unit 4- de-mystifying the math - amazon web...
TRANSCRIPT
1
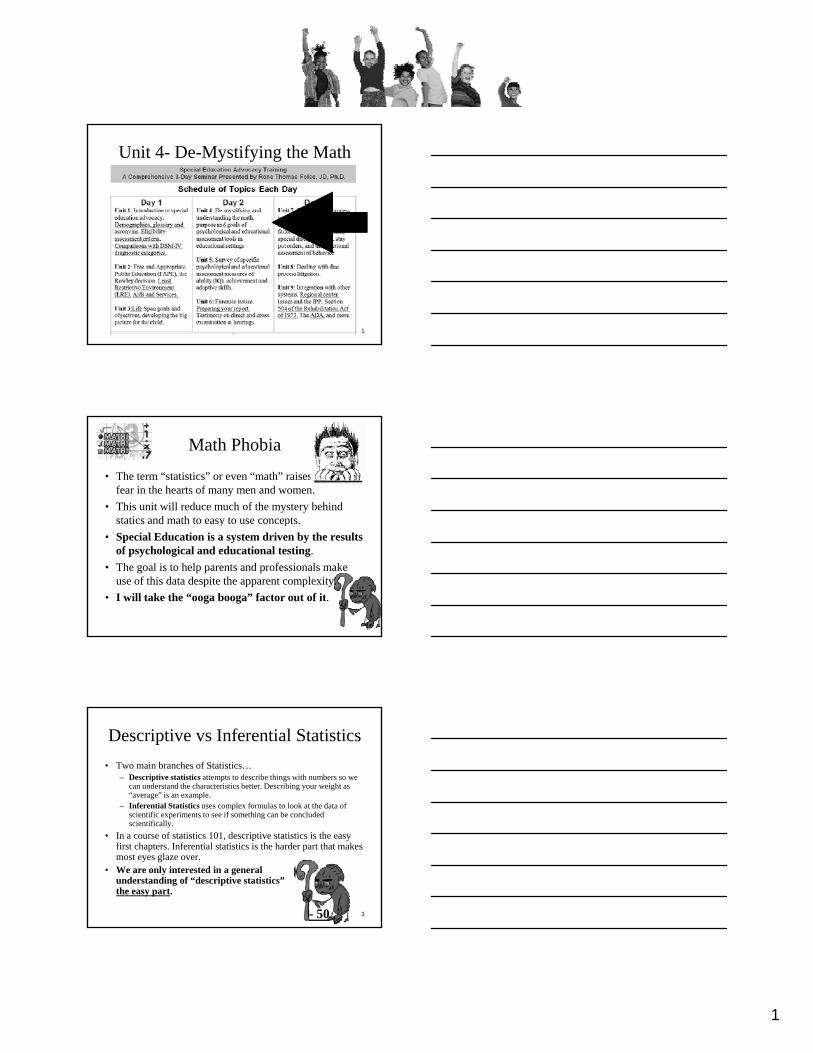
Unit 4- De-Mystifying the Math
We Are HereWe Are Here
1
Math Phobia
• The term “statistics” or even “math” raisesfear in the hearts of many men and women.
• This unit will reduce much of the mystery behind statics and math to easy to use concepts.
2
y p
• Special Education is a system driven by the results of psychological and educational testing.
• The goal is to help parents and professionals make use of this data despite the apparent complexity.
• I will take the “ooga booga” factor out of it.
Descriptive vs Inferential Statistics
• Two main branches of Statistics…– Descriptive statistics attempts to describe things with numbers so we
can understand the characteristics better. Describing your weight as “average” is an example.
– Inferential Statistics uses complex formulas to look at the data of scientific experiments to see if something can be concluded
3
p gscientifically.
• In a course of statistics 101, descriptive statistics is the easy first chapters. Inferential statistics is the harder part that makes most eyes glaze over.
• We are only interested in a general understanding of “descriptive statistics” the easy part.
- 50- 50

2
The Concept of “Average”
• This term is commonly understood in the generic sense. The movie you saw was “average” the cup of coffee you had was “above average”.
• A more complicated way of saying “average” is mean, median or mode. These terms are important to
4
pscientists and professionals.
• If I simplify the descriptive statistical terms to just use with word “average” most people understand that if you child is “above average” that is good and “below average” is not as good if we are evaluating a desirable trait.
• The word “average” is sufficient for most purposes.
- 5- 5
If You Must Know…
• Mean is the mathematical average of scores. (add up all the test scores and divide by number of students)
• Median is the score in the middle of all scores
+ 3+ 5
5
• Median is the score in the middle of all scores. (if 100 students took the test and you arranged them in order, it would be the score of the 50th
student)
• Mode is the value that occurs most often. (if more students got 80 on a test than any other score)
Example of a Trait “Height”
• If I measure the height of all 48 people in this room, and told you your height was 68.5” you would know something about yourself.
• But you would know more about yourself if I could put
6
y y pthis into the perspective of how you compare to others.
• If height were a desirable trait, and I said “you are above average” you would be happy even if I meant mean, median or mode. The word “average” explains it well enough for most.
• I can also use a descriptive statistic tool called “plotting” or “graphing” the data.
3
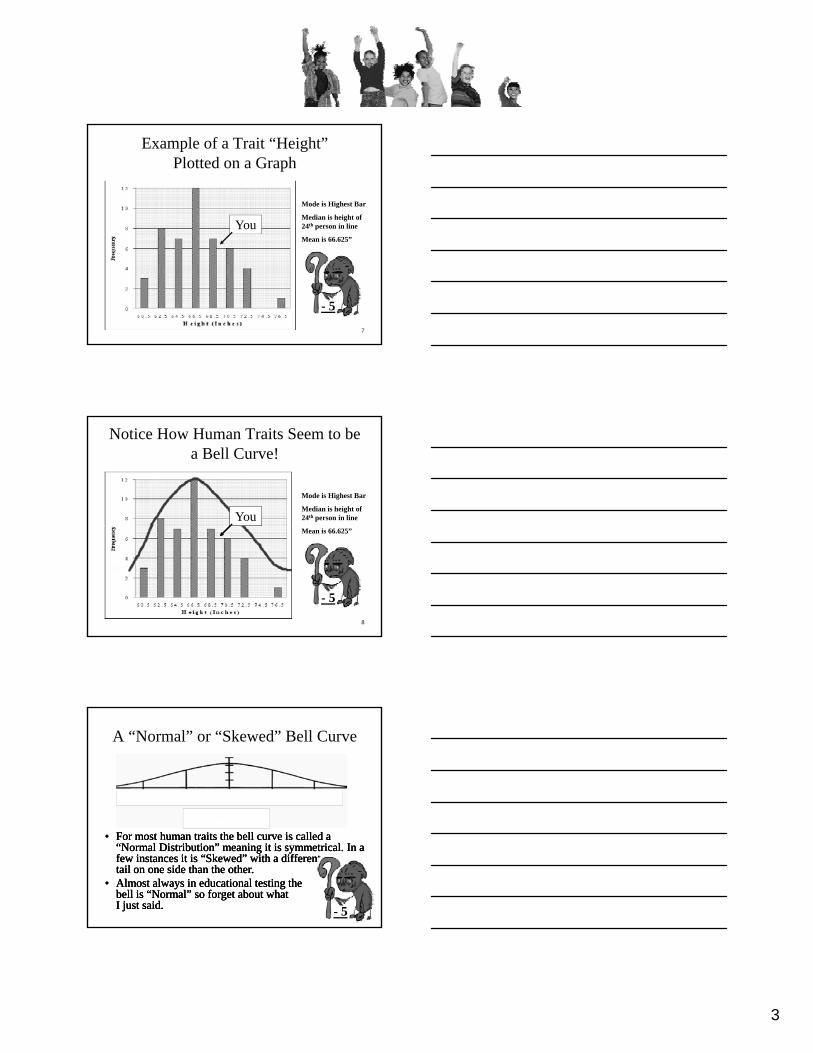
Example of a Trait “Height”Plotted on a Graph
Mode is Highest Bar
Median is height of 24th person in lineYou
7
Mean is 66.625”
- 5
Notice How Human Traits Seem to be a Bell Curve!
Mode is Highest Bar
Median is height of 24th person in lineYouYou
8
Mean is 66.625”
- 5- 5
A “Normal” or “Skewed” Bell Curve
9
• For most human traits the bell curve is called a “Normal Distribution” meaning it is symmetrical. In a few instances it is “Skewed” with a different tail on one side than the other.
• Almost always in educational testing the bell is “Normal” so forget about what I just said. - 5
• For most human traits the bell curve is called a “Normal Distribution” meaning it is symmetrical. In a few instances it is “Skewed” with a different tail on one side than the other.
• Almost always in educational testing the bell is “Normal” so forget about what I just said. - 5
• For most human traits the bell curve is called a “Normal Distribution” meaning it is symmetrical. In a few instances it is “Skewed” with a different tail on one side than the other.
• Almost always in educational testing the bell is “Normal” so forget about what I just said. - 5- 5

4
What is a Percentile Rank (PR)?
• For example, if a student scored in the 66th percentile on a test, that student achieved a score that is higher than 66% of the other students who took the test. So, if 1,000 students took the test, the student in the 66th percentile scored higher than 660 students
10
percentile scored higher than 660 students.• Do not confuse percentile scores with percentage
correct scores. Percentile scores allow you to compare one student's scores with a group of students who took the test. Percentage correct scores simply reveal the number of items that a student answered correctly out of the total number of items.
How Far Am I Above Average?You are 98%tileYou are 98%tile
11
• I can answer your question about “how far above average you are by giving you a percentile rank.
• Almost everyone understands a percentile rank - 5- 5
Parents Can Use Percentile Rank Information Math
84%tile
Science 50%tile
Reading 16%tile
12
• If you child is in the 84%tile in math is that good or bad?
• If you child is in the 16%tile in reading is that good or bad?
• If you child is in the 50%tile in science is that good or bad?
Science 50%tile
5
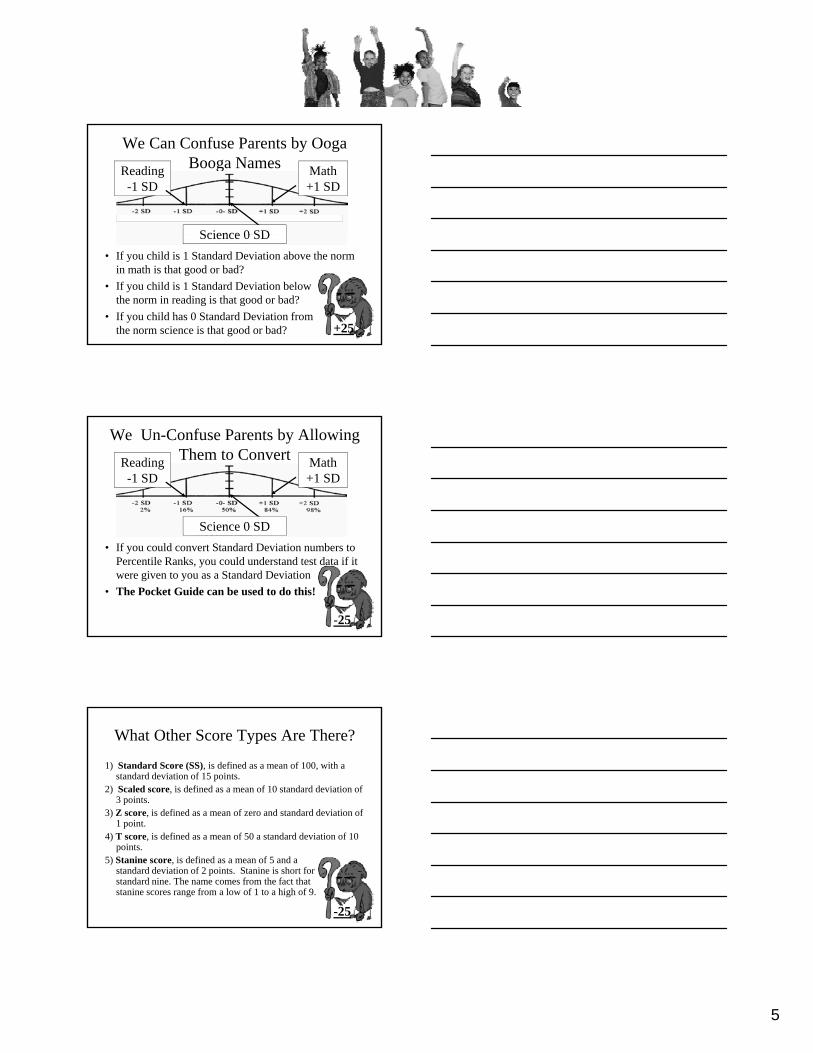
We Can Confuse Parents by Ooga Booga Names Math
+1 SD
Science 0 SD
Reading -1 SD
13
• If you child is 1 Standard Deviation above the norm in math is that good or bad?
• If you child is 1 Standard Deviation below the norm in reading is that good or bad?
• If you child has 0 Standard Deviation from the norm science is that good or bad?
Science 0 SD
+25
We Un-Confuse Parents by Allowing Them to Convert Math
+1 SD
Science 0 SD
Reading -1 SD
14
• If you could convert Standard Deviation numbers to Percentile Ranks, you could understand test data if it were given to you as a Standard Deviation
• The Pocket Guide can be used to do this!
Science 0 SD
-25-25
What Other Score Types Are There?
1) Standard Score (SS), is defined as a mean of 100, with a standard deviation of 15 points.
2) Scaled score, is defined as a mean of 10 standard deviation of 3 points.
3) Z score, is defined as a mean of zero and standard deviation of
15
)1 point.
4) T score, is defined as a mean of 50 a standard deviation of 10 points.
5) Stanine score, is defined as a mean of 5 and a standard deviation of 2 points. Stanine is short for standard nine. The name comes from the fact that stanine scores range from a low of 1 to a high of 9.
-25

6
All These Scores Can Be Converted
16-25+25
The most common educational test score is reported as a “Standard Score” or SS. An IQ is reported as a Standard Score. Using the conversion chart above see if you can calculate this.
1) What percentile is a child with an IQ of 85?
2) What percentile is a child with an IQ of 100?
3) What percentile is a child with an IQ of 115?
The Back of the Pocket Guide
Billy Has an IQ of 76. What is his
Billy has an IQ of 76. What is his
Mary has an IQ of 109. What is her percentile rank?
Mary has an IQ of 109. What is her percentile rank?
17
percentile rank?percentile rank?
Joe has an IQ of 132. What is his percentile rank?
Which of the three are nearest to “average” in IQ? What IQ does an exact “average” child have?
Z Score is Mean of zero and standard deviation of 1 point
1) A gifted program requires an IQ of 2 standard deviations above average or more. What IQ is that?
18
2) The definition of mental retardation requires an IQ that is 2 standard deviations below average or more. What IQ is that?
7
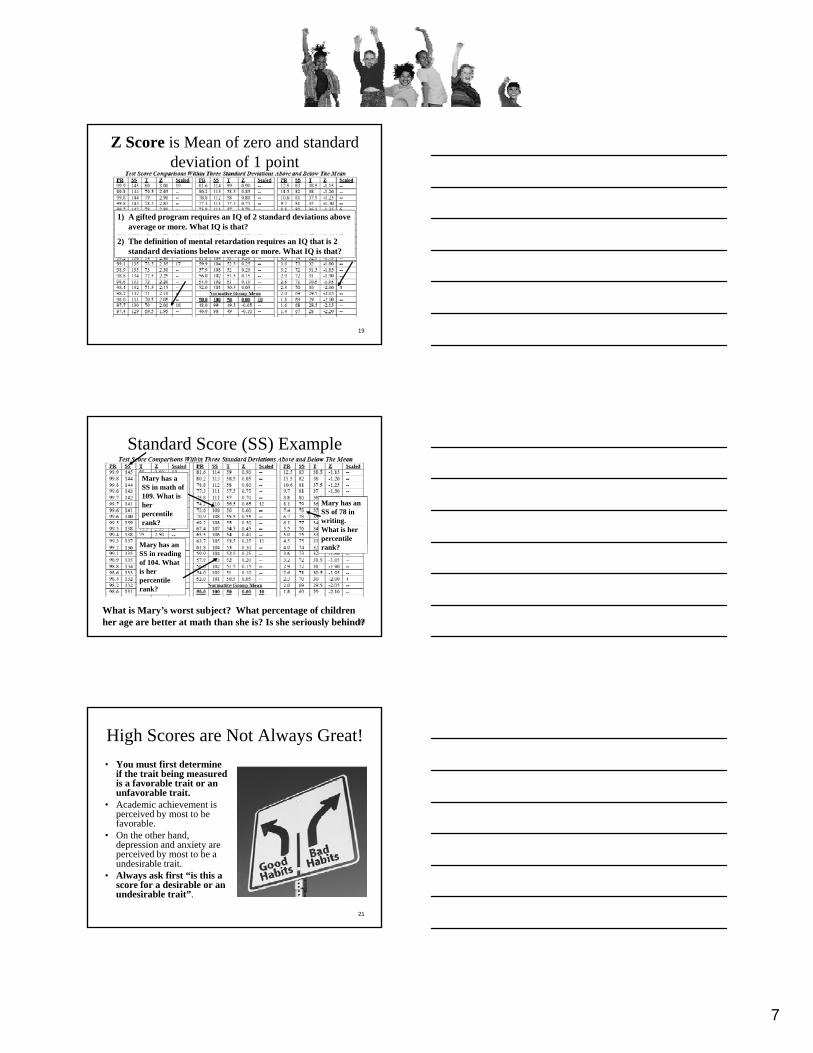
Z Score is Mean of zero and standard deviation of 1 point
1) A gifted program requires an IQ of 2 standard deviations above average or more. What IQ is that?
19
2) The definition of mental retardation requires an IQ that is 2 standard deviations below average or more. What IQ is that?
Standard Score (SS) Example
Billy Has an IQ of 76. What is his
Mary has an SS of 78 in writing.
Mary has a SS in math of 109. What is her percentile rank?
20
percentile rank?What is her percentile rank?Mary has an
SS in reading of 104. What is her percentile rank?
What is Mary’s worst subject? What percentage of children her age are better at math than she is? Is she seriously behind?
High Scores are Not Always Great!
• You must first determine if the trait being measured is a favorable trait or an unfavorable trait.
• Academic achievement is perceived by most to be
21
p yfavorable.
• On the other hand, depression and anxiety are perceived by most to be a undesirable trait.
• Always ask first “is this a score for a desirable or an undesirable trait”.

8
T score, is defined as a mean of 50 a standard deviation of 10 points.
1) Your child is given an MMPI-A (The Minnesotta Multipersonality Inventory, Adolescent version) and got a T
i d i f 72
22
score in depression of 72
2) Is this child above or below “average” in depression?
3) Is this good or bad? 4) What percentile rank is that?
T score, is defined as a mean of 50 a standard deviation of 10 points.
1) Your child is given an MMPI-A (The Minnesotta Multipersonality Inventory, Adolescent version) and got a T
i d i f 72
23
score in depression of 72
2) Is this child above or below “average” in depression?
3) Is this good or bad? 4) What percentile rank is that?
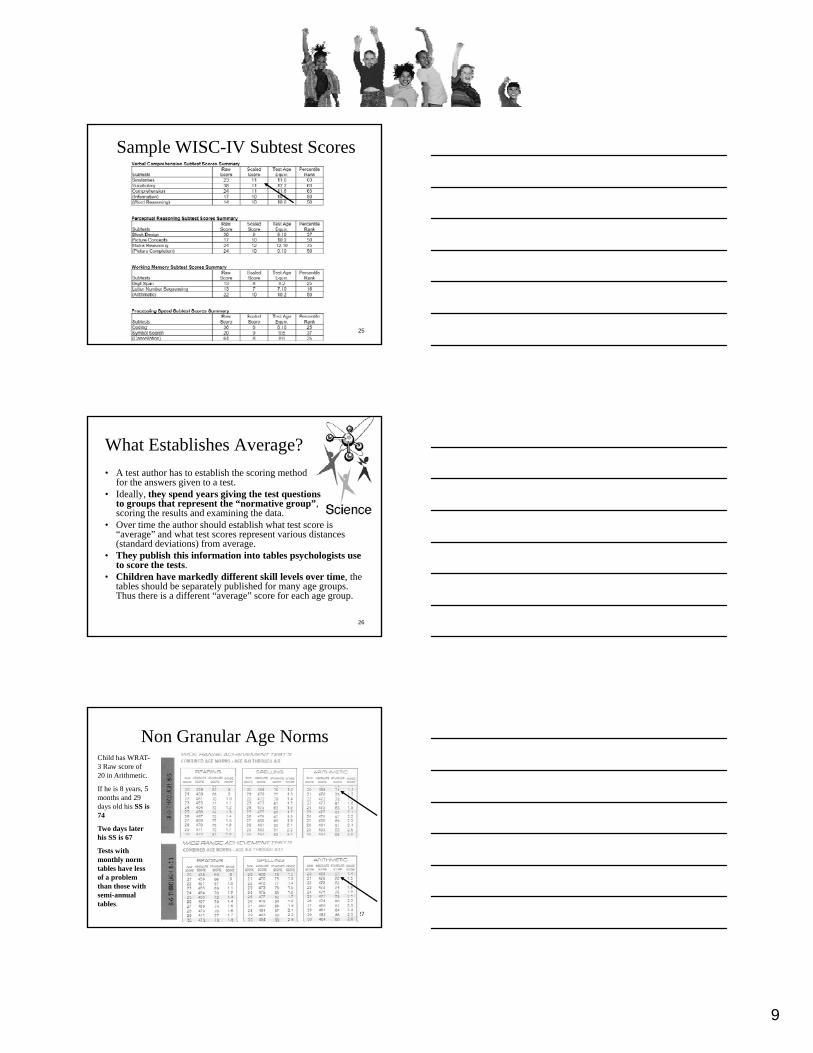
Scaled score, is defined as a mean of 10 standard deviation of 3 points
Scaled scores are s all
24
• Scaled scores are usually provided for sub-tests of large tests.
• One typical example is the WISC-IV Wechsler Intelligence Scale for Children, Fourth Edition
9
Sample WISC-IV Subtest Scores
25
What Establishes Average?
• A test author has to establish the scoring method for the answers given to a test.
• Ideally, they spend years giving the test questions to groups that represent the “normative group”, scoring the results and examining the data.
• Over time the author should establish what test score is
26
Over time the author should establish what test score is “average” and what test scores represent various distances (standard deviations) from average.
• They publish this information into tables psychologists use to score the tests.
• Children have markedly different skill levels over time, the tables should be separately published for many age groups. Thus there is a different “average” score for each age group.
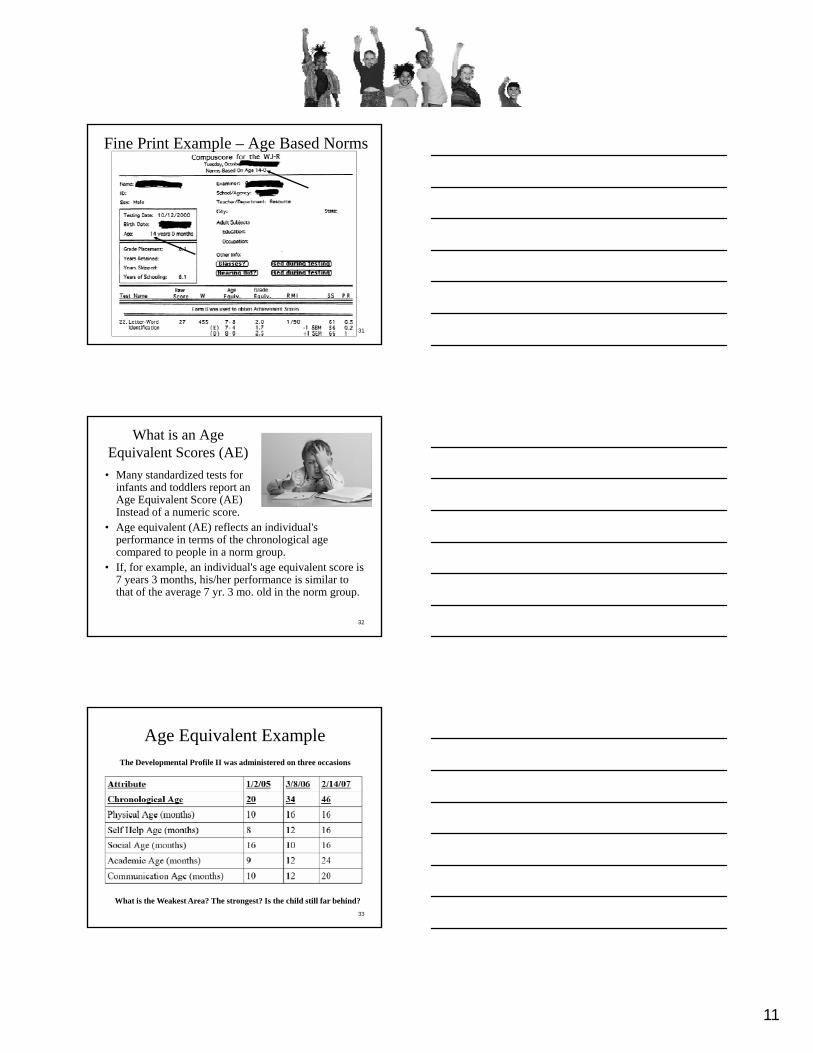
Non Granular Age NormsChild has WRAT-3 Raw score of 20 in Arithmetic.
If he is 8 years, 5 months and 29 days old his SS is 74
27
Two days later his SS is 67
Tests with monthly norm tables have less of a problem than those with semi-annual tables.
10
Problems with “Standardized: Tests
• A psychological or educational test can have problems and not all of them are well regarded and well developed.
• One example can be problems with cultural differences where what is “normal” may not be the case in
28
where what is normal may not be the case in different cultures. (See the Larry P. class action).
• Test interpretation takes professional expertise to make adjustments or disregard data when necessary.
• Point to Remember: Not all test information is accurate and reliable, and the information is helpful but needs professional guidance much of the time.
The Australian Scale For Asperger's Syndrome (A.S.A.S.) Example
• The The Australian Scale For Asperger's Syndrome (A.S.A.S.) promoted by Tony Attwood, PhD. in his book ASPERGER'S SYNDROME: A GUIDE FOR PARENTS AND PROFESSIONALS. The questionnaire is designed to identify behaviours and
29
questionnaire is designed to identify behaviours and abilities indicative of Asperger's Syndrome in children during their primary school years.
• A psychologist I used once in a case relied heavily on this measure.
• I could not find published data supporting the use of this tool.
Using Grade Level vs Age Level Norms
• If a child is held back a grade, they are involved in curriculum that is below their chronological age.
• When scoring Achievement Tests (Reading, Writing and Math) should you use age based or grade based
30
) y g gnorms?
• The former will show lower standard scores than the latter.
• Make sure you read the fine print on the test report to know which was done. Ideally score it both ways.
11
Fine Print Example – Age Based Norms
31
What is an Age Equivalent Scores (AE)
• Many standardized tests for infants and toddlers report an Age Equivalent Score (AE) Instead of a numeric score.
• Age equivalent (AE) reflects an individual's
32
• Age equivalent (AE) reflects an individual's performance in terms of the chronological age compared to people in a norm group.
• If, for example, an individual's age equivalent score is 7 years 3 months, his/her performance is similar to that of the average 7 yr. 3 mo. old in the norm group.
Age Equivalent ExampleThe Developmental Profile II was administered on three occasions
33
What is the Weakest Area? The strongest? Is the child still far behind?
12
What is a Grade Equivalent Score (GE)?
• GE scores are often misunderstood; be careful when you interpret them.
• If a 4th grader received a 7th grade equivalent score on a 4th grade reading achievement test
34
score on a 4th grade reading achievement test, the parents may believe their child is ready for 7th grade material.
• Actually, the score means that the child reads 4th grade material as well as the average 7th grader would read 4th grade material.
Grade Equivalent Example
35What should you be most worried about with this child?
Grade Equivalent Example
36What should you be most worried about with this child?

13
Standard Error of Measurement
• If I give 10 people a ruler and ask them to measure a room size, I would not get the same 10 answers. There will be errors. The same applies to standardized tests
• The results from taking a single test one time may
37
• The results from taking a single test one time may not reflect an individual’s true abilities. The Standard Error is an estimate calculated by the test author of the amount of variation to be expected in a particular score on a particular test.
• This statistic provides a range of scores within which a test subject's true score is likely to fall.
Standard Error and Cut Off Scores
• Regional Center eligibility is based upon five categories, one of which is mental retardation.
• Earlier diagnostic schemes used a fixed cutoff of an IQ of 70 or lower to support a diagnosis.Th di i f h Di i i d S i i l
38
• The current edition of the Diagnositic and Statistical Manual of Mental Disorders (DSM-IV) uses the term “Significantly subaverage intellectual functioning: an IQ of approximately 70 or below…”
• The word “approximately” recognizes problems of the standard error of measurement.
Validity and Reliability
• A valid measure accurately represents the relationship between things, such as a test score, and the attribute the test is supposed to measure.
• Reliability is the consistency of your measurement, or the degree to which an instrument measures the
39
or the degree to which an instrument measures the same way each time it is used under the same condition with the same subjects. In short, it is the repeatability of your measurement.
• Test authors calculate and report the coefficient of validity and reliability with 1.00 being best. Coefficients around .7 are not uncommon.

14
Standard Scores and Closing the Gap
• If a year goes by, and a child has the same standard score as the year before, he has not lost ground compared to his “average” peer.
40
• If his standard score is lower, he has gotten farther away from average.
• If his standard score is higher, he has gained ground and closed some of the gap with his peers.
Woodcock Johnson Triennial Scores
41In what subjects has this student lost ground?
Woodcock Johnson Triennial Scores
42In what subjects has this student lost ground?