unit 4: figures
TRANSCRIPT
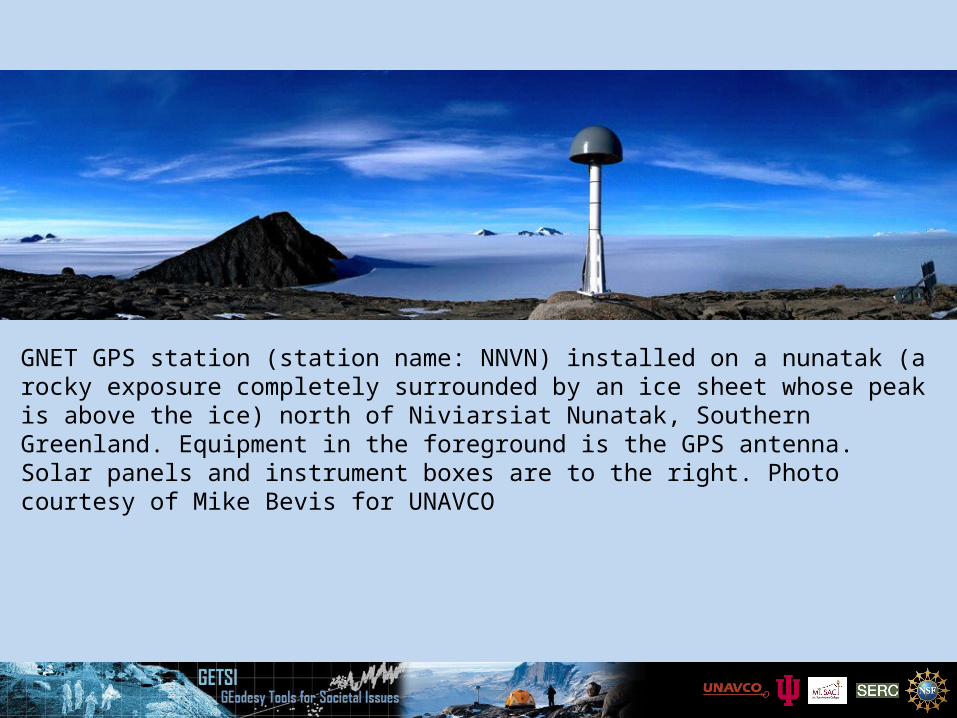
GNET GPS station (station name: NNVN) installed on a nunatak (a rocky exposure completely surrounded by an ice sheet whose peak is above the ice) north of Niviarsiat Nunatak, Southern Greenland. Equipment in the foreground is the GPS antenna. Solar panels and instrument boxes are to the right. Photo courtesy of Mike Bevis for UNAVCO

GNET GPS station (name: HJOR) in SE Greenland. GPS antenna is visible in the photo. Site was constructed in 2007. Photo by Dana Caccamise, Ohio State University.
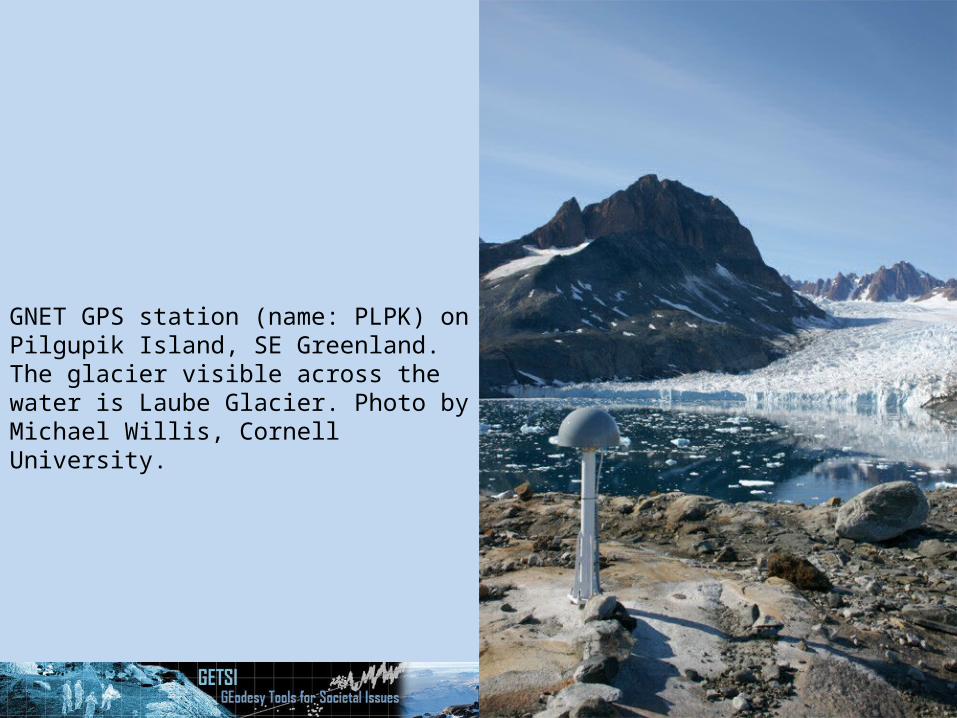
GNET GPS station (name: PLPK) on Pilgupik Island, SE Greenland. The glacier visible across the water is Laube Glacier. Photo by Michael Willis, Cornell University.
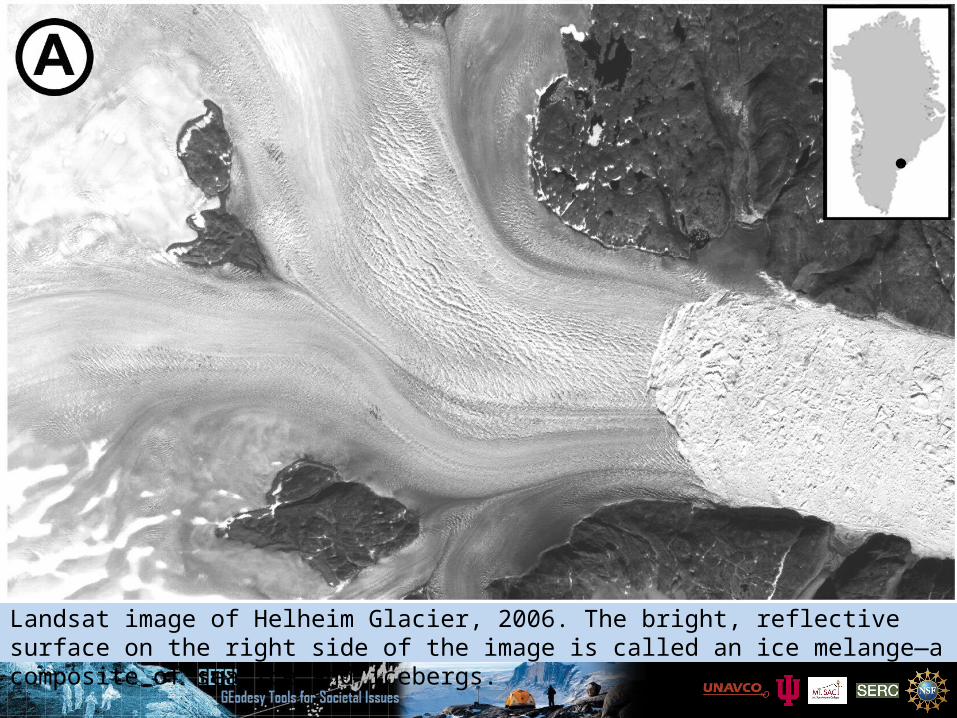
Landsat image of Helheim Glacier, 2006. The bright, reflective surface on the right side of the image is called an ice melange—a composite of sea ice and icebergs.

Left: Digital elevation model (DEM) of Helheim Glacier, 2006. Red star represents study location for ice elevation data. Brown represents the eleavation of the land surface. Blue represents elevation of the ice and ocean (from Stearns and Hamilton, 2007.)
Right: Vertical displacement (thinning) of the surface of Helheim Glacier from 1995-2012 derived from repeat satellite and airborne altimetry. Notice that elevation changes From Csatho et al., 2014.
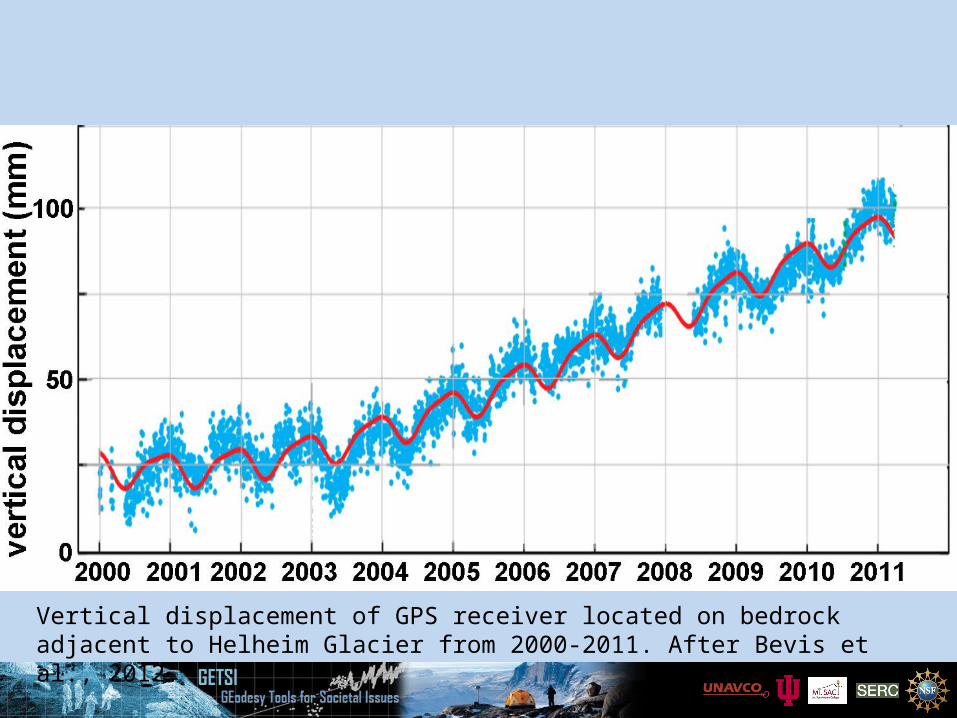
Vertical displacement of GPS receiver located on bedrock adjacent to Helheim Glacier from 2000-2011. After Bevis et al., 2012.
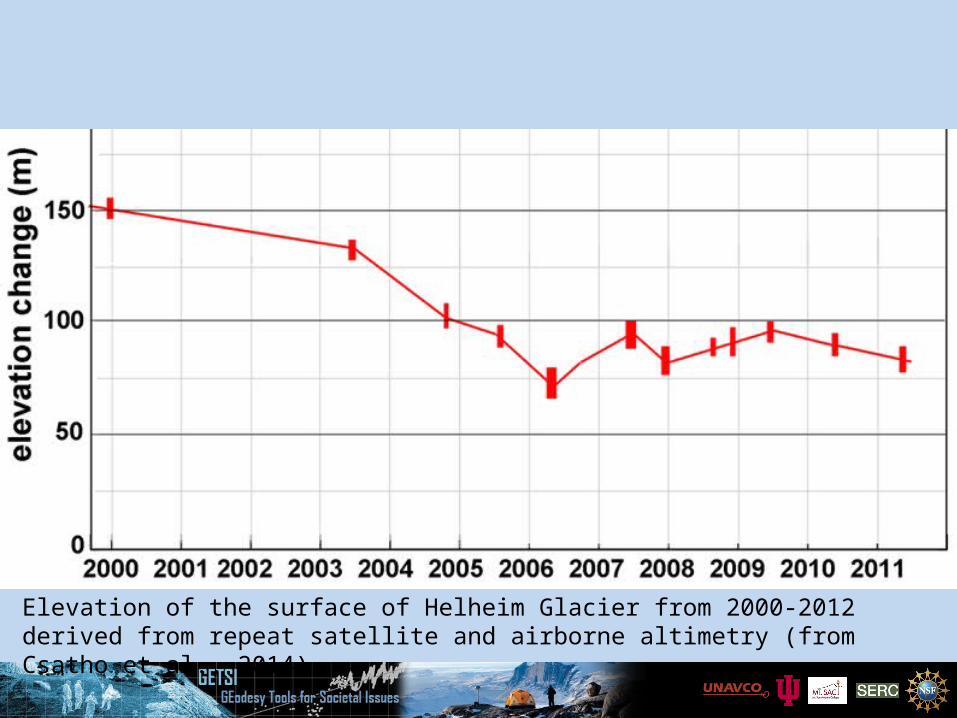
Elevation of the surface of Helheim Glacier from 2000-2012 derived from repeat satellite and airborne altimetry (from Csatho et al., 2014).
This work is supported by the National Science Foundation’s Transforming Undergraduate Education in STEM program within the Directorate for Education and Human Resources (DUE-1245025).
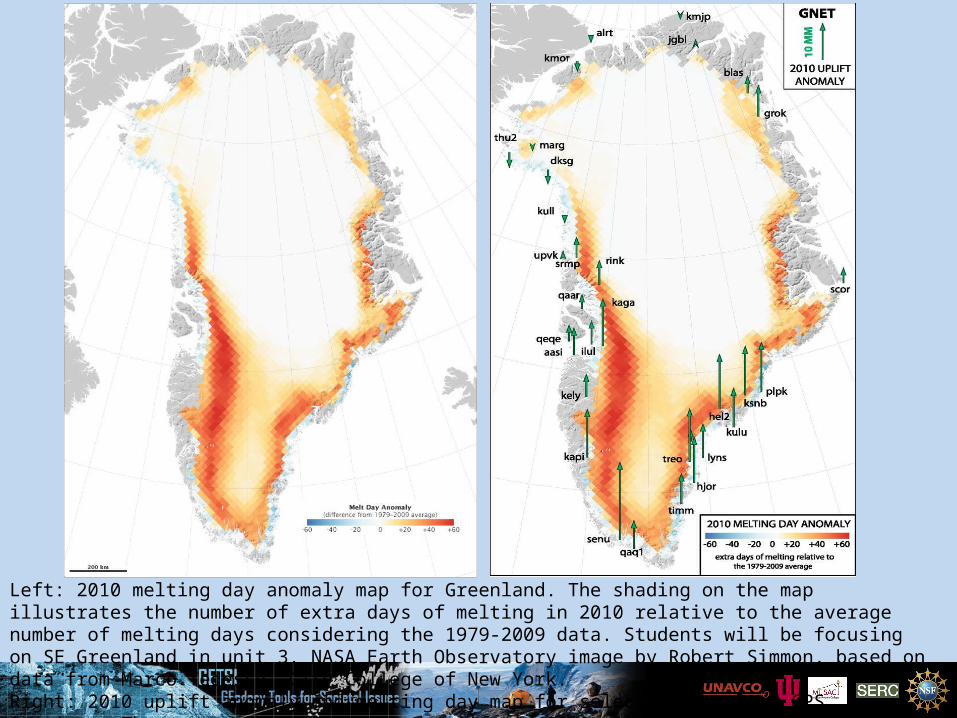
Left: 2010 melting day anomaly map for Greenland. The shading on the map illustrates the number of extra days of melting in 2010 relative to the average number of melting days considering the 1979-2009 data. Students will be focusing on SE Greenland in unit 3. NASA Earth Observatory image by Robert Simmon, based on data from Marco Tedesco, City College of New York. Right: 2010 uplift anomaly and melting day map for selected Greenland GPS stations. The green arrows illustrate uplift in 2010 relative to the trend from site installation date (~2000 for most sites)