unit 4: normal distributions part 3 statistics. focus points find the areas under the standard...
TRANSCRIPT

Unit 4: Normal Distributions
Part 3
Statistics

Focus Points
• Find the areas under the standard normal curve
• Find data from standard normal table

Standard Normal Distribution
The standard normal distribution is a normal distribution with mean μ = 0 and standard deviation σ = 1.
• Any normal distribution of x values can be converted to the standard normal distribution by converting all x values to their corresponding z values.• Finding the z score
Reading the Standard Normal Table
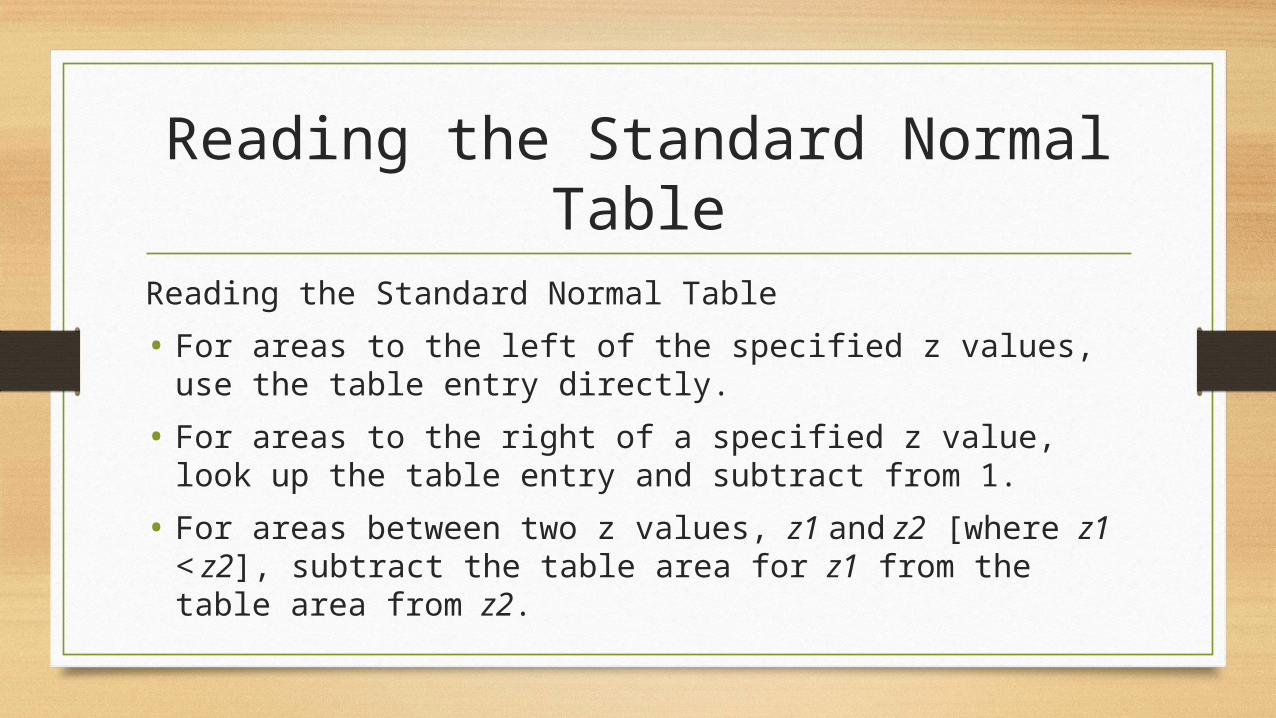
Reading the Standard Normal Table
• For areas to the left of the specified z values, use the table entry directly.
• For areas to the right of a specified z value, look up the table entry and subtract from 1.
• For areas between two z values, z1 and z2 [where z1 < z2], subtract the table area for z1 from the table area from z2.
Guided Exercise #1
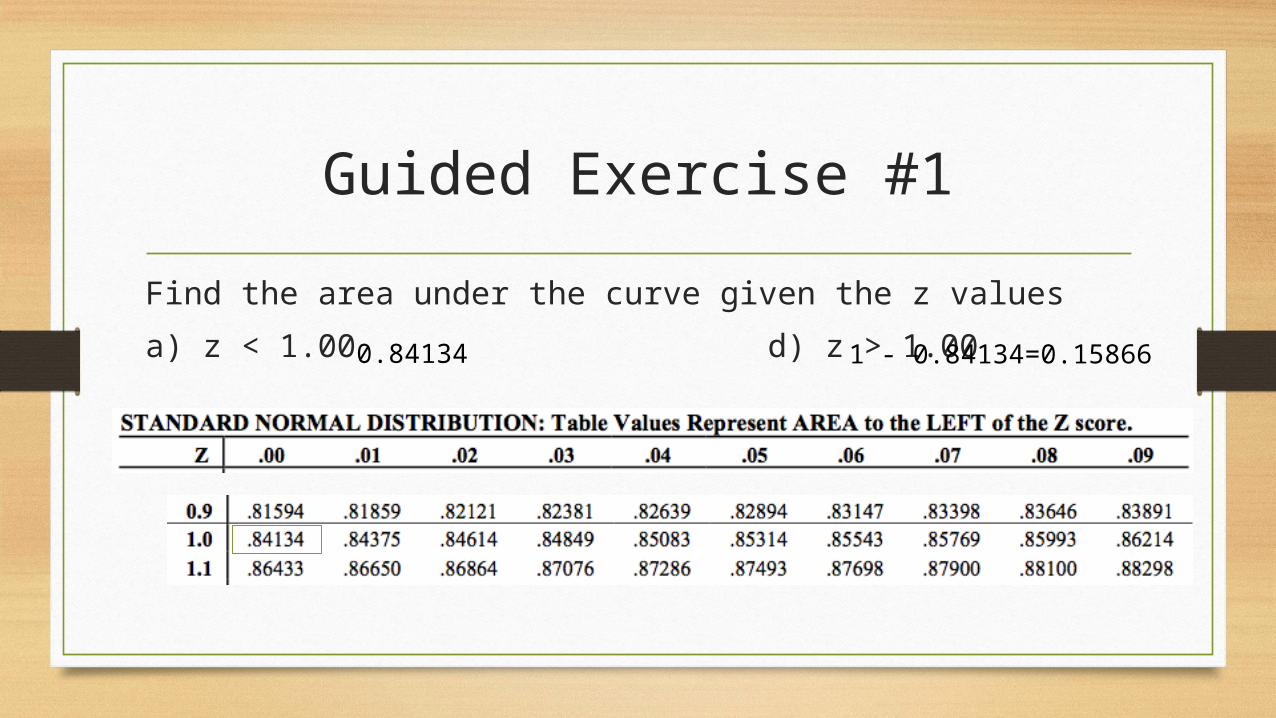
Find the area under the curve given the z values
a) z < 1.00d) z > 1.00
0.84134 1 - 0.84134=0.15866
Guided Exercise #1
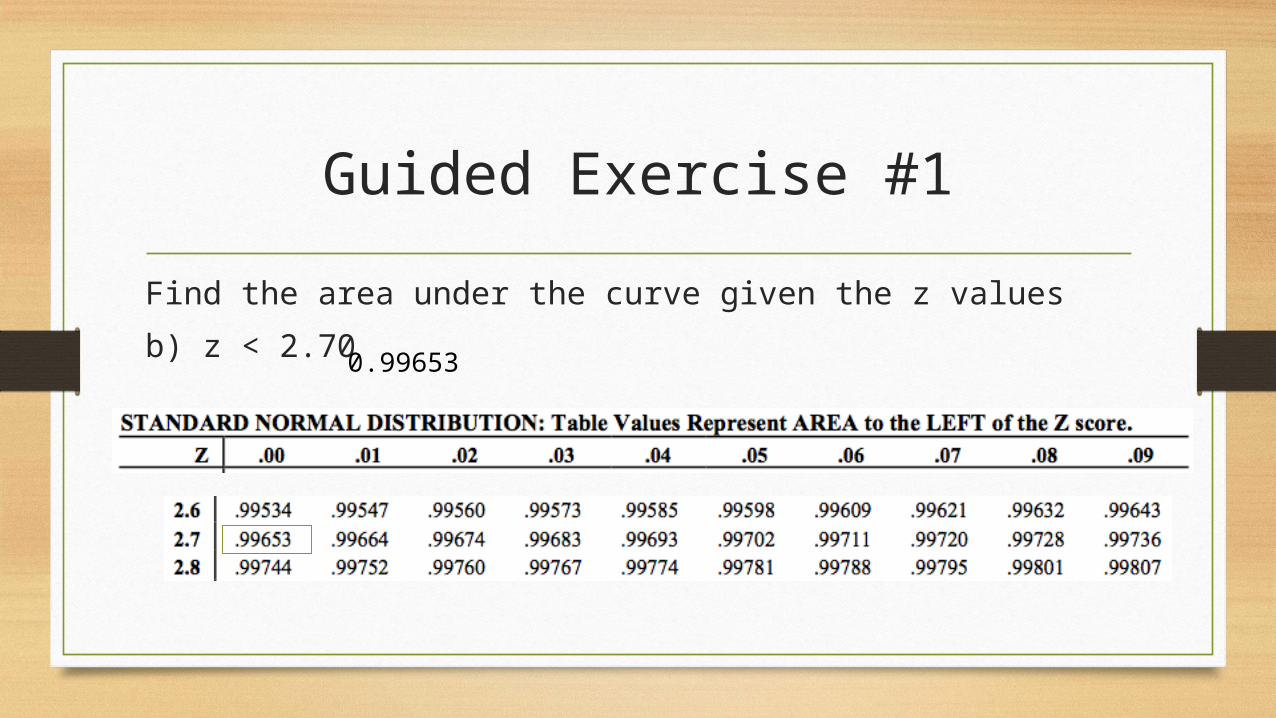
Find the area under the curve given the z values
b) z < 2.70 0.99653

Guided Exercise #1
Find the area under the curve given the z values
c) 1.00 < z < 2.70
0.84134 0.996530.99653 - 0.84134 = .15519

Solving Problems with the Standard Normal Table
1. Find the z score
2. Notate whether less than or greater than
3. Use the table to get area
4. Convert into percentages
Guided Exercise #2
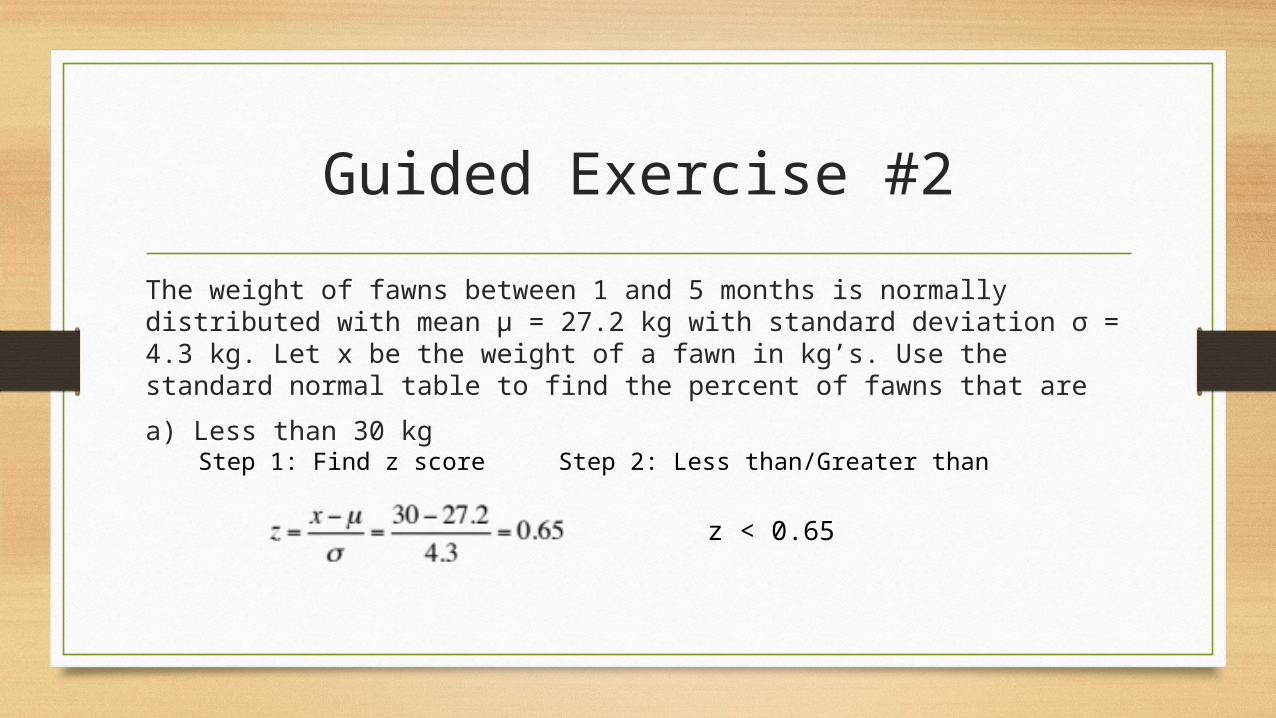
The weight of fawns between 1 and 5 months is normally distributed with mean μ = 27.2 kg with standard deviation σ = 4.3 kg. Let x be the weight of a fawn in kg’s. Use the standard normal table to find the percent of fawns that are
a) Less than 30 kgStep 1: Find z score Step 2: Less than/Greater than
z < 0.65
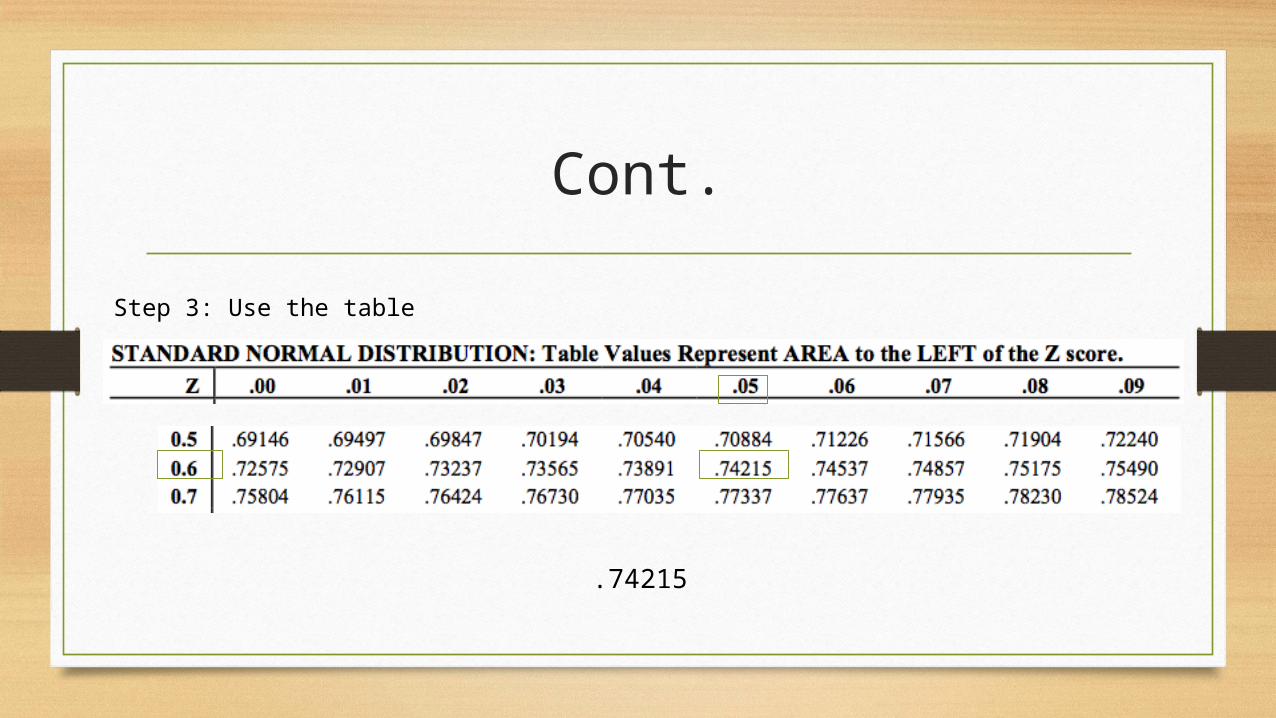
Cont.
Step 3: Use the table
.74215

Guided Exercise #2
The weight of fawns between 1 and 5 months is normally distributed with mean μ = 27.2 kg with standard deviation σ = 4.3 kg. Let x be the weight of a fawn in kg’s. Use the standard normal table to find the percent of fawns that are
a) More than 26 kgStep 1: Find z score Step 2: Less than/Greater than
z > - 0.28
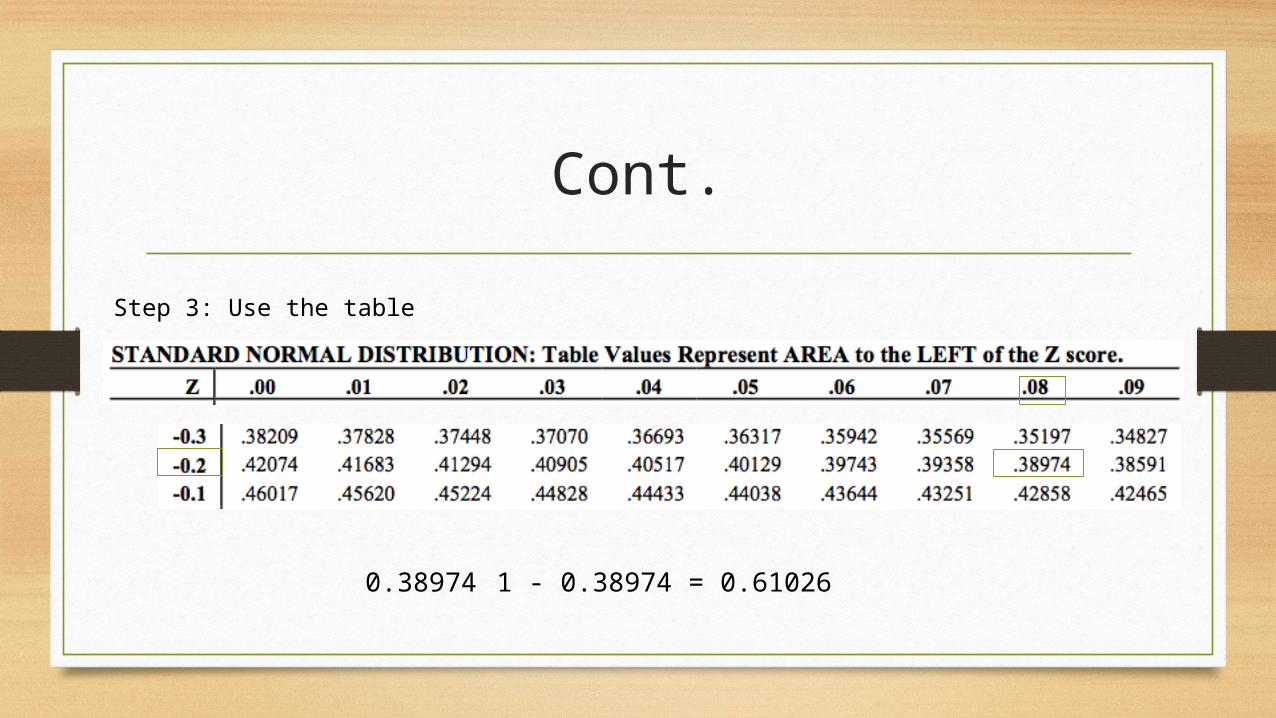
Cont.
Step 3: Use the table
0.38974 1 - 0.38974 = 0.61026

Guided Exercise #2
The weight of fawns between 1 and 5 months is normally distributed with mean μ = 27.2 kg with standard deviation σ = 4.3 kg. Let x be the weight of a fawn in kg’s. Use the standard normal table to find the percent of fawns that are
a) Between 20 and 35 kgStep 1: Find z score Step 2: Less than/Greater than
- 1.67 < z < 1.81

Step 3: Use the table
Cont.
0.96485 - 0.04746 = 0.91749