unit 5. research project. results and conclusions
TRANSCRIPT

Unit 5 Research Project
Worthing College Sports Science[Harmony Driver]
2015

Assessment Criteria Pages 3-17 & 27-38
• P2: carry out sport science or exercise science-based research
• P3: collect and record data from the research project conducted
• M2: correctly analyse collected data, describing techniques used
• D1: correctly analyse data, explaining techniques used
• P4: produce a full research report using a standard scientific structure

Optimum rehydration fluid research project
P2: Carry out / P4: Produce
AbstractThe purpose of this research project was to determine the optimum rehydration fluid. This was to enable a 16-18 year old female, performance level athlete, after high intensity exercise, reach pre exercise state of hydration. The research was designed to gain information about hydration to help sports teams in Worthing college to improve their performance during both training and matches. To find this information, I asked 12 participants that fit the population specification to provide urine samples before completing 3 sets of 6 Malcolms. Another urine sample was then taken. At this point the participants were given 500ml of either water, hypotonic, hypertonic and isotonic sports drinks to consume. After an hour, the final sample was taken. All the urine samples were compared to a chart and a value given. The results were inconclusive as there was no clear optimum hydration fuel. However, it does show that an individual should carry tests on themselves to find their own optimum hydration fuel, this is because each athlete will lose fluid at different rates and therefore dehydrate over a shorter period of time and rehydration is different for each individual and therefore participant.
P2: Carry out / P4: Produce
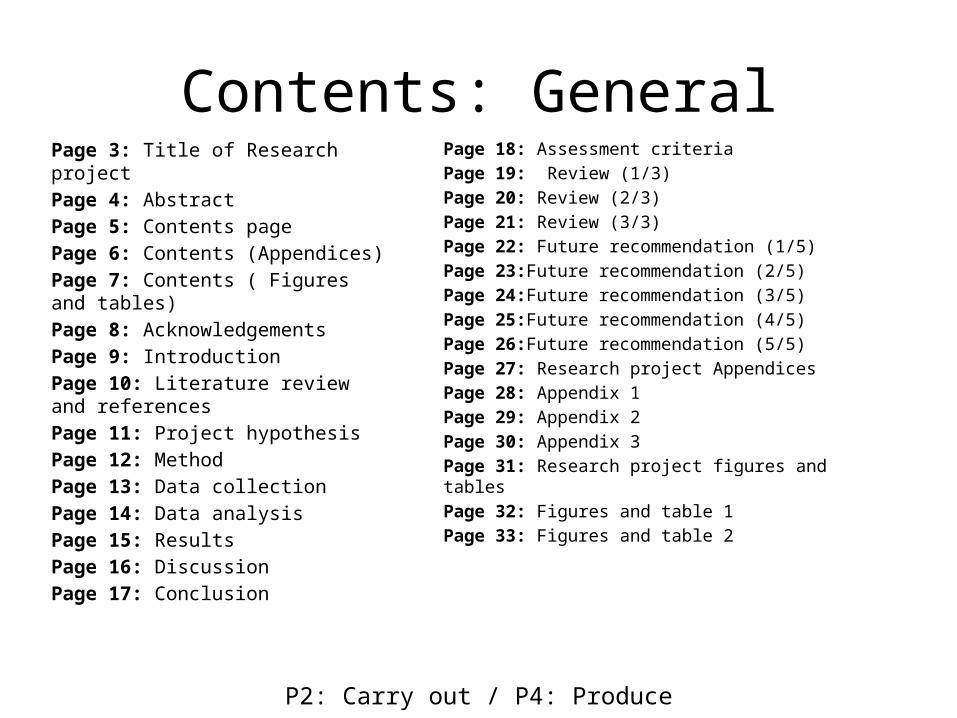
Contents: GeneralPage 3: Title of Research projectPage 4: AbstractPage 5: Contents pagePage 6: Contents (Appendices)Page 7: Contents ( Figures and tables)Page 8: Acknowledgements Page 9: IntroductionPage 10: Literature review and referencesPage 11: Project hypothesisPage 12: MethodPage 13: Data collectionPage 14: Data analysisPage 15: ResultsPage 16: DiscussionPage 17: Conclusion
P2: Carry out / P4: Produce
Page 18: Assessment criteriaPage 19: Review (1/3)Page 20: Review (2/3)Page 21: Review (3/3)Page 22: Future recommendation (1/5)Page 23:Future recommendation (2/5)Page 24:Future recommendation (3/5)Page 25:Future recommendation (4/5)Page 26:Future recommendation (5/5)Page 27: Research project Appendices Page 28: Appendix 1Page 29: Appendix 2Page 30: Appendix 3Page 31: Research project figures and tablesPage 32: Figures and table 1Page 33: Figures and table 2

Contents: Appendices
Page 27: Title pagePage 28: Appendix 1Page 29: Appendix 2Page 30: Appendix 3
P2: Carry out / P4: Produce

Contents: Figures and Tables
Page 31: Title pagePage 32: Figures and table 1Page 33: Figures and table 2
P2: Carry out / P4: Produce

Acknowledgements
The research project could not have been completed without the following people. I would like to thank Mark Sambrook for giving advice during the early planning phase and Paul Cox helping the organisation throughout the project. The Women's rugby team also get a mention as they were willing test subjects, so that I could get the results I needed.
P2: Carry out / P4: Produce

IntroductionBy the end of my research project I aimed to determine the optimum rehydration fluid to enable a 16-18 year old female, performance level athlete, after high intensity exercise, reach pre exercise state of hydration. I chose this aim because I have always been told that hydration is key for sporting success, and that water is essential for high performance athletes. Therefore I was interested in finding out whether there is better ways to hydrate your body than just drinking water. I also wanted my performance level to increase and if I find an extra 1% improvement in hydration then the results would be useful to not only me but my team mates as well. The time scale of the research project started on the 19th of January where I started to develop ideas about my research project aim. This progressed to the testing of my aim to be conducted from the 23rd of February till the 16th of March. At this stage of the timescale, I wanted to start analysing the data and writing up my research project, the final deadline for this research project on the 17th of April 2015.
P2: Carry out / P4: Produce

Literature Review and References
https://worthingsportscience.wordpress.com/2015/02/27/unit-5-literature-review-harmony-driver/
P2: Carry out / P4: Produce

Project Hypothesis
If an athlete consumes 500ml of isotonic drink then they will become hydrated over a shorter period of time than if the athlete was to consume hypertonic, hypotonic drinks and water.No matter which sports drink is consumed, this will still have a quicker rehydration rate than just plain water because of the lack in sodium and carbohydrate.
P2: Carry out / P4: Produce

MethodThe research will be in the format of an experimental research design. This is because the project is testing the effects of an independent variable (hydration fuels) on a dependent (rehydration). At the beginning of the research project, I asked each of the participants to fill out a PAR-Q form ( see Appendix 1) so that I was aware of any current illness or injuries which could prevent them from completing the proposed exercise. Before the set exercise is completed, all participants are required to take a urine sample which I then compare to the normative data, the urine chart (see Appendix 2) and give the urine a numerical value. The participants will then take part in three sets of Malcolm’s ( 6 repetitions in a set) with 1 minute rest in between. After the exercise has been completed, I will collect another urine sample and again compare to the urine chart and place a value. At this point the participant will be given 500ml of a specific drink (Isotonic, water, hypertonic and hypotonic), this will be recorded to ensure that the results match up to the correct participants. After an hour, the body has time to rehydrate and another sample will be taken and recorded on a table. Ready to compare the values after all tests are complete.
P3: Collect and record / M2: Correctly analyse & describe techniques / D1: Correctly analyse & explain techniques
Data CollectionThe research project required field based data collection, it took place across the road at Hill barn as the rugby pitch was out of action. This was so that the participants were in the environment that the sport is played so that external validity can be claimed. Hill barn was also used as less equipment was involved (only a set of cones) and therefore did not need specialist equipment which would only be found in a lab, therefore the research project was also conducted in a cheaper way. However, I was not be able to control weather, which had an affect on dehydration levels and difficulty in exercising. The weather was hot and sunny when the tests were completed and therefore you can assume that fluid loss would have increased. This was useful for the research project as it showed a larger range between the starting and ending numerical values. If I had the facilities, the data will be quantitative as the colour of the urine could be analysed via the wavelengths and therefore numerical data can be produced. The research project relied on my subjective view, this was because I had no specialised equipment to measure osmolality This meant the it was only my opinion of the colour of the urine and where it was valued on the chart. Therefore my research design will not be as precise.
P3: Collect and record / M2: Correctly analyse & describe techniques / D1: Correctly analyse & explain techniques

Data Analysis
After the tests have been completed, I will have decided the numerical value that the urine sample is similar to and record this on a table (See Figures and table 1). The data from this table was then transferred onto the computer and a bar graph was created. The hydration level before, after and after an hour were separated by different colours so that the dereference between the hydration can be clearly evident. This will show the increase in hydration and be able to locate the greatest difference in numerical data, therefore finding the optimum hydration fuel.
P3: Collect and record / M2: Correctly analyse & describe techniques / D1: Correctly analyse & explain techniques

Results
The data collected after transferring it into a table and graph did not show any trends regarding which hydration fuel was the best. This may be because the number of participants were too low to have enough results to witness a trend. The results did show however, that all the fuels were capable of restoring the participants to euhydration.
P3: Collect and record / M2: Correctly analyse & describe techniques / D1: Correctly analyse & explain techniques

Discussion
After transferring the data onto an Excel document and a bar graph created, I was expecting to see a visible trend. At the beginning of the research project, I thought, probably quite naively, that there would be a clear difference between the hydration fuels and that one would stand above the rest. However, this was not the case. The graph (See Appendix 2), showed that all the fuels were successful in rehydrating the participant and there was no hydration fuel that gave a significant difference on hydration.
P2: Carry out / P4: Produce

ConclusionBy the end of my research project I aimed to determine the optimum rehydration fluid to enable a 16-18 year old female, performance level athlete, after high intensity exercise, reach pre exercise state of hydration.The key trends that were established in my literacy review included the importance of hydration on sporting performance and that athletes should try their best in educating themselves. My research came to the conclusion that everyone is an individual and therefore each athlete should do further tests on themselves to find their own optimum hydration fuel to improve their sporting performance. This information would be valuable for my population as sporting teams would be able to cater for each individual at performance level if they wanted to get that extra percentage in the performance. The literacy review also suggested that water is essential for hydration, however added sodium would restore plasma volumes to higher than rehydration state and therefore the athlete would become hydrated at a quicker rate.The results and discussion do not support my hypothesis because the sports drinks (isotonic, hypertonic and hypotonic) did not have a clear lead against water to be the optimum hydration fuel, even though they contain the sodium that was trending throughout the literacy review. Therefore, I would then agree with Michael N. Sawka who believes that with sufficient recovery time, consuming plain water and eating a normal meal will provide enough sodium, carbohydrate and electrolytes to restore euhydration.
P2: Carry out / P4: Produce

Assessment Criteria Pages 19-26
• P5: carry out a review of the research project conducted, describing strengths, areas for improvement and future recommendations.
• M3: carry out a review of the research project, explaining strengths, areas for improvement and future recommendations.
• D2: carry out a review of the research project, justifying future recommendations for further research.

Review (1/3)
By the end of my research project I aimed to determine the optimum rehydration fluid to enable a 16-18 year old female, performance level athlete, after high intensity exercise, reach pre exercise state of hydration. Regarding the exact aim, the research project conclusions did not meet this as there was no conclusive optimum hydration fuel found after analysing the results. The testing was able to show that all hydration fuels were efficient in restoring the hydration levels after exercise. So fro athletes at a performance level, it is essential to drink one of the four drinks to ensure they become fully hydrated again. The results also suggested that the best hydration fuel is different for each individual.
P5: Describe / M3: Explain / D2: Justify

Review (2/3)
What were the strengths of the research project? A strength of my research project is that I easily managed to find 10 willing participants. These participants also met the criteria stated in my aim, they were all female, performance level athletes who were aged 16-18 years old.Another strength of the research project is that the chosen exercise for my participants to take part in was achievable and dehydrated the participants enough that it would make a change to the colour of their urine. The Malcolms were also easy to explain so that there was no confusion and they were completed correctly is that the results were reliable. The tests that took place were located on the rugby field, this is a strength of the research as this is the environment that these athlete would be training/ playing matches on so therefore, the hydration levels reflects an everyday session.
P5: Describe / M3: Explain / D2: Justify
Review (3/3)What were the areas for improvement of the research project? An area of improvement that needed addressing was the fact that not all the participants were working as hard as others. This meant there was little difference in there hydration level because the amount of effort put in wasn’t enough for fluid loss to be high. Therefore, when comparing the urine colour before and after, each drink used was effective enough to get the participant to pre- exercise state. Another improvement area within the research project would be the fact that I judged the colour of the urine whilst it was in the bowl of the toilet, this meant that the colour was actually diluted which would have effected the results. However, the colour difference was still visible when comparing to a urine chart.The colour chart that I was comparing the urine too was very basic. And after visiting Chichester university and seeing that the osmolality of urine can be measured, I realised that my research project would not be accurate enough for others to benefit from the conclusion and results.
P5: Describe / M3: Explain / D2: Justify

Future Recommendations (1/5)If the project was to be completed again what would you change and why? If I was to complete the research again, I would have contacted Chichester university and ask if I could come and do some testing using their osmolality equipment. If I got permission then this would increase the accuracy of my research project as the concentration of the urine would be measured so even the smallest margin of difference would be recorded rather than just going up in colours.Another recommendation that would be considered is the lack of organisation that went on throughout the research project. The time scale previously stated on my research planning sheet was not kept to and therefore testing and concluding was completed in a rush.I would also recommend that the purchase of sample collectors ( such a pots) is essential, this is so that the urine is not diluted and can be held to the colour chart rather that relying on my subjective view.
P4: Produce / P5: Describe / M3: Explain / D2: Justify

Future Recommendations (2/5)
What would be the benefits of the proposed changes stated on the previous page? The proposed changes would be beneficial to the research project as it would make the results more accurate and precise. Using the osmolality of the urine will give the precise concentration to 0.01 %, which is quantitative data. Whereas my research project was qualitative but then turned into numerical data by a key.Improved organisation would mean that a thorough conclusion would be made.
P4: Produce / P5: Describe / M3: Explain / D2: Justify
Future Recommendations (3/5)
A further research project could be completed by changing the population of the aim. In my research project, the participants were all female. It would be interesting to see whether hydration levels and the type of fuel consumed would have a different effect on male performance level athletes.
P4: Produce / P5: Describe / M3: Explain / D2: Justify

Future Recommendations (4/5)
The population of the aim can also change regarding the level of performance of the participant when conducting further research. My research project conducted test of performance level athletes, whereas future test could be conducted on foundation level. This suggest the participants would be less fit and therefore fluid loss may be more and show a larger difference in hydration.
P4: Produce / P5: Describe / M3: Explain / D2: Justify

Future Recommendations (5/5)
The last future recommendation would be increasing the population by changing the age group to a greater range. A research project could focus on an older audience.
P4: Produce / P5: Describe / M3: Explain / D2: Justify

Research Project Appendices

Appendix 1The image shows a Physical activity readiness questionnaire which I asked each participant to complete before taking part in any of the testing process.

Appendix 2The images shows an example of a urine chart that I used when comparing the samples during the testing stage of the research project.

Appendix 3The image shows a diagram of one Malcolm.The cones are placed 10 metres apart. The participant will start laying on their front by the middle cone. They will then run to the cone in front of them and complete a down up. They will then turn around and run to the furthest cone and complete another down up. This is repeated 6 times to form a set.

Research Project Figures and Tables
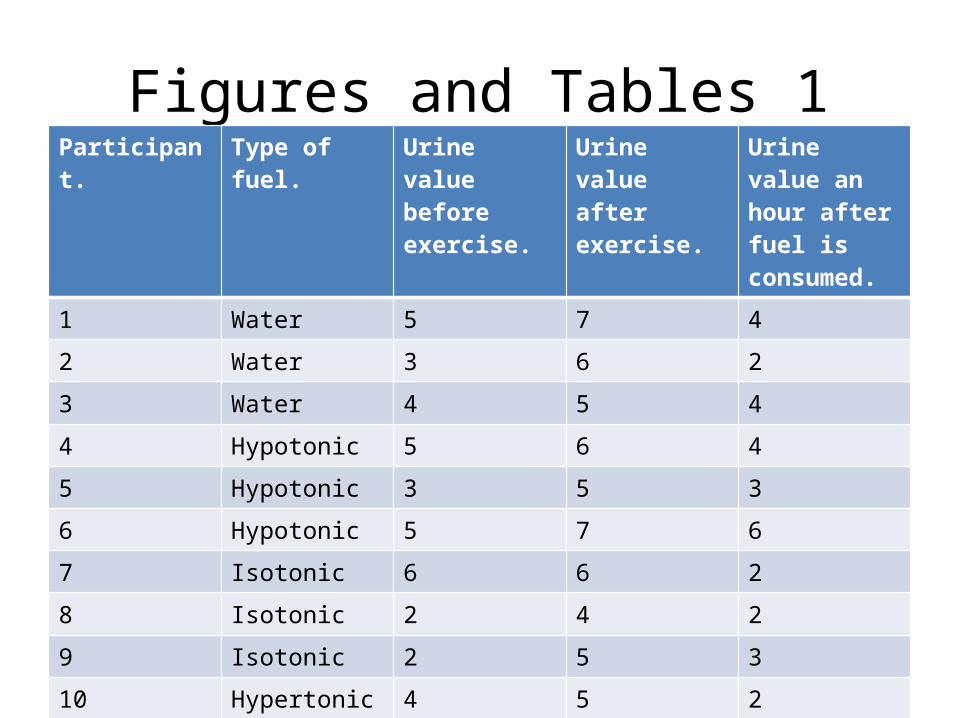
Figures and Tables 1Participant. Type of fuel. Urine value
before exercise.
Urine value after exercise.
Urine value an hour after fuel is consumed.
1 Water 5 7 4
2 Water 3 6 2
3 Water 4 5 4
4 Hypotonic 5 6 4
5 Hypotonic 3 5 3
6 Hypotonic 5 7 6
7 Isotonic 6 6 2
8 Isotonic 2 4 2
9 Isotonic 2 5 3
10 Hypertonic 4 5 2
11 Hypertonic 6 7 3
12 Hypertonic 3 5 4

Figures and Tables 2
1 2 3 4 5 6 7 8 9 10 11 120
1
2
3
4
5
6
7
8
Series1Series2Series3
Y axis : Value on urine chartX axis: Participant numberSeries 1: Before exerciseSeries 2: Straight after exerciseSeries 3: After an hour with hydration fuel1-3: Water4-6: Hypotonic7-9: Isotonic10-12: Hypertonic