unit 7 jeopardy
DESCRIPTION
Unit 7 JeopardY. Don’t yell Don’t argue and Have fun!. Unit 7 Review JEOPARDY. 7.2. 7.3/7.4. 7.1. 7.5. 7.7. 100. 100. 100. 100. 100. 200. 200. 200. 200. 200. 300. 300. 300. 300. 300. 400. 400. 400. 400. 400. 500. 500. 500. 500. 500. 7.1 100. Vocabulary: - PowerPoint PPT PresentationTRANSCRIPT

Don’t yellDon’t argue
and Have fun!
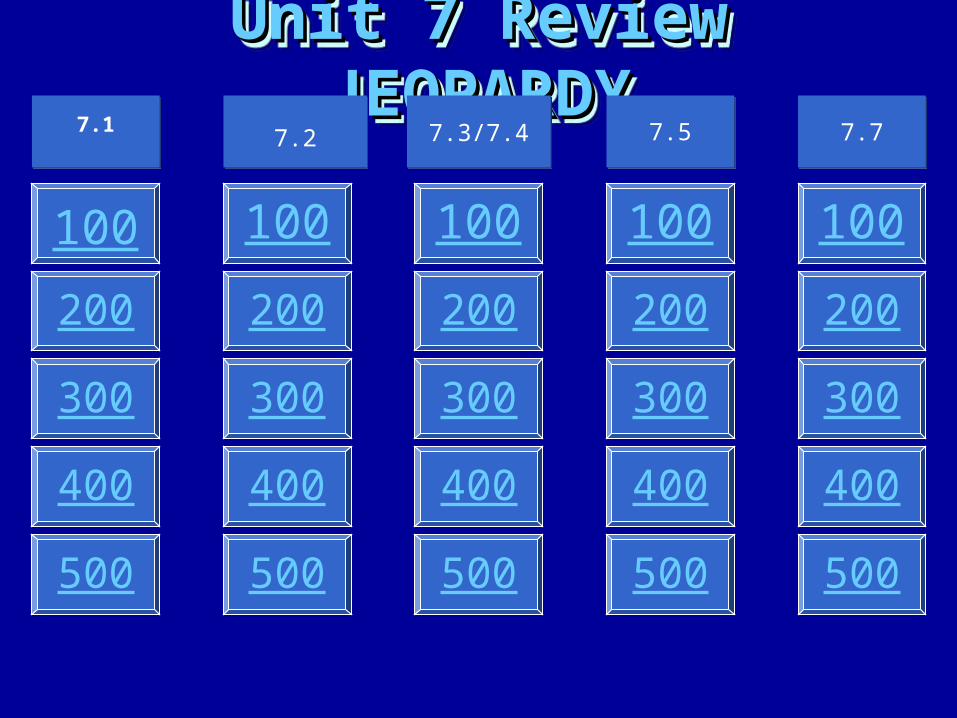
Unit 7 Review Unit 7 Review JEOPARDYJEOPARDY
Unit 7 Review Unit 7 Review JEOPARDYJEOPARDY
300
500
400
100
7.3/7.47.3/7.4
200
300
400
500
100
200
100
400
300
500
7.1
200
300
400
500
100
200
300
400
500
100
200
7.2 7.5 7.7
7.1 100
Vocabulary:
___________ is a graph of a set of data pairs (x, y)
7.1 100
What is
SCATTER PLOT
7.1 200
Vocabulary:
_______________ is a linear model used to fit a line to a
data set
7.1 200
What is
MEDIAN-MEDIAN LINE
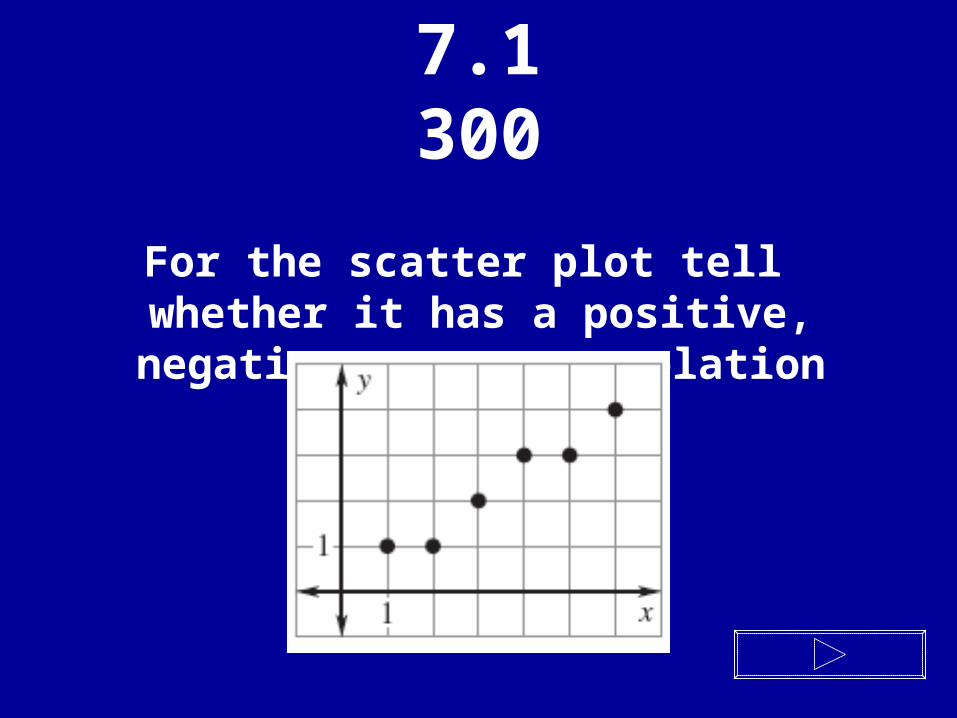
7.1300
For the scatter plot tell whether it has a positive, negative, or no correlation
7.1300
What is
POSITIVE CORRELATION
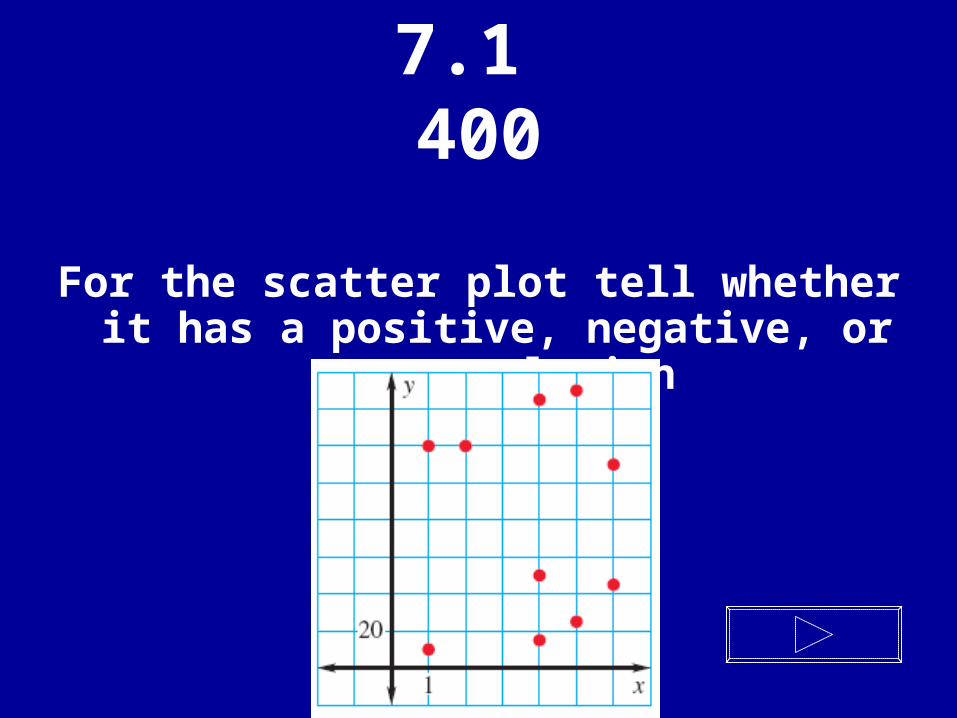
7.1 400
For the scatter plot tell whether it has a positive, negative, or no correlation
7.1 400
What is
NO CORRELATION
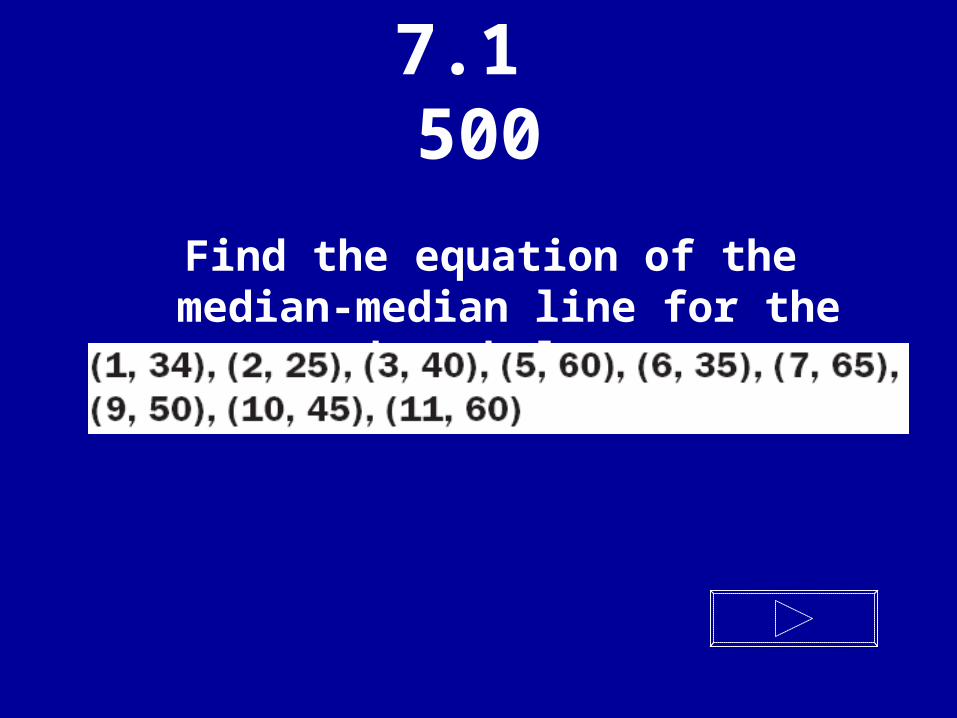
7.1 500
Find the equation of the median-median line for the data below:
7.1 500
What is
y = 2x + 36
7.2100
Vocabulary:_________________ is the process
of finding a the best fitting quadratic model for a set of data
7.2100
What is
QUADRATIC REGRESSION
7.2200
Vocabulary:
Finding a line or a curve that matches a set of data points is called
_______________

7.2200
What is
CURVE FITTING
7.2 300
Write the quadratic function whose graph has vertex (-2, 3) and passes
through the point (-1, 1)
7.2300
What is
y = -2(x + 2) + 3
7.2400
Write the quadratic function whose graph has vertex (1, -4) and
passes through the point (0, -3)
7.2400
What is
y = (x – 1)2 - 4
7.2500
Write a quadratic function whose graph has x-intercepts -2 and 1
and point (-1, -4)
7.2500
What is
y = 2(x + 2)(x – 1)
7.3/7.4100
Vocabulary:____________ are numerical values
used to summarize and compare sets of data
7.3/7.4 100
What is
STATISTICS
7.3/7.4 200
Vocabulary:
A normal distribution is modeled by a bell-shaped curve called a ________________
that is symmetric about the mean
7.3/7.4 200
What is
NORMAL CURVE
7.3/7.4300
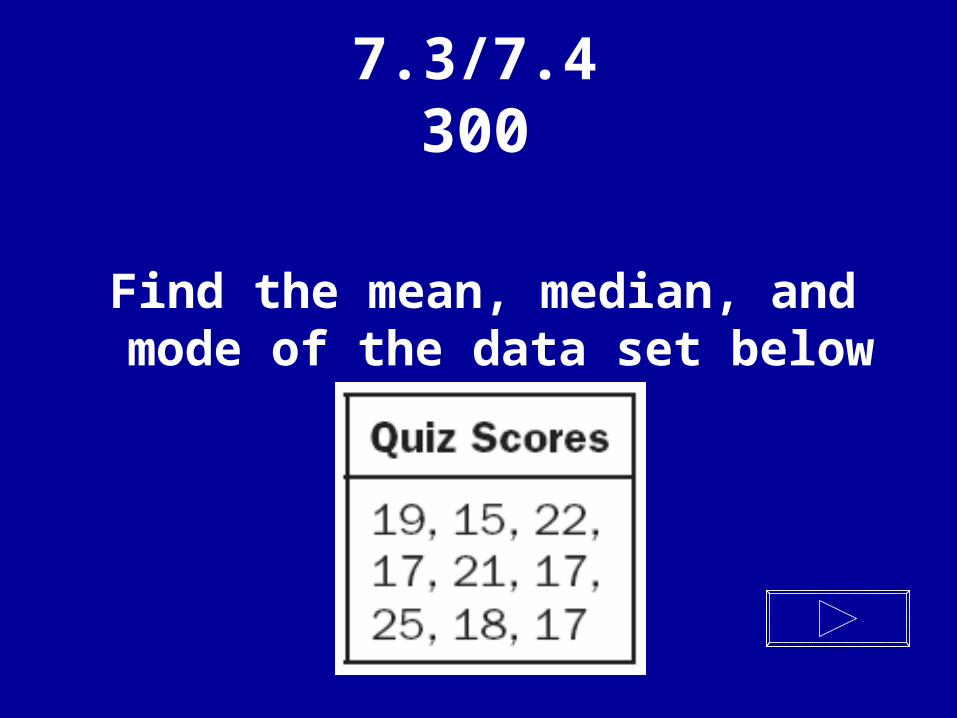
Find the mean, median, and mode of the data set below
7.3/7.4 300
What is
Mean: 19, Median: 18, Mode: 17
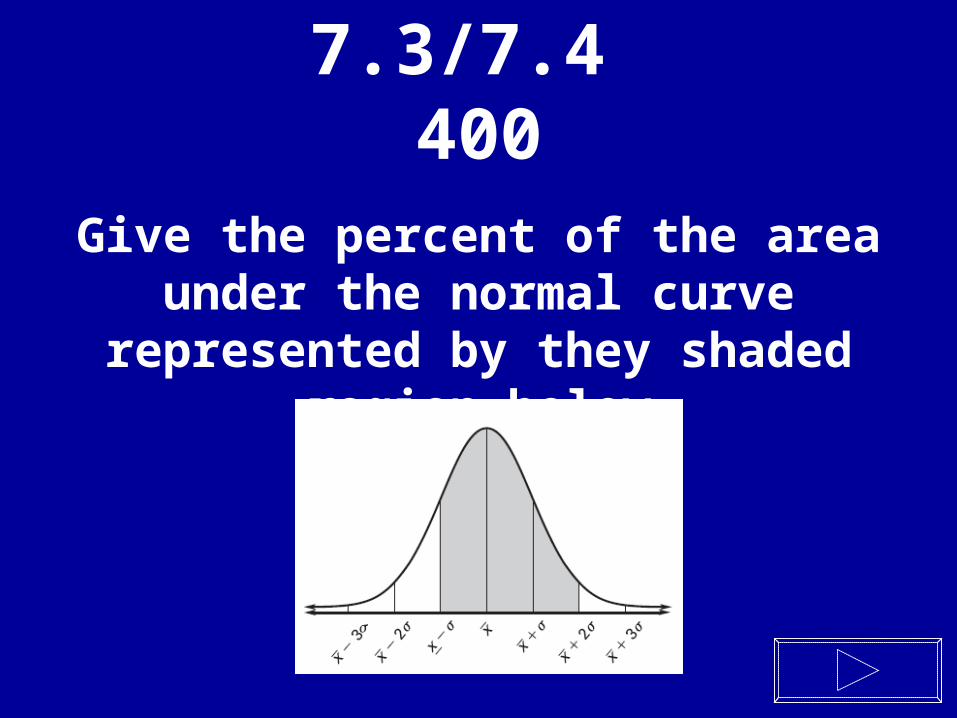
7.3/7.4 400
Give the percent of the area under the normal curve represented by they
shaded region below

7.3/7.4 400
What is
.815 or 81.5%
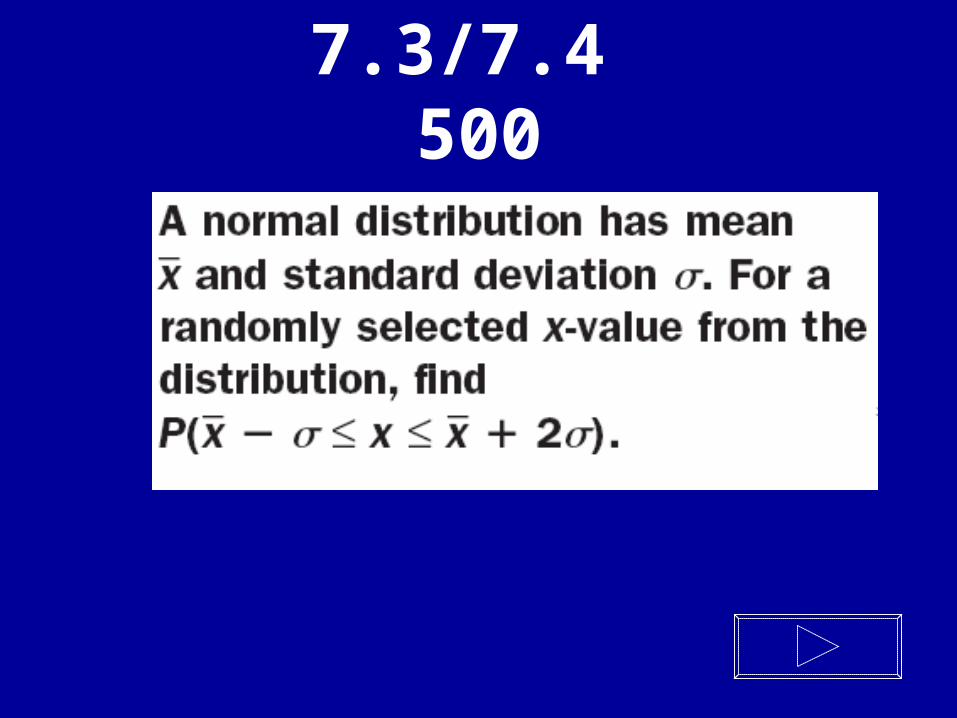
7.3/7.4 500
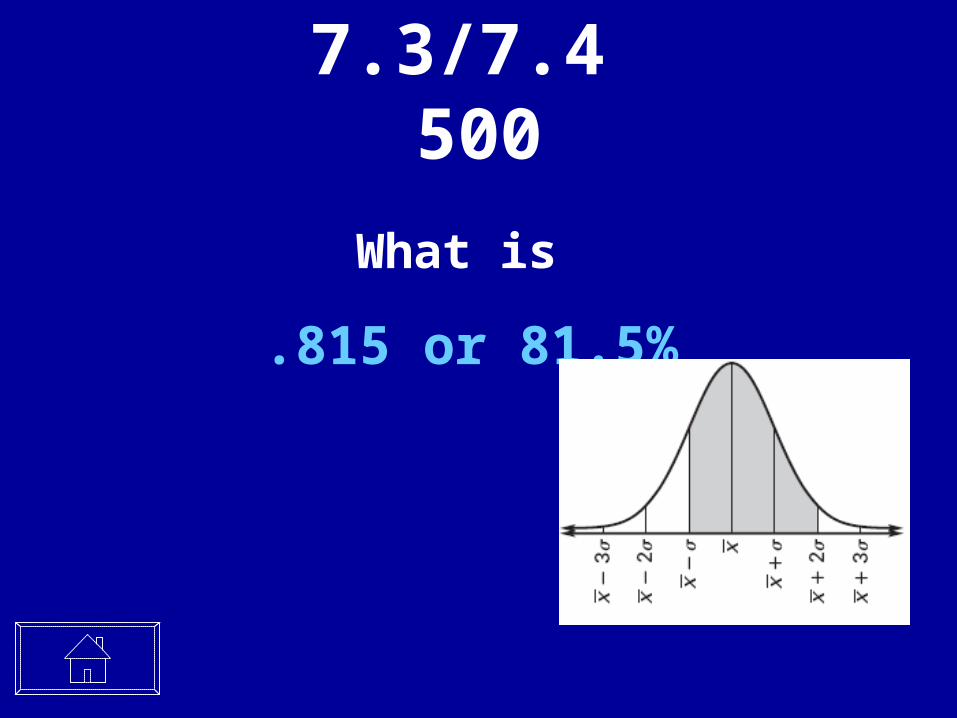
7.3/7.4 500
What is
.815 or 81.5%

7.5 100
Identify the type of sample:
7.5100
What is
SELF-SELECTED
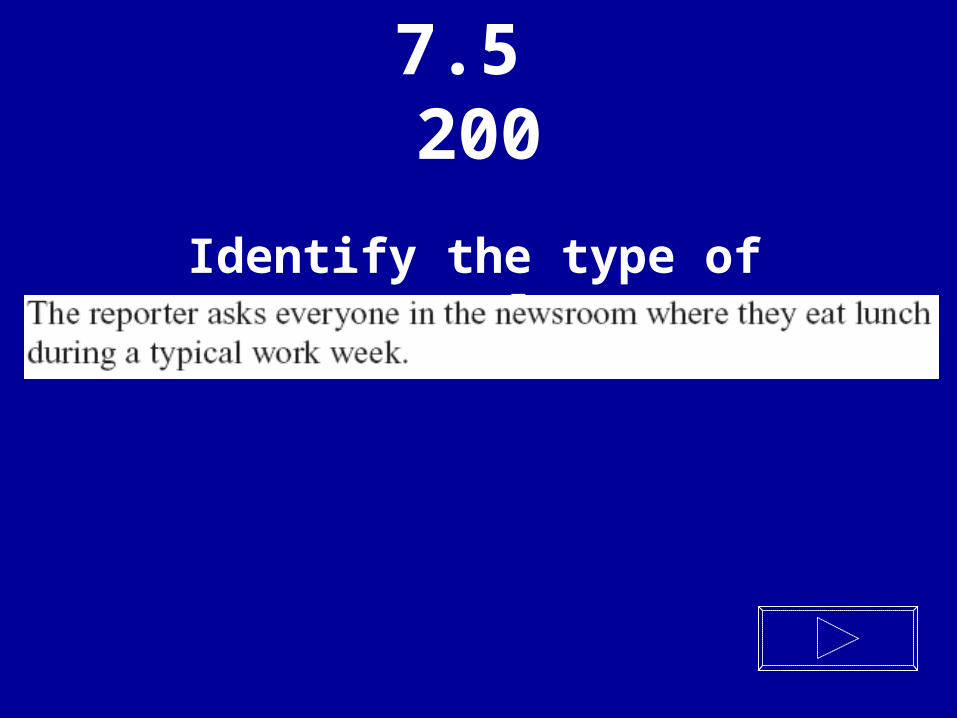
7.5 200
Identify the type of sample:
7.5 200
What is
CONVENIENCE
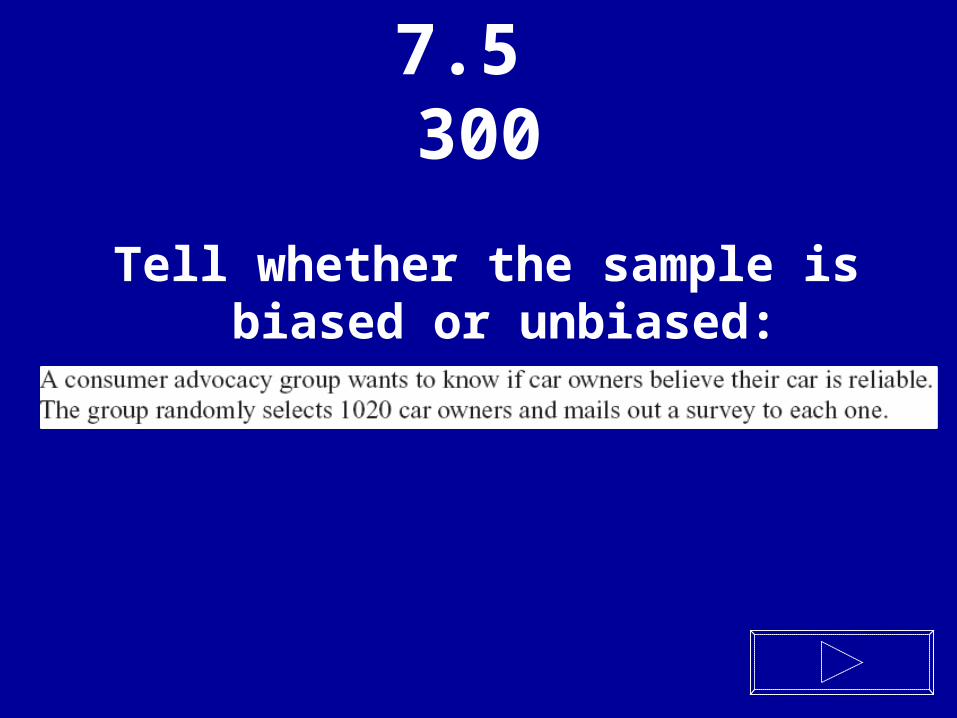
7.5 300
Tell whether the sample is biased or unbiased:
7.5 300
What is
UNBIASED
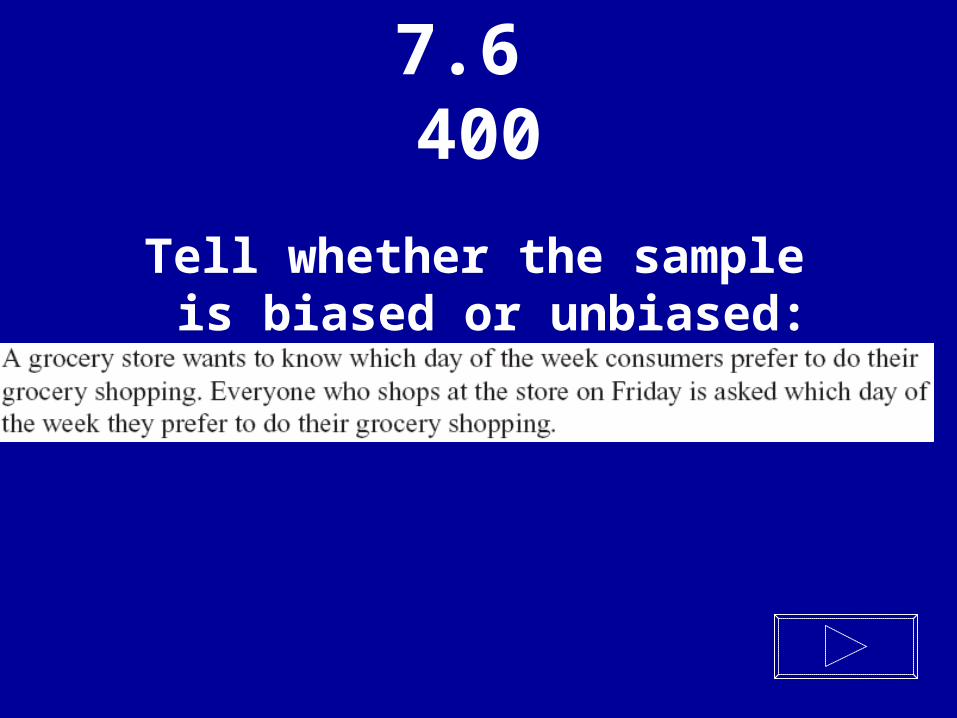
7.6 400
Tell whether the sample is biased or unbiased:
7.6 400
What is
BIASED
7.6 500
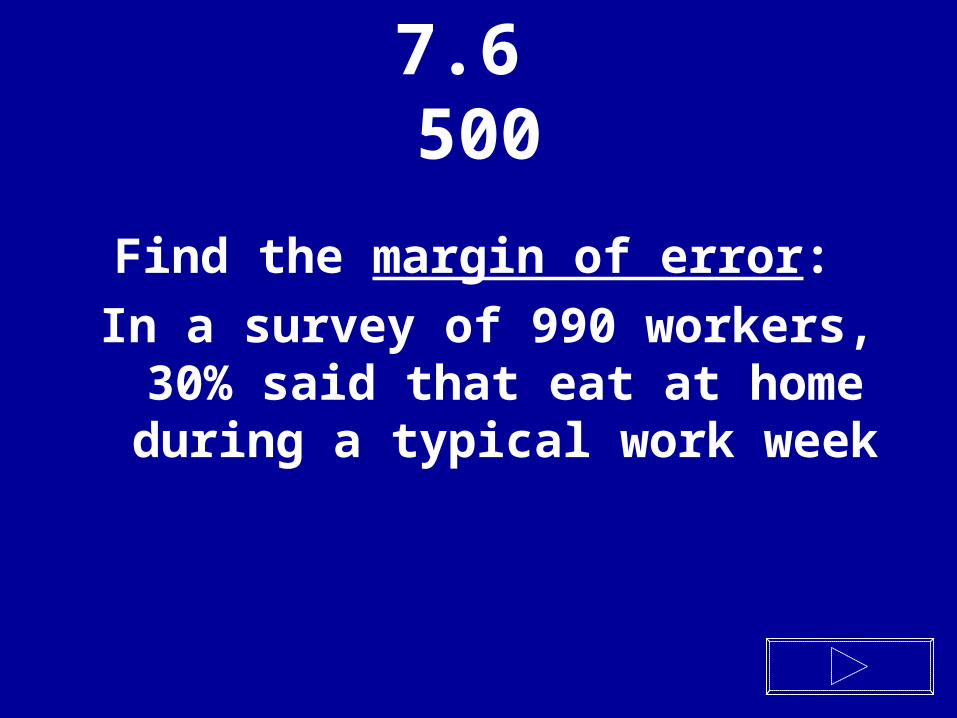
Find the margin of error:
In a survey of 990 workers, 30% said that eat at home during a
typical work week
7.6 500
What is
± 0.032
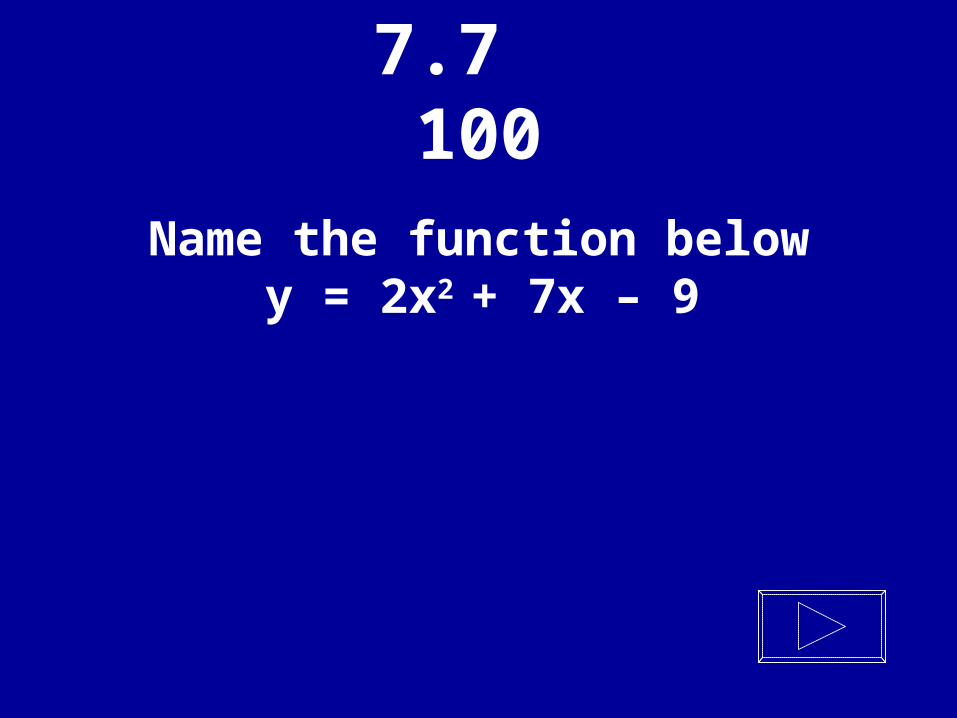
7.7 100
Name the function belowy = 2x2 + 7x – 9
7.7 100
What is
QUADRATIC
7.7 200
Name the function below:
y = 3x
7.7 200
What is
EXPONENTIAL
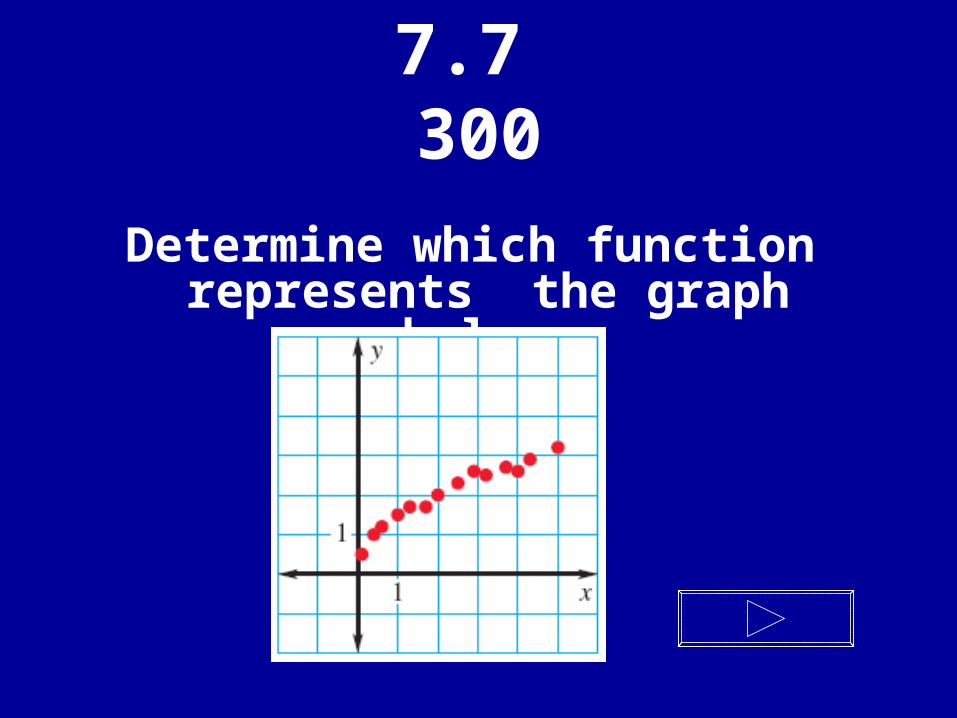
7.7 300
Determine which function represents the graph below:
7.7 300
What is
LINEAR
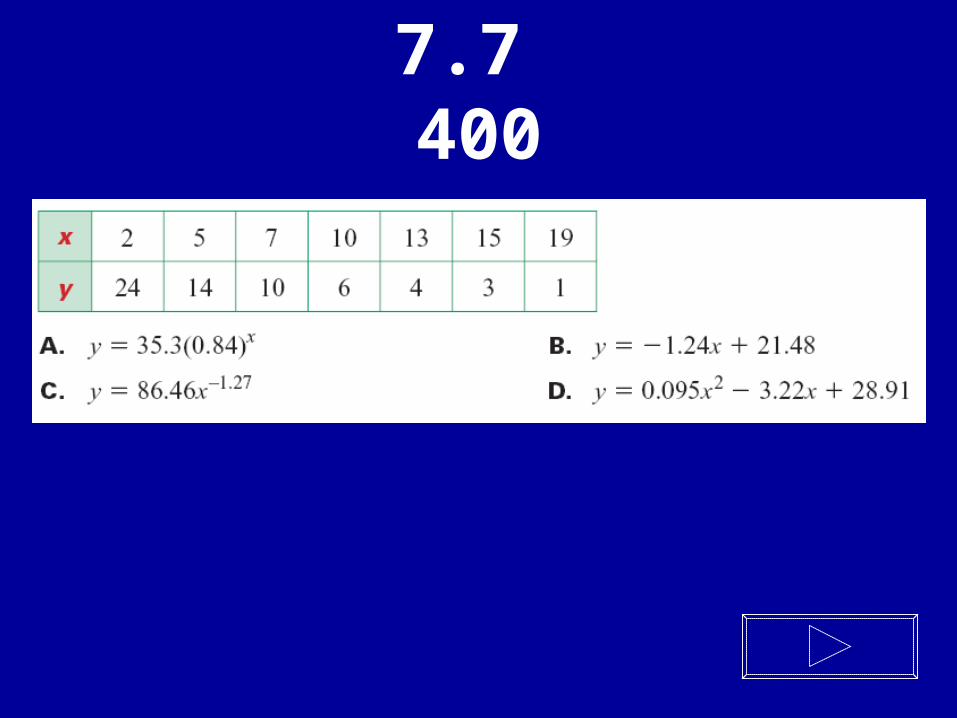
7.7 400
7.7 400
What is
A: y = 35.3(0.84)x
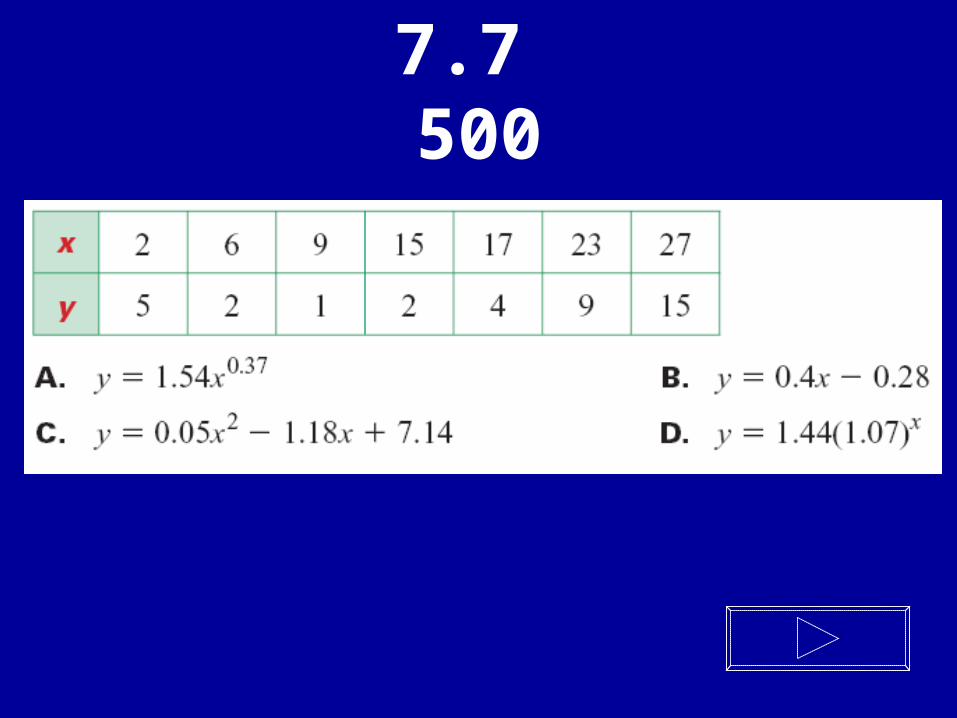
7.7 500
7.7 500
What is
C: y = 0.05x2 – 1.06x + 6.69