united nations • department of economic and social ... · pdf filesex ratio,2012 (men per...
TRANSCRIPT
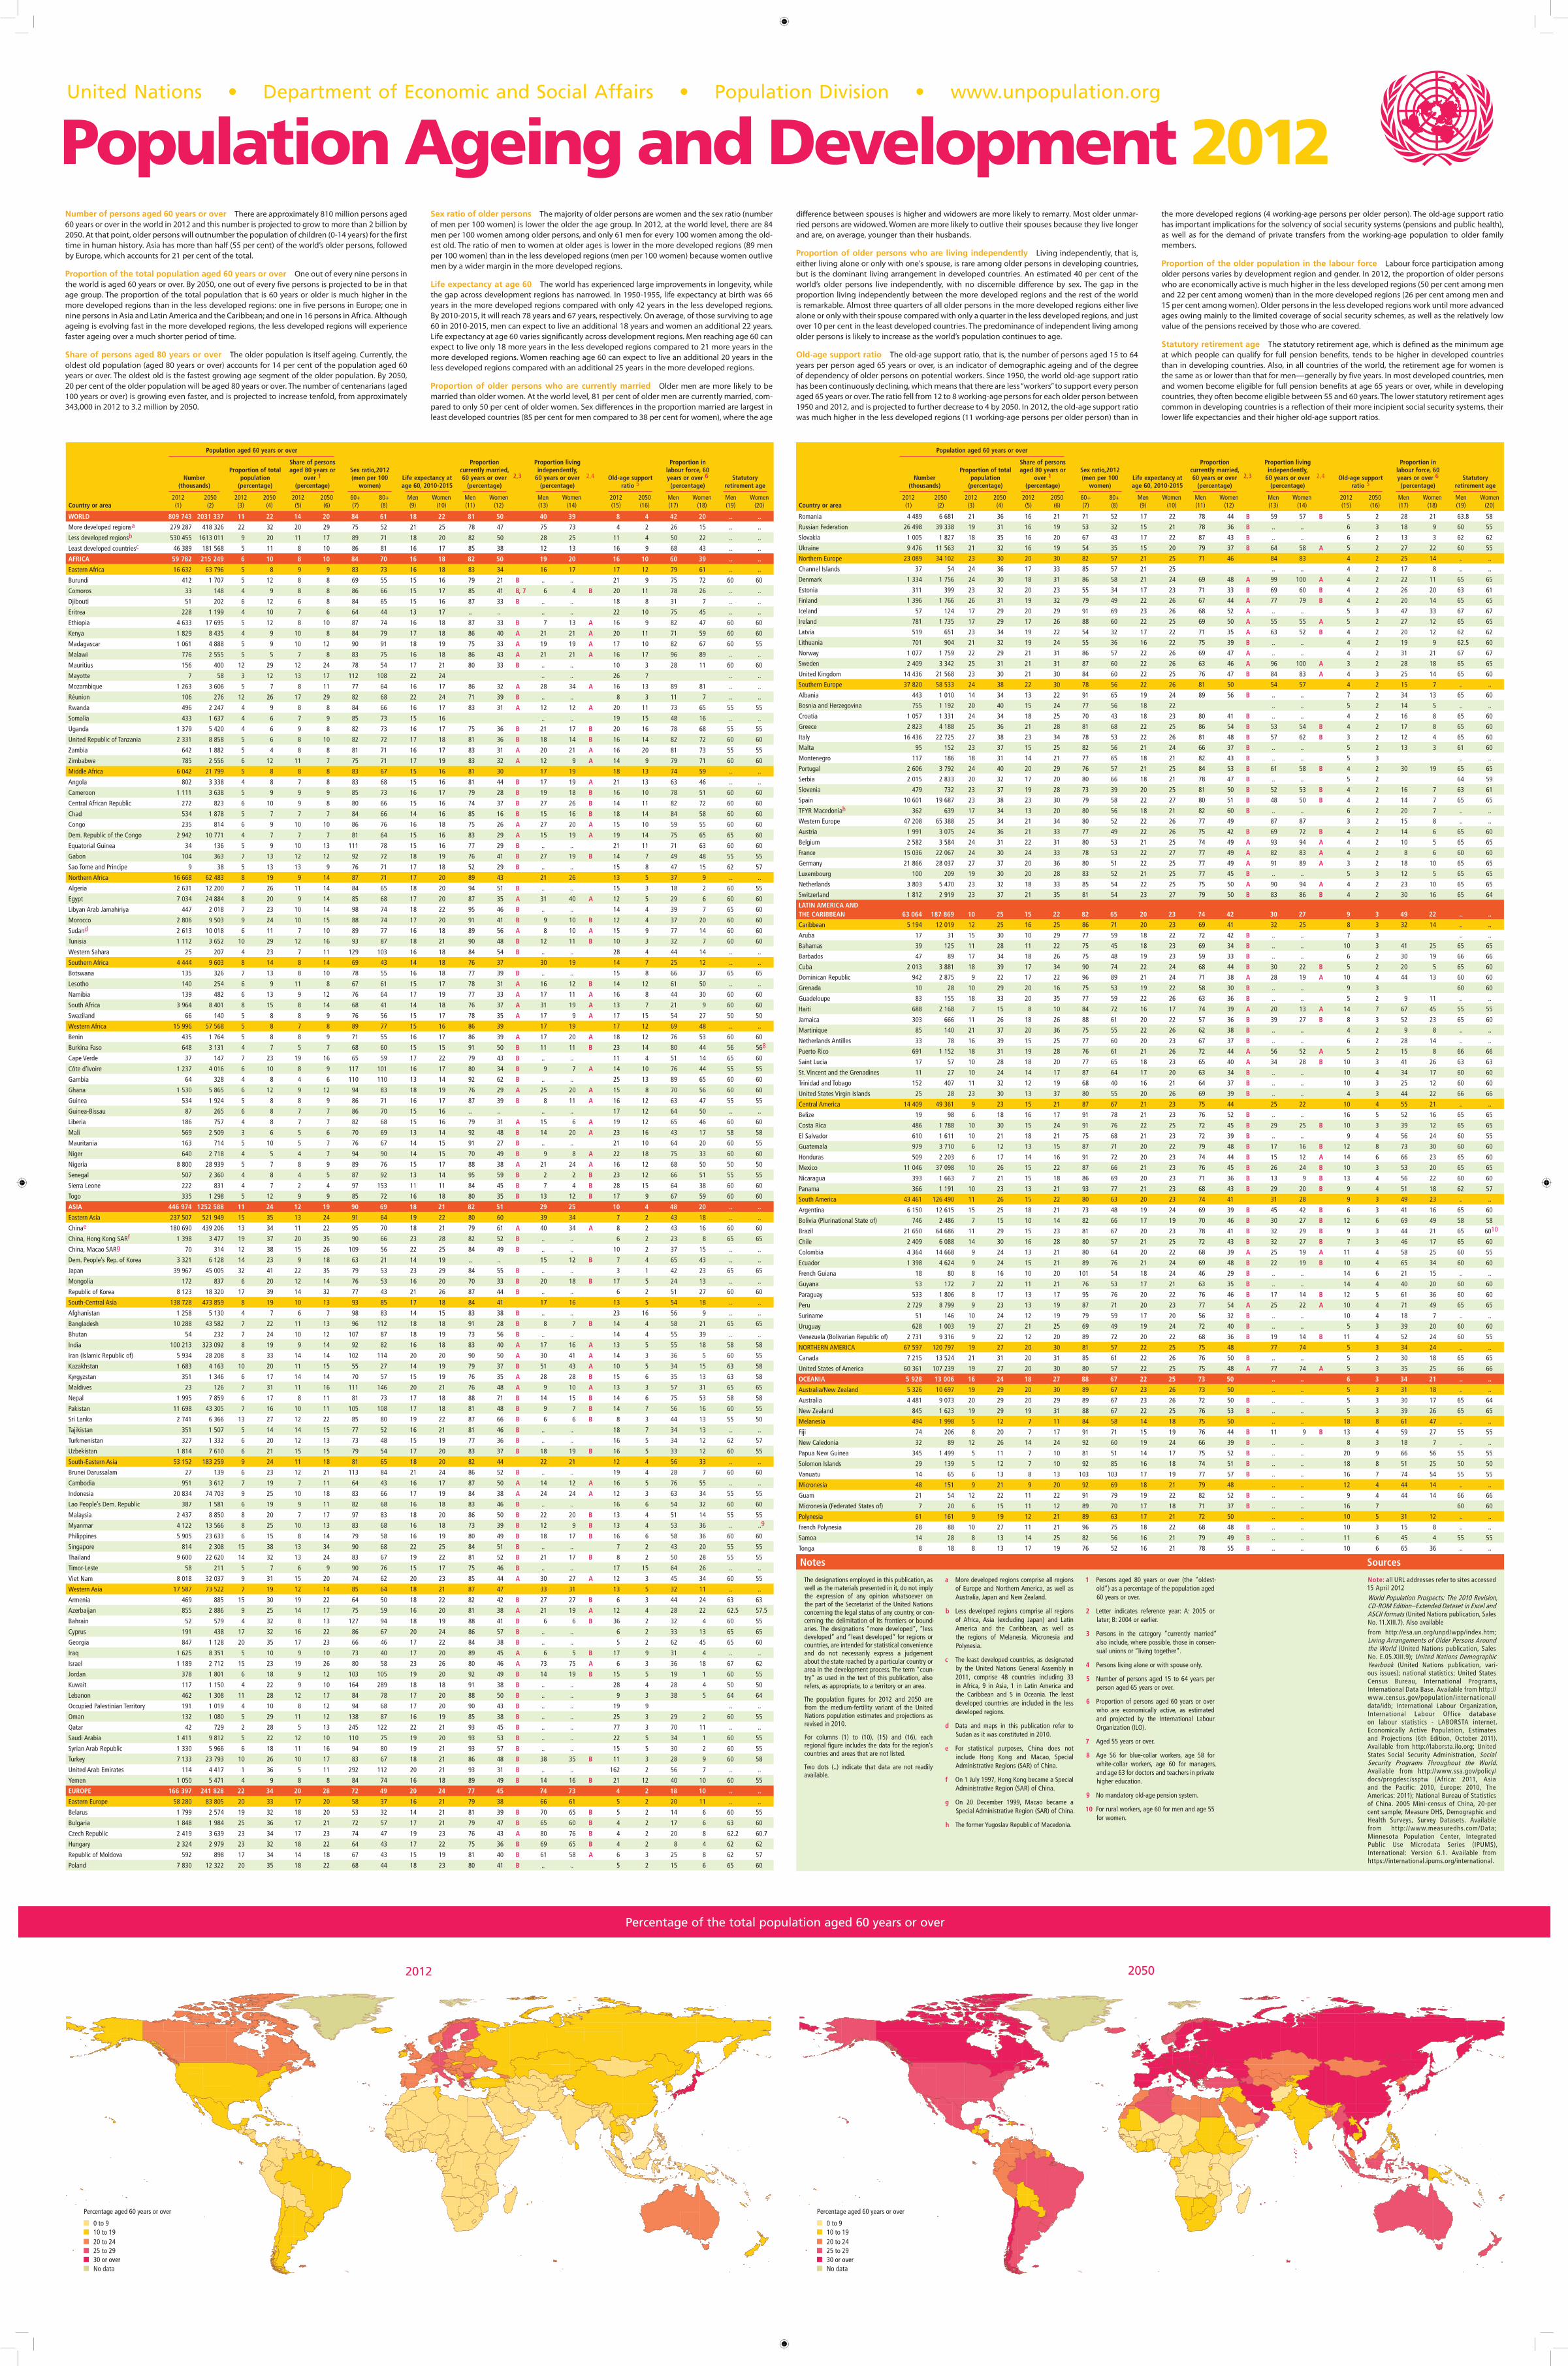
Country or area
Population aged 60 years or over
Number (thousands)
Proportion of total population
(percentage)
Share of persons aged 80 years or
over 1 (percentage)
Sex ratio,2012 (men per 100
women)Life expectancy at age 60, 2010-2015
Proportion currently married, 60 years or over
(percentage)2,3
Proportion living independently,
60 years or over (percentage)
2,4 Old-age support ratio 5
Proportion in labour force, 60 years or over 6
(percentage)Statutory
retirement age
2012(1)
2050(2)
2012(3)
2050(4)
2012(5)
2050(6)
60+(7)
80+(8)
Men(9)
Women(10)
Men(11)
Women(12)
Men(13)
Women(14)
2012(15)
2050(16)
Men(17)
Women(18)
Men(19)
Women(20)
WORLD 809 743 2031 337 11 22 14 20 84 61 18 22 81 50 40 39 8 4 42 20 .. ..
More developed regionsa 279 287 418 326 22 32 20 29 75 52 21 25 78 47 75 73 4 2 26 15 .. ..
Less developed regionsb 530 455 1613 011 9 20 11 17 89 71 18 20 82 50 28 25 11 4 50 22 .. ..
Least developed countriesc 46 389 181 568 5 11 8 10 86 81 16 17 85 38 12 13 16 9 68 43 .. ..
AFRICA 59 782 215 249 6 10 8 10 84 70 16 18 82 50 19 20 16 10 60 39 .. ..
Eastern Africa 16 632 63 796 5 8 9 9 83 73 16 18 83 34 16 17 17 12 79 61 .. ..
Burundi 412 1 707 5 12 8 8 69 55 15 16 79 21 B .. .. 21 9 75 72 60 60
Comoros 33 148 4 9 8 8 86 66 15 17 85 41 B, 7 6 4 B 20 11 78 26 .. ..
Djibouti 51 202 6 12 6 8 84 65 15 16 87 33 B .. .. 18 8 31 7 .. ..
Eritrea 228 1 199 4 10 7 6 64 44 13 17 .. .. .. .. 22 10 75 45 .. ..
Ethiopia 4 633 17 695 5 12 8 10 87 74 16 18 87 33 B 7 13 A 16 9 82 47 60 60
Kenya 1 829 8 435 4 9 10 8 84 79 17 18 86 40 A 21 21 A 20 11 71 59 60 60
Madagascar 1 061 4 888 5 9 10 12 90 91 18 19 75 33 A 19 19 A 17 10 82 67 60 55
Malawi 776 2 555 5 5 7 8 83 75 16 18 86 43 A 21 21 A 16 17 96 89 .. ..
Mauritius 156 400 12 29 12 24 78 54 17 21 80 33 B .. .. 10 3 28 11 60 60
Mayotte 7 58 3 12 13 17 112 108 22 24 .. .. 26 7 .. ..
Mozambique 1 263 3 606 5 7 8 11 77 64 16 17 86 32 A 28 34 A 16 13 89 81 .. ..
Réunion 106 276 12 26 17 29 82 68 22 24 71 39 B .. .. 8 3 11 7 .. ..
Rwanda 496 2 247 4 9 8 8 84 66 16 17 83 31 A 12 12 A 20 11 73 65 55 55
Somalia 433 1 637 4 6 7 9 85 73 15 16 .. .. 19 15 48 16 .. ..
Uganda 1 379 5 420 4 6 9 8 82 73 16 17 75 36 B 21 17 B 20 16 78 68 55 55
United Republic of Tanzania 2 331 8 858 5 6 8 10 82 72 17 18 81 36 B 18 14 B 16 14 82 72 60 60
Zambia 642 1 882 5 4 8 8 81 71 16 17 83 31 A 20 21 A 16 20 81 73 55 55
Zimbabwe 785 2 556 6 12 11 7 75 71 17 19 83 32 A 12 9 A 14 9 79 71 60 60
Middle Africa 6 042 21 799 5 8 8 8 83 67 15 16 81 30 17 19 18 13 74 59 .. ..
Angola 802 3 338 4 8 7 8 83 68 15 16 81 44 B 17 19 A 21 13 63 46 .. ..
Cameroon 1 111 3 638 5 9 9 9 85 73 16 17 79 28 B 19 18 B 16 10 78 51 60 60
Central African Republic 272 823 6 10 9 8 80 66 15 16 74 37 B 27 26 B 14 11 82 72 60 60
Chad 534 1 878 5 7 7 7 84 66 14 16 85 16 B 15 16 B 18 14 84 58 60 60
Congo 235 814 6 9 10 10 86 76 16 18 75 26 A 27 20 A 15 10 59 55 60 60
Dem. Republic of the Congo 2 942 10 771 4 7 7 7 81 64 15 16 83 29 A 15 19 A 19 14 75 65 65 60
Equatorial Guinea 34 136 5 9 10 13 111 78 15 16 77 29 B .. .. 21 11 71 63 60 60
Gabon 104 363 7 13 12 12 92 72 18 19 76 41 B 27 19 B 14 7 49 48 55 55
Sao Tome and Principe 9 38 5 13 13 9 76 71 17 18 52 29 B .. .. 15 8 47 15 62 57
Northern Africa 16 668 62 483 8 19 9 14 87 71 17 20 89 43 21 26 13 5 37 9 .. ..
Algeria 2 631 12 200 7 26 11 14 84 65 18 20 94 51 B .. .. 15 3 18 2 60 55
Egypt 7 034 24 884 8 20 9 14 85 68 17 20 87 35 A 31 40 A 12 5 29 6 60 60
Libyan Arab Jamahiriya 447 2 018 7 23 10 14 98 74 18 22 95 46 B .. .. 14 4 39 7 65 60
Morocco 2 806 9 503 9 24 10 15 88 74 17 20 91 41 B 9 10 B 12 4 37 20 60 60
Sudand 2 613 10 018 6 11 7 10 89 77 16 18 89 56 A 8 10 A 15 9 77 14 60 60
Tunisia 1 112 3 652 10 29 12 16 93 87 18 21 90 48 B 12 11 B 10 3 32 7 60 60
Western Sahara 25 207 4 23 7 11 129 103 16 18 84 54 B .. .. 28 4 44 14 .. ..
Southern Africa 4 444 9 603 8 14 8 14 69 43 14 18 76 37 30 19 14 7 25 12 .. ..
Botswana 135 326 7 13 8 10 78 55 16 18 77 39 B .. .. 15 8 66 37 65 65
Lesotho 140 254 6 9 11 8 67 61 15 17 78 31 A 16 12 B 14 12 61 50 .. ..
Namibia 139 482 6 13 9 12 76 64 17 19 77 33 A 17 11 A 16 8 44 30 60 60
South Africa 3 964 8 401 8 15 8 14 68 41 14 18 76 37 A 31 19 A 13 7 21 9 60 60
Swaziland 66 140 5 8 8 9 76 56 15 17 78 35 A 17 9 A 17 15 54 27 50 50
Western Africa 15 996 57 568 5 8 7 8 89 77 15 16 86 39 17 19 17 12 69 48 .. ..
Benin 435 1 764 5 8 8 9 71 55 16 17 86 39 A 17 20 A 18 12 76 53 60 60
Burkina Faso 648 3 131 4 7 5 7 68 60 15 15 91 50 B 11 11 B 23 14 80 44 56 568
Cape Verde 37 147 7 23 19 16 65 59 17 22 79 43 B .. .. 11 4 51 14 65 60
Côte d’Ivoire 1 237 4 016 6 10 8 9 117 101 16 17 80 34 B 9 7 A 14 10 76 44 55 55
Gambia 64 328 4 8 4 6 110 110 13 14 92 62 B .. .. 25 13 89 65 60 60
Ghana 1 530 5 865 6 12 9 12 94 83 18 19 76 29 A 25 20 A 15 8 70 56 60 60
Guinea 534 1 924 5 8 8 9 86 71 16 17 87 39 B 8 11 A 16 12 63 47 55 55
Guinea-Bissau 87 265 6 8 7 7 86 70 15 16 .. .. .. .. 17 12 64 50 .. ..
Liberia 186 757 4 8 7 7 82 68 15 16 79 31 A 15 6 A 19 12 65 46 60 60
Mali 569 2 509 3 6 5 6 70 69 13 14 92 48 B 14 20 A 23 16 43 17 58 58
Mauritania 163 714 5 10 5 7 76 67 14 15 91 27 B .. .. 21 10 64 20 60 55
Niger 640 2 718 4 5 4 7 94 90 14 15 70 49 B 9 8 A 22 18 75 33 60 60
Nigeria 8 800 28 939 5 7 8 9 89 76 15 17 88 38 A 21 24 A 16 12 68 50 50 50
Senegal 507 2 360 4 8 4 5 87 92 13 14 95 59 B 2 2 B 23 12 66 51 55 55
Sierra Leone 222 831 4 7 2 4 97 153 11 11 84 45 B 7 4 B 28 15 64 38 60 60
Togo 335 1 298 5 12 9 9 85 72 16 18 80 35 B 13 12 B 17 9 67 59 60 60
ASIA 446 974 1252 588 11 24 12 19 90 69 18 21 82 51 29 25 10 4 48 20 .. ..
Eastern Asia 237 507 521 949 15 35 13 24 91 64 19 22 80 60 39 34 7 2 43 18 .. ..
Chinae 180 690 439 206 13 34 11 22 95 70 18 21 79 61 A 40 34 A 8 2 43 16 60 60
China, Hong Kong SARf 1 398 3 477 19 37 20 35 90 66 23 28 82 52 B .. .. 6 2 23 8 65 65
China, Macao SARg 70 314 12 38 15 26 109 56 22 25 84 49 B .. .. 10 2 37 15 .. ..
Dem. People’s Rep. of Korea 3 321 6 128 14 23 9 18 63 21 14 19 .. .. 15 12 B 7 4 65 43 .. ..
Japan 39 967 45 005 32 41 22 35 79 53 23 29 84 55 B .. .. 3 1 42 23 65 65
Mongolia 172 837 6 20 12 14 76 53 16 20 70 33 B 20 18 B 17 5 24 13 .. ..
Republic of Korea 8 123 18 320 17 39 14 32 77 43 21 26 87 44 B .. .. 6 2 51 27 60 60
South-Central Asia 138 728 473 859 8 19 10 13 93 85 17 18 84 41 17 16 13 5 54 18 .. ..
Afghanistan 1 258 5 130 4 7 6 7 98 83 14 15 83 38 B .. .. 23 16 56 9 .. ..
Bangladesh 10 288 43 582 7 22 11 13 96 112 18 18 91 28 B 8 7 B 14 4 58 21 65 65
Bhutan 54 232 7 24 10 12 107 87 18 19 73 56 B .. .. 14 4 55 39 .. ..
India 100 213 323 092 8 19 9 14 92 82 16 18 83 40 A 17 16 A 13 5 55 18 58 58
Iran (Islamic Republic of) 5 934 28 208 8 33 14 14 102 114 20 20 90 50 A 30 41 A 14 3 36 5 60 55
Kazakhstan 1 683 4 163 10 20 11 15 55 27 14 19 79 37 B 51 43 A 10 5 34 15 63 58
Kyrgyzstan 351 1 346 6 17 14 14 70 57 15 19 76 35 A 28 28 B 15 6 35 13 63 58
Maldives 23 126 7 31 11 16 111 146 20 21 76 48 A 9 10 A 13 3 57 31 65 65
Nepal 1 995 7 859 6 17 8 11 81 73 17 18 88 71 B 14 15 B 14 6 75 53 58 58
Pakistan 11 698 43 305 7 16 10 11 105 108 17 18 81 48 B 9 7 B 14 7 56 16 60 55
Sri Lanka 2 741 6 366 13 27 12 22 85 80 19 22 87 66 B 6 6 B 8 3 44 13 55 50
Tajikistan 351 1 507 5 14 14 15 77 52 16 21 81 46 B .. .. 18 7 34 13 .. ..
Turkmenistan 327 1 332 6 20 12 13 73 48 15 19 77 36 B .. .. 16 5 34 12 62 57
Uzbekistan 1 814 7 610 6 21 15 15 79 54 17 20 83 37 B 18 19 B 16 5 33 12 60 55
South-Eastern Asia 53 152 183 259 9 24 11 18 81 65 18 20 82 44 22 21 12 4 56 33 .. ..
Brunei Darussalam 27 139 6 23 12 21 113 84 21 24 86 52 B .. .. 19 4 28 7 60 60
Cambodia 951 3 612 7 19 7 11 64 43 16 17 87 50 A 14 12 A 16 5 76 55 .. ..
Indonesia 20 834 74 703 9 25 10 18 83 66 17 19 84 38 A 24 24 A 12 3 63 34 55 55
Lao People’s Dem. Republic 387 1 581 6 19 9 11 82 68 16 18 83 46 B .. .. 16 6 54 32 60 60
Malaysia 2 437 8 850 8 20 7 17 97 83 18 20 86 50 B 22 20 B 13 4 51 14 55 55
Myanmar 4 122 13 566 8 25 10 13 83 68 16 18 73 39 B 12 9 B 13 4 53 36 .. ..9
Philippines 5 905 23 633 6 15 8 14 79 58 16 19 80 49 B 18 17 B 16 6 58 36 60 60
Singapore 814 2 308 15 38 13 34 90 68 22 25 84 51 B .. .. 7 2 43 20 55 55
Thailand 9 600 22 620 14 32 13 24 83 67 19 22 81 52 B 21 17 B 8 2 50 28 55 55
Timor-Leste 58 211 5 7 6 9 90 76 15 17 75 46 B .. .. 17 15 64 26 .. ..
Viet Nam 8 018 32 037 9 31 15 20 74 62 20 23 85 44 A 30 27 A 12 3 45 34 60 55
Western Asia 17 587 73 522 7 19 12 14 85 64 18 21 87 47 33 31 13 5 32 11 .. ..
Armenia 469 885 15 30 19 22 64 50 18 22 82 42 B 27 27 B 6 3 44 24 63 63
Azerbaijan 855 2 886 9 25 14 17 75 59 16 20 81 38 A 21 19 A 12 4 28 22 62.5 57.5
Bahrain 52 579 4 32 8 13 127 94 18 19 88 41 B 6 6 B 36 2 32 4 60 55
Cyprus 191 438 17 32 16 22 86 67 20 24 86 57 B .. .. 6 2 33 13 65 65
Georgia 847 1 128 20 35 17 23 66 46 17 22 84 38 B .. .. 5 2 62 45 65 60
Iraq 1 625 8 351 5 10 9 10 73 40 17 20 89 45 A 6 5 B 17 9 31 4 .. ..
Israel 1 189 2 712 15 23 19 26 80 58 23 26 80 46 A 73 75 A 6 3 36 18 67 62
Jordan 378 1 801 6 18 9 12 103 105 19 20 92 49 B 14 19 B 15 5 19 1 60 55
Kuwait 117 1 150 4 22 9 10 164 289 18 18 91 38 B .. .. 28 4 28 4 50 50
Lebanon 462 1 308 11 28 12 17 84 78 17 20 88 50 B .. .. 9 3 38 5 64 64
Occupied Palestinian Territory 191 1 019 4 10 8 12 94 68 17 20 90 43 B .. .. 19 9 .. ..
Oman 132 1 080 5 29 11 12 138 87 16 19 85 38 B .. .. 25 3 29 2 60 55
Qatar 42 729 2 28 5 13 245 122 22 21 93 45 B .. .. 77 3 70 11 .. ..
Saudi Arabia 1 411 9 812 5 22 12 10 110 75 19 20 93 53 B .. .. 22 5 34 1 60 55
Syrian Arab Republic 1 330 5 966 6 18 11 16 94 80 19 21 93 57 B .. .. 15 5 30 2 60 55
Turkey 7 133 23 793 10 26 10 17 83 67 18 21 86 48 B 38 35 B 11 3 28 9 60 58
United Arab Emirates 114 4 417 1 36 5 11 292 112 20 21 93 31 B .. .. 162 2 56 7 .. ..
Yemen 1 050 5 471 4 9 8 8 84 74 16 18 89 49 B 14 16 B 21 12 40 10 60 55
EUROPE 166 397 241 828 22 34 20 28 72 49 20 24 77 45 74 73 4 2 18 10 .. ..
Eastern Europe 58 280 83 805 20 33 17 20 58 37 16 21 79 38 66 61 5 2 20 11 .. ..
Belarus 1 799 2 574 19 32 18 20 53 32 14 21 81 39 B 70 65 B 5 2 14 6 60 55
Bulgaria 1 848 1 984 25 36 17 21 72 57 17 21 79 47 B 65 60 B 4 2 17 6 63 60
Czech Republic 2 419 3 639 23 34 17 23 74 47 19 23 76 43 A 80 76 B 4 2 20 8 62.2 60.7
Hungary 2 324 2 979 23 32 18 22 64 43 17 22 75 36 B 69 65 B 4 2 8 4 62 62
Republic of Moldova 592 898 17 34 14 18 67 43 15 19 81 40 B 61 58 A 6 3 25 8 62 57
Poland 7 830 12 322 20 35 18 22 68 44 18 23 80 41 B .. .. 5 2 15 6 65 60
Number of persons aged 60 years or over There are approximately 810 million persons aged 60 years or over in the world in 2012 and this number is projected to grow to more than 2 billion by 2050. At that point, older persons will outnumber the population of children (0-14 years) for the first time in human history. Asia has more than half (55 per cent) of the world’s older persons, followed by Europe, which accounts for 21 per cent of the total.
Proportion of the total population aged 60 years or over One out of every nine persons in the world is aged 60 years or over. By 2050, one out of every five persons is projected to be in that age group. The proportion of the total population that is 60 years or older is much higher in the more developed regions than in the less developed regions: one in five persons in Europe; one in nine persons in Asia and Latin America and the Caribbean; and one in 16 persons in Africa. Although ageing is evolving fast in the more developed regions, the less developed regions will experience faster ageing over a much shorter period of time.
Share of persons aged 80 years or over The older population is itself ageing. Currently, the oldest old population (aged 80 years or over) accounts for 14 per cent of the population aged 60 years or over. The oldest old is the fastest growing age segment of the older population. By 2050, 20 per cent of the older population will be aged 80 years or over. The number of centenarians (aged 100 years or over) is growing even faster, and is projected to increase tenfold, from approximately 343,000 in 2012 to 3.2 million by 2050.
Sex ratio of older persons The majority of older persons are women and the sex ratio (number of men per 100 women) is lower the older the age group. In 2012, at the world level, there are 84 men per 100 women among older persons, and only 61 men for every 100 women among the old-est old. The ratio of men to women at older ages is lower in the more developed regions (89 men per 100 women) than in the less developed regions (men per 100 women) because women outlive men by a wider margin in the more developed regions.
Life expectancy at age 60 The world has experienced large improvements in longevity, while the gap across development regions has narrowed. In 1950-1955, life expectancy at birth was 66 years in the more developed regions compared with only 42 years in the less developed regions. By 2010-2015, it will reach 78 years and 67 years, respectively. On average, of those surviving to age 60 in 2010-2015, men can expect to live an additional 18 years and women an additional 22 years. Life expectancy at age 60 varies significantly across development regions. Men reaching age 60 can expect to live only 18 more years in the less developed regions compared to 21 more years in the more developed regions. Women reaching age 60 can expect to live an additional 20 years in the less developed regions compared with an additional 25 years in the more developed regions.
Proportion of older persons who are currently married Older men are more likely to be married than older women. At the world level, 81 per cent of older men are currently married, com-pared to only 50 per cent of older women. Sex differences in the proportion married are largest in least developed countries (85 per cent for men compared to 38 per cent for women), where the age
difference between spouses is higher and widowers are more likely to remarry. Most older unmar-ried persons are widowed. Women are more likely to outlive their spouses because they live longer and are, on average, younger than their husbands.
Proportion of older persons who are living independently Living independently, that is, either living alone or only with one's spouse, is rare among older persons in developing countries, but is the dominant living arrangement in developed countries. An estimated 40 per cent of the world’s older persons live independently, with no discernible difference by sex. The gap in the proportion living independently between the more developed regions and the rest of the world is remarkable. Almost three quarters of all older persons in the more developed regions either live alone or only with their spouse compared with only a quarter in the less developed regions, and just over 10 per cent in the least developed countries. The predominance of independent living among older persons is likely to increase as the world’s population continues to age.
Old-age support ratio The old-age support ratio, that is, the number of persons aged 15 to 64 years per person aged 65 years or over, is an indicator of demographic ageing and of the degree of dependency of older persons on potential workers. Since 1950, the world old-age support ratio has been continuously declining, which means that there are less “workers” to support every person aged 65 years or over. The ratio fell from 12 to 8 working-age persons for each older person between 1950 and 2012, and is projected to further decrease to 4 by 2050. In 2012, the old-age support ratio was much higher in the less developed regions (11 working-age persons per older person) than in
the more developed regions (4 working-age persons per older person). The old-age support ratio has important implications for the solvency of social security systems (pensions and public health), as well as for the demand of private transfers from the working-age population to older family members.
Proportion of the older population in the labour force Labour force participation among older persons varies by development region and gender. In 2012, the proportion of older persons who are economically active is much higher in the less developed regions (50 per cent among men and 22 per cent among women) than in the more developed regions (26 per cent among men and 15 per cent among women). Older persons in the less developed regions work until more advanced ages owing mainly to the limited coverage of social security schemes, as well as the relatively low value of the pensions received by those who are covered.
Statutory retirement age The statutory retirement age, which is defined as the minimum age at which people can qualify for full pension benefits, tends to be higher in developed countries than in developing countries. Also, in all countries of the world, the retirement age for women is the same as or lower than that for men—generally by five years. In most developed countries, men and women become eligible for full pension benefits at age 65 years or over, while in developing countries, they often become eligible between 55 and 60 years. The lower statutory retirement ages common in developing countries is a reflection of their more incipient social security systems, their lower life expectancies and their higher old-age support ratios.
United Nations • Department of Economic and Social Affairs • Population Division • www.unpopulation.org
Population Ageing and Development 2012
The designations employed in this publication, as well as the materials presented in it, do not imply the expression of any opinion whatsoever on the part of the Secretariat of the United Nations concerning the legal status of any country, or con-cerning the delimitation of its frontiers or bound-aries. The designations “more developed”, “less developed” and “least developed” for regions or countries, are intended for statistical convenience and do not necessarily express a judgement about the state reached by a particular country or area in the development process. The term “coun-try” as used in the text of this publication, also refers, as appropriate, to a territory or an area.
The population figures for 2012 and 2050 are from the medium-fertility variant of the United Nations population estimates and projections as revised in 2010.
For columns (1) to (10), (15) and (16), each regional figure includes the data for the region’s countries and areas that are not listed.
Two dots (..) indicate that data are not readily available.
a More developed regions comprise all regions of Europe and Northern America, as well as Australia, Japan and New Zealand.
b Less developed regions comprise all regions of Africa, Asia (excluding Japan) and Latin America and the Caribbean, as well as the regions of Melanesia, Micronesia and Polynesia.
c The least developed countries, as designated by the United Nations General Assembly in 2011, comprise 48 countries including 33 in Africa, 9 in Asia, 1 in Latin America and the Caribbean and 5 in Oceania. The least developed countries are included in the less developed regions.
d Data and maps in this publication refer to Sudan as it was constituted in 2010.
e For statistical purposes, China does not include Hong Kong and Macao, Special Administrative Regions (SAR) of China.
f On 1 July 1997, Hong Kong became a Special Administrative Region (SAR) of China.
g On 20 December 1999, Macao became a Special Administrative Region (SAR) of China.
h The former Yugoslav Republic of Macedonia.
1 Persons aged 80 years or over (the “oldest-old”) as a percentage of the population aged 60 years or over.
2 Letter indicates reference year: A: 2005 or later; B: 2004 or earlier.
3 Persons in the category “currently married” also include, where possible, those in consen-sual unions or “living together”.
4 Persons living alone or with spouse only.
5 Number of persons aged 15 to 64 years per person aged 65 years or over.
6 Proportion of persons aged 60 years or over who are economically active, as estimated and projected by the International Labour Organization (ILO).
7 Aged 55 years or over.
8 Age 56 for blue-collar workers, age 58 for white-collar workers, age 60 for managers, and age 63 for doctors and teachers in private higher education.
9 No mandatory old-age pension system.
10 For rural workers, age 60 for men and age 55 for women.
Note: all URL addresses refer to sites accessed 15 April 2012World Population Prospects: The 2010 Revision, CD-ROM Edition–Extended Dataset in Excel and ASCII formats (United Nations publication, Sales No. 11.XIII.7). Also availablefrom http://esa.un.org/unpd/wpp/index.htm; Living Arrangements of Older Persons Around the World (United Nations publication, Sales No. E.05.XIII.9); United Nations Demographic Yearbook (United Nations publication, vari-ous issues); national statistics; United States Census Bureau, International Programs, International Data Base. Available from http://www.census.gov/population/international/data/idb; International Labour Organization, International Labour Office database on labour statistics - LABORSTA internet. Economically Active Population, Estimates and Projections (6th Edition, October 2011). Available from http://laborsta.ilo.org; United States Social Security Administration, Social Security Programs Throughout the World. Available from http://www.ssa.gov/policy/docs/progdesc/ssptw (Africa: 2011, Asia and the Pacific: 2010, Europe: 2010, The Americas: 2011); National Bureau of Statistics of China. 2005 Mini-census of China, 20-per cent sample; Measure DHS, Demographic and Health Surveys, Survey Datasets. Available from http://www.measuredhs.com/Data; Minnesota Population Center, Integrated Public Use Microdata Series (IPUMS), International: Version 6.1. Available from https://international.ipums.org/international.
Notes Sources
Country or area
Population aged 60 years or over
Number (thousands)
Proportion of total population
(percentage)
Share of persons aged 80 years or
over 1 (percentage)
Sex ratio,2012 (men per 100
women)Life expectancy at age 60, 2010-2015
Proportion currently married, 60 years or over
(percentage)2,3
Proportion living independently,
60 years or over (percentage)
2,4 Old-age support ratio 5
Proportion in labour force, 60 years or over 6
(percentage)Statutory
retirement age
2012(1)
2050(2)
2012(3)
2050(4)
2012(5)
2050(6)
60+(7)
80+(8)
Men(9)
Women(10)
Men(11)
Women(12)
Men(13)
Women(14)
2012(15)
2050(16)
Men(17)
Women(18)
Men(19)
Women(20)
Romania 4 489 6 681 21 36 16 21 71 52 17 22 78 44 B 59 57 B 5 2 28 21 63.8 58
Russian Federation 26 498 39 338 19 31 16 19 53 32 15 21 78 36 B .. .. 6 3 18 9 60 55
Slovakia 1 005 1 827 18 35 16 20 67 43 17 22 87 43 B .. .. 6 2 13 3 62 62
Ukraine 9 476 11 563 21 32 16 19 54 35 15 20 79 37 B 64 58 A 5 2 27 22 60 55
Northern Europe 23 089 34 102 23 30 20 30 82 57 21 25 71 46 84 83 4 2 25 14 .. ..
Channel Islands 37 54 24 36 17 33 85 57 21 25 .. .. 4 2 17 8 .. ..
Denmark 1 334 1 756 24 30 18 31 86 58 21 24 69 48 A 99 100 A 4 2 22 11 65 65
Estonia 311 399 23 32 20 23 55 34 17 23 71 33 B 69 60 B 4 2 26 20 63 61
Finland 1 396 1 766 26 31 19 32 79 49 22 26 67 44 A 77 79 B 4 2 20 14 65 65
Iceland 57 124 17 29 20 29 91 69 23 26 68 52 A .. .. 5 3 47 33 67 67
Ireland 781 1 735 17 29 17 26 88 60 22 25 69 50 A 55 55 A 5 2 27 12 65 65
Latvia 519 651 23 34 19 22 54 32 17 22 71 35 A 63 52 B 4 2 20 12 62 62
Lithuania 701 904 21 32 19 24 55 36 16 22 75 39 B .. .. 4 2 19 9 62.5 60
Norway 1 077 1 759 22 29 21 31 86 57 22 26 69 47 A .. .. 4 2 31 21 67 67
Sweden 2 409 3 342 25 31 21 31 87 60 22 26 63 46 A 96 100 A 3 2 28 18 65 65
United Kingdom 14 436 21 568 23 30 21 30 84 60 22 25 76 47 B 84 83 A 4 3 25 14 65 60
Southern Europe 37 820 58 533 24 38 22 30 78 56 22 26 81 50 54 57 4 2 15 7 .. ..
Albania 443 1 010 14 34 13 22 91 65 19 24 89 56 B .. .. 7 2 34 13 65 60
Bosnia and Herzegovina 755 1 192 20 40 15 24 77 56 18 22 .. .. 5 2 14 5 .. ..
Croatia 1 057 1 331 24 34 18 25 70 43 18 23 80 41 B .. .. 4 2 16 8 65 60
Greece 2 823 4 188 25 36 21 28 81 68 22 25 86 54 B 53 54 B 4 2 17 8 65 60
Italy 16 436 22 725 27 38 23 34 78 53 22 26 81 48 B 57 62 B 3 2 12 4 65 60
Malta 95 152 23 37 15 25 82 56 21 24 66 37 B .. .. 5 2 13 3 61 60
Montenegro 117 186 18 31 14 21 77 65 18 21 82 43 B .. .. 5 3 .. ..
Portugal 2 606 3 792 24 40 20 29 76 57 21 25 84 53 B 61 58 B 4 2 30 19 65 65
Serbia 2 015 2 833 20 32 17 20 80 66 18 21 78 47 B .. .. 5 2 64 59
Slovenia 479 732 23 37 19 28 73 39 20 25 81 50 B 52 53 B 4 2 16 7 63 61
Spain 10 601 19 687 23 38 23 30 79 58 22 27 80 51 B 48 50 B 4 2 14 7 65 65
TFYR Macedoniah 362 639 17 34 13 20 80 56 18 21 82 60 B .. .. 6 2 20 7 .. ..
Western Europe 47 208 65 388 25 34 21 34 80 52 22 26 77 49 87 87 3 2 15 8 .. ..
Austria 1 991 3 075 24 36 21 33 77 49 22 26 75 42 B 69 72 B 4 2 14 6 65 60
Belgium 2 582 3 584 24 31 22 31 80 53 21 25 74 49 A 93 94 A 4 2 10 5 65 65
France 15 036 22 067 24 30 24 33 78 53 22 27 77 49 A 82 83 A 4 2 8 6 60 60
Germany 21 866 28 037 27 37 20 36 80 51 22 25 77 49 A 91 89 A 3 2 18 10 65 65
Luxembourg 100 209 19 30 20 28 83 52 21 25 77 45 B .. .. 5 3 12 5 65 65
Netherlands 3 803 5 470 23 32 18 33 85 54 22 25 75 50 A 90 94 A 4 2 23 10 65 65
Switzerland 1 812 2 919 23 37 21 35 81 54 23 27 79 50 B 83 86 B 4 2 30 16 65 64
LATIN AMERICA AND THE CARIBBEAN 63 064 187 869 10 25 15 22 82 65 20 23 74 42 30 27 9 3 49 22 .. ..
Caribbean 5 194 12 019 12 25 16 25 86 71 20 23 69 41 32 25 8 3 32 14 .. ..
Aruba 17 31 15 30 10 29 77 59 18 22 72 42 B .. .. 7 3 .. ..
Bahamas 39 125 11 28 11 22 75 45 18 23 69 34 B .. .. 10 3 41 25 65 65
Barbados 47 89 17 34 18 26 75 48 19 23 59 33 B .. .. 6 2 30 19 66 66
Cuba 2 013 3 881 18 39 17 34 90 74 22 24 68 44 B 30 22 B 5 2 20 5 65 60
Dominican Republic 942 2 875 9 22 17 22 96 89 21 24 71 38 A 28 19 A 10 4 44 13 60 60
Grenada 10 28 10 29 20 16 75 53 19 22 58 30 B .. .. 9 3 60 60
Guadeloupe 83 155 18 33 20 35 77 59 22 26 63 36 B .. .. 5 2 9 11 .. ..
Haiti 688 2 168 7 15 8 10 84 72 16 17 74 39 A 20 13 A 14 7 67 45 55 55
Jamaica 303 666 11 26 18 26 88 61 20 22 57 36 B 39 27 B 8 3 52 23 65 60
Martinique 85 140 21 37 20 36 75 55 22 26 62 38 B .. .. 4 2 9 8 .. ..
Netherlands Antilles 33 78 16 39 15 25 77 60 20 23 67 37 B .. .. 6 2 28 14 .. ..
Puerto Rico 691 1 152 18 31 19 28 76 61 21 26 72 44 A 56 52 A 5 2 15 8 66 66
Saint Lucia 17 57 10 28 18 20 77 65 18 23 65 40 A 34 28 B 10 3 41 26 63 63
St. Vincent and the Grenadines 11 27 10 24 14 17 87 64 17 20 63 34 B .. .. 10 4 34 17 60 60
Trinidad and Tobago 152 407 11 32 12 19 68 40 16 21 64 37 B .. .. 10 3 25 12 60 60
United States Virgin Islands 25 28 23 30 13 37 80 55 20 26 69 39 B .. .. 4 3 44 22 66 66
Central America 14 409 49 361 9 23 15 21 87 67 21 23 75 44 25 22 10 4 55 21 .. ..
Belize 19 98 6 18 16 17 91 78 21 23 76 52 B .. .. 16 5 52 16 65 65
Costa Rica 486 1 788 10 30 15 24 91 76 22 25 72 45 B 29 25 B 10 3 39 12 65 65
El Salvador 610 1 611 10 21 18 21 75 68 21 23 72 39 B .. .. 9 4 56 24 60 55
Guatemala 979 3 710 6 12 13 15 87 71 20 22 79 48 B 17 16 B 12 8 73 30 60 60
Honduras 509 2 203 6 17 14 16 91 72 20 23 74 44 B 15 12 A 14 6 66 23 65 60
Mexico 11 046 37 098 10 26 15 22 87 66 21 23 76 45 B 26 24 B 10 3 53 20 65 65
Nicaragua 393 1 663 7 21 15 18 86 69 20 23 71 36 B 13 9 B 13 4 56 22 60 60
Panama 366 1 191 10 23 13 21 93 77 21 23 68 43 B 29 20 B 9 4 51 18 62 57
South America 43 461 126 490 11 26 15 22 80 63 20 23 74 41 31 28 9 3 49 23 .. ..
Argentina 6 150 12 615 15 25 18 21 73 48 19 24 69 39 B 45 42 B 6 3 41 16 65 60
Bolivia (Plurinational State of) 746 2 486 7 15 10 14 82 66 17 19 70 46 B 30 27 B 12 6 69 49 58 58
Brazil 21 650 64 686 11 29 15 23 81 67 20 23 78 41 B 32 29 B 9 3 44 21 65 6010
Chile 2 409 6 088 14 30 16 28 80 57 21 25 72 43 B 32 27 B 7 3 46 17 65 60
Colombia 4 364 14 668 9 24 13 21 80 64 20 22 68 39 A 25 19 A 11 4 58 25 60 55
Ecuador 1 398 4 624 9 24 15 21 89 76 21 24 69 48 B 22 19 B 10 4 65 34 60 60
French Guiana 18 80 8 16 10 20 101 54 18 24 46 29 B .. .. 14 6 21 15 .. ..
Guyana 53 172 7 22 11 21 76 53 17 21 63 35 B .. .. 14 4 40 20 60 60
Paraguay 533 1 806 8 17 13 17 95 76 20 22 76 46 B 17 14 B 12 5 61 36 60 60
Peru 2 729 8 799 9 23 13 19 87 71 20 23 77 54 A 25 22 A 10 4 71 49 65 65
Suriname 51 146 10 24 12 19 79 59 17 20 56 32 B .. .. 10 4 18 7 .. ..
Uruguay 628 1 003 19 27 21 25 69 49 19 24 72 40 B .. .. 5 3 39 20 60 60
Venezuela (Bolivarian Republic of) 2 731 9 316 9 22 12 20 89 72 20 22 68 36 B 19 14 B 11 4 52 24 60 55
NORTHERN AMERICA 67 597 120 797 19 27 20 30 81 57 22 25 75 48 77 74 5 3 34 24 .. ..
Canada 7 215 13 524 21 31 20 31 85 61 22 26 76 50 B .. .. 5 2 30 18 65 65
United States of America 60 361 107 239 19 27 20 30 80 57 22 25 75 48 A 77 74 A 5 3 35 25 66 66
OCEANIA 5 928 13 006 16 24 18 27 88 67 22 25 73 50 .. .. 6 3 34 21 .. ..
Australia/New Zealand 5 326 10 697 19 29 20 30 89 67 23 26 73 50 .. .. 5 3 31 18 .. ..
Australia 4 481 9 073 20 29 20 29 89 67 23 26 72 50 B .. .. 5 3 30 17 65 64
New Zealand 845 1 623 19 29 19 31 88 67 22 25 76 53 B .. .. 5 3 39 26 65 65
Melanesia 494 1 998 5 12 7 11 84 58 14 18 75 50 .. .. 18 8 61 47 .. ..
Fiji 74 206 8 20 7 17 91 71 15 19 76 44 B 11 9 B 13 4 59 27 55 55
New Caledonia 32 89 12 26 14 24 92 60 19 24 66 39 B .. .. 8 3 18 7 .. ..
Papua New Guinea 345 1 499 5 11 7 10 81 51 14 17 75 52 B .. .. 20 9 66 56 55 55
Solomon Islands 29 139 5 12 7 10 92 85 16 18 74 51 B .. .. 18 8 51 25 50 50
Vanuatu 14 65 6 13 8 13 103 103 17 19 77 57 B .. .. 16 7 74 54 55 55
Micronesia 48 151 9 21 9 20 92 69 18 21 79 48 .. .. 12 4 44 14 .. ..
Guam 21 54 12 22 11 22 91 79 19 22 82 52 B .. .. 9 4 44 14 66 66
Micronesia (Federated States of) 7 20 6 15 11 12 89 70 17 18 71 37 B .. .. 16 7 60 60
Polynesia 61 161 9 19 12 21 89 63 17 21 72 50 .. .. 10 5 31 12 .. ..
French Polynesia 28 88 10 27 11 21 96 75 18 22 68 48 B .. .. 10 3 15 8 .. ..
Samoa 14 28 8 13 14 25 82 56 16 21 79 49 B .. .. 11 6 45 4 55 55
Tonga 8 18 8 13 17 19 76 52 16 21 78 55 B .. .. 10 6 65 36 .. ..
Percentage of the total population aged 60 years or over
2012 2050
Percentage aged 60 years or over
0 to 910 to 1920 to 2425 to 2930 or overNo data
Percentage aged 60 years or over
0 to 910 to 1920 to 2425 to 2930 or overNo data

The population pyramids for the less developed regions are transitioning from a triangular, wide-based shape (associated with a youthful age structure) to a more rectangular shape (associated with an older age structure). The age composition of the more developed regions is also in a transitional state, from the somewhat more rectangular shape of 1970, which also shows the demographic scars of the Second World War, to the even more rectangular structure in 2050.
The population of the world is changing dramatically in both size and age composition
Age distribution of the world’s population
Old-age support ratio (persons aged 15-64 per person aged 65 or over)
05
1015
2025
30+
OCEANIA
NORTHERN AMERICA
LATIN AMERICA AND THE CARIBBEAN
EUROPE
ASIA
AFRICA
Uni
ted
Ara
b E
mira
tes
Qat
arB
ahra
inS
ierr
a Le
one
Wes
tern
Sah
ara
Kuw
ait
May
otte
Gam
bia
Om
anM
ali
Bur
kina
Fas
oA
fgha
nist
anS
eneg
alS
audi
Ara
bia
Erit
rea
Nig
erM
aurit
ania
Equ
ator
ial G
uine
aA
ngol
aYe
men
Bur
undi
Ken
yaC
omor
osP
apua
New
Gui
nea
Rw
anda
Uga
nda
Occ
upie
d P
ales
tinia
n Te
rrito
ryLi
beria
Dem
. Rep
ublic
of t
he C
ongo
Som
alia
Bru
nei D
arus
sala
mC
had
Tajik
ista
nD
jibou
tiB
enin
Sol
omon
Isla
nds
Mad
agas
car
Tim
or-L
este
Iraq
Sw
azila
ndG
uine
a-B
issa
uM
ongo
liaTo
goVa
nuat
uTu
rkm
enis
tan
Zam
bia
Gui
nea
Eth
iopi
aP
hilip
pine
sU
nite
d R
epub
lic o
f Tan
zani
aM
alaw
iC
ambo
dia
Lao
Peo
ple'
s D
em. R
epub
licN
amib
iaM
icro
nesi
a (F
ed. S
tate
s of
)C
amer
oon
Moz
ambi
que
Nig
eria
Uzb
ekis
tan
Bel
ize
Sud
anS
ao T
ome
and
Prin
cipe
Kyrg
yzst
anB
otsw
ana
Con
goS
yria
n A
rab
Rep
ublic
Jord
anG
hana
Alg
eria
Côt
e d'
Ivoi
reN
epal
Guy
ana
Cen
tral A
fric
an R
epub
licLi
byan
Ara
b Ja
mah
iriya
Pak
ista
nB
angl
ades
hG
abon
Zim
babw
eLe
soth
oFr
ench
Gui
ana
Bhu
tan
Hon
dura
sIra
n (Is
lam
ic R
epub
lic o
f)H
aiti
Nic
arag
uaS
outh
Afr
ica
Mal
dive
sM
yanm
arM
alay
sia
Indi
aFi
jiG
uate
mal
aB
oliv
ia (P
lurin
atio
nal S
tate
of)
Egy
ptIn
done
sia
Mor
occo
Vie
t Nam
Par
agua
yA
zerb
aija
nC
ape
Verd
eS
amoa
Col
ombi
aTu
rkey
Vene
zuel
a (B
oliv
aria
n R
epub
lic o
f)C
hina
, Mac
ao S
AR
Fren
ch P
olyn
esia
Per
uC
osta
Ric
aK
azak
hsta
nS
aint
Luc
iaS
urin
ame
Tuni
sia
Mex
ico
St.
Vin
cent
and
the
Gre
nadi
nes
Ecu
ador
Dom
inic
an R
epub
licB
aham
asTr
inid
ad a
nd T
obag
oTo
nga
Mau
ritiu
sP
anam
aLe
bano
nG
rena
daB
razi
lG
uam
El S
alva
dor
Chi
naJa
mai
caN
ew C
aled
onia
Réu
nion
Sri
Lank
aTh
aila
ndS
inga
pore
Aru
baC
hile
Dem
. Peo
ple'
s R
ep. o
f Kor
eaA
lban
iaR
epub
lic o
f Mol
dova
Arm
enia
Net
herla
nds
Ant
illes
Rep
ublic
of K
orea
Bar
bado
sA
rgen
tina
Cyp
rus
TFY
R M
aced
onia
Slo
vaki
aIs
rael
Chi
na, H
ong
Kon
g S
AR
Rus
sian
Fed
erat
ion
Irela
ndC
uba
Icel
and
Mon
tene
gro
Bel
arus
Pol
and
Gua
delo
upe
Pue
rto
Ric
oB
osni
a an
d H
erze
govi
naU
nite
d S
tate
s of
Am
eric
aLu
xem
bour
gN
ew Z
eala
ndG
eorg
iaA
ustra
liaS
erbi
aC
anad
aM
alta
Rom
ania
Uru
guay
Ukr
aine
Cze
ch R
epub
licM
artin
ique
Nor
way
Lith
uani
aN
ethe
rland
sU
nite
d S
tate
s V
irgin
Isla
nds
Slo
veni
aH
unga
ryC
hann
el Is
land
sS
pain
Sw
itzer
land
Cro
atia
Uni
ted
Kin
gdom
Est
onia
Latv
iaB
ulga
riaD
enm
ark
Aus
tria
Fran
ceB
elgi
umP
ortu
gal
Finl
and
Gre
ece
Sw
eden
Ger
man
yIta
lyJa
pan
Percentage of population aged 60 or over living independently (latest available data)
Living independently, that is, either alone or only with one’s spouse is rare among older people in developing countries, but is the dominant living arrangement in developed countries. Older persons who live independently represent almost three quarters of all older persons in the more developed regions compared to only just over 10 per cent in
the least developed countries and just over a quarter in the less developed regions. At the world level, 40 per cent of the older population live alone or only with their spouse. Independent older men live predominantly with a spouse, while independent older women more commonly live alone.
Historically, the population of older persons in the world was small compared to the population of younger adults or children. As a consequence of population ageing, by 2070, the group of older persons is projected to surpass the three younger 20-year age groups: children
and adolescents under 20 years, young adults from 20 to 39 years, and middle-aged adults from 40 to 59 years. Moreover, older persons aged 60 years or over will outnumber children (persons under the age of 15) by 2050. Older persons already outnumber children in the more developed regions.
Men
0
10
20
30
40
50
60
70
80
16
58
33
37
More developed
regions
11
29
19
22
World
9
20
10
16
Less developed countries
3
98
5
Least developedcountries
Living alone
Living with spouse,no children
Women
Living alone
Living with spouse,no children
Millions B. More developed regions
0
50
100
150
200
250
300
350
400
450
500
1950 1975 2000 2025 2050 2075 2100
A. World
0
500
1 000
1 500
2 000
2 500
3 000
1950 1975 2000 2025 2050 2075 2100 1950 1975 2000 2025 2050 2075 2100
C. Less developed regions
0
500
1 000
1 500
2 000
2 500
3 000
0-19 years
20-39 years
40-59 years
60 years or over
Population by broad age groups
1970
1970
10 8 6 4 2 0 2 4 6 8 10
0-4
5-9
10-14
15-19
20-24
25-29
30-34
35-39
40-44
45-49
50-54
55-59
60-64
65-69
70-74
75-79
80-84 60+
15-59
<15
85-89
90-94
95-99
100+
A. Less developed regions
B. More developed regions
Males Females
10 8 6 4 2 0 2 4 6 8 10
0-4
5-9
10-14
15-19
20-24
25-29
30-34
35-39
40-44
45-49
50-54
55-59
60-64
65-69
70-74
75-79
80-84
85-89
90-94
95-99
100+
10 8 6 4 2 0 2 4 6 8 10
0-4
5-9
10-14
15-19
20-24
25-29
30-34
35-39
40-44
45-49
50-54
55-59
60-64
65-69
70-74
75-79
80-84
85-89
90-94
95-99
100+
2010
10 8 6 4 2 0 2 4 6 8 10
0-4
5-9
10-14
15-19
20-24
25-29
30-34
35-39
40-44
45-49
50-54
55-59
60-64
65-69
70-74
75-79
80-84
85-89
90-94
95-99
100+
2050
2050
10 8 6 4 2 0 2 4 6 8 10
0-4
5-9
10-14
15-19
20-24
25-29
30-34
35-39
40-44
45-49
50-54
55-59
60-64
65-69
70-74
75-79
80-84
85-89
90-94
95-99
100+
2010
10 8 6 4 2 0 2 4 6 8 10
0-4
5-9
10-14
15-19
20-24
25-29
30-34
35-39
40-44
45-49
50-54
55-59
60-64
65-69
70-74
75-79
80-84
85-89
90-94
95-99
100+
60+
15-59
<15
60+
15-59
<15
60+
15-59
<15
60+
15-59
<15
60+
15-59
<15
Cohort sizes will become balanced before the end of the twenty-first century
Older persons are more likely to live independently in developed countries
PoPulation ageing and develoPment 2012
UNITED NATIONSasdf
Germany, Italy, Japan and Sweden only have 3 working-age individuals for each older person. By contrast, countries such as Bahrain, Qatar and the United Arab Emirates have over 30 persons of working age per older person. European countries tend to cluster at the lower end of support ratios, while countries from Western Asia, South-Central Asia and sub-Saharan Africa tend to be at the higher end. Most countries in the world are in an intermediate transitional phase, with old-age support ratios between 5 and 20 persons of working-age per older person.
Some societies are facing extremely low old-age support ratios
USD 10
ISBN 978-92-1-151494-0
Copyright © United Nations, 2012All rights reserved
ST/ESA/SER.A/323Sales No. E.12.XIII.6
Enquiries should be directed to:Director, Population DivisionDepartment of Economic and Social AffairsUnited Nations, New York, NY 10017, USA
Fax number: 1 212 963 2147
Printed at the United Nations, New York12-40658—September 2012—3,500