united statesd18rn0p25nwr6d.cloudfront.net/cik-0001692063/487... · note 12 segment reporting 19...
TRANSCRIPT

Table of Contents
UNITED STATES
SECURITIES AND EXCHANGE COMMISSIONWashington, D.C. 20549
_____________________________________________________________________________
FORM 10-Q_____________________________________________________________________________
☒ QUARTERLY REPORT PURSUANT TO SECTION 13 OR 15(d) OF THE SECURITIES EXCHANGE ACT OF 1934For the quarterly period ended September 30, 2019
OR
☐ TRANSITION REPORT PURSUANT TO SECTION 13 OR 15(d) OF THE SECURITIES EXCHANGE ACT OF 1934
For the transition period from to Commission File Number: 001-38054
_____________________________________________________________________________
Schneider National, Inc.(Exact Name of Registrant as Specified in Its Charter)
_____________________________________________________________________________
Wisconsin 39-1258315(State or Other Jurisdiction of
Incorporation or Organization) (I.R.S. Employer
Identification Number)
3101 South Packerland Drive
Green Bay Wisconsin 54313(Address of Registrant’s Principal Executive Offices) (Zip Code)
(920) 592-2000(Registrant’s Telephone Number, Including Area Code)
Securities registered pursuant to Section 12(b) of the Exchange Act:
Title of each class Trading Symbol Name of each exchange on which registered
Class B common stock, no par value SNDR New York Stock Exchange
Indicate by check mark whether the registrant (1) has filed all reports required to be filed by Section 13 or 15(d) of the Securities Exchange Act of 1934 during the preceding 12months (or for such shorter period that the registrant was required to file such reports), and (2) has been subject to such filing requirements for the past 90 days.
Yes ☒ No ☐
Indicate by check mark whether the registrant has submitted electronically every Interactive Data File required to be submitted pursuant to Rule 405 of Regulation S-T duringthe preceding 12 months (or for such shorter period that the registrant was required to submit such files).
Yes ☒ No ☐
Indicate by check mark whether the registrant is a large accelerated filer, an accelerated filer, a non-accelerated filer, a smaller reporting company, or an emerging growthcompany. See the definitions of “large accelerated filer,” “accelerated filer,” “smaller reporting company,” and “emerging growth company” in Rule 12b-2 of the Exchange Act.
Large accelerated filer ☒ Accelerated filer ☐
Non-accelerated filer ☐ (Do not check if a smaller reporting company) Smaller reporting company ☐
Emerging growth company ☐
If an emerging growth company, indicate by check mark if the registrant has elected not to use the extended transition period for complying with any new or revised financial
accounting standards provided pursuant to Section 13(a) of the Exchange Act. ☐
Indicate by check mark whether the registrant is a shell company (as defined in Rule 12b-2 of the Exchange Act).
Yes ☐ No ☒
As of October 25, 2019, the registrant had 83,029,500 shares of Class A Common Stock, no par value, outstanding and 94,088,025 shares of Class B Common Stock, no parvalue, outstanding.

Table of Contents

Table of Contents
SCHNEIDER NATIONAL, INC.QUARTERLY REPORT ON FORM 10-QFor the Quarter Ended September 30, 2019
TABLE OF CONTENTS
Page
Cautionary Note Regarding Forward-Looking Statements 1PART I. FINANCIAL INFORMATION
ITEM 1. Financial Statements 3 Consolidated Statements of Comprehensive Income (Unaudited) 3 Consolidated Balance Sheets (Unaudited) 4 Consolidated Statements of Cash Flows (Unaudited) 5 Consolidated Statements of Shareholders' Equity (Unaudited) 6 Notes to Consolidated Financial Statements (Unaudited) 8 Page
Note 1 General 8 Note 2 Leases 8 Note 3 Revenue Recognition 13 Note 4 Fair Value 14 Note 5 Investments 15 Note 6 Goodwill and Other Intangible Assets 16 Note 7 Debt and Credit Facilities 17 Note 8 Income Taxes 17 Note 9 Common Equity 18 Note 10 Share-Based Compensation 18 Note 11 Commitments and Contingencies 18 Note 12 Segment Reporting 19 Note 13 Restructuring Charges 21 ITEM 2. Management’s Discussion and Analysis of Financial Condition and Results of Operations 22ITEM 3. Quantitative and Qualitative Disclosures about Market Risk 37ITEM 4. Controls and Procedures 37
PART II. OTHER INFORMATIONITEM 1. Legal Proceedings 38ITEM 1A. Risk Factors 38ITEM 2. Unregistered Sales of Equity Securities and Use of Proceeds 38ITEM 3. Defaults Upon Senior Securities 38ITEM 4. Mine Safety Disclosures 38ITEM 5. Other Information 38ITEM 6. Exhibits 39Signature 40
i

Table of Contents
GLOSSARY OF TERMS
3PL Provider of outsourced logistics services. In logistics and supply chain management, it means a company’s use of third-party businesses, the3PL(s), to outsource elements of the company’s distribution, fulfillment, and supply chain management services.
ASC Accounting Standards CodificationASU Accounting Standards UpdateCODM Chief Operating Decision MakerFASB Financial Accounting Standards BoardFTFM First to Final Mile operating segmentGAAP United States Generally Accepted Accounting PrinciplesLIBOR London InterBank Offered RatePSI Platform Science, Inc.SEC United States Securities and Exchange CommissionVTL Van Truckload operating segmentWSL Watkins and Shepard Trucking, Inc. and Lodeso, Inc. These businesses were acquired simultaneously in June 2016.
ii

Table of Contents
CAUTIONARY NOTE REGARDING FORWARD-LOOKING STATEMENTS
This report contains forward-looking statements, within the meaning of the safe harbor provisions of the United States Private Securities Litigation Reform Act of1995. These forward-looking statements reflect the Company's current expectations, beliefs, plans, or forecasts with respect to, among other things, future eventsand financial performance and trends in the business and industry. The words “may,” “will,” “could,” “should,” “would,” “anticipate,” “estimate,” “expect,”“project,” “intend,” “plan,” “believe,” “prospects,” “potential,” “budget,” “forecast,” “continue,” “predict,” “seek,” “objective,” “goal,” “guidance,” “outlook,”“effort,” “target,” and similar words, expressions, terms, and phrases among others, generally identify forward-looking statements, which speak only as of the datethe statements were made. Forward-looking statements involve estimates, expectations, projections, goals, forecasts, assumptions, risks, and uncertainties. Readersare cautioned that a forward-looking statement is not a guarantee of future performance and that actual results could differ materially from those contained in theforward-looking statement.
Risks, uncertainties, and other factors that could cause or contribute to actual results differing materially from those expressed or implied by the forward-lookingstatements include, but are not limited to, the following:
• Economic and business risks inherent in the truckload and transportation industry, including competitive pressures pertaining to pricing, capacity, andservice;
• Our ability to manage and implement effectively our growth and diversification strategies and cost saving initiatives;
• Our dependence on our reputation and the Schneider brand and the potential for adverse publicity, damage to our reputation, and the loss of brand equity;
• Risks related to demand for our service offerings;
• Risks associated with the loss of a significant customer or customers;
• Capital investments that fail to match customer demand or for which we cannot obtain adequate funding;
• Fluctuations in the price or availability of fuel, the volume and terms of diesel fuel purchase commitments, and our ability to recover fuel costs throughour fuel surcharge programs;
• Our ability to attract and retain qualified drivers and owner-operators;
• Our reliance on owner-operators to provide a portion of our truck fleet;
• Our dependence on railroads in the operation of our intermodal business;
• Service instability from third-party capacity providers used by our logistics brokerage business;
• Changes in the outsourcing practices of our third-party logistics customers;
• Difficulty in obtaining material, equipment, goods, and services from our vendors and suppliers;
• Variability in insurance and claims expenses and the risks of insuring claims through our captive insurance company;
• The impact of laws and regulations that apply to our business, including those that relate to the environment, taxes, employees, owner-operators, and ourcaptive insurance company; changes to those laws and regulations; and the increased costs of compliance with existing or future federal, state, and localregulations;
• Political, economic, and other risks from cross-border operations and operations in multiple countries;
• Risks associated with financial, credit, and equity markets, including our ability to service indebtedness and fund capital expenditures and strategicinitiatives;
• Negative seasonal patterns generally experienced in the trucking industry during traditionally slower shipping periods and winter months;
• Risks associated with severe weather and similar events;
• Significant systems disruptions, including those caused by cybersecurity events;
• The potential that we will not successfully identify, negotiate, consummate, or integrate acquisitions;
• Exposure to claims and lawsuits in the ordinary course of business;
• Our ability to adapt to new technologies and new participants in the truckload and transportation industry; and
1

Table of Contents
• Those risks and uncertainties discussed in Part I, Item 1A, “Risk Factors,” of our most recently filed Annual Report on Form 10-K, as such may beamended or supplemented in Part II, Item 1A, “Risk Factors,” of this report or other Quarterly Reports on Form 10-Q filed after such Annual Report onForm 10-K, as well as those discussed in our consolidated financial statements, related notes, and the other information appearing elsewhere in this reportand our other filings with the SEC.
The Company disclaims any intention and undertakes no obligation, to update or revise any of its forward-looking statements after the date of this report to reflectactual results or future events or circumstances whether as a result of new information, future events or otherwise, except as required by law. Given these risks anduncertainties, readers are cautioned not to place undue reliance on such forward-looking statements.
2

Table of Contents
PART I. FINANCIAL INFORMATION
Item 1. Financial Statements
SCHNEIDER NATIONAL, INC.CONSOLIDATED STATEMENTS OF COMPREHENSIVE INCOME (Unaudited)(in millions, except per share data)
Three Months Ended
September 30, Nine Months Ended
September 30,
2019 2018 2019 2018Operating revenues $ 1,183.9 $ 1,280.1 $ 3,590.7 $ 3,655.4Operating expenses:
Purchased transportation 511.7 521.1 1,488.8 1,431.8Salaries, wages, and benefits 257.3 317.2 856.6 943.2Fuel and fuel taxes 70.6 87.4 221.6 260.3Depreciation and amortization 74.1 73.3 222.4 216.9Operating supplies and expenses 139.1 123.5 418.3 364.2Insurance and related expenses 24.4 24.1 78.0 69.4Other general expenses 27.3 35.6 90.3 112.4Goodwill impairment charge — — 34.6 —Restructuring charges 50.4 — 50.4 —
Total operating expenses 1,154.9 1,182.2 3,461.0 3,398.2Income from operations 29.0 97.9 129.7 257.2Other expenses (income):
Interest income (2.0) (1.5) (6.6) (2.9)Interest expense 3.8 4.2 13.1 13.0Other expenses (income)—net 0.5 (0.1) 1.2 (1.0)
Total other expense 2.3 2.6 7.7 9.1Income before income taxes 26.7 95.3 122.0 248.1Provision for income taxes 7.0 24.6 30.9 64.0Net income 19.7 70.7 91.1 184.1Other comprehensive income (loss):
Foreign currency translation adjustments (0.3) (0.9) (0.2) (0.8)Unrealized income (loss) on marketable securities—net of tax — — 0.7 (0.3)
Total other comprehensive income (loss) (0.3) (0.9) 0.5 (1.1)Comprehensive income $ 19.4 $ 69.8 $ 91.6 $ 183.0
Weighted average common shares outstanding 177.1 177.0 177.1 177.0Basic earnings per share $ 0.11 $ 0.40 $ 0.51 $ 1.04
Weighted average diluted shares outstanding 177.3 177.2 177.3 177.2Diluted earnings per share $ 0.11 $ 0.40 $ 0.51 $ 1.04
See notes to consolidated financial statements (unaudited).
3

Table of Contents
SCHNEIDER NATIONAL, INC.CONSOLIDATED BALANCE SHEETS (Unaudited)(in millions, except share data)
September 30, December 31, 2019 2018Assets Current Assets:
Cash and cash equivalents $ 437.1 $ 378.7Marketable securities 47.4 51.3Trade accounts receivable—net of allowance of $8.5 million and $6.8 million, respectively 498.8 593.1Other receivables 160.2 31.8Current portion of lease receivables—net of allowance of $0.6 million and $0.5 million, respectively 125.5 129.1Inventories 57.7 60.8Prepaid expenses and other current assets 200.9 79.5
Total current assets 1,527.6 1,324.3Noncurrent Assets:
Property and equipment: Transportation equipment 2,814.1 2,900.2Land, buildings, and improvements 189.5 177.2Other property and equipment 161.9 157.6
Total property and equipment 3,165.5 3,235.0Accumulated depreciation 1,270.7 1,312.8
Net property and equipment 1,894.8 1,922.2Lease receivables 126.3 133.2Capitalized software and other noncurrent assets 155.0 82.6Goodwill 127.3 162.2
Total noncurrent assets 2,303.4 2,300.2Total Assets $ 3,831.0 $ 3,624.5
Liabilities and Shareholders' Equity Current Liabilities:
Trade accounts payable $ 239.8 $ 226.0Accrued salaries, wages, and benefits 60.2 94.8Claims accruals—current 192.0 58.3Current maturities of debt and finance lease obligations 101.5 51.7Dividends payable 10.9 10.6Other current liabilities 94.0 81.2
Total current liabilities 698.4 522.6Noncurrent Liabilities:
Long-term debt and finance lease obligations 304.6 359.6Claims accruals—noncurrent 103.6 113.3Deferred income taxes 446.5 450.6Other noncurrent liabilities 85.7 46.1
Total noncurrent liabilities 940.4 969.6Total Liabilities 1,638.8 1,492.2Commitments and Contingencies (Note 11) Shareholders' Equity:
Class A common shares, no par value, 250,000,000 shares authorized, 83,029,500 shares issued and outstanding — —Class B common shares, no par value, 750,000,000 shares authorized, 94,834,653 and 94,593,588 shares issued, and94,085,005 and 93,969,268 shares outstanding, respectively — —Additional paid-in capital 1,544.5 1,544.0Retained earnings 648.2 589.3Accumulated other comprehensive loss (0.5) (1.0)
Total Shareholders' Equity 2,192.2 2,132.3

Total Liabilities and Shareholders' Equity $ 3,831.0 $ 3,624.5See notes to consolidated financial statements (unaudited).
4

Table of Contents
SCHNEIDER NATIONAL, INC.CONSOLIDATED STATEMENTS OF CASH FLOWS (Unaudited)(in millions)
Nine Months Ended
September 30,
2019 2018Operating Activities:
Net income $ 91.1 $ 184.1Adjustments to reconcile net income to net cash provided by operating activities:
Depreciation and amortization 222.4 216.9Goodwill impairment 34.6 —Gains on sales of property and equipment (2.6) (4.5)Impairment on assets held for sale 11.8 0.3Proceeds from lease receipts 59.6 —Deferred income taxes (4.3) 34.4Long-term incentive and share-based compensation expense 3.4 15.3Non-cash restructuring charges 43.3 —Other noncash items 2.9 (3.1)Changes in operating assets and liabilities:
Receivables 82.2 (67.3)Other assets (31.1) (15.9)Payables 0.3 35.6Claims reserves and other receivables—net (1.1) 13.7Other liabilities (42.2) 0.6
Net cash provided by operating activities 470.3 410.1Investing Activities:
Purchases of transportation equipment (308.6) (268.1)Purchases of other property and equipment (42.8) (22.3)Proceeds from sale of property and equipment 38.8 74.6Proceeds from lease receipts — 56.2Proceeds from sale of off-lease inventory 15.0 —Purchases of lease equipment (62.7) (58.4)Sales of marketable securities 13.2 3.9Purchases of marketable securities (8.5) (8.0)
Net cash used in investing activities (355.6) (222.1)Financing Activities:
Payments of debt and finance lease obligations (5.7) (17.3) Payments of deferred consideration related to acquisition (18.7) (19.3) Dividends paid (31.9) (30.1)
Net cash used in financing activities (56.3) (66.7)Net increase in cash and cash equivalents 58.4 121.3Cash and Cash Equivalents:
Beginning of period 378.7 238.5End of period $ 437.1 $ 359.8
Additional Cash Flow Information: Noncash investing and financing activity:
Equipment purchases in accounts payable $ 15.5 $ 36.5Dividends declared but not yet paid 10.9 10.7Ownership interest in Platform Science, Inc. — 2.5
Cash paid during the period for: Interest 12.4 13.2Income taxes—net of refunds 42.6 25.5
See notes to consolidated financial statements (unaudited).
5


Table of Contents
SCHNEIDER NATIONAL, INC.CONSOLIDATED STATEMENTS OF SHAREHOLDERS' EQUITY (Unaudited)(in millions, except per share data)
Common Stock
Additional Paid-In Capital
RetainedEarnings
Accumulated OtherComprehensive Loss Total
Balance—December 31, 2017 $ — $ 1,534.6 $ 355.6 $ — $ 1,890.2 Net income — — 47.6 — 47.6 Other comprehensive loss — — — (0.6) (0.6) Share-based compensation expense — 2.0 — — 2.0
Dividends declared at $0.06 per share of Class A and Class Bcommon shares — — (10.7) — (10.7)
Share issuances — 0.2 — — 0.2 Shares withheld for employee taxes — (1.8) — — (1.8) Cumulative-effect adjustment of ASU 2014-09 adoption — — 7.3 — 7.3 Other — 0.2 — — 0.2 Balance—March 31, 2018 — 1,535.2 399.8 (0.6) 1,934.4 Net income — — 65.8 — 65.8 Other comprehensive gain — — — 0.4 0.4 Share-based compensation expense — 2.1 — — 2.1
Dividends declared at $0.06 per share of Class A and Class Bcommon shares — — (10.5) — (10.5)
Share issuances — 0.3 — — 0.3 Shares withheld for employee taxes — (0.1) — — (0.1) Exercise of employee stock options — 0.2 — — 0.2 Other — (0.1) — — (0.1) Balance—June 30, 2018 — 1,537.6 455.1 (0.2) 1,992.5 Net income — — 70.7 — 70.7 Other comprehensive loss — — — (0.9) (0.9) Share-based compensation expense — 2.1 — — 2.1
Dividends declared at $0.06 per share of Class A and Class Bcommon shares — — (10.8) — (10.8)
Shares withheld for employee taxes — (0.4) — — (0.4) Balance—September 30, 2018 $ — $ 1,539.3 $ 515.0 $ (1.1) $ 2,053.2
6

Table of Contents
SCHNEIDER NATIONAL, INC.CONSOLIDATED STATEMENTS OF SHAREHOLDERS' EQUITY (Unaudited)(in millions, except per share data)
Common Stock
Additional Paid-In Capital
RetainedEarnings
Accumulated OtherComprehensive Loss Total
Balance—December 31, 2018 $ — $ 1,544.0 $ 589.3 $ (1.0) $ 2,132.3 Net income — — 36.9 — 36.9 Other comprehensive gain — — — 0.7 0.7 Share-based compensation expense — 2.0 — — 2.0
Dividends declared at $0.06 per share of Class A and Class Bcommon shares — — (10.7) — (10.7)
Shares withheld for employee taxes — (1.2) — — (1.2) Balance—March 31, 2019 — 1,544.8 615.5 (0.3) 2,160.0 Net income — — 34.5 — 34.5 Other comprehensive gain — — — 0.1 0.1 Share-based compensation expense — 1.6 — — 1.6
Dividends declared at $0.06 per share of Class A and Class Bcommon shares — — (11.0) — (11.0)
Share issuances — 0.2 — — 0.2 Balance—June 30, 2019 — 1,546.6 639.0 (0.2) 2,185.4 Net income — — 19.7 — 19.7 Other comprehensive loss — — — (0.3) (0.3) Share-based compensation expense — (2.2) — — (2.2)
Dividends declared at $0.06 per share of Class A and Class Bcommon shares — — (10.5) — (10.5)
Share issuances — 0.1 — — 0.1 Balance—September 30, 2019 $ — $ 1,544.5 $ 648.2 $ (0.5) $ 2,192.2
See notes to consolidated financial statements (unaudited).
7
Table of Contents
SCHNEIDER NATIONAL, INC.NOTES TO CONSOLIDATED FINANCIAL STATEMENTS (Unaudited)September 30, 2019
1. GENERAL
Description of Business
In this report, when we refer to “the Company,” “us,” “we,” “our,” “ours,” or “Schneider,” we are referring to Schneider National, Inc. and its subsidiaries. We area leading transportation services organization headquartered in Green Bay, Wisconsin. We provide a broad portfolio of premier truckload, intermodal, and logisticssolutions and operate one of the largest trucking fleets in North America.
Basis of Presentation
The accompanying unaudited interim consolidated financial statements have been prepared in accordance with GAAP and the rules and regulations of the SECapplicable to quarterly reports on Form 10-Q. Therefore, these consolidated financial statements and footnotes do not include all disclosures required by GAAP forannual financial statements. These consolidated financial statements should be read in conjunction with the consolidated financial statements and related notesincluded in our Annual Report on Form 10-K for the year ended December 31, 2018. Financial results for an interim period are not necessarily indicative of theresults for a full year.
All intercompany transactions have been eliminated in consolidation.
In the opinion of management, these statements reflect all adjustments (consisting only of normal recurring adjustments) necessary for the fair presentation of ourfinancial results for the interim periods presented.
Accounting Standards Issued but Not Yet Adopted
In August 2018, the FASB issued ASU 2018-15, Customer's Accounting for Implementation Costs Incurred in a Cloud Computing Arrangement That Is a ServiceContract, which aligns the capitalization requirements for implementation costs incurred in a hosting arrangement that is a service contract with the existingcapitalization requirements for implementation costs incurred to develop or obtain internal-use software. ASU 2018-15 is effective for us as of January 1, 2020with early adoption permitted. We are currently evaluating the impact the adoption of this ASU will have on our consolidated financial statements and do notbelieve the impact will be material. We expect to adopt this standard on a prospective basis.
In August 2018, the FASB issued ASU 2018-13, Fair Value Measurement - Disclosure Requirements, which removes, modifies, and adds certain disclosurerequirements for fair value measurements. These changes include removing the disclosure requirements related to the amount of and reasons for transfers betweenLevel 1 and Level 2 of the fair value hierarchy and adding disclosure requirements about the range and weighted-average of significant unobservable inputs used todevelop Level 3 fair value measurements. Additionally, the amendments remove the phrase “at a minimum” from the codification clarifying that materiality shouldbe considered when evaluating disclosure requirements. ASU 2018-13 is effective for us January 1, 2020 with early adoption permitted. We do not believe theadoption of this ASU will have a material impact on our disclosures and plan to early adopt this standard during the fourth quarter of 2019.
In June 2016, the FASB issued ASU 2016-13, Financial Instruments - Credit Losses: Measurement of Credit Losses on Financial Instruments, which requirescompanies to use a forward-looking, expected loss model to estimate credit losses on various types of financial assets and net investments in leases. It also requiresadditional disclosures related to credit quality of trade and other receivables, including information related to management’s estimate of credit allowances. InNovember 2018, this was further updated with the issuance of ASU 2018-19, which excludes receivables from operating leases from the scope. ASU 2016-13 iseffective for us January 1, 2020. We expect the standard will have an impact on our available-for-sale debt securities, net investment in leases, contract assets, tradeaccounts receivable, and reinsurance receivables. Based on our initial assessment, we do not believe the standard will have a material impact on our consolidatedfinancial statements, however we are still assessing the financial impacts.
2. LEASES
We adopted ASU 2016-02, Leases, which is codified in ASC 842, as of January 1, 2019 using the optional transition method. The FASB’s authoritative guidanceprovided companies with the option to apply this ASU to new and existing leases within the scope of the guidance as of the beginning of the period of adoption.We elected this transition method of applying the new lease
8

Table of Contents
standard and have recognized right-of-use assets and lease liabilities as of January 1, 2019. Prior period amounts were not adjusted and will continue to be reportedunder the accounting standards in effect for those periods.
Adoption of the new standard resulted in the initial recording of right-of-use lease assets and related lease liabilities of $80.6 million and $85.2 million,respectively. As of September 30, 2019, right-of-use lease assets and related lease liabilities were $73.5 million and $80.9 million, respectively. Operating leaseright-of-use assets and operating lease liabilities are recognized based on the present value of the future lease payments over the term. Schneider's incrementalborrowing rates are used as the discount rates for leases and are determined based on U. S. Treasury rates plus an applicable margin to arrive at all-in rates.Schneider uses multiple discount rates based on lease terms and other economic factors. The operating lease right-of-use asset also includes accrued lease expenseresulting from the straight-line accounting under prior accounting methods, which is now being amortized over the remaining life of the lease.
In addition, we elected the package of practical expedients provided under the guidance. The practical expedient package applies to leases that commenced prior toadoption of the new standard and permits companies not to reassess whether existing or expired contracts are or contain a lease, the lease classification, and anyinitial direct costs for any existing leases. We also elected the practical expedient related to land easements, allowing us to carry forward the accounting treatmentof our existing agreements for land easements, none of which were material as of January 1, 2019.
As lessee
We lease real estate, transportation equipment, and office equipment under operating and finance leases. Our real estate operating leases include operating centers,distribution warehouses, offices, and drop yards. Our finance leases relate almost entirely to transportation equipment. A majority of our leases include an option toextend the lease, and a small number of our leases include an option to early terminate the lease, which may include a termination payment. If we are reasonablycertain to exercise an option to extend a lease, the extension period is included as part of the right-of-use asset and lease liability.
For our real estate leases, we have elected to apply the recognition requirement to leases of twelve months or less, therefore, an operating lease right-of-use assetand liability will be recognized for all these leases. For our equipment leases, we have elected to not apply the recognition requirements to leases of twelve monthsor less. These leases will be expensed on a straight-line basis and no operating lease right-of-use asset or liability will be recorded.
We have also elected to not separate the different components within the contract for our leases; therefore, all fixed costs associated with the lease are included inthe right-of-use asset and the operating lease liability. This often relates to the requirement for us to pay a proportionate share of real estate taxes, insurance,common area maintenance, and other operating costs in addition to a base or fixed rent. Some of our leases have variable payment amounts, and the variableportions of those payments are excluded from the right-of-use asset and the lease liability.
At the inception of our contracts we determine if the contract is or contains a lease. A contract is or contains a lease if it conveys the right to control the use of anidentified asset for a period of time in exchange for consideration.
A small number of our leased real estate assets contains subleases. The lease income related to subleases is shown in the lease cost table below.
Certain equipment leases contain residual value guarantees. These are guarantees made to the lessor that the value of the underlying asset returned to the lessor atthe end of the lease will be at least a specified amount.
None of our leases contain restrictions or covenants that restrict us from incurring other financial obligations.
9

Table of Contents
The following table presents our net lease costs for the three and nine months ended September 30, 2019:
Financial Statement Classification
Three Months Ended
September 30, Nine Months Ended
September 30,
(in millions) 2019 2019
Operating lease cost Operating lease cost Operating supplies and expenses $ 8.7 $ 26.5Short-term lease cost (1) Operating supplies and expenses 2.0 5.5
Finance lease cost Amortization of right-of-use assets Depreciation and amortization 0.9 2.5Interest on lease liabilities Interest expense — 0.2
Variable lease cost Operating supplies and expenses 0.7 2.1Sublease income Operating revenues (1.5) (4.1)
Total net lease cost $ 10.8 $ 32.7(1) Includes short-term lease costs for leases twelve months or less, including those with a duration of one month or less.
As of September 30, 2019, remaining lease terms and discount rates under operating and finance leases were as follows:
September 30, 2019
Weighted-average remaining lease term Operating leases 4.4 yearsFinance leases 0.3 years
Weighted-average discount rate Operating leases 4.2%Finance leases 4.7%
Other information related to our leases is as follows:
Nine Months Ended
September 30,
(in millions) 2019
Cash paid for amounts included in the measurement of lease liabilities Operating cash flows from operating leases $ 26.7Operating cash flows from finance leases 0.2Financing cash flows from finance leases 2.0
Right-of-use assets obtained in exchange for new lease liabilities Operating leases $ 20.6Finance leases —
Operating lease right-of-use assets, current operating lease liabilities, and noncurrent operating lease liabilities are included in capitalized software and othernoncurrent assets, other current liabilities, and other noncurrent liabilities, respectively, in the consolidated balance sheet as of September 30, 2019.
10

Table of Contents
At September 30, 2019, future lease payments under operating and finance leases were as follows:
(in millions) Operating Leases Finance Leases
Remaining 2019 $ 8.5 $ 4.92020 27.2 0.42021 17.1 —2022 11.1 —2023 8.8 —2024 and thereafter 15.9 —
Total 88.6 5.3Amount representing interest (7.7) —
Present value of lease payments 80.9 5.3Current maturities (27.1) (5.3)
Long-term lease obligations $ 53.8 $ —
For certain of our real estate leases, there are options contained within the lease agreement to extend beyond the initial lease term. The Company recognizesoptions as right-of-use assets and lease liabilities when deemed reasonably certain to be exercised. Future operating lease payments at September 30, 2019 include$10.6 million related to options to extend lease terms that we are reasonably certain to exercise. Options related to our FTFM service offering that were previouslyconsidered reasonably certain to be exercised have been removed from the future operating lease payments at September 30, 2019.
Under ASC 840, future minimum lease payments as of December 31, 2018 were as follows:
(in millions) Operating Leases Capital Leases
2019 $ 35.8 $ 6.92020 25.7 0.22021 14.9 —2022 8.4 —2023 6.8 —2024 and thereafter 12.7 —
Total $ 104.3 7.1
Amount representing interest (0.2)Present value of minimum lease payments 6.9Current maturities (6.7)
Long-term capital lease obligations $ 0.2
As of September 30, 2019, we had additional leases that had not yet commenced of $3.5 million. These leases will commence during the remainder of 2019 andhave lease terms of four months to five years.
The consolidated balance sheets include right-of-use assets acquired under finance leases as components of property and equipment as of September 30, 2019 andJanuary 1, 2019, as follows:
(in millions) September 30, 2019 January 1, 2019
Transportation equipment $ 19.9 $ 19.9Real property 0.8 0.8Other property 1.5 0.6Accumulated amortization (13.1) (11.2)
Total $ 9.1 $ 10.1
Transportation equipment is being amortized to the estimated residual value by the end of the lease. Real and other property under finance leases are beingamortized to a zero net book value over the initial lease term.
11

Table of Contents
As lessor
We finance various types of transportation-related equipment for independent third parties under lease contracts which are generally for one year to five years andare accounted for as sales-type leases with fully guaranteed residual values. At the inception of the contracts, we determine if the contract is or contains a lease. Acontract is or contains a lease if it conveys the right to control the use of an identified asset for a period of time in exchange for consideration.
With the adoption of ASC 842, all leases for which we are the lessor meet the definition of sales-type leases. In addition, as required under ASC 842, all cash flowsfrom lease receipts are classified as operating activities on the consolidated statement of cash flows beginning January 1, 2019. We previously presented all cashflows from lease receipts as investing activities.
As of September 30, 2019 and January 1, 2019, the investment in lease receivables was as follows:
September 30, 2019 January 1, 2019
Future minimum payments to be received on leases $ 146.9 $ 140.0Guaranteed residual lease values 138.2 151.0
Total minimum lease payments to be received 285.1 291.0Unearned income (33.3) (28.7)
Net investment in leases 251.8 262.3
Current maturities of lease receivables 126.1 129.6Less—allowance for doubtful accounts (0.6) (0.5)Current portion of lease receivables—net of allowance 125.5 129.1
Lease receivables—noncurrent $ 126.3 $ 133.2
The amounts to be received on lease receivables as of September 30, 2019 were as follows:
(in millions) September 30, 2019
Remaining 2019 $ 35.82020 142.82021 75.72022 30.62023 0.22024 and thereafter —
Total undiscounted lease cash flows 285.1Amount representing interest (33.3)
Present value of lease receivables 251.8Current lease receivables, net of allowance (125.5)
Long-term lease receivable $ 126.3
Leases are generally placed on nonaccrual status (nonaccrual of interest and other fees) when a payment becomes 90 days past due or upon receipt of notificationof bankruptcy, upon the death of a customer, or in other instances in which management concludes collectability is not reasonably assured. The accrual of interestand other fees is resumed when all payments are less than 60 days past due. At September 30, 2019, there were $0.3 million of lease payments greater than 90 dayspast due. The terms of the lease agreements generally give us the ability to take possession of the underlying asset in the event of default. We may incur creditlosses in excess of recorded allowances if the full amount of any anticipated proceeds from the sale or re-lease of the asset supporting the third party’s financialobligation is not realized. Repossession and estimated reconditioning costs are recorded in the consolidated statements of comprehensive income in the periodincurred.
Our lease payments primarily include base rentals and guaranteed residual values. In addition, we also collect one-time administrative fees and heavy vehicle usetax on our leases. We have elected to not separate the different components within the contract as the administrative fees were not material for the three and ninemonths ended September 30, 2019. We have also
12

Table of Contents
elected to exclude all taxes assessed by a governmental authority from the consideration (e.g., heavy vehicle use tax). All of our leases require fixed payments,therefore we have no variable payment provisions.
Our leases contain an option for the lessee to return, extend, or purchase the equipment at the end of the lease term for the guaranteed contract residual amount.This is estimated to approximate the fair value of the equipment. Equipment is leased under sales-type leases where the lessees guarantee the residual value of theequipment. The table below provides additional information on our sales-type leases.
Three Months Ended
September 30, Nine Months Ended
September 30,
(in millions) 2019 2019
Revenue $ 50.9 $ 159.8Cost of goods sold (46.8) (144.0)
Operating profit $ 4.1 $ 15.8
Interest income on lease receivable $ 7.0 $ 20.4Initial direct cost incurred — —
The amounts to be received on lease receivables as of December 31, 2018 under ASC 840 were as follows:
(in millions) December 31, 2018
2019 $ 149.02020 112.72021 29.02022 0.32023 —2024 and thereafter —
Total $ 291.0
3. REVENUE RECOGNITION
Disaggregated Revenues
The majority of our revenues are related to transportation and have similar characteristics. The following table summarizes our revenues by type of service, andeach type of service is further described below.
Three Months Ended
September 30, Nine Months Ended
September 30,
Disaggregated Revenues (in millions) 2019 2018 2019 2018
Transportation $ 1,093.9 $ 1,175.0 $ 3,297.7 $ 3,362.9Logistics management 32.3 57.7 120.1 163.7Other 57.7 47.4 172.9 128.8
Total operating revenues $ 1,183.9 $ 1,280.1 $ 3,590.7 $ 3,655.4
Transportation
Transportation revenues relate to the Truckload and Intermodal reportable segments, as well as to our brokerage business, which is included in the Logisticsreportable segment.
In the Transportation portfolio, our service obligation to customers is satisfied over time. We do not believe there is a significant impact on the nature, amount,timing, and uncertainty of revenue or cash flows based on the mode of transportation. The economic factors that impact our transportation revenue are generallyconsistent across these modes given the relatively short-term nature of each contract. For the majority of our transportation business, the “contract with a customer”is identified as an individual order under a negotiated agreement. Some consideration is variable in that a final transaction price is uncertain and is susceptible tofactors outside of Schneider's influence, such as the weather or the accumulation of accessorial charges. Pricing information is supplied by rate schedules thataccompany negotiated contracts.
13
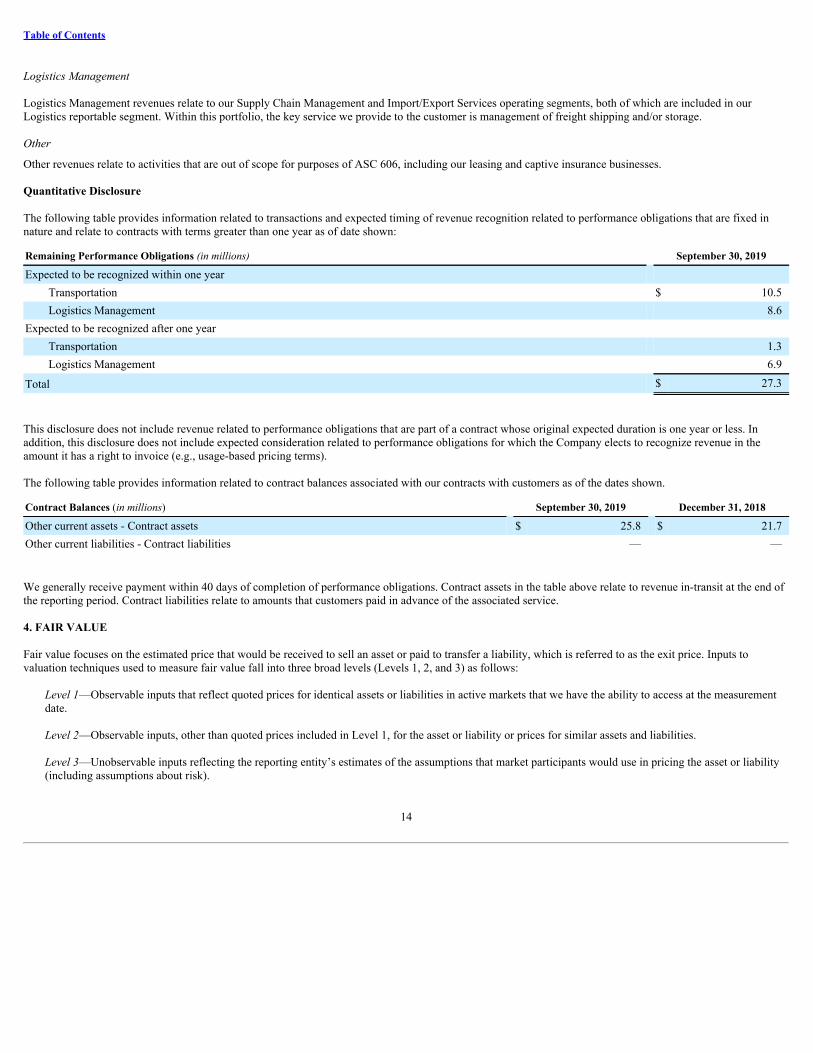
Table of Contents
Logistics Management
Logistics Management revenues relate to our Supply Chain Management and Import/Export Services operating segments, both of which are included in ourLogistics reportable segment. Within this portfolio, the key service we provide to the customer is management of freight shipping and/or storage.
Other
Other revenues relate to activities that are out of scope for purposes of ASC 606, including our leasing and captive insurance businesses.
Quantitative Disclosure
The following table provides information related to transactions and expected timing of revenue recognition related to performance obligations that are fixed innature and relate to contracts with terms greater than one year as of date shown:
Remaining Performance Obligations (in millions) September 30, 2019
Expected to be recognized within one year Transportation $ 10.5Logistics Management 8.6
Expected to be recognized after one year Transportation 1.3Logistics Management 6.9
Total $ 27.3
This disclosure does not include revenue related to performance obligations that are part of a contract whose original expected duration is one year or less. Inaddition, this disclosure does not include expected consideration related to performance obligations for which the Company elects to recognize revenue in theamount it has a right to invoice (e.g., usage-based pricing terms).
The following table provides information related to contract balances associated with our contracts with customers as of the dates shown.
Contract Balances (in millions) September 30, 2019 December 31, 2018
Other current assets - Contract assets $ 25.8 $ 21.7Other current liabilities - Contract liabilities — —
We generally receive payment within 40 days of completion of performance obligations. Contract assets in the table above relate to revenue in-transit at the end ofthe reporting period. Contract liabilities relate to amounts that customers paid in advance of the associated service.
4. FAIR VALUE
Fair value focuses on the estimated price that would be received to sell an asset or paid to transfer a liability, which is referred to as the exit price. Inputs tovaluation techniques used to measure fair value fall into three broad levels (Levels 1, 2, and 3) as follows:
Level 1—Observable inputs that reflect quoted prices for identical assets or liabilities in active markets that we have the ability to access at the measurementdate.
Level 2—Observable inputs, other than quoted prices included in Level 1, for the asset or liability or prices for similar assets and liabilities.
Level 3—Unobservable inputs reflecting the reporting entity’s estimates of the assumptions that market participants would use in pricing the asset or liability(including assumptions about risk).
14
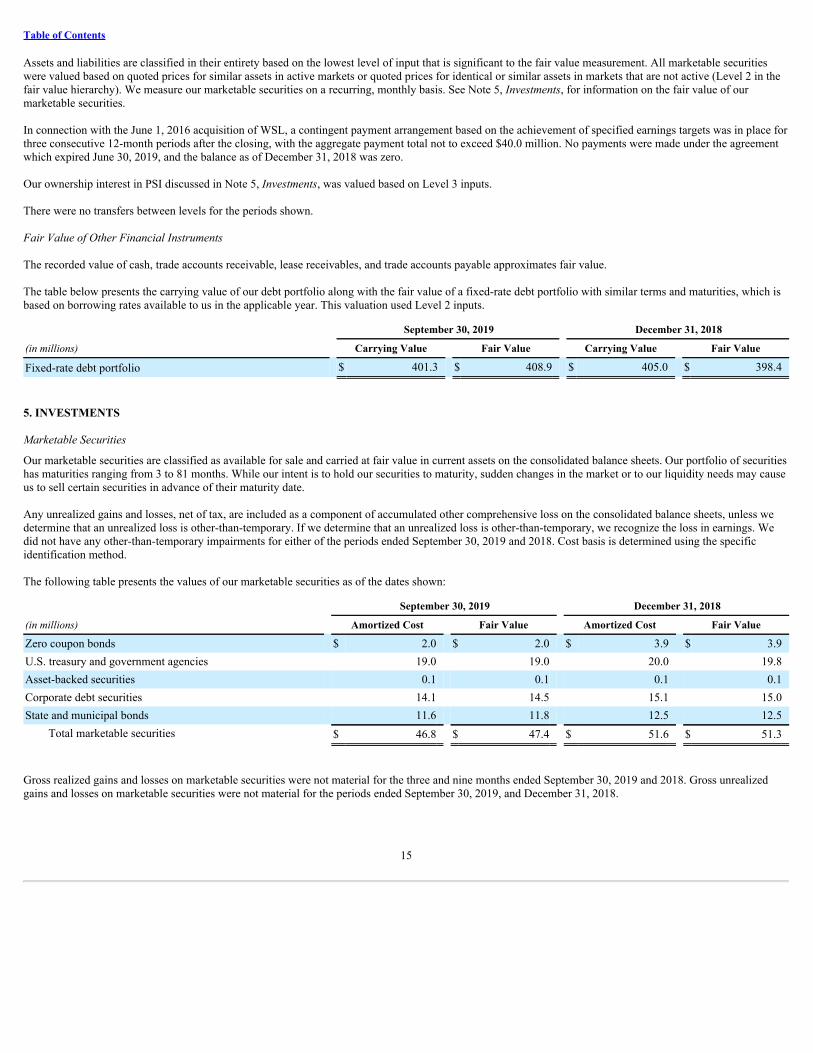
Table of Contents
Assets and liabilities are classified in their entirety based on the lowest level of input that is significant to the fair value measurement. All marketable securitieswere valued based on quoted prices for similar assets in active markets or quoted prices for identical or similar assets in markets that are not active (Level 2 in thefair value hierarchy). We measure our marketable securities on a recurring, monthly basis. See Note 5, Investments, for information on the fair value of ourmarketable securities.
In connection with the June 1, 2016 acquisition of WSL, a contingent payment arrangement based on the achievement of specified earnings targets was in place forthree consecutive 12-month periods after the closing, with the aggregate payment total not to exceed $40.0 million. No payments were made under the agreementwhich expired June 30, 2019, and the balance as of December 31, 2018 was zero.
Our ownership interest in PSI discussed in Note 5, Investments, was valued based on Level 3 inputs.
There were no transfers between levels for the periods shown.
Fair Value of Other Financial Instruments
The recorded value of cash, trade accounts receivable, lease receivables, and trade accounts payable approximates fair value.
The table below presents the carrying value of our debt portfolio along with the fair value of a fixed-rate debt portfolio with similar terms and maturities, which isbased on borrowing rates available to us in the applicable year. This valuation used Level 2 inputs.
September 30, 2019 December 31, 2018
(in millions) Carrying Value Fair Value Carrying Value Fair Value
Fixed-rate debt portfolio $ 401.3 $ 408.9 $ 405.0 $ 398.4
5. INVESTMENTS
Marketable Securities
Our marketable securities are classified as available for sale and carried at fair value in current assets on the consolidated balance sheets. Our portfolio of securitieshas maturities ranging from 3 to 81 months. While our intent is to hold our securities to maturity, sudden changes in the market or to our liquidity needs may causeus to sell certain securities in advance of their maturity date.
Any unrealized gains and losses, net of tax, are included as a component of accumulated other comprehensive loss on the consolidated balance sheets, unless wedetermine that an unrealized loss is other-than-temporary. If we determine that an unrealized loss is other-than-temporary, we recognize the loss in earnings. Wedid not have any other-than-temporary impairments for either of the periods ended September 30, 2019 and 2018. Cost basis is determined using the specificidentification method.
The following table presents the values of our marketable securities as of the dates shown:
September 30, 2019 December 31, 2018
(in millions) Amortized Cost Fair Value Amortized Cost Fair Value
Zero coupon bonds $ 2.0 $ 2.0 $ 3.9 $ 3.9U.S. treasury and government agencies 19.0 19.0 20.0 19.8Asset-backed securities 0.1 0.1 0.1 0.1Corporate debt securities 14.1 14.5 15.1 15.0State and municipal bonds 11.6 11.8 12.5 12.5
Total marketable securities $ 46.8 $ 47.4 $ 51.6 $ 51.3
Gross realized gains and losses on marketable securities were not material for the three and nine months ended September 30, 2019 and 2018. Gross unrealizedgains and losses on marketable securities were not material for the periods ended September 30, 2019, and December 31, 2018.
15

Table of Contents
Ownership Interest in Platform Science, Inc.
In 2018, we acquired a 30% ownership interest in PSI in exchange for granting PSI a non-exclusive license to our proprietary telematics mobile software that wasdeveloped to enable driver productivity and ensure regulatory compliance. Our ownership interest in PSI is being accounted for under ASC 321, Investments -Equity Securities and is recorded at fair value in other noncurrent assets on the consolidated balance sheets. The fair value of the ownership interest as ofDecember 31, 2018 was determined to be $3.5 million through an independent valuation. As of September 30, 2019, there have been no transactions that wouldindicate that the value of our ownership interest in PSI changed.
6. GOODWILL AND OTHER INTANGIBLE ASSETS
Goodwill represents the excess of the purchase price of our acquisitions over the fair value of the identifiable net assets acquired. Changes in the carrying amountof goodwill were as follows:
(in millions) Truckload Logistics Other Total
Balance at December 31, 2018 $ 138.2 $ 14.2 $ 9.8 $ 162.2Goodwill impairment charge (34.6) — — (34.6)Foreign currency translation — — (0.3) (0.3)
Balance at September 30, 2019 $ 103.6 $ 14.2 $ 9.5 $ 127.3
At September 30, 2019 and December 31, 2018, we had accumulated goodwill impairment charges of $42.6 million and $8.0 million, respectively.
Goodwill is tested for impairment at least annually using both the discounted cash flow method and the guideline public company method in calculating the fairvalues of our reporting units. Key inputs used in the discounted cash flow approach include growth rates for sales and operating profit, perpetuity growthassumptions, and discount rates. As interest rates rise, the calculated fair values of our reporting units will decrease, which could impact the results of our goodwillimpairment tests.
A triggering event occurred during the second quarter of 2019 as results from our FTFM reporting unit continued to be less than projected, despite sustainedinvestments and operational changes designed to improve efficiencies. Because of this triggering event, an impairment test was performed for the FTFM reportingunit. As a result of the testing performed, an impairment loss of $34.6 million was recorded for our FTFM reporting unit as the discounted cash flows expected tobe generated by this reporting unit were not sufficient to recover its carrying value. This represents all of the goodwill related to the FTFM reporting unit.
The identifiable intangible assets other than goodwill listed below are included in capitalized software and other noncurrent assets on the consolidated balancesheets.
(in millions) Gross Carrying
Amount AccumulatedAmortization
Net CarryingAmount
Balance at September 30, 2019 Customer lists $ 1.1 $ 1.1 $ —Trade name — — —
Total intangible assets 1.1 1.1 —
Balance at December 31, 2018 Customer lists 10.5 3.5 7.0Trade name 1.4 1.2 0.2
Total intangible assets $ 11.9 $ 4.7 $ 7.2
As part of the shutdown of our FTFM service offering in the third quarter of 2019, we wrote-off the gross carrying amount of the customer lists and trade nameobtained through the WSL acquisition. An impairment charge of $6.5 million was recorded for the unamortized value of the customer lists in the three monthsended September 30, 2019. The impairment charge is included in the consolidated statements of comprehensive income within restructuring charges. Refer to Note13, Restructuring Charges, for additional details.
16

Table of Contents
Amortization expense for intangible assets was $0.1 million and $0.3 million for the three months ended September 30, 2019 and September 30, 2018,respectively, and $0.7 million and $1.1 million for the nine months ended September 30, 2019 and 2018, respectively. Accumulated amortization in the table aboveincludes foreign currency translation related to a customer list.
7. DEBT AND CREDIT FACILITIES
As of September 30, 2019 and December 31, 2018, debt included the following:
(in millions) September 30, 2019 December 31, 2018
Unsecured senior notes: principal payable at maturities ranging from 2019 through 2025; interestpayable in semiannual installments through the same timeframe; weighted-average interest rate of3.36% for both 2019 and 2018 $ 400.0 $ 400.0Equipment financing notes: principal and interest payable in monthly installments through 2019;weighted average interest rate of 3.98% and 3.72% for 2019 and 2018, respectively 1.3 5.0
Total principal outstanding 401.3 405.0Current maturities (96.2) (45.0)Debt issuance costs (0.5) (0.6)
Long-term debt $ 304.6 $ 359.4
Our Credit Agreement (the “2018 Credit Facility”) provides borrowing capacity of $250.0 million and allows us to request an increase in total commitment by upto $150.0 million, for a total potential commitment of $400.0 million through August 2023. The agreement also provides a sublimit of $100.0 million to be used forthe issuance of letters of credit. We had no outstanding borrowings under this agreement as of September 30, 2019 or December 31, 2018. Standby letters of creditunder this agreement amounted to $3.9 million at September 30, 2019 and December 31, 2018 and were primarily related to the requirements of certain of our realestate leases.
We also have a Receivables Purchase Agreement (the “2018 Receivables Purchase Agreement”) that allows us to borrow funds against qualifying trade receivablesat rates based on one-month LIBOR up to $200.0 million and provides for the issuance of standby letters of credit through September 2021. We had no outstandingborrowings under this facility at September 30, 2019 or December 31, 2018. At September 30, 2019 and December 31, 2018, standby letters of credit under thisagreement amounted to $70.3 million and $65.3 million, respectively, and were primarily related to the requirements of certain of our insurance obligations.
8. INCOME TAXES
Our effective income tax rate was 26.2% and 25.8% for the three months ended September 30, 2019 and 2018, respectively, and 25.3% and 25.8% for the ninemonths ended September 30, 2019 and 2018, respectively. In determining the quarterly provision for income taxes, we use an estimated annual effective tax rate,adjusted for discrete items. This rate is based on our expected annual income, statutory tax rates, and best estimate of nontaxable and nondeductible items ofincome and expense.
17
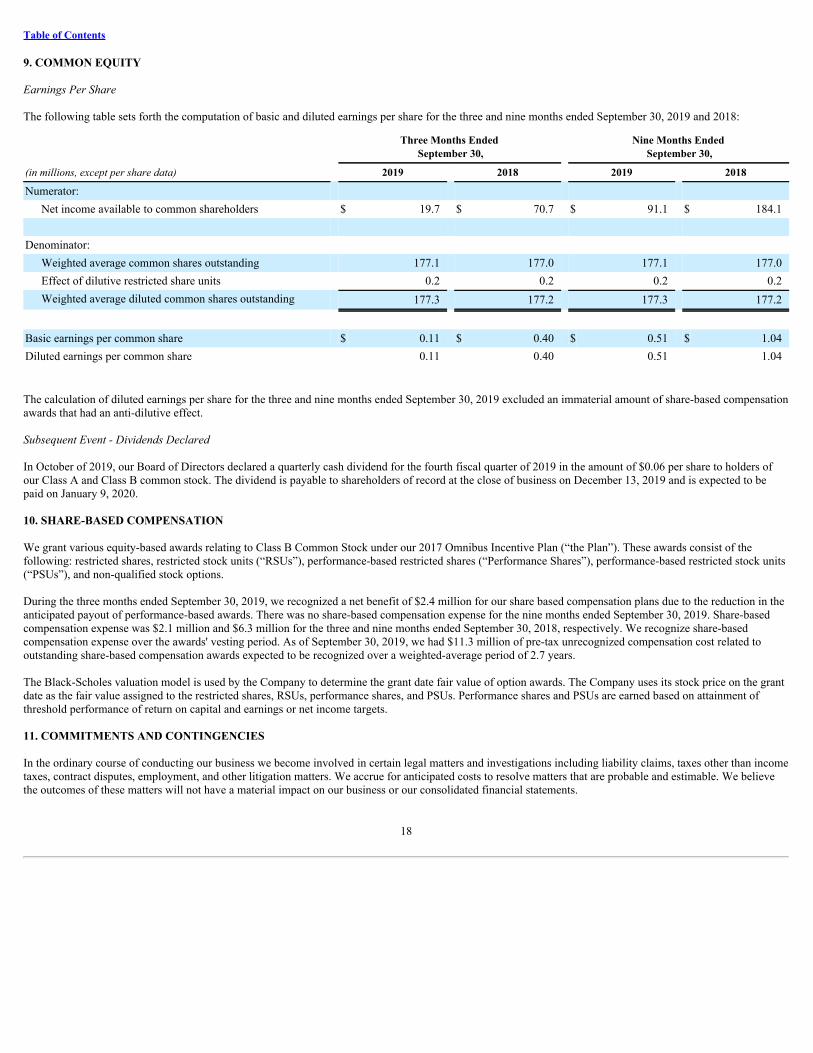
Table of Contents
9. COMMON EQUITY
Earnings Per Share
The following table sets forth the computation of basic and diluted earnings per share for the three and nine months ended September 30, 2019 and 2018:
Three Months Ended
September 30, Nine Months Ended
September 30,
(in millions, except per share data) 2019 2018 2019 2018
Numerator: Net income available to common shareholders $ 19.7 $ 70.7 $ 91.1 $ 184.1
Denominator:
Weighted average common shares outstanding 177.1 177.0 177.1 177.0Effect of dilutive restricted share units 0.2 0.2 0.2 0.2Weighted average diluted common shares outstanding 177.3 177.2 177.3 177.2
Basic earnings per common share $ 0.11 $ 0.40 $ 0.51 $ 1.04Diluted earnings per common share 0.11 0.40 0.51 1.04
The calculation of diluted earnings per share for the three and nine months ended September 30, 2019 excluded an immaterial amount of share-based compensationawards that had an anti-dilutive effect.
Subsequent Event - Dividends Declared
In October of 2019, our Board of Directors declared a quarterly cash dividend for the fourth fiscal quarter of 2019 in the amount of $0.06 per share to holders ofour Class A and Class B common stock. The dividend is payable to shareholders of record at the close of business on December 13, 2019 and is expected to bepaid on January 9, 2020.
10. SHARE-BASED COMPENSATION
We grant various equity-based awards relating to Class B Common Stock under our 2017 Omnibus Incentive Plan (“the Plan”). These awards consist of thefollowing: restricted shares, restricted stock units (“RSUs”), performance-based restricted shares (“Performance Shares”), performance-based restricted stock units(“PSUs”), and non-qualified stock options.
During the three months ended September 30, 2019, we recognized a net benefit of $2.4 million for our share based compensation plans due to the reduction in theanticipated payout of performance-based awards. There was no share-based compensation expense for the nine months ended September 30, 2019. Share-basedcompensation expense was $2.1 million and $6.3 million for the three and nine months ended September 30, 2018, respectively. We recognize share-basedcompensation expense over the awards' vesting period. As of September 30, 2019, we had $11.3 million of pre-tax unrecognized compensation cost related tooutstanding share-based compensation awards expected to be recognized over a weighted-average period of 2.7 years.
The Black-Scholes valuation model is used by the Company to determine the grant date fair value of option awards. The Company uses its stock price on the grantdate as the fair value assigned to the restricted shares, RSUs, performance shares, and PSUs. Performance shares and PSUs are earned based on attainment ofthreshold performance of return on capital and earnings or net income targets.
11. COMMITMENTS AND CONTINGENCIES
In the ordinary course of conducting our business we become involved in certain legal matters and investigations including liability claims, taxes other than incometaxes, contract disputes, employment, and other litigation matters. We accrue for anticipated costs to resolve matters that are probable and estimable. We believethe outcomes of these matters will not have a material impact on our business or our consolidated financial statements.
18

Table of Contents
We record liabilities for claims accruals based on our best estimate of expected losses. The primary claims arising for the Company consist of accident-relatedclaims for personal injury, collision, and comprehensive compensation, in addition to workers' compensation and cargo liability claims. We maintain insurancewith licensed insurance carriers above the amounts in which we self-insure. We review our accruals periodically to ensure that the aggregate amounts of ouraccruals are appropriate at any period after consideration of available insurance coverage. Although it is possible that our claims accruals will change based onfuture developments, we do not believe these changes will be material to our results of operations considering our insurance coverage and other factors.
At September 30, 2019, our firm commitments to purchase transportation equipment totaled approximately $278.1 million.
The representative of the former owners of WSL has filed a lawsuit in the Delaware Court of Chancery which alleges that we have not fulfilled certain obligationsunder the purchase and sale agreement relating to the post-closing operations of the business, and as a result, the former owners claim they are entitled to anadditional payment of $40.0 million. For additional information on this contingent payment see Note 4, Fair Value. A trial date has been set for April 2020. Webelieve that we have strong defenses to this claim. A judgment by the Court against us could have a material adverse effect on our results of operations.
12. SEGMENT REPORTING
We have three reportable segments – Truckload, Intermodal, and Logistics – which are based primarily on the services each segment provides.
As of December 31, 2018, our operating segments within the Truckload reportable segment were VTL, FTFM, and Bulk. On July 29, 2019 the Board of Directorsapproved a structured shutdown of our FTFM service offering, which was included within our FTFM operating segment. Once the shutdown of the FTFM serviceoffering is complete, there will be two operating segments within the Truckload reportable segment, VTL and Bulk.
The CODM reviews revenues for each operating segment without the inclusion of fuel surcharge revenues. For segment purposes, any fuel surcharge revenuesearned are recorded as a reduction of the segment’s fuel expenses. Income from operations at a segment level reflects the measures presented to the CODM foreach segment.
Separate balance sheets are not prepared by segment, and, as a result, assets are not separately identifiable by segment. All transactions between reporting segmentsare eliminated in consolidation.
The following tables summarize our segment information. Intersegment revenues were immaterial for all segments, with the exception of Other, which includesrevenues from insurance premiums charged to other segments for workers’ compensation, auto, and other types of insurance. Intersegment revenues included inOther revenues below were $20.8 million and $20.7 million for the three months ended September 30, 2019 and 2018, respectively, and $66.8 million and $62.0million for the nine months ended September 30, 2019 and 2018, respectively.
Revenues by Segment Three Months Ended
September 30, Nine Months Ended
September 30,
(in millions) 2019 2018 2019 2018
Truckload $ 515.6 $ 566.9 $ 1,582.3 $ 1,685.0Intermodal 249.2 254.4 746.6 688.0Logistics 236.1 271.8 707.0 743.7Other 94.3 83.9 290.0 237.0Fuel surcharge 114.2 134.9 350.2 385.8Inter-segment eliminations (25.5) (31.8) (85.4) (84.1)
Operating revenues $ 1,183.9 $ 1,280.1 $ 3,590.7 $ 3,655.4
19
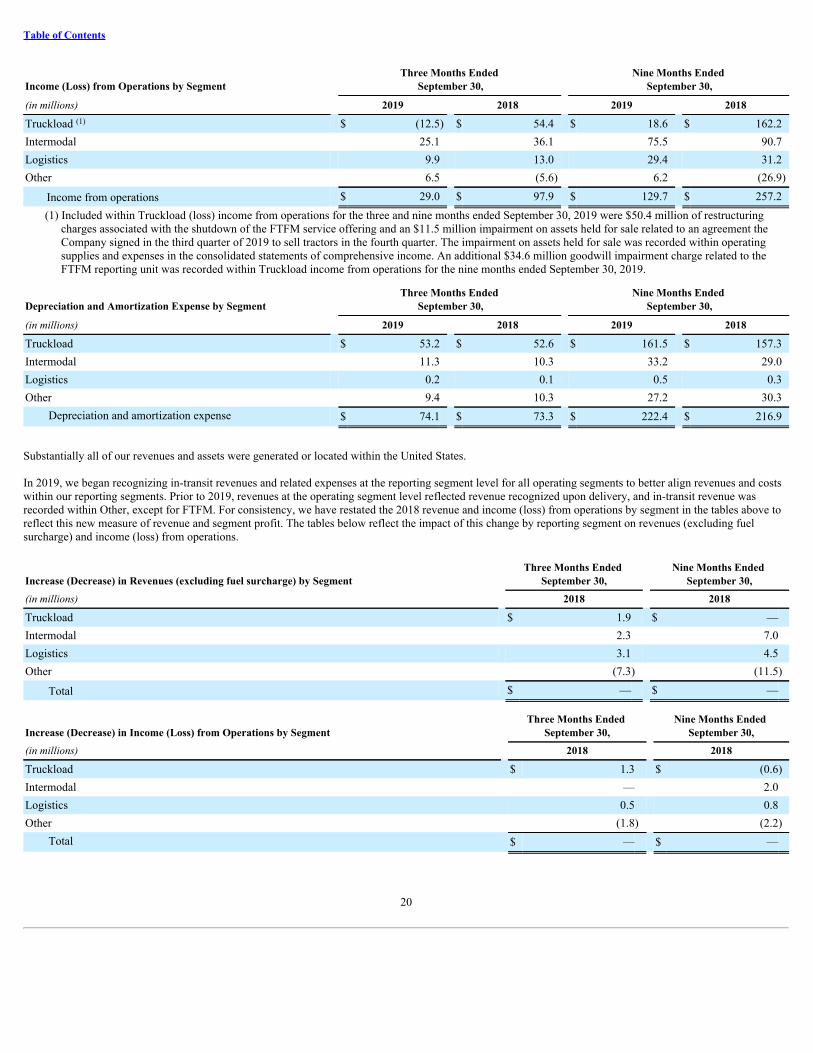
Table of Contents
Income (Loss) from Operations by Segment Three Months Ended
September 30, Nine Months Ended
September 30,
(in millions) 2019 2018 2019 2018
Truckload (1) $ (12.5) $ 54.4 $ 18.6 $ 162.2Intermodal 25.1 36.1 75.5 90.7Logistics 9.9 13.0 29.4 31.2Other 6.5 (5.6) 6.2 (26.9)
Income from operations $ 29.0 $ 97.9 $ 129.7 $ 257.2(1) Included within Truckload (loss) income from operations for the three and nine months ended September 30, 2019 were $50.4 million of restructuring
charges associated with the shutdown of the FTFM service offering and an $11.5 million impairment on assets held for sale related to an agreement theCompany signed in the third quarter of 2019 to sell tractors in the fourth quarter. The impairment on assets held for sale was recorded within operatingsupplies and expenses in the consolidated statements of comprehensive income. An additional $34.6 million goodwill impairment charge related to theFTFM reporting unit was recorded within Truckload income from operations for the nine months ended September 30, 2019.
Depreciation and Amortization Expense by Segment Three Months Ended
September 30, Nine Months Ended
September 30,
(in millions) 2019 2018 2019 2018
Truckload $ 53.2 $ 52.6 $ 161.5 $ 157.3Intermodal 11.3 10.3 33.2 29.0Logistics 0.2 0.1 0.5 0.3Other 9.4 10.3 27.2 30.3
Depreciation and amortization expense $ 74.1 $ 73.3 $ 222.4 $ 216.9
Substantially all of our revenues and assets were generated or located within the United States.
In 2019, we began recognizing in-transit revenues and related expenses at the reporting segment level for all operating segments to better align revenues and costswithin our reporting segments. Prior to 2019, revenues at the operating segment level reflected revenue recognized upon delivery, and in-transit revenue wasrecorded within Other, except for FTFM. For consistency, we have restated the 2018 revenue and income (loss) from operations by segment in the tables above toreflect this new measure of revenue and segment profit. The tables below reflect the impact of this change by reporting segment on revenues (excluding fuelsurcharge) and income (loss) from operations.
Increase (Decrease) in Revenues (excluding fuel surcharge) by Segment Three Months Ended
September 30, Nine Months Ended
September 30,
(in millions) 2018 2018
Truckload $ 1.9 $ —Intermodal 2.3 7.0Logistics 3.1 4.5Other (7.3) (11.5)
Total $ — $ —
Increase (Decrease) in Income (Loss) from Operations by Segment Three Months Ended
September 30, Nine Months Ended
September 30,
(in millions) 2018 2018
Truckload $ 1.3 $ (0.6)Intermodal — 2.0Logistics 0.5 0.8Other (1.8) (2.2)
Total $ — $ —
20

Table of Contents
13. RESTRUCTURING CHARGES
On July 29, 2019 the Company’s Board of Directors approved a structured shutdown of its FTFM service offering within its Truckload reporting segment whichwas substantially complete as of August 31, 2019. As part of the shutdown, $50.4 million of restructuring charges were incurred during the third quarter of 2019.Combined with anticipated future shutdown costs, the Company will be at the lower end of its estimated range of $50.0 million to $75.0 million. All of therestructuring charges were recorded within our Truckload reporting segment. Pre-tax losses of our FTFM service offering were $8.9 million and $9.7 million forthe three months ended September 30, 2019 and 2018, respectively and $34.2 million and $19.3 million for the nine months ended September 30, 2019 and 2018,respectively.
The costs associated with the shutdown are presented separately on the consolidated statements of comprehensive income within restructuring charges and aresummarized in the following table for the three and nine months ended September 30, 2019:
(in millions) September 30, 2019
Impairment charges $ 35.7Receivables write-down 7.6Other costs 7.1
Total restructuring charges $ 50.4
As part of our assessment of impairment charges during the quarter ended September 30, 2019, we recorded at fair value $50.6 million of transportation equipmentusing market data and $13.6 million of right-of-use lease assets using discounted cash flow analyses. As a result of the above, we utilized level 3 inputs incalculating the fair value. These assets, less the cost to sell, are recorded within prepaid expenses and other current assets and other noncurrent assets, respectively,on the consolidated balance sheets as of September 30, 2019.
As of December 31, 2018 and September 30, 2019, FTFM restructuring liabilities are classified as current liabilities on the consolidated balance sheets andbalances are as follows:
(in millions) Restructuring Liabilities
Balance at December 31, 2018 $ —Restructuring charges 7.1Cash payments (5.2)
Balance at September 30, 2019 $ 1.9
The required criteria, as defined by ASC 360, Property, Plant and Equipment, was satisfied as part of the shutdown of our FTFM service offering forreclassification of related transportation equipment into assets held for sale. The following table presents information on assets held for sale as of December 31,2018 and September 30, 2019 within our Truckload segment. As of September 30, 2019, $50.6 million of the assets held for sale balance relates to the shutdown ofour FTFM service offering. Assets held for sale, net of impairment, are included in prepaid expenses and other current assets in the consolidated balance sheets.
(in millions) September 30, 2019 December 31, 2018
Truckload $ 119.2 $ 19.5
21

Table of Contents
Item 2. Management’s Discussion and Analysis of Financial Condition and Results of Operations
The following discussion and analysis should be read in conjunction with the accompanying consolidated financial statements and related notes and our AnnualReport on Form 10-K for the year ended December 31, 2018.
INTRODUCTION
We are a leading transportation and logistics services company providing a broad portfolio of premier truckload, intermodal, and logistics solutions and operatingone of the largest for-hire trucking fleets in North America. Our highly flexible and balanced business combines asset-based truckload services with asset-lightintermodal and non-asset logistics offerings, enabling us to serve our customers’ diverse transportation needs. Our broad portfolio of services provides us with agreater opportunity to allocate capital within our portfolio of services in a manner designed to maximize returns across all market cycles and economic conditions.We continually monitor our performance and market conditions to ensure appropriate allocation of capital and resources to grow our businesses and to optimizereturns across reportable segments. Our strong balance sheet enables us to carry out an acquisition strategy that strengthens our overall portfolio. We are positionedto leverage our scalable platform and experienced operations team to acquire high-quality businesses that meet our disciplined selection criteria to broaden ourservice offerings and customer base.
Our truckload services include standard long-haul and regional shipping services primarily using dry van equipment, bulk, temperature-controlled, and customizedsolutions for high-value, time-sensitive loads. These services are executed through either for-hire or dedicated contracts. FTFM residential and retail store deliveryservices were also provided into the third quarter of 2019, when that service offering was shut down.
Our intermodal service consists of door-to-door container on flat car service by a combination of rail and over-the-road transportation, in association with our railcarrier partners. Our intermodal service uses company-owned containers, chassis, and trucks, using primarily company dray drivers to offer vast coveragethroughout North America, including cross border.
Our logistics offerings consist of non-asset freight brokerage services, supply chain services (including 3PL), and import/export services. Our logistics businesstypically provides value-added services using third-party capacity, augmented by our assets, to manage and move our customers’ freight.
Our success depends on our ability to balance our transportation network and efficiently and effectively manage our resources in the delivery of truckload,intermodal, and logistics services to our customers. Resource requirements vary with customer demand, which may be subject to seasonal or general economicconditions. We believe that our ability to properly select freight and adapt to changes in customer transportation needs allows us to efficiently deploy resources andmake capital investments in trucks, trailers, containers, and chassis, or obtain qualified third-party capacity at a reasonable price for our logistics segment.
Consistent with the transportation industry, our results of operations generally show a seasonal pattern. The strongest volumes are typically in the late third andfourth quarters. Operating expenses tend to be higher in the winter months primarily due to colder weather, which causes higher maintenance expense and higherfuel consumption from increased idle time.
RESULTS OF OPERATIONS
Non-GAAP Financial Measures
In this section of our report, we present the following non-GAAP financial measures: (1) revenues (excluding fuel surcharge), (2) adjusted income from operations,(3) adjusted operating ratio, and (4) adjusted net income. We also provide reconciliations of these measures to the most directly comparable financial measurescalculated and presented in accordance with GAAP.
Management believes the use of each of these non-GAAP measures assists investors in understanding our business by (a) removing the impact of items from ouroperating results that, in our opinion, do not reflect our core operating performance, (b) providing investors with the same information our management usesinternally to assess our core operating performance, and (c) presenting comparable financial results between periods. In addition, in the case of revenues (excludingfuel surcharge), we believe the measure is useful to investors because it isolates volume, price, and cost changes directly related to industry demand and the waywe operate our business from the external factor of fluctuating fuel prices and the programs we have in place to manage fuel price fluctuations. Fuel-related costsand their impact on our industry are important to our results of operations, but they are often independent of other, more relevant factors affecting our results ofoperations and our industry.
22
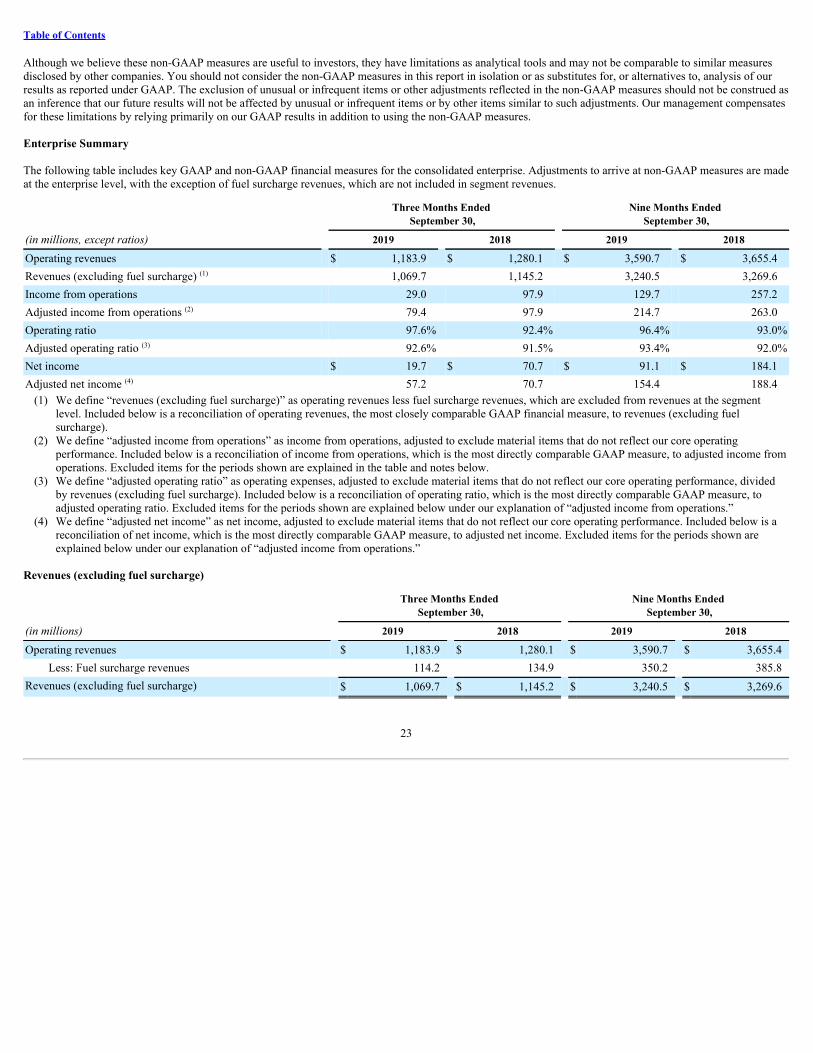
Table of Contents
Although we believe these non-GAAP measures are useful to investors, they have limitations as analytical tools and may not be comparable to similar measuresdisclosed by other companies. You should not consider the non-GAAP measures in this report in isolation or as substitutes for, or alternatives to, analysis of ourresults as reported under GAAP. The exclusion of unusual or infrequent items or other adjustments reflected in the non-GAAP measures should not be construed asan inference that our future results will not be affected by unusual or infrequent items or by other items similar to such adjustments. Our management compensatesfor these limitations by relying primarily on our GAAP results in addition to using the non-GAAP measures.
Enterprise Summary
The following table includes key GAAP and non-GAAP financial measures for the consolidated enterprise. Adjustments to arrive at non-GAAP measures are madeat the enterprise level, with the exception of fuel surcharge revenues, which are not included in segment revenues.
Three Months Ended
September 30, Nine Months Ended
September 30,
(in millions, except ratios) 2019 2018 2019 2018
Operating revenues $ 1,183.9 $ 1,280.1 $ 3,590.7 $ 3,655.4Revenues (excluding fuel surcharge) (1) 1,069.7 1,145.2 3,240.5 3,269.6Income from operations 29.0 97.9 129.7 257.2Adjusted income from operations (2) 79.4 97.9 214.7 263.0Operating ratio 97.6% 92.4% 96.4% 93.0%Adjusted operating ratio (3) 92.6% 91.5% 93.4% 92.0%Net income $ 19.7 $ 70.7 $ 91.1 $ 184.1Adjusted net income (4) 57.2 70.7 154.4 188.4
(1) We define “revenues (excluding fuel surcharge)” as operating revenues less fuel surcharge revenues, which are excluded from revenues at the segmentlevel. Included below is a reconciliation of operating revenues, the most closely comparable GAAP financial measure, to revenues (excluding fuelsurcharge).
(2) We define “adjusted income from operations” as income from operations, adjusted to exclude material items that do not reflect our core operatingperformance. Included below is a reconciliation of income from operations, which is the most directly comparable GAAP measure, to adjusted income fromoperations. Excluded items for the periods shown are explained in the table and notes below.
(3) We define “adjusted operating ratio” as operating expenses, adjusted to exclude material items that do not reflect our core operating performance, dividedby revenues (excluding fuel surcharge). Included below is a reconciliation of operating ratio, which is the most directly comparable GAAP measure, toadjusted operating ratio. Excluded items for the periods shown are explained below under our explanation of “adjusted income from operations.”
(4) We define “adjusted net income” as net income, adjusted to exclude material items that do not reflect our core operating performance. Included below is areconciliation of net income, which is the most directly comparable GAAP measure, to adjusted net income. Excluded items for the periods shown areexplained below under our explanation of “adjusted income from operations.”
Revenues (excluding fuel surcharge)
Three Months Ended
September 30, Nine Months Ended
September 30,
(in millions) 2019 2018 2019 2018
Operating revenues $ 1,183.9 $ 1,280.1 $ 3,590.7 $ 3,655.4Less: Fuel surcharge revenues 114.2 134.9 350.2 385.8
Revenues (excluding fuel surcharge) $ 1,069.7 $ 1,145.2 $ 3,240.5 $ 3,269.6
23
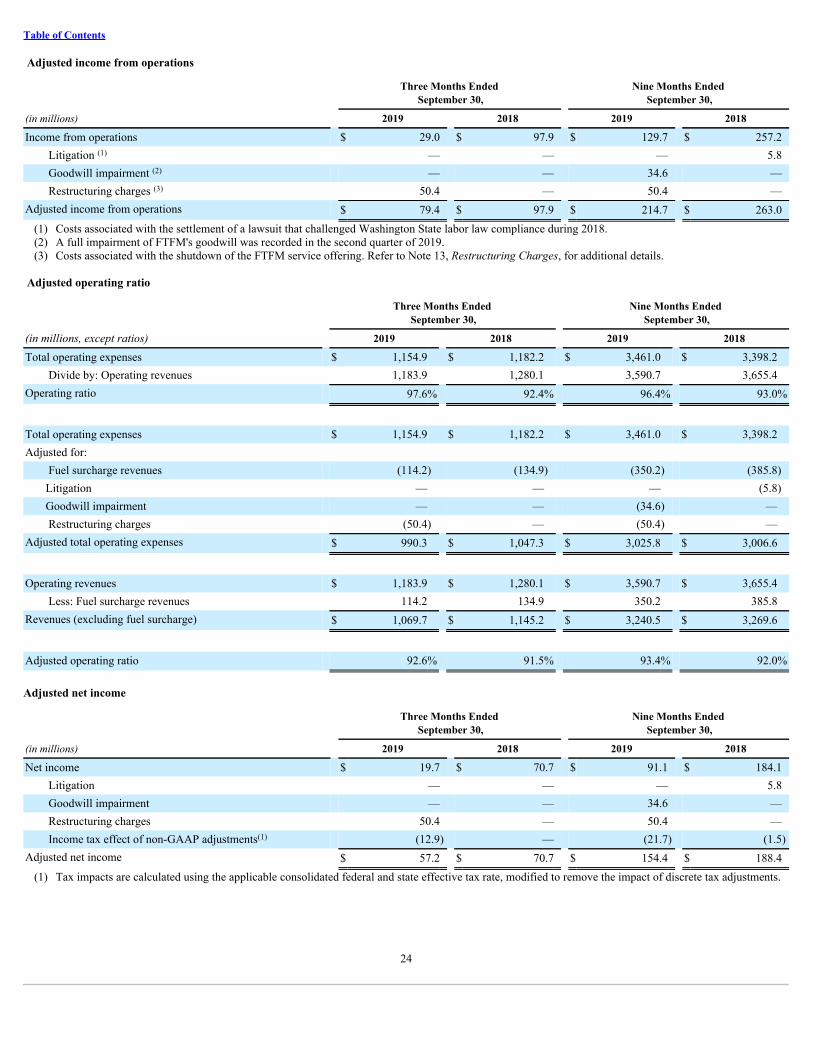
Table of Contents
Adjusted income from operations
Three Months Ended
September 30, Nine Months Ended
September 30,
(in millions) 2019 2018 2019 2018
Income from operations $ 29.0 $ 97.9 $ 129.7 $ 257.2Litigation (1) — — — 5.8Goodwill impairment (2) — — 34.6 —Restructuring charges (3) 50.4 — 50.4 —
Adjusted income from operations $ 79.4 $ 97.9 $ 214.7 $ 263.0(1) Costs associated with the settlement of a lawsuit that challenged Washington State labor law compliance during 2018.(2) A full impairment of FTFM's goodwill was recorded in the second quarter of 2019.(3) Costs associated with the shutdown of the FTFM service offering. Refer to Note 13, Restructuring Charges, for additional details.
Adjusted operating ratio
Three Months Ended
September 30, Nine Months Ended
September 30,
(in millions, except ratios) 2019 2018 2019 2018
Total operating expenses $ 1,154.9 $ 1,182.2 $ 3,461.0 $ 3,398.2Divide by: Operating revenues 1,183.9 1,280.1 3,590.7 3,655.4
Operating ratio 97.6% 92.4% 96.4% 93.0%
Total operating expenses $ 1,154.9 $ 1,182.2 $ 3,461.0 $ 3,398.2Adjusted for:
Fuel surcharge revenues (114.2) (134.9) (350.2) (385.8) Litigation — — — (5.8) Goodwill impairment — — (34.6) —
Restructuring charges (50.4) — (50.4) —Adjusted total operating expenses $ 990.3 $ 1,047.3 $ 3,025.8 $ 3,006.6
Operating revenues $ 1,183.9 $ 1,280.1 $ 3,590.7 $ 3,655.4Less: Fuel surcharge revenues 114.2 134.9 350.2 385.8
Revenues (excluding fuel surcharge) $ 1,069.7 $ 1,145.2 $ 3,240.5 $ 3,269.6
Adjusted operating ratio 92.6% 91.5% 93.4% 92.0%
Adjusted net income
Three Months Ended
September 30, Nine Months Ended
September 30,
(in millions) 2019 2018 2019 2018
Net income $ 19.7 $ 70.7 $ 91.1 $ 184.1Litigation — — — 5.8Goodwill impairment — — 34.6 —Restructuring charges 50.4 — 50.4 —Income tax effect of non-GAAP adjustments(1) (12.9) — (21.7) (1.5)
Adjusted net income $ 57.2 $ 70.7 $ 154.4 $ 188.4(1) Tax impacts are calculated using the applicable consolidated federal and state effective tax rate, modified to remove the impact of discrete tax adjustments.
24
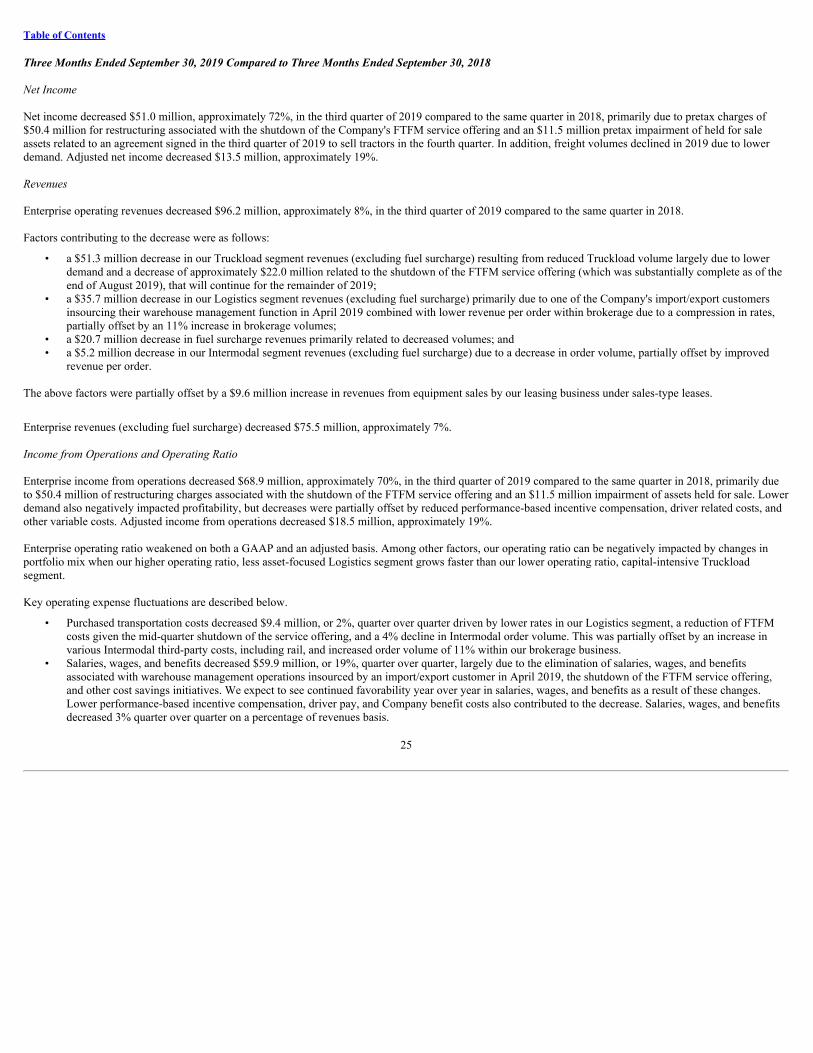
Table of Contents
Three Months Ended September 30, 2019 Compared to Three Months Ended September 30, 2018
Net Income
Net income decreased $51.0 million, approximately 72%, in the third quarter of 2019 compared to the same quarter in 2018, primarily due to pretax charges of$50.4 million for restructuring associated with the shutdown of the Company's FTFM service offering and an $11.5 million pretax impairment of held for saleassets related to an agreement signed in the third quarter of 2019 to sell tractors in the fourth quarter. In addition, freight volumes declined in 2019 due to lowerdemand. Adjusted net income decreased $13.5 million, approximately 19%.
Revenues
Enterprise operating revenues decreased $96.2 million, approximately 8%, in the third quarter of 2019 compared to the same quarter in 2018.
Factors contributing to the decrease were as follows:
• a $51.3 million decrease in our Truckload segment revenues (excluding fuel surcharge) resulting from reduced Truckload volume largely due to lowerdemand and a decrease of approximately $22.0 million related to the shutdown of the FTFM service offering (which was substantially complete as of theend of August 2019), that will continue for the remainder of 2019;
• a $35.7 million decrease in our Logistics segment revenues (excluding fuel surcharge) primarily due to one of the Company's import/export customersinsourcing their warehouse management function in April 2019 combined with lower revenue per order within brokerage due to a compression in rates,partially offset by an 11% increase in brokerage volumes;
• a $20.7 million decrease in fuel surcharge revenues primarily related to decreased volumes; and• a $5.2 million decrease in our Intermodal segment revenues (excluding fuel surcharge) due to a decrease in order volume, partially offset by improved
revenue per order.
The above factors were partially offset by a $9.6 million increase in revenues from equipment sales by our leasing business under sales-type leases.
Enterprise revenues (excluding fuel surcharge) decreased $75.5 million, approximately 7%.
Income from Operations and Operating Ratio
Enterprise income from operations decreased $68.9 million, approximately 70%, in the third quarter of 2019 compared to the same quarter in 2018, primarily dueto $50.4 million of restructuring charges associated with the shutdown of the FTFM service offering and an $11.5 million impairment of assets held for sale. Lowerdemand also negatively impacted profitability, but decreases were partially offset by reduced performance-based incentive compensation, driver related costs, andother variable costs. Adjusted income from operations decreased $18.5 million, approximately 19%.
Enterprise operating ratio weakened on both a GAAP and an adjusted basis. Among other factors, our operating ratio can be negatively impacted by changes inportfolio mix when our higher operating ratio, less asset-focused Logistics segment grows faster than our lower operating ratio, capital-intensive Truckloadsegment.
Key operating expense fluctuations are described below.
• Purchased transportation costs decreased $9.4 million, or 2%, quarter over quarter driven by lower rates in our Logistics segment, a reduction of FTFMcosts given the mid-quarter shutdown of the service offering, and a 4% decline in Intermodal order volume. This was partially offset by an increase invarious Intermodal third-party costs, including rail, and increased order volume of 11% within our brokerage business.
• Salaries, wages, and benefits decreased $59.9 million, or 19%, quarter over quarter, largely due to the elimination of salaries, wages, and benefitsassociated with warehouse management operations insourced by an import/export customer in April 2019, the shutdown of the FTFM service offering,and other cost savings initiatives. We expect to see continued favorability year over year in salaries, wages, and benefits as a result of these changes.Lower performance-based incentive compensation, driver pay, and Company benefit costs also contributed to the decrease. Salaries, wages, and benefitsdecreased 3% quarter over quarter on a percentage of revenues basis.
25
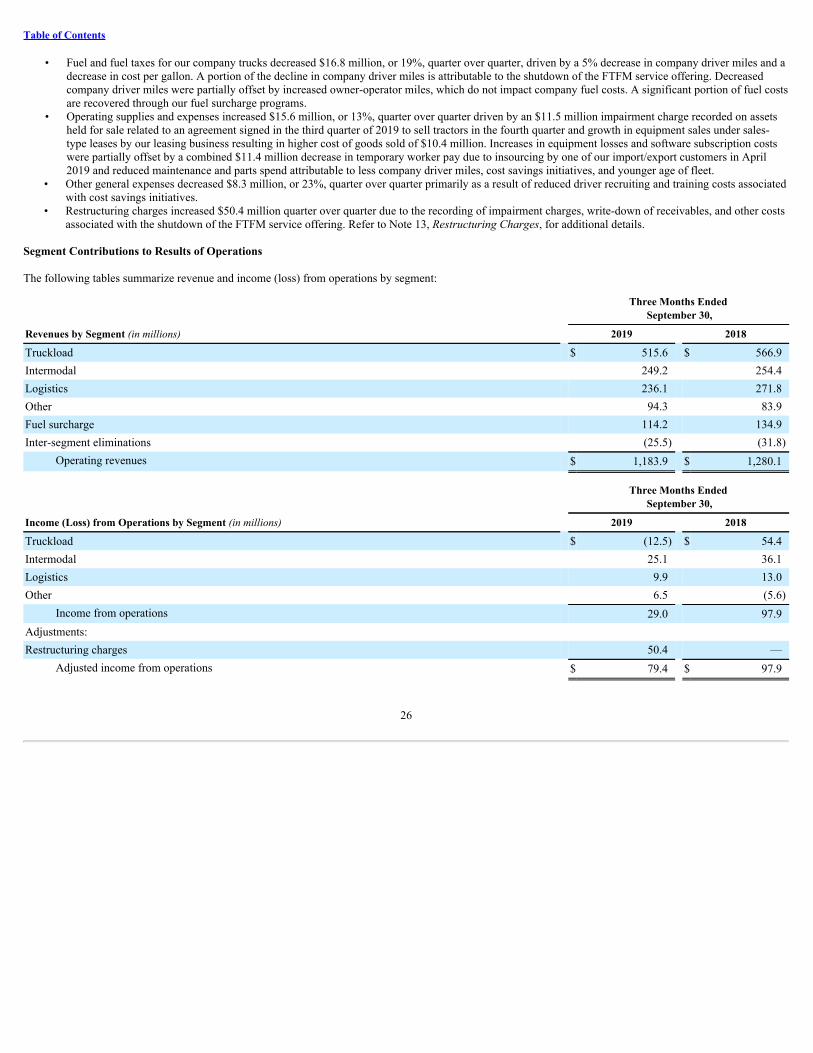
Table of Contents
• Fuel and fuel taxes for our company trucks decreased $16.8 million, or 19%, quarter over quarter, driven by a 5% decrease in company driver miles and adecrease in cost per gallon. A portion of the decline in company driver miles is attributable to the shutdown of the FTFM service offering. Decreasedcompany driver miles were partially offset by increased owner-operator miles, which do not impact company fuel costs. A significant portion of fuel costsare recovered through our fuel surcharge programs.
• Operating supplies and expenses increased $15.6 million, or 13%, quarter over quarter driven by an $11.5 million impairment charge recorded on assetsheld for sale related to an agreement signed in the third quarter of 2019 to sell tractors in the fourth quarter and growth in equipment sales under sales-type leases by our leasing business resulting in higher cost of goods sold of $10.4 million. Increases in equipment losses and software subscription costswere partially offset by a combined $11.4 million decrease in temporary worker pay due to insourcing by one of our import/export customers in April2019 and reduced maintenance and parts spend attributable to less company driver miles, cost savings initiatives, and younger age of fleet.
• Other general expenses decreased $8.3 million, or 23%, quarter over quarter primarily as a result of reduced driver recruiting and training costs associatedwith cost savings initiatives.
• Restructuring charges increased $50.4 million quarter over quarter due to the recording of impairment charges, write-down of receivables, and other costsassociated with the shutdown of the FTFM service offering. Refer to Note 13, Restructuring Charges, for additional details.
Segment Contributions to Results of Operations
The following tables summarize revenue and income (loss) from operations by segment:
Three Months Ended
September 30,
Revenues by Segment (in millions) 2019 2018
Truckload $ 515.6 $ 566.9Intermodal 249.2 254.4Logistics 236.1 271.8Other 94.3 83.9Fuel surcharge 114.2 134.9Inter-segment eliminations (25.5) (31.8)
Operating revenues $ 1,183.9 $ 1,280.1
Three Months Ended
September 30,
Income (Loss) from Operations by Segment (in millions) 2019 2018
Truckload $ (12.5) $ 54.4Intermodal 25.1 36.1Logistics 9.9 13.0Other 6.5 (5.6)
Income from operations 29.0 97.9Adjustments: Restructuring charges 50.4 —
Adjusted income from operations $ 79.4 $ 97.9
26

Table of Contents
Truckload
The following table presents our key performance indicators for our Truckload segment for the periods indicated, consistent with how revenues and expenses arereported internally for segment purposes. Descriptions of the four quadrants that make up our Truckload segment are as follows:
• Dedicated standard - Transportation services with equipment devoted to customers under long-term contracts utilizing standard dry van trailingequipment.
• Dedicated specialty - Transportation services with equipment devoted to customers under long-term contracts utilizing bulk, temperature controlled,flatbed, straight truck, and other specialty equipment.
• For-hire standard - Transportation services of one-way shipments utilizing standard dry van trailing equipment.• For-hire specialty - Transportation services of one-way shipments utilizing bulk, temperature controlled, flatbed, straight truck, and other specialty
equipment.
Three Months Ended
September 30,
2019 2018
Dedicated standard Revenues (excluding fuel surcharge) (1) $ 82.3 $ 81.2 Average trucks (2) (3) 1,807 1,671 Revenue per truck per week (4) $ 3,515 $ 3,792
Dedicated specialty Revenues (excluding fuel surcharge) (1) $ 93.4 $ 95.9 Average trucks (2) (3) 2,100 2,107 Revenue per truck per week (4) $ 3,433 $ 3,551
For-hire standard Revenues (excluding fuel surcharge) (1) $ 291.4 $ 306.3 Average trucks (2) (3) 6,003 6,094 Revenue per truck per week (4) $ 3,746 $ 3,921
For-hire specialty Revenues (excluding fuel surcharge) (1) $ 48.9 $ 81.6 Average trucks (2) (3) 1,009 1,521 Revenue per truck per week (4) $ 3,746 $ 4,180
Total Truckload Revenues (excluding fuel surcharge) (6) $ 515.6 $ 566.9 Average trucks (2) (3) 10,919 11,393 Revenue per truck per week (4) $ 3,648 $ 3,868 Average company trucks (3) 7,998 8,634 Average owner-operator trucks (3) 2,921 2,759 Trailers 35,612 38,026 Operating ratio (5) 102.4% 90.4%
(1) Revenues (excluding fuel surcharge), in millions, exclude revenue in-transit.(2) Includes company trucks and owner-operator trucks.(3) Calculated based on beginning and end of month counts and represents the average number of trucks available to haul freight over the specified timeframe.(4) Calculated excluding fuel surcharge and revenue in-transit, consistent with how revenue is reported internally for segment purposes, using weighted
workdays.(5) Calculated as segment operating expenses divided by segment revenues (excluding fuel surcharge) including revenue in-transit and related expenses at the
operating segment level.(6) Revenues (excluding fuel surcharge), in millions, include revenue in-transit at the operating segment level, and therefore does not sum with amounts
presented above.
27

Table of Contents
Truckload revenues (excluding fuel surcharge) decreased $51.3 million, approximately 9%, in the third quarter of 2019 compared to the same quarter in 2018. Bothvolume and price declined quarter over quarter with the decrease in volume having the largest impact. Decreased volume of 9% was the result of lower demandcompared to the third quarter of 2018 and the shutdown of our FTFM service offering in the third quarter of 2019. Fewer premium and promotional revenueopportunities contributed to the decline in price. Revenue per truck per week decreased $220, or 6%, quarter over quarter as a result of lower productivity.
Truckload income from operations decreased $66.9 million, approximately 123%, in the third quarter of 2019 compared to the same quarter in 2018 due mainly to$50.4 million of restructuring charges related to the shutdown of our FTFM service offering and an $11.5 million non-cash charge resulting from the impairment ofassets held for sale. The decline in Truckload volume noted above also contributed to the decrease in income from operations but was partially offset by areduction in driver and maintenance costs due to less company driver miles, cost savings initiatives, and younger age of fleet compared to the third quarter of 2018.
Intermodal
The following table presents our key performance indicators for our Intermodal segment for the periods indicated:
Three Months Ended
September 30,
2019 2018
Orders (1) 110,721 115,936Containers 23,014 21,288Trucks (2) 1,544 1,482Revenue per order (3) $ 2,259 $ 2,175Operating ratio (4) 89.9% 85.8%
(1) Based on delivered orders.(2) Includes company trucks and owner-operator trucks at the end of the period.(3) Calculated excluding fuel surcharge and revenue in-transit, consistent with how revenue is reported internally for segment purposes.(4) Calculated as segment operating expenses divided by segment revenues (excluding fuel surcharge) including revenue in-transit and related expenses at the
operating segment level.
Intermodal revenues (excluding fuel surcharge) decreased $5.2 million, approximately 2%, in the third quarter of 2019 compared to the same quarter in 2018.Revenue per order increased 4% due in part to 2018 contract carry-over, 2019 contract renewals and increased length of haul, but was offset by a decrease in ordersof 4%. The decrease in orders was largely the result of lower volumes in the overall domestic intermodal freight market.
Intermodal income from operations decreased $11.0 million, approximately 30%, in the third quarter of 2019 compared to the same quarter in 2018 primarily dueto reduced volume and increases in purchased transportation costs.
Logistics
The following table presents our key performance indicators for our Logistics segment for the periods indicated:
Three Months Ended
September 30,
2019 2018
Operating ratio (1) 95.8% 95.2%Brokerage revenues as a percentage of Logistics revenues (2) 86.9% 79.1%
(1) Calculated as segment operating expenses divided by segment revenues (excluding fuel surcharge) including revenue in-transit and related expenses at theoperating segment level.
(2) Revenues (excluding fuel surcharge), in millions, including revenue in-transit.
Logistics revenues (excluding fuel surcharge) decreased $35.7 million, approximately 13%, in the third quarter of 2019 compared to the same quarter in 2018. Thisdecrease was primarily the result of warehouse management functions being insourced by one of the Company's import/export customers in April 2019. Inaddition, reduced revenue per order was partially offset by brokerage volume growth of 11% compared to the same quarter in 2018.
28

Table of Contents
Logistics income from operations decreased $3.1 million, approximately 24%, in the third quarter of 2019 compared to the same quarter in 2018, primarily due tocompressed net revenue in brokerage.
Other
Included in Other was income from operations of $6.5 million in the third quarter of 2019, compared to a loss of $5.6 million in the same quarter in 2018. The$12.1 million change was driven by a decrease in performance-based incentive compensation due to a decline in Enterprise results.
Other Income (Expense)
Other expense decreased $0.3 million, approximately 12%, in the third quarter of 2019 compared to the same quarter in 2018 due primarily to a $0.5 millionincrease in interest income and a $0.4 million decrease in interest expense partially offset by a $0.6 million decrease in net foreign currency gains.
Income Tax Expense
Our provision for income taxes decreased $17.6 million, approximately 72%, in the third quarter of 2019 compared to the same quarter in 2018 due to lowertaxable income. The effective income tax rate was 26.2% for the three months ended September 30, 2019 compared to 25.8% for the same period last year.
Nine Months Ended September 30, 2019 Compared to Nine Months Ended September 30, 2018
Net Income
Net income decreased $93.0 million, approximately 51%, in the nine months ended September 30, 2019 compared to the same period in 2018, primarily due topretax restructuring and goodwill impairment charges associated with the FTFM service offering of $50.4 million and $34.6 million, respectively, and an $11.5million pretax impairment of held for sale assets. In addition, Truckload freight volume declined in 2019 due to lower demand. Adjusted net income decreased$34.0 million, approximately 18%.
Revenues
Enterprise operating revenues decreased $64.7 million, approximately 2%, in the nine months ended September 30, 2019 compared to the same period in 2018.
Factors contributing to the decreases in revenues were as follows:
• a $102.7 million decrease in Truckload revenues (excluding fuel surcharge) resulting from reduced Truckload volume due to lower market demand andthe shutdown of the FTFM service offering (which was substantially complete as of the end of August 2019), that will continue for the remainder of 2019;
• a $35.6 million decrease in fuel surcharge revenues primarily related to decreased Truckload volumes; and• a $36.7 million decrease in Logistics revenues (excluding fuel surcharge) primarily due to one of the Company's import/export customers insourcing their
warehouse management function in April 2019 combined with lower revenue per order within brokerage due to a compression in revenue per order,partially offset by a 15% increase in brokerage volumes.
The above factors were partially offset by:
• a $58.6 million increase in our Intermodal segment revenues (excluding fuel surcharge) primarily due to improved revenue per order and an increase inorder volume; and
• a $48.5 million increase in revenues from equipment sales by our leasing business under sales-type leases.
Enterprise revenues (excluding fuel surcharge) decreased $29.1 million, approximately 1%.
Income from Operations and Operating Ratio
Enterprise income from operations decreased $127.5 million, approximately 50%, in the nine months ended September 30, 2019 compared to the same period in2018, primarily due to $50.4 million of restructuring charges associated with the shutdown of the FTFM service offering, a $34.6 million FTFM goodwillimpairment, and an increase in FTFM operating losses, as operating losses exceeded prior year by $14.5 million. Additionally, an $11.5 million impairment of heldfor sale assets and lower demand negatively impacted profitability but were partially offset by reduced performance-based incentive compensation and Companybenefits, driver related costs, and other variable costs.
29

Table of Contents
Adjusted income from operations decreased $48.3 million, approximately 18%.
Enterprise operating ratio weakened on both a GAAP basis and an adjusted basis. Our operating ratio can be negatively impacted when our higher operating ratio,less asset-focused Logistics segment grows faster than our lower operating ratio, capital-intensive Truckload segment.
Key operating expense fluctuations are described below.
• Purchased transportation costs increased $57.0 million, or 4%, period over period. An increase in various Intermodal third-party costs, including rail,combined with order volume growth in our Logistics segment of 15% resulted in higher purchased transportation. This was partially offset by a decreasein purchased transportation cost per order within our Logistics segment based on additional carrier capacity in 2019 which led to the compression ofcarrier rates. The shutdown of the FTFM service offering, which was substantially complete as of August 2019, also contributed to the reduction ofpurchased transportation.
• Salaries, wages, and benefits decreased $86.6 million, or 9%, period over period, largely due to the elimination of salaries, wages, and benefits associatedwith warehouse management operations insourced by an import/export customer in April 2019, the shutdown of the FTFM service offering, and other costsavings initiatives. We expect to see continued favorability year over year in salaries, wages, and benefits as a result of these changes. Lowerperformance-based incentive compensation, Company benefit costs, and driver pay also contributed to the decrease. Salaries, wages, and benefitsdecreased 2% period over period on a percentage of revenues basis.
• Fuel and fuel taxes for our company trucks decreased $38.7 million, or 15%, period over period, driven by a 7% decrease in company driver miles and adecrease in cost per gallon. A portion of the decline in company driver miles is attributable to the shutdown of the FTFM service offering. Decreasedcompany driver miles were partially offset by increased owner-operator miles, which do not impact company fuel costs. A significant portion of fuel costsare recovered through our fuel surcharge programs.
• Depreciation and amortization increased $5.5 million, or 3%, period over period, primarily due to replacement tractors to achieve a younger age of fleetand prior year's investment in chassis and containers to support our Intermodal segment. Continuing to invest in replacement tractors is an important partof our strategic plan as it contributes to reduced maintenance and fuel costs and improves the overall driver experience.
• Operating supplies and expenses increased $54.1 million, or 15%, period over period. The increase was mainly due to an increase in equipment salesunder sales-type leases by our leasing business, resulting in higher cost of goods sold of $44.3 million, and an $11.5 million impairment charge recordedon assets held for sale related to an agreement signed in the third quarter of 2019 to sell tractors in the fourth quarter. Software subscription costs andIntermodal rail yard ramp storage expenses also increased compared to 2018. Increases in the above costs were offset by a combined $16.2 milliondecrease in temporary worker pay due to insourcing of one of our import/export customers in April 2019 and reduced maintenance and parts spendattributable to less company driver miles, cost savings initiatives, and younger age of fleet.
• Insurance and related expenses increased $8.6 million, or 12%, period over period. The increase was predominately due to an increase in the severity ofauto losses and related insurance premiums.
• Other general expenses decreased $22.1 million, or 20%, period over period as a result of decreased driver recruiting and training costs associated withcost savings initiatives, a $5.8 million decrease in litigation costs, and lower professional service fees of $3.1 million.
• Restructuring charges increased $50.4 million period over period due to the recording of impairment charges, write-down of receivables, and other costsassociated with the shutdown of the FTFM service offering. Refer to Note 13, Restructuring Charges, for additional details.
30

Table of Contents
Segment Contributions to Results of Operations
The following tables summarize revenue and income (loss) from operations by segment:
Nine Months Ended
September 30,
Revenues by Segment (in millions) 2019 2018
Truckload $ 1,582.3 $ 1,685.0Intermodal 746.6 688.0Logistics 707.0 743.7Other 290.0 237.0Fuel surcharge 350.2 385.8Inter-segment eliminations (85.4) (84.1)
Operating revenues $ 3,590.7 $ 3,655.4
Nine Months Ended
September 30,
Income (Loss) from Operations by Segment (in millions) 2019 2018
Truckload $ 18.6 $ 162.2Intermodal 75.5 90.7Logistics 29.4 31.2Other 6.2 (26.9)
Income from operations 129.7 257.2Adjustments: Litigation — 5.8Goodwill impairment 34.6 —Restructuring charges 50.4 —
Adjusted income from operations $ 214.7 $ 263.0
31

Table of Contents
Truckload
The following table presents our key performance indicators for our Truckload segment for the periods indicated, consistent with how revenues and expenses arereported internally for segment purposes. Descriptions of the four quadrants that make up our Truckload segment are as follows:
• Dedicated standard - Transportation services with equipment devoted to customers under long-term contracts utilizing standard dry van trailingequipment.
• Dedicated specialty - Transportation services with equipment devoted to customers under long-term contracts utilizing bulk, temperature controlled,flatbed, straight truck, and other specialty equipment.
• For-hire standard - Transportation services of one-way shipments utilizing standard dry van trailing equipment.• For-hire specialty - Transportation services of one-way shipments utilizing bulk, temperature controlled, flatbed, straight truck, and other specialty
equipment.
Nine Months Ended
September 30,
2019 2018
Dedicated standard Revenues (excluding fuel surcharge) (1) $ 250.8 $ 237.7 Average trucks (2) (3) 1,806 1,637 Revenue per truck per week (4) $ 3,607 $ 3,780
Dedicated specialty Revenues (excluding fuel surcharge) (1) $ 281.9 $ 304.5 Average trucks (2) (3) 2,132 2,279 Revenue per truck per week (4) $ 3,435 $ 3,478
For-hire standard Revenues (excluding fuel surcharge) (1) $ 859.9 $ 901.2 Average trucks (2) (3) 6,079 6,096 Revenue per truck per week (4) $ 3,674 $ 3,848
For-hire specialty Revenues (excluding fuel surcharge) (1) $ 188.4 $ 241.6 Average trucks (2) (3) 1,304 1,551 Revenue per truck per week (4) $ 3,752 $ 4,052
Total Truckload Revenues (excluding fuel surcharge) (6) $ 1,582.3 $ 1,685.0 Average trucks (2) (3) 11,321 11,563 Revenue per truck per week (4) $ 3,628 $ 3,793 Average company trucks (3) 8,433 8,833 Average owner-operator trucks (3) 2,888 2,730 Trailers 35,612 38,026 Operating ratio (5) 98.8% 90.4%
(1) Revenues (excluding fuel surcharge), in millions, exclude revenue in-transit.(2) Includes company trucks and owner-operator trucks.(3) Calculated based on beginning and end of month counts and represents the average number of trucks available to haul freight over the specified timeframe.(4) Calculated excluding fuel surcharge and revenue in-transit, consistent with how revenue is reported internally for segment purposes, using weighted
workdays.(5) Calculated as segment operating expenses divided by segment revenues (excluding fuel surcharge) including revenue in-transit and related expenses at the
operating segment level.(6) Revenues (excluding fuel surcharge), in millions, include revenue in-transit at the operating segment level, and therefore does not sum with amounts
presented above.
32

Table of Contents
Truckload revenues (excluding fuel surcharge) decreased $102.7 million, approximately 6%, in the nine months ended September 30, 2019 compared to the sameperiod in 2018. A decline in volume of 8% was partially offset by a 2% increase in price. Decreased volume was the result of a decrease in demand which drovelower productivity, as well as the shutdown of our FTFM service offering in the third quarter of 2019. Price increased period over period due to contract carry-overand 2019 rate renewals, despite fewer promotional and premium revenue opportunities. Revenue per truck per week decreased $165, or 4%, period over period as aresult of lower productivity driven primarily by lower freight volumes.
Truckload income from operations decreased $143.6 million, approximately 89%, in the nine months ended September 30, 2019 compared to the same period in2018. This decrease was primarily due to $50.4 million of restructuring charges related to the shutdown of our FTFM service offering, the $34.6 million FTFMgoodwill impairment, an additional $14.5 million in operating losses within FTFM through the third quarter of 2019 compared to the same period in 2018, and the$11.5 million non-cash charge resulting from the impairment of assets held for sale. Lower volumes, as discussed above, also contributed to the decrease but werepartially offset by a reduction in driver and maintenance related costs.
Intermodal
The following table presents our key performance indicators for our Intermodal segment for the periods indicated:
Nine Months Ended
September 30,
2019 2018
Orders (1) 329,505 329,014Containers 23,014 21,288Trucks (2) 1,544 1,482Revenue per order (3) $ 2,258 $ 2,070Operating ratio (4) 89.9% 86.8%
(1) Based on delivered orders.(2) Includes company trucks and owner-operator trucks at the end of the period.(3) Calculated excluding fuel surcharge and revenue in-transit, consistent with how revenue is reported internally for segment purposes.(4) Calculated as segment operating expenses divided by segment revenues (excluding fuel surcharge) including revenue in-transit and related expenses at the
operating segment level.
Intermodal revenues (excluding fuel surcharge) increased $58.6 million, approximately 9%, in the nine months ended September 30, 2019 compared to the sameperiod in 2018. The increase was driven by a 9% increase in revenue per order primarily resulting from 2018 contract carry-over, 2019 contract renewals andincreased length of haul, while orders remained flat period over period.
Intermodal income from operations decreased $15.2 million, approximately 17%, in the nine months ended September 30, 2019 compared to the same period in2018. Revenue growth, due to the increase in revenue per order noted above, was more than offset by higher purchased transportation, equipment depreciation, andrail ramp storage costs. Asset utilization was also unfavorable compared to the same period of 2018.
Logistics
The following table presents our key performance indicators for our Logistics segment for the periods indicated:
Nine Months Ended
September 30,
2019 2018
Operating ratio (1) 95.8% 95.8%Brokerage revenues as a percentage of Logistics revenues (2) 83.6% 78.3%
(1) Calculated as segment operating expenses divided by segment revenues (excluding fuel surcharge) including revenue in-transit and related expenses at theoperating segment level.
(2) Revenues (excluding fuel surcharge), in millions, including revenue in-transit.
Logistics revenues (excluding fuel surcharge) decreased $36.7 million, approximately 5%, in the nine months ended September 30, 2019 compared to the sameperiod in 2018, primarily due to one of the Company's import/export customers
33

Table of Contents
insourcing their warehouse management function in April 2019. In addition, reduced revenue per order was partially offset by brokerage volume growth of 15%.
Logistics income from operations decreased $1.8 million, approximately 6%, in the nine months ended September 30, 2019 compared to the same period in 2018,primarily due to compressed net revenue in brokerage and reduced volumes within our import/export business.
Other
Our Other segment recorded income from operations of $6.2 million in the nine months ended September 30, 2019, compared to a loss of $26.9 million in the sameperiod in 2018. Factors contributing to increased income include a reduction in performance-based incentive compensation, the $5.8 million settlement of a lawsuitthat challenged Washington State labor law compliance in 2018, and a $4.6 million increase in income from operations from our leasing business driven byincreased lease activity.
Other Expense (Income)
Other expense decreased $1.4 million, approximately 15%, in the nine months ended September 30, 2019 compared to the same period in 2018, primarily from a$3.7 million increase in interest income and a $0.3 million decrease in net foreign currency losses, partially offset by the 2018 recognition of a $2.5 million pre-taxgain related to our ownership interest in PSI and a $0.1 million increase in interest expense. See Note 5, Investments, for more information on PSI.
Income Tax Expense
Our provision for income taxes decreased $33.1 million, approximately 52%, in the nine months ended September 30, 2019 compared to the same period in 2018due to lower taxable income. The effective income tax rate was 25.3% for the nine months ended September 30, 2019 compared to 25.8% for the same period lastyear.
34

Table of Contents
LIQUIDITY AND CAPITAL RESOURCES
Our primary uses of cash are working capital requirements, capital expenditures, dividend payments, and debt service requirements. Additionally, we may use cashfor acquisitions and other investing and financing activities. Working capital is required principally to ensure we are able to run the business and have sufficientfunds to satisfy maturing short-term debt and operational expenses. Our capital expenditures consist primarily of transportation equipment and informationtechnology.
Historically, our primary source of liquidity has been cash flow from operations. In addition, we have a $250.0 million revolving credit facility and a $200.0million accounts receivable facility. We anticipate that cash generated from operations, together with amounts available under our credit facilities, will besufficient to meet our requirements for the foreseeable future. To the extent additional funds are necessary to meet our long-term liquidity needs as we continue toexecute our business strategy, we anticipate that these funds will be obtained through additional indebtedness, additional equity offerings, or a combination of thesepotential sources of funds. Our ability to fund future operating expenses and capital expenditures, as well as our ability to meet future debt service obligations orrefinance our indebtedness will depend on our future operating performance, which will be affected by general economic, financial, and other factors beyond ourcontrol.
The following table presents our cash and debt outstanding as of the dates shown:
(in millions) September 30, 2019 December 31, 2018
Cash and cash equivalents $ 437.1 $ 378.7Marketable securities 47.4 51.3
Total cash, cash equivalents, and marketable securities $ 484.5 $ 430.0
Debt: Senior notes $ 400.0 $ 400.0Equipment financing 1.3 5.0Finance leases 5.3 6.9
Total debt (1) $ 406.6 $ 411.9
(1) Debt on our consolidated balance sheets is presented net of deferred financing costs.
Debt
At September 30, 2019, we were in compliance with all financial covenants and financial ratios under our credit agreements and the indentures governing oursenior notes. See Note 7, Debt and Credit Facilities, for information about our short-term and long-term financing arrangements.
Cash Flows
The following table summarizes, for the periods indicated, the changes to our cash flows provided by (used in) operating, investing, and financing activities.
Nine Months Ended
September 30,
(in millions) 2019 2018
Net cash provided by operating activities $ 470.3 $ 410.1Net cash used in investing activities (355.6) (222.1)Net cash used in financing activities (56.3) (66.7)
Nine Months Ended September 30, 2019 Compared to Nine Months Ended September 30, 2018
Operating Activities
Cash provided by operating activities increased $60.2 million, approximately 15%, in the first nine months of 2019 compared to the same period in 2018, drivenprimarily by the reclassification of proceeds from lease receipts from investing activities with the adoption of ASC 842 and the net change in working capitalbalances, partially offset by the decrease in net income as
35

Table of Contents
adjusted for non-cash items. Non-cash restructuring charges related to the shutdown of the FTFM service offering were $43.3 million in the first nine months of2019 and primarily included charges for the impairment of tangible and intangible assets including equipment, customer lists and other customer related assets, andsoftware.
Investing Activities
Cash used in investing activities increased $133.5 million, approximately 60%, in the first nine months of 2019 compared to the same period in 2018. The increasein cash used was driven by the increase in net capital expenditures and the reclassification of proceeds from lease receipts to operating activities with the adoptionof ASC 842, partially offset by increased sales of marketable securities.
Capital Expenditures
The following table sets forth, for the periods indicated, our net capital expenditures.
Nine Months Ended
September 30,
(in millions) 2019 2018
Transportation equipment $ 308.6 $ 268.1Other property and equipment 42.8 22.3Proceeds from sale of property and equipment (38.8) (74.6)
Net capital expenditures $ 312.6 $ 215.8
Expenditures for transportation equipment and other property and equipment increased $40.5 million and $20.5 million, respectively, in the first nine months of2019 compared to the same period in 2018 driven by increased tractor purchases, land, buildings, and improvements spend, and capitalized IT costs. Proceeds fromsale of property and equipment decreased $35.8 million primarily as a result of reduced tractor sales. See Note 11, Commitments and Contingencies, forinformation on our firm commitments to purchase transportation equipment.
Financing Activities
Cash used in financing activities decreased $10.4 million, approximately 16%, in the first nine months of 2019 compared to the same period in 2018. The maindriver of the decrease in cash used was the $11.6 million decrease in payments on debt and finance lease obligations, partially offset by a $1.8 million increase individends paid in 2019 compared to 2018.
Other Considerations that Could Affect Our Results, Liquidity, or Capital Resources
Driver Capacity and Wage Cost
Our professional driver workforce is one of our most valuable assets. Recruiting and retaining sufficient numbers of qualified drivers is challenging in anincreasingly competitive driver market and has a significant impact on our operating costs and ability to serve our customers. Changes in the demographiccomposition of the workforce, alternative employment opportunities that become available in the economy, and individual drivers’ desire to be home morefrequently can affect availability of drivers and increase the wages our drivers require.
Factors that Could Result in a Goodwill Impairment
Goodwill is tested for impairment at least annually using both the discounted cash flow method and the guideline public company method in calculating the fairvalues of our reporting units. Key inputs used in the discounted cash flow approach include growth rates for sales and operating profit, perpetuity growthassumptions, and discount rates. As interest rates rise, the calculated fair values of our reporting units will decrease, which could impact the results of our goodwillimpairment tests.
We will perform our annual evaluation of goodwill for impairment as of October 31, 2019, with such analysis expected to be finalized during the fourth quarter. Aspart of our annual process of updating our goodwill impairment evaluation, we will assess the impact of current operating results and our resulting managementactions to determine whether they have an impact on the long-term valuation of reporting units and the related recoverability of our goodwill. A triggering eventoccurred during the second quarter of 2019 that resulted in impairment of all goodwill related to our FTFM reporting unit. See further discussion in Note 6,Goodwill and Other Intangible Assets.
36

Table of Contents
Off-Balance Sheet Arrangements
We have no arrangements that meet the definition of off-balance sheet arrangements.
Contractual Obligations
See the disclosure under the heading “Management’s Discussion and Analysis of Financial Condition and Results of Operations — Contractual Obligations” in theAnnual Report on Form 10-K for the year ended December 31, 2018 for our contractual obligations as of December 31, 2018. There were no material changes toour contractual obligations during the nine months ended September 30, 2019.
CRITICAL ACCOUNTING POLICIES
We have reviewed our critical accounting policies and considered whether any new critical accounting estimates or other significant changes to our accountingpolicies require any additional disclosures. We have found the disclosures made in our Annual Report on Form 10-K for the year ended December 31, 2018 arestill current other than goodwill related to our FTFM reporting unit which has now been fully impaired. See Note 6, Goodwill and Other Intangible Assets foradditional discussion.
Item 3. Quantitative and Qualitative Disclosures about Market Risk
Our market risks have not changed significantly from the market risks reported in our Annual Report on Form 10-K for the year ended December 31, 2018.
Item 4. Controls and Procedures
Evaluation of Disclosure Controls and Procedures
Our management, including our Chief Executive Officer and Chief Financial Officer, has evaluated the effectiveness of our disclosure controls and procedures (asdefined in Rules 13a-15(e) and 15d-15(e) under the Securities Exchange Act of 1934, as amended), as of the end of the period covered by this report. Based uponthat evaluation, our Chief Executive Officer and Chief Financial Officer have concluded that our disclosure controls and procedures were effective as of the end ofthe period covered by this report.
Changes in Internal Control
There were no changes in our internal control over financial reporting (as defined in Rules 13a-15(f) and 15d-15(f) under the Securities Exchange Act of 1934, asamended) during the fiscal quarter covered by this report, that have materially affected, or are reasonably likely to materially affect, our internal control overfinancial reporting.
37

Table of Contents
PART II. OTHER INFORMATIONItem 1. Legal Proceedings
For information relating to legal proceedings, see Note 11, Commitments and Contingencies, which is incorporated herein by reference.
Item 1A. Risk Factors
There have been no material changes from the risk factors disclosed in the Annual Report on Form 10-K for the year ended December 31, 2018.
Item 2. Unregistered Sales of Equity Securities and Use of Proceeds
The following table sets forth information regarding the purchases of our equity securities made by or on behalf of us or any affiliated purchaser (as defined inExchange Act Rule 10b-18) during the three months ended September 30, 2019:
Issuer Purchases of Equity Securities
2019 Total Number of Shares
Purchased Average Price Paid per
Share
Total Number of SharesPurchased as Part of Publicly
Announced Plans or Programs
Maximum Approximate DollarValue of Shares that May Yet Be
Purchased Under the Plans orPrograms
July 1 - July 31 — $ — — $ —August 1 - August 31 — — — —September 1 - September 30 — — — —
Total — $ — — $ — Limitation Upon Payment of Dividends
The 2018 Credit Facility includes covenants limiting our ability to pay dividends or make distributions on our capital stock if a default exists under the 2018 CreditFacility or would be caused by giving effect to such dividend.
Item 3. Defaults Upon Senior Securities
Not applicable.
Item 4. Mine Safety Disclosures
Not applicable.
Item 5. Other Information
None.
38

Table of Contents
Item 6. Exhibits
ExhibitNumber Exhibit Description
31.1* Certification pursuant to Rule 13a-14(a) or 15d-14(a), as adopted pursuant to Section 302 of the Sarbanes-Oxley Act of 2002
31.2* Certification pursuant to Rule 13a-14(a) or 15d-14(a), as adopted pursuant to Section 302 of the Sarbanes-Oxley Act of 2002
32.1** Certification pursuant to 18 U.S.C. Section 1350, as adopted pursuant to Section 906 of the Sarbanes-Oxley Act of 2002
32.2** Certification pursuant to 18 U.S.C. Section 1350, as adopted pursuant to Section 906 of the Sarbanes-Oxley Act of 2002
101.INS*
XBRL Instance Document - The instance document does not appear in the interactive data file because its XBRL tags are embedded withinthe Inline XBRL document.
101.SCH* XBRL Taxonomy Extension Schema Document 101.CAL* XBRL Taxonomy Calculation Linkbase Document 101.DEF* XBRL Taxonomy Extension Definition Linkbase Document 101.LAB* XBRL Taxonomy Extension Labels Linkbase Document 101.PRE* XBRL Taxonomy Extension Presentation Linkbase Document
104* The cover page from the Company's Quarterly Report on Form 10-Q for the quarter ended September 30, 2019, formatted in Inline XBRL* Filed herewith.** Furnished herewith.
39

Table of Contents
SIGNATURE
Pursuant to the requirements of the Securities Exchange Act of 1934, the registrant, Schneider National, Inc., has duly caused this report to be signed on its behalfby the undersigned thereunto duly authorized.
SCHNEIDER NATIONAL, INC.
Date: October 31, 2019 /s/ Stephen L. Bruffett Stephen L. Bruffett Executive Vice President and Chief Financial Officer (Duly Authorized Officer and Principal Financial Officer)
40
Exhibit 31.1
Certification of Chief Executive Officer Pursuant to Exchange Act Rule 13a-14(a),as Adopted Pursuant to Section 302 of the Sarbanes-Oxley Act of 2002
I, Mark B. Rourke, certify that:
1. I have reviewed this Quarterly Report on Form 10-Q of Schneider National, Inc.;
2. Based on my knowledge, this report does not contain any untrue statement of a material fact or omit to state a material fact necessary to make the statementsmade, in light of the circumstances under which such statements were made, not misleading with respect to the period covered by this report;
3. Based on my knowledge, the financial statements, and other financial information included in this report, fairly present in all material respects the financialcondition, results of operations and cash flows of the registrant as of, and for, the periods presented in this report;
4. The registrant’s other certifying officer(s) and I are responsible for establishing and maintaining disclosure controls and procedures (as defined in Exchange ActRules 13a-15(e) and 15d-15(e)) and internal control over financial reporting (as defined in Exchange Act Rules 13a-15(f) and 15d-15(f)) for the registrant andhave:
(a) Designed such disclosure controls and procedures, or caused such disclosure controls and procedures to be designed under our supervision, to ensure thatmaterial information relating to the registrant, including its consolidated subsidiaries, is made known to us by others within those entities, particularlyduring the period in which this report is being prepared;
(b) Designed such internal control over financial reporting, or caused such internal control over financial reporting to be designed under our supervision, toprovide reasonable assurance regarding the reliability of financial reporting and the preparation of financial statements for external purposes inaccordance with generally accepted accounting principles;
(c) Evaluated the effectiveness of the registrant’s disclosure controls and procedures and presented in this report our conclusions about the effectiveness ofthe disclosure controls and procedures, as of the end of the period covered by this report based on such evaluation; and
(d) Disclosed in this report any change in the registrant’s internal control over financial reporting that occurred during the registrant’s most recent fiscalquarter (the registrant’s fourth fiscal quarter in the case of an annual report) that has materially affected, or is reasonably likely to materially affect, theregistrant’s internal control over financial reporting; and
5. The registrant’s other certifying officer(s) and I have disclosed, based on our most recent evaluation of internal control over financial reporting, to theregistrant’s auditors and the audit committee of the registrant’s board of directors (or persons performing the equivalent functions):
(a) All significant deficiencies and material weaknesses in the design or operation of internal control over financial reporting which are reasonably likely toadversely affect the registrant’s ability to record, process, summarize and report financial information; and
(b) Any fraud, whether or not material, that involves management or other employees who have a significant role in the registrant’s internal control overfinancial reporting.
Date: October 31, 2019 /s/ Mark B. Rourke Mark B. Rourke Chief Executive Officer and President (Principal Executive Officer)

Exhibit 31.2
Certification of Chief Financial Officer Pursuant to Exchange Act Rule 13a-14(a),as Adopted Pursuant to Section 302 of the Sarbanes-Oxley Act of 2002
I, Stephen L. Bruffett, certify that:
1. I have reviewed this Quarterly Report on Form 10-Q of Schneider National, Inc.;
2. Based on my knowledge, this report does not contain any untrue statement of a material fact or omit to state a material fact necessary to make the statementsmade, in light of the circumstances under which such statements were made, not misleading with respect to the period covered by this report;
3. Based on my knowledge, the financial statements, and other financial information included in this report, fairly present in all material respects the financialcondition, results of operations and cash flows of the registrant as of, and for, the periods presented in this report;
4. The registrant’s other certifying officer(s) and I are responsible for establishing and maintaining disclosure controls and procedures (as defined in Exchange ActRules 13a-15(e) and 15d-15(e)) and internal control over financial reporting (as defined in Exchange Act Rules 13a-15(f) and 15d-15(f)) for the registrant andhave:
(a) Designed such disclosure controls and procedures, or caused such disclosure controls and procedures to be designed under our supervision, to ensure thatmaterial information relating to the registrant, including its consolidated subsidiaries, is made known to us by others within those entities, particularlyduring the period in which this report is being prepared;
(b) Designed such internal control over financial reporting, or caused such internal control over financial reporting to be designed under our supervision, toprovide reasonable assurance regarding the reliability of financial reporting and the preparation of financial statements for external purposes inaccordance with generally accepted accounting principles;
(c) Evaluated the effectiveness of the registrant’s disclosure controls and procedures and presented in this report our conclusions about the effectiveness ofthe disclosure controls and procedures, as of the end of the period covered by this report based on such evaluation; and
(d) Disclosed in this report any change in the registrant’s internal control over financial reporting that occurred during the registrant’s most recent fiscalquarter (the registrant’s fourth fiscal quarter in the case of an annual report) that has materially affected, or is reasonably likely to materially affect, theregistrant’s internal control over financial reporting; and
5. The registrant’s other certifying officer(s) and I have disclosed, based on our most recent evaluation of internal control over financial reporting, to theregistrant’s auditors and the audit committee of the registrant’s board of directors (or persons performing the equivalent functions):
(a) All significant deficiencies and material weaknesses in the design or operation of internal control over financial reporting which are reasonably likely toadversely affect the registrant’s ability to record, process, summarize and report financial information; and
(b) Any fraud, whether or not material, that involves management or other employees who have a significant role in the registrant’s internal control overfinancial reporting.
Date: October 31, 2019 /s/ Stephen L. Bruffett Stephen L. Bruffett Executive Vice President and Chief Financial Officer (Principal Financial Officer)
Exhibit 32.1
Certification of Chief Executive Officer Pursuant to 18 U.S.C. Section 1350, as AdoptedPursuant to Section 906 of the Sarbanes-Oxley Act Of 2002
In connection with the Quarterly Report on Form 10-Q of Schneider National, Inc. (the “Company”), for the quarterly period ended September 30, 2019 as filedwith the Securities and Exchange Commission on the date hereof (the “Report”), I, Mark B. Rourke, Chief Executive Officer and President of the Company,certify, pursuant to 18 U.S.C. Section 1350, as adopted pursuant to Section 906 of the Sarbanes-Oxley Act of 2002, that, to my knowledge:
(1) The Report fully complies with the requirements of Section 13(a) or 15(d) of the Securities Exchange Act of 1934, as amended; and
(2) The information contained in the Report fairly presents, in all material respects, the financial condition and results of operations of the Company.
Date: October 31, 2019 /s/ Mark B. Rourke Mark B. Rourke Chief Executive Officer and President (Principal Executive Officer)

Exhibit 32.2
Certification of Chief Financial Officer Pursuant to 18 U.S.C. Section 1350, as AdoptedPursuant to Section 906 of the Sarbanes-Oxley Act Of 2002
In connection with the Quarterly Report on Form 10-Q of Schneider National, Inc. (the “Company”), for the quarterly period ended September 30, 2019 as filedwith the Securities and Exchange Commission on the date hereof (the “Report”), I, Stephen L. Bruffett, Executive Vice President and Chief Financial Officer ofthe Company, certify, pursuant to 18 U.S.C. Section 1350, as adopted pursuant to Section 906 of the Sarbanes-Oxley Act of 2002, that, to my knowledge:
(1) The Report fully complies with the requirements of Section 13(a) or 15(d) of the Securities Exchange Act of 1934, as amended; and
(2) The information contained in the Report fairly presents, in all material respects, the financial condition and results of operations of the Company.
Date: October 31, 2019 /s/ Stephen L. Bruffett Stephen L. Bruffett Executive Vice President and Chief Financial Officer (Principal Financial Officer)