united states cancer registries fda meeting of pediatric subcommittee of the anti-infective drugs...
TRANSCRIPT

United States Cancer Registries
FDA Meeting of Pediatric Subcommittee of the Anti-Infective
Drugs Advisory Committee
October 30, 2003
Phyllis A. Wingo, PhD, MS

Outline of Presentation
Cancer registry programs in the United States
Data available
Data quality issues
United States Cancer Statistics (USCS), including childhood cancers
Follow-up
Summary

Cancer Registry Programs in the
United States

History of Cancer Registration in the United States
1930's -First hospital based registries1941 - Connecticut Cancer Registry 1971 - SEER Program1987 - NAACCR 1990 - National Cancer Data Base1992 - National Program of Cancer
Registries 2000 - CDC and NCI Memorandum of
Understanding2002 - United States Cancer Statistics

Surveillance Epidemiology and End Results (SEER) Program
NCI 1973+9 States and 6
metropolitan areas
26% population coverage
AK HI
SEERSEER/NPCR (2000+)

National Program of Cancer Registries (NPCR)
CDC 1995+45 states,
3 territories, District of Columbia
96% population coverage
NPCRNPCR/SEER
AK HI

Cancer Registries Amendment Act (PL 102-515)
Passed by Congress October 1992
Authorized establishment of National Program of Cancer Registries (NPCR)
Set requirements for funded central registries

Requirements of Cancer Registries Amendment Act
Statewide, population-based registry
Statewide legislation/regulations
Compliance with standardsCompletenessTimelinessQuality
Uniform data elements, uniform format
Statewide annual report

Legislation and Regulations
Authorizing legislation supports existence of central registries
State regulations:- Comprehensive reporting - Access to records- Reporting of uniform data- Protection of confidentiality- Access to data by researchers- Authorization to conduct research
- Protection from liability
Data available in
population-based registries in the United States

Reportable Cancer Case
Defined as "each form of invasive cancer with the exception of basal cell and squamous cell carcinoma of the skin and each form of in situ cancer except for carcinoma in situ of the cervix uteri"

Data Items
Demographic Information, including at a minimum:NameAddress at diagnosisCensus tractRace and Spanish/Hispanic originSexBirth dateSocial security number

Data Items (Continued)
Clinical Information, including at a minimum:Date of diagnosisDate of admission/first contactSource of informationDate and type of first course of
definitive treatment (surgery)Date of deathUnderlying cause of death

Data Items (Continued)
Pathologic Information, including at a minimum:Primary siteMorphology Type, behavior, and
gradeSequence numberLateralityDiagnostic confirmation

Data Quality Issues

NPCR Standards for Completeness
Standard processes for measuring completeness:
Case sharing with all bordering states
Case reporting from all facilities providing cancer screening, diagnosis, and treatment
Case finding audits
Death clearance and follow-back
Duplicate records protocol

NPCR Standards for Timeliness
Standard data items for measuring timeliness:
Dates case report sent to central registry received by central registry loaded into central registry database
Date tumor record available in central registry

NPCR Standards for Completeness and Timeliness
Within 24 months, <3% death certificate only cases ≤0.1% of records are duplicates
90% of unduplicated, expected, malignant cases within 12 months
95% of unduplicated, expected, malignant cases within 24 months

NPCR Standard for Quality
Within 12 months of the close of the dx year, 97% of the cases pass an NPCR prescribed set of standard data edits.
Within 24 months of the close of the dx year, 99% of the cases pass an NPCR prescribed set of standard data edits.

North American Association of Central Cancer Registries (NAACCR)
Uniform data standards for cancer registration
Education and training
Certification
Data publication
Data use

1997
1998
*North American Association of Central Cancer Registries
2000
2002
NAACCR*-Certified State Cancer Registries by Year of Data Submission
DCDC
DCDC

United States Cancer Statistics, 2000 Incidence

Joint Publication of National, Regional, and State Cancer Incidence Data
United States Cancer Statistics (USCS)
2000 incidence data
Crude and age-adjusted rates per 100,000
95% CI 84% population
coverage

USCS – Eligibility Criteria
High quality data> 90% completeness of case ascertainment< 5% death certificate-only cases> 97% records pass EDITS< 3% records missing information on race< 2% records missing information on sex
and age 41 statewide and 6 metropolitan area cancer
registries met criteria

Registry Programs Meeting Quality Criteria 2000
PUERTORICO
AK
HAWAII
CA
ID
WA
MT
WY
UT
CO
AZNM
TX
OK
KS
NE
SD
ND MN
WI
IA
ILOHIN
KY
WVVA
NC
GA
FL
ALMS
MO
AR
LA
NV
MI
PNNJ
NY MA
VT
NH
ME
TN
SC
MDDE
CT RI
DC
OR
Atlanta
Detroit
SanFrancisco/Oakland
LosAngeles
Seattle/Puget Sound
San Jose/Monterey
REPUBLICof Palau
7
VIRGINISLANDS

USCS - Content
Section 1: National cancer incidence data by site, sex and race 84% coverage US population
84% White 81% Black 91% Asian / Pacific Islander
> 1 million new cases > 10,000 new cases among children 0-19
years old
Section 2
Section 3
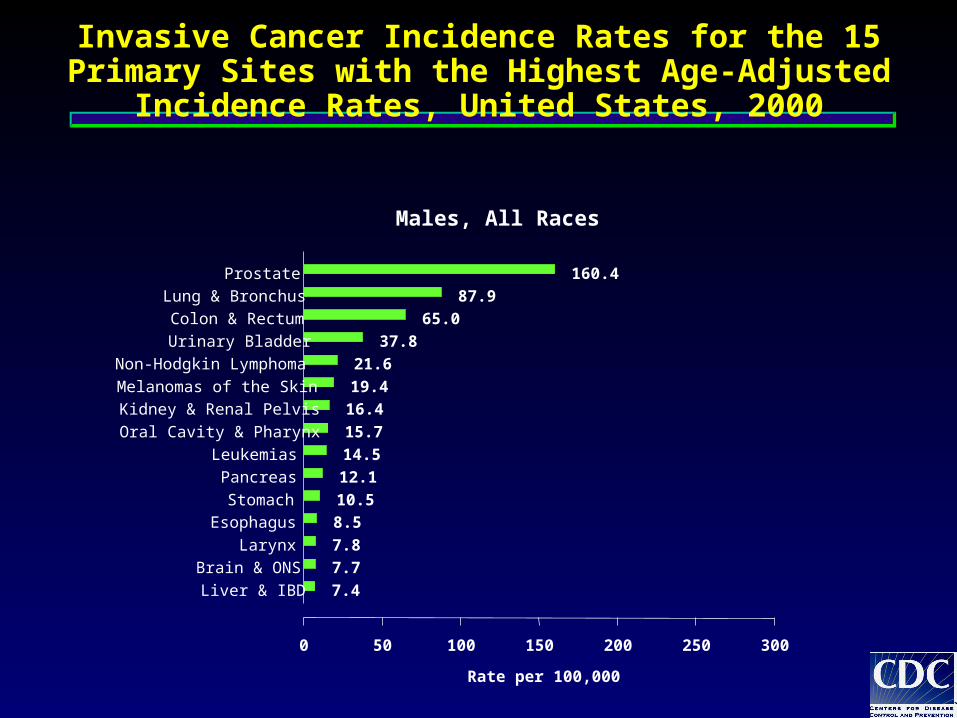
Invasive Cancer Incidence Rates for the 15 Primary Sites with the Highest Age-Adjusted Incidence Rates,
United States, 2000
Liver & IBD
Brain & ONS
Larynx
Esophagus
Stomach
Pancreas
Leukemias
Oral Cavity & Pharynx
Kidney & Renal Pelvis
Melanomas of the Skin
Non-Hodgkin Lymphoma
Urinary Bladder
Colon & Rectum
Lung & Bronchus
Prostate
0 50 100 150 200 250 300
7.4
7.7
7.8
8.5
10.5
12.1
14.5
15.7
16.4
19.4
21.6
37.8
65.0
87.9
160.4
Males, All Races
Rate per 100,000

Invasive Cancer Incidence Rates for the 15 Primary Sites with the Highest Age-Adjusted Incidence Rates,
United States, 2000
Brain & ONS
Oral Cavity & Pharynx
Kidney & Renal Pelvis
Leukemias
Cervix Uteri
Pancreas
Urinary Bladder
Thyroid
Melanomas of the Skin
Non-Hodgkin Lymphoma
Ovary
Corpus & Uterus, NOS
Colon & Rectum
Lung & Bronchus
Breast
0 50 100 150 200 250 300
5.5
6.0
8.4
8.7
9.2
9.5
9.8
10.7
12.4
15.4
15.8
23.5
47.0
52.5
128.9
Females, All Races
Rate per 100,000

Lymphoma Incidence Rates by Sex, United States, 2000
Males Females
Rate Count Rate Count
Lymphoma 22 23,092 14 26,052
Hodgkin 19 12
Non-Hodgkin 3 1
Age-adjusted rates (2000) per 100,000

Invasive Skin Cancer Incidence Rates by Sex, United States, 2000
Males Females
Rate Count Rate Count
Skin* 25 26,052 18 23,162
Melanoma of skin 3 2
Non-epi skin 22 15
Age-adjusted rates (2000) per 100,000*Excluding basal and squamous cell skin cancer

Invasive Cancer Incidence Rates for Childhood Cancers, by Sex, Ages 0-19, 2000
Males Females
ICCC category Rate Count Rate Count
All sites combined 166 5,674 147 4,782
I Leukemia 42 36
II Lymphoma 28 20
III CNS 30 25
IV Sympath nerv sys 8 7
V Retinoblastoma 3 2
VI Renal tumors 6 7
Age-adjusted rates (2000) per 1,000,000

Males Females
ICCC category
VII Hepatic tumors 2 2
VIII Malignant bone 9 8
IX Soft-tissue sarcoma 13 10
X Germ-cell tropho 13 10
XI Carcinomas 11 19
XII Other 1 1
Not classified ^ 1
Age-adjusted rates (2000) per 1,000,000
Invasive Cancer Incidence Rates for Childhood Cancers, by Sex, Ages 0-19, 2000

USCS - Content
Section 1: National cancer incidence data by site, sex and race
Section 2: Cancer incidence data by states, census division, sex and race Regions > 80% population coverage
Pacific 100%, Mt. 100% W.N. Central 96% E.N. Central 100% Mid. Atlantic 100% New England 91% South 57%
Section 3

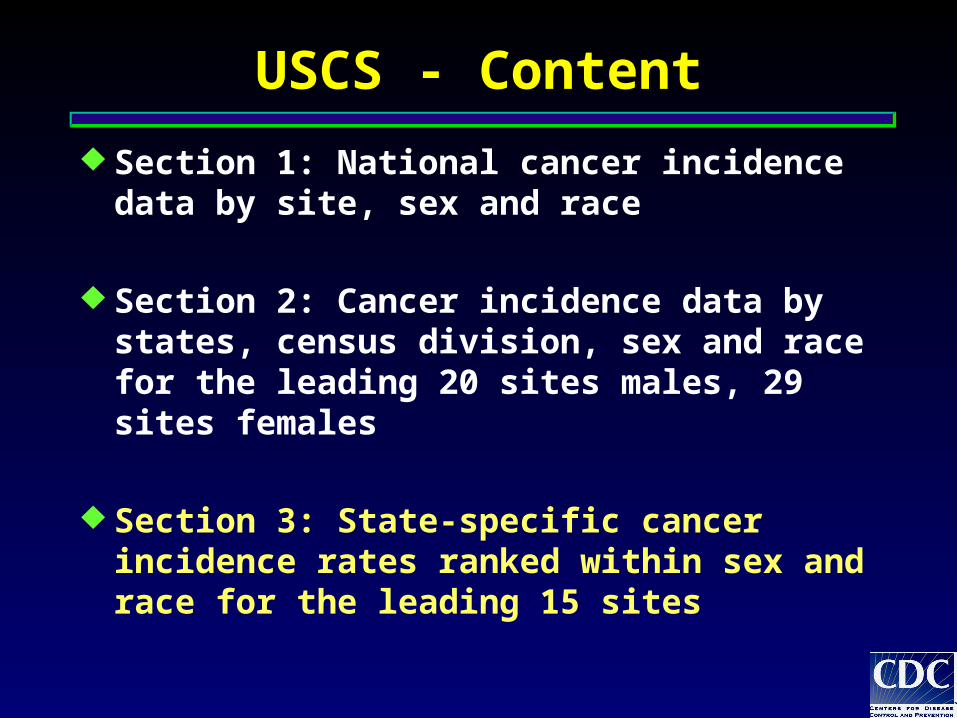
USCS - Content
Section 1: National cancer incidence data by site, sex and race
Section 2: Cancer incidence data by states, census division, sex and race for the leading 20 sites males, 29 sites females
Section 3: State-specific cancer incidence rates ranked within sex and race for the leading 15 sites

Follow-up in Population-Based Registries in the United States

Follow-up to Determine Vital Status
To confirm deaths among cancer patients, all NPCR and SEER registries link with:
State death certificates files
Social security files
National Death Index (NDI)

Follow-up to Determine Vital Status
To confirm alive status among cancer patients, all SEER (9 states) and selected NPCR registries (very few) link with:
Social security files
Hospital discharge data
Medicare (CMS)
Voter registration
Motor vehicle registration
Other

Summary
Population-based cancer registries in all 50 states and the District of Columbia.
CTQ varies across states
Follow-up good for death status, limited for alive status

Summary
Strong nationwide cancer registry infrastructure in place
Data available at national, regional, state and local levels for: Monitoring burden of disease Planning comprehensive cancer control
programs Conducting special research studies

www.cdc.gov/cancer/npcrwww.cdc.gov/cancer/npcr

Future Plans
Expand population-based coverage Include other racial and ethnic groups Estimated of case counts at the national and
regional levels Trend data Pediatric cancers Mortality data

Frequency DistributionAges 0-19, 2000
ICCC category
NPCR
N=9,882
SEER
N=1,823
I Leukemia 25% 27%
II Lymphoma 15 14
III CNS 18 17
IV Sympathetic nervous system 5 5
V Retinoblastoma 2 2
VI Renal tumors 4 4
VII Hepatic tumors 1 1
VIII Malignant bone tumors 5 5

Frequency Distribution, continuedAges 0-19, 2000
ICCC category
NPCR
N=9,882
SEER
N=1,823
IX Soft-tissue sarcoma 8 % 9 %
X Germ-cell trophoblastic 7 7
XI Carcinomas 9 9
XII Other 0 0
Not classified 0 0
Total 100 100

Lymphoma and Reticuloendothelial Neopl, 2000 Age-Specific and Age-Adjusted Incidence Rates
8
15
24
49
16
24
7
13
23
48
14
23
0
10
20
30
40
50
60
70
0-4 5-9 10-14 15-19 0-14 0-19
Age at Diagnosis
NPCR
SEER
Rates are per 1,000,000 and are age-adjusted to the 2000 US standard population

Acute Lymphocytic Leukemia, 2000Age-Specific and Age-Adjusted Incidence Rates
59
30
16 15
34
29
59
35
17 18
36
32
0
10
20
30
40
50
60
70
1-4 5-9 10-14 15-19 0-14 0-19
Age at Diagnosis
NPCR
SEER
0-04
Rates are per 1,000,000 and are age-adjusted to the 2000 US standard population