united states department of agriculture the infant formula ... · the brand of formula provided by...
TRANSCRIPT

The Infant Formula MarketConsequences of a Change in the WIC Contract Brand
Victor OliveiraElizabeth FrazãoDavid Smallwood
EconomicResearchReportNumber 124
August 2011
United States Department of Agriculture
EconomicResearchService

The U.S. Department of Agriculture (USDA) prohibits discrimination in all its programs and activities on the basis of race, color, national origin, age, disability, and, where applicable, sex, marital status, familial status, parental status, religion, sexual orientation, genetic information, political beliefs, reprisal, or because all or a part of an individual's income is derived from any public assistance program. (Not all prohibited bases apply to all programs.) Persons with disabilities who require alternative means for communication of program information (Braille, large print, audiotape, etc.) should contact USDA's TARGET Center at (202) 720-2600 (voice and TDD).
To file a complaint of discrimination write to USDA, Director, Office of Civil Rights, 1400 Independence Avenue, S.W., Washington, D.C. 20250-9410 or call (800) 795-3272 (voice) or (202) 720-6382 (TDD). USDA is an equal opportunity provider and employer.
Recommended citation format for this publication: Oliveria, Victor, Elizabeth Frazão, and David Smallwood, The Infant Formula Market: Consequences of a Change in the WIC Contract Brand, ERR-124, U.S. Department of Agriculture, Economic Research Service, August 2011.
Photo: USDA/ERS.
ww
ww
w.wwer
sr .usda.govoo
Visit Our Website To Learn More!For more ERS information and research
on the WIC program:
www.ers.usda.gov/briefing/wic

United StatesDepartmentof Agriculture
www.ers.usda.gov
A Report from the Economic Research Service
Abstract
The Special Supplemental Nutrition Program for Women, Infants, and Children (WIC) is the major purchaser of infant formula in the United States. To reduce cost to the WIC program, each State awards a sole-source contract to a formula manufacturer to provide its product to WIC participants in the State. As part of the contract, the WIC State agency receives rebates from the manufacturers. In this study, we use 2004-09 Nielsen scanner-based retail sales data from over 7,000 stores in 30 States to examine the effect of winning a WIC sole-source contract on infant formula manufacturers’ market share in supermarkets. We fi nd that the manufacturer holding the WIC contract brand accounted for the vast majority—84 percent—of all formula sold by the top three manufacturers. The impact of a switch in the manufacturer that holds the WIC contract was consider-able. The market share of the manufacturer of the new WIC contract brand increased by an average 74 percentage points after winning the contract. Most of this increase was a direct effect of WIC recipients switching to the new WIC contract brand. However, manu-facturers also realized a spillover effect from winning the WIC contract whereby sales of formula purchased outside of the program also increased.
Keywords: WIC, Special Supplemental Nutrition Program for Women, Infants, and Children, infant formula, rebate, sole-source contracts, contract brand, spillover effect, ERS, USDA
Acknowledgments
The authors thank Sid Clemans (Offi ce of Budget and Program Analysis, USDA), Zoë Neuberger (Center on Budget and Policy Priorities), Edward Harper, Linda Clarke, Lisa Southworth, Hayes Brown, Karen Meade, and Dennis Ranalli (Food and Nutrition Service, USDA), David Betson (Notre Dame University), Art Burger (Burger, Carroll & Associates, Inc), and Phil Kaufman and Ephraim Leibtag (Economic Research Service, USDA) for their comments on earlier drafts; Laurie True (California WIC Association), Brian S. Kohler (Lexis Nexis), and William H. Kaericher (Beech-Nut Nutrition Corporation) for their insights about the infant formula market and marketing issues; Priscilla Smith for editorial support, and Wynnice Pointer-Napper for design support.
Victor Oliveira, [email protected] Elizabeth Frazão, [email protected] Smallwood, [email protected]
The Infant Formula MarketConsequences of a Change in the WIC Contract Brand
Economic Research Report Number 124
August 2011

iiThe Infant Formula Market: Consequences of a Change in the WIC Contract Brand / ERR-124
Economic Research Service/USDA
Contents
Summary. . . . . . . . . . . . . . . . . . . . . . . . . . . . . . . . . . . . . . . . . . . . . . . . . . . iii
Introduction . . . . . . . . . . . . . . . . . . . . . . . . . . . . . . . . . . . . . . . . . . . . . . . . . 1
WIC and the Infant Formula Rebate Program. . . . . . . . . . . . . . . . . . . . . 3 Overview of the WIC Program . . . . . . . . . . . . . . . . . . . . . . . . . . . . . . . . . 3 WIC’s Infant Formula Rebate Program . . . . . . . . . . . . . . . . . . . . . . . . . . 3
Characteristics of the Infant Formula Market . . . . . . . . . . . . . . . . . . . . . 6
Infant Formula Data . . . . . . . . . . . . . . . . . . . . . . . . . . . . . . . . . . . . . . . . . 10 Representativeness of the ERS sample data . . . . . . . . . . . . . . . . . . . . . . 10 States included in the analysis. . . . . . . . . . . . . . . . . . . . . . . . . . . . . . . . . 11 Stores included in the analysis . . . . . . . . . . . . . . . . . . . . . . . . . . . . . . . . 11 Time period used in the analysis. . . . . . . . . . . . . . . . . . . . . . . . . . . . . . . 12 Types of formula included in the analysis. . . . . . . . . . . . . . . . . . . . . . . . 13 Identifying WIC contract-brand formula . . . . . . . . . . . . . . . . . . . . . . . . 14
Contract Brand Status and Market Share. . . . . . . . . . . . . . . . . . . . . . . . 16
Effect of a Change in the WIC Contract Brand on Market Share . . . . 19
Does WIC Limit Infant Formula Selection? . . . . . . . . . . . . . . . . . . . . . . 26
Retail Prices Are Not Behind Increases in Contract Brands’ Market Share. . . . . . . . . . . . . . . . . . . . . . . . . . . . . . 28
Discussion . . . . . . . . . . . . . . . . . . . . . . . . . . . . . . . . . . . . . . . . . . . . . . . . . . 31
References . . . . . . . . . . . . . . . . . . . . . . . . . . . . . . . . . . . . . . . . . . . . . . . . . . 33
Appendix—Comparison of the Infant Formula Market Based on the Nielsen’s Supermarket Subsample and Nielsen’s National-Level Data Set . . . . . . . . . . . . . . . . . . . . . . . . . . . . . . . . . . . . . . . 35

iiiThe Infant Formula Market: Consequences of a Change in the WIC Contract Brand / ERR-124
Economic Research Service/USDA
Summary
What Is the Issue?
USDA’s Special Supplemental Nutrition Program for Women, Infants, and Children (WIC) is the major purchaser of infant formula in the United States. In addition to other benefi ts, the program provides participants with a food instrument, typically a voucher or electronic benefi ts transfer (EBT) card, that participants redeem for food—formula, in the case of infants—in authorized retail stores. To reduce the cost of infant formula to WIC, Federal law requires that WIC State agencies enter into cost-containment contracts with manufacturers of infant formula. Typically, WIC State agencies obtain substantial discounts in the form of rebates from infant formula manufac-turers for each can of formula purchased through the program. In exchange for rebates, a manufacturer is given the exclusive right to provide its product to WIC participants in the State. These sole-source contracts are awarded on the basis of competitive bids. The brand of formula provided by WIC varies by State depending on which manufacturer holds the contract for that State.
What is the impact of WIC and its sole-source infant formula rebate program on market share? Does the program and its use of sole-source contracts have economic implications that extend beyond WIC? In this report, we examine the effect of the program on the infant formula market in supermarkets. We explore situations in which the holder of the WIC contract in a State switched from one manufacturer to another.
What Were the Study Findings?
The effect of WIC and its sole-source infant formula contracts on market share was signifi cant. Following are some key fi ndings among the 30 States that saw a shift in WIC contract brand from 2004 to 2009:
• The manufacturer of the WIC contract brand accounted for 84 percent of all milk-based formula (the predominant type of formula) sold by the three major formula manufacturers in supermarkets.
• The market share of the manufacturer of the new WIC contract brand increased by an average 74 percentage points after the contract change. This increase was almost completely offset by the loss in market share of the manufacturer that lost the contract.
Most of the shift in market share was a direct effect of WIC recipi-ents switching to the new WIC contract brand.
Some of the shift in market share was due to spillover effects whereby sales of the contract manufacturer’s formula purchased outside the WIC program also increased.
• The change in market shares was not explained by changes in the retail prices of the new WIC contract brand relative to the former WIC contract brand.

ivThe Infant Formula Market: Consequences of a Change in the WIC Contract Brand / ERR-124
Economic Research Service/USDA
How Was the Study Conducted?
Our study is based on 2004-09 data from the Nielsen Company comprising weekly observations from store-based (point of sale) scanner data from over 7,000 supermarkets in 30 States that experienced a switch in the manufacturer that held the WIC contract. Supermarkets are a key component of the infant formula market, accounting for nearly two-thirds of all infant formula sales. We used a pre/post methodology to determine the overall effect on market share when the holder of the WIC contract changed. We compared each manu-facturer’s market share in a State in the 52 weeks prior to the contract change to its market share in weeks 13 to 52 after the contract change (weeks 0-12 were excluded to account for the potential lag in converting WIC participants to the new contract brand of formula during the transition period).
1The Infant Formula Market: Consequences of a Change in the WIC Contract Brand / ERR-124
Economic Research Service/USDA
Introduction
WIC provides nutritious foods, nutrition education, and referrals to health and other social services to participants at no charge. WIC serves low-income pregnant, postpartum, and breastfeeding women, and infants and children up to age 5 who are at nutrition risk. WIC promotes breastfeeding as the optimal source of nutrition for infants, but provides free infant formula to mothers who choose not to breastfeed exclusively.
WIC is the major purchaser of infant formula in the United States. To reduce the cost of infant formula to the program, Federal law requires that WIC State agencies enter into cost-containment contracts with the manufacturers of infant formula. Typically, WIC State agencies obtain substantial discounts in the form of rebates from the manufacturers for each can of formula purchased through the program. In exchange for rebates, a manufacturer is given the exclusive right to provide its products to WIC participants in the State. These sole-source contracts are awarded on the basis of competitive bids: the fi rm offering the lowest net wholesale price (equal to the manufac-turer’s wholesale price minus the rebate) wins the WIC contract for that State. As a result, the brand of formula provided by WIC varies by State.
On average, WIC State agencies rebid their infant formula rebate contracts every 4 years, and in many States, the manufacturer that wins the contract—and thus the brand of formula provided through WIC—changes from one contract to the next. The overall objective of this report is to examine the effect of WIC’s rebate program and its use of sole-source contracts on the infant formula market in supermarkets by exploiting the natural experi-ments created when the WIC contract brand changes.1 Specifi cally, this study addresses the following fi ve questions:
1. What is the WIC contract brand’s share of infant formula sales in supermarkets?
2. What is the effect of a change in the WIC contract brand on market shares?
3. Do infant formula manufacturers realize spillover effects from winning the WIC contract?
4. Does WIC affect the selection of some brands of formula in supermarkets?
5. Are changes in the market share of the WIC contract brand associated with changes in its retail price?
It is important to note that this study is based on data on infant formula sales in stores that are more likely to have WIC redemptions (i.e., supermarkets), and do not capture formula sales in other types of stores that may be less affected by WIC (i.e., mass merchandisers without full supermarkets, ware-house clubs, drug stores, convenience stores, toy stores, and other channels).2 To the extent that WIC participants are more likely to redeem their food instruments in supermarkets, our fi ndings may overestimate WIC’s impact in the overall infant formula market. However, supermarkets are an impor-tant component of the overall infant formula market, accounting for about
1Throughout this report, “changes in the WIC contract brand” refers to when the holder of the WIC infant formula contract switches from one manufacturer to another. It does not refer to changes in the composition of a specifi c infant formula product.
2Although data on WIC redemptions by type of store are not available, we hypothesize that most purchases of WIC foods occur in supermarkets for several reasons: (1) since WIC State agencies establish minimum require-ments for the variety and quantity of foods that vendors must stock to be authorized for the program, supermar-kets are more likely than other stores to meet the minimum requirements; (2) supermarkets are likely to offer a better selection of WIC authorized foods such as cereal, and (3) WIC shoppers, who may shop at supermarkets for their non-WIC foods, are likely to combine their shopping trips.

2The Infant Formula Market: Consequences of a Change in the WIC Contract Brand / ERR-124
Economic Research Service/USDA
63 percent of all infant formula sales. So, assessing how WIC affects infant formula sales in supermarkets is key to understanding WIC’s impact on the entire infant formula market.
This study builds on previous ERS and ERS-funded research related to WIC and infant formula, that includes: a Report to Congress on the availability of infant formula by geographic area (Oliveira et al., 2001); an analysis of the effects of WIC and its infant formula rebate program on the retail prices of infant formula (Oliveira et al., 2004); the development of a model that provides the theoretical framework for the econometric analyses of retail prices for infant formula (Prell, 2006); an examination of trends in the factors affecting infant formula costs to the WIC program (Oliveira and Davis, 2006); an analysis on the effect of WIC’s sole-source contracts on the wholesale price of infant formula (Betson, 2009); and an examination of trends in infant formula rebates (Oliveira et al., 2010). In particular, this study expands an ERS-funded study by Huang and Perloff (2008) that looked at the effect that winning the WIC infant formula contract had on sales in the non-WIC market using data on powdered milk-based infant formula sales collected from a sample of 39 grocery stores in 1997-1999. Our study, based on 2004-09 data from over 7,000 supermarkets in 30 States, extends their analysis by examining liquid concentrate as well as powdered formula in different container sizes separately. Our data refl ect the introduction in the past decade of Docosahexaenoic acid and Arachidonic acid (DHA/ARA) supplemented formulas that now dominate the infant formula market. It is the fi rst large-scale study to quantify WIC’s overall effect, that is, the combined effect that winning the WIC infant formula contract has on sales in the WIC and non-WIC markets.
The next section provides a brief overview of WIC and the infant formula rebate program. The following section examines the characteristics of the infant formula market while the remaining sections present the results of the analysis.
3The Infant Formula Market: Consequences of a Change in the WIC Contract Brand / ERR-124
Economic Research Service/USDA
WIC and the Infant Formula Rebate Program
WIC is the Nation’s third-largest food assistance program in terms of expenditures, trailing only the Supplemental Nutrition Assistance Program (SNAP—formerly the Food Stamp Program) and the National School Lunch Program. In fi scal 2010, an average 9.2 million persons participated in WIC each month (USDA, 2010a). This included 2.2 million infants or over half of all infants born in the United States.
Overview of the WIC Program
WIC is based on the premise that early intervention programs during crit-ical times of growth and development can help prevent future medical and developmental problems. To participate in WIC, applicants must be either a pregnant woman, a nonbreastfeeding woman up to 6 months postpartum, a breastfeeding woman up to 1 year postpartum, an infant up to his/her fi rst birthday, or a child up to his/her fi fth birthday. The family income of WIC applicants must be at or below 185 percent of the Federal poverty guidelines. Applicants for the WIC program who participate in or who have certain family members who participate in SNAP, Medicaid, or the Temporary Assistance Program for Needy Families (TANF) are deemed to meet the income eligibility criterion automatically. Applicants must also be nutrition-ally at risk, as determined by a health professional such as a physician, nutri-tionist, or nurse and based on Federal guidelines.
WIC provides participants with a package of supplemental foods designed to address their nutritional needs. For nearly all of the study period examined in this report, the WIC food package for fully formula-fed infants less than 1 year of age provided up to a maximum monthly allowance of 806 reconstituted fl uid ounces of infant formula, equivalent to 26 reconstituted fl uid ounces per day.3
All States except Vermont and Mississippi distribute WIC foods, including infant formula, via the retail food delivery system.4 Under this system, partici-pants “purchase” the WIC food items from retail food stores at the full retail price using a food instrument (i.e., voucher, check, or EBT card) that speci-fi es the types and amounts of foods that can be purchased and the dates that the instrument can be used. In the case of infant formula, the food instrument also specifi es the brand of formula to be purchased, the form (powder, liquid concentrate, or ready-to-feed), the base (milk, soy, or protein hydrolysate) and can size (see box on “Infant Formulas”). WIC recipients are issued either a 1-, 2-, or 3-month supply of vouchers at any one time (7 CFR 246.12). Only those vendors (usually supermarkets, grocery stores, or pharmacies) authorized by the WIC State agency may transact and redeem food instruments. In 2008 (the latest data available), there were nearly 49,000 WIC-authorized food vendors nationwide (USDA, 2008).
WIC’s Infant Formula Rebate Program
Each WIC State agency operates its own infant formula rebate program and is responsible for negotiating rebate contracts with infant formula manufacturers (some States form multistate alliances to join in single rebate agreement). As a result, the conditions of the contract—including the amount of the rebate
3The interim rule revising the WIC food packages was published in December 2007; however, no States implemented the new food packages prior to January 2009. The new food packages revised age specifi cations for the infant food packages and established three feeding options within each infant food package—fully breastfed, partially breastfed, or fully formula fed. Each infant food package provides different amounts of infant formula depending on the infant’s age and feeding option. Among fully formula-fed infants, those younger than 4 months of age receive the same amount of formula under the new food package as under the old food package. However, fully formula-fed infants 4-5 months of age receive greater amounts of formula than before, while infants 6-11 months of age receive smaller amounts of infant formula under the new food package.
4Vermont uses a home delivery system whereby the WIC foods are delivered to the participant’s home, while Mississippi, parts of Chicago, IL, and two Indian Tribal Organizations State agencies use direct distribution whereby participants pick up their WIC foods from storage facilities operated by the State or local WIC agency.

4The Infant Formula Market: Consequences of a Change in the WIC Contract Brand / ERR-124
Economic Research Service/USDA
and the contract term (i.e., the period during which the infant formula rebate contract is in effect), as well as the manufacturer who holds the contract—will vary across States. Since the mid-1990s, only the three major infant formula manufacturers—Mead Johnson, Abbott, and Nestlé (now Gerber)—have held rebate contracts.5
Manufacturers designate the specifi c infant formula product—referred to as the primary contract brand—for which they submit a bid in response to a rebate solicitation and for which a contract is awarded by the WIC State agency. The WIC State agency must use the primary contract infant formula as the fi rst choice of issuance to the WIC participants in that State. However, winning infant formula bidders are required to supply and provide a rebate on all infant formulas they produce that the WIC State agency chooses to issue, except exempt infant formulas. That is, the WIC State agency may choose to
5As of February 2010, the brand name of Nestlé’s line of infant formu-las was changed to Gerber. This report retains the Nestlé label since the study period (2004-09) predated the brand name change.
Protein Base. Milk-based infant formulas, containing lactose and cow’s milk proteins, are the most widely used formula. Soy-based formulas, made with soy protein and free of lactose, provide an alternative protein source for infants with symptoms of lactose intolerance and are also used by parents seeking a vegetarian diet for their infants. A small proportion of infant formula uses protein hydrolysate as a base. As of 2004, most formulas are supplemented with the fatty acids docosahexaenoic acid (DHA) and arachidonic acid (ARA).
Specialized Formulas. There is a wide range of specialized infant formulas designed for infants with unique nutritional needs. For example, milk-based, lactose-free formulas are available for infants sensitive to lactose. Hypoallergenic formulas, including protein hydrolysate formulas, are available for infants with food protein allergies. Other types of specialized formulas in the marketplace include organic formulas, prebiotic formulas, probiotic formulas, formulas marketed to older infants (e.g., 9 to 24 months) or to younger infants (e.g., 0 to 3 months), as well as formulas to reduce colic, diarrhea, spit-up, fussiness, and gas.
Exempt Formulas. These formulas are labeled for use by an infant who has an inborn error of metabolism or a low birth weight, or who otherwise has an unusual medical or dietary problem (21 U.S. Code 350a) they are available for infants with special nutritional needs (e.g., premature infants) and medical disorders, such as phenylketonuria (PKU).
Product Form. Infant formulas come in three forms: powder (the least expensive form per reconstituted ounce), liquid concentrate, and ready-to-feed (the most expensive form per reconstituted ounce).
Package size. Formulas—particularly powdered forms—are available in a wide range of package sizes that differ by manufacturer and product. All liquid concentrate comes in 13-ounce cans.
Iron level. Formulas come in two different iron levels: added iron and low iron. The American Academy of Pediatrics (1999) recommends that formula-fed infants receive iron-fortifi ed formulas as a way of reducing the prevalence of iron defi ciency anemia. Prior to the recent revisions in the WIC food package, iron-fortifi ed infant formulas were routinely issued in WIC; all low-iron infant formulas issued through WIC required medical documentation. The new WIC food package disallows the issuance of all low-iron infant formulas to any infants.
Infant Formulas

5The Infant Formula Market: Consequences of a Change in the WIC Contract Brand / ERR-124
Economic Research Service/USDA
approve for issuance some, none, or all of the winning bidder’s other infant formula products. As a result, the specifi c infant formula products provided through WIC will vary across States, even in those States in which the same manufacturer holds the contract.6 All infant formulas (except exempt infant formula) produced by the manufacturer awarded the rebate contract are referred to as contract brand infant formulas.
Under special circumstances, WIC may also issue formula not manufactured by the WIC contract manufacturer. Such formula (referred to as noncontract infant formula) may be issued only with medical documentation provided by a licensed health care professional authorized to write medical prescriptions under State law that an infant has a condition that dictates the formula’s use. The only exception to this rule is that local WIC agencies may issue noncon-tract-brand infant formula without medical documentation in order to accom-modate religious eating patterns (65 Federal Register 51213-51229). WIC State agencies do not receive rebates from noncontract-brand infant formula (some States have disallowed any use of non-contract formula). In 2004 (the latest data available), noncontract-brand formula was estimated to account for 8 percent of all formula provided to WIC participants (U.S. Government Accountability Offi ce, 2006).
WIC State agencies reimburse the vendor for the full retail price of the formula purchased with WIC food instruments. The WIC State Agency then requests a rebate reimbursement from the manufacturer. As a result, the actual cost to WIC for each can of infant formula sold through the program is equal to the retail price minus the manufacturer’s rebate, or, expressed another way, the net wholesale price plus the retail markup.
Manufacturer’s rebates are generally quite large. Among contracts in effect in December 2008, the amount of the rebate as a percentage of the wholesale price (or average percentage discount) for powder was 85 percent (Oliveira et al., 2010).7 Thus, on average, WIC paid only 15 percent of the wholesale price for formula (plus the retail markup).
Rebates have been a major source of funds for WIC. For example, in fi scal year 2009, infant formula rebates totaled $1.9 billion compared to program expenditures of $6.5 billion post-rebate (USDA, 2010a and USDA, 2010b). Because WIC is a discretionary grant program funded annually by appropria-tions law, the number of participants that can be served each year depends on the annual appropriation and WIC’s operating costs. The savings generated by rebates are used to provide benefi ts to more participants within the same total budget. Since the mid-1990s, rebates have supported about one-quarter of all WIC- participants.
6For example, some States in which Mead Johnson held the WIC infant formula contract included Enfamil A.R. Lipil (a formula thickened with added rice starch targeted to infants who spit up frequently) on their list of allowable formula products while other States did not.
7The percentage discount is based on wholesale prices at the time of the bid opening. The contracts contain infl a-tionary provisions whereby in the event of an increase in the wholesale price after the bid opening, there is a cent-for-cent increase in the rebate amounts. Thus, if the wholesale price increases at any time during the life of the contract, the amount of the rebate increases and the average percentage discount received by WIC will be even greater.

6The Infant Formula Market: Consequences of a Change in the WIC Contract Brand / ERR-124
Economic Research Service/USDA
Characteristics of the Infant Formula Market
The information for this section comes from a proprietary report on national and regional trends in the infant formula market that was prepared for ERS by the Nielsen Company (2008). Nielsen used a variety of products and resources to develop estimates representing the entire U.S. infant formula market including sales in supermarkets, mass merchandisers, drug stores, convenience stores, and other outlets.
The U.S. infant formula market accounted for about $3.5 billion in sales in 2007. This was about the same as the previous year, and up slightly from 2004 and 2005 (fi g. 1). On the other hand, infant formula sales by volume (in reconstituted ounces) have trended downward in recent years (fi g. 2). Between 2004 and 2007, volume sales in reconstituted fl uid ounces fell about 5 percent. This decline is a continuation of a trend ERS identifi ed for the period 1994-2000 (Oliveira et al., 2004).
The infant formula market is highly concentrated. In 2008, three manufac-turers accounted for 98 percent of all dollar sales (fi g. 3). Abbott, maker
Figure 1
Infant formula dollar sales, 2004-07Billion dollars
Source: Nielsen Company, 2008. 2004 2005 2006 2007
0
1
2
3
4
Figure 2
Infant formula sales by volume, 2004-07Billion reconstituted ounces
Source: Nielsen Company, 2008. 2004 2005 2006 2007
0
5
10
15
20
25
30

7The Infant Formula Market: Consequences of a Change in the WIC Contract Brand / ERR-124
Economic Research Service/USDA
of the Similac product line (43 percent), and Mead Johnson, maker of the Enfamil line (40 percent), accounted for the bulk of dollar sales, while Nestlé, maker of the Good Start line, accounted for another 15 percent. Most of the remaining 2 percent of infant formula sales was accounted for by PBM Nutritionals, which produces the Bright Beginnings line of infant formulas as well as most of the private-label or store-brand formulas. PBM has never bid on a WIC contract.
Infant formula sales are shifting from supermarkets to other outlets. Supermarkets (including mass merchandisers with full supermarkets) accounted for 70 percent of all dollar sales in 2004, but only 63 percent in 2007 (fi g. 4). During this period, the share of sales in warehouse clubs increased from 10 percent to 13 percent and the share of sales in “all other” channels (i.e., outlets other than supermarkets, mass merchandisers, drug stores, and warehouse clubs)—almost doubled, increasing from less than 5 percent to 9 percent of all infant formula sales in 2007. This trend may refl ect the increase in online shopping for infant formula.
Figure 3
Share of infant formula dollar sales by manufacturer, 2008
Note: Sales figures for 2008 were annualized based on data for the first 6 months of the year. Data exclude Walmart.
Source: Nielsen Company, 2008.
Mead Johnson
Abbott
Nestlé
All other
40%
2%
15%
43%
Figure 4
Dollar sales by outlet, 2004-07Percent
Source: Nielsen Company, 2008.
2004 2005 2006 20070
20
40
60
80
100Supermarkets Mass merchandisers w/o supermarkets
All otherDrug storeWarehouse clubs

8The Infant Formula Market: Consequences of a Change in the WIC Contract Brand / ERR-124
Economic Research Service/USDA
Most formula is milk-based—comprising some 80 percent of dollar sales in 2008, up from 76 percent in 2004 (fi g. 5). Soy-based formula accounted for 14 percent of all dollar sales in 2008 compared to 17 percent in 2004. Other formula bases accounted for 6 to 7 percent of all 2004-08 sales.
Powder is the primary product form for infant formula sold in this country and its share of the market continues to grow. In 2008, powder comprised 83 percent of all dollar sales, up from 71 percent in 2004 (fi g. 6). During the same period, sales of liquid concentrate fell from 20 percent to only 10 percent of all formula sales, and ready-to-feed fell from 9 percent to 7 percent. The lower price of powder may be an important economic factor in its growth.8
One of the most important developments in the infant formula market in recent years was the introduction of formulas supplemented with the fatty
8Powder was about 14 percent less expensive than liquid concentrate on a per reconstituted fl uid ounce basis based on the relative prices of Mead Johnson’s Enfamil LIPIL, Ross’ Similac Advance, and Nestlé’s Good Start Supreme DHA & ARA in powder and liquid concen-trate as of September 2007.
Figure 5
Share of infant formula dollar sales by base, 2004-08Percent
Note: Sales figures for 2008 were annualized based on data for the first 6 months of the year. Data exclude Walmart.
Source: Nielsen Company, 2008.
OtherSoyMilk
2004 2005 2006 2007 20080
20
40
60
80
100
Figure 6
Share of infant formula dollar sales by form, 2004-08Percent
Note: Sales figures for 2008 were annualiized based on data for the first 6 months of the year. Data exclude Walmart.
Source: Nielsen Company, 2008.
Ready-to-useLiquid concentratePowder
2004 2005 2006 2007 20080
20
40
60
80
100

9The Infant Formula Market: Consequences of a Change in the WIC Contract Brand / ERR-124
Economic Research Service/USDA
acids docosahexaenoic acid (DHA) and arachidonic acid (ARA) which some studies have linked to improved vision and cognitive development in infants.9 Abbott fi rst introduced these formulas into their U.S. product lines in 2002, with Mead Johnson and Nestlé following in 2003. Although more expensive than unsupplemented formulas, sales of DHA/ARA-supplemented formulas increased rapidly, and by 2004 they accounted for 69 percent of all dollar sales. By 2008, DHA/ARA-supplemented formulas accounted for nearly all—98 percent—dollar sales (fi g. 7).
9The U.S. Food and Drug Administration (FDA) claims that the scientifi c evidence on whether the addition of DHA and ARA to infant formulas is benefi cial is mixed (U.S. Department of Health and Human Services, 2006). FDA states that “Some studies in infants suggest that including these fatty acids in infant formulas may have positive effects on visual function and neural development over the short term. Other studies in infants do not confi rm these benefi ts. There are no currently available published reports from clinical studies that address whether any long-term benefi cial effects exist.”
Figure 7
Share of infant formula dollar sales by DHA/ARA supplement status, 2004-2008Percent
DHA/ARA=Docosahexaenoic acid and Arachidonic acid.Note: Sales figures for 2008 were annualiized based on data for the first 6 months of the year. Data exclude Walmart.
Source: Nielsen Company, 2008.
Unsupplemented
DHA/ARA supplemented
2004 2005 2006 2007 20080
20
40
60
80
100

10The Infant Formula Market: Consequences of a Change in the WIC Contract Brand / ERR-124
Economic Research Service/USDA
Infant Formula Data
In fi scal 2008, ERS contracted with the Nielsen Company, Inc., for a license to access proprietary data on infant formula sales in grocery stores with sales over $2 million per year in the 48 contiguous States in its Scantrack StoreView point of sale data monitoring and analysis system. Nielsen Scantrack StoreView provides store-level weekly data on dollar sales, quanti-ties sold, infant formula product (universal product code or UPC), product characteristics (i.e., manufacturer, package size, physical form, product base, total yield), temporary price reductions, as well as various store characteris-tics. ERS obtained data for the period covering the week ending January 3, 2004, to the week ending April 4, 2009.
To maintain confi dentiality, Nielsen did not identify store names, chains, or street addresses. The sample of stores included traditional grocery stores and supermarkets as well as supercenters (i.e., a type of mass merchandiser that contains a full grocery within the store; examples include Super Kmart and Super Target). Sample stores did not include any Walmart supercenters because Walmart does not participate in the Scantrack system. The data also do not capture formula sold in drug stores, mass merchandisers without a full supermarket, toy stores, baby stores, or formula sold via the Internet.
The ERS sample was comprised of 13,715 supermarkets or 39 percent of all supermarkets with sales of $2 million or more (Progressive Grocer, 2008). Stores included in the ERS sample tended to be larger than the average super-market. Sales of infant formula in the stores comprising the ERS supermarket data set accounted for 70 percent of Nielsen’s estimate of infant formula dollar sales from all supermarkets and supercenters (including Walmart), and 44 percent of Nielsen’s estimate of infant formula dollar sales from all outlets—supermarkets, mass merchandisers, drug stores, convenience stores, etc.—in the United States.
Representativeness of the ERS sample data
As part of the agreement with Nielsen, ERS had access to individual store-level data on infant formula sales from only a subsample of stores in Nielsen’s database—those retailers who permitted store-level disclosure of their sales (i.e., releasable retailers). Because of various privacy and nondisclosure restrictions, individual store-level projection factors were not available to ERS. As a result, the data obtained from the individual stores included in this data set could not be weighted up to national estimates. This raises the question—are the stores in the ERS supermarket sample representative of all supermarkets in the United States? Although the answer to this ques-tion cannot be defi nitively ascertained, comparing the characteristics of the infant formula sales based on the data provided to ERS to those derived from Nielsen’s national-level retail infant formula data provides an indication of whether the ERS data are similar to national-level estimates.
As part of its contract with ERS, the Nielsen Company, Inc., provided a summary report of the entire U.S. infant formula market based primarily on Scantrack sales data from supermarkets, as well as mass merchandisers—both with and without full supermarkets—(excluding Walmart), drug stores, convenience stores,

11The Infant Formula Market: Consequences of a Change in the WIC Contract Brand / ERR-124
Economic Research Service/USDA
warehouse clubs, and dollar stores (Nielsen Company, 2008). For this summary report, Nielsen supplemented the Scantrak data with its Homescan data that provides food-purchase information from additional outlets from a panel of U.S. households (food-at-home purchases from all individuals in the household were captured using a scanning device in the home). The data from these two sources were projected up to derive national estimates.
ERS compared the characteristics of the infant formula market within the stores included in the ERS sample against the characteristics of the infant formula market at the national level, as provided by Nielsen (2008). In general, the mix of infant formula products in the ERS supermarket subsample was similar to the mix of products in the national formula market sample. That is, the share of formula sales (by both dollar sales and volume sales) by manufacturer, form, product base, DHA/ARA supplementation status, container size (for powder), and geographic region derived from the ERS supermarket subsample data closely mirrored that of the national infant formula market (see appendix). Because the Nielsen summary report did not provide State-level estimates for infant formula sales, it was not possible to do any State-level comparisons between the characteristics of formula sold in the supermarket subsample and the formula sold in all retail stores.
States included in the analysis
The ERS data set contained information on stores in each of the 48 contig-uous States and Washington, DC. However, because the focus of this report is to examine the effect of a change in WIC contract brand on the market, 19 States, in addition to Alaska and Hawaii, were dropped from the analysis sample (table 1) because they either:
(a) did not use the retail distribution system for WIC (2 States),
(b) did not award a new contract during the study period (3 States),
(c) did not experience a change in the WIC contract brand of formula because the same manufacturer that held the former contract also won the new contract (12 States), or
(d) the contract change happened either too early or too late in the 2004-09 study period such that the data did not contain a full year of either prechange or postchange data (two States).
The fi nal data set used for the analyses discussed in this report included data from stores in 30 States (including Washington, DC), as detailed in table 2.
Stores included in the analysis
Within the 30-State study sample, sales data were available from a total of 8,370 stores. However, we were concerned that data from stores that entered or exited the market, or that were closed for some period during the study period (e.g., for renovations or due to a change in ownership), could bias the results of the analysis. In order to ensure that the sample included only those stores that were in business for a full year before and a full year after the change in the WIC contract brand, we restricted the fi nal sample to those stores with 52 weeks of sales both before and after the change in the

12The Infant Formula Market: Consequences of a Change in the WIC Contract Brand / ERR-124
Economic Research Service/USDA
WIC contract. This restriction excluded from the study sample 989 stores (12 percent) that did not report any infant formula sales for 1 or more weeks during the year prior to and the year after the contract change.10 The fi nal data set consisted of 7,381 stores in the 30 States that had formula sales in every week for 1 year before and 1 year after the switch in the WIC infant formula contract brand (see table 2).
Time period used in the analysis
The start dates, expiration dates, and lengths of the contracts vary by State. To control for this variation, the study looked at each State’s infant formula market during the year prior to the contract change and the year after the contract change regardless of when the contract actually changed. We desig-nated the week in which the change occurred as week 0 and then numbered all other weeks sequentially from that point. For example, week -52 refers to 52 weeks (i.e., 1 year) prior to the contract change, and week 52 refers to 52 weeks (1 year) after the change.
In some States, vouchers issued prior to the contract change specify the “old” contract brand even if those vouchers are to be redeemed after the contract change.11 In those States, there is a transition period after the date the WIC contract brand changes when WIC vouchers for both the former and new contracted formulas can be redeemed. Further complicating matters, States issue vouchers for different time periods. In 2005, 23 of the 89 WIC State agencies issued food vouchers once every 3 months, 23 issued them every 2
10On average, the excluded stores reported no infant formula sales for 46 weeks during the 105-week study period.
11Every WIC voucher lists the spe-cifi c period during which the voucher can be used (for example, the voucher may include “First Day To Use” and “Last Day To Use” dates).
Table 1
States excluded from the analysis
State Reason for exclusion
Alaska Original Nielsen data set excluded AlaskaAlabama The same manufacturer held both the new and former contracts
Arkansas The same manufacturer held both the new and former contracts
Florida The same manufacturer held both the new and former contracts
Hawaii Original Nielsen data set excluded Hawaii
Indiana The same manufacturer held both the new and former contracts
Kentucky The same manufacturer held both the new and former contracts
Mississippi Mississippi does not use a retail food distribution system
Missouri No new contracts were awarded during 2004-08
Nebraska No new contracts were awarded during 2004-08
New Jersey The same manufacturer held both the new and former contracts
New Mexico The same manufacturer held both the new and former contracts
New York The same manufacturer held both the new and former contracts
North Carolina The same manufacturer held both the new and former contracts
North Dakota The same manufacturer held both the new and former contracts
Ohio The same manufacturer held both the new and former contracts
Oklahoma The same manufacturer held both the new and former contracts
Pennsylvania 52 weeks of data after the contract changed were not available
South Dakota No new contracts were awarded during 2004-08
Tennessee 52 weeks of data before the contract changed were not available
Vermont Vermont does not use a retail food distribution system
Source: USDA, Economic Research Service.

13The Infant Formula Market: Consequences of a Change in the WIC Contract Brand / ERR-124
Economic Research Service/USDA
months, 37 issued them on a monthly basis, and the remaining 6 issued them every 3 months or on an as needed basis (USDA, 2005). States that issue vouchers 3 months at a time will have longer transition periods than States that issue vouchers for shorter periods of time. To account for this transition period, we excluded the fi rst 3 months of data after the contract change (i.e., weeks 0 to 12) from some of the analyses, as noted in the text.
Types of formula included in the analysis
All of the analyses discussed in this report were limited to formula produced by the three major infant formula manufacturers—Mead Johnson, Abbott, and Nestlé—that held one or more rebate contracts during the study period.
Table 2
States included in the analyses
StateNumberof stores
Former WICcontract brand
New WICcontract brand
Date ofcontract change
Arizona 397 Mead Johnson Abbott 10/1/2007California 1,533 Abbott Mead Johnson 8/1/2007Colorado 286 Abbott Mead Johnson 1/1/2008Connecticut 154 Mead Johnson Nestlé 10/1/2006Delaware 54 Mead Johnson Abbott 10/1/2007District of Columbia 19 Mead Johnson Abbott 10/1/2007Georgia 481 Mead Johnson Abbott 10/1/2006Idaho 53 Mead Johnson Abbott 10/1/2007Illinois 365 Abbott Mead Johnson 2/1/2008Iowa 101 Mead Johnson Abbott 10/1/2007Kansas 79 Mead Johnson Abbott 10/1/2007Louisiana 114 Abbott Mead Johnson 10/1/2007Maine 69 Mead Johnson Nestlé 10/1/2006Maryland 344 Mead Johnson Abbott 10/1/2007Massachusetts 297 Mead Johnson Nestlé 10/1/2006Michigan 273 Abbott Mead Johnson 11/1/2006Minnesota 56 Mead Johnson Abbott 10/1/2007Montana 45 Mead Johnson Abbott 10/1/2007Nevada 144 Mead Johnson Abbott 10/1/2007New Hampshire 89 Mead Johnson Nestlé 10/1/2006Oregon 202 Mead Johnson Abbott 10/1/2007Rhode Island 35 Mead Johnson Nestlé 10/1/2006South Carolina 322 Abbott Nestlé 4/7/2005Texas 626 Mead Johnson Abbott 10/1/2007Utah 92 Mead Johnson Abbott 10/1/2007Virginia 598 Nestlé Abbott 7/1/2006Washington 353 Mead Johnson Abbott 10/1/2007West Virginia 68 Mead Johnson Abbott 10/1/2007Wisconsin 108 Abbott Nestlé 1/1/2006Wyoming 24 Mead Johnson Abbott 10/1/2007Total 7,381
Note: To be included in the analyses, stores must have reported some infant formula sales dur-ing both the 52-week precontract change period and the 52-week postcontract change period.
Sources: USDA, Economic Research Service calculations based on Nielsen supermarket scanner-based data and unpublished USDA, Food and Nutrition Service data.

14The Infant Formula Market: Consequences of a Change in the WIC Contract Brand / ERR-124
Economic Research Service/USDA
Infant formula produced by other manufacturers not participating in WIC’s infant formula rebate program, such as PBM, were not included in the anal-ysis. These other brands accounted for an average of only 2 percent of all dollar sales of formula throughout 2004-2008 (excluding sales at Walmart) (Nielsen, 2008).
This report focuses solely on milk-based formula in two forms—powder and liquid concentrate (thus, soy- and other-base formulas, as well as all ready-to-feed formulas were excluded from the analysis).12 Because both the can sizes and reconstitution factors for formula in powder form differ across manufac-turers and products, we converted all volumes to a standard unit—26 fl uid ounces of reconstituted formula, which represents WIC’s daily maximum allowance during the study period (it is also the equivalent of a 13-ounce (oz) can of liquid concentrate).
For this study, we grouped these formulas into the following three categories:
Powder formula in 12- to 16-oz containers—all powder formula purchased through WIC during the study period was sold in 12- to 16-oz containers. Some of the formula in this size container is also sold outside of the WIC program. Each State determines which of the contract brand products to offer to WIC participants in that State, and we were not able to determine the exact mix of products provided through WIC for each State during the entire study period, so we included all products. However, given the size of the WIC program, the powder formulas purchased through WIC will account for the vast majority of the sales in this size category.
Powder formula in non-WIC size containers—this category includes all powder formula sold in containers either smaller than 12 oz or larger than 16 oz. Since WIC does not provide formula in these sizes, all of the formula in this category is provided outside of WIC.
Liquid concentrate—Since liquid concentrate is only sold in 13-oz containers, this category includes both WIC and non-WIC sales of formula.
These three types of milk-based formulas accounted for 80 percent of all volume sales in the ERS 30-State data set during the 105-week study period (fi g. 8). Powder in 12- to 16-oz containers accounted for 55 percent of all sales, powder in other size containers accounted for 17 percent of sales, and liquid concentrate accounted for another 8 percent of sales.
Identifying WIC contract-brand formula
The ERS 30-State data set identifi ed every infant formula product sold in each store every week from January 2004 to April 2009. We used data provided by USDA’s Food and Nutrition Service (FNS)—the agency that administers the WIC program—to identify the State-specifi c WIC contract brand for the current contract and the previous contract (as used in this report, the term “WIC contract brand” refers to all the formula produced by the manufacturer that held the WIC infant formula contract in a State at a particular point in time). This allowed us to code each infant formula product
12Local WIC agencies are required to issue all infant formula in powder or liquid concentrate form. Ready-to-feed formulas are only authorized in certain situations, for example when: (1) the participant’s household has an unsani-tary or restricted water supply or poor refrigeration; (2) the person caring for the participant may have diffi culty in correctly diluting concentrated or powder forms; or (3) the WIC infant formula is only available in ready-to-feed (7 CFR 246.10).

15The Infant Formula Market: Consequences of a Change in the WIC Contract Brand / ERR-124
Economic Research Service/USDA
sold in a particular State each week based on whether the manufacturer held the WIC contract before or after the change in the contract brand:
New WIC contract brand—all formula produced by the manufac-turer awarded the most recent WIC contract.
Former WIC contract brand—all formula produced by the manufac-turer that held the previous WIC contract.
Other brand—all formula produced by the manufacturer that did not hold either the former or the new WIC contract.
For example, in Arizona, Abbott held the most recent WIC contract and Mead Johnson held the prior contract. Therefore, all infant formula produced by Abbott, regardless of point in time, was coded as “new WIC contract brand,” all formula produced by Mead Johnson was coded as “former WIC contract brand,” and all formula produced by Nestlé was coded as “other brand.”
Figure 8
Volume sales of infant formula by base and form, ERS 30-State data set
WIC=Special Supplemental Nutrition Program for Women, Infants, and Children.Note: Based on the 7,381 stores in the 30-State ERS data set during the 105-week study period.
Source: USDA, Economic Research Service calculations based on Nielsen supermarket scanner-based data.
14%
17%55%
8%
Other bases
Soy-based
Milk-based powder, ready-to-feed
Milk-based powder, non-WIC sizes
Milk-based powder, 12-16 oz
Milk-based liquid concentrate
3%
4%

16The Infant Formula Market: Consequences of a Change in the WIC Contract Brand / ERR-124
Economic Research Service/USDA
Contract Brand Status and Market Share
Among the 7,381 supermarkets in the ERS 30-State data set, volume sales of infant formula from the manufacturer holding the WIC contract brand accounted for the vast majority—84 percent—of all milk-based formula (excluding ready-to-feed formula) sold by the 3 major manufacturers in supermarkets (fi g. 9).13
The share of formula sales going to the manufacturer that holds the WIC contract varied signifi cantly by form and container size. The WIC contract brand accounted for 92 percent of all sales of powder in 12- to 16-oz containers and 95 percent of all sales of liquid concentrate in supermarkets. Thus, the manufacturer holding the WIC infant formula contract accounts for the vast majority of formula sales in liquid concentrate and 12- to 16-oz powder in supermarkets. The WIC contract brand accounted for a smaller proportion of sales of powder in non-WIC sizes, although it still accounted for over half—51 percent—of all sales in this category.
The large market share attributed to the manufacturer holding the WIC contract brand provides an indication of the major role that WIC plays in the infant formula market. However, there are several possible factors behind the WIC contract brand’s large share of infant formula sales in supermarkets, only some of which are related to WIC:
1. Direct WIC effects: This occurs when WIC recipients use their WIC food instrument to purchase the WIC contract brand of formula. Given the large amount of formula purchased through WIC, the direct effect is undoubtedly responsible for most of the sales of the WIC contract brand. However, the exact magnitude of the direct effect cannot be ascertained from the data. In a previous study, the authors estimated that about 57-68 percent of all infant formula sold in the United States in 2004-06 was purchased through the program (Oliveira et al., 2010). However, this fi gure includes sales in all outlets—supermarkets, as well as mass merchandisers (with
13For each State, the WIC contract holder’s percentage of total sales was estimated by using data on the 52 weeks prior to a contract change and weeks 13 to 52 after a contract change. Weeks 0 to 12 after the change were excluded because those weeks represent a potential transitional period when some States may experience sales of “WIC” formula from both the old and new contract holder.
Figure 9
The WIC contract brand's percentage of formula sold in supermarkets, by formula typePercent of formula sold
WIC=Special Supplemental Nutrition Program for Women, Infants, and Children.Source: USDA, Economic Research Service calculations based on Nielsen supermarket scanner-based data.
All formula Powder, 12-16 oz Liquid concentrate Powder, other sizes0
20
40
60
80
100

17The Infant Formula Market: Consequences of a Change in the WIC Contract Brand / ERR-124
Economic Research Service/USDA
and without full supermarkets), warehouse clubs, drug stores, conve-nience stores, toy stores, and other channels—and the percent of infant formula sales in supermarkets that is purchased through WIC may differ.
2. Indirect effects: This occurs when winning the WIC contract leads to increased sales in the non-WIC market (see box on “Spillover Effects of WIC” for a discussion of how formula manufacturers can realize indirect effects).
3. Factors not related to WIC: Non-WIC customers may purchase the WIC contract brand for reasons totally unrelated to WIC. For example, because of price, personal preference, or recommendations from family and friends, a non-WIC mother may purchase a specifi c brand of formula regardless of whether or not it is the WIC contract brand. That is, she would have purchased the same formula product even in the absence of the program.
The next section further examines the WIC contract brand’s large share of infant formula sales in supermarkets by disentangling the effects of WIC’s rebate program and its use of sole-source contracts—that is, the combined direct and indirect effects of WIC—from effects unrelated to WIC.

18The Infant Formula Market: Consequences of a Change in the WIC Contract Brand / ERR-124
Economic Research Service/USDA
When infant formula manufacturers win a WIC infant formula contract, they also experience the indirect effect of increased sales of formula that is not purchased with WIC food instruments. That is, the benefi ts of holding the WIC infant formula contract “spill over” to non-WIC sales. There are a number of possible mechanisms by which infant formula manufacturers may realize spillover effects:
• Since WIC infants account for a large portion of infant formula consumers, retailers may devote more shelf space and better product placement to the WIC contract brand. This results in greater product visibility, which in turn may spur sales of the contract brand to non-WIC consumers. The U.S. Government Accountability Offi ce (2006) interviewed the three main U.S. formula manufacturers about factors infl uencing the attractiveness of a WIC contract and reported that all three “manufacturers noted the importance of shelf space and product placement to their marketing strategies.”
• Sales may also rise if hospitals and/or physicians recommend the WIC contract brand to non-WIC mothers. The same 2006 Government Accountability Offi ce report stated that “State WIC programs often work with physicians to educate them about the program and the requirement that most WIC participants use the contract brand of infant formula. Physicians may decide to recommend the WIC brand of infant formula to all patients to avoid having to differentiate between those enrolled and not enrolled in WIC. Similarly, some hospitals agree to provide WIC-brand infant formula to new mothers so that they won’t have to switch infant formulas after they leave the hospital. It may be easier for hospitals to provide the WIC-brand infant formula to all new mothers.”
• Being identifi ed as the WIC brand also may increase the credibility of the product among non-WIC consumers. That is, the increase in demand for the WIC brand among non-WIC consumers may be due to the Government’s tacit endorsement of the product.
• To the degree that the quantity of formula provided by WIC does not meet all of their infant’s formula needs, mothers of WIC infants may be reluctant to feed a different brand of formula to their infants and will therefore be likely to supplement the formula provided through WIC by purchasing the same brand of formula out of pocket.
• Former WIC recipients may demonstrate brand loyalty by buying the same WIC-provided brand they used with one infant when they have subsequent babies after leaving the WIC program.
• WIC recipients who are satisfi ed with the WIC contract brand of formula may recommend the brand to their non-WIC friends and relatives.
• After the infants reach 1 year of age—when WIC no longer provides formula to the child—some WIC mothers may choose to feed their child toddler formula (i.e., formula targeted to young children). Mothers may be more likely to purchase the same brand of toddler formula that was provided to their infant through WIC.
Spillover Effects of WIC

19The Infant Formula Market: Consequences of a Change in the WIC Contract Brand / ERR-124
Economic Research Service/USDA
Effect of a Change in the WIC Contract Brand on Market Share
To better understand the impact of WIC’s rebate program and its use of sole-source contracts on the infant formula market in supermarkets, we took advantage of the natural experiments created when the WIC contract brand in a State switched from one manufacturer to another. Specifi cally, we conducted a pre/post analysis (also known as an event study analysis) of the overall effect (i.e., the direct and indirect effects of WIC combined) of a contract change on market share. To do this, we compared each manufactur-er’s average market share in each State in the 52 weeks prior to the switch in the contract brand, to their average market share in weeks 13 to 52 after the switch. Weeks 0-12 were excluded to account for the transition period when there may be a lag in converting all WIC participants to the new contract brand of formula.
Figures 10-12 illustrate the pre/post analysis of the overall effect of a change in the WIC contract based on the 1,533 sample stores in California—the State that serves the largest number of WIC infants. The impact of a change in the WIC contract on manufacturer’s share of infant formula sales for milk-based powder in 12- to 16-oz containers was dramatic (fi g. 10). The market share of the manufacturer that lost the WIC contract (Abbott) decreased substan-tially after the change, while the share of the winning manufacturer (Mead Johnson) increased substantially after the change. The same general pattern held for liquid concentrate (fi g. 11). The change in the market share of the contract-winning manufacturer of milk-based powder in non-WIC sizes also increased after the change in the WIC contract brand, although to a much lesser degree (fi g. 12).
All of the other States included in our analysis showed the same general pattern as California. Figure 13 summarizes the changes in overall market shares for all milk-based formula (excluding ready-to-feed formula) after the
Figure 10
Share of volume sales by WIC contract brand status12-16 oz milk-based powder (California)Percent
WIC=Special Supplemental Nutrition Program for Women, Infants, and Children.Note: Dashed line represents the week the contract brand changed.
Source: USDA, Economic Research Service calculations based on Nielsen supermarket scanner-based data.
-52 -39 -26 -13 0 13 26 39 520
20
40
60
80
100
New WIC contract brand
Other brand
Former WIC contract brand
Week

20The Infant Formula Market: Consequences of a Change in the WIC Contract Brand / ERR-124
Economic Research Service/USDA
WIC contract changed. Across all 30 States, the market share of the manu-facturer of the new WIC contract brand contract increased by an average of 74 percentage points after the contract changed.14 This increase in market share for the winning manufacturer was almost completely offset by the loss in market share of the manufacturer that lost the contract as its share of sales decreased by an average 73 percentage points across all 30 States. The other manufacturer in the State (i.e., the one that did not hold the contract in either period) appears to be unaffected, with its market share decreasing by 1 percentage point on average.
14Throughout this report, averages refer to simple unweighted averages whereby each State receives the same weight regardless of how much infant formula was sold in each State.
Figure 11
Share of volume sales by WIC contract brand statusmilk-based liquid concentrate (California)Percent
WIC=Special Supplemental Nutrition Program for Women, Infants, and Children.Note: Dashed line represents the week the contract brand changed.
Source: USDA, Economic Research Service calculations based on Nielsen supermarket scanner-based data.
-52 -39 -26 -13 0 13 26 39 52
New WIC contract brand
Other brand
Former WIC contract brand
Week
0
20
40
60
80
100
Figure 12
Share of volume sales by WIC contract brand status, milk-based powder in non-WIC sizes (California)Percent
WIC=Special Supplemental Nutrition Program for Women, Infants, and Children.Note: Dashed line represents the week the contract brand changed.
Source: USDA, Economic Research Service calculations based on Nielsen supermarket scanner-based data.
-52 -39 -26 -13 0 13 26 39 52
New WIC contract brand
Other brand
Former WIC contract brand
Week
0
10
20
30
40
50
60
70

21The Infant Formula Market: Consequences of a Change in the WIC Contract Brand / ERR-124
Economic Research Service/USDA
Estimates of changes in formula market shares—for both WIC and non-WIC formula types and sizes—after a WIC contract change are presented below:
Powder in 12- to 16-oz cans
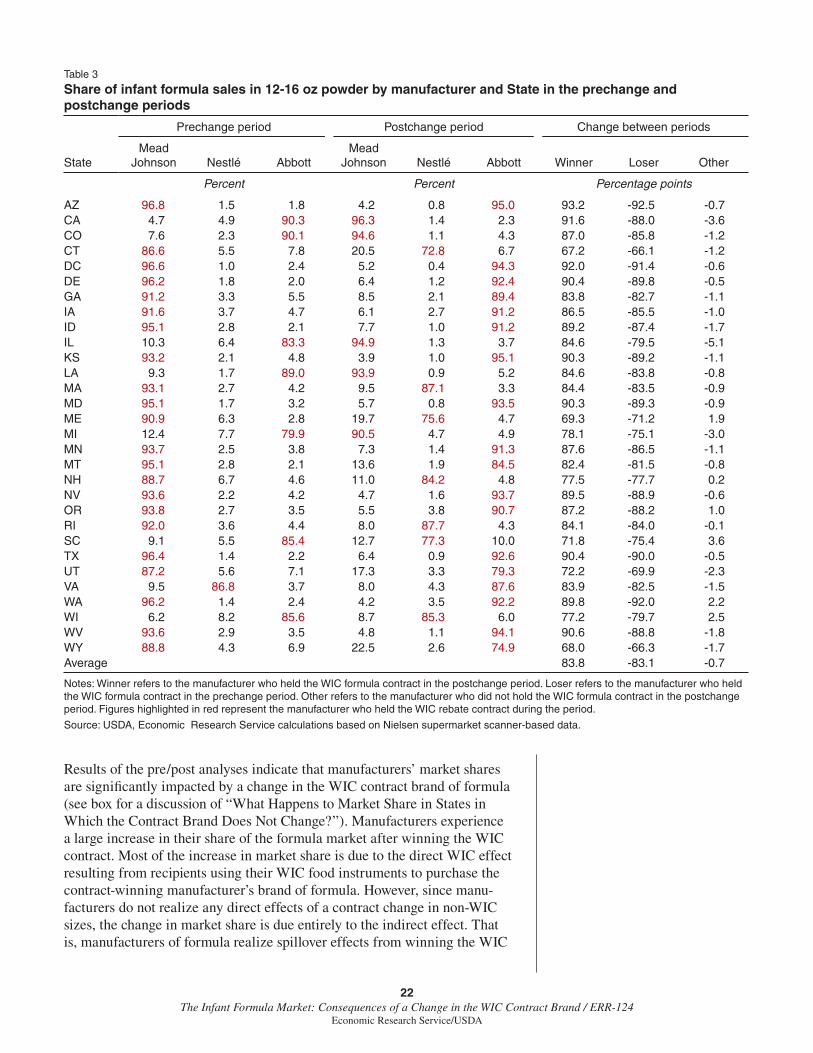
Results of the pre/post analysis of the overall effect of a change in the WIC contract indicate that the increase in the average market share after a manufacturer won the WIC infant formula contract was striking, ranging from 67 percentage points in CT to 93 percentage points in AZ (table 3). Using a simple average across the 30 States, the manufacturer’s share of total volume sales of milk-based powder in 12- to 16-oz cans increased by 84 percentage points after it won the contract. The market share of the manufacturer that lost the contract decreased by almost the same amount—83 percentage points across the States—while the market share of the other manufacturer in the State decreased by less than one percentage point on average.
Liquid concentrate
Liquid concentrate is also strongly impacted by changes in the WIC contract brand. Manufacturers winning the WIC contract saw an average 88-percentage-point increase in their market share while manufacturers who lost the contract saw an average 86-percentage-point decrease in market share (table 4). The manufacturers with neither contract showed little change in market share after the contract change.
Powder in non-WIC sizes
Because WIC formula in powder form is only provided in 12- to 16-oz cans, manufacturers of formula in other size containers do not realize any direct effect from winning the WIC contract. Therefore, one might hypothesize that sales of powder formula in other container sizes would be unaffected by changes in the WIC contract brand. However, the pre/post analysis indicates that the manufacturer winning the WIC contract experienced an average 18-percentage-point increase in sales of powder formula in non-WIC size containers (table 5). Manufacturers who lost the contract experienced an average 19-percentage-point loss in their volume share of formula in non-WIC size containers, whereas the manufacturer that had neither contract showed little change.
Figure 13
Change in market share after the WIC contract changesPercentage points
WIC=Special Supplemental Nutrition Program for Women, Infants, and Children.Source: USDA, Economic Research Service calculations based on Nielsen supermarket scanner-based data.
Winning manufacturer
Losing manufacturer
Other manufacturer
-100-80-60-40-20
020406080
100
22The Infant Formula Market: Consequences of a Change in the WIC Contract Brand / ERR-124
Economic Research Service/USDA
Results of the pre/post analyses indicate that manufacturers’ market shares are signifi cantly impacted by a change in the WIC contract brand of formula (see box for a discussion of “What Happens to Market Share in States in Which the Contract Brand Does Not Change?”). Manufacturers experience a large increase in their share of the formula market after winning the WIC contract. Most of the increase in market share is due to the direct WIC effect resulting from recipients using their WIC food instruments to purchase the contract-winning manufacturer’s brand of formula. However, since manu-facturers do not realize any direct effects of a contract change in non-WIC sizes, the change in market share is due entirely to the indirect effect. That is, manufacturers of formula realize spillover effects from winning the WIC
Table 3
Share of infant formula sales in 12-16 oz powder by manufacturer and State in the prechange and postchange periods
State
Prechange period Postchange period Change between periods
MeadJohnson Nestlé Abbott
MeadJohnson Nestlé Abbott Winner Loser Other
Percent Percent Percentage points
AZ 96.8 1.5 1.8 4.2 0.8 95.0 93.2 -92.5 -0.7CA 4.7 4.9 90.3 96.3 1.4 2.3 91.6 -88.0 -3.6CO 7.6 2.3 90.1 94.6 1.1 4.3 87.0 -85.8 -1.2CT 86.6 5.5 7.8 20.5 72.8 6.7 67.2 -66.1 -1.2DC 96.6 1.0 2.4 5.2 0.4 94.3 92.0 -91.4 -0.6DE 96.2 1.8 2.0 6.4 1.2 92.4 90.4 -89.8 -0.5GA 91.2 3.3 5.5 8.5 2.1 89.4 83.8 -82.7 -1.1IA 91.6 3.7 4.7 6.1 2.7 91.2 86.5 -85.5 -1.0ID 95.1 2.8 2.1 7.7 1.0 91.2 89.2 -87.4 -1.7IL 10.3 6.4 83.3 94.9 1.3 3.7 84.6 -79.5 -5.1KS 93.2 2.1 4.8 3.9 1.0 95.1 90.3 -89.2 -1.1LA 9.3 1.7 89.0 93.9 0.9 5.2 84.6 -83.8 -0.8MA 93.1 2.7 4.2 9.5 87.1 3.3 84.4 -83.5 -0.9MD 95.1 1.7 3.2 5.7 0.8 93.5 90.3 -89.3 -0.9ME 90.9 6.3 2.8 19.7 75.6 4.7 69.3 -71.2 1.9MI 12.4 7.7 79.9 90.5 4.7 4.9 78.1 -75.1 -3.0MN 93.7 2.5 3.8 7.3 1.4 91.3 87.6 -86.5 -1.1MT 95.1 2.8 2.1 13.6 1.9 84.5 82.4 -81.5 -0.8NH 88.7 6.7 4.6 11.0 84.2 4.8 77.5 -77.7 0.2NV 93.6 2.2 4.2 4.7 1.6 93.7 89.5 -88.9 -0.6OR 93.8 2.7 3.5 5.5 3.8 90.7 87.2 -88.2 1.0RI 92.0 3.6 4.4 8.0 87.7 4.3 84.1 -84.0 -0.1SC 9.1 5.5 85.4 12.7 77.3 10.0 71.8 -75.4 3.6TX 96.4 1.4 2.2 6.4 0.9 92.6 90.4 -90.0 -0.5UT 87.2 5.6 7.1 17.3 3.3 79.3 72.2 -69.9 -2.3VA 9.5 86.8 3.7 8.0 4.3 87.6 83.9 -82.5 -1.5WA 96.2 1.4 2.4 4.2 3.5 92.2 89.8 -92.0 2.2WI 6.2 8.2 85.6 8.7 85.3 6.0 77.2 -79.7 2.5WV 93.6 2.9 3.5 4.8 1.1 94.1 90.6 -88.8 -1.8WY 88.8 4.3 6.9 22.5 2.6 74.9 68.0 -66.3 -1.7Average 83.8 -83.1 -0.7
Notes: Winner refers to the manufacturer who held the WIC formula contract in the postchange period. Loser refers to the manufacturer who held the WIC formula contract in the prechange period. Other refers to the manufacturer who did not hold the WIC formula contract in the postchange period. Figures highlighted in red represent the manufacturer who held the WIC rebate contract during the period.
Source: USDA, Economic Research Service calculations based on Nielsen supermarket scanner-based data.

23The Infant Formula Market: Consequences of a Change in the WIC Contract Brand / ERR-124
Economic Research Service/USDA
contract whereby sales of formula purchased outside of the WIC program also increase.
For the powdered formula in WIC size containers and liquid concentrate, the data do not allow spillover effects to be separated from the direct effects of winning the WIC contract. However, it is likely that spillover effects accrue to the entire product line of the manufacturer holding the WIC contract. That is, the same factors that result in increased sales of powder in non-WIC sizes for the manufacturer that wins the WIC contract—such as increased shelf space devoted to the WIC contract brand—may be in play for the other types of formula as well. Since non-WIC consumers, who pay for formula out-of-pocket, are probably more likely to purchase the more economically priced
Table 4
Share of infant formula sales in liquid concentrate by manufacturer and State in the prechange and postchange periods
State
Prechange period Postchange period Change between periods
MeadJohnson Nestlé Abbott
MeadJohnson Nestlé Abbott Winner Loser Other
Percent Percent Percentage points
AZ 84.2 9.3 6.5 12.1 3.1 84.8 78.4 -72.1 -6.3CA 3.8 0.8 95.5 95.8 0.4 3.8 92.0 -91.7 -0.3CO 10.2 5.2 84.5 92.0 0.4 7.5 81.8 -77.0 -4.8CT 95.8 1.2 3.0 19.7 77.4 2.8 76.2 -76.1 -0.1DC 99.7 0.1 0.2 1.2 0.1 98.7 98.5 -98.5 0.0DE 97.8 1.0 1.2 3.8 0.5 95.8 94.6 -94.1 -0.5GA 95.3 2.3 2.5 3.5 2.0 94.5 92.1 -91.8 -0.3IA 94.8 0.3 4.8 9.2 0.6 90.2 85.3 -85.6 0.3ID 95.5 2.6 1.9 14.4 1.2 84.4 82.6 -81.1 -1.5IL 2.9 1.6 95.5 96.4 0.9 2.7 93.5 -92.8 -0.7KS 89.5 5.4 5.1 6.2 1.5 92.3 87.2 -83.3 -3.9LA 1.8 0.5 97.6 98.3 0.3 1.4 96.4 -96.2 -0.2MA 97.8 0.5 1.7 9.0 89.9 1.1 89.4 -88.8 -0.6MD 98.0 0.9 1.1 4.1 0.4 95.6 94.5 -94.0 -0.5ME 95.3 2.3 2.3 3.5 96.2 0.3 93.8 -91.8 -2.1MI 4.2 5.6 90.1 93.2 2.6 4.1 89.0 -86.0 -3.0MN 96.7 1.2 2.0 6.1 0.5 93.4 91.4 -90.7 -0.7MT 96.9 2.1 1.0 12.3 4.1 83.7 82.7 -84.6 1.9NH 92.1 4.1 3.8 9.8 89.0 1.2 84.9 -82.3 -2.6NV 90.3 2.7 7.0 11.1 2.5 86.3 79.3 -79.2 -0.2OR 94.6 2.5 3.0 7.5 1.5 91.1 88.1 -87.1 -1.0RI 98.3 0.4 1.2 4.7 94.6 0.7 94.2 -93.6 -0.6SC 1.9 1.1 97.0 3.4 86.8 9.8 85.7 -87.1 1.5TX 97.6 0.9 1.5 5.0 0.7 94.4 92.8 -92.6 -0.2UT 89.5 6.3 4.2 22.5 5.7 71.8 67.5 -67.0 -0.6VA 7.0 89.3 3.7 4.8 3.2 92.0 88.3 -86.1 -2.2WA 98.2 0.5 1.3 6.6 0.2 93.3 91.9 -91.6 -0.4WI 3.0 3.2 93.8 2.3 90.9 6.8 87.7 -87.0 -0.6WV 92.5 4.6 2.9 3.5 1.4 95.0 92.1 -89.0 -3.1WY 89.8 6.6 3.7 15.1 5.9 79.0 75.3 -74.7 -0.7Average 87.6 -86.4 -1.1
Notes: Winner refers to the manufacturer who held the WIC formula contract in the postchange period. Loser refers to the manufacturer who held the WIC formula contract in the prechange period. Other refers to the manufacturer who did not hold the WIC formula contract in the postchange period. Figures highlighted in red represent the manufacturer who held the WIC rebate contract during the period.
Source: USDA, Economic Research Service calculations based on Nielsen supermarket scanner-based data.

24The Infant Formula Market: Consequences of a Change in the WIC Contract Brand / ERR-124
Economic Research Service/USDA
larger size powder containers, the spillover effect is likely to be smaller for liquid concentrate and powder in 12- to 16-oz containers.
The spillover effect is important for manufacturers because, unlike the formula that is purchased with WIC food instruments, manufacturers do not pay a rebate on formula purchased outside of WIC. Based on a rebate with an average discount of 85 percent off the wholesale price of powder—the average among all States as of December 2008—manufacturers’ revenues for non-WIC formula was over 6 times greater than for the same formula purchased through WIC.
Table 5
Share of infant formula sales in other size powder by manufacturer and State in the prechange and postchange periods
State
Prechange period Postchange period Change between periods
MeadJohnson Nestlé Abbott
MeadJohnson Nestlé Abbott Winner Loser Other
Percent Percent Percentage pointsAZ 68.5 12.0 19.5 42.3 12.5 45.2 25.7 -26.2 0.5CA 38.5 14.3 47.2 55.8 14.0 30.3 17.2 -16.9 -0.3CO 42.9 12.8 44.3 60.1 11.6 28.3 17.2 -16.0 -1.2CT 60.0 12.6 27.4 46.3 23.8 30.0 11.2 -13.7 2.6DC 62.1 14.0 23.9 40.5 15.4 44.1 20.2 -21.6 1.4DE 65.6 14.2 20.2 45.2 14.1 40.7 20.5 -20.3 -0.2GA 58.5 14.2 27.3 44.8 13.7 41.4 14.1 -13.7 -0.4IA 68.4 12.3 19.4 42.8 12.9 44.2 24.9 -25.6 0.7ID 72.3 11.5 16.2 53.5 8.7 37.8 21.6 -18.8 -2.9IL 39.0 16.6 44.5 52.9 15.9 31.2 14.0 -13.3 -0.7KS 71.6 7.2 21.1 46.6 7.8 45.6 24.4 -25.0 0.6LA 50.9 10.5 38.7 70.2 8.8 21.0 19.4 -17.7 -1.7MA 59.8 16.2 24.0 44.6 26.1 29.3 9.9 -15.2 5.3MD 64.8 13.1 22.1 50.6 12.2 37.2 15.0 -14.2 -0.9ME 65.0 12.5 22.5 51.6 23.4 25.0 10.9 -13.4 2.5MI 35.8 21.4 42.8 52.0 15.5 32.5 16.2 -10.4 -5.8MN 72.0 19.2 8.7 35.0 18.5 46.6 37.8 -37.1 -0.8MT 72.0 11.5 16.5 52.3 9.6 38.1 21.6 -19.7 -1.9NH 52.7 16.9 30.3 43.2 23.9 32.9 6.9 -9.5 2.6NV 66.4 11.4 22.2 53.4 10.3 36.3 14.2 -13.0 -1.1OR 71.8 9.7 18.5 47.1 10.1 42.8 24.3 -24.7 0.4RI 74.9 10.7 14.4 54.3 26.3 19.4 15.6 -20.6 5.0SC 38.2 19.4 42.4 36.3 35.3 28.4 15.9 -14.0 -1.9TX 68.3 11.7 20.0 50.1 12.3 37.6 17.7 -18.2 0.6UT 66.2 16.3 17.5 50.6 15.0 34.3 16.8 -15.6 -1.2VA 41.6 33.9 24.4 44.8 22.1 33.1 8.6 -11.8 3.1WA 65.0 9.6 25.4 42.8 8.6 48.6 23.2 -22.2 -1.0WI 21.9 18.7 59.4 28.3 44.5 27.2 25.8 -32.2 6.4WV 72.0 9.8 18.2 48.5 10.3 41.1 22.9 -23.4 0.5WY 64.7 14.1 21.2 49.0 11.7 39.3 18.1 -15.7 -2.4Average 18.4 -18.7 0.3
Notes: Winner refers to the manufacturer who held the WIC formula contract in the postchange period. Loser refers to the manufacturer who held the WIC formula contract in the prechange period. Other refers to the manufacturer who did not hold the WIC formula contract in the postchange period. Figures highlighted in red represent the manufacturer who held the WIC rebate contract during the period.
Source: USDA, Economic Research Service calculations based on Nielsen supermarket scanner-based data.
25The Infant Formula Market: Consequences of a Change in the WIC Contract Brand / ERR-124
Economic Research Service/USDA
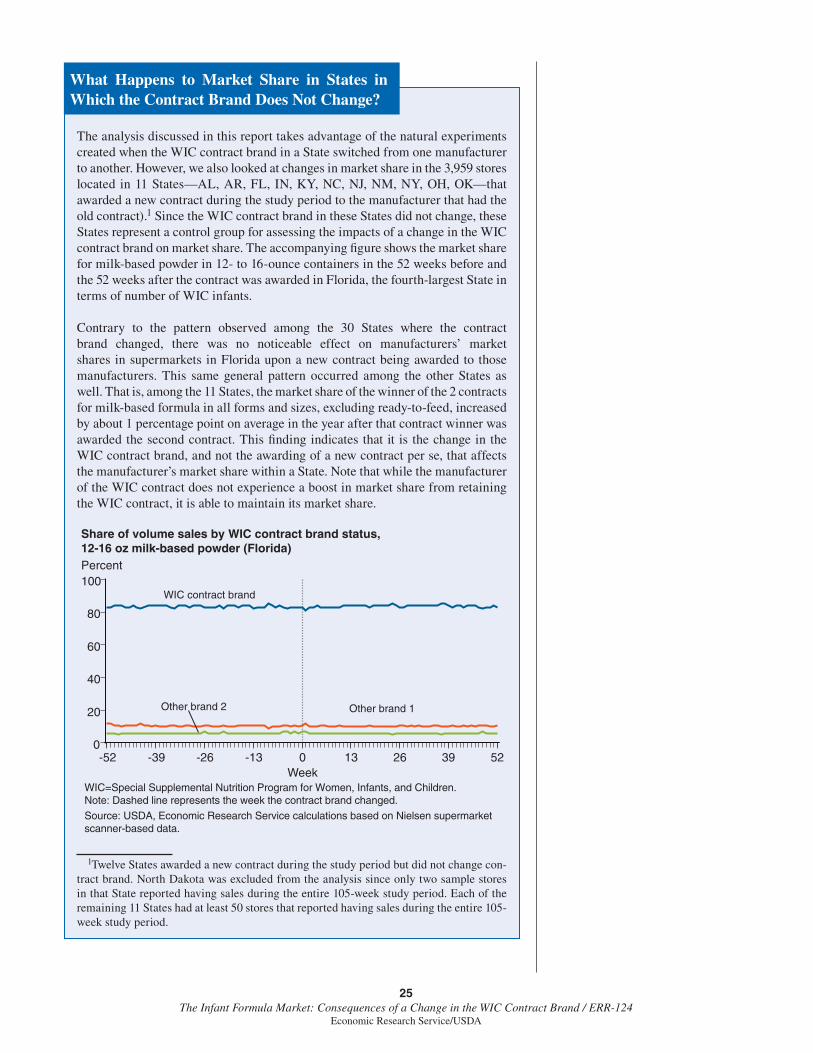
The analysis discussed in this report takes advantage of the natural experiments created when the WIC contract brand in a State switched from one manufacturer to another. However, we also looked at changes in market share in the 3,959 stores located in 11 States—AL, AR, FL, IN, KY, NC, NJ, NM, NY, OH, OK—that awarded a new contract during the study period to the manufacturer that had the old contract).1 Since the WIC contract brand in these States did not change, these States represent a control group for assessing the impacts of a change in the WIC contract brand on market share. The accompanying fi gure shows the market share for milk-based powder in 12- to 16-ounce containers in the 52 weeks before and the 52 weeks after the contract was awarded in Florida, the fourth-largest State in terms of number of WIC infants.
Contrary to the pattern observed among the 30 States where the contract brand changed, there was no noticeable effect on manufacturers’ market shares in supermarkets in Florida upon a new contract being awarded to those manufacturers. This same general pattern occurred among the other States as well. That is, among the 11 States, the market share of the winner of the 2 contracts for milk-based formula in all forms and sizes, excluding ready-to-feed, increased by about 1 percentage point on average in the year after that contract winner was awarded the second contract. This fi nding indicates that it is the change in the WIC contract brand, and not the awarding of a new contract per se, that affects the manufacturer’s market share within a State. Note that while the manufacturer of the WIC contract does not experience a boost in market share from retaining the WIC contract, it is able to maintain its market share.
1Twelve States awarded a new contract during the study period but did not change con-tract brand. North Dakota was excluded from the analysis since only two sample stores in that State reported having sales during the entire 105-week study period. Each of the remaining 11 States had at least 50 stores that reported having sales during the entire 105-week study period.
What Happens to Market Share in States in Which the Contract Brand Does Not Change?
Share of volume sales by WIC contract brand status, 12-16 oz milk-based powder (Florida)Percent
WIC=Special Supplemental Nutrition Program for Women, Infants, and Children.Note: Dashed line represents the week the contract brand changed.
Source: USDA, Economic Research Service calculations based on Nielsen supermarket scanner-based data.
Week-52 -39 -26 -13 0 13 26 39 52
0
20
40
60
80
100 WIC contract brand
Other brand 1 Other brand 2

26The Infant Formula Market: Consequences of a Change in the WIC Contract Brand / ERR-124
Economic Research Service/USDA
Does WIC Limit Infant Formula Selection?
The previous analyses indicated that manufacturers of the WIC contract brand realize spillover effects from winning the WIC contract. In this section we examine one possible source of the spillover effect—the reduced likelihood that non-WIC brands of formula are available in supermarkets. The rationale is as follows: because sales of non-WIC brands are relatively small, it may not make fi nancial sense to devote valuable shelf space to such products. This may be especially true for smaller stores with limited shelf space. These stores may decide to stock only one brand of formula—the largest seller—which in most cases will be the WIC brand (WIC-authorized stores are required to maintain a minimum stock of the WIC contract brand). Non-WIC patrons of these stores have limited options and may choose to purchase the WIC-brand of formula at that store rather than shop for non-WIC brands of formula at a different store. Manufacturers of the WIC brand of formula will realize a spillover effect from these stores to the degree that non-WIC patrons of these stores, who might otherwise purchase a non-WIC brand of formula if it was available, instead purchase the WIC contract brand.
Because the Nielsen data represent sales of formula in stores, we were not able to directly determine the availability of formula in stores—that is, whether infant formula was on the stores’ shelves. However, as a proxy for availability, we looked at the last week in which the store sold any noncon-tract brands of formula. For example, if a store last had sales of a noncontract brand of formula in week 46, that means the store did not sell noncontract formula during weeks 47 to 52, that is, over the last 6 weeks of the study period.15
Only 1 percent of the sample stores reported no sales of noncontract brands of powder in 12- to 16-oz containers during the last 6 weeks of the study period, and only 4 percent reported no sales of noncontract brands of powder in the non-WIC sizes. So, there is little evidence that WIC affected the avail-ability of noncontract brands of powder formula to consumers.
On the other hand, 35 percent of the stores in the ERS 30-State sample reported no sales of noncontract brand of liquid concentrate during the last 6 weeks of the study period, 21 percent had no sales of noncontract brand of liquid concentrate during the last 13 weeks (i.e., about 3 months), and 9 percent reported no sales of noncontract brands of liquid concentrate during the last 26 weeks (i.e., 6 months) of the study period (fi g. 14). Since it is doubtful that a store would continue to carry products that were not selling for long periods of time (6 weeks or more), it is likely that the store had elim-inated the noncontract brands of formula from their shelves.
These results suggest that WIC and its rebate program may affect the avail-ability of noncontract brands of liquid concentrate infant formula in super-markets. Sales of concentrate are much smaller than that of powder, and liquid concentrate requires more shelf space per reconstituted unit of volume. Because infant formula is an integral part of a formula-fed infant’s diet, some WIC State agencies may require that WIC-authorized vendors stock a large enough supply of formula—including liquid concentrate—to fully
15The study period consisted of the 52 weeks after the contract change (i.e., the year following the change in the contract brand).
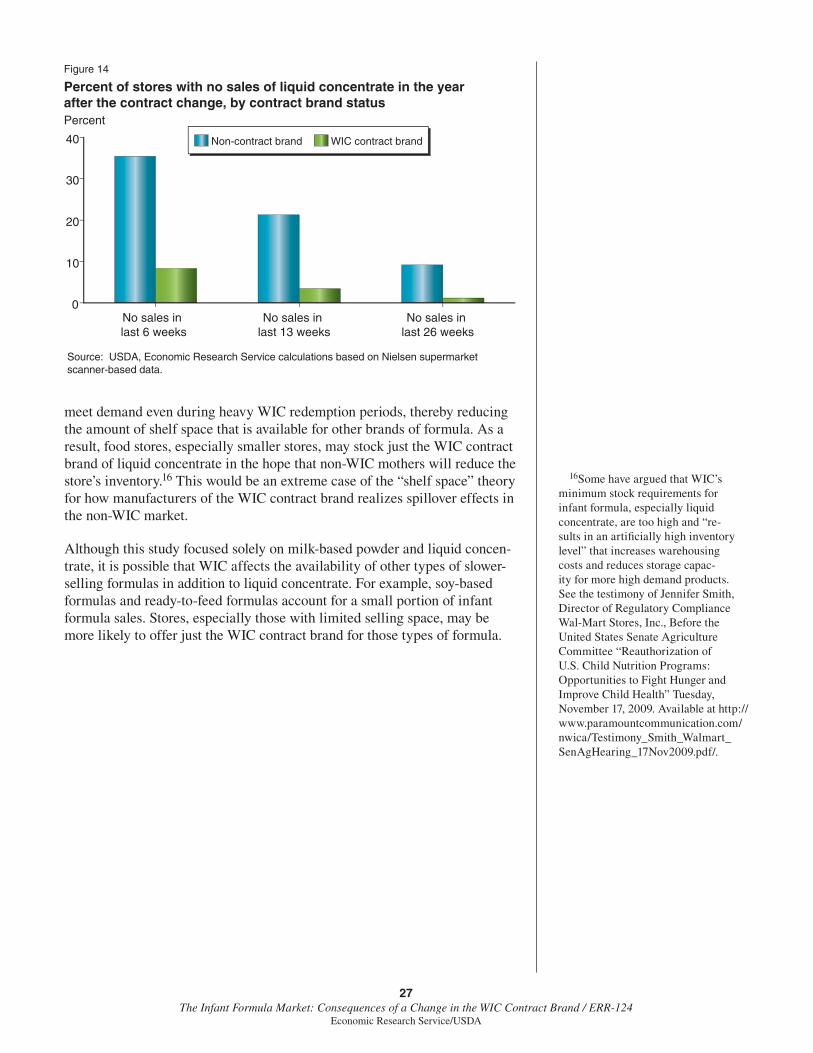
27The Infant Formula Market: Consequences of a Change in the WIC Contract Brand / ERR-124
Economic Research Service/USDA
meet demand even during heavy WIC redemption periods, thereby reducing the amount of shelf space that is available for other brands of formula. As a result, food stores, especially smaller stores, may stock just the WIC contract brand of liquid concentrate in the hope that non-WIC mothers will reduce the store’s inventory.16 This would be an extreme case of the “shelf space” theory for how manufacturers of the WIC contract brand realizes spillover effects in the non-WIC market.
Although this study focused solely on milk-based powder and liquid concen-trate, it is possible that WIC affects the availability of other types of slower-selling formulas in addition to liquid concentrate. For example, soy-based formulas and ready-to-feed formulas account for a small portion of infant formula sales. Stores, especially those with limited selling space, may be more likely to offer just the WIC contract brand for those types of formula.
16Some have argued that WIC’s minimum stock requirements for infant formula, especially liquid concentrate, are too high and “re-sults in an artifi cially high inventory level” that increases warehousing costs and reduces storage capac-ity for more high demand products. See the testimony of Jennifer Smith, Director of Regulatory Compliance Wal-Mart Stores, Inc., Before the United States Senate Agriculture Committee “Reauthorization of U.S. Child Nutrition Programs: Opportunities to Fight Hunger and Improve Child Health” Tuesday, November 17, 2009. Available at http://www.paramountcommunication.com/nwica/Testimony_Smith_Walmart_SenAgHearing_17Nov2009.pdf/.
Figure 14
Percent of stores with no sales of liquid concentrate in the year after the contract change, by contract brand statusPercent
Source: USDA, Economic Research Service calculations based on Nielsen supermarket scanner-based data.
No sales in last 6 weeks
No sales in last 13 weeks
No sales in last 26 weeks
0
10
20
30
40 Non-contract brand WIC contract brand

28The Infant Formula Market: Consequences of a Change in the WIC Contract Brand / ERR-124
Economic Research Service/USDA
Retail Prices Are Not Behind Increases in Contract Brands’ Market Share
This study has shown that State-level market shares change dramatically when there is a change in the WIC contract brand. However, it is impor-tant to determine whether this result was due to the change in the WIC contract brand or if changes in the retail price impacted the result. It is possible—but as we will discuss below, highly unlikely—that the shift in market share was driven by retailers offering the new WIC contract brands at reduced prices relative to the former contract brand. We exam-ined the retail price of the winning and losing brands of formula in the year prior to and the year after the contract change to determine how the retail price of the wining brand changed relative to the retail price of the losing brand of formula.
The analysis was limited to each of the three major manufacturer’s primary milk-based powder infant formula product during the study period—Similac Advance (Abbott) 12.9-oz can, Enfamil LIPIL (Mead Johnson) 12.9-oz can, and Good Start Supreme (Nestlé) 12-oz can.17 All of these products are supplemented with DHA and ARA. These supplemented formulas were introduced to the U.S. formula market in 2002-03, and WIC State agencies began authorizing them for their WIC programs at different times. Once authorized, the supplemented formulas quickly became the primary formula distributed through that State’s WIC program. However, the data indicate that in seven of the States included in this study, the WIC program was transitioning to the supplemented formulas during the year prior to the contract change. This is indicated by the fact that in the year prior to the contract change, unsupplemented formulas outsold the supple-mented formulas during some of the 52 weeks prior to the contract change. To avoid confusion as to whether changes in the price of formula were due to the State switching to supplemented formula or due to the new WIC infant formula contract, these seven States—CT, ME, MI, NH, RI, VA, and WY—were dropped from this analysis.
For the remaining 23 States, the relative price of the new to the former contract brand was measured by the ratio of the real retail price (i.e., adjusted for infl ation using the Consumer Price Index for All Items) of the new contract brand to the real retail price of the former contract brand. The change in the relative real price of the new WIC contract brand was then estimated as the difference in the relative price in the year after the contract change and the year prior to the contract change:18
17These three products, in addition to being the primary contract brands in WIC, were their respective fi rm’s big-gest sellers, accounting for an estimated one-quarter of total dollar sales of DHA/ARA-supplemented formula be-tween January 2004 and August 2008.
18Within each store, the average price—weighted by volume of sales—was estimated for the winning and losing brand for both the post and pre period. State averages were estimated by taking the average among all stores in the State with each store having the same weight (i.e., store averages were not weighted by volume of sales).
The relative real price change of the new WIC contract brand is equal to:
Year after contract change Year prior to contract change
Average real price of new contract brand minus Average real price of new contract brand
Average real price of former contract brand Average real price of former WIC contract

29The Infant Formula Market: Consequences of a Change in the WIC Contract Brand / ERR-124
Economic Research Service/USDA
A positive number indicates that the price of the new contract brand of formula increased by a greater percentage than the price of the former contract brand of formula. Conversely, a negative number indicates that the price of the new contract brand increased by a smaller percentage than the price of the former brand of formula. A value of zero indicates that the price of new contract brand did not change relative to the price of the old contract brand.
Results of the analysis showed no clear pattern in the change in the rela-tive price of the winning brand (table 6). In 12 States, the ratio was positive (indicating that the percent price change was greater for the winning brand than for the losing brand), and in 11 States the ratio was negative (indicating that the percent price change was smaller for the winning brand than for the losing brand). On average, the retail price of the winning brand relative to that of the losing brand increased by less than 2 percentage points between the year prior to the contract change and the year after the contract changed. That is, the price of the winning brand relative to the price of the losing brand did not change appreciatively between the two periods.
This fi nding indicates that the shift in market share was not due to a decrease in the relative retail prices of the new WIC contract brand to the former WIC brand of formula, but rather was due to the change in contract brand status.
Table 6
The relative real price change of the new WIC contract winner to the former WIC contract holder when the contract changes
State
Percentage point change
Arizona 0.35California 2.07Colorado 3.59Delaware -1.57District of Columbia -0.59Georgia 1.06Idaho 5.56Illinois 4.10Iowa -2.80Kansas -1.18Louisiana -3.77Maryland -0.81Massachusetts 2.54Minnesota -3.07Montana -1.06Nevada -2.67Oregon 0.39South Carolina 0.31Texas 2.23Utah 0.28Washington -1.26West Virginia 0.05Wisconsin -1.86
23-State average 1.88
Source: USDA, Economic Research Service calculations based on Nielsen supermarket scanner-based data.

30The Infant Formula Market: Consequences of a Change in the WIC Contract Brand / ERR-124
Economic Research Service/USDA
This fi nding is noteworthy for another reason. Rather than retail prices affecting market share when the WIC contract changes, it is more likely that changes in the WIC contract brand would affect retail prices. Economic theory suggests that the proportion of a store’s infant formula customers who participate in WIC should affect the store’s retail markup, and hence affect the retail price of formula. Since WIC recipients purchase their formula with WIC food instruments, they do not pay for their WIC formula from their personal funds and therefore are not sensitive to the prices that a store charges for formula. As a result, stores serving a greater percentage of WIC recipients have an economic incentive to raise the retail price of the WIC brand in order to take advantage of the WIC recipients’ price insensitivity.
Market forces limit the degree to which WIC vendors can take advantage of the price insensitivity of WIC participants and charge higher prices for the WIC contract brand of formula.19 That is because WIC vendors serve both WIC and non-WIC customers, and if a WIC vendor charges too high a price for the WIC foods, the non-WIC customers—who pay out of pocket for their food—may respond by shopping at another store, resulting in a loss of revenue for the vendor. However, as the proportion of price-insensitive customers increase, there is less economic incentive to the store to keep prices low. That is, the loss in revenue from the relatively few non-WIC consumers purchasing formula (and potentially other foods as well) who decide to shop in another store is more than offset by the increase in revenue generated from raising the retail price of the WIC brand of formula.
Given the large percentage of formula purchased through WIC and the price insensitivity of consumers who purchase their formula with WIC food instru-ments, one would expect that retail prices of the new WIC contract brand would increase relative to the retail price of the former WIC contract brand in the absence of current Federal regulations. The results of this analysis indi-cate that this did not happen. An earlier ERS analysis of the infant formula market in 1994-2000 concluded that the WIC contract brands of formula were associated with modestly higher retail prices in supermarkets (Oliveira et al., 2004). On the other hand, the results of this study are consistent with the results of the study by Huang and Perloff (2009), who found that the retail prices of formula did not change when the WIC contract changed. They attributed this to retail prices being sticky and retailers only adjusting retail prices after a change in wholesale prices. ERS is planning to conduct a more detailed study of WIC’s impact on retail prices at the individual store level using the ERS supermarket data set from Nielsen.
19Federal regulations also limit the degree to which WIC vendors can take advantage of the price insensitivity of WIC participants. The WIC vendor cost containment fi nal rule was published on October 8, 2009, which follows up on an interim rule published in 2005. The interim rule addressed the rising costs of vendors that had more WIC sales than non-WIC sales, by requiring that such vendors must be cost neutral for the program. Under these provisions, the WIC State agency may pay such vendors no more on average per food instrument than the State agency pays all other vendors statewide. The fi nal rule made only minor adjustments to the provisions of the interim rule, providing simplifi cation and exemption processes to reduce the administrative burden of WIC State agencies, and providing additional due process protections for vendors. The fi nal rule was effective on November 9, 2009.

31The Infant Formula Market: Consequences of a Change in the WIC Contract Brand / ERR-124
Economic Research Service/USDA
Discussion
Rebates from infant formula manufacturers are important to WIC, supporting about one-quarter of all participants in the program. Although average percentage discounts (i.e., the rebate as a percentage of the whole-sale price) decreased slightly in recent years, they remain high—on average, about 85 percent.20 Economists have long wondered how the infant formula manufacturers can afford to offer such large rebates to WIC. The results of this study suggest several reasons for the sizeable rebates. These reasons are tied to both the direct and indirect effects that winning the WIC infant formula contract has on the winning manufacturer’s share of the infant formula market.
Winning the WIC contract assures large volume sales to the manufacturer. On average, WIC contract brands accounted for 84 percent of all formula sold in supermarkets in the ERS 30-State sample. Most of this large market share is due to the direct WIC effect of participants using their WIC food instruments to purchase the contract brand of formula. However, manufac-turers also realize indirect or spillover effects from winning the WIC contract whereby sales of formula purchased outside of WIC also increase. Unlike formula purchased through WIC, manufacturers do not pay a rebate on formula that is purchased outside the program.
The large volumes of formula sold via WIC’s direct effects, and, to a lesser degree, its indirect effects, may also reduce the winning manufacturer’s costs on a per unit basis. For example, manufacturers pay a variety of fees and payments to retailers to persuade them to carry their product (Federal Trade Commission, 2003). These may include slotting fees, pay-to-stay fees, and promotion and advertising allowances, all of which increase costs to the manufacturer. Anecdotal evidence suggests that the WIC contract winning manufacturer has an advantaged bargaining position and can negotiate lower fees than the other manufacturers because of the larger volume of sales associated with the WIC contract brand. In addition, since WIC-authorized stores are required to provide the WIC contract brand formula to consumers, retailers participating in WIC have little leverage when negotiating informal fees, such as a slotting fee or a pay-to-stay fee for the primary WIC contract brand. As a result, the per unit costs to the contract brand manufacturer may be lower than that of the other formula manufacturers, holding other factors constant.
Infant formula manufacturers have large fi xed costs associated with their manufacturing plants and low, and perhaps declining, marginal costs of production. Operating plants at less than their optimal level may be ineffi cient and lead to higher per unit costs. On average, manufacturers who win a WIC contract experience a 74-percentage-point increase in market share. This means that winning a WIC infant formula contract, especially a contract for one of the larger States or one of the multistate alliances, can have a consid-erable impact on the manufacturer’s ability to operate at or near optimal capacity. That is, winning a WIC contract may not only increase sales but also lower per unit costs.
20Oliveira et al., (2010) estimated that the average percentage discount for powdered formula in the contracts in effect in December 2008 was 85 percent, compared to an average 91 percent in the previous contracts (Oliveira, et al., 2010).
32The Infant Formula Market: Consequences of a Change in the WIC Contract Brand / ERR-124
Economic Research Service/USDA
As a result, manufacturers who are operating at less than their optimal level, or manufacturers who want to keep their production levels high and are facing expiring contracts, have an incentive to bid aggressively on new contracts. Furthermore, because volume sales of formula have been decreasing over the last several decades, formula manufacturers are competing for a shrinking infant formula market, making winning the WIC infant formula contracts even more important.

33The Infant Formula Market: Consequences of a Change in the WIC Contract Brand / ERR-124
Economic Research Service/USDA
References
American Academy of Pediatrics. 1999. “Iron Fortifi cation of Infant Formula (RE9865), Policy Statement of the American Academy of Pediatrics,” Pediatrics, Vol. 104 (1), July.
Betson, D. 2009. Impact of the WIC Program on the Infant Formula Market, CCR-51, USDA, Economic Research Service, January.
Federal Trade Commission. 2003. Slotting Allowances in the Retail Grocery Industry: Selected Case Studies in Five Product Categories, FTC Staff Study, November.
Huang, R., and J. Perloff. 2009. WIC Contract Spillover Effects, Food Marketing Policy Center Research Report No. 118, University of Connecticut, December.
Nielsen Company. 2008. The Infant Formula Market: January 2004 through June 2008, Final Report, unpublished report prepared for USDA, Economic Research Service.
Oliveira, V., and D. Davis. 2006. Recent Trends and Economic Issues in the WIC Infant Formula Rebate Program, Economic Research Report No. 22, USDA, Economic Research Service, August.
Oliveira, V., E. Frazão, and D. Smallwood. 2010. Rising Infant Formula Costs to the WIC Program: Recent Trends in Rebates and Wholesale Prices, ERR-93, USDA, Economic Research Service, February.
Oliveira, V., M. Prell, D. Smallwood, and E. Frazão. 2001. Infant Formula Prices and Availability: Final Report to Congress, E-FAN-02-001, USDA, Economic Research Service, October.
Oliveira, V., M. Prell, D. Smallwood, and E. Frazão. 2004. WIC and the Retail Price of Infant Formula, FANRR-39, USDA, Economic Research Service, June.
Prell, M. 2004. An Economic Model of WIC, the Infant Formula Rebate Program, and the Retail Price of Infant Formula, FANRR-39-2, USDA, Economic Research Service, December.
Progressive Grocer, April 15, 2008.
USDA, Food and Nutrition Service. 2010a. Program Information Report (Keydata), U.S. Summary, FY 2009-FY 2010, September 2010, December.
USDA, Food and Nutrition Service. 2008. WIC and Retail Grocery Stores, Fact Sheet, January.
USDA, Food and Nutrition Service, Supplemental Food Programs Division. 2005. The Integrity Profi le (TIP) Report, Fiscal Year 2005. Available at http://www.fns.usda.gov/wic/tip/tipreport2005.htm/.

34The Infant Formula Market: Consequences of a Change in the WIC Contract Brand / ERR-124
Economic Research Service/USDA
USDA, Offi ce of Budget and Program Analysis. 2010b. 2011 USDA Budget Explanatory Notes for Committee on Appropriations, Chapter on Food and Nutrition Services.
U.S. Department of Health and Human Services, U.S. Food and Drug Administration, Center for Food Safety and Applied Nutrition. Website updated 5/14/2009 on “Infant Formula: Frequently Asked Questions,” accessed on October 29, 2010 at http://www.cfsan.fda.gov/~dms/inf-faq.html/.
U.S. Government Accountability Offi ce. 2006. FOOD ASSISTANCE, FNS Could Take Additional Steps to Contain WIC Infant Formula Costs, GAO-06-380, March.

35The Infant Formula Market: Consequences of a Change in the WIC Contract Brand / ERR-124
Economic Research Service/USDA
Appendix—Comparison of the Infant Formula Market Based on the Nielsen’s Supermarket Subsample and Nielsen’s National-Level Data Set
In order to evaluate the representativeness of the stores included in the ERS supermarket data, we compared the characteristics of the infant formula market based on the ERS supermarket subsample to the characteristics of the infant formula market based on Nielsen’s national level infant formula market data set. Two separate comparisons were made, one based on dollar sales (appendix table 1) and the other based on volume sales (appendix table 2).
Appendix table 1
Comparison of dollar sales of infant formula based on Nielsen’s national data set and the ERS supermarket data set, by product characteristics, 2004-08
2004 2005 2006 2007 2008
Percent
Manufacturer:
Estimates based on Nielsen nationally representative data
Mead Johnson 48.3 NA NA 44.6 40.1
Abbott 40.1 NA NA 38.5 42.7
Nestlé 10.3 NA NA 15.1 15.0
All other 1.3 NA NA 1.8 2.2
Estimates based on ERS supermarket data
Mead Johnson 45.3 NA NA 43.4 39.4
Abbott 41.6 NA NA 38.8 42.1
Nestlé 11.8 NA NA 16.4 17.0
All other 1.3 NA NA 1.4 1.6
Form:
Estimates based on Nielsen nationally representative data
Powder 71 75 78 81 83
Concentrate 20 16 14 12 10
Ready-to-use 9 9 8 7 7
Estimates based on ERS supermarket data
Powder 69 73 77 80 83
Concentrate 22 18 15 14 11
Ready-to-use 10 9 7 6 5
Base:
Estimates based on Nielsen nationally representative data
Milk 76 76 78 79 80
Soy 17 17 16 15 14
Other 6 7 7 7 7
Estimates based on ERS supermarket data
Milk 75 75 76 78 80
Soy 18 18 17 15 14
Other 7 7 7 7 7
—continued

36The Infant Formula Market: Consequences of a Change in the WIC Contract Brand / ERR-124
Economic Research Service/USDA
Appendix table 1
Comparison of dollar sales of infant formula based on Nielsen’s national data set and the ERS supermarket data set, by product characteristics, 2004-08—Continued
2004 2005 2006 2007 2008
Percent
Supplementation status:
Estimates based on Nielsen nationally representative data
DHA/ARA supplemented 69 79 87 96 99
Unsupplemented 31 21 13 4 1
Estimates based on ERS supermarket data
DHA/ARA supplemented 66 77 85 96 99
Unsupplemented 34 23 15 4 1
Container size (powder):
Estimates based on Nielsen nationally representative data
12 oz 9 10 12 14 13
12.9 oz 50 53 53 53 53
14.3 oz 11 7 4 1 0
16 oz 4 4 4 4 4
25.7 oz 17 18 18 17 18
Other 9 8 9 11 12
Estimates based on ERS supermarket data
12 oz 8 9 12 15 16
12.9 oz 52 55 55 56 56
14.3 oz 11 7 4 0 0
16 oz 6 7 7 7 7
25.7 oz 15 16 15 14 12
Other 7 6 7 8 9
Region:
Estimates based on Nielsen nationally representative data
Northeast 16 16 15 15 15
Midwest 24 24 23 23 22
South 39 39 40 40 41
West 21 22 22 22 22
Estimates based on ERS supermarket data
Northeast 19 19 19 18 18
Midwest 19 19 19 18 18
South 39 39 39 40 40
West 22 23 23 23 23
DHA/ARA=Docosahexaenoic acid and Arachidonic acid.Notes: NA=Not available.
Estimates based on Nielsen nationally representative data are based on Nielsen projections of total infant formula sales from all outlets. Estimates based on ERS supermarket data are based on unweighted estimates from a sample of supermarkets with annual sales over $2 million.
Sources: Nielsen Company 2008 and USDA, Economic Research Service calculations based on Nielsen supermarket scanner-based data.

37The Infant Formula Market: Consequences of a Change in the WIC Contract Brand / ERR-124
Economic Research Service/USDA
Appendix table 2
Comparison of volume sales of infant formula based on Nielsen’s national data set and the ERS supermarket data set, by product characteristics, 2004-08
2004 2005 2006 2007 2008
Percent
Manufacturer:
Estimates based on Nielsen nationally representative data
Mead Johnson 46.2 NA NA 43.0 37.9
Abbott 37.7 NA NA 37.5 42.2
Nestlé 13.4 NA NA 15.7 15.4
All other 2.7 NA NA 3.7 4.5
Estimates based on ERS supermarket data
Mead Johnson 43.1 NA NA 42.3 38.1
Abbott 38.8 NA NA 38.0 41.6
Nestlé 15.4 NA NA 17.0 17.3
All other 2.7 NA NA 2.7 3.0
Form:
Estimates based on Nielsen nationally representative data
Powder 76 79 82 85 87
Concentrate 18 14 12 10 9
Ready-to-use 7 6 6 5 5
Estimates based on ERS supermarket data
Powder 73 78 81 84 86
Concentrate 20 16 14 12 10
Ready-to-use 7 6 5 4 4
Base:
Estimates based on Nielsen nationally representative data
Milk 79 79 80 81 82
Soy 17 17 16 15 14
Other 4 4 4 4 4
Estimates based on ERS supermarket data
Milk 78 78 79 80 82
Soy 18 18 16 15 14
Other 4 4 5 4 4
—continued
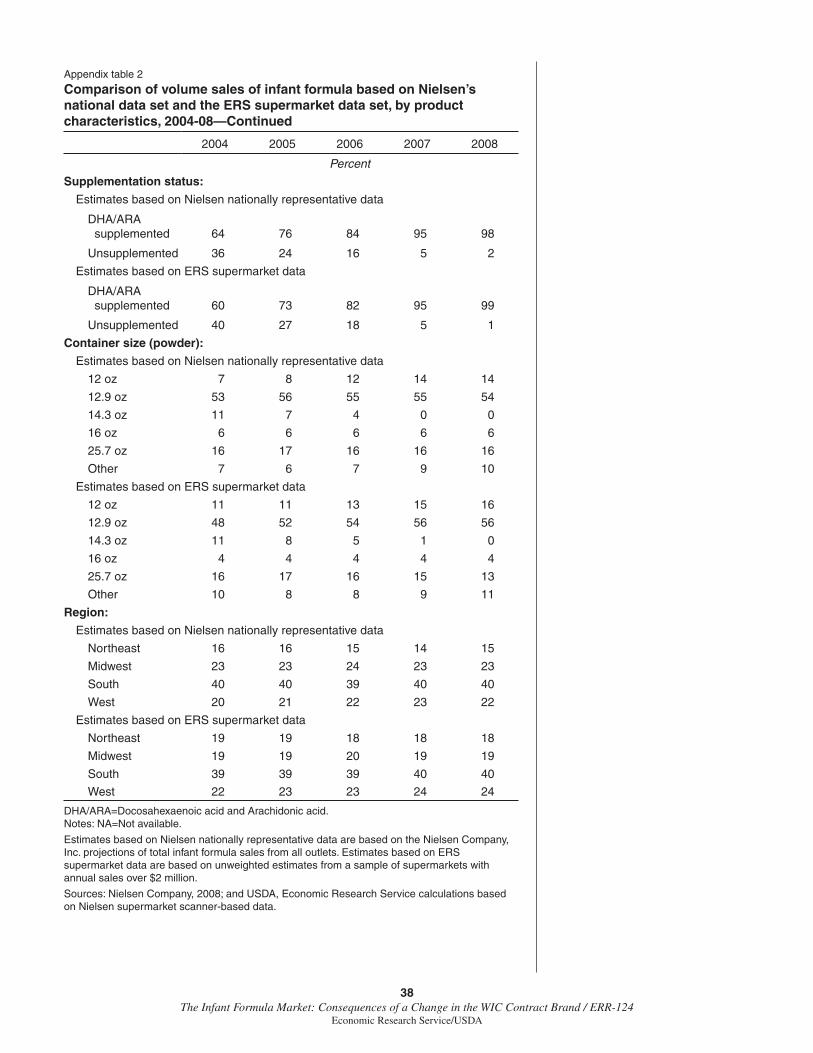
38The Infant Formula Market: Consequences of a Change in the WIC Contract Brand / ERR-124
Economic Research Service/USDA
Appendix table 2
Comparison of volume sales of infant formula based on Nielsen’s national data set and the ERS supermarket data set, by product characteristics, 2004-08—Continued
2004 2005 2006 2007 2008
Percent
Supplementation status:
Estimates based on Nielsen nationally representative data
DHA/ARA supplemented 64 76 84 95 98
Unsupplemented 36 24 16 5 2
Estimates based on ERS supermarket data
DHA/ARA supplemented 60 73 82 95 99
Unsupplemented 40 27 18 5 1
Container size (powder):
Estimates based on Nielsen nationally representative data
12 oz 7 8 12 14 14
12.9 oz 53 56 55 55 54
14.3 oz 11 7 4 0 0
16 oz 6 6 6 6 6
25.7 oz 16 17 16 16 16
Other 7 6 7 9 10
Estimates based on ERS supermarket data
12 oz 11 11 13 15 16
12.9 oz 48 52 54 56 56
14.3 oz 11 8 5 1 0
16 oz 4 4 4 4 4
25.7 oz 16 17 16 15 13
Other 10 8 8 9 11
Region:
Estimates based on Nielsen nationally representative data
Northeast 16 16 15 14 15
Midwest 23 23 24 23 23
South 40 40 39 40 40
West 20 21 22 23 22
Estimates based on ERS supermarket data
Northeast 19 19 18 18 18
Midwest 19 19 20 19 19
South 39 39 39 40 40
West 22 23 23 24 24
DHA/ARA=Docosahexaenoic acid and Arachidonic acid.Notes: NA=Not available.
Estimates based on Nielsen nationally representative data are based on the Nielsen Company, Inc. projections of total infant formula sales from all outlets. Estimates based on ERS supermarket data are based on unweighted estimates from a sample of supermarkets with annual sales over $2 million.
Sources: Nielsen Company, 2008; and USDA, Economic Research Service calculations based on Nielsen supermarket scanner-based data.