united states department of the interior geological
TRANSCRIPT

UNITED STATES DEPARTMENT OF THE INTERIOR
GEOLOGICAL SURVEY Water Resources Division
GEOHYDROLOGY AND ARTIFICIAL-RECHARGE POTENTIAL
OF THE IRVINE AREA
ORANGE COUNTY, CALIFORNIA
By
John A. Singer
Prepared in cooperation with the Orange County Water District and the
Irvine Ranch Water District
OPEN-FILE REPORT
ICO
Menlo Park, California January 8, 1973


CONTENTS
PageA T~\ o f~ Y~ o ^» "f~ w w M» 1r\u o U l_ ct L* U J_
-Ln L iroduc L ion* ""* " " " -' * " -' ... . . . . . . ---- -- ---- . .-- ---- -------- .._...... ^/Jr liirp os e cinci s cope " " " ... . «__« .«._.. ......._ «.«.__«.«_ ^Well-numbering system 6Jr IT e VI O US S txj.QigS" " " " "" -"" "" "" """""~"""""~"""""""""-" -- -- -------- -- - - - - /
/\ IT eel on s L.iiQ -._ «.«.«.«.«. «.__ ..__ «.__«.«.«. .._..........«.«...«.«.«. _«.« «.«._«.«.«.« ^
ITODelineation of the aquifer 12Water levels and ground-water movement 17Ground-water quality 21Relation of the aquifer to the surrounding areas 25
Artificial-recharge potential 36v-»onc J_us ions " * *" «._«. _« «. __... ..__.. ...... ..___ «._ «.__ _«.«. «.«.«.«.«.«.«.« « « __«._«.«.«.__«.«._ _«. j ySelected references 40
ILLUSTRATIONS
PageFigure 1. Index map 3
2 0 Map showing major physiographic and structural features ofpart of the coastal plain of southern California 4
3o Map showing generalized geology, location of wells, testholes, and geologic sections 8
4o Composite sections showing relative thickness and generalizedlithology of stratigraphic units 11
5. Map of elevation of bottom of aquifer 146. Geologic sections A-A ? and B-B ? 167. Map of aquifer transmissivity 188. Hydrograph of well 5S/9W-34J1 and pumping periods of nearby
wells. May and June 1971 209. Hap of water-level elevations<, January 1971 22
III

IV CONTENTS
Page Figure 10. Hydrograph of well 6S/8W-6P1 24
11. Graph of total annual pumpage southeast of Newport Freeway 2412. Map of water-level elevations, spring 1956 2613. Map of water-level elevations, autumn 1956 2814. Map of water-level decline, spring-autumn 1956 3015. Map showing dissolved-solids content of ground water 32 16o Map showing percentage of clay in upper 100 feet as
determined from drillers' logs 34
TABLES
PageTable 1. Test-hole data 37
2. Selected grain-size analyses 38

GEOHYDROLOGY AND ARTIFICIAL-RECHARGE POTENTIAL OF THE IRVINE AREA
ORANGE COUNTY, CALIFORNIA
By John A. Singer
ABSTRACT
The Irvine area is in hydraulic continuity with the rest of the coastal plain in Orange County Factors that distinguish the aquifer section of the Irvine area from that in other parts of the coastal plain are a low permeability, a high clay and silt content, and a thin alluvial sequence. Rapid facies change and the large percentage of silt and clay in the section locally result in confining conditions. The aquifer, most of which is included in the Fernando Formation, is as much as 1,300 feet thick beneath parts of the plain. The alluvium overlying the Fernando Formation averages about 200-250 feet in thickness and also contains significant amounts of silt and clay.
Transmissivities range from 25,000 to 100,000 gallons per day per foot in the Irvine area, values which are much lower than those in the rest of the coastal plain in Orange County.
Water levels have recovered as much as 60 feet from the low levels of the early 1950*s. Water-level maps indicate that in the winter non-pumping season water tends to move toward upper Newport Bay and the rest of the coastal plain. During the summer pumping season a cone of depression develops, reversing the winter gradient.
The average dissolved-solids content of the ground water is about 800 milligrams per liter. The most prevalent cations are sodium and calcium; the most prevalent anions are bicarbonate and sulfate. No long-term degradation of water quality has occurred, with the exception of a slight increase in dissolved solids.
No areas in the Irvine area are suitable for the large-scale spreading of water for artificial recharge. Clay and silt predominate in the section beneath the Tustin plain, and in the foothill areas either bedrock is close to the surface or the alluvium is fine grained.
1

GEOHYDROLOGY, IRVINE AREA, ORANGE CO., CALIF,
INTRODUCTION
Orange County, Calif, (fig. 1), in which Irvine is located, has one of the fastest growing populations in the Nation. In 1950 the county had 220,000 people; in 1960, 700,000 people; and in 1970, about 1,410,000 people. Accompanying this growth are many problems, especially those of water supply. Total water use in Orange County amounted to 363,000 acre-feet in 1970. Of this total, 295,000 acre-feet was for industrial and domestic use, and 68,000 acre-feet was for agricultural use. These figures represent an increase of 23 percent in industrial and domestic use and a decrease of 35 percent in agricultural use since 1964. Total use, however, increased only 6 percent since 1964. Not only is an adequate water supply required to sustain the economy but some means of disposing of waste water is necessary. In 1970 waste water totaled 155,000 acre-feet; most was in the form of domestic sewage, and 98 percent was discharged to the ocean. The remainder of the waste water was used for irrigation, recharge, and recreation or was discharged to water courses.
Since 1941 Colorado River water has been available to Orange County. This imported water was first used for ground-water recharge by spreading on the bed of the Santa Ana River in 1949. During the 1971 water year, 1 Orange County received 190,000 acre-feet of Colorado River water. Of this total, 50,000 acre-feet or about 26 percent was used for ground-water recharge. In the near future, water from the California Aqueduct from northern California will be available to Orange County. This water will be of better chemical quality than the existing water supply from the Colorado River. Selecting the best method of utilizing and distributing the additional water is of prime importance to local water purveyors.
The Orange County Water District manages the water resources within the coastal plain of the county and hence seeks to determine the geohydrologic framework of the Irvine area (fig. 2) so that a comprehensive management program may be carried out. The Irvine Ranch Water District is responsible for both the supply and the disposal of water in most of the Irvine area. Both agencies recognize that as urbanization proceeds, problems of waste-water disposal will increase.
water year is that period from October 1 of one year through September 30 of the following year and is designated by the calendar year in which it ends.

INTRODUCTION
A_N G E COUNTY
116° 115°
y 9 ao
FIGURE 1. Index map.

1IB
°20
I1I
7°40
'
Sa
nta
A
ra
Riv
er
rec
ha
rge
1!7°
50'
o
M
o G § t-1 O o O O o
FIG
UR
E 2. M
ajo
r physi
og
rap
hic
an
d st
ructu
ral
featu
res
of
part
of
the
co
ast
al
pla
inof
south
ern
C
ali
forn
ia.

INTRODUCTION l.
Purpose and Scope
The principal purpose of the study was to define the geohydrologic framework of the Irvine area. Of particular importance was (1) the relation between the geohydrology of the aquifer beneath the Tustin plain and that of the sedimentary rocks in the bordering foothills and (2) the feasibility of using the foothill areas or the plain for artificial recharge of imported water or treated waste effluent. A secondary objective was to determine, insofar as data permitted, the degree of hydraulic continuity and the flow pattern in the aquifer between the recharge area of the Santa Ana River and the Irvine area (fig, 2). The degree of hydraulic continuity indicates the amount of benefit the Irvine area receives from artificial recharge in the Santa Ana River,
Specifically s the study consisted of collecting data on;
1. Water levels of wells.
2. Drillers' and geophysical logs of wells.
3. Ground-water pumpage from wells,
4. Geologic and geophysical surveys.
5o Pump characteristics and efficiencies.
6. Streamflow characteristics,
7. Quality of water from wells.
To supplement the above data, field studies were made which included the augering of test holes, the canvassing of active wells, and a geologic reconnaissance of the area. Also included was a review of the existing literature, listed in the selected references at the end of this report.
The cooperation of many individuals and agencies concerned with the Irvine area was vital to the study. Particular thanks are given to Mr. J. B. Fairchild, district geologist, Orange County Water District; Mr. Ray Stoyer, assistant general manager, Irvine Ranch Water District; and Mr. J. W. Brown, manager, Agricultural Engineering and Water Department, The Irvine Co,, for their help in supplying data and records and for access arrangements during the project.

GEOHYDROLOGY, IRVINE AREA, ORANGE CO., CALIF,
Well-Numbering System
Wells are numbered according to their location in the rectangular system for the subdivision of public land. That part of the number preceding the slash (as in 5S/9W-34J1) indicates the township (T. 5 S.); the number following the slash indicates the range (R. 9 W.); the number following the hyphen indicates the section (sec. 34); the letter following the section number indicates the 40-acre subdivision of the section according to the lettered diagram. The final digit is a serial number for wells in each 40-acre subdivision. The area covered by this report lies entirely south and west of the San Bernardino base line and meridian.
R.10W.R.9W. R.8W. R.7W.R.6W. R.5W R.4W R.3W. R.2W. R.1W.
T.I N.
T.I S.
T.2S.
T.3S.
T4S.
T.5S.
SAN BER
~>
NARO
^
NO B ASE LINEX<
_ s.trUJ
Zo f.
Of<X
UJ CO
«c </)
\\\\\
\
6
7
18
19
30
31
5
8
17
20
29
32
4
9
16
21
28
33
3
10
15
22
27
34
2
11
14
23
26^-
1
12
13
24
25
4!»
\\\\*
\\\
D
E
M
N
C
F
L
P
B
G 4
K
Q
A
H
Jo5S/9W-:
R
4)1

INTRODUCTION
Previous Studies
The surface geology of the Santa Ana Mountains and the San Joaquin Hills (fig. 2) was studied in detail by Vedder, Yerkes, and Schoellhamer (1957); Schoellhamer, Kinney, Yerkes, and Vedder (1954); Yerkes (1957); and Morton (1970).
The subsurface geology of the Irvine area is not as well known. A brief description was presented by Yerkes, McCulloh, Schoellhamer, and Vedder (1965). An aeromagnetic map of part of the area by Andreasen, Pitkin, and Petrafeso (1964) is also available.
The geohydrology of the area was described briefly by Poland, Piper, and others (1956); Piper, Garrett, and others (1953); Poland (1959); Moreland and Singer (1969a); Hardt and Cordes (1971); and the California Department of Water Resources (1967a).
In addition, reports by Lowry Engineering-Science (1969), Brown and Caldwell (1968), the Orange County Water District (1972), and the Orange County Flood Control District (1970) presented background information and basic data.
Area of Study
The Tustin plain, about 40 miles southeast of Los Angeles, is bounded on the east by the Santa Ana Mountains and on the south by the San Joaquin Hills. The study area (fig. 3) encompasses about 75,000 acres, of which about 38,000 acres comprises the alluvial plain; the remainder consists of the adjacent mountain areas.
Elevations range from 5 to 450 feet above sea level on the floor of the plain to more than 1,100 feet in the San Joaquin Hills and more than 1,700 feet in the Santa Ana Mountains. The major streams draining the area are San Diego Creek, Rattlesnake Canyon Wash, Hicks Canyon Wash, and Peters Canyon Wash (fig. 3). The streams, with the exception of lower reaches of San Diego Creek, are ephemeral and discharge into upper Newport Bay. Irrigation return accounts for some low flow in the summer.
The climate is Mediterranean in type, with hot, dry summers and cool, wet winters. Mean annual precipitation ranges from about 14 inches on the plain to more than 20 inches in the surrounding mountains. The mean temperature is about 62°F (16.7°C) with extremes of less than 32°F (0.0°C) and more than 100°F (37.8°C).
The alluvial plain in the study area, herein defined as the Tustin plain (fig. 2), had been devoted almost exclusively to agriculture in the past. Much of the flat agricultural land is now being converted to tract housing, with accompanying changes in water-use and waste-water disposal problems.

GEOHYDROLOGY, IRVINE AREA, ORANGE CO., CALIF.
R.9 W R.8 ». 117 o 45 .
T.5 S
R.9 ». R.8 «. ii7°4S'
FIGURE 3. Generalized geology, location of wells, test holes,and geologic sections.

INTRODUCTION
7°40'R B W
others (1954» and Vedder and others (1957* 7 6 S
EXPLANATION
I QQ I AI luvium 1 ~^)b=^ \ (Quaternary) I Water-bear ingI °' | Terrace deposits J > rocks
| TO | Older semi crjnso I idated rocks (Tertiary) J
\///\ Non-water-bearing rocks (Tertiary and older)
Geologic contact
Drainage divide
o pl Well with driller's log or water-level data and number19
Test hole and number
A A' Location of geologic section (shown in figure 6)
FIGURE 3. Continued.

10 GEOHYDROLOGY, IRVINE AREA, ORANGE CO., CALIF.
The Irvine Ranch, which occupies most of the alluvial plain, currently (1970) has about 40 active water wells. Most of these wells are used exclusively for irrigation. The majority are of the deep-well turbine type and were drilled before 1940. Depending upon a decision to be made by the local water purveyors, these wells will be either incorporated into the public supply system or destroyed. In 1971 the domestic water supply consisted almost exclusively of imported Colorado River water from the Metropolitan Water District of Southern California.
GEOLOGY
The Tustin plain (fig. 2) lies within the central block of the coastal plain, beneath which the basement surface plunges to a maximum depth of more than 31,000 feet below sea level about 25 miles northwest of the study area. Overlying the basement rocks is a Cretaceous to Holocene succession of marine and nonmarine clastic sedimentary rocks that attains a maximum thickness of at least 32,000 feet in the Santa Ana Mountains. This sequence is represented at the surface in the study area mainly by sandstone, siltstone, and conglomerate of Miocene age. Figure 4 shows the lithology and relative thickness of the stratigraphic units that underlie the San Joaquin Hills and the northern Santa Ana Mountains.
The Santa Ana Mountains and the San Joaquin Hills are the surface expressions of large complex anticlines. The Tustin plain overlies a synclinal depression that is quite shallow in the study area compared with the rest of the coastal plain. Basement rocks are penetrated between 4,000 and 6,000 feet below sea level in the Tustin plain. Although many faults are present in the surrounding hills, none appears to be expressed at the surface of the Tustin plain.
For the purposes of this report, the rock units have been divided as follows: (1) non-water-bearing rocks some localized zones of water probably occur in these rocks, but yields would be quite small and hence they are considered to be non-water-bearing in this report; (2) older semiconsolidated rocks; (3) terrace deposits; and (4) alluvium (fig. 3). Each of the latter three units is water bearing.
The non-water-bearing rocks, as shown in figure 3, include all rocks older than the Fernando Formation in the Santa Ana Mountains and the Capistrano Formation in the San Joaquin Hills (fig. 4). They consist mainly of shale, siltstone, sandstone, and conglomerate.

O I I fD
h-1
OJ
rr
H-
O
<
i-h
fD
co
rr
rr
JTi~
t H
* PJ
O
rt
?r"
H-
3O
Q
fDn
coCU
CO
H-
3O
Q
*
C
OQ
3
fDH
- 3
rt
fDco
i-s N
fD a O
OQ
! H
i1
!i!i'!
! '
i'!
! l: if
1 2
f S is. tn
1
; £
.^ f
"f^ ^'."-
o.
/>.'*
m X T)
\
> O z
NON-
WAT
ER-B
EARI
NG
ROCK
SW
ATER
-BEA
RING
RO
CKS
§
it ass

12 GEOHYDROLOGY, IRVINE AREA, ORANGE CO., CALIF.
The water-bearing older semiconsolidated rocks as grouped in this report include the Capistrano, Fernando, and Niguel Formations, of late Miocene to late Pliocene age (Yerkes and others, 1965). These formations consist of sandstone and siltstone with some conglomerate lenses. The Fernando Formation does not crop out in the study area but probably underlies most of the Tustin plain. This formation is known to exist at depth in the rest of the coastal plain where it forms the lower aquifer system. The Capistrano and Niguel Formations crop out in the southeastern part of the study area and probably interfinger with the Fernando Formation. These formations uncon- formably overlie many older formations and range in thickness from a few feet to more than 1,500 feet.
The terrace deposits, of Quaternary age, are distinguished from the alluvium mainly on a topographic basis. The terrace deposits are lithologically similar to the alluvium, are generally quite thin, and unconformably overlie various older units. Because this unit is thin it is not everywhere saturated, and therefore it is only locally water bearing.
The alluvium, of Holocene age, ranges in thickness from a few feet to more than 200 feet. This unit includes the deposits of modern stream channels, alluvial fans, and flood plains, and consists predominantly of silt and clay with only an occasional sand and gravel lens. The unit is generally water bearing where it forms the widespread surficial cover of the Tustin plain.
GEOHYDROLOGY
Delineation of the Aquifer
Ground water is present beneath all the Tustin plain. Some wells have been drilled in the canyons surrounding the plain, but their yields are generally quite small. The part of the aquifer beneath the alluvium of the Tustin plain consists of a thick succession of silt- and clay-rich strata with occasional sand and gravel lenses. On the basis of lithologic descriptions of the aquifer given in drillers' logs, this unit (the older semiconsolidated rocks of fig. 3) has been assigned to the Fernando Formation, here of Pliocene age. The Capistrano and Wiguel Formations in the southeastern part of the study area probably interfinger with the Fernando Formation and are generally equivalent in age to the Fernando Formation.
The aquifer in the Tustin plain has been delineated almost solely on the basis of drillers' logs.. Although the interpretation of information in drillers' logs is subjective, one can commonly pick the top of the low-yield section, or what is considered the non-water-bearing sequence. The top of this section is characterized by an almost continuous sequence of blue shale, sandstone, and blue clay. Some electric-log and seismic data were also available but were of limited value because most of the data were from the non-water-bearing rocks below the aquifer.

GEOHYDROLOGY 13
Within the study area the base of the aquifer is deepest 1 mile northeast of the Marine Corps Air Station, Santa Ana (fig. 5). The aquifer thins appreciably toward the Santa Ana Mountains and the San Joaquin Hills, finally tapering out toward the southeast. Toward the northwest the unit dips more steeply beneath the main part of the coastal plain and probably attains a depth of 2,000 feet below sea level outside the study area. No contours are extended beyond the alluvium because well data are lacking outside the alluvial plain.
Figure 6 shows the extent of the aquifer in cross section. Attempts were made to correlate beds within the Fernando Formation but, because of the rapid facies change and interfingering of lithologies, no valid correlations from well to well could be made. The thickness of the alluvium in the Tustin plain decreases from northwest to southeast (section A-A', fig. 6) and is significantly less than in the rest of the coastal plain. In the main part of the coastal plain, the alluvium and late Pleistocene deposits are as much as 1,000 feet thick and are very coarse grained (California Department of Water Resources, 1967a); in the Tustin plain the alluvium averages about 200-250 feet in thickness and is mostly fine grained. As shown by figure 6, future wells drilled in the Tustin plain should not extend below the top of the non-water-bearing rocks. In the past, wells were drilled hundreds of feet into this nonproductive unit, apparently in the hope of finding good water-bearing strata.
Water also occurs in the alluvium overlying the Fernando Formation. The contact between the alluvium and the Fernando Formation is difficult to recognize in drillers' logs but was interpreted to be at that point on the logs where the brown clayey lithologies of the Fernando Formation predominated over yellow alluvial beds. In actuality, probably little hydrologic difference exists between the alluvium and the Fernando Formation.
Beneath the Tustin plain the aquifer is, for the most part, confined. This confinement is caused by the large quantity of interfingering silt and clay in the aquifer and not by a single confining layer.
A map of aquifer transmissivity (fig. 7) was constructed to illustrate areal changes in this physical characteristic. Transmissivity is the measure of the ability of the formation to transmit water and is defined as the rate of fluid flow, in gallons per day, through a saturated strip of aquifer 1 foot wide under unit hydraulic gradient. To estimate transmissivity values, data were collected from many short-term pumping tests. The test data included the yield of the well, in gallons per minute, and the amount of water-level decline or drawdown, in feet, caused by the pumping. From this information the specific capacity of a given well was calculated. The specific capacity of a well is the rate of discharge of water from the well divided by the drawdown of water level in the well. The specific capacity is then multiplied by a factor of 2,000 to estimate the transmissivity (Theis and others, 1963).

14 GEOHYDROLOGY, IRVINE AREA, ORANGE CO. , CALIF.
n.9 w R.9». R.BI.
T.5 S.
Base from U.S. Geological Survey, 1:24,000 El Toro, I9BB, Tustin, 1965, Orange, 1964, Black Star Canyon, 1967, Laguna Beach, 1965, San luan Capistrano, I96B
R.9 N.
FIGURE 5. Elevation of bottom of aquifer.

GEOHYDROLOGY 15
7°40'R.8 ».
. Geology generalized after SchoelIhamer and others (1954) and Vedder and others (1957)
EXPLANATION
GEOLOGIC CONTACT Boundary of alluvium
DRAINAGE DIVIDE
-100 STRUCTURE CONTOUR Shows elevation of bottom of aquifer; dashed where approximate Central closed depression contour is hachured Contour interval 100 feet; datum is mean sea level
WELL WITH DRILLER'S LOG AND NUMBER
u WELL WITH WATER-LEVEL DATA AND NUMBER
4MILES
1l7°40' R.8 W.
FIGURE 5. Continued.

16 GEOHYDROLOGY, IRVINE AREA, ORANGE CO., CALIF.
FIGURE 6. Geologic sections A-A' and B-B 1 .

GEOHYDROLOGY 17
The transmissivity values in the Tustin plain area (fig. 7) are quite low relative to other parts of the coastal plain and reflect the large quantity of silt and clay present in the aquifer. The transmissivity increases toward the northwest and the main part of the coastal plain, owing to increased permeability of individual beds and the addition of younger, more permeable beds comprising a greater aquifer thickness.
A water-level recorder was installed on well 5S/9W-34J1 (fig. 3) May 14, 1971, and removed June 7, 1971. The water-level record indicated that the well responded immediately to pumping in wells more than a mile away. Pumping in wells 5S/9W-34Q1, 35J1, 6S/9W-2A4, and 2D1 caused a 15-foot water-level decline in the observation well after 7 days. The water level was still declining when the recorder had to be removed (fig. 8). The immediate response of the aquifer to the pumping activity confirms the existence of confining conditions beneath the Tustin plain.
Water Levels and Ground-Water Movement
Ground water moves downgradient under the influence of gravity and other forces in much the same manner as surface water flows in a stream channel, but at a much slower rate. The approximate direction of ground-water movement can be determined from a water-level contour map (fig. 9); the ground water moves downgradient normal to the contours.
Figure 9 shows the water-level contours for January 1971 when pumping was at a minimum in the Tustin plain. The map also shows the residual influence of much previous pumping in the area. Recharge from the surrounding Santa Ana Mountains and the San Joaquin Hills travels westward toward the main part of the coastal basin; however, most is intercepted in residual pumping depressions near wells east of the Newport Freeway. Some water moves southwestward toward the ocean. The map indicates direction of movement only, and not the quantity of flow.
The hydrograph for well 6S/8W-6P1 (fig. 10) is indicative of water-level fluctuations in the Tustin plain. Water levels have recovered greatly since the early and middle 1950's and currently (1971) even exceed those of the 1930's. This recovery is a function of decreased pumpage (fig. 11) in the Tustin plain and also of a general rise in water levels throughout the coastal plain, attributable to the spreading of Colorado River water in the Santa Ana River. Amplitude of the yearly fluctuation has varied considerably over the years. In periods of low rainfall and low recharge to the basin, the yearly fluctuation was about 30 feet, but in periods of high rainfall and high recharge the fluctuation was about 10 feet. Probably this is partly due to less pumpage during the wetter years. Variations in nearby pumping patterns probably also affect the hydrograph.

18 GEOHYDROLOGY, IRVINE AREA, ORANGE CO., CALIF.
T.5 S
Base from U.S. Geological Survey, 1:24,000 El Toro, 1968, Tustin, 1965, Orange, 1964, Black Star Canyon, 1967, Laguna Beach, 1965, San Juan Capistrano,
R.9 ». R.8 ». u7 0 45'
FIGURE 7. Aquifer transmissivity.

GE (HYDROLOGY 19
7°40'R.8 *
T.5 S.
Geology generalized aftei SchoelIhamer an others (1954) and Veddei and others (1957
EXPLANATION
GEOLOGIC CONTACT Boundary of alluvium
DRAINAGE DIVIDE
50,000 LINE OF EQUAL TRANSMISSIVITY, IN GALLONS PER DAY PER FOOT Interval as shown, dashed where approximate
o62 WELL AND NUMBER
*" WELL WITH PUMP-TEST DATA AND NUMBER
FIGURE 7. Continued.

20 GEOHYDROLOGY, IRVINE AREA, ORANGE CO., CALIF.
55
60
65
70
75h
76
M H H H H H
I h
Pumping periods of nearby wells
14 20 25 30MAY
5 JUNE
6S/9W-2A4
5S/9W-34Q1
6S/9W-2D1
5S/9W-35J1
FIGURE 8. Hydrograph of well 5S/9W-34J1 and pumping periods of nearby wells, May and June 1971.

GEOHYDROLOGY 21
Figure 12 shows the water-level contours for spring 1956, before the summer pumping period. The general configuration of the contours on this map closely resembles that of figure 9 for January 1971.
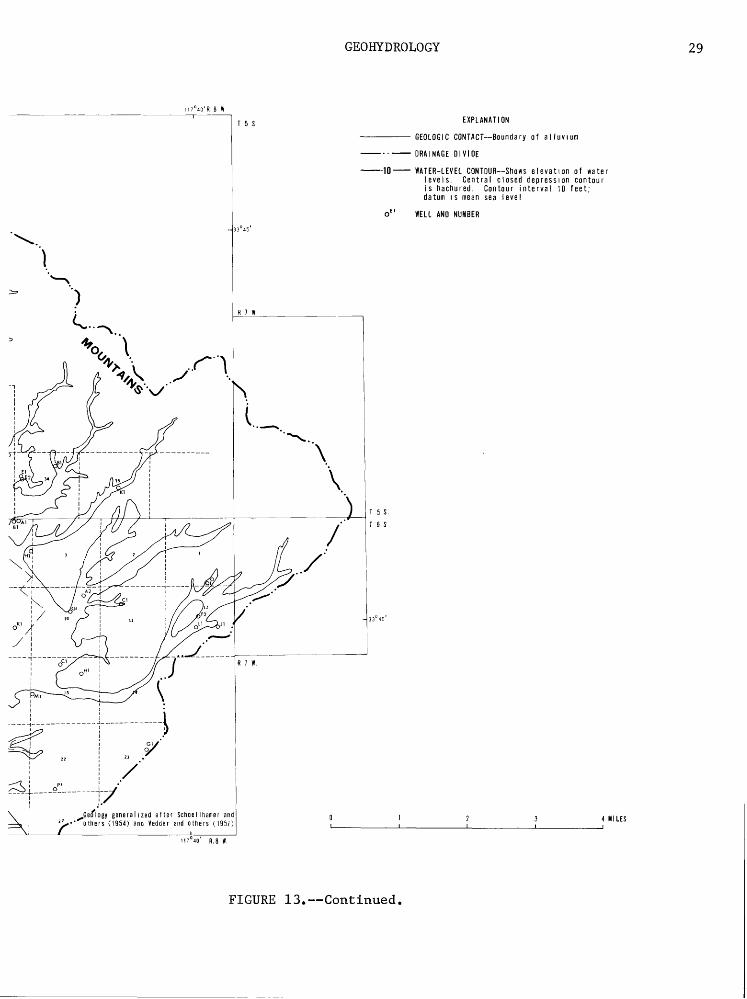
Figure 13 shows the water-level contours for autumn 1956, at the end of the summer pumping season, when water levels throughout Orange County were at their historic low. At this time a cone of depression spread over a large part of the Tustin plain, and water levels were as low as 70 feet below sea level. When the cone of depression existed, water moved toward wells in the study area from the northwest and also from the southwest. The maximum change in water level from the pumping period to the nonpumping period in 1956 was more than 60 feet (fig. 14). In 1956 only about 19,000 acre-feet of water was pumped from the area (fig. 11). The large water-level decline shown in figure 14 is a result of the low transmissivity of the aquifer.
The 1956 pumping depression corresponds with the area of greatest pumping activity. Pumping from the area around sees. 34 and 35, T. 5 S., R. 9 W., accounted for 12 percent of the pumpage while pumping from the area just to the southeast accounted for 15 percent of the pumpage. Pumping was also heavy in the area just southeast of Tustin, but the water-level declines were not as large, probably because of the greater transmissivity in that area.
The water-level recovery in the Irvine area, 1956-71, is a result of two factors. One is a decrease in pumping in the area. Figure 11 shows a decrease in pumpage from more than 21,000 acre-feet in 1955 to about 14,500 acre-feet in 1971, almost a 31-percent reduction. The second factor is the spreading of imported water in the Santa Ana River. The contour maps indicate that the raising of water levels to the northwest in the coastal plain is beneficial because as a result less water leaves the Irvine area. Also, during times of pumping, water moves into the area from the main part of the coastal plain northwest of the Newport Freeway.
Ground-Water Quality
The chemical quality of the water in the area is quite variable, both laterally and with depth. Most of the wells are open to the aquifer from the water surface to the bottom of the well, so that distinctions of water quality with depth are not generally possible. Ground water in the Irvine area has sodium and calcium as its prevalent cations and either bicarbonate or sulfate as its main anion. The dissolved-solids content of the ground water generally ranges from 250 to 1,700 mg/1 (milligrams per liter) and averages about 800 mg/1.
Figure 15 shows that, in general, the source of poorer quality water is recharge from the Santa Ana Mountains. This poorer quality recharge is probably the result of ground-water inflow from the marine sedimentary rocks found in the Santa Ana Mountains. Some irrigation return flow in the foothill areas may also account for this poor-quality water. Sulfate and sodium distribution is generally similar to the pattern of dissolved solids seen in figure 15.

22 GEOHYDROLOGY, IRVINE AREA, ORANGE CO., CALIF.
T.5 S
R.9 R. R.8 R. H7°45'
FIGURE 9. Water-level elevations, January 1971,

GEOHYDROLOGY 23
II7°40'R 8 W.
^.Geology generalized after Schoellhaier an '' others (1954) and Vedder and others (1957
T.5 S. EXPLANATION
- GEOLOGIC CONTACT Boundary of alluvium
- DRAINAGE DIVIDE
-80 (HATER-LEVEL CONTOUR Shows elevation of water levels. Contour interval 10 feet; datum is mean sea level
o" WELL AND NUMBER
4 MILES
I17°40' R.8
FIGURE 9. Continued.

24 GEOHYDROLOGY, IRVINE AREA, ORANGE CO., CALIF.
^ 40
; Sea level
-20
FIGURE 10. Hydrograph of well 6S/8W-6P1.
FIGURE 11. Total annual pumpage southeast of Newport Freeway,

GEOHYDROLOGY 25
Figure 15 does not show that there has been direct influence on water chemistry as a result of spreading of Colorado River water in the Santa Ana River. In the main part of the Orange County coastal plain, however, the influence of Colorado River water is readily evident (Moreland and Singer, 1969b (fig. 4)). This influence may occur in the Irvine area but is masked by the high dissolved solids of the native water.
The water quality in the area has not changed markedly with time. A slight increase in the average dissolved solids was noted for most of the area, but no one cause of this trend could be identified. Scattered wells throughout the area indicated local occurrences of high chloride and, in some, high nitrate. No pattern could be found to account for these occurrences. Drillers' logs were not available for the wells in which degradation was evident. These local occurrences may be due to irrigation-return water entering the deep aquifers through poorly constructed wells.
Relation of the Aquifer to the Surrounding Areas
The aquifer section in the Tustin plain seems to be in hydraulic continuity with the rest of the coastal plain. Some factors, however, tend to distinguish it from the main part of the coastal plain.
One of these factors is that the alluvial deposits in the Irvine area are finer grained than those of the rest of the coastal plain. Figure 16 shows the percentage of clay indicated in the upper 100 feet of the drillers' logs. Although the percentages are too random to map, clay does predominate in this interval throughout the area. The clay content averages 80-90 percent throughout the Tustin plain. In the northwest corner of the area the clay content is less and is somewhat comparable to that found in the central part of the coastal plain.
Another factor is that the Fernando Formation, the main aquifer beneath the Tustin plain, is finer grained in the study area than in the rest of the coastal plain. The water-yielding intervals within the Fernando Formation probably average only 10-20 percent of the total section.
A third factor is that the thick section of water-yielding deposits that exist above the Fernando Formation in the rest of the coastal plain is absent beneath the Tustin plain. These deposits are mainly Pleistocene sand and gravel that are quite permeable where they occur in the rest of the coastal plain.
Because the direction of water movement in the area is determined by water levels not only in the Irvine area but also in the main part of the coastal plain, an attempt was made to determine the net flow across a line paralleling the Newport Freeway. But, owing to the rapid change in water levels and the difficulty in obtaining representative measurements during the pumping season, a net-flow quantity could not be obtained. To arrive at a valid estimate, a more complete knowledge of transmissivity and water levels is necessary.

26 GEOHYDROLOGY, IRVINE AREA, ORANGE CO., CALIF.
R.9 «. R.8 ». ) , 7 «45 1
T.5 S
R.9 W R.9 «. R.8 «. m°45'
FIGURE 12. Water-level elevations, spring 1956,

GEOHYDROLOGY 27
I17°40'R.B
T.5 S.
generalized after Schoellhamer an others (1954) and Vedder and others (1957
EXPLANATION
GEOLOGIC CONTACT Boundary of alluvium
DRAINAGE DIVIDE
-30 WATER-LEVEL CONTOUR Shows elevation of water levels. Contour interval 10 feet; datum is mean sea level
o" WELL AND NUMBER
in°4o' R.8
FIGURE 12. Continued.

28 GEOHYDROLOGY, IRVINE AREA, ORANGE CO., CALIF.
R.9
T.5 S.
U.S. Geological Survey, 1:24,000 1968, Tustin, 1965, Orange, 1964, r Canyon, 1967, Laguna, 1965, Capistrano, 1968
R.9 ». R.8 ». ii7°*5'
FIGURE 13. Water-level elevations, autumn 1956.
GEOHYDROLOGY 29
I7°40'R 8 W
Geology generalized after Schoel Ihamer an others (1954) and Vedder and others (1957
EXPLANATION
GEOLOGIC CONTACT Boundary of alluvium
DRAINAGE DIVIDE
WATER-LEVEL CONTOUR Shows elevation of water levels. Central closed depression contour is hachured. Contour interval 10 feet; datum is mean sea level
WELL AND NUMBER
4 MILES
FIGURE 13. Continued.

30 GEOHYDROLOGY, IRVINE AREA, ORANGE CO., CALIF.
R.9 ». R.8 ». ln °45'
T.5 S.
R.3 ». R.8 ». n7°45'
FIGURE 14. Water-level decline, spring-autumn 1956.

GEOHYDROLOGY 31
II7°40'R.8
1 ^Geology generalized after Schoellhamer an ' others (1954) and Vedder and others (1957
EXPLANATION
GEOLOGIC CONTACT Boundary of alluvium
DRAINAGE DIVIDE
30 LINE OF EQUAL WATER-LEVEL DECLINE Interval 10 feet
0A " WELL AND NUMBER
4 MILES
FIGURE 14. Continued.

32 GEOHYDROLOGY, IRVINE AREA, ORANGE CO., CALIF.
R.9 ». R.9 ». R.8 N. ln °45'
T.5 S
R.9 ». R.B ». ii7°45'
FIGURE 15. Dissolved-solids content of ground water,

GEOHYDROLOGY 33
EXPLANATION
GEOLOGIC CONTACT Boundary of alluvium
DRAINAGE DIVIDE
700 LINE OF EQUAL DISSOLVED-SOLIDS CONTENT IntervaI, 100 milligrams per Iiter
WELL AND NUMBER
DATA POINT AND NUMBER
.Geology generalized after SchoelIhamer and others (1954) and Vedder and others (1957
17°40' R.8
FIGURE 15. Continued.

34 GEOHYDROLOGY, IRVINE AREA, ORANGE CO., CALIF.
R.9 ». R.8 ». H7 o45 .
R.9 W. R.9 ». R.8 ». H7°45'
FIGURE 16. Percentage of clay in upper 100 feet as determined from drillers 1 logs.

GEOHYDROLOGY 35
17°40'R 8 W
EXPLANATION
GEOLOGIC CONTACT Boundary of alluvium
DRAINAGE DIVIDE
86 DATA POINT Number shows percentage of clay shown in upper 100 feet of driller's log
.^Geology generalized after SchoelIhamer and '' others (1954) and Vedder and others (1957)
in°40' R.8 w.
4 MILES
FIGURE 16. Continued.

36 GEOHYDROLOGY, IRVINE AREA, ORANGE CO., CALIF.
However, the general relation is as follows: Water generally tends to move out of the Irvine area from September through May and into the area during June, July, and August. This may vary by 2 or 3 months in any individual year. During 1953-69 it seemed that the net flow was out of the Irvine area.
The surrounding hills are the major source of recharge for the Irvine area. However, during times of heavy pumping and the resulting large water- level decline, water tends to move into the area from the coastal plain to the northwest. This recharge would not occur if water levels in the main part of the coastal plain were lower than those in the Irvine area. Spreading of Colorado River water in the Santa Ana River channel is one of the major factors in maintaining high water levels in the coastal plain.
ARTIFICIAL-RECHARGE POTENTIAL
More than 200 drillers' logs were processed by computer and analyzed to define textural variations in the subsurface material (fig. 16). This analysis shows that large-scale spreading of water in the central part of the Tustin plain is not feasible. As noted above, most of the logs showed a high percentage of clay in the upper 100 feet. Behavior of irrigation waste water also indicates low permeability of surface deposits; waste water flows for many miles in unlined drainage ditches without notable infiltration.
Potential recharge sites in the foothill areas were studied by means of shallow auger holes. A total of 31 holes was augered in the foothill area (fig. 3). The depth of the holes ranged from 30 feet to 108 feet, but most were between 40 and 80 feet. Silt and clay predominated in all the holes. The few sand and gravel lenses were generally close to the surface and were underlain by silt and clay. Water was found in more than half the holes and was contained in fine-grained deposits which in some areas immediately overlie the non-water-bearing rocks. This probably indicates that rainfall infiltrates into the hills and ultimately moves downgradient and recharges the ground-water basin beneath the Tustin plain.
Table 1 presents the data obtained from the test holes.

ARTIFICIAL-RECHARGE POTENTIAL
TABLE 1. Test-hole data
[Sites are shown in figure 3]
37
Auger hole No.
1234
56789
101112131415
16171819202122232425262728293031
Depth driller (feet below
land surface)
72623742
37108345762787157826236
3037425590779752
10747374242923752
Water level (feet below
land surface)
3242
nonenone
1242
none476062
none506744
none
none1512
none72
none37
none50
nonenone372727
none27
Hole bottomed in
SandstoneSilt and clayConglomerateSilt and fine
sanddo.
SandstoneConglomerateSilt and sand
do.SandstoneConglomerateSand with siltConglomerate
do.Claystone
*
SiltstoneSand and siltSandstoneConglomerateSandy clayClaySilt and sandClayConglomerateClaystoneSiltstoneSand and siltClaySand and siltSandstoneClay
Predominant material
Silt and clayDo.Do.Do.
Do.Do.Do.Do.Do.
SiltDo.
Fine sandSand and siltSiltSand and gravel
to 22 feetSiltstoneSand and siltClay and siltSand and siltClay
Do.Silt and sandSand above claySandClaystoneSiltstoneSandSand and gravelSand and siltSilt and sandClay

38 GEOHYDROLOGY, IRVINE AREA, ORANGE CO., CALIF.
Grain-size analyses made on selected samples (table 2) confirmed the field observation that silt and clay predominated in practically all the holes. In holes that penetrated a substantial thickness of sand and gravel, either the underlying non-water-bearing rock was at shallow depths or water was close to the surface, allowing little additional space for recharge.
TABLE 2. Selected grain-size analyses
Test holeNo.
11223344556677899
101011111212131314141516161717
Depth of
sample (ft)
17354
307
155
10103015573
10357
377
3216547
3216356
42306
276
15
<32 16
«- Pebble
00000000000000000000000000000000
0000000000000000005.6000005.60000000
8 4
gravel -*
1.00.9
000002.40000001.42.506.4002.800001.0000.5
0
0.20.1.1.4
01.4.1.3.2.5.1.9,3.6
1.12.0.3
1.3.5
0.6.8.2.5.2
3.70.7001.6.1
Percent (Sieve
2
Granule gravel
0.20.2.1.5.1.6.9.6.2
1.1.2
1.1.7.8
1.72.01.31.21.3.5
1.33.2.4.6.8
5.61.7.8.2
2.53.2
retained by weight size in millimeters)
1
Very coarse sand
2.22.41.31.43.33.01.55.12.21.23.91.63.52.04.14.33.94.13.83.5.8
3.53.52.52.25.18.34.26.1,5
4.916.1
0.5
Coarse sand
8.38.44.54.79.5
10.46.0
10.58.94.99.9
14.47.86.7
14.16.06.18.67.57.03.67.95.27.05.09.5
10.48.1
13.42.9
11.922.2
0.25 0.125
>led. Fine sand sand
16.6 14.823.1 21.69.9 10.736.1 22.918.6 15.515.8 15.512.7 9.010.9 9.712.2 8.823.3 16.413.5 10.016.7 11.413.5 11.811.8 12.919.4 13.38.6 9.29.4 14.711.0 12.412.8 11.213.8 15.210.2 25.610.9 10.88.1 11.1
18.3 21.511.9 13.918.4 17.210.7 9.712.2 11.815.4 11.16.3 6.3
21.0 13.913.0 9.0
0.625
Very fine sand
10.710.68.49.29.4
10.26.98.96.77.67.57.39.9
11.37.7
11.614.612.18.7
11.016.210.818.615.510.511.57.68.97.57.0
10.77.2
<0.625Total silt and
clay
46.033.764.125.542.844.961.953.957.846.453.648.451.554.439.956.244.850.241.447.843.151.349.534.549.837.342.952.345.876.832.829.2
CONCLUSIONS 39
Hence, it was concluded that large-scale water spreading for recharge in the Irvine area would not be feasible. Also, because of the low percentage of water-yielding intervals within the aquifer (p. 25), it was concluded that recharge using injection wells would not be feasible in the study area. From field observation it would appear that Santiago Creek, which lies just out of the Irvine area to the northeast, would afford the best possibility for water spreading for artificial recharge. Further work would be needed to confirm this conclusion, however.
CONCLUSIONS
The study yielded the following conclusions about the geohydrology of the Irvine area:
1. The major aquifer is the Fernando Formation which is more than 900 feet thick in the Irvine area.
2» The bottom of the aquifer is marked by the top of the Vaqueros and Sespe Formations.
3. The transmissivity of the aquifer is quite low compared with the rest of the coastal plain because of the high silt and clay content in the Irvine area.
4. There are no permeable water-bearing deposits of any significance below the Fernando Formation in the Irvine area.
5. Water levels have recovered greatly from their historic lows, but large seasonal water-level fluctuations still occur.
6. Recharge to the area is derived from the surrounding hills.
7. Recharge is derived from the main part of the coastal plain area when the water levels in the main part of the coastal plain are higher than those in the Irvine area; that is, in the autumn after heavy pumping for agriculture.
8. The area is in structural and hydraulic continuity with the rest of the coastal plain; however, the permeability of the deposits in the Irvine area is much lower.
9. Large-scale spreading of water for artificial recharge is not feasible because of the high silt and clay content of the near-surface sedimentary deposits.
10. Water quality is quite variable areally but shows no marked change with time and is adequate for irrigation purposes.

40 GEOHYDHOLOGY, IRVINE AREA, ORANGE CO., CALIF,
SELECTED REFERENCES
Andreasen, G. E., Pitkin, J. A., and Petrafeso, F. A., 1964, Aeromagnetic mapof the Long Beach-Santa Ana area, Los Angeles and Orange Counties,California: U.S. Geol. Survey Geophys. Inv. Map GP-464.
Boon, R. H., and Stephenson, R. E., 1959, Orange County land and water use survey, 1957: California Dept. Water Resources, Bull. 70, 57 p., app.
Brown and Caldwell, 1968, Irvine Ranch sewerage survey, Phases 1, 2, 3, and 4: Alhambra, Calif., Brown and Caldwell rept. prepared for the Irvine Ranch Water Dist., 161 p.
California Department of Water Resources, 1967a, Progress report on the ground water geology of the Coastal Plain of Orange County: 138 p.
____1967b, Progress report on water quality prediction procedure for the Coastal Plain of Orange County: 49 p.
1967c, Orange County land and water use survey, 1964: Bull. 70-64, 70 p.
Hardt, W. F., and Cordes, E. H., 1971, Analysis of ground-water system in Orange County, California, by use of an electrical analog model: U.S. Geol. Survey open-file rept., 60 p.
Lowry Engineering-Science, 1969, Water reclamation master plan for the IrvineRanch Water District: Santa Ana, Calif., Lowry Eng.-Sci. rept., preparedfor the Irvine Ranch Water Dist e , 80 p., app e
Moreland, J. A., and Singer, J. A., 1969a, A study of deep aquifers underlying coastal Orange County, California: U.S. Geol. Survey open-file rept., 27 p.
____1969b, Evaluation of water-quality monitoring in the Orange County Water District, California: U.S. Geol. Survey open-file rept., 27 p.
Norton, P. K., 1970, Geology of the NE% and NW^ Canada Gobernadora quadrangle, Orange County, California: California Div. Mines and Geology, prelim, rept. 10, 3 pis.
Orange County Flood Control District, 1970, Annual hydrology report, 1969-70 season: v. 6, 145 p.
Orange County Water District, 1972, Engineer's report on ground-waterconditions, water supply, and basin utilization in the Orange County Water District: 80 P.

SELECTED REFERENCES 41
Piper, A. M., Garrett, A. A., and others, 1953, Native and contaminatedground waters in the Long Beach-Santa Ana area, California: U 0 S. Geol. Survey Water-Supply Paper 1136, 320 p.
Poland, Jo F., 1959, Hydrology of the Long Beach-Santa Ana area, California, with special reference to the watertightness of the Newport-Inglewood structural zone, with a section on Withdrawal of ground water, 1932-41, by Alien Sinnott and J. F. Poland: U.S. Geol. Survey Water-Supply Paper 1471, 257 p.
Poland, J. F., Piper, A. M., and others, 1956, Ground-water geology of thecoastal zone, Long Beach-Santa Ana area, California: U.S. Geol. Survey Water-Supply Paper 1109, 162 p.
Schoellhamer, J. E., Kinney, D. M., Yerkes, R. F., and Vedder, J. G., 1954, Geologic map of the northern Santa Ana Mountains, Orange and Riverside Counties, California: U.S. Geol. Survey Oil and Gas Inv. Map OM-154.
Smith, R. D., 1971, Orange County land and water use survey 1970: California Dept. Water Resources rept., 30 p.
Theis, C. V., Brown, R. H., and Meyer, R. R., 1963, Estimating thetransmissibility of aquifers from the specific capacity of wells 'in Methods of determining permeability, transmissibility, and drawdown, compiled by Ray Bentall: U.S. Geol. Survey Water-Supply Paper 1536-1, p. 331-341.
Vedder, J. G., Yerkes, R. F., and Schoellhamer, J. E., 1957, Geologic map of the San Joaquin Hills-San Juan Capistrano area, Orange County, California: U.S. Geol. Survey Oil and Gas Inv. Map OM-193.
Yerkes, R. F., 1957, Volcanic rocks of the El Modeno area, Orange County, California: U.S. Geol. Survey Prof. Paper 274-L, p. 313-334.
Yerkes, R. F., McCulloh, T. H., Schoellhamer, J. E., and Vedder, J. A., 1965, Geology of the Los Angeles basin, California an introduction: U.S. Geol. Survey Prof. Paper 420-A, p. A1-A57.