united states international trade commission - association of fish
TRANSCRIPT


UNITED STATES INTERNATIONAL TRADE COMMISSION
This report was prepared principally by
Rose M. Steller
Animal and Forest Products BranchAgriculture and Forest Products Division
Robert A. Rogowsky
Address all communications toSecretary to the Commission
United States International Trade CommissionWashington, DC 20436
Director of Operations
COMMISSIONERS
Marcia E. Miller
Deanna Tanner Okun, ChairmanJennifer A. Hillman, Vice Chairman
Stephen Koplan
Acting Director of Industries
Charlotte R. LaneDaniel R. Pearson

1 The information and analysis provided in this report are for the purposes of this report only.Nothing in this report should be construed to indicate how the Commission would find in aninvestigation conducted under statutory authority covering the same or similar subject matter.
i
PREFACE
In 1991 the United States International Trade Commission initiated its current Industry andTrade Summary series of informational reports on the thousands of products imported intoand exported from the United States. Each summary addresses a differentcommodity/industry area and contains information on product uses, U.S. and foreignproducers, and customs treatment. Also included is an analysis of the basic factors affectingtrends in consumption, production, and trade of the commodity, as well as those bearing onthe competitiveness of U.S. industries in domestic and foreign markets.1
This report on furskins covers the period 1998-2002. Listed below are the individualsummary reports published to date on the agriculture and forest products sectors.
USITCpublicationnumber Publication date Title2459 November 1991 . . . . . . . . . . . Live Sheep and Meat of Sheep2462 November 1991 . . . . . . . . . . . Cigarettes2477 January 1992 . . . . . . . . . . . . . Dairy Produce2478 January 1992 . . . . . . . . . . . . . Oilseeds2511 March 1992 . . . . . . . . . . . . . . Live Swine and Fresh, Chilled, or
Frozen Pork2520 June 1992 . . . . . . . . . . . . . . . . Poultry2544 August 1992 . . . . . . . . . . . . . . Fresh or Frozen Fish2545 November 1992 . . . . . . . . . . . Natural Sweeteners2551 November 1992 . . . . . . . . . . . Newsprint2612 March 1993 . . . . . . . . . . . . . . Wood Pulp and Waste Paper2615 March 1993 . . . . . . . . . . . . . . Citrus Fruit2625 April 1993 . . . . . . . . . . . . . . . Live Cattle and Fresh, Chilled, or
Frozen Beef and Veal2631 May 1993 . . . . . . . . . . . . . . . . Animal and Vegetable Fats and Oils2635 June 1993 . . . . . . . . . . . . . . . . Cocoa, Chocolate, and Confectionery2636 May 1993 . . . . . . . . . . . . . . . . Olives2639 June 1993 . . . . . . . . . . . . . . . . Wine and Certain Fermented
Beverages2693 October 1993 . . . . . . . . . . . . . Printing and Writing Paper2702 November 1993 . . . . . . . . . . . Fur Goods2726 January 1994 . . . . . . . . . . . . . Furskins2737 March 1994 . . . . . . . . . . . . . . Cut Flowers2749 March 1994 . . . . . . . . . . . . . . Paper Boxes and Bags2762 April 1994 . . . . . . . . . . . . . . . Coffee and Tea

ii
PREFACE—CONTINUED
USITCpublicationnumber
Publicationdate Title
2859 May 1995 . . . . . . . . . . . . . . . Seeds2865 April 1995 . . . . . . . . . . . . . . Malt Beverages2875 May 1995 . . . . . . . . . . . . . . . Certain Fresh Deciduous Fruits2898 June 1995 . . . . . . . . . . . . . . . Certain Miscellaneous Vegetable
Substance and Products2917 October 1995 . . . . . . . . . . . . Lumber, Flooring, and Siding2918 August 1995 . . . . . . . . . . . . . Printed Matter2928 November 1995 . . . . . . . . . . Processed Vegetables3015 February 1997 . . . . . . . . . . . Hides, Skins, and Leather3020 March 1997 . . . . . . . . . . . . . Nonalcoholic Beverages3022 April 1997 . . . . . . . . . . . . . . Industrial Papers and Paperboards3080 January 1998 . . . . . . . . . . . . Dairy Products3083 February 1998 . . . . . . . . . . . Canned Fish, Except Shellfish3095 March 1998 . . . . . . . . . . . . . Milled Grains, Malts, and Starches3096 April 1998 . . . . . . . . . . . . . . Millwork3145 December 1998 . . . . . . . . . . Wool and Related Animal Hair3148 December 1998 . . . . . . . . . . Poultry3171 March 1999 . . . . . . . . . . . . . Dried Fruits Other Than Tropical3268 December 1999 . . . . . . . . . . Eggs3275 January 2000 . . . . . . . . . . . . Animal Feeds3350 September 2000 . . . . . . . . . . Grain (Cereals)3352 September 2000 . . . . . . . . . . Edible Nuts3355 September 2000 . . . . . . . . . . Newsprint3373 November 2000 . . . . . . . . . . Distilled Spirits3391 January 2001 . . . . . . . . . . . . Cotton3461 October 2001 . . . . . . . . . . . . Cured Fish3463 October 2001 . . . . . . . . . . . . Fresh or Frozen Fish3490 February 2002 . . . . . . . . . . . Wood Pulp and Waste Paper3576 February 2003 . . . . . . . . . . . Oilseeds3579 February 2003 . . . . . . . . . . . Live Sheep and Meat of Sheep3580 February 2003 . . . . . . . . . . . Cut Flowers3592 April 2003 . . . . . . . . . . . . . . Pasta3635 September 2003 . . . . . . . . . . Bakery Products

iii
CONTENTSPage
Preface . . . . . . . . . . . . . . . . . . . . . . . . . . . . . . . . . . . . . . . . . . . . . . . . . . . . . . . . . . . . . . . . . . . i
Abstract . . . . . . . . . . . . . . . . . . . . . . . . . . . . . . . . . . . . . . . . . . . . . . . . . . . . . . . . . . . . . . . . . 1
Introduction . . . . . . . . . . . . . . . . . . . . . . . . . . . . . . . . . . . . . . . . . . . . . . . . . . . . . . . . . . . 3
U.S. industry profile . . . . . . . . . . . . . . . . . . . . . . . . . . . . . . . . . . . . . . . . . . . . . . . . . 4
Industry structure . . . . . . . . . . . . . . . . . . . . . . . . . . . . . . . . . . . . . . . . . . . . . . . . . . . . . . . . 4Number of firms, employment, and geographic distribution . . . . . . . . . . . . . . . . . . . . . . . 4Labor and automation . . . . . . . . . . . . . . . . . . . . . . . . . . . . . . . . . . . . . . . . . . . . . . . . . . . . . 6Humane treatment and animal welfare . . . . . . . . . . . . . . . . . . . . . . . . . . . . . . . . . . . . . . . . 6Special considerations . . . . . . . . . . . . . . . . . . . . . . . . . . . . . . . . . . . . . . . . . . . . . . . . . . . . . 7Marketing methods . . . . . . . . . . . . . . . . . . . . . . . . . . . . . . . . . . . . . . . . . . . . . . . . . . . . . . . 8
Ranch furskins . . . . . . . . . . . . . . . . . . . . . . . . . . . . . . . . . . . . . . . . . . . . . . . . . . . . . . . . 8Wild furskins . . . . . . . . . . . . . . . . . . . . . . . . . . . . . . . . . . . . . . . . . . . . . . . . . . . . . . . . . 9
Research and development . . . . . . . . . . . . . . . . . . . . . . . . . . . . . . . . . . . . . . . . . . . . . . . . . 9
U.S. market . . . . . . . . . . . . . . . . . . . . . . . . . . . . . . . . . . . . . . . . . . . . . . . . . . . . . . . . . . . . 10
Consumer characteristics and factors affecting demand . . . . . . . . . . . . . . . . . . . . . . . . . . . 10Consumption . . . . . . . . . . . . . . . . . . . . . . . . . . . . . . . . . . . . . . . . . . . . . . . . . . . . . . . . . . . . 10Production . . . . . . . . . . . . . . . . . . . . . . . . . . . . . . . . . . . . . . . . . . . . . . . . . . . . . . . . . . . . . . 10
Ranch mink production . . . . . . . . . . . . . . . . . . . . . . . . . . . . . . . . . . . . . . . . . . . . . . . . . 10Wild fur harvest . . . . . . . . . . . . . . . . . . . . . . . . . . . . . . . . . . . . . . . . . . . . . . . . . . . . . . . 12
U.S. trade . . . . . . . . . . . . . . . . . . . . . . . . . . . . . . . . . . . . . . . . . . . . . . . . . . . . . . . . . . . . . . . 13
U.S. imports . . . . . . . . . . . . . . . . . . . . . . . . . . . . . . . . . . . . . . . . . . . . . . . . . . . . . . . . . . . . 13Products imported, levels, and trends . . . . . . . . . . . . . . . . . . . . . . . . . . . . . . . . . . . . . . . 13Principal import suppliers . . . . . . . . . . . . . . . . . . . . . . . . . . . . . . . . . . . . . . . . . . . . . . . 13U.S. importers . . . . . . . . . . . . . . . . . . . . . . . . . . . . . . . . . . . . . . . . . . . . . . . . . . . . . . . . 14
U.S. trade measures . . . . . . . . . . . . . . . . . . . . . . . . . . . . . . . . . . . . . . . . . . . . . . . . . . . . . . . 14Tariff measures . . . . . . . . . . . . . . . . . . . . . . . . . . . . . . . . . . . . . . . . . . . . . . . . . . . . . . . . 14Nontariff measures . . . . . . . . . . . . . . . . . . . . . . . . . . . . . . . . . . . . . . . . . . . . . . . . . . . . . 14
U.S. exports . . . . . . . . . . . . . . . . . . . . . . . . . . . . . . . . . . . . . . . . . . . . . . . . . . . . . . . . . . . . . 15Products exported, levels, and trends . . . . . . . . . . . . . . . . . . . . . . . . . . . . . . . . . . . . . . . 15Principal export markets . . . . . . . . . . . . . . . . . . . . . . . . . . . . . . . . . . . . . . . . . . . . . . . . . 15U.S. exporters . . . . . . . . . . . . . . . . . . . . . . . . . . . . . . . . . . . . . . . . . . . . . . . . . . . . . . . . . 16

iv
CONTENTS—ContinuedPage
U.S. trade—ContinuedForeign trade measures . . . . . . . . . . . . . . . . . . . . . . . . . . . . . . . . . . . . . . . . . . . . . . . . . . . . 16
Tariff measures . . . . . . . . . . . . . . . . . . . . . . . . . . . . . . . . . . . . . . . . . . . . . . . . . . . . . . . 16Nontariff measures . . . . . . . . . . . . . . . . . . . . . . . . . . . . . . . . . . . . . . . . . . . . . . . . . . . . 16
Foreign industry profile . . . . . . . . . . . . . . . . . . . . . . . . . . . . . . . . . . . . . . . . . . . . 17
Overview . . . . . . . . . . . . . . . . . . . . . . . . . . . . . . . . . . . . . . . . . . . . . . . . . . . . . . . . . . . . . . . 17Country/regional profiles . . . . . . . . . . . . . . . . . . . . . . . . . . . . . . . . . . . . . . . . . . . . . . . . . . 18
European Union . . . . . . . . . . . . . . . . . . . . . . . . . . . . . . . . . . . . . . . . . . . . . . . . . . . . . . 18Denmark . . . . . . . . . . . . . . . . . . . . . . . . . . . . . . . . . . . . . . . . . . . . . . . . . . . . . . . . . 19Netherlands . . . . . . . . . . . . . . . . . . . . . . . . . . . . . . . . . . . . . . . . . . . . . . . . . . . . . . . 19Finland . . . . . . . . . . . . . . . . . . . . . . . . . . . . . . . . . . . . . . . . . . . . . . . . . . . . . . . . . . . 20Sweden . . . . . . . . . . . . . . . . . . . . . . . . . . . . . . . . . . . . . . . . . . . . . . . . . . . . . . . . . . 20
Asia . . . . . . . . . . . . . . . . . . . . . . . . . . . . . . . . . . . . . . . . . . . . . . . . . . . . . . . . . . . . . . . . 21Hong Kong . . . . . . . . . . . . . . . . . . . . . . . . . . . . . . . . . . . . . . . . . . . . . . . . . . . . . . . 21China . . . . . . . . . . . . . . . . . . . . . . . . . . . . . . . . . . . . . . . . . . . . . . . . . . . . . . . . . . . . 22Korea . . . . . . . . . . . . . . . . . . . . . . . . . . . . . . . . . . . . . . . . . . . . . . . . . . . . . . . . . . . . 23
Russia . . . . . . . . . . . . . . . . . . . . . . . . . . . . . . . . . . . . . . . . . . . . . . . . . . . . . . . . . . . . . . 23Canada . . . . . . . . . . . . . . . . . . . . . . . . . . . . . . . . . . . . . . . . . . . . . . . . . . . . . . . . . . . . . 24
Appendixes . . . . . . . . . . . . . . . . . . . . . . . . . . . . . . . . . . . . . . . . . . . . . . . . . . . . . . . . . . . . .A. Explanation of tariff and trade agreement terms . . . . . . . . . . . . . . . . . . . . . . . . . . . . . . . . . . . . A-1B. Statistical tables . . . . . . . . . . . . . . . . . . . . . . . . . . . . . . . . . . . . . . . . . . . . . . . . . . . . . . . . . . . . . B-1
Figures1. Furskins: Structure of the U.S. industry . . . . . . . . . . . . . . . . . . . . . . . . . . . . . . . . . . . . . . . . . . 52. Mink furskins: U.S. production, imports, and apparent consumption, 1998-2002 . . . . . . . . . . 11
TablesB-1. Mink: Number of farms and pelts produced, by leading States, 1998-2002 . . . . . . . . . . . B-3B-2. Mink furskins: U.S. production, exports of domestic merchandise, imports for
consumption, and apparent consumption, 1998-2002 . . . . . . . . . . . . . . . . . . . . . . . . . . B-3B-3. Ranch mink furskins: U.S. pelts produced, average market price, and value of
mink pelts, 1998-2002 . . . . . . . . . . . . . . . . . . . . . . . . . . . . . . . . . . . . . . . . . . . . . . . . . . B-4B-4. Furskins: U.S. wild fur harvest, by major species and region of catch, 1997-98
harvest . . . . . . . . . . . . . . . . . . . . . . . . . . . . . . . . . . . . . . . . . . . . . . . . . . . . . . . . . . . . . . B-4B-5. Fur harvest: Average pelt prices for certain wild furbearers, by region of catch,
1997-98 harvest . . . . . . . . . . . . . . . . . . . . . . . . . . . . . . . . . . . . . . . . . . . . . . . . . . . . . . . B-5

CONTENTS—ContinuedPage
v
Tables—ContinuedB-6. Furskins: U.S. exports of domestic merchandise, imports for consumption, and
merchandise trade balance, by selected countries, and country groups, 1998-2002 . . . B-6B-7. Furskins: U.S. imports for consumption, by principal types, 1998-2002 . . . . . . . . . . . . . . B-7B-8. Furskins: U.S. imports for consumption, by principal sources, 1998-2002 . . . . . . . . . . . . B-7B-9. Mink furskins: U.S. imports for consumption, by principal sources, 1998-2002 . . . . . . . B-8B-10. Fox furskins: U.S. imports for consumption, by principal sources, 1998-2002 . . . . . . . . . B-8B-11. Furskins: Harmonized Tariff Schedule subheadings; description; U.S. col. 1 rate of
duty as of Jan. 1, 2003; U.S. exports, 2002; and U.S. imports, 2002 . . . . . . . . . . . . . . . B-9B-12. Furskins: U.S. exports of domestic merchandise, by principal types, 1998-2002 . . . . . . . B-12B-13. Furskins: U.S. exports of domestic merchandise, by selected countries and regions,
1998-2002 . . . . . . . . . . . . . . . . . . . . . . . . . . . . . . . . . . . . . . . . . . . . . . . . . . . . . . . . . . . B-13B-14. Mink furskins: U.S. exports of domestic merchandise, by selected countries and
regions, 1998-2002 . . . . . . . . . . . . . . . . . . . . . . . . . . . . . . . . . . . . . . . . . . . . . . . . . . . . . B-13B-15. Mink furskins: World production by principal producing countries, 1998-2002 . . . . . . . B-14B-16. Farmed fox: Number of pelts offered on the world market, 1998-2002 . . . . . . . . . . . . . . B-14B-17. Furskins: World imports, by major markets, 1998-2001 . . . . . . . . . . . . . . . . . . . . . . . . . . B-14B-18. Fur farming: Action taken to abolish fur farms, by selected countries . . . . . . . . . . . . . . . B-15


OMB No.: 3117--0188
01/04
ITC READER SATISFACTION SURVEYIndustry and Trade Summary: Furskins
The U.S. International Trade Commission (USITC) is interested in your voluntary com-ments (burden less than 10 minutes) to help assess the value and quality of our reports, and to assistin improving future products. Please return survey by facsimile (202-205-2384) or by mail to theUSITC, or visit the USITC Internet home page(http://reportweb.usitc.gov/reader_survey/readersurvey.html) to electronically submit a Web version ofthe survey.
(Please print; responses below not for attribution):
Your name and title:
Organization (if applicable):
Which format is most useful to you? - CD-ROM - Hardcopy - USITC Internet site
Circle your assessment of each factor below: SA = strongly agree, A = agree, N = no opinion,D = disagree, or SD = strongly disagree.
Value of this report:" Statistical data are useful SA A N D SD. . . . . . . . . . . . . . . . . . . . . . . . . . . . . ." Other non-numerical facts are useful SA A N D SD. . . . . . . . . . . . . . . . . . ." Analysis augments statistical data/other facts SA A N D SD. . . . . . . . . . . ." Relevant topic(s)/subject matter SA A N D SD. . . . . . . . . . . . . . . . . . . . . . . ." Primary or leading source of information on this subject SA A N D SD. .
Quality of this report:" Clearly written SA A N D SD. . . . . . . . . . . . . . . . . . . . . . . . . . . . . . . . . . . . . . ." Key issues are addressed SA A N D SD. . . . . . . . . . . . . . . . . . . . . . . . . . . . . . ." Charts and graphs aid understanding SA A N D SD. . . . . . . . . . . . . . . . . . ." References cite pertinent sources SA A N D SD. . . . . . . . . . . . . . . . . . . . . . .
Other preferred source of information on this subject:
Specify chapters, sections, or topics in report that are most useful:
Identify any type of additional information that should have been included in report:
Suggestions for improving report:
Please update your mailing and electronic addresses below (voluntary)-
Mailing address:
City, state, and zip code:
E-mail address:

UNITED STATESINTERNATIONAL TRADE COMMISSION
WASHINGTON, DC 20436
OFFICIAL BUSINESSPENALTY FOR PRIVATE, USE $300
FOLD
NO POSTAGENECESSARY
IF MAILEDIN THE
UNITED STATES
BUSINESS REPLY MAILFIRST CLASS PERMIT NO. 12840 WASHINGTON, DC
POSTAGE WILL BE PAID BY ADDRESSEE
U.S INTERNATIONAL TRADE COMMISSION500 E STREET, SW.WASHINGTON, DC 20277--2840
ATTN:OFFICE OF INDUSTRIESITS: Furskins

1
ABSTRACT
This report addresses trade and industry conditions for fur-bearing animals and the peltsderived from fur bearers for the period 1998-2002.
• The United States is the world’s largest-volume producer of furskins derivedfrom animals harvested in the wild, and the fourth largest producer offarm-raised mink. Mink is by far the most important fur bearer raised on farms,ahead of other species such as fox and chinchilla.
• U.S. farmed mink pelt production continued its long-term downward trendbetween 1998 and 2002. In 2002, ranch mink pelt production (estimated toaccount for more than 50 percent of total U.S. production) totaled 2.6 millionpelts, valued at $79.6 million, down 12 percent (by quantity) from 1998. Datafor wild furskin production and other ranched production (e.g., fox andchinchilla) are estimated at $70 million for 2002.
• The number of U.S. mink farms declined from 438 in 1998 to 318 in 2002.Average pelt production during the period rose from 6,708 pelts per farm to8,177 pelts per farm, reflecting consolidation in the mink industry.
• Denmark was by far the leading mink-producing country, accounting for nearly40 percent of world production in 2002. Other major foreign producers includedthe Netherlands, Russia, Finland, China, Sweden, and Canada. World productionof mink furskins is estimated at 30.9 million pelts in 2002, up from 27.7 millionpelts in 1999.
• The ultimate consumers of furs, both wild and farm, are wearers of fur garmentsand accessories. Important factors influencing demand for fur include theweather, economic conditions, and fashion trends. Antifur legislation hasresulted in the banning of fur farms in some countries.
• Canada was the largest single country supplier of furskins to the U.S. market,
accounting for 35 percent (by value) of U.S. imports in 2002. The EU,principally the countries of the Netherlands, Finland, Spain, Sweden, andDenmark, accounted for 46 percent of U.S. furskin imports in 2002. U.S.imports from Russia consisted primarily of sable while Finland was the largestU.S. supplier of fox pelts.
• U.S. furskin imports fluctuated from a low of $73.3 million in 1999 to a high of$95.6 million in 2001, generally reflecting changes in unit value per pelt. Forexample, the average price per mink pelt ranged from a low of $24.53 in 1999to a high of $28.30 in 2002. Imports of mink pelts accounted for 53 percent ofthe value of U.S. imports in 2002.
• The United States is a major exporter of both wild and farmed furskins. Majorexport markets for U.S. furskins include Canada, the EU, and Asia. U.S. exportsto Asia (primarily Hong Kong and Korea) as a share of total exports grew from22 percent in 1998 to 47 percent in 2002.


1 Furskins are also referred to as skins or pelts. 2 For information on the dressing and the fur garment manufacturing sectors, see USITCIndustry & Trade Summary, “Fur Goods,” USITC publication 2702, Nov. 1993. 3 The International Fur Trade Federation, The Socio-Economic Impact of European FurFarming found at http://www.iftf.com/socio.asp, retrieved Apr. 30, 2003.
3
INTRODUCTION
This summary covers furskins,1 raw and tanned or dressed, dyed or not dyed. Informationis provided on the structure of the U.S. industry and certain foreign industries, U.S. andforeign tariff and nontariff measures, and the competitive conditions of U.S. producers inboth domestic and foreign markets. The analysis primarily covers the period 1998-2002.Appendix A is an explanation of tariff and trade agreement terms. Appendix B is statisticaltables.
The furskin industry consists of three segments: (1) the raw furskin supply segment; (2) thedressing or pelt processing segment; and (3) the fur garment manufacturing segment. Thissummary primarily addresses the raw furskin segment.2
Furskins (pelts) are derived from animals either raised in captivity on fur farms or obtainedfrom the wild catch of trappers and hunters (including such species as muskrat, raccoon,beaver, bobcat, fox, and mink). Approximately 85 percent of the world furskin productionis derived from farm-raised species.3 Raw or undressed furskins are either unprocessed pelts,or processed pelts that have not been subject to any processing to preserve them indefinitelyin a pliant state. Most furskins are sold undressed at public auctions under an opencompetitive bidding system. All furskins are tanned before they are made into fur goods, andmany dressed furskins are dyed to provide uniform color or to improve their appearance orto meet current fashion trends. The principal end use for processed furskins is themanufacture of fur apparel, such as coats and jackets, and as trim or lining for cloth orleather coats.
Mink is by far the most important fur bearer raised on farms although other species such asfox and chinchilla are also raised commercially. The United States is the fourth-largest minkpelt producer in the world. Pelts derived from U.S. farm mink production currently accountsfor 8 percent of world supply. In 2002, U.S. production totaled approximately 2.6 millionpelts, valued at $79.6 million.
U.S. imports of furskins in 2002 were valued at $87.2 million, most of which enter duty-free.The value of U.S. exports of furskins totaled $172.6 million, and the U.S. trade surplus infurskins totaled $86 million in 2002.

4 U.S. Census Bureau, North American Industry Classification System (NAICS), found athttp://www.census.gov/epcd/naics02/index.html, retrieved Apr. 16, 2003. 5 Mink account for the bulk of U.S. furskin production and data on mink are available fromvarious sources. Production data relating to other species of fur-bearing animals are generallyunavailable or limited. 6 Statistical tables are in appendix B. 7 Jack Brennan, senior vice president, Mink Specialties Co., Dundee, IL Raising Mink and Fox,speech presented at a conference sponsored by Successful Farming magazine found athttp://www.uwyo.edu/AGadmin/-sustainableag/Powell’s Publications/mink.3col.pdf, retrieved Apr.21, 2003. 8 USDA, National Agricultural Statistics Service (NASS), Mink, various issues. 9 Fur Commission USA, press release, “U.S. Fur Farms Continue Consolidation,” July 20,2002, found at http://www.furcommmission.com/news/newsfo5C.HTM, retrieved Apr. 18, 2003.
4
U.S. INDUSTRY PROFILE
Industry Structure
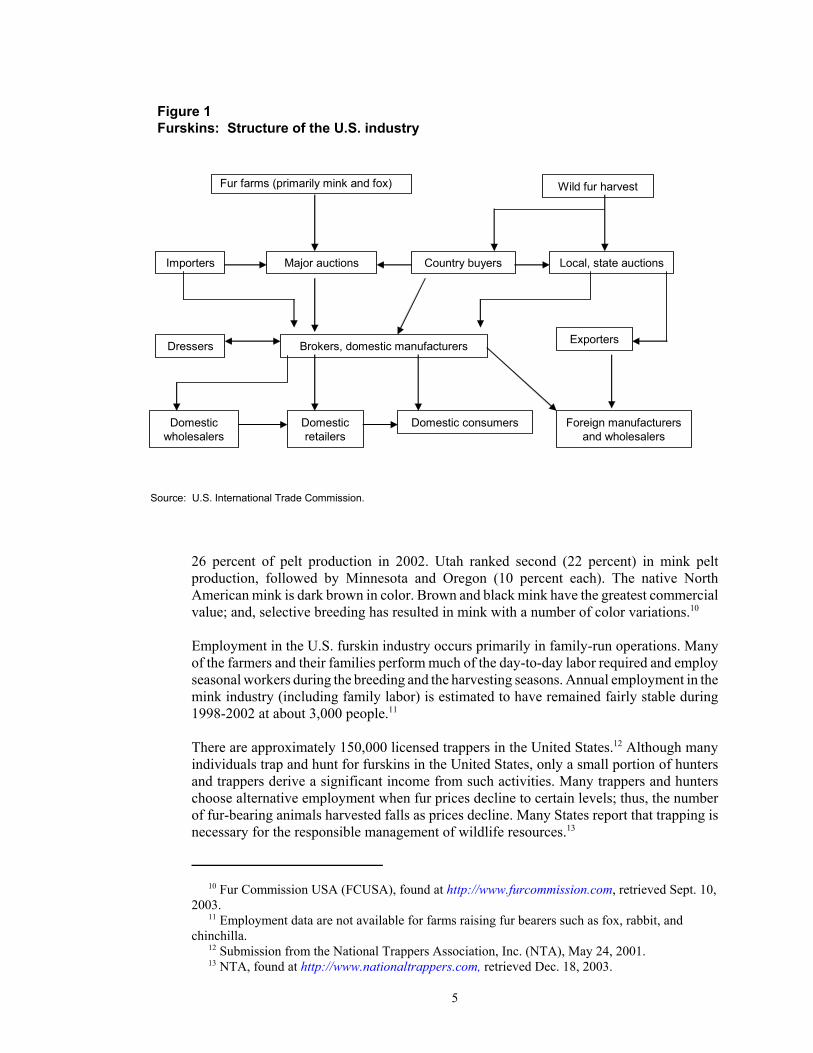
The structure of the U.S. furskin industry is shown in figure 1. The North American IndustryClassification System (NAICS) categories applicable to the products in this digest are Fur-bearing Animal and Rabbit Production (11293 pt.), Hunting and Trapping (11421 pt.), andLeather and Hide Tanning and Finishing (336110 pt.).4
Number of Firms, Employment, and GeographicDistribution5
The number of mink farms in the United States declined from 438 in 1998 to 318 in 2002,or by 27 percent (table B-1).6 In 2002, Utah had 80 farms followed by Wisconsin with69 farms and Minnesota with 33. The size of the operation can vary significantly; from a fewdozen breeding pairs to thousands of animals. However, the average U.S. mink farm consistsof 800 females and 160 males.7 Most U.S. mink farms or ranches are usually small, family-owned businesses. The number of mink farms that also raised fox in 2002 totaled 20, downby 13 percent from 1998.8
Although the number of fur farms declined during 1998-2002, average pelt production perfarm rose by 22 percent (from 6,708 pelts per farm to 8,177 pelts per farm). The increase inpelt production per farm coupled with the decline in the number of farms reflected, in part,consolidation in the mink industry as smaller operations merged to form larger ones, andmultiple operations by individual families merged under a single corporate umbrella.9
Mink pelt production in the United States totaled 2.6 million pelts in 2002. Although Utahhad the most mink farms, Wisconsin ranked first in mink pelt production, accounting for
10 Fur Commission USA (FCUSA), found at http://www.furcommission.com, retrieved Sept. 10,2003. 11 Employment data are not available for farms raising fur bearers such as fox, rabbit, andchinchilla. 12 Submission from the National Trappers Association, Inc. (NTA), May 24, 2001. 13 NTA, found at http://www.nationaltrappers.com, retrieved Dec. 18, 2003.
5
Figure 1Furskins: Structure of the U.S. industry
Wild fur harvest
Local, state auctions
Exporters
Domestic consumers
Source: U.S. International Trade Commission.
Fur farms (primarily mink and fox)
Importers Major auctions Country buyers
Dressers Brokers, domestic manufacturers
Foreign manufacturers and wholesalers
Domestic retailers
Domestic wholesalers
26 percent of pelt production in 2002. Utah ranked second (22 percent) in mink peltproduction, followed by Minnesota and Oregon (10 percent each). The native NorthAmerican mink is dark brown in color. Brown and black mink have the greatest commercialvalue; and, selective breeding has resulted in mink with a number of color variations.10
Employment in the U.S. furskin industry occurs primarily in family-run operations. Manyof the farmers and their families perform much of the day-to-day labor required and employseasonal workers during the breeding and the harvesting seasons. Annual employment in themink industry (including family labor) is estimated to have remained fairly stable during1998-2002 at about 3,000 people.11
There are approximately 150,000 licensed trappers in the United States.12 Although manyindividuals trap and hunt for furskins in the United States, only a small portion of huntersand trappers derive a significant income from such activities. Many trappers and hunterschoose alternative employment when fur prices decline to certain levels; thus, the numberof fur-bearing animals harvested falls as prices decline. Many States report that trapping isnecessary for the responsible management of wildlife resources.13

14 Utah Farm Bureau News, “The state of mink: A visit to one of Utah’s many minkoperations,” found at http://www.fb.com/utfb/News/March, retrieved Apr. 18, 2003. 15 Furbusiness, “Fur Facts - fur to fashion,” found at http://www.furbusiness.com/FurFacts/8/,retrieved Apr. 18, 2003. 16 “Characteristics, Activities, Lifestyles, and Attitudes of Trappers in North America,” ch. 7 inWild Furbearer Management and Conservation in North America, ed. Milan Novak and others(Ontario: The Ontario Trappers Association, 1987), p. 72.
6
Labor and Automation
Raising fur-bearing animals and the preservation of the pelts are highly labor-intensive. Asstated, many mink farmers hire seasonal workers during the breeding and harvesting seasons.Mink and fox are generally raised in pens, housed within covered (open-sided) sheds.Newborn mink (kits) remain in the pens with their mothers until weaned (after approximately6 weeks), at which time they are separated, with two to a pen. Once the kits are mature(about 12 weeks), they are placed in individual pens to prevent the mink from inflicting furdamage to their pen mates. Farmers check the quality of fur of each animal, retaining theanimals with the best fur for breeding purposes.14
The use of mechanical feeders and watering systems assist many farmers in their dailyfeedings. Many farmers are employing computer software systems to maintain detailedrecords about their animals, including genetic characteristics and the value of the peltsproduced.
Skill is required in processing raw pelts or dressed skins. Before pelts come to auction, thepelts are scraped and stretched on boards to dry and maintain consistent shape. This preventsthe pelts from decaying and allows the pelts to be stored. Dressing pelts is a highly skilledprocess involving many steps, including soaking the pelts in brine or saline solutions tosoften the pelts, placing the pelts in a drum to soften further, and pickling the pelts (a processin which chrome is added to the pelt). The pelts are then stretched and may be dyed. Afterprocessing, the pelts are then sorted and made ready for the furrier or manufacturer.15
Humane Treatment and Animal Welfare
Opposition to the raising of furbearers and the harvesting of wild furbearers (primarily fortheir pelts) by animal rights activists and animal welfare groups has grown tremendouslysince the late 1960s. Opposition to trapping and raising of animals (for human benefit) isbased in part on moral and ethical grounds as well as concern for animal welfare. Althoughthere is some overlap, the animal rights activists generally oppose any nonessential humanuse of animals, whereas the welfare groups generally strive to promote legislation that willeffectively result in more humane and ethical treatment of wild and farm-raised animals.16
Some opposition groups have acted on their concerns by raiding mink farms and releasinganimals, causing economic losses to the fur industry.

17 FCUSA, “Fur Facts,” found at http://www.furcommission.com/farming/pelts.htm, retrievedApr. 30, 2003. 18 The International Association of Fish and Wildlife Agencies (IAFWA) is an organization ofpublic agencies charged with the protection and management of North America’s fish and wildliferesources. All 50 States are members. Best Management Practice (BMP) is a method to improvean activity by developing recommendations based on sound scientific information whilemaintaining practicability. 19 IAFWA, “Best Management Practices for Trapping Furbearers in the United States,” May 10,2001.
7
According to the Fur Commission USA (FCUSA), the raising of fur-bearing animalsinvolves good husbandry and humane farm management practices. Sound genetics andquality feed programs are necessary to ensure optimal growth and production of top qualitypelts. Fur farming is regulated by local, State, national, and sometimes international humaneregulations. In addition, country fur breeders associations generally follow “Codes ofPractice” developed with cooperation from fur farmers, government, scientists, veterinarians,and animal-welfare authorities. In the United States, mink standards are administered by theFCUSA and for fox by the U.S. Fox Shippers Council.17
The catching of fur bearers in the wild requires expert trapping and hunting techniques.Knowledge of baits, lures, traps, site location, and animal behavior are fundamental skillsnecessary for successful trapping and hunting. Trapping has long been a controversial topicin wildlife management and conservation, mainly because of questions surrounding animalwelfare and humane capture practices, as well as animal rights concerns. In 1996, theInternational Association of Fish and Wildlife Agencies (IAFWA) started a program toresearch and develop “Best Management Practices” (BMPs) for trapping fur bearers in theUnited States.18 Once developed, BMPs are provided to State agencies and trappers forincorporation into trapper education and wildlife management programs. BMPs are aimedat improving the welfare of animals captured in traps by identifying the best traps for eachspecies of fur bearers in the United States. In addition, BMPs are used to addressinternational commitments to identify and promote the use of humane traps and trappingmethods for capturing wildlife.19
Special Considerations
Feed cost is the largest cost incurred by fur farms (and for many other farm-raised animals),representing 50-60 percent of the total cost of producing a pelt. Mink require a high-qualityprotein feed for reproductive performance, growth of the kits, and ultimately for theproduction of high-quality fur pelts. Fur farms purchase agricultural byproducts from theproduction of human food, including raw meat from the beef, pork, and poultry industries,as well as fish byproducts. The component of the feed may differ by region, as fur farmsgenerally purchase byproducts of agricultural industries produced locally. Prepared rationssold by animal feed companies may supplement the diet.
Most of the byproducts consumed by fur bearers are products unfit for human consumption.Some fur farmers contend that they provide an environmentally friendly service by utilizingmillions of tons of meat byproducts, that, for the most part, would go unused and add tolandfill waste. For example, in Wisconsin, cheese byproducts unfit for human consumption

20 FCUSA, “Fur Farming’s Role in Agriculture,” found at http://www.furcommission.com/-farming/-role.htm, retrieved May 2, 2003. 21 Ibid. 22 The Salt Lake Tribune, “Co-op Sued for Not Delivering Feed to Remote Mink Ranch,” bySteven Oberbeck, Nov. 9, 2002, found at www.sltrib.com/2002/nov/11092002/business/-14837.htm, retrieved May 6, 2003. 23 Utah Farm Bureau News, Mar. 2001, “The state of mink: A visit to one of Utah’s many minkoperations,” found at http://www.fb.com/utfb/News/March%20News%20-%20Web/MINK%20-story.htm, retrieved May 6, 2003. 24 Formerly known as the Seattle Fur Exchange. 25 American Legend, found at http://www.seattlefur.com, retrieved Sept. 10, 2003. 26 North American Fur Auctions, press release, “NAFA Expands US Midwest Operations,”July 18, 2002, found at http://nafa.ca/news/PrssRls.July.18,2002.htm, retrieved Sept. 10, 2003,and Sandy Parker Report, Vol. 26, No. 22, July 22, 2002, found at http://www.furcommison.com/-news/SP4K.htm, retrieved Sept. 10, 2003.
8
are used by area fur farms to feed mink and fox.20 In Utah, fish byproducts from canneriesin California as well as byproducts from seven other States are trucked into a central feedmill.21 In addition, purchases of byproducts that would otherwise be disposed of provide asource of revenue for other farm producers.
Some ranchers have organized cooperatives in which members are provided with reducedcost feed as well as other needed supplies. In Utah, farmed fur bearers consume over 50million pounds of animal byproducts annually. The Utah Fur Breeders AgriculturalCooperative provides reduced cost feed to approximately 130 ranches in Utah and SouthernIdaho.22 In addition to lowering feed cost to its members, the Utah co-op eliminates the needfor ranchers to purchase capital-intensive mixing equipment.23
Marketing Methods
Ranch Furskins
Ranch furskins are largely marketed through international auctions. Major North Americanauctions that offer farm-produced pelts include the American Legend Auctions (ALA)24 andthe North American Fur Auctions (NAFA). ALA is in Seattle and is a U.S. producer-ownedcooperative. In addition to North American mink, ALA also sells European mink, NorthAmerican wild fur, and North American and European farm fox.25
NAFA sells both farm-produced pelts and wild furs in its Toronto facility. Auctions in theNAFA New Jersey facility were halted after the September 11, 2001, tragedy to ease fearsof foreign buyers traveling to New York. In August 2002, NAFA officials terminated itsleasing agreement on this facility, leaving its facility in Toronto as its sole auction house.Meanwhile NAFA expanded its Wisconsin office and full service processing facility usedfor fur grading and cold storage.26
Although the first auction sales of the marketing year usually occur in October, largervolume sales occur during January through May. The principal buyers at auctions are furskindealers and fur garment or manufacturers of fur trim. Generally, sellers and buyers at

27 USDA, Cooperative State Research Education and Extension Service (CSREES) facsimile,“Public Funding for Mink and Rabbit Research,” May 12, 2003. Funding dollars are for calendaryear 2001. 28 According to a USITC staff telephone interview with a USDA official, there is very little ifany Federally funded mink research, May 7, 2003. 29 The Mink Farmers’ Research Foundation is a committee of Fur Commission USA. See 2003Blue Book of Fur Farming, p. 26. 30 Minnesota Foundation for Responsible Animal Care, “Fur Farmers Care,” found athttp://www.mnbeef.org/-MnFRAC/fur.htm, retrieved May 5, 2003. 31 USDA, Cooperative State Research, Education and Extension Service (CSREE), “ThrivingLivestock,” found at http://www.reeusda.gov/success/Animal.Final.html, retrieved May 7, 2003.
9
auctions are assessed a fee. Major European fur auctions are in Copenhagen, Denmark, andHelsinki, Finland.
Wild Furskins
Wild furskin harvesters have many options in marketing their furskins. Some harvestersmarket their furs through country buyers, who then sell them to auction houses, brokers,exporters, and/or fur manufacturers. Some harvesters rely on auctions organized by local andState trapping associations to market their furs. A commission is generally charged to the furharvester. In addition, some wild furskins are marketed to international auction houses. Suchfurs are grouped in uniform lots and consequently command a higher price than trappers’bundles auctioned at local or State associations. Some international auctions that market wildfurs include NAFA, ALA, and Fur Harvesters Auction, Inc., North Bay, Ontario.
Research and Development
USDA, Cooperative State Research, Education and Extension Service (CSREES) collectsdata on public research expenditures and funding for fur-bearing animals. There are threeactive research projects for mink and two for rabbits, with funding for mink research totaling$42,870 and funding for rabbit research totaling $90,569.27 These expenditures are from allsources (Federal, State, and private).28 Research is conducted at various universities and landgrant institutions (e.g., the University of Minnesota). The Mink Farmers’ ResearchFoundation29 also supports many research projects that focus attention on genetics, diseasecontrol, and animal behavior.30
Aleutian disease (AD) is a highly infectious disease affecting ranch-raised mink. Currentlythere is no treatment, vaccine, or cure known for AD. In addition to high mortality rates, ADcauses severe economic losses in both reproduction and fur value. AD infects about30 percent of the mink herds in Utah, resulting in mortality of about 20 percent. A vaccineis being developed against the disease by Utah State University that promises to eliminatethese losses, which could save Utah mink producers $2.4 million.31
32 Estimated by the staff of the USITC.
10
U.S. MARKET
Consumer Characteristics and Factors Affecting Demand
The intermediate consumers of furskins (ranch and wild) are fur dressers or wearing apparelmanufacturers; however, the ultimate consumers are wearers of fur garments. Demand forfur is primarily driven by weather (i.e. the colder the climate the greater demand), economicconditions, and fashion trends. Fur is considered a luxury item and in times of economicdownturns demand for fur products declines. The promotion of anti-fur messages by variousanimal rights groups can also dampen the demand for fur apparel.
Consumption
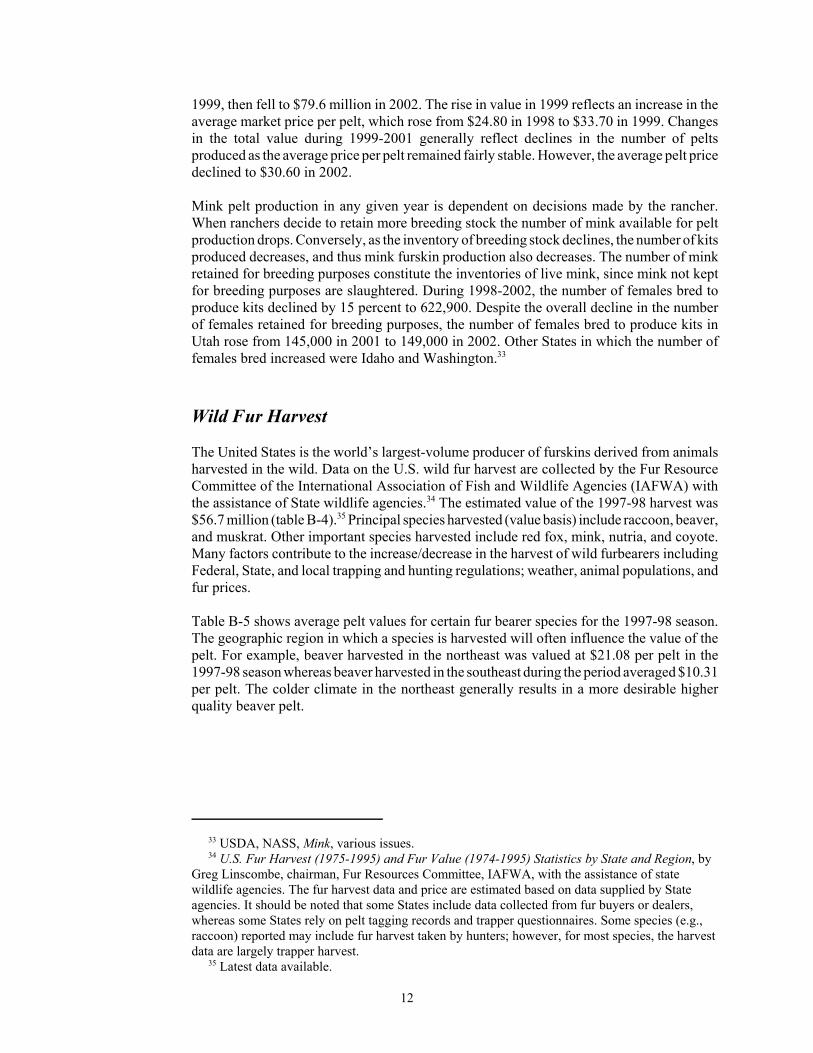
Industry sources indicate that mink pelts account for the bulk of U.S. furskin consumption.Consumption data on other species are unavailable. U.S. apparent consumption of minkfurskins declined significantly between $37.6 million in 1998 to $7.3 million in 2002 asshown figure 2 and table B-2. The decline in consumption reflected, in part, a decline in U.S.mink pelt production, a greater share of U.S. mink pelts purchased by international markets(increase in U.S. exports), and a decrease in the number of mink pelts imported. Importsaccounted for 57 percent of the value of U.S. mink production in 2002. As shown in tableB-2, U.S. mink exports exceeded U.S. mink production during 1998-2002. This anomalyoccurred because statistics on U.S. mink production do not account for pelt inventories orfor wild mink pelts harvested; U.S. export data, however, include inventoried pelts and wildmink pelts harvested, as well as farmed pelt production.
Production
Total U.S. furskin production is estimated at $151 million in 2002.32 During 1998-2002, U.S.ranched mink furskin production continued its long-term downward trend. The number ofmink pelts produced, the average marketing price, and the value of production for 1998-2002is shown in table B-3.
Ranch Mink Production
Mink pelt production totaled 2.6 million pelts in 2002, down by 12 percent from 1998. Thevalue of mink pelt production rose sharply from $72.9 million in 1998 to $94.8 million in

#
#
#
##
1998 1999 2000 2001 20020
20
40
60
80
100
120
140Million dollars
U.S. production U.S. imports Apparent consumption#
Note.--Inventories are not available.
Source: Production data compiled from the U.S. Department of Agriculture, NASS, Mink, July 15, 2003. Import data compiled from official statistics of the U.S. Department of Commerce.
Figure 2Mink furskins: U.S. production, imports, and apparent consumption, 1998-2002
11
33 USDA, NASS, Mink, various issues. 34 U.S. Fur Harvest (1975-1995) and Fur Value (1974-1995) Statistics by State and Region, byGreg Linscombe, chairman, Fur Resources Committee, IAFWA, with the assistance of statewildlife agencies. The fur harvest data and price are estimated based on data supplied by Stateagencies. It should be noted that some States include data collected from fur buyers or dealers,whereas some States rely on pelt tagging records and trapper questionnaires. Some species (e.g.,raccoon) reported may include fur harvest taken by hunters; however, for most species, the harvestdata are largely trapper harvest. 35 Latest data available.
12
1999, then fell to $79.6 million in 2002. The rise in value in 1999 reflects an increase in theaverage market price per pelt, which rose from $24.80 in 1998 to $33.70 in 1999. Changesin the total value during 1999-2001 generally reflect declines in the number of peltsproduced as the average price per pelt remained fairly stable. However, the average pelt pricedeclined to $30.60 in 2002.
Mink pelt production in any given year is dependent on decisions made by the rancher.When ranchers decide to retain more breeding stock the number of mink available for peltproduction drops. Conversely, as the inventory of breeding stock declines, the number of kitsproduced decreases, and thus mink furskin production also decreases. The number of minkretained for breeding purposes constitute the inventories of live mink, since mink not keptfor breeding purposes are slaughtered. During 1998-2002, the number of females bred toproduce kits declined by 15 percent to 622,900. Despite the overall decline in the numberof females retained for breeding purposes, the number of females bred to produce kits inUtah rose from 145,000 in 2001 to 149,000 in 2002. Other States in which the number offemales bred increased were Idaho and Washington.33
Wild Fur Harvest
The United States is the world’s largest-volume producer of furskins derived from animalsharvested in the wild. Data on the U.S. wild fur harvest are collected by the Fur ResourceCommittee of the International Association of Fish and Wildlife Agencies (IAFWA) withthe assistance of State wildlife agencies.34 The estimated value of the 1997-98 harvest was$56.7 million (table B-4).35 Principal species harvested (value basis) include raccoon, beaver,and muskrat. Other important species harvested include red fox, mink, nutria, and coyote.Many factors contribute to the increase/decrease in the harvest of wild furbearers includingFederal, State, and local trapping and hunting regulations; weather, animal populations, andfur prices.
Table B-5 shows average pelt values for certain fur bearer species for the 1997-98 season.The geographic region in which a species is harvested will often influence the value of thepelt. For example, beaver harvested in the northeast was valued at $21.08 per pelt in the1997-98 season whereas beaver harvested in the southeast during the period averaged $10.31per pelt. The colder climate in the northeast generally results in a more desirable higherquality beaver pelt.

36 Data on individual species imported are not available.
13
U.S. TRADE
The United States had a positive trade balance for furskins in every year during 1998-2002(table B-6). Imports and exports generally rose from 1999 to 2002; however, the increase inexports was more significant--from $141 million in 1999 to $173 million in 2002. TheUnited States registered a trade deficit with the EU during 1999-2002, reflecting a shift intrade to Asian markets and away from the EU. The United States registered a trade surplusof $76 million with Asia in 2002.
U.S. Imports
U.S. furskin imports during 1998-2002 are shown in tables B-7 through B-10. Such importsconsisted mostly of mink, fox, and sable (table B-7). Mink, primarily undressed furskins,accounted for about 52 percent of the value of U.S. furskin imports annually during1998-2002.
Products Imported, Levels, and Trends
U.S. furskin imports amounted to $87.2 million in 2002; mink pelts made up $46.6 million(53 percent), fox pelts accounted for $7.1 million (8 percent), and sable accounted for$2.3 million (3 percent). U.S. imports of “other” dressed, dyed furskins (HTS subheading4302.19.75) totaled $12.1 million in 2002, accounting for 14 percent of furskin imports.Furskins included in this other category are derived from many species, including beaver,chinchilla, ermine, fisher, fitch, leopard, lynx, marten, nutria, ocelot, otter, pony, sable, andwolf.36
Principal Import Suppliers
The EU and Canada are the major U.S. suppliers of furskins, accounting for 81 percent ofU.S. imports (by value) in 2002 (table B-8). Canada was the leading single country supplierduring 1998-2002, accounting for about 39 percent (by value) of total U.S. furskins importsannually. Canada was the leading supplier of mink pelts during 1998-2002, accounting for35 percent of such imports in 2002 (table B-9).
The Netherlands, Finland, Spain, Sweden, and Denmark accounted for more than 80 percentof U.S. furskin imports from the EU (table B-8). The Netherlands is the leading EU exporterof mink furskins to the United States, followed by Sweden, and Denmark. Finland is theleading supplier of fox pelts, accounting for more than 70 percent of the value in 2002 (tableB-10). U.S. imports from Spain consisted mainly of “other” dressed and dyed furskins.Russia was the leading U.S. supplier of sable furskins during 1998-2002; such importstotaled $2.1 million in 2002.

37 Sandy Parker Reports, Vol. 27, Aug. 18, 2003. 38 Sec. 17 of the Endangered Species Act. 39 U.S. Department of the Interior, U.S. Fish & Wildlife Service, “Overview of the Division ofFederal Program Activities,” found at http://habitat.fws.gov/overview.htm, retrieved May 7, 2003.
14
U.S. Importers
The principal importers of furskins are U.S. fur brokers and wearing apparel manufacturers.The number of brokers and establishments is unknown; however, industry sources report thatvery few manufacturing facilities remain in New York City, which was once the fur-manufacturing center of the United States.37
U.S. Trade Measures
Tariff Measures
The provisions of the HTS for the furskins covered in this summary are shown in table B-11.This table shows the general and special column 1 rates of duty applicable to U.S. importsof furskins as of January 1, 2003. Furskin trade is covered in chapter 43. In addition, thetable shows U.S. exports and imports of furskins, by HTS subheading, during 2002.Appendix A includes an explanation of tariff and trade agreement terms.
The aggregate trade-weighted average rate of duty for all products included in this summarywas 0.50 percent ad valorem in 2002 and the aggregate trade-weighted average rate of dutyfor dutiable products was 2.2 percent ad valorem.
Nontariff Measures
The importation of threatened or endangered fur bearers or their products is prohibited underauthority of the Endangered Species Act (ESA) of 1973 (Public Law 93-205). TheConvention on International Trade in Endangered Species of Wild Fauna and Flora (CITES)was established to govern the importation and exportation of endangered species and theirproducts and was codified as part of the ESA on December 28, 1973. There are currently 161countries that ascribe to CITES.
The Marine Mammal Protection Act38 prohibits almost all commerce in seal, whale, andother marine mammal products, including furskins. However, Alaskan natives (Indians,Aleuts, and Eskimos) may hunt for subsistence and to make “cottage industry” handicrafts.39

40 USDA, FAS, Peoples Republic of China, “Market Development Reports China’s GrowingMink Market 2002,” GAIN Report #CH2801, June 25, 2002.
15
U.S. Exports
The United States is a major exporter of wild harvested and farm-raised furskins, the bulkof which are exported in the raw state. U.S. furskin exports during 1998-2002 are shown intables B-12 through B-14.
Products Exported, Levels, and Trends
U.S. furskin exports amounted to $172.6 million in 2002 (table B-12), of which$122.2 million (71 percent) consisted of mink pelts. Mink pelts accounted for between56 percent and 77 percent of the value of exports during 1998-2002. Fox, beaver, andmuskrat accounted for most of the remainder.
U.S. furskin exports declined from a high of $195.6 million in 1998 to $140.5 million in1999 then rose steadily totaling $172.6 million in 2002. The decline in value from 1998 to1999 reflected a decline in the quantity of furskins exported (except for mink pelts) and toa larger degree a decline in the unit value for most species, including mink pelts. The unitvalue for mink pelts dropped by 25 percent from $31.23 per pelt in 1998 to $23.57 per peltin 1999 (table B-12). Exports to the EU and Canada declined in 1999 from year earlierlevels, with exports to the EU showing the largest decline, dropping from $76.0 million to$19.7 million. U.S. exports to Asian markets increased by 34 percent from 1998 to 1999,driven mainly by increased shipments to Hong Kong and Korea.
Principal Export Markets
The leading markets for U.S. furskins include Canada, the EU, and Asia (table B-13).Canada was the leading single-country U.S. export market for furskins during 1998-99, butHong Kong became the leading market in 2000 and remained the leading market in 2001.Canada regained its place as the leading market in 2002. Canada was the second-leadingmarket for U.S. mink furskins exports (table B-14).
U.S. furskin exports to Asia rose by 84 percent during the period of review, from$43.7 million in 1998 to $80.4 million in 2002, reflecting Asia’s dominance (due in largepart to Asia’s lower labor costs) in the fur apparel and accessories manufacturing sectors.Hong Kong and Korea are the leading Asian markets, accounting for 90 percent of U.S.furskin exports to Asia in 2002. Hong Kong was the leading U.S. export market for minkfurskins during 1998-2002; however, most of these furskin exports to Hong Kong are re-exported to China.40 Exports to the EU declined from $76.0 million in 1998 to $22.0 millionin 2002, reflecting Asian dominance at the international fur auctions. Leading EU marketsinclude Germany, Greece, and Italy.

41 Official Journal of the European Communities, Ch. 43 “Furskins and Artificial Fur;Manufacturers Thereof,” Dec. 28, 2002, pp. 315-317, found at http://www.trade.gov/td/tic/tariff/-eu_instructions.htm, retrieved July 7, 2003. 42 See Asia-Pacific Economic Cooperation (APEC), Canada Economy Information, found athttp://www.apectariff.org, retrieved July 7, 2003. 43 See APEC Customs Guide - Hong Kong, China - 2003, found at http://www.apectariff.org/-tdb.cgi, retrieved July 7, 2003. 44 China’s WTO Accession and Trade Agreements found at http://www.mac.doc.gov/China/-WTOAccessionPackageNEW.html, retrieved Aug. 19, 2003.
16
U.S. Exporters
Most U.S. furskin production is marketed through two auction houses. The leading U.S.exporters of furskins include the NAFA and the American Legend Auctions. Representativesof major international buyers generally purchase furskins through these auction houses. Itis estimated that a few hundred foreign buyers (e.g., Hong Kong dealers) purchase domesticfurs annually at these auctions to be subsequently exported to foreign interests.
Foreign Trade Measures
Tariff Measures
Raw furskin imports into the EU enter duty free; tariffs on imports of tanned or dressedfurskins and pieces or cuttings of furskins, tanned or dressed, range from free to 2.7 percentad valorem.41 Imports of furskins into Canada from the United States enter duty free.Canadian imports of furskins from other countries that qualify for most favorable nation(MFN) treatment enter duty free for raw furskins and from free to 8 percent ad valorem fordressed furskins.42 Tariffs in Korea range from 3 percent ad valorem on raw furskins to 5percent on tanned or dressed furskins. The Hong Kong Special Administrative Region of thePeople's Republic of China (HKSAR) is a free port and does not levy any customs tariff onimports.43 China acceded to the World Trade Organization (WTO) on December 11, 2001,and its accession should further open its market to U.S. furskins. The bound rate for rawmink pelts (the principal U.S. fur exported to China) was 24 percent on January 1, 2001,with the final bound rate of 15 percent to be implemented on January 1, 2004.44 Dressedmink received a rate of 24 percent on January 1, 2001, with the final bound rate of12 percent to be implemented on January 1, 2005. Imports of tanned or dressed furskins ofgrey squirrel, ermine, other marten, fox, otter, marmot, lynx, and other furskins notspecifically identified are also subject to staged duty reductions–declining from 17.2 percentin 2001 to 10 percent in 2004. All remaining furskins receive a duty rate of 20 percent withno staged reduction.
Nontariff Measures
Like the United States, most countries are members of CITES, and as such prohibit theimportation and exportation of furskins from endangered species. In 1991, the EU approved

45 EEC No. 3254/91 of Nov. 4, 1991, Official Journal of the European Communities,No. L 308/1. 46 The Agreed Minute, is a nonbinding understanding with the EU, that expresses the intentionof the United States and the EU to support trap research by their respective authorities, andforeseeing the phaseout of certain trapping devices. 47 The Office of the United States Trade Representative (USTR), press release, “United StatesReaches Understanding with the European Union on Humane Trapping Standards,” Dec. 23, 1997. 48 In the United States, individual State and tribal authorities have primary authority over theregulation of trapping and are thus responsible for implementing the humane trapping standards.See USTR, press release, “United States Reaches Understanding,” Dec. 23, 1997. 49 See summary section entitled “Humane treatment and animal welfare,” for information onBest Management Practices (BMPs). 50 British Fur Trade Association, “Facts and Figures,” found at http://www.britishfur.co.uk/-mediafacts.html, retrieved July 14, 2003.
17
a Council Regulation45 that banned the use of leg-hold traps in the EU. In addition, theregulation which was scheduled for implementation in December 1997, would ban theimportation of certain wild furskins (and fur products) from countries that use leghold trapsor employ trapping methods that fall below internationally agreed humane trappingstandards. Such a ban would adversely affect U.S. exports of fur to the EU as such traps arewidely used by trappers in the United States. Other important wild fur- harvesting countriesinclude Canada and Russia. However, in July 1997, an “Agreement on Humane TrappingStandards between Canada, the European Community, and the Russian Federation” wasreached. On December 18, 1997, the United States and the EU signed an Agreed Minute46
on humane trapping standards, thus allowing for the uninterrupted trade of wild furs.47 TheUS-EU understanding (Agreed Minute) describes the characteristics of trap performance thatneed to be met in order for any trap to conform to the humane trapping standards. It reflects,in part, the intent of U.S. authorities to phase out certain leghold restraining traps and topromote trap research, as well as report research findings.48 Authorities in the United Statesimplemented the US-EU understanding through the Best Management Practices.49 TheAgreed Minute will permit continuing access of U.S. source fur and fur products to the EUmarket.
FOREIGN INDUSTRY PROFILE
Overview
Furskins derived from farmed fur-bearing animals account for 85 percent of fur productionworldwide.50 Mink and fox are the most common fur bearers raised on farms. As in theUnited States, farmed fur animals in foreign producing countries are typically fed a dietbased mainly of slaughter-house and fish byproducts. Such feed is generally produceddomestically and often is supplied by feed centers that are usually farmer owned. Most furfarms are family-owned operations that often employ additional workers during the breedingand pelting seasons.

51 Based on statistics of the Food and Agriculture Organization of the United Nations, found athttp://www.fao.org, retrieved Sept. 9, 2003. 52 Sandy Parker, Farm Produced Minkskins, Oslo Fur Auctions, Ltd., July 16, 2003. 53 Saga Furs of Scandinavia found at http://www.sagafurs.com, retrieved Aug. 27, 2003. 54 Ibid. 55 Copenhagen Fur Center, press release, “CFC Retires from the SAGA co-operation,” found at http://www.cfc.dk/sw5394.asp, retrieved Aug. 26, 2003.
18
Europe is by far the largest producer of farmed mink and fox followed by North America.Other principal producing countries include Russia and China. World mink productiondeclined from 30.1 million pelts in 1998 to 27.7 million pelts in 1999, then rose steadilyreaching an estimated 30.9 million pelts in 2002 (table B-15). Global fox productiondeclined from about 4.8 million pelts in 1998 to 4.0 million pelts in 2000, then rose to4.5 million pelts in 2002 as shown in table B-16. Finland was by far the largest singlecountry producer of fox pelts, with a share of 47 percent of world fox production.
Leading import markets for raw furskins include the EU, Asia, and North America (tableB-17). Over 1991-2001, the developing countries’ share of furskin imports rose from31 percent to 50 percent; conversely, the share accounted for by developed countriesdeclined from 69 percent to 50 percent.51
Country/Regional Profiles
European Union
The EU accounted for about 65 percent of world mink production in 2002.52 Denmark, theNetherlands, Finland, and Sweden are the leading furskin producers in the EU. The largestconsumers of fur products in Europe are Italy, Spain, and Germany. The majority ofEuropean fur production is marketed either through Denmark’s Copenhagen Fur Center(CFC) or Finland’s Finnish Fur Sales Ltd., (FFS). CFC is the world’s largest auction houseof farmed furskins selling nearly 13 million pelts annually with mink accounting for about90 percent of the pelts sold. International auctions are held 5 - 6 times a year.
Saga Furs of Scandinavia (Saga Furs) is the world’s largest fur-marketing organization,representing fur breeders from Denmark, Finland, Norway, and Sweden. Saga Furs isresponsible for promoting and branding of SAGA Mink® and SAGA Fox® skins sold atauction houses in Copenhagen and Helsinki.53 In 2002, SAGA Mink® and SAGA Fox®accounted for 66 percent of the world’s market for farmed mink and 61 percent of foxmarketed, respectively. Saga Furs design center is credited with the renewed interest in fursand offers workshops on the latest pelt-processing techniques and innovative ways to use furpelts.54 The future of SAGA however is uncertain, as Denmark’s fur breeders association(CFC), the largest contributor to SAGA, has removed itself from the organization effectiveJune 2005.55
Fur farmers in the EU are subject to humane animal regulations. Council Directive 98/58 setsdown rules covering the welfare of farmed animals, including fur bearing animals and

56 British Fur Trade Association Mink Farming, “Fur Farming in the EU,” found athttp://www.britishfur.co.uk/farmbody.html, retrieved Apr. 30, 2003. 57 European Fur Breeders’ Association (EFBA), Legislation, found at http://www.efbanet.com/-legislation.htm, retrieved May 29, 2003. 58 Animal Protection Institute, The Demise of Fur; A Multilateral Approach by Camilla Fox,reprinted from Animals’ Agenda, Vol. 17, No. 1, Jan./Feb. 1997, found at http://www.api4-animals.org, retrieved Aug. 26, 2003. 59 Copenhagen Fur Center, found at http://www.cfc.dk/sw568.asp, retrieved May 28, 2003. 60 Bont voor Dieren, “Fur Farming in the Netherlands,” found at http://www.bontvoordieren.-nl/english/dutch.php-?action=furfarming, retrieved May 2, 2003.
19
Directive 93/119 deals with the slaughter and killing of fur and other farmed animals.56 In1999, the Council of Europe revised its standards for fur farming. The new standards formedthe basis for the Code of Practice of the European Fur Breeders’ Association (EFBA).57
Animal rights and animal welfare organizations have established a strong antifur movementin much of Europe.58 Pressure from animal rights and animal welfare groups have led manyEuropean countries to pass legislation banning fur farming or making it economicallyunviable to raise fur-bearing animals. Table B-18 shows various regulations affecting theraising of fur-bearing animals for certain European countries. In addition to efforts to banfur farming, the EU in 1995 banned the use of leghold traps within its borders.
Denmark
By far the world’s leading producer and exporter of ranch mink, Denmark accounted forabout 40 percent of world mink production annually during 1998-2002 (table B-15). MostDanish mink farms are small family-run businesses although Denmark has some of thelargest farms in the world. The Danish Fur Breeders Association represents about 2,400 furbreeders in Denmark and conducts its own research. Danish furs are generally marketedthrough the producer owned CFC. Furskins are the fourth- largest animal export productfrom Denmark.59 Major export markets include Hong Kong, China, Japan, other Europeancountries, and Korea.
Although world mink production has remained fairly stable in recent years, Danishproduction has increased while declines in production have taken place in many othercountries. Danish mink production rose from 8.3 million pelts in 1983 (22 percent of worldproduction) to 12.2 million pelts in 2002, accounting for nearly 40 percent of world minkproduction. Conversely, the United States saw production decline during the same periodfrom 4.4 million pelts (16 percent of world production) in 1983 to 2.6 million pelts in 2002(8 percent of world production).
Netherlands
The Netherlands accounts for about 10 percent of world mink production, the majority ofwhich is exported. The overall number of mink farms has been declining; however, thenumber of mink raised per farm has been increasing.60 Consequently, mink pelt productionhas remained fairly steady, averaging about 2.9 million pelts annually during 1998-2002.The number of mink pelts produced totaled 3.0 million in 2002. There is a ban onconstruction of new fox fur and chinchilla fur facilities in the Netherlands, with existing fox

61 World Animal Net: Anti-Fur Campaign: Legislation, “Anti-fur Legislation,” found athttp://www.worldanimal.net/fur-legislation.html, retrieved June 2, 2003. 62 Bont voor Dieren, “Fur Farming in the Netherlands,” found athttp://www.bontvoordieren.nl/english/-dutch.php?action=furfarming, retrieved May 2, 2003. 63 European Fur Breeders Association, “Dutch Government Fur Farming Ban Withdrawn,”Feb. 27, 2003, found at www.efbanet.com/presreleases.html, retrieved Sept. 4, 2003. 64 Finnish Fur Breeders’ Association, found at http://www.stkl-fpf.fi/index_e.htm, retrievedJuly 15, 2003. 65 Finnish Fur Sales, 2.4.9 “Pelting Service,” found at http://www.ffs.fi, retrieved Sept. 11, 2003. 66 Information on the Swedish industry was obtained by Commission staff from Asa Lexmon,agricultural specialist, FAS, Stockholm, in an e-mail correspondence of Sept. 3, 2003, unlessotherwise noted.
20
and chinchilla farms due to be phased out by 2008. Antifur campaigns in the early 1980sresulted in a drastic decline in fur retail sales in the Netherlands.61 The Bont voor Dieren (Furfor Animals), a Dutch animal protection organization, claim partial responsibility for the banon new fox fur and chinchilla fur facilities and to the phasing out of existing fox andchinchilla farms.62 The Dutch Government has withdrawn a proposed ban on mink farming,reporting that its Cabinet has “no ethical objections to mink farming” and “does not want toact ahead of any Brussels legislation.”63
Finland
Finland is the world’s largest-volume producer and exporter of fox pelts and the fifth largestworld producer of mink pelts (tables B-16 & B-15). Fur farming is concentrated on the westcoast, due in part to its accessibility to fish byproducts. There are approximately 1,600 furfarms in Finland with employment estimated at 7,000. Fox production totaled 2.1 millionpelts in 2002. There are many breeds of foxes raised in Finland; however, the blue fox is themost common, and, as its name indicates, it is blue-grey in color. The fur is principally usedin the manufacture of collars and trimmings. Mink production averaged about 2 million peltsannually during the period, with black and brown shades being the most popular colors. Over98 percent of Finnish fur production is exported. China and Russia are the most importantmarkets for Finnish pelts; other important markets include Italy, Greece, Germany, andJapan.64
The Finnish Fur Sales (FFS) is a leading international fur auction company that is publicallylisted on the Helsinki Stock Exchange. The Finnish Fur Breeders Association is its largeststockholder. In 2001, FFS opened an automated pelting facility (Furfix Oy). This facilityprovided service to more than 200 mink breeders in its first year of operation, pelting about500,000 mink pelts. Using the latest technology, the automated machinery provides (1) moreuniform pelts than those processed by individual ranchers, and (2) higher quality pelts to furbuyers.65
Sweden
There are approximately 170 mink farms in Sweden, which ranked seventh in world minkproduction in 2002.66 Such production increased from a low of 1.2 million pelts in 2000 to1.4 million pelts in 2002 (table B-15). All fur farmers are members of SPR, The NationalFederation of Swedish Fur Farmers. The SPR is responsible for marketing of Swedish pelts,

67 Respect for Animals, press release, “Swedish Vote to Ban Fur Farming Succeeds,” Nov. 13,2001, found at http://www.respectforanimals.org/news/131101.html, retrieved Aug. 27, 2003. 68 Industry Canada, Hong Kong - Leather and Fur - Competitive Situation found athttp://strategis.ic.gc.ca/SSGF/dd79252f.html, retrieved July 28, 2003 and Hong Kong’s TradeDevelopment Council, “Profiles of Hong Kong Major Manufacturing Industries, Hong Kong’s FurIndustry,” Sept. 2002, found at http://www.tdctrade.com/main/industries/t2_2_14.htm, retrievedMay 1, 2003. 69 USDA, FAS, Peoples Republic of China, “Market Development Reports China’s GrowingMink Market 2002,” GAIN Report No. CH2801, June 25, 2002. 70 From Copenhagen Fur Center, found at http://www.furs.com/FUR/FurAge3.html, retrievedJuly 11, 2003.
21
which are sold at auctions, primarily at CFC to international buyers. In recent years, theSwedish Government and the public have strongly questioned the raising of fur-bearinganimals. In November 2001, Sweden’s Social Democratic Party voted to ban fur farming.67
The Swedish Government is reportedly investigating the affects of a possible ban on furfarming, but results have not been finalized.
Asia
Hong Kong, China, and Korea are the primary Asian markets for furskins. China ranks sixthin world mink production. Demand for furskins, primarily for use in the manufacture of furgarments and accessories for both domestic and world markets has grown rapidly. Thefollowing provides information on these markets.
Hong Kong
Hong Kong was the leading world market for furskins during 1998-2001 as shown in tableB-17. Principal suppliers to the Hong Kong market include Denmark, Finland, Canada, andthe United States.
Most of Hong Kong’s fur-manufacturing takes place in mainland China at facilities ownedby Hong Kong Chinese. The number of fur-manufacturing establishments in Hong Kong declined from 24 in 1996 to 10 in 2001 as higher labor cost and stricter environmentalregulations resulted in furriers setting up offshore production facilities in mainland China.68
Notwithstanding the decline in the number of manufacturing establishments, Hong Kongremains active in many trade related services, such as sales, marketing, and fur designs.Hong Kong traders act as brokers for Chinese buyers at U.S. fur auctions.69 In addition, thepurchased pelts are shipped to Hong Kong and re-exported to China. The raw pelts aredressed in China often by Hong Kong-owned dressing companies. The pelts are then usuallysent to Chinese furskins dealers and/or to Hong Kong and Chinese garment and trimmingmanufacturers.
Hong Kong is the world’s largest exporter of manufactured fur goods, although as stated,most fur garments are made in China at facilities managed and owned by the Hong KongChinese.70 Hong Kong exports of fur clothing (including re-exports) totaled

71 Converted to U.S. dollars based on statistics of the International Monetary Fund:International Financial Statistics, July 2003, China, P.R.: Hong Kong average annual exchangerates for 2000 and 2002. 72 “Hong Kong’s Total Exports of Clothing of Furskins (SITC 84831),” found athttp://stat.tdctrade.com/monthly/prodt3.htm, retrieved Aug. 1, 2003 and Profiles of Hong KongMajor Manufacturing Industries, found at http://stat.tdctrade.com/monthly/prodt3.htm, retrievedMay 1, 2003. 73 Based on Jan-June 2002 data. See Hong Kong’s Trade Development Council, “Profiles ofHong Kong Major Manufacturing Industries, Hong Kong’s Fur Industry,” Sept. 2002, found athttp://www.tdctrade.com/main/-industries/t2_2_14.htm, retrieved May 1, 2003. 74 Fur Age article by David Sebben, executive director of Wild Fur Council of North America,found at http://www.furs.com/FUR/FurAge2.html, retrieved July 16, 2003. 75 North American Fur Auctions (NAFA), Market Bulletin - January 25, 2001, “Far EastMarket Report,” found at http://nafa.ca/ranchfur/marketnews_jan2001.asp, retrieved July 24,2003. 76 See Hong Kong writeup. 77 NAFA, Market Bulletin - January 25, 2001, “Far East Market Report,” found athttp://nafa.ca/ranchfur/-marketnews_jan2001.asp, retrieved July 24, 2003.
22
US$258 million71 (HK $2.0 billion) in 2002, up from US$232 million (HK $1.8 billion) in2000.72 Japan, the United States, and the EU accounted for more than 75 percent of HongKong’s fur clothing exports in 2002.73 China and Korea are also emerging as importantexport markets for Hong Kong.
China
In recent years China’s furskin industry has been restructuring with many state-ownedenterprises closing and being replaced by private firms and joint-venture firms. There are alimited number of private mink farms in Northeast China that market their pelt productiondomestically. Fur pelts produced in China are considered inferior to North American andEuropean pelts and are generally consumed domestically. The level of China’s technologywith respect to tanning, dressing, dyeing, and craftsmanship is relatively low, except for inGuangdong Province, where the level of technology is relatively high because of innovationsin processing and manufacturing techniques.74
Official data on Chinese furskin production are unknown; however, mink pelt production isestimated at about 1.7 million in 2002 (table B-15), up from 1.2 million in 1998. Foxproduction totaled about 1.2 million pelts in 2002, up from 400,000 in 1998 (table B-16).
Chinese furskin imports rose from $49 million in 1998 to $66 million in 2001 (table B-17).Leading import suppliers include Europe (primarily Denmark, Holland, and Finland), theUnited States, and Canada. An estimated 70 percent of world mink production ismanufactured into garments and accessories in China.75 However, much of China’s fur-manufacturing sector is owned by Hong Kong furriers and the furs are shipped out(re-exported) from Hong Kong and are recorded by Hong Kong’s trade statistics.76 Factorscontributing to the increase in Chinese furskin imports include low wages, ease in expandingdressing and dyeing facilities, on time delivery of product, and acceptable workmanship andreliability. In addition to being a major exporter of fur products, China is now recognized asthe leading consumer of mink garments.77 Although Hong Kong is expected to continue toplay a significant role in China’s fur industry, analyst expect China to develop its own fully

78 USDA, FAS, Peoples Republic of China, “Market Development Reports China’s GrowingMink Market 2002,” GAIN Report No. CH2801, 25, 2002. 79 NAFA, Market Bulletin, Dec. 14, 2000, “Korea,” found at http://nafa.ca/ranchfur/market-news.dec2000.asp, retrieved Sept. 2, 2003. 80 International Herald Tribune, “Fur Comes Back in a Brashy Way,” Mar. 13, 1998, p. 23,found at http://www.iht.com, retrieved Apr. 30, 2003. 81 The Russia Journal, “Russian fur industry struggles for survival,” Feb. 22, 2002, found athttp://www.therussiajournal.com/index.htm?obj+5563, retrieved July 23, 2003. 82 Ibid.
23
integrated mink processing industry in the near future.78 China’s demand for fur is expectedto increase; reflecting an expanding economy and stable currency. Because Hong Kong hasestablished distribution channels into China, its exporters have a competitive advantage overother suppliers.
Korea
Korea was the third largest importer of furskins in 2001 (table B-17). Such imports rose from$41 million in 1998 to $90 million in 2000, then declined to $67 million in 2001. Thedecline in imports during 2001 reflect, in part, economic problems, decline in the stockmarket, and a weakening currency, which have lessened the demand for fur garments,especially traditional mink garments.79 In addition, inventories of traditional garments havegrown as demand for dyed, plucked and sheared mink, fox, and some wild furs haveincreased, reflecting increased demand by younger consumers. Korea is also importingfinished garments from China, a trend that is expected to continue.
Russia
Farmed fur production as well as the harvesting of wild fur-bearing animals in Russia hasdeclined dramatically in recent years.80 The decline in fur production reflects the economicreform that resulted in the disintegration of the former Soviet Union and the subsequentdemise of state-subsidized industries. Important fur-bearing species raised on farms includesable, mink, and fox. The number of fur farms declined from about 150 in the 1990s to about40 in 2002.81 Approximately one-half of the farms are large-scale operations and account for80 percent of Russian pelt production.82
Sables are found almost exclusively in Russia and are one of the most expensive furs. Sablepelts are derived from wild sable as well as from farmed sable. The former Soviet Unionbanned export sales of sable-breeding stock. Thus, the Government controlled the resourceand ultimately the number of pelts available on the world market. The ban on export salesof live sable remains in place despite Russia’s move toward a free market economy. TheUnited States, Hong Kong, and Japan are among the largest buyers of Russian sable pelts.
In the early 1990s, Russia was believed to have been the world’s largest producer of farmedmink pelts. In 1993, such production was estimated at about 12.0 million pelts and accountedfor 36 percent of world mink pelt production. In 2002, Russia’s mink pelt production totaledabout 2.7 million pelts (table B-15) and accounted for about 9 percent of world production.The bulk of production is consumed domestically.

83 Fur Farming in Russia: The Current Situation and the Prospects, prepared by NA. Balakirevand E.A. Tinaeva, original report, found at http://www.ifasnet.org/PDF/vol_25_no-_1scientifur-vol25_1_m, retrieved July 24, 2003. 84 The Russia Journal, “Russia no longer big, furry monster,” Oct. 21, 2000, found athttp://therussiajournal.com-/index.htm?obj+3708, retrieved July 23, 2003. 85 Ibid. 86 Statistics Canada, “Livestock Statistics,” Second Quarter 2002, Catalogue no.23-603-XIE,pp. 91-92.
24
Production costs to raise farmed fur animals have risen since the end of the Soviet Union,prior to which fur farmers had ready access to domestic fish and meat processing byproducts.As a result of government reforms, the Russian Government no longer subsidizes feed oroffers easy credit terms. Feed costs, which represent the greatest cost of producing a pelt,rose as the infrastructure of industries which provided domestic fish and meat byproductswere destroyed.83 Russian fur farmers thus incur greater production cost compared withother major farmed fur-producing countries.
Farmed pelts produced in Russia are considered inferior to those produced by NorthAmerican and European producers. Many farmers cannot afford the imported feed andantibiotics necessary to raise animals that will produce quality pelts. One source reported thatScandinavian fur farms are more competitive than Russian farms because Scandinavianproducers’ farms are small family-run businesses that rely on skills handed down throughseveral generations versus the large collective-style farms found in Russia.84
Russia has traditionally consumed over half the world's fur supply, primarily for headgear.The structure of consumer demand in Russia for fur-wearing apparel is changing in that thedemand for domestic manufactured goods is declining while the demand for importedapparel is increasing. The old Soviet-style retail shops are being replaced by modernboutiques. Imported mink apparel is generally of higher quality and is in vogue. Once amongthe largest fur manufacturers in the world, Russia now imports more than 70 percent of itsfur garments and accessories.85
Russian furskins are marketed through the Soyuzpushnina auction house in St. Petersburg,as well as through international auction houses such as the Copenhagen Fur Center inDenmark. Some pelts that previously were sold exclusively through Soyuzpushnina are nowsold directly from fur farms to brokers and or dealers. The decline in Russian fur productionhas resulted in Russia becoming a major competitor at international auctions.
Canada
Canada is a major world producer of wild furskins as well as a major exporter of both wildfurskins and ranch mink skins. Canada’s furskin industry, like the U.S. furskin industry,includes small-family owned business, as well as trappers and hunters. Canada’s wild harvestand ranch furskins are generally marketed through auction facilities in Toronto, North Bay,and Vancouver. Fur dressing facilities are in Quebec and fur garment manufacturers areprimarily in Montreal and Toronto.
Canadian ranch mink production rose from a low of 900,000 pelts in 1999 to a high of1.2 million pelts in 2002 (table B-15). Ranch mink production is concentrated in theProvinces of Nova Scotia, Ontario, and British Colombia.86 The number of mink farms as

87 Ibid 88 Statistics Canada, “Fur Statistics, 2003,” Vol. 1, no. 1, pp. 86-92, found athttp://www.statcan.ca/english/-freepub/23-013-XIE/free.htm, retrieved Aug. 25, 2003. 89 FCUSA, “Fur Facts,” found at http://www.furcommission.com/farming/pelts.htm, retrievedApr. 30, 2003. 90 Data on Canadian wild fur harvest are on a “fur year basis” which runs from July 1 toJune 30; data on farmed furskin production are on a calendar year basis, with most peltingoccurring in the fall. See Statistics Canada, “Fur Statistics, 2003,” Vol. 1, no. 1, p. 1, found athttp://www.statcan.ca/english/freepub/23-013-XIE/free.htm, retrieved Aug. 25, 2003.
25
of December 31, 2001 totaled 190.87 Ranched foxskin production totaled 13,160 pelts in2001, down from 26,510 pelts in 1998.88 The number of farms raising foxes declined steadilyfrom 272 in 1998 to 135 in 2002, reflecting a long-term decline in fox pelts prices. Leadingfox-producing Provinces include Nova Scotia, Quebec, Newfoundland, and New Brunswick.Mink and fox standards in Canada are represented by the Canada Mink Breeders Associationand Canada Fox Breeders Association.89
The Canadian wild fur harvest rose from CAN$16.7 million in 1998 to CAN$20.6 millionin 2000, or by 23 percent.90 Quebec, Ontario, and Manitoba were the major harvestingProvinces accounting for more than 60 percent of the value. The wild fur harvest accountedfor more than 40 percent of the value of Canadian furskins harvested during the period.Major species harvested include marten and beaver (accounting for 58 percent of the wildfur harvest ($CAN 11.9 million)). Other major species harvested include coyote, fox, andotter.


APPENDIX AEXPLANATION OF TARIFF AND TRADEAGREEMENT TERMS


A-3
TARIFF AND TRADE AGREEMENTTERMS
In the Harmonized Tariff Schedule of the United States (HTS), chapters 1through 97 coverall goods in trade and incorporate the internationally adopted Harmonized CommodityDescription and Coding System through the 6-digit level of product description. SubordinateU.S. 8-digit rate lines, either enacted by Congress or proclaimed by the President, allowmore narrowly applicable duty rates; nonlegal 10-digit statistical reporting numbers providedata of national interest. Chapters 98 and 99 contain special U.S. classifications andtemporary rate provisions, respectively. The HTS replaced the Tariff Schedules of the UnitedStates (TSUS) effective Jan. 1, 1989. The HTS is updated by published supplements and byelectronic revisions at http://www.usitc.gov/taffairs.htm#HTS; see preface pages and changerecords in each document.
Duty rates in the general subcolumn of HTS column 1 are normal trade relations rates; manygeneral rates have been eliminated or are being reduced due to concessions resulting fromthe Uruguay Round of Multilateral Trade Negotiations. General duty rates apply to allcountries except those listed in HTS general note 3(b) (Cuba, Laos, and North Korea) plusSerbia and Montenegro, which are subject to the statutory rates set forth in column 2.Specified goods from designated general-rate countries may be eligible for reduced rates ofduty or duty-free entry under preferential tariff programs, as set forth in the specialsubcolumn of HTS rate of duty column 1 or in the general notes. If eligibility for specialtariff rates is not claimed or established, goods are dutiable at general rates. The HTS doesnot list countries covered by a total or partial embargo; it likewise does not containantidumping or countervailing duties (consult the International Trade Administration of theDepartment of Commerce).
The Generalized System of Preferences (GSP) affords nonreciprocal duty-free entry tocertain goods of designated beneficiary developing countries. The U.S. GSP, under title Vof the Trade Act of 1974, as amended, now applies to merchandise imported on or after Jan.1, 1976, and before the close of Dec. 31, 2006. Indicated by the symbol "A", "A*", or "A+"in the special subcolumn, The legal framework of the GSP is set forth in HTS general note4; eligible articles must be the product of and imported directly from designated beneficiarydeveloping countries. Eligible products of listed sub-Saharan African countries may qualifyfor duty-free entry under the African Growth and Opportunity Act (AGOA) (see HTS gen.note 16) through Sept. 30, 2008, as indicated by the symbol “D” in the special subcolumn;see subchapter XIX of chapter 98.
The Caribbean Basin Economic Recovery Act (CBERA) affords nonreciprocal tariffpreferences to designated Caribbean Basin developing countries. The CBERA--enacted intitle II of Pub. Law 98-67, implemented by Presidential Proclamation 5133 of Nov. 30, 1983,and amended by the Customs and Trade Act of 1990, applies to goods entered, or withdrawnfrom warehouse for consumption, on or after Jan. 1, 1984. Indicated by the symbol "E" or"E*" in the special subcolumn, CBERA provides duty-free entry to eligible articles, andreduced-duty treatment to certain other articles, which are the product of and importeddirectly from designated countries (see HTS gen. note 7). Other eligible products of listedbeneficiary countries may qualify for duty-free or reduced-duty entry under the CaribbeanBasin Trade Partnership Act (CBTPA) (see HTS gen. note 17), through Sept. 30, 2008, as

A-4
indicated by the symbol “R” in the special subcolumn; see also subchapter XX of chapter98.
Free rates of duty in the special subcolumn followed by the symbol "IL" are applicable toproducts of Israel under the United States-Israel Free Trade Area Implementation Act of1985 (IFTA), as provided in general note 8 to the HTS; see also subchapter VIII of chapter99.
Nonreciprocal duty-free treatment in the special subcolumn followed by the symbol "J" or"J*" in parentheses is afforded to eligible articles from designated beneficiary countriesunder the Andean Trade Preference Act (ATPA), enacted as title II of Pub. Law 102-182(effective July 22, 1992; see HTS gen. note 11) and renewed through December 31, 2006,by the Andean Trade Promotion and Drug Eradication Act of 2002. Goods eligible for newbenefits under the latter act are designated by a “J+” in the special subcolumn; see alsosubchapter XXI of chapter 98.
Preferential free rates of duty in the special subcolumn followed by the symbol "CA" areapplicable to eligible goods of Canada, and rates followed by the symbol "MX" areapplicable to eligible goods of Mexico, under the North American Free Trade Agreement(NAFTA), as provided in general note 12 to the HTS and implemented effective Jan. 1,1994, by Presidential Proclamation 6641 of Dec. 15, 1993. Goods must originate in theNAFTA region under rules set forth in general note 12(t) and meet other requirements of thenote and applicable regulations.
Preferential rates of duty in the special subcolumn followed by the symbol “JO” areapplicable to eligible goods of Jordan under the United States-Jordan Free Trade AreaImplementation Act, (JFTA) effective as of Dec. 17, 2001; see HTS gen. note 18 andsubchapter IX of chapter 99.
Other special tariff treatment applies to particular products of insular possessions (gen. note3(a)(iv)), products of the West Bank and Gaza Strip (gen. note 3(a)(v)), goods covered bythe Automotive Products Trade Act (APTA) (gen. note 5) and the Agreement on Trade inCivil Aircraft (ATCA) (gen. note 6), articles imported from freely associated states (gen.note 10), pharmaceutical products (gen. note 13), and intermediate chemicals for dyes (gen.note 14).
The General Agreement on Tariffs and Trade 1994 (GATT 1994), pursuant to theAgreement Establishing the World Trade Organization and based upon the earlier GATT1947 (61 Stat. (pt. 5) A58; 8 UST (pt. 2) 1786), is the primary multilateral system ofdiscipline and principles governing international trade. The agreements mandatemost-favored-nation treatment, maintenance of scheduled concession rates of duty, andnational treatment for imported goods; GATT provides the legal framework for customsvaluation standards, "escape clause" (emergency) actions, antidumping and countervailingduties, dispute settlement, and other measures. Results of the Uruguay Round of multilateraltariff negotiations are set forth in separate schedules of concessions for each participatingcontracting party, with the U.S. schedule designated as Schedule XX. Pursuant to theAgreement on Textiles and Clothing (ATC) of the GATT 1994, member countries arephasing out restrictions on imports under the prior "Arrangement Regarding InternationalTrade in Textiles" (known as the Multifiber Arrangement (MFA)). Under the MFA, adeparture from GATT 1947 provisions, importing and exporting countries negotiatedbilateral agreements limiting textile and apparel shipments, and importing countries could

A-5
take unilateral action to control shipments. Quantitative limits were established on textilesand apparel of cotton, other vegetable fibers, wool, man-made fibers or silk blends in aneffort to prevent or limit market disruption in the importing countries. The ATC establishesnotification and safeguard procedures, along with other rules concerning the customstreatment of textile and apparel shipments, and calls for the eventual complete integrationof this sector into the GATT 1994 and the phase-out of quotas over a ten-year period, or byJan. 1, 2005.


APPENDIX BSTATISTICAL TABLES


B-3
Table B-1Mink: Number of farms and pelts produced, by leading States, 1998-2002
State/Pelts/Farms 1998 1999 2000 2001 2002Wisconsin:
Pelts . . . . . . . . . . . . . . . . . . . . . . . . . . . . . 800,500 731,700 680,100 672,000 685,000Farms . . . . . . . . . . . . . . . . . . . . . . . . . . . . 94 82 70 69 69
Utah:Pelts . . . . . . . . . . . . . . . . . . . . . . . . . . . . . 675,000 650,000 590,000 610,000 575,000Farms . . . . . . . . . . . . . . . . . . . . . . . . . . . . 115 110 90 80 80
Minnesota:Pelts . . . . . . . . . . . . . . . . . . . . . . . . . . . . . 268,200 262,700 284,800 286,500 267,000Farms . . . . . . . . . . . . . . . . . . . . . . . . . . . . 44 40 37 36 33
Oregon:Pelts . . . . . . . . . . . . . . . . . . . . . . . . . . . . . 263,000 270,000 268,000 251,000 270,200Farms . . . . . . . . . . . . . . . . . . . . . . . . . . . . 30 30 28 26 25
Idaho:Pelts . . . . . . . . . . . . . . . . . . . . . . . . . . . . . 192,600 228,500 222,400 151,200 228,900Farms . . . . . . . . . . . . . . . . . . . . . . . . . . . . 22 26 24 28 25
Washington:Pelts . . . . . . . . . . . . . . . . . . . . . . . . . . . . . 142,600 129,200 112,700 113,100 110,000Farms . . . . . . . . . . . . . . . . . . . . . . . . . . . . 20 18 16 15 15
Iowa:Pelts . . . . . . . . . . . . . . . . . . . . . . . . . . . . . 123,900 128,100 136,800 105,900 111,600Farms . . . . . . . . . . . . . . . . . . . . . . . . . . . . 19 16 16 13 16
All other:Pelts . . . . . . . . . . . . . . . . . . . . . . . . . . . . . 472,399 412,600 371,300 377,600 352,700Farms . . . . . . . . . . . . . . . . . . . . . . . . . . . . 94 82 69 62 55
U.S. total:Pelts . . . . . . . . . . . . . . . . . . . . . . . . . . . . . 2,938,199 2,812,800 2,666,100 2,567,300 2,600,400Farms . . . . . . . . . . . . . . . . . . . . . . . . . . . . 438 404 350 329 318
Source: USDA, NASS, Mink, various issues.
Table B-2Mink furskins1: U.S. production, exports of domestic merchandise, imports for consumption, andapparent consumption, 1998-2002
Year Production1 Exports2 Imports3Apparent
consumptionRatio of imports
to production––––––––––––––– Thousand dollars –––––––––––––––––
1998 . . . . . . . . . . . . . . . . . 72,862 78,044 42,762 37,580 591999 . . . . . . . . . . . . . . . . . 94,798 97,750 33,739 30,787 362000 . . . . . . . . . . . . . . . . . 90,644 115,818 42,624 17,450 472001 . . . . . . . . . . . . . . . . . 85,928 120,457 46,252 11,723 542002 . . . . . . . . . . . . . . . . . 79,600 117,356 45,090 7,334 57
1 Production includes whole, undressed farmed mink furskins, but not wild mink.2 Exports include whole, undressed wild and farmed mink furskins.3 Imports include whole, undressed wild and farmed mink furskins.
Note.—Factors that contributed to U.S. mink exports exceeding U.S. mink production during 1998-2002 are: U.S.mink production does not account for pelt inventories and does not include mink harvested from the wild; whereasU.S. export data includes inventoried pelts and mink pelts harvested from the wild as well as farmed pelt production.
Note.—Ratio of imports to consumption is exceptionally high. As the table shows U.S. exports exceed U.S.production, thus the share of consumption supplied by imports is generally high.
Source: Production data compiled from the U.S. Department of Agriculture, NASS, Mink, July 15, 2003; import andexport data compiled from official statistics of the U.S. Department of Commerce.,

B-4
Table B-3Ranch mink furskins: U.S. pelts produced, average market price, and value of mink pelts,1998-2002Year Pelts Average market price Value of mink pelts
Thousands Dollars Million dollars
1998 . . . . . . . . . . . . . . . . . . . . . . 2,938 24.80 72.91999 . . . . . . . . . . . . . . . . . . . . . . 2,813 33.70 94.82000 . . . . . . . . . . . . . . . . . . . . . . 2,666 34.00 90.62001 . . . . . . . . . . . . . . . . . . . . . . 2,567 33.50 85.92002 . . . . . . . . . . . . . . . . . . . . . . 2,600 30.60 79.6Source: USDA, National Agricultural Statistics Service (NASS), Mink, July 15, 2003.
Table B-4Furskins: U.S. wild fur harvest, by major species and region of catch, 1997-98 harvestRegion Otter Coyote Nutria Mink Red Fox Muskrat Beaver Raccoon Other Total
––––––––––––––––––––––––––––––– 1,000 (pelts) –––––––––––––––––––––––––––––––––––
Midwest1 . . . . . 7 105 (2) 134 88 1,457 285 2,240 303 4,618Northeast3 . . . . 3 12 (2) 35 57 545 53 296 154 1,155Southeast4 . . . 14 7 361 16 7 74 56 211 47 793West5 . . . . . . . 4 36 37 5 13 108 35 149 110 497 Total . . . . . . 29 159 398 190 164 2,183 429 2,896 613 7,062
–––––––––––––––––––––––––––––– 1,000 (dollars) –––––––––––––––––––––––––––––––––
Midwest1 . . . . . 302 1,065 (2) 1,531 1,127 4,175 4,573 25,120 964 38,857Northeast3 . . . . 111 139 (2) 406 762 1,801 1,112 3,500 972 8,805Southeast4 . . . 447 50 1,864 144 80 198 581 1,393 223 4,981West5 . . . . . . . 163 269 195 51 181 227 589 1,034 1,329 4,038 Total . . . . . . 1,025 1,524 2,059 2,132 2,150 6,402 6,854 31,047 3,489 56,680
1 The Midwest includes the States of Illinois, Indiana, Iowa, Kansas, Michigan, Minnesota, Missouri, Nebraska,North Dakota, Ohio, Oklahoma, South Dakota, and Wisconsin.
2 No data reported.3 The Northeast States include Connecticut, Delaware, Maine, Maryland, Massachusetts, New Hampshire, New
Jersey, New York, Pennsylvania, Rhode Island, and Vermont. 4 The Southeast includes the States of Alabama, Arkansas, Florida, Georgia, Kentucky, Louisiana, Mississippi,
North Carolina, South Carolina, Tennessee, Virginia, and West Virginia.5 The West includes the States of Alaska, Arizona, California, Colorado, Idaho, Montana, Nevada, New Mexico,
Oregon, Texas, Utah, Washington, and Wyoming.
Note.—Because of rounding, figures may not add to the totals shown.
Source: U.S. Fur Harvest (1970-1998) and Fur Value (1974-1998) Statistics by State and Region, collectedannually from State Wildlife Agencies by Greg Linscombe, Chairman, Fur Resources Committee, InternationalAssociation of Fish and Wildlife Agencies.

B-5
Table B-5 Fur harvest: Average pelt prices for certain wild fur bearers, by region of catch, 1997-98 harvest Species Southeast3 Midwest1 West4 Northeast2
–––––––––––––––––– Dollar (per pelt) ––––––––––––––––
Beaver . . . . . . . . . . . . . . . . . . . . . . . . . . . . . . . . . . 10.31 16.05 16.76 21.08Red fox . . . . . . . . . . . . . . . . . . . . . . . . . . . . . . . . . . 11.64 12.44 14.35 13.38Raccoon . . . . . . . . . . . . . . . . . . . . . . . . . . . . . . . . . 6.61 11.21 6.92 11.84Muskrat . . . . . . . . . . . . . . . . . . . . . . . . . . . . . . . . . . 2.69 2.87 2.11 3.30
1 The Midwest includes the States of Illinois, Indiana, Iowa, Kansas, Michigan, Minnesota, Missouri, Nebraska,North Dakota, Ohio, Oklahoma, South Dakota, and Wisconsin.
2 The Northeast States include Connecticut, Delaware, Maine, Maryland, Massachusetts, New Hampshire, NewJersey, New York, Pennsylvania, Rhode Island, and Vermont.
3 The Southeast includes the States of Alabama, Arkansas, Florida, Georgia, Kentucky, Louisiana, Mississippi,North Carolina, South Carolina, Tennessee, Virginia, and West Virginia.
4 The West includes the States of Alaska, Arizona, California, Colorado, Idaho, Montana, Nevada, New Mexico,Oregon, Texas, Utah, Washington, and Wyoming.
Note.—Because of rounding, figures may not add to the totals shown.
Source: U.S. Fur Harvest (1970-1998) and Fur Value (1974-1998) Statistics by State and Region, collected annuallyfrom State Wildlife Agencies by Greg Linscombe, Chairman, Fur Resources Committee, International Association ofFish and Wildlife Agencies.

B-6
Table B-6Furskins: U.S. exports of domestic merchandise, imports for consumption, and merchandise tradebalance, by selected countries, and country groups, 1998-20021
Countries 1998 1999 2000 2001 2002–––––––––––––––––– Million (dollars) ––––––––––––––––––––
U.S. exports of domestic merchandise:Canada . . . . . . . . . . . . . . . . . . . . . . . . . . . 55 51 38 48 51Hong Kong . . . . . . . . . . . . . . . . . . . . . . . . 30 34 49 49 40Korea . . . . . . . . . . . . . . . . . . . . . . . . . . . . 9 22 31 25 32Turkey . . . . . . . . . . . . . . . . . . . . . . . . . . . 10 2 5 8 13Germany . . . . . . . . . . . . . . . . . . . . . . . . . 26 9 10 6 8Greece . . . . . . . . . . . . . . . . . . . . . . . . . . . 28 3 5 7 6China . . . . . . . . . . . . . . . . . . . . . . . . . . . . 3 1 5 5 5Finland . . . . . . . . . . . . . . . . . . . . . . . . . . . 2 2 1 1 2Spain . . . . . . . . . . . . . . . . . . . . . . . . . . . . 1 (2) (2) (2) (2)Sweden . . . . . . . . . . . . . . . . . . . . . . . . . . (2) (2) (2) (2) (2)All other . . . . . . . . . . . . . . . . . . . . . . . . . . 32 17 14 24 16
Total . . . . . . . . . . . . . . . . . . . . . . . . . . 196 141 158 173 173EU-15 . . . . . . . . . . . . . . . . . . . . . . . . . . . . . . 76 20 22 27 22Asia . . . . . . . . . . . . . . . . . . . . . . . . . . . . . . . . 44 58 87 83 80U.S. imports for consumption:
Canada . . . . . . . . . . . . . . . . . . . . . . . . . . . 34 32 35 36 31Hong Kong . . . . . . . . . . . . . . . . . . . . . . . . (2) (2) 1 (2) (2)Korea . . . . . . . . . . . . . . . . . . . . . . . . . . . . (2) (2) (2) (2) (2)Turkey . . . . . . . . . . . . . . . . . . . . . . . . . . . (2) (2) (2) 1 (2)Germany . . . . . . . . . . . . . . . . . . . . . . . . . (2) 1 1 1 1Greece . . . . . . . . . . . . . . . . . . . . . . . . . . . 1 (2) 1 1 1China . . . . . . . . . . . . . . . . . . . . . . . . . . . . 1 1 2 3 3Finland . . . . . . . . . . . . . . . . . . . . . . . . . . . 8 6 6 9 7Spain . . . . . . . . . . . . . . . . . . . . . . . . . . . . 4 3 5 7 7Sweden . . . . . . . . . . . . . . . . . . . . . . . . . . 6 6 7 8 7All other . . . . . . . . . . . . . . . . . . . . . . . . . . 32 24 29 30 30
Total . . . . . . . . . . . . . . . . . . . . . . . . . . 86 73 87 96 87EU-15 . . . . . . . . . . . . . . . . . . . . . . . . . . . . . . 35 27 33 42 40Asia . . . . . . . . . . . . . . . . . . . . . . . . . . . . . . . . 2 1 3 3 4U.S. merchandise trade balance:
Canada . . . . . . . . . . . . . . . . . . . . . . . . . . . 21 19 3 12 20Hong Kong . . . . . . . . . . . . . . . . . . . . . . . . 30 34 48 49 40Korea . . . . . . . . . . . . . . . . . . . . . . . . . . . . 9 22 31 25 32Turkey . . . . . . . . . . . . . . . . . . . . . . . . . . . 10 2 5 7 13Germany . . . . . . . . . . . . . . . . . . . . . . . . . 26 8 9 5 7Greece . . . . . . . . . . . . . . . . . . . . . . . . . . . 27 3 4 6 5China . . . . . . . . . . . . . . . . . . . . . . . . . . . . 2 0 3 2 2Finland . . . . . . . . . . . . . . . . . . . . . . . . . . . -6 -4 -5 -8 -5Spain . . . . . . . . . . . . . . . . . . . . . . . . . . . . -3 -3 -5 -7 -7Sweden . . . . . . . . . . . . . . . . . . . . . . . . . . -6 -6 -7 -8 -7All other . . . . . . . . . . . . . . . . . . . . . . . . . . 0 -7 -15 -6 -14
Total . . . . . . . . . . . . . . . . . . . . . . . . . . 110 68 71 77 86EU-15 . . . . . . . . . . . . . . . . . . . . . . . . . . . . . . 41 -7 -11 -15 -18Asia . . . . . . . . . . . . . . . . . . . . . . . . . . . . . . . . 42 57 84 80 76
1 Import values are based on Customs value; export values are based on f.a.s. values, U.S. port of export.2 Less than $500,000.
Note.—The countries shown are those with the largest total U.S. trade (U.S. imports plus exports) in theseproducts.
Source: Compiled from official statistics of the U.S. Department of Commerce.

B-7
Table B-7Furskins1: U.S. imports for consumption, by principal types, 1998-2002Type 1998 1999 2000 2001 2002
––––––––––––––––––––––––Quantity (1,000 pelts) ––––––––––––––––––––––––––
Mink . . . . . . . . . . . . . . . . . . 1,592 1,509 1,731 1,755 1,645Fox . . . . . . . . . . . . . . . . . . . 161 188 158 133 106Sable . . . . . . . . . . . . . . . . . 51 54 64 54 26All other . . . . . . . . . . . . . . . (2) (2) (2) (2) (2)
Total . . . . . . . . . . . . . . . (2) (2) (2) (2) (2)
–––––––––––––––––––––––––Value (1,000 dollars)––––––––––––––––––––––––––
Mink . . . . . . . . . . . . . . . . . . 44,575 37,026 45,535 48,737 46,567 Fox . . . . . . . . . . . . . . . . . . . 7,175 5,559 7,591 8,954 7,144 Sable . . . . . . . . . . . . . . . . . 4,133 2,536 3,793 3,451 2,335 All other . . . . . . . . . . . . . . . 30,525 28,149 30,528 34,415 31,129
Total . . . . . . . . . . . . . . . 86,408 73,270 87,447 95,557 87,175
–––––––––––––––––––––– Unit value (dollar per pelt) ––––––––––––––––––––––––
Mink . . . . . . . . . . . . . . . . . . 28.01 24.53 26.31 27.76 28.30 Fox . . . . . . . . . . . . . . . . . . . 44.62 29.61 47.89 67.12 67.64 Sable . . . . . . . . . . . . . . . . . 80.49 47.23 59.52 63.50 89.08 All other . . . . . . . . . . . . . . . (2) (2) (2) (2) (2)
Average . . . . . . . . . . . . . (2) (2) (2) (2) (2)1 Includes ranch and wild furskins, raw and/or dressed, whether or not dyed.2 Not meaningful.
Source: Compiled from tariff and trade data from the U.S. Department of Commerce, U.S. Department of theTreasury, and the USITC.
Table B-8Furskins: U.S. imports for consumption, by principal sources, 1998-2002 Source 1998 1999 2000 2001 2002
–––––––––––––––––– Thousand dollars––––––––––––––––––––
Canada . . . . . . . . . . . . . . . . . . . . . . . . . . . . . . . 33,725 31,556 35,390 35,539 30,653EU:
Netherlands . . . . . . . . . . . . . . . . . . . . . . . . . 4,656 1,916 2,195 5,297 7,812Finland . . . . . . . . . . . . . . . . . . . . . . . . . . . . . 8,314 6,298 6,429 8,717 7,024Spain . . . . . . . . . . . . . . . . . . . . . . . . . . . . . . 3,653 3,276 5,390 7,139 6,751Sweden . . . . . . . . . . . . . . . . . . . . . . . . . . . . 5,753 5,802 6,503 7,579 6,561Denmark . . . . . . . . . . . . . . . . . . . . . . . . . . . . 7,068 3,493 4,970 5,345 5,008Other EU . . . . . . . . . . . . . . . . . . . . . . . . . . . 5,313 6,073 8,002 8,421 6,878
Total EU . . . . . . . . . . . . . . . . . . . . . . . . . 34,756 26,858 33,489 42,498 40,034Russia . . . . . . . . . . . . . . . . . . . . . . . . . . . . . . . . 4,217 2,310 3,643 2,795 2,300
Subtotal . . . . . . . . . . . . . . . . . . . . . . . . . . . . 72,708 60,724 72,522 80,832 72,987All other . . . . . . . . . . . . . . . . . . . . . . . . . . . . . . 13,700 12,546 14,925 14,725 14,188
Grand total . . . . . . . . . . . . . . . . . . . . . . . . . . 86,408 73,270 87,447 95,557 87,175Note.—Because of rounding, figures may not add to the totals shown.
Source: Compiled from official statistics of the U.S. Department of Commerce, U.S. Department of the Treasury,and the USITC.

B-8
Table B-9Mink furskins: U.S. imports for consumption, by principal sources, 1998-2002 Countries 1998 1999 2000 2001 2002
––––––––––––––––––– Thousand dollars –––––––––––––––––––
Canada . . . . . . . . . . . . . . . . . . . . . . . . . . . . . . . 22,625 21,139 27,795 27,562 23,388EU:
Netherlands . . . . . . . . . . . . . . . . . . . . . . . . . 4,645 1,920 2,193 5,288 7,812Sweden . . . . . . . . . . . . . . . . . . . . . . . . . . . . 5,558 5,757 6,472 7,471 6,516Denmark . . . . . . . . . . . . . . . . . . . . . . . . . . . . 6,454 3,238 4,831 4,690 4,551Other EU . . . . . . . . . . . . . . . . . . . . . . . . . . . 4,742 4,239 3,286 2,924 3,400
Total EU . . . . . . . . . . . . . . . . . . . . . . . . . 21,399 15,154 16,782 20,373 22,279Other . . . . . . . . . . . . . . . . . . . . . . . . . . . . . . . . . 551 733 958 802 900
Grand total . . . . . . . . . . . . . . . . . . . . . . . . . . 44,575 37,026 45,535 48,737 46,567Note.—Because of rounding, figures may not add to the totals shown.
Source: Compiled from official statistics of the U.S. Department of Commerce, U.S. Department of the Treasury,and the USITC.
Table B-10Fox furskins: U.S. imports for consumption, by principal sources, 1998-2002 Countries 1998 1999 2000 2001 2002
––––––––––––––––––– Thousand dollars–––––––––––––––––––EU:
Finland . . . . . . . . . . . . . . . . . . . . . . . . . . . . . 4,666 3,874 5,183 6,507 5,179Other EU . . . . . . . . . . . . . . . . . . . . . . . . . . . 706 290 185 714 453
Total EU . . . . . . . . . . . . . . . . . . . . . . . . . 5,372 4,164 5,368 7,221 5,632Canada . . . . . . . . . . . . . . . . . . . . . . . . . . . . . . . 1,153 1,215 1,059 979 749All other . . . . . . . . . . . . . . . . . . . . . . . . . . . . . . 762 547 1,407 885 876
Grand total . . . . . . . . . . . . . . . . . . . . . . . . . . 7,287 5,926 7,834 9,085 7,257Note.—Because of rounding, figures may not add to the totals shown.
Source: Compiled from official statistics of the U.S. Department of Commerce, U.S. Department of the Treasury,and the USITC.

B–9
Table B-11Furskins: Harmonized Tariff Schedule subheadings; description; U.S. col. 1 rate of duty as of Jan. 1, 2003; U.S. exports, 2002; and U.S. imports, 2002
HTSsubheading Suffix1 Brief description
Col. 1 rate of duty as of Jan. 1, 2003 U.S. exports 2002
(000 dollars)
U.S. imports 2002
(000 dollars)General Special2
4301 Raw furskins (including heads, tails, paws and other pieces or cuttings):Of mink, whole, with or without head, tail or paws . . . . . . . . . . . . . . . . . . Free
4301.10.00 10 Wild . . . . . . . . . . . . . . . . . . . . . . . . . . . . . . . . . . . . . . . . . . . . . . . . . . . (3) 374301.10.00 20 Other . . . . . . . . . . . . . . . . . . . . . . . . . . . . . . . . . . . . . . . . . . . . . . . . . . . 117,356 45,0524301.30.00 00 Lamb (Astrakhan, Broadtail, Caracul, Persian and similar lamb,
Indian, Chinese, Mongolian or Tibetan lamb), whole, with or withouthead, tail or paws . . . . . . . . . . . . . . . . . . . . . . . . . . . . . . . . . . . . . . . . . Free 13,978 106
4301.60 Fox, whole with or without head, tail or paws:4301.60.30 00 Silver, black or platinum fox, including mutations of these . . . . . . . . . . 5.1% Free (A,CA,E,IL,J,MX)
1.2% (JO)(4) 389
4301.60.60 00 Other . . . . . . . . . . . . . . . . . . . . . . . . . . . . . . . . . . . . . . . . . . . . . . . . . . . Free (4) 6,4454301.70.00 00 Seal . . . . . . . . . . . . . . . . . . . . . . . . . . . . . . . . . . . . . . . . . . . . . . . . . . . . . . Free 567 04301.80.01 Other furskins, whole, with or without head, tail or paws: Free4301.80.01 01 Hare . . . . . . . . . . . . . . . . . . . . . . . . . . . . . . . . . . . . . . . . . . . . . . . . . . . . (5) 24301.80.01 02 Rabbit . . . . . . . . . . . . . . . . . . . . . . . . . . . . . . . . . . . . . . . . . . . . . . . . . (5) 2254301.80.01 03 Beaver . . . . . . . . . . . . . . . . . . . . . . . . . . . . . . . . . . . . . . . . . . . . . . . . . . (5) 6644301.80.01 04 Muskrat . . . . . . . . . . . . . . . . . . . . . . . . . . . . . . . . . . . . . . . . . . . . . . . . . (5) 1594301.80.01 10 Nutria . . . . . . . . . . . . . . . . . . . . . . . . . . . . . . . . . . . . . . . . . . . . . . . . . . . 954 3324301.80.01 20 Lynx . . . . . . . . . . . . . . . . . . . . . . . . . . . . . . . . . . . . . . . . . . . . . . . . . . . . (5) 914301.80.01 40 Marten . . . . . . . . . . . . . . . . . . . . . . . . . . . . . . . . . . . . . . . . . . . . . . . . . . (5) 4264301.80.01 60 Sable . . . . . . . . . . . . . . . . . . . . . . . . . . . . . . . . . . . . . . . . . . . . . . . . . . . (5) 2,3354301.80.01 70 Fisher . . . . . . . . . . . . . . . . . . . . . . . . . . . . . . . . . . . . . . . . . . . . . . . . . . (5) 924301.80.01 75 Racoon . . . . . . . . . . . . . . . . . . . . . . . . . . . . . . . . . . . . . . . . . . . . . . . . . (5) 9294301.80.01 90 Other . . . . . . . . . . . . . . . . . . . . . . . . . . . . . . . . . . . . . . . . . . . . . . . . . . . 21,093 8374301.90.00 00 Heads, tails, paws and other pieces or cuttings, suitable for furriers’
use . . . . . . . . . . . . . . . . . . . . . . . . . . . . . . . . . . . . . . . . . . . . . . . . . . . . . Free 332 1564302 Tanned or dressed furskins (including heads, tails, paws and
other pieces or cuttings), whether or not assembled: Whole skins, with or without head, tail or paws, not assembled:
Of mink . . . . . . . . . . . . . . . . . . . . . . . . . . . . . . . . . . . . . . . . . . . . . . . . . 2.1% Free (A,CA,E,IL,J,JO,MX)4302.11.00 10 Kolinsky . . . . . . . . . . . . . . . . . . . . . . . . . . . . . . . . . . . . . . . . . . . . . . (6) 24302.11.00 20 Other . . . . . . . . . . . . . . . . . . . . . . . . . . . . . . . . . . . . . . . . . . . . . . . . 4,825 1,4764302.13.00 00 Lamb, (Astrakhan, Broadtail, Caracul, Persian and similar lamb,
Indian, Chinese, Mongolian or Tibetan lamb) . . . . . . . . . . . . . . . . . 2.2% Free (A,CA,E,IL,J,JO,MX) 401 1,688
See footnotes at end of table.

B–10
Table B-11–ContinuedFurskins: Harmonized Tariff Schedule subheadings; description; U.S. col. 1 rate of duty as of Jan. 1, 2003; U.S. exports, 2002; and U.S. imports, 2002
HTSsubheading Suffix1 Brief description
Col. 1 rate of duty as of Jan. 1, 2003 U.S. exports2002
(000 dollars)
U.S. imports 2002
(000 dollars)General Special2
4302 Tanned or dressed furskins (including heads, tails, paws and other pieces or cuttings)—Continued
4302.19 Other:Beaver, chinchilla, ermine, fisher, fitch, fox, leopard, lynx,
marten, nutria, ocelot, otter, pony, racoon, sable or wolf:4302.19.15 00 Silver, black, or platinum fox, including mutations of these . . . . . 5.6% Free (A,CA,E,IL,J,,MX)
1.4% (JO)(7) 54
4302.19.30 Other:Not dyed . . . . . . . . . . . . . . . . . . . . . . . . . . . . . . . . . . . . . . . . . . 1.5% Free (A,CA,E,IL,J,JO,MX)
4302.19.30 30 Fox . . . . . . . . . . . . . . . . . . . . . . . . . . . . . . . . . . . . . . . . . . . . (7) 2564302.19.30 40 Racoon . . . . . . . . . . . . . . . . . . . . . . . . . . . . . . . . . . . . . . . . . (7) 3374302.19.30 70 Other . . . . . . . . . . . . . . . . . . . . . . . . . . . . . . . . . . . . . . . . . . . (7) 2,5584302.19.45 Dyed . . . . . . . . . . . . . . . . . . . . . . . . . . . . . . . . . . . . . . . . . . . . . 2.2% Free (A,CA,E,IL,J,JO,MX)4302.19.45 30 Fox . . . . . . . . . . . . . . . . . . . . . . . . . . . . . . . . . . . . . . . . . . . . (7) 1134302.19.45 40 Racoon . . . . . . . . . . . . . . . . . . . . . . . . . . . . . . . . . . . . . . . . . (7) 364302.19.45 70 Other . . . . . . . . . . . . . . . . . . . . . . . . . . . . . . . . . . . . . . . . . . . (7) 6184302.19.55 00 Rabbit or hare . . . . . . . . . . . . . . . . . . . . . . . . . . . . . . . . . . . . . . . . . . . . 2.7% Free (A,CA,E,IL,J,JO,MX) (7) 1,291
Other:4302.19.60 00 Not dyed . . . . . . . . . . . . . . . . . . . . . . . . . . . . . . . . . . . . . . . . . . . . . . 3.5% Free (A,CA,E,IL,J,JO,MX) (7) 3,854
4302.19.75 00 Dyed . . . . . . . . . . . . . . . . . . . . . . . . . . . . . . . . . . . . . . . . . . . . . . . . . 1.7% Free (A,CA,E,IL,J,JO,MX) (7) 12,1224302.20 Heads, tails, paws and other pieces or cuttings, not assembled:4302.20.30 00 Beaver, Caracul or Persian lamb, chinchilla, ermine, fisher,
fitch, fox, Kolinsky, leopard, lynx, marten, mink, nutria,ocelot, otter, pony, racoon, sable or wolf . . . . . . . . . . . . . . . . . . . . . 2.1% Free (A,CA,E,IL,J,JO,MX) (8) 712
Other:4302.20.60 00 Not dyed . . . . . . . . . . . . . . . . . . . . . . . . . . . . . . . . . . . . . . . . . . . . . . 3.5% Free (A,CA,E,IL,J,JO,MX) (8) 4574302.20.90 00 Dyed . . . . . . . . . . . . . . . . . . . . . . . . . . . . . . . . . . . . . . . . . . . . . . . . . 1.7% Free (A,CA,E,IL,J,JO,MX) (8) 1,500
4302.30.00 00 Whole skins and pieces or cuttings thereof, assembled . . . . . . . . . . . . . . 5.3% Free (A,CA,E,IL,J,MX)1.3% (JO)
625 1,824
See footnotes at end of table.

B–11
Table B-11–ContinuedFurskins: Harmonized Tariff Schedule subheadings; description; U.S. col. 1 rate of duty as of Jan. 1, 2003; U.S. exports, 2002; and U.S. imports, 2002
HTSsubheading Suffix1 Brief description
Col. 1 rate of duty as of Jan. 1, 2003 U.S. exports2002
(000 dollars)
U.S. imports 2002
(000 dollars)General Special2
1 The suffix is not pat of the legal HTS text.2 Programs under which special tariff treatment may be provided and the corresponding symbols for such programs as they are indicated in the “Special” subcolumn are as follows:
Generalized System of Preferences (A); NAFTA of Canada (CA); Mexico (MX); Caribbean Basin Economic Recovery Act (E); United States-Israel Free-Trade Area (IL); the AndeanTrade Preference Act (J); and the United States-Jordan Free Trade Implementation Act (JO). See general notes to the HTS for more details on these programs.
3 Export data included in HTS heading 4301.10.00.20.4 Export data are not available for HTS heading and suffix 4301.60.30.00 and HTS 4301.60.60.00. Collectively, the value of these exports was $2,923,000 in 2002.5 Export data included in HTS subheading 4301.80.01"Other” and correspond to imports entered under HTS subheading 4301.80.01 (except nutria).6 Export data included in HTS subheading 4302.11.00.207 Export data are not available for HTS headings 4302.19.15, 4302.19.30, 4302.19.45, 4302.19.55, 4302.19.60, and 4302.19.75. Collectively, the value of these exports was
$8,150,000 in 2002.8 Export data are not available for HTS headings 4302.20.30, 4302.20.60,and 4302.20.90. Collectively, the value of these exports was $1,107,000 in 2002.
Source: Compiled from official statistics of the U.S. Department of Commerce and from USITC, Harmonized Tariff Schedule of the United States (2003), USITC publication 3565,2003.

B-12
Table B-12 Furskins: U.S. exports of domestic merchandise, by principal types, 1998-2002Type 1998 1999 2000 2001 2002
–––––––––––––––––––– Quantity (1,000 pelts) ––––––––––––––––––––
Mink . . . . . . . . . . . . . . . . . . . . . . . . . . . . 3,480 4,413 4,591 4,452 4,265Fox . . . . . . . . . . . . . . . . . . . . . . . . . . . . . 100 69 120 236 202Beaver . . . . . . . . . . . . . . . . . . . . . . . . . . 316 239 250 226 (1)Muskrat . . . . . . . . . . . . . . . . . . . . . . . . . . 678 721 667 1,076 (1)Nutria . . . . . . . . . . . . . . . . . . . . . . . . . . . 382 40 29 70 371All other . . . . . . . . . . . . . . . . . . . . . . . . . 4,871 2,348 1,949 2,825 3,965
Total . . . . . . . . . . . . . . . . . . . . . . . . . 9,828 7,831 7,606 8,885 8,804
––––––––––––––––––––Value (1,000 dollars)––––––––––––––––––––––
Mink . . . . . . . . . . . . . . . . . . . . . . . . . . . . 108,688 104,017 121,562 126,262 122,181Fox . . . . . . . . . . . . . . . . . . . . . . . . . . . . . 1,759 1,192 3,482 4,893 2,923Beaver . . . . . . . . . . . . . . . . . . . . . . . . . . 6,639 3,596 3,430 2,933 (1)Muskrat . . . . . . . . . . . . . . . . . . . . . . . . . . 2,520 1,917 2,267 3,629 (1)Nutria . . . . . . . . . . . . . . . . . . . . . . . . . . . 2,314 799 177 379 954All other . . . . . . . . . . . . . . . . . . . . . . . . . 73,674 29,006 26,664 34,775 46,517
Total . . . . . . . . . . . . . . . . . . . . . . . . . 195,594 140,526 157,581 172,872 172,575
–––––––––––––––––– Unit value (dollar per pelt) –––––––––––––––––––
Mink . . . . . . . . . . . . . . . . . . . . . . . . . . . . 31.23 23.57 26.48 28.36 28.65 Fox . . . . . . . . . . . . . . . . . . . . . . . . . . . . . 17.61 17.25 28.97 20.75 14.45 Beaver . . . . . . . . . . . . . . . . . . . . . . . . . . 21.01 15.02 13.75 12.96 (1)Muskrat . . . . . . . . . . . . . . . . . . . . . . . . . . 3.72 2.66 3.40 3.37 (1)Nutria . . . . . . . . . . . . . . . . . . . . . . . . . . . 6.05 19.80 6.01 5.40 2.57All other . . . . . . . . . . . . . . . . . . . . . . . . . 15.12 12.35 13.68 12.31 11.73
Total . . . . . . . . . . . . . . . . . . . . . . . . . 19.90 17.95 20.72 19.46 19.601 Included in “all other” category.
Source: Compiled from tariff and trade data from the U.S. Department of Commerce, the U.S. Department of theTreasury, and the USITC.

B-13
Table B-13Furskins: U.S. exports of domestic merchandise, by selected countries and regions, 1998-2002Countries 1998 1999 2000 2001 2002
–––––––––––––––––––––––––– Thousand dollars ––––––––––––––––––––––––––
Asia:Hong Kong . . . . . . . . . . . 30,029 33,910 48,815 49,219 40,158 Korea . . . . . . . . . . . . . . . 9,033 22,455 31,113 25,482 32,287 China . . . . . . . . . . . . . . . 3,024 1,139 4,900 5,066 5,453 Japan . . . . . . . . . . . . . . . 1,119 667 1,266 1,800 1,268 All other . . . . . . . . . . . . . 488 182 1,086 1,108 1,243
Asia total . . . . . . . . . . 43,693 58,353 87,180 82,674 80,409 Canada . . . . . . . . . . . . . . . . 54,785 51,491 38,092 47,798 50,756 EU:
Germany . . . . . . . . . . . . 25,807 9,344 9,556 6,332 7,565 Greece . . . . . . . . . . . . . . 28,432 3,127 4,696 6,968 5,848 Italy . . . . . . . . . . . . . . . 7,532 1,903 2,853 3,929 3,586 Finland . . . . . . . . . . . . . . 2,107 1,720 977 1,361 1,907 United Kingdom . . . . . . . 7,345 654 2,330 6,857 1,410 France . . . . . . . . . . . . . . 1,719 1,611 617 696 651 All other . . . . . . . . . . . . . 3,029 1,341 1,012 1,043 1,040
EU total . . . . . . . . . . . 75,970 19,701 22,042 27,186 22,006 All other markets . . . . . . . . . 21,146 10,982 10,267 15,214 19,403
Total . . . . . . . . . . . . . . . . 195,594 140,526 157,581 172,872 172,575 Source: Compiled from tariff and trade data from the U.S. Department of Commerce, the U.S. Department of theTreasury, and the USITC.
Table B-14Mink furskins: U.S. exports of domestic merchandise, by selected countries and regions,1998-2002Market 1998 1999 2000 2001 2002
––––––––––––––––––Thousand dollars ––––––––––––––––––––Asia:
Hong Kong . . . . . . . . . . . . . . . . . . . . . . . . . . 26,138 30,421 44,032 45,279 37,216Korea . . . . . . . . . . . . . . . . . . . . . . . . . . . . . . 8,178 21,549 30,454 23,978 31,456China . . . . . . . . . . . . . . . . . . . . . . . . . . . . . . 1,189 605 3,583 1,992 3,092Japan . . . . . . . . . . . . . . . . . . . . . . . . . . . . . . 851 384 390 839 629All other . . . . . . . . . . . . . . . . . . . . . . . . . . . . 93 0 4 142 338
Total Asia . . . . . . . . . . . . . . . . . . . . . . . . . 36,449 52,959 78,463 72,231 72,730Canada . . . . . . . . . . . . . . . . . . . . . . . . . . . . . . . 14,359 34,982 26,399 33,111 33,756EU:
Germany . . . . . . . . . . . . . . . . . . . . . . . . . . . 19,495 6,384 7,042 3,704 6,496Greece . . . . . . . . . . . . . . . . . . . . . . . . . . . . . 21,043 1,845 3,561 5,225 4,003Finland . . . . . . . . . . . . . . . . . . . . . . . . . . . . . 1,986 1,549 736 1,306 1,784Italy . . . . . . . . . . . . . . . . . . . . . . . . . . . . . . . 2,704 826 1,414 1,481 1,109All other EU . . . . . . . . . . . . . . . . . . . . . . . . . 10,264 1,878 2,717 6,738 1,521
Total EU . . . . . . . . . . . . . . . . . . . . . . . . . . 55,492 12,482 15,470 18,455 14,913All other . . . . . . . . . . . . . . . . . . . . . . . . . . . . . . 2,388 3,594 1,230 2,465 782
World . . . . . . . . . . . . . . . . . . . . . . . . . . . . . . 108,688 104,017 121,562 126,262 122,181Source: Compiled from official statistics of the U.S. Department of Commerce.

B-14
Table B-15Mink furskins: World production by principal producing countries, 1998-2002Country 1998 1999 2000 2001 2002
––––––––––––––––––––––– Thousand pelts–––––––––––––––––––––––
Denmark . . . . . . . . . . . . . . . . . . . . . . . . 11,900 10,500 10,900 12,200 12,200Netherlands . . . . . . . . . . . . . . . . . . . . . 2,700 2,700 2,750 3,000 3,000Russia . . . . . . . . . . . . . . . . . . . . . . . . . . 3,330 2,670 2,250 2,500 2,700United States . . . . . . . . . . . . . . . . . . . . 2,900 2,800 2,650 2,570 2,550Finland . . . . . . . . . . . . . . . . . . . . . . . . . 2,100 1,900 2,000 2,000 2,000China . . . . . . . . . . . . . . . . . . . . . . . . . . 1,200 1,500 1,700 2,000 1,700Sweden . . . . . . . . . . . . . . . . . . . . . . . . . 1,300 1,300 1,200 1,325 1,400Canada . . . . . . . . . . . . . . . . . . . . . . . . . 950 900 1,000 1,150 1,200All other . . . . . . . . . . . . . . . . . . . . . . . . 3,709 3,470 3,663 3,805 4,115
World . . . . . . . . . . . . . . . . . . . . . . . . 30,089 27,740 28,113 30,550 30,865Note.—Because of rounding, figures may not add to the totals shown.
Source: Facsimile from Sandy Parker, Farm Produced Minkskins, Oslo Fur Auctions, Ltd., July 16, 2003.
Table B-16Farmed fox: Number of pelts offered on the world market, 1998–2002Region/country 1998 1999 2000 2001 2002
–––––––——–––––Thousand pelts––––——–––––––––– Scandinavia:
Finland . . . . . . . . . . . . . . . . . . . . . . . . . . . . . . . . . . . . . 2,700 2,100 1,900 2,115 2,125Other Scandinavian . . . . . . . . . . . . . . . . . . . . . . . . . . . 655 499 430 431 432
Scandinavia total . . . . . . . . . . . . . . . . . . . . . . . . . . . 3,355 2,599 2,330 2,546 2,557China . . . . . . . . . . . . . . . . . . . . . . . . . . . . . . . . . . . . . . . . 400 800 900 1,000 1,200Russia . . . . . . . . . . . . . . . . . . . . . . . . . . . . . . . . . . . . . . . . 680 400 350 350 400All other . . . . . . . . . . . . . . . . . . . . . . . . . . . . . . . . . . . . . . 324 376 403 436 380
Grand total . . . . . . . . . . . . . . . . . . . . . . . . . . . . . . . . . . 4,759 4,175 3,983 4,332 4,537Note.—Because of rounding, figures may not add to the totals shown.
Source: Facsimile from Sandy Parker, Farm Produced Foxskins, Oslo Fur Auctions, Ltd., July 16, 2003.
Table B-17Furskins: World imports, by major markets, 1998- 2001Markets 1998 1999 2000 2001
–––––––––––––––––Millions (dollars) –––––––––––––––
Hong Kong . . . . . . . . . . . . . . . . . . . . . . . . . . . . . . . . . . 321 283 371 394EU1 . . . . . . . . . . . . . . . . . . . . . . . . . . . . . . . . . . . . . . . . 190 89 103 103South Korea . . . . . . . . . . . . . . . . . . . . . . . . . . . . . . . . . 41 72 90 67China . . . . . . . . . . . . . . . . . . . . . . . . . . . . . . . . . . . . . . 49 45 63 66United States . . . . . . . . . . . . . . . . . . . . . . . . . . . . . . . . 61 47 58 62All other . . . . . . . . . . . . . . . . . . . . . . . . . . . . . . . . . . . . 140 118 121 151
World . . . . . . . . . . . . . . . . . . . . . . . . . . . . . . . . . . . . 802 654 806 8431 Excludes intra EU trade.
Source: Food and Agriculture Organization of the United Nations, statistical database, found athttp://www.fao.org, retrieved Aug. 1, 2003.

B-15
Table B-18Fur farming: Actions taken to abolish fur farms, by selected countries
Austria . . . . . . . . . . . . . . . . . . . . . Austria was the first EU member state to ban fur farming. Each of the 9regions in Austria voted to ban fur farming during the 1990s. In June 1998,the last remaining mink farm closed.
Netherlands . . . . . . . . . . . . . . . . . Fox and chinchilla farming were banned since 1995 and 1997 respectively. Both bans allow for phase out period extending to April 2008. A proposal toban mink farming has been dropped pending new legislation from the EU.
Great Britain and Wales . . . . . . . . The Fur Farming Prohibition Act of 2000 effectively shut down all fur farmsJanuary 1, 2003.
Scotland . . . . . . . . . . . . . . . . . . . . Scotland passed the Fur Farming (Prohibition) Bill in March 2002. Sincethere are no fur farms in Scotland, the main objective of the bill is to preventfur farmers from Great Britain and Wales relocating to Scotland by prohibitingthe establishment of fur farms north of the border.
Sweden . . . . . . . . . . . . . . . . . . . . . In November 2001, Sweden’s Social Democratic Party voted to ban furfarming. The Swedish Government is investigating the affects of possible banon fur farming, but results have not been finalized.
Source: World Animal Net, Anti-Fur Legislation, found at Internet address; http://worldanimal.net/fur-egislation.html, retrieved Aug. 25, 2003.