united states science advisory epa-sab-ec-adv-00-005 ... · the usepa’s draft case study analysis...
TRANSCRIPT

United States Science Advisory EPA-SAB-EC-ADV-00-005Environmental Board (1400A) May 2000
Protection Agency Washington DC www.epa.gov/sab
AN SAB ADVISORY ONTHE USEPA’s DRAFT CASESTUDY ANALYSIS OF THERESIDUAL RISK OFSECONDARY LEADSMELTERS
Prepared by the Residual RiskSubcommittee of the ScienceAdvisory Board

May 19, 2000
EPA-SAB-EC-ADV-00-005
Honorable Carol M. BrownerAdministratorU.S. Environmental Protection Agency1200 Pennsylvania Avenue Washington, DC 20460
RE: Advisory on the USEPA's Draft Case Study Analysis of the Residual Riskof Secondary Lead Smelters
Dear Ms. Browner:
On March 1-2, 2000, the Science Advisory Board's (SAB's) Residual Risk Subcommittee ofthe SAB Executive Committee conducted a peer review of an Agency case study of the residual riskassessment methodology, described in its Report to Congress (USEPA, 1999), as applied to thesecondary lead smelter source category (USEPA, 2000). The review of the seven-volume set ofmaterial focused on eight specific questions that are addressed in detail in the accompanying SABreport.
In short, the Subcommittee concludes that the Agency has developed a useful, self-described"work-in progress". The methodology used in this interim workproduct, as far as it currently goes, isconsistent with the methodology described in the Report to Congress. Further, the assumptions usedare consistent with current methods and practice. The case study provides a valuable example of howthe approach presented in the Report is going to be implemented.
However, because the Subcommittee has not yet seen a full residual risk analysis and, thus, isunable to comment on the complete process, a number of important concerns were identified thatshould be addressed. Specifically, this interim analysis does not include the following importantelements: an ecosystem risk assessment; a health risk assessment that includes population risks; a fullanalysis of uncertainty and variability; a computer model for assessing multimedia transport and fate thathas been adequately evaluated; nor a clear description of the process and how the assessments link tothe eventual risk management decisions. The attached consensus report contains a discussion of anumber of additional issues related to the specific approaches taken in the interim analysis.
Looking to the future and the 173 other source categories to be addressed in the residual riskprogram, the Subcommittee is concerned about the data gaps that are likely to be even more of a

2
problem than they are in the case of secondary lead smelters. Both the Agency and the Congress needto recognize this problem in order to ensure that there is an adequate data base to support the residualrisk analysis program.
During the review by the Executive Committee, a number of important concerns were raisedthat will be the subject of a subsequent SAB Commentary. In addition, the Health and EnvironmentalEffects Subcommittee (HEES) of the SAB's Council on Clean Air Act Compliance Analysis(COUNCIL) and the Agency will host a June, 2000 workshop on dealing with hazardous air pollutants(HAPs). The workshop and its outcomes could prove useful insights that are applicable to theimplementing of the Residual Risk Program.
We appreciate the opportunity to provide advice on this effort. The Agency staff was open,collegial, cognizant of shortcomings in the document, and accepting of the Subcommittee's suggestions. Given the incomplete state of the document at this time and the precedent-setting nature of this -- thefirst of 174 -- residual risk analyses, we conclude that a peer review of the final Agency Report onsecondary lead smelters is in order. We look forward to your response.
Sincerely,
/s/ /s/
Dr. Morton Lippmann, Interim Chair Dr. Philip Hopke, ChairScience Advisory Board Residual Risk Subcommittee
Science Advisory Board

i
NOTICE
This report has been written as part of the activities of the Science Advisory Board, a publicadvisory group providing extramural scientific information and advice to the Administrator and otherofficials of the US Environmental Protection Agency. The Board is structured to provide balanced,expert assessment of scientific matters related to problems facing the Agency. This report has not beenreviewed for approval by the Agency and, hence, the contents of this report do not necessarily representthe views and policies of the US Environmental Protection Agency, nor of other agencies in the ExecutiveBranch of the Federal government, nor does mention of trade names or commercial products constitute arecommendation for use.
Distribution and Availability: This Science Advisory Board report is provided to the USEPAAdministrator, senior Agency management, appropriate program staff, interested members of the public,and is posed on the SAB website (www.epa.gov/sab). Information on its availability is also provided inthe SAB's monthly newsletter (Happenings at the Science Advisory Board). Additional copies andfurther information are available from the SAB Staff.
ii
US ENVIRONMENTAL PROTECTION AGENCY SCIENCE ADVISORY BOARD
RESIDUAL RISK SUBCOMMITTEE MEMBERS: SECONDARY LEAD SMELTERS
SAB MEMBERS*
Dr. Philip Hopke, Department of Chemistry, Clarkson University, Potsdam, NY (Chair)Member: SAB's Clean Air Science Advisory Committee
Dr. Stephen L. Brown, Risks of Radiation Chemical Compounds (R2C2), Oakland, CAMember: SAB's Research Strategies Advisory Committee,
SAB's Radiation Advisory Committee
Dr. Michael J. McFarland, Engineering Depart., Utah State University, River Heights, UT Member: SAB's Environmental Engineering Committee
Dr. Paulette Middleton, RAND Ctr for Env Sciences & Policy, Boulder, CO Member: SAB's Advisory Council on Clean Air Act Compliance Analysis
Dr. Jerome Nriagu, School of Public Health, University of Michigan, Ann Arbor, MI Member: SAB's Integrated Human Exposure Committee
SAB CONSULTANTS*
Dr. Gregory Biddinger, Exxon-Mobil Company, Fairfax, VA
Dr. Deborah Cory-Slechta, Department of Environmental Medicine, University of Rochester,Rochester, NY
Dr. Thomas J. Gentile, NY State Dept of Environmental Conservation, Albany, NY
Dr. Dale Hattis, Clark University, Worcester, MA
Dr. George E. Taylor, Biology Department, George Mason University, Fairfax, VA
Dr. Valerie Thomas, Center for Energy and Environmental Studies, Princeton University, Princeton, NJ
Dr. Rae Zimmerman, Robert Wagner Graduate School of Public Service, New York University, NewYork, NY

iii
SCIENCE ADVISORY BOARD STAFF:Dr. Donald G. Barnes, Designated Federal Officer, US Environmental Protection Agency Science
Advisory Board (1400A), 1200 Pennsylvania Avenue, Washington, DC 20460Ms. Priscilla Tillery-Gadson, Management Associate, US Environmental Protection Agency Science
Advisory Board (1400A), 1200 Pennsylvania Avenue, Washington, DC 20460
Ms. Betty Fortune , Management Assistant, US Environmental Protection Agency Science AdvisoryBoard (1400A), 1200 Pennsylvania Avenue, Washington, DC 20460
* Members of this SAB Subcommittee consist of a. SAB Members: Experts appointed by the Administrator to two-year terms to serve on one of
the 10 SAB Standing Committees.b. SAB Consultants: Experts appointed by the SAB Staff Director to a one-year term to serve on
ad hoc Panels formed to address a particular issue; in this case, the application of theAgency's Residual Risk Policy to the case of secondary lead smelters.

iv
TABLE OF CONTENTS
1.0 EXECUTIVE SUMMARY . . . . . . . . . . . . . . . . . . . . . . . . . . . . . . . . . . . . . . . . . . . . . . . . . . . . . 1
2.0 INTRODUCTION . . . . . . . . . . . . . . . . . . . . . . . . . . . . . . . . . . . . . . . . . . . . . . . . . . . . . . . . . . . 42.1 Background . . . . . . . . . . . . . . . . . . . . . . . . . . . . . . . . . . . . . . . . . . . . . . . . . . . . . . . . . . 42.2 Charge . . . . . . . . . . . . . . . . . . . . . . . . . . . . . . . . . . . . . . . . . . . . . . . . . . . . . . . . . . . . . . 42.3 SAB Review Process . . . . . . . . . . . . . . . . . . . . . . . . . . . . . . . . . . . . . . . . . . . . . . . . . . . 5
3.0 RESPONSES TO SPECIFIC CHARGE QUESTIONS . . . . . . . . . . . . . . . . . . . . . . . . . . . . . . . 63.1 Charge Question 1: Overall
Is the methodology that the Agency applied in this risk assessmentconsistent with the risk assessment approach and methodologypresented in the Report to Congress (EPA-453/R-99-001)? Are theassumptions used in this risk assessment consistent with currentmethods and practices? . . . . . . . . . . . . . . . . . . . . . . . . . . . . . . . . . . 6
3.2 Charge Question 2: Model InputsAre the methods used to estimate emission rates, and the methodused to estimate species at the stack appropriate and clearlydescribed? . . . . . . . . . . . . . . . . . . . . . . . . . . . . . . . . . . . . . . . . . . . . 8
3.2.1 Inhalation Screening . . . . . . . . . . . . . . . . . . . . . . . . . . . . . . . . . . . . . . . . . . . . . 83.2.2 Multipathway Risk Assessment . . . . . . . . . . . . . . . . . . . . . . . . . . . . . . . . . . . . . 9
3.3 Charge Question 3: Models Does the risk assessment use appropriate currently available
dispersion models both at the screening level and at the more refinedlevel of analysis? Are the models applied correctly? Given the stateof the science, does the risk assessment use an appropriate multi-pathway model? The assessment uses the IEM-2M model, with somemodifications. Is the IEM-2M model appropriate for use in thisregulatory context? With regard to the modification and applicationof the model, did the EPA appropriately modify the model for use inthis risk assessment, and did the Agency apply the model correctly? Is there another model or another approach that is available at thistime that EPA should consider? . . . . . . . . . . . . . . . . . . . . . . . . . . . 10
3.3.1 Does the risk assessment use appropriate currently available dispersion modelsboth at the screening level and at the more refined level of analysis? . . . . . . . . . . . . . . . . . . . . . . . . . . . . . . . . . . . . . . . . . . . . . . . . . 10
3.3.2 Are the models applied correctly? . . . . . . . . . . . . . . . . . . . . . . . . . . . . . . . . . . 10

v
3.3.3 Given the state of the science, does the risk assessment use an appropriatemultipathway model? The assessment uses the IEM-2M model with somemodifications. Is the IEM-2M appropriate for use in this regulatory context? . 11
3.3.4 With regard to the modification and application of the model, did the EPAappropriately modify the model for use in this risk assessment, and did theAgency apply the model correctly? . . . . . . . . . . . . . . . . . . . . . . . . . . . . . . . . 13
3.4 Charge Question 4: Choice of ReceptorsThe Agency identifies the home gardener as the appropriate receptorto estimate risks to the residential population and the farmer toembody high end risks. Are these receptors appropriate for thistask? . . . . . . . . . . . . . . . . . . . . . . . . . . . . . . . . . . . . . . . . . . . . . . . . 13
3.5 Charge Question 5: Ecological Risk AssessmentGiven currently available methods, are the models used for theecological assessment appropriate? Are they applied correctly? Arethe ecological benchmarks appropriate? . . . . . . . . . . . . . . . . . . . . 14
3.5.1 General Statement . . . . . . . . . . . . . . . . . . . . . . . . . . . . . . . . . . . . . . . . . . . . . 143.5.2 Given currently available methods, are the for the ecological assessment
appropriate? . . . . . . . . . . . . . . . . . . . . . . . . . . . . . . . . . . . . . . . . . . . . . . . . 143.5.3 Are they (the models) applied correctly? . . . . . . . . . . . . . . . . . . . . . . . . . . . . . 163.5.4. Are the ecological benchmarks appropriate? . . . . . . . . . . . . . . . . . . . . . . . . . 16
3.6 Charge Question 6: Health Risk Assessment Section 3.4.1 of the Report to Congress identifies several datasources that the Agency would draw upon for choosing dose-response assessments to be used in residual risk assessments. TheReport also states that EPA will develop a hierarchy for using suchsources. Given available dose-response information, is the hierarchypresented in this assessment appropriate (see especially footnote #6,section 2.2.1)? For each chemical included in the assessment, is thechoice of dose-response assessment appropriate? Are the dose-response assessments appropriately incorporated into theassessment? . . . . . . . . . . . . . . . . . . . . . . . . . . . . . . . . . . . . . . . . . . 17
3.7 Charge Question 7: Uncertainty and Variability AssessmentDid the assessment use appropriate currently available methods toidentify the variables and pathways to address the uncertainty andvariability assessment? Are the methods used to quantify variabilityand uncertainty acceptable? Are there other, more appropriatemethods available for consideration? . . . . . . . . . . . . . . . . . . . . . . 20
3.8 Charge Question 8: Presentation of ResultsDoes the Agency's document clearly present and interpret the riskresults? Does it provide the appropriate level of information? Do

vi
the figures and tables adequately present the data? Do the formatsprovide for a clear understanding of the material? . . . . . . . . . . . . 22
3.8.1 Initial Screening Analysis . . . . . . . . . . . . . . . . . . . . . . . . . . . . . . . . . . . . . . . . 223.8.2 Multipathway Analysis . . . . . . . . . . . . . . . . . . . . . . . . . . . . . . . . . . . . . . . . . . 243.8.3 Uncertainty and Variability Analysis . . . . . . . . . . . . . . . . . . . . . . . . . . . . . . . . 253.8.4 Risk Characterization . . . . . . . . . . . . . . . . . . . . . . . . . . . . . . . . . . . . . . . . . . . 263.8.5 Summary and Discussion . . . . . . . . . . . . . . . . . . . . . . . . . . . . . . . . . . . . . . . . 26
4. 0 REFERENCES . . . . . . . . . . . . . . . . . . . . . . . . . . . . . . . . . . . . . . . . . . . . . . . . . . . . . . . . . . . R-1
APPENDIX A
WRITTEN COMMENTS OF SUBCOMMITTEE MEMBERS1. Dr. Gregory Biddinger . . . . . . . . . . . . . . . . . . . . . . . . . . . . . . . . . . . . . . . . . . . . . . . . . . A-22. Dr. Stephen L. Brown . . . . . . . . . . . . . . . . . . . . . . . . . . . . . . . . . . . . . . . . . . . . . . . . . . A-73. Dr. Deborah Cory-Slechta . . . . . . . . . . . . . . . . . . . . . . . . . . . . . . . . . . . . . . . . . . . . . . A-144. Dr. Thomas J. Gentile . . . . . . . . . . . . . . . . . . . . . . . . . . . . . . . . . . . . . . . . . . . . . . . . . . A-175. Dr. Dale Hattis . . . . . . . . . . . . . . . . . . . . . . . . . . . . . . . . . . . . . . . . . . . . . . . . . . . . . . . A-276. Dr. Michael J. McFarland . . . . . . . . . . . . . . . . . . . . . . . . . . . . . . . . . . . . . . . . . . . . . . A-347. Dr. Paulette Middleton . . . . . . . . . . . . . . . . . . . . . . . . . . . . . . . . . . . . . . . . . . . . . . . . . A-398. Dr. George E. Taylor . . . . . . . . . . . . . . . . . . . . . . . . . . . . . . . . . . . . . . . . . . . . . . . . . . A-429. Dr. Rae Zimmerman . . . . . . . . . . . . . . . . . . . . . . . . . . . . . . . . . . . . . . . . . . . . . . . . . . . A-48
APPENDIX B
A MORE DETAILED DESCRIPTION OF THE SAB PROCESS . . . . . . . . . . . . . . B-1
APPENDIX C
GLOSSARY . . . . . . . . . . . . . . . . . . . . . . . . . . . . . . . . . . . . . . . . . . . . . . . . . . . . . . . . . . C-1

1
1. EXECUTIVE SUMMARY
On March 1-2, 2000, the Science Advisory Board's (SAB's) Residual Risk Subcommittee of theSAB Executive Committee conducted a peer review of an Agency draft case study of the residual riskassessment methodology, as described in its Report to Congress (USEPA, 1999), as applied to thesecondary lead smelter source category (USEPA, 2000). The SAB understands that the Agency plansanother iteration, including additional data collection and analysis before the results are considered for usein a regulatory contexts. The review of the seven-volume set of material focused on eight specificquestions that are addressed in detail in the accompanying SAB report.
In short, the Subcommittee concludes that the Agency has developed a useful, self-described"work-in progress". The methodology used in this interim workproduct, as far as it currently goes, isconsistent with the methodology described in the Report to Congress. Further, the assumptions used areconsistent with current methods and practice. The case study provides a valuable example of how theapproach presented in the Report is going to be implemented.
However, because the Subcommittee has not yet seen a full residual risk analysis and, thus, isunable to comment on the complete process, a number of important concerns were identified that shouldbe addressed. Specifically, this interim analysis does not include the following important elements: anecosystem risk assessment; a health risk assessment that includes population risks; a full analysis ofuncertainty and variability; a computer model for assessing multimedia transport and fate that has beenadequately evaluated; nor a clear description of the process and how the assessments link to the eventualrisk management decisions. With respect to the specific approaches taken in the interim analysis, anumber of questions are discussed in detail in the attached consensus report.
One of the greatest shortcomings of the case study in its incomplete state is that only the first stagescreening analysis has been done for the ecological risk assessment. While the Office of Air QualityPlanning and Standards (OAQPS) recognizes that a full risk assessment is needed, the Subcommittee isdisappointed at the pace at which the assessment is being developed and implemented for ecology andnatural resources. It would appear that a more concerted and scientifically sound analysis is needed inorder to meet the mandate of the Clean Air Act Amendments (CAAA).
Regarding the health risk assessment portion of the case study, the Subcommittee finds that,within the limitations of data and resources, the approaches employed by the Agency were able toqualitatively identify potentially high human health risk situations. However, the Subcommittee alsoconcluded that the currently available science is insufficient to be comfortable with the quantitative valuesestimated by these models. In particular, the analysis calls into question the ability of the model to reliablyquantify the amount of the deposited contaminant that is transferred to the food chain. In addition, thecurrent risk assessment will have to be further developed in order to include population risks if it is tomeet the needs of the Agency.

2
The lack of a more rigorous treatment of uncertainty and variability may lend an aura of precisionto the risk estimates in the case study that may not be warranted and could, thereby, be misleading forAgency decision makers. In particular, the uncertainty analysis does not consider the propagation ofuncertainties of the model parameters throughout the analysis.
In the case of multimedia computer models, the Subcommittee is concerned about the extent towhich such models were applied without due consideration of the plausibility of the assumptions and thephysical meaning of the results. There should be an iterative process in which implausible results flagproblem areas, so that the Agency can make appropriate revisions in the model and/or its inputs, and themodel run again. A number of plausibility checks were described by the Subcommittee and in publiccomments that would provide checkpoints in the analysis and, thereby, indicate the need for alternativeassumptions and recalculation. Inclusion of these checkpoints would be helpful to both the Agency andthe reader.
Finally, an overarching comment is that the case study should provide more details of what wasdone, how it was accomplished, and how the results link to the eventual risk management decisions. It iscritical that the process be described as clearly as possible, especially articulating why particular choiceswere made at various decision points in the risk analysis. The current document is lacking in this regard.
Moving beyond the strictly technical aspects of the document on which the SAB has been askedto provide advice, the Subcommittee would like to comment on what it understands is the Agency'sintention to make decisions based on these results. Specifically, the Agency is mandated under Section112(f) of the Clean Air Act to conduct the residual risk assessment and to make a decision aboutwhether or not further regulation is necessary in order to protect public health and the environment. Inparticular, as stated in the Agency's response to the previous SAB review of the Report To Congress(SAB-EC-98-013), “the decision made with the results of the screening analysis is [either] no furtheraction or refine the analysis, while the decision made with the results of the more refined analysis is[either] no further action or consider additional emissions control.” As discussed above, theSubcommittee concludes that, as the currently presented, the results of the refined analysis provide thesame answer as the initial screening analysis; that is, they will not suffice as a basis for risk-basedrulemaking, and, therefore, an even more refined analysis is needed. Therefore, the case study, at thisstage, has not achieved its decision objective, and another level of analysis or iteration is needed. Abetter-informed decision will be possible if the results of the case study more fully reflect the inability todefine the risks more precisely.
Outside the bounds of this particular analysis, the Subcommittee expressed two broader concernsregarding future assessments. First, the present source category, secondary lead smelters, is relativelydata-rich. Because of the existence of the lead National Ambient Air Quality Standard (NAAQS) andthe concern for blood lead levels in children, there are more data in the vicinity of facilities of this sourcecategory than are likely to be available for other HAPs from other types of sources. For many or mostother source categories, the number of HAPs and the number of source types, coupled with the limited

3
data on emissions and quantitative information on health and ecological effects, makes the residual risktask substantial.
Second, while the basic Congressional approach of imposing controls and assessing residual riskof remaining HAPs emissions makes sense, in concept, it appears that there have not been sufficientresources provided to collect and assess all of the pertinent data from state/local air quality and publichealth agencies that could be fruitfully brought to bear on this problem. There are certainly not sufficientresources to permit the testing of specific HAPs for their toxicity if those dose-response data are notalready available. In the case of secondary lead smelters, only seven of the 50 identified HAPs wereexcluded from the residual risk assessment due to the lack of dose-response data. However, lack of datawill likely pose much greater problems when other source categories are addressed in the future. Suchdata gaps could lead to the omission of compounds from the assessment, resulting in a subsequentunderestimation of the residual risk. Appropriate recognition of this problem is needed by both Congressand the Agency in order to develop an adequate data base to support the residual risk analysis program.

4
2. INTRODUCTION
2.1 Background
Section 112(f)(1) of the Clean Air Act (CAA), as amended, directs ERA to prepare a ResidualRisk Report to Congress (RTC) that describes the methods to be used in assessing the risk remaining,(i.e., the residual risk) after maximum achievable control technology (MACT) standards, applicable toemissions sources of hazardous air pollutants (HAPs), have been promulgated under Section 112(d). The RTC was intended to present EPA’s proposed strategy for dealing with the issue of residual risk and reflected consideration of technical recommendations in reports by the National Research Council["Science and Judgment"] (NRC, 1994) and the Commission on Risk Assessment and Risk Management(CRARM, 1997). As a strategy document, the Agency's RTC described general directions, rather thanprescribed procedures. The announced intent was to provide a clear indication of the Agency's plans,while retaining sufficient flexibility that the program can incorporate changes in risk assessmentmethodologies that will evolve during the 10-year lifetime of the residual risk program.
In 1998, the SAB conducted a formal review (SAB, 1998b) of the draft RTC (USEPA, 1998)and its proposed methodology. In their review, the SAB noted that it was difficult to assess the Agency'smethodology without first seeing it applied to a specific case.
In the summer of 1999, the Agency asked the SAB to provide advice on the application of theresidual risk methodology to the specific case of lead smelters. This source category was selected since itwas relatively small (fewer than 30 facilities nationwide) and data rich.
2.2 Charge
In the months leading up to the SAB meeting, the Agency and the Board negotiated a Chargeconsisting of the eight questions below.
a) Overall -- Is the methodology that the Agency applied in this risk assessment consistentwith the risk assessment approach and methodology presented in the Report to Congress?(EPA-453/R-99-001)? Are the assumptions used in this risk assessment consistent with currentmethods and practices?
b) Model Inputs -- Are the methods used to estimate emission rates, and the method used toestimate species at the stack appropriate and clearly described?
c) Models -- Does the risk assessment use appropriate currently available dispersionmodels both at the screening level and at the more refined level of analysis? Are the modelsapplied correctly? Given the state of the science, does the risk assessment use an appropriatemulti-pathway model? The assessment uses the IEM-2M model, with some modifications. Is theIEM-2M model appropriate for use in this regulatory context? With regard to the modification

5
and application of the model, did the EPA appropriately modify the model for use in this riskassessment, and did the Agency apply the model correctly? Is there another model or anotherapproach that is available at this time that EPA should consider?
d) Choice of Receptors -- The Agency identifies the home gardener as the appropriatereceptor to estimate risks to the residential population and the farmer to embody high end risks. Are these receptors appropriate for this task?
e) Ecological Risk Assessment -- Given currently available methods, are the models used forthe ecological assessment appropriate? Are they applied correctly? Are the ecologicalbenchmarks appropriate?
f) Health Risk Assessment -- Section 3.4.1 of the Report to Congress identifies several datasources that the Agency would draw upon for choosing dose-response assessments to be used inresidual risk assessments. The Report also states that EPA will develop a hierarchy for using suchsources. Given available dose-response information, is the hierarchy presented in this assessmentappropriate (see especially footnote #6, section 2.2.1)? For each chemical included in theassessment, is the choice of dose-response assessment appropriate? Are the dose-responseassessments appropriately incorporated into the assessment?
g) Uncertainty and Variability Assessment -- Did the assessment use appropriate currentlyavailable methods to identify the variables and pathways to address the uncertainty and variabilityassessment? Are the methods used to quantify variability and uncertainty acceptable? Are thereother, more appropriate methods available for consideration?
h) Presentation of Results -- Does the Agency's document clearly present and interpret therisk results? Does it provide the appropriate level of information? Do the figures and tablesadequately present the data? Do the formats provide for a clear understanding of the material?
The Charge guides an SAB review, but it does not constrain the range of comments that theSubcommittee members can legitimately offer.
2.3 SAB Review Process
The SAB Subcommittee was recruited following nominations received from SAB Members andConsultants, the Agency, and outside organizations. The group met in public session on March 1-2,2000 at the main auditorium of the USEPA Environmental Research Center in Research Triangle Park,NC. Written comments prepared before and after the meeting by Subcommittee members, and madeavailable at the meeting, form the basis for this report. Individual comments are included in Appendix Afor the edification of the Agency as an illustration of the issues identified by the Subcommittee membersand of the range of views expressed. Those comments are not a part of the consensus report. A moredetailed description of the SAB process for this review can be found in Appendix B.

6
3. RESPONSES TO SPECIFIC CHARGE QUESTIONS
3.1 Charge Question 1: Overall
Is the methodology that the Agency applied in this risk assessment consistent with the riskassessment approach and methodology presented in the Report to Congress(EPA-453/R-99-001)? Are the assumptions used in this risk assessment consistent withcurrent methods and practices?
The methodology presented in this report is consistent with the Report to Congress, as far as itcurrently goes, and many of the assumptions are consistent with current methods and practice. However,the Subcommittee has not yet seen a full residual risk analysis and is unable to comment on the completeanalysis process. More specifically, this was an interim analysis that did not include such importantelements as an ecosystem risk assessment, a health risk assessment that includes population risks, a fulluncertainty and variability (U&V) analysis, a computer model for assessing multimedia transport and fatethat has been adequately evaluated, nor a clear description of the process and how the assessments linkto the eventual risk management decisions. At this interim stage, it looks only at four of the 23 sourcesfrom the secondary lead smelters category. Nonetheless, the report does provide a valuable indication ofhow the approach presented in the Report to Congress is going to be implemented in practice. Withrespect to the specific approaches used in the case study, there are a number of questions that arediscussed in detail in response to the specific charge questions below.
A general comment is that the case study should provide more details of what was done and howit was accomplished. It is critical that the process be as clear and fully articulated as possible. Moredetails are needed on how each model has been modified from prior use. For example, it is not clearhow the IEM-2M model was modified from its prior use in the mercury assessment in order to be usedfor the secondary lead smelter emissions. The interested and knowledgeable reader should be able tofollow what changes were made and understand why such modifications were made.
There is clearly a significant problem with how fugitive emissions are being treated. In thisanalysis, much of the residual risk results from fugitive dust emissions. However, there is little directinformation in the Agency's document on how these emission rates were modeled. In the Agencypresentations at the meeting, four approaches to modifying the fugitive emissions were provided.
It should be possible to utilize existing data to help refine the emissions estimates. At many ormost of these facilities, there are ambient monitors generating data to determine compliance with the lead(Pb) National Ambient Air Quality Standard (NAAQS). These data should provide an opportunity toestimate the routine emissions around the plant and potentially observe the differences in concentrationsbefore and after whatever steps were implemented to comply with the fugitive part of the MACTstandard. Information on the frequency and extent of upset conditions at these plants could be used tosupplement monitoring data from routine operations. Anytime data are available to provide ground truth,

7
the Agency should compare those data to the model results. This feedback approach would mitigateagainst the generation of results that appear unreasonable.
A number of concerns were raised about the manner in which the models appear to have beenapplied without adequate consideration of the plausibility of the assumptions or the physical meaning ofthe results. An iterative process is needed in which, even in the absence of external comparison data,when implausible results are obtained, the model inputs can be appropriately revised and the model runagain. For example, when excessively high blood lead levels are estimated (e.g., 200 µg/dL), the analystshould reexamine the model inputs and make appropriate modifications. Similarly, where excessively lowbreast milk contaminant levels were estimated, the analyst should also reexamine the models. A numberof such plausibility checks were described by the Subcommittee or in public comments that can providecheckpoints in the analysis to indicate the need for alternative assumptions and recalculation. Theresulting discussion of these implausible results and the changes made to the calculation would be a usefulmodification to the current approach.
Only the first stage screening for potential hazard was available for consideration of the ecologicalrisk. It is recognized by OAQPS that a full assessment of ecological risk is needed, but the rate ofprogress in this direction has been slow. The methods and supporting assumptions made are general, atbest, and would need to be more definitively treated in a refined ecological risk assessment (See ChargeQuestion 5 for more details). The Agency should devote sufficient effort and resources to insure acredible ecological risk assessment for this prototypic case study.
One of the critical problems for future residual risk analyses will be the availability of data.Secondary lead smelters emit lead and other HAPs. Emissions and related ambient monitoring data forlead are generally available. Data on the other HAPs are less available, making future assessments ofresidual risk associated with these other HAPs more of a challenge. Even when data are available, thedata will need to be evaluated to determine their appropriateness for ground-truthing risk estimates. Inaddition, there is a significant question about how available are the critical input data needed to crediblycharacterize the residual risks from the other 173 source categories. In the present analysis, missinginformation, such as the toxicity of a number of HAPs, led to those compounds being excluded from theanalysis. There may be molecular modeling approaches (e.g., Quantitative Structure-ActivityRelationships (QSAR)) that would permit estimation of relative toxicity of the organic HAP compoundsfor which data are not available and a screening analysis of their likely effect on the overall risks couldpossibly be developed.
The Subcommittee felt that, within the limitations of data and resources, the approaches adoptedwere able to identify potential high human health risk situations. However, they also felt that the science isinsufficient to be fully confident in the quantitative values estimated by these models. There are significantconcerns regarding the nature of the full ecological risk assessment because a complete analysis has notyet been presented. There is concern that the apparent precision of the resulting risk estimates may beoverstated and that more effort is needed to present results that better reflect the uncertainties andvariability in the analysis. The review material did not give a clear picture of how the results of the

8
analysis would be used in the risk management process. Such information would have helped theSubcommittee to comment more precisely on the adequacy of the analytic results to support the decisionmaking process.
In any event, it is recognized that at some point management decisions will have to be madebased on results stemming from analyses of this type. The Agency is mandated under Section 112(f) toconduct the residual risk assessment and to make a decision to implement further regulation or to make adecision that no further regulation is needed. In response to the previous SAB review (SAB, 1998b) ofthe Report to Congress, the Agency responded that, "the decision made with the results of the screeninganalysis is [either] no further action or refine the analysis, while the decision made with the results of themore refined analysis is [either] no further action or consider additional emissions control." As discussedabove, the results of the more refined analysis provides the same answer as the initial inhalation screen;that is, an even more refined analysis is needed. Therefore, the case study, in its current state, has notachieved the decision objective, and another level of analysis or iteration would be needed. The casestudy needs better quality input data/estimates on fugitive emissions, a more in-depth and refined analysis,a clearer presentation of the steps taken in the analysis and the results produced, and a more seriouseffort to fully integrate uncertainty and variability into the analysis. In summary, a better-informed decisionwill be possible if the results of the case study more fully reflect the inability to define the risks precisely.
3.2 Charge Question 2: Model Inputs
Are the methods used to estimate emission rates, and the method used to estimate speciesat the stack appropriate and clearly described?
3.2.1 Inhalation Screening
The fundamental equations used by the Agency to estimate the specific inorganic and organichazardous air pollutant (HAP) emission rates for process and process fugitive emissions are described byEquations 1 and 2, respectively. These equations provide a technically sound methodology for estimatingspecific HAP emission rates based on the metal HAP and hydrocarbon emissions data provided in theBackground Information Document (BID) (USEPA, 1994). Although the Subcommittee can supportthe Agency's initial decision to employ the AP-42 based fugitive HAP emissions estimates in the inhalationscreening study, the combined effect of using these conservative data with a conservative air pollutionconcentration model has clearly resulted in an overestimation of ambient HAP air concentrations. On theother hand, "upset" conditions were not assessed with any data in this assessment, and considerable leadmay be emitted from these facilities under such circumstances. This could lead to an underestimation ofambient HAP air concentrations. To ensure that the use of SCREEN3 will result in realistic predictions ofambient air pollutant concentrations, the Agency should evaluate the underlying assumptions adopted inthe area source emissions algorithm, as well as the quality of emissions data, to determine if they warrantfurther refinement.
9
Although the Agency should be commended for its creative and resourceful use of existing data toestimate specific HAP emission rates, the Subcommittee identified several opportunities for the Agency toimprove its general description and use of the reported data sets. First, the Agency should provide abetter and more complete description of the data elements contained in Tables B.1.1 and B.1.2. Areviewer of these tables would find it difficult to discern what statistical measurement is actually beingreported; i.e., mean, median, or upper confidence limit (UCL). Secondly, the Agency should exploreusing means as inputs to the HAPs emission rate estimate methodology, since the means of these likelyskewed distributions would provide a quick screening tool that is more conservative than the median andless conservative than the 95th percentile upper confidence limit (UCL). The concern is that simply usingof the 95th percentile UCL would screen out very few, if any, sources. Countering this concern, ofcourse, is the unknown impact of upset conditions, as noted above, whose analysis also needs attention. Finally, to provide a reviewer of the methodology an opportunity to reproduce any or all of the emissionrate estimates, the Subcommittee recommends that the Agency provide an example within the documentthat illustrates the proper use of Equations 1 and 2.
As noted in the response to Charge Question 7 below, the Subcomm1ittee found that the analysisof uncertainty and variability was incomplete in several respects, thereby depriving the risk manager ofimportant information when making these important decisions.
3.2.2 Multipathway Risk Assessment
To estimate the specific HAP emission rates from both the process and process fugitive emissionsources, the Agency employed site-specific HAP emissions information from facility compliance reports,as well as information from the BID database, where necessary, in the multipathway risk assessment. Although the Subcommittee commends the Agency for demonstrating resourcefulness in employing thebest available site-specific data to generate HAP emission rates, there is concern over the generalapproach used by the Agency in employing secondary data to estimate site-specific HAP emission ratesin the multipathway risk assessment.
To improve the scientific defensibility of both the stack and fugitive HAP emission estimates forthe multipathway risk assessment, the Subcommittee developed several recommendations forconsideration by the Agency. First, prior to using secondary data for site-specific emission estimates, theAgency needs to evaluate the quality of the individual data sets using a clear, easy-to-follow, andwell-documented methodology. Development and implementation of a technically sound data qualityevaluation methodology will provide the Agency with a framework for establishing the minimum dataquality criteria for use in residual risk estimates. Secondly, to leverage limited time and resources, theAgency should collaborate with its industrial partners to identify and collect additional site-specificmonitoring data for use in estimating process and process fugitive HAP emission rates. Third, because ofits relative importance in characterizing human health and ecological risk, existing air monitoring data,where available, should be employed by the Agency for the groundtruthing of site-specific fugitive HAPemission estimates. Information on the frequency and extent of non-routine, or upset, conditions must beconsidered. Finally, to assist a reviewer in reproducing any or all of the final risk assessment numbers, the

10
Agency should present a detailed example illustrating the basic process by which a data elementcontained in a NESHAP secondary lead smelter compliance report is used to generate final human healthand ecological risk estimates.
3.3 Charge Question 3: Models
Does the risk assessment use appropriate currently available dispersion models both at thescreening level and at the more refined level of analysis? Are the models appliedcorrectly? Given the state of the science, does the risk assessment use an appropriatemulti-pathway model? The assessment uses the IEM-2M model, with some modifications. Is the IEM-2M model appropriate for use in this regulatory context? With regard to themodification and application of the model, did the EPA appropriately modify the model foruse in this risk assessment, and did the Agency apply the model correctly? Is there anothermodel or another approach that is available at this time that EPA should consider?
3.3.1 Does the risk assessment use appropriate currently available dispersion modelsboth at the screening level and at the more refined level of analysis?
Both the SCREEN3 and Industrial Source Complex Short Term 3 (ISCST3) models havebecome widely accepted tools-of-the-trade and probably are the most suited for this point sourcecategory. However, there are minor shortcomings in the models that need to be clearly articulated. Theconservative screening nature of SCREEN3 is designed to "capture" all facilities that may need furtherinvestigation. As a result, the output should result in many false positives which may reduce the credibilityof the model.
In the current assessment, the Agency uses the IEM-2M model for its multipathway analysis. Although it is the only multipathway modeling tool that the Agency has readily available for use, there area number of concerns regarding the model that are discussed elsewhere in this Advisory. In themeantime, it should be noted that OAQPS is in the process of developing the Total Risk IntegratedModel (TRIM) as a flexible, state-of-the-art model for evaluating multimedia chemical fate, transport, andrisk of HAPs. A recent review of this effort by SAB's Environmental Models Subcommittee found TRIMto be promising and innovative, while providing a number of recommendations for further improvement(SAB, 2000). When TRIM becomes available, it should provide an improvement over the modelingframework used in the current report.
While understanding the need for the Agency to move ahead with the Residual Risk Program, theSubcommittee is concerned that the IEM-2M model, as currently employed, is not able to provide thelevel of technical information that is needed for making scientifically sound regulatory decisions. Conceptually, the TRIM model is a significant improvement over IEM-2M. However, TRIM facesdevelopment challenges of its own that will require resources to address. Therefore, the Agency facesthe difficult near-term choice of trying to improve an inferior model or committing to complete a superiormodel. The Agency needs to develop a plan for how and when they will use these models and how theywill effect a transition from one to the other.

11
3.3.2 Are the models applied correctly?
A number of assumptions in model execution can affect the outputs. For example, it wasassumed that all emissions come from the center of the facility, when, in fact, the exact location ofemission source -- currently unknown -- should have a strong influence on predicted downwind exposurelevels. Locations of stacks in relation to buildings and building sizes can also result in an incorrectestimation of exposure rate. Also, using meteorological data from the nearest reporting meteorologicalstation is an approximation commonly employed. However, risk assessors and risk managers need to beaware of the suitability of this approximation in some locales, such as those with complex terrain and/orlong distances between the facilities and the station..
A major issue which must be addressed is how to consider historical lead and other persistentchemical contamination at the site which was deposited prior to the promulgation of the MACT standardbut which may nonetheless substantially contribute to on-going exposures post-MACT. A residual riskanalysis that does not add exposures to baseline contamination to the estimates of on-going contaminationmay vastly underestimate the hazard quotient at the site and incorrectly conclude that the on-goingreleases pose risks at less than threshold levels.
The Agency chose four cases with relatively high projected risks as illustrative examples, includingboth urban and rural settings. The Subcommittee understands that the terrain in each of these four caseswas unremarkable, and, consequently, it was reasonable to model them in that way. In the final residualrisk assessment for this source category, all of the facilities in the category will be modeled individually,and complex terrain, downwash, and other model adjustments will need to be incorporated into thatanalysis, as appropriate.
Other issues raise questions that should be addressed in subsequent reports. For instance,classification of metals as persistent, bioaccumulative toxicants (PBTs) is problematic, since theirenvironmental fate and transport cannot be adequately described using models for organic contaminants. Also, hazard indices for the ingestion pathway were developed separately from those for inhalation, andthe impact of this strategy on the non-cancer results is unknown.
3.3.3 Given the state of the science, does the risk assessment use an appropriatemultipathway model? The assessment uses the IEM-2M model with somemodifications. Is the IEM-2M appropriate for use in this regulatory context?
The IEM-2M modeling was performed as a set of linked Excel spreadsheets. Although pertinentequations were given in Appendices, the implementation of the modeling effort needs to be carefullyexamined. The spreadsheets were not provided to the Subcommittee in time for substantive review bythe members, and implementation of complex spreadsheet models can often lead to unsuspected errors. Therefore, the Subcommittee was unable to verify the figures and can only encourage the Agency tocarefully examine the quality control applied in the construction of the spreadsheets. Further, thespreadsheets should be available to the public.
The Subcommittee understands that use of the IEM-2M model for the case of mercury (Hg) hasbenefitted from some limited peer review. However, adaptation of the model to address HAPs other

12
than Hg does not appear to have been rigorously evaluated (Rimer, 2000). In view of the uniqueenvironmental chemistry of mercury, extrapolation of the model to other metals must be made withextreme caution.
Through application of the model to a number of source categories and a number of pollutantswith different behaviors, the Agency will have the opportunity to evaluate the model, at least in part. While human exposure data are rare, data on environmental concentrations of pollutants in various mediaare more widely available. In many cases, simply knowing that the model estimates are within an order ofmagnitude of measured environmental concentrations would provide much greater confidence in themodel as an analytic tool. In particular, it would be important for the Agency to show that themultipathway model produces approximately correct estimates results for the concentrations in food ofdioxins/furans and mercury, two important and difficult to model pollutants. If the evaluation exercisesindicate that the model is at variance with reality, the model will have to be revised and previous resultsmay need to be recalculated.
At the same time, the Subcommittee recognizes that the Agency is moving toward finaldevelopment and implementation of the TRIM computer model, which would replace the IEM-2Mmodel. Therefore, the Agency will have to balance the competing needs of making significantimprovements to the old model vs. completing development and evaluation of the next generation model.
In its present form, the model can be used to show that there may be a relationship between atmospherically deposited HAP and the total burden of the particular contaminant in a target ecosystem. It cannot reliably quantify the amount of deposited HAP expected to be transferred to the human foodchain. While some of the problem could arguably be related to an overestimate of fugitive emissions, it isclear that missing process considerations in the model severely limit its ability to simulate the movement ofmaterials in the environment. For example, the transfer coefficients have been estimated withoutconsidering the effects of biogeochemical processes on contaminant reaction rates, speciation, andbioavailability. By ignoring the physical and chemical drivers, the IEM-2M model may have yieldedgrossly unrealistic concentrations of some contaminants in environmental contaminants. Table 6.8 (p.160, Vol. I) provides an excellent example of the model inadequacy. The calculated concentrations oflead in surface water near a secondary lead smelter is reported as 103 to 106 ug/L, which is a highenough concentration of lead to sterilize the water. These unrealistic estimates should be identified assuch, and appropriate adjustments made. In real life, most of the deposited lead would be adsorbed ontoparticulates and removed to the sediment. This scavenging removal could readily reduce the dissolvedlead concentration to the measured value of 0.002-2.0 ug/L. Exaggerated concentrations, as well asunrealistic risks that have been reported for other contaminants, might likewise be traced to modeldeficiencies. This is an example of how the results of the model can be compared with what can bereasonably assumed about the functioning of a water system. The consequence of this comparison shouldbe a reevaluation of the results so that the estimated concentrations are brought into line with what wouldbe reasonably observed in real ecosystems. A simple re-scaling of the fugitive emissions estimates, alone,is not likely to solve some of these obvious problems.

13
The IEM-2M has a number of limitations of which the decisionmakers need to be aware. Themodel does not differentiate between natural and anthropogenic fractions of a contaminant in a givenenvironmental medium. It estimates the incremental levels/effects without considering the levels/effects ofthe contaminant that have already been built up in the environmental medium. The Subcommitteesuggests that the Agency discuss how inclusion of baseline concentrations (that is, contributions fromnatural plus anthropogenic sources other than the post-MACT facility) would affect estimated total andattributable risks. The model does not insure mass balance, nor does it account for feedbackmechanisms between environmental media. While the IEM-2M can be used to estimate individual excessrisk, it is not at all clear from the documentation that it can provide the spatial and temporal distributionsof exposure that will be needed to provide the link to distributed populations. Therefore, additionalrefinement made be needed so that the model can be used to estimate the population risk.
Uncertainty analysis, a critical adjunct to risk analysis, is not included in the IEM-2M model. Inview of the uncertainties and assumptions in the model, ground-truthing should be an essential aspect of the model analysis.
3.3.4 With regard to the modification and application of the model, did the EPAappropriately modify the model for use in this risk assessment, and did theAgency apply the model correctly?
The IEM-2M model should be regarded, at best, as a work-in-progress. The Subcommitteeunderstands that the IEM-2M will be replaced by the TRIM model, referenced above, once the latterhas been sufficiently well-developed. In the meantime, in light of the limitations noted about the IEM-2M, its results must be regarded with informed caution.
3.4 Charge Question 4: Choice of Receptors
The Agency identifies the home gardener as the appropriate receptor to estimate risks tothe residential population and the farmer to embody high end risks. Are these receptorsappropriate for this task?
The home gardener and the farmer are acceptable receptors for this task, but their assumedexposure scenarios need to be modified in order to provide a more realistic estimate of the risks to typicalmembers of the local community. Specifically, the input assumptions for both scenarios may beunrealistically high compared to the real exposures of the local residential and farm communities,particularly regarding inhalation and food preparation activities. The inhalation exposures assume that thereceptor is exposed to outdoor concentrations 24 hours per day. The food ingestion pathway assumesthat home-grown produce is not washed. The risk model results are very sensitive to these assumptions. Moreover, these exposure assumptions make it especially difficult to check the model results throughcomparison with data. Existing and potential data on human exposure levels are likely to be from peoplein nearby communities who do not have these high-end exposure behaviors. For these reasons, theSubcommittee recommends that the Agency also model the exposure of home gardeners who are notoutside all the time and who do wash their home-grown produce.

14
Further, the case study assumes continuous exposure over a lifetime for inhaled HAPs butexposure over shorter periods for ingestion of soil, water, and produce containing HAPs; i.e., 12 yearsfor a home gardener and 17 years for a farmer. The reason for this apparent inconsistency should bemade clear.
The overall characterization of the risks to the local community needs to be clarified when thepopulation exposure assessment is completed.
3.5 Charge Question 5: Ecological Risk Assessment
Given currently available methods, are the models used for the ecological assessmentappropriate? Are they applied correctly? Are the ecological benchmarks appropriate?
3.5.1 General Statement
In the previous SAB review of the residual risk issue (SAB, 1998b), the Subcommittee stronglyencouraged the Agency to elevate the prominence of ecological risk and to establish a commitment toecological concern that was more nearly co-equal to that of human health. The recommendation wasdriven by the neglect of ecological and natural resources considerations in the draft Report to Congress(USEPA, 1999).
At the March 1 briefing, the Agency stated that the risk to ecological and natural resources willnot be addressed at this time in other than a screening level analysis; i.e., a hazard assessment, rather thana risk assessment. This position is unfortunate, even for a document that is admittedly a work-in-progress, since this shortcoming was strongly identified in the Board's earlier report (SAB, 1998). Sucha position would be unacceptable in the final document in that it would ignore the legal mandate to avoid"an adverse environmental impact" that is "significant" and "widespread" and likely to result in the"degradation of environmental quality over broad areas" (CAAA Section 112(a)(7)). By pursuing ahazard assessment for secondary lead smelters rather than a risk assessment, the Agency will likelygenerate a large number of "false positives" that will make the task of the risk manager more difficult. Itcould also have the unwarranted effect of setting a precedent for using hazard assessment for ecologicaland natural resources analysis in lieu of a risk assessment for future residual risk analyses.
3.5.2 Given currently available methods, are the for the ecological assessmentappropriate?
As a matter of first importance, the document should indicate whether the ecological riskassessment presented here is being developed in accordance with the Agency's Ecological RiskAssessment Guidelines (EPA, 1998). These guidelines have been developed over several years, haveinvolved many experts from the ecological science community, and have been endorsed by the SAB(SAB, 1997).
The ecological risk screen is underpinned by five concatenated models, with the term "model"used loosely to include both formally constructed code, as well as more simple spreadsheets. The

15
source, dispersion, deposition, and multipathway models are the same as those used to conduct thehuman health characterization. The fifth and last model -- and the one unique to ecology and naturalresources -- is the spreadsheet to screen for ecological effects using the Hazard Quotient (HQ) andHazard Index (HI) methodologies. The only two models that are specifically relevant to ecology and natural resources are the multipathway and ecological effectsmodels.
a) Multipathway Models - The multipathway model is appropriate for the task ofcharacterization of exposure and supporting a risk assessment. The model has thenecessary features to handle the transport, transformation, and fate of organic andinorganic compounds in multiple media; i.e., soil, water, air and biota. In light of theresults from both human health and ecology analyses, the "screened risks" appear to resultfrom a few critical parts of the code, most notably soil-to-plant uptake, atmosphere-to-plant deposition and accumulation, bioaccumulation in the food chain, and transport inaquatic environments. Because these processes are so instrumental in the overall riskanalysis and because the model's validity was repeatedly questioned, it is recommendedthat these critical subcodes be peer-reviewed to assure that the mathematical formulationis reasonable, current, and scientifically defensible. However, as noted above in Section3.3.3, the Agency needs to balance efforts to improve the IEM-2M model against theneed to develop and implement the next generation models, such as TRIM.
Although multipathway methods are more than adequate for the task of screening and arecertainly the appropriate method for a risk assessment, it is not necessary to usemultipathway models in the initial screening assessment. Traditionally, multipathwaymodels are reserved for those compounds that are persistent and bioaccumulativetoxicants (PBTs). Unless the entire list of HAPs is made up of PBT chemicals, it wouldbe more efficient to screen using simple fate and direct exposure models. If a PBTcompound were to pass the toxicity screen (HQ < 1.0), the hazard of direct contactwould likely be insignificant, and the Agency could decide if the compound warrants areview of higher trophic considerations based on size and spatial distribution of theindustry source category, plus the dispersion potential of the HAP. If the sources weremany, large, and widely distributed, it might pass the test of being "widespread" and likelyto result in "degradation in environmental quality over broad areas". Otherwise, onlycompounds with HQ>1.0 would be the subject of the multipathway analysis.
b) Ecological Risk Screening (i.e. Hazard) Model - The Agency provides a rudimentaryhazard ranking or screening process for culling through the HAPs associated withsecondary lead smelters source category. The method is based on the generation ofHazard Quotients (HQs) which are simple ratios of environmental concentrations toeffects-based environmental benchmarks. The benchmark is a concentration level in amedium at which little or no potential exists for an hazard. As a screening tool, thisapproach is valid, although it necessarily results in a high number of "false positives". Screening ecological hazards with this approach is well-established for use in ranking andprioritizing hazards associated with chemicals; e.g., new product design and approval,
16
risk-based corrective actions at contaminated sites, and prioritization of resources in regulatory programs.
As is well-stated in the case study, this conservative methodology is only used either toremove chemicals from further risk management consideration (i.e. the risk is acceptable)or to indicate that there is a need for further analysis. The HQ approach with suchconservative effects benchmarks is really aimed at protecting all individuals in theecosystem and, by inference, to protecting the structure and function of the ecosystem inwhich that individual lives.
3.5.3 Are they (the models) applied correctly?
Given that this analysis is a screening exercise (i.e., hazard assessment) and not a risk assessment,the models are applied correctly, with the exception of the summation of HQs, as discussed below. There are several key aspects of the application for a screening exercise that warrant the Agency'sattention:
a) Top Carnivores - This functional group is omitted from the model in terrestrialecosystems; yet it is likely to be the most responsive functional group for PBTs. Therationale for not including this functional group (i.e., "Data are not available") is contraryto what can be done in a screening exercise.
b) Background Concentration - For ecological systems, the inclusion of geochemicalbackground concentrations is more important than for human health, particularly for thosechemicals that have a natural source; e.g., manganese, mercury, and nickel. The naturalbackground issue should be re-evaluated in order to address the risk to ecological andnatural resources.
c) Summation of HQs - Generating an HI by summation of HQs for chemicals in differentclasses (e.g., metals and organics) or for obviously different organics (e.g. phthalates andPAHs) goes beyond current good practice in screening ecological risks. The resultingHI is possibly misleading. Summation of HQs should be limited to chemicals that operatevia the same mode of action on the same target organ or system.
3.5.4. Are the ecological benchmarks appropriate?
It is not possible to completely answer this question from the information given. The selectedbenchmarks represent the current state of the practice for screening assessments, many of which havebeen developed for use at contaminated sites as a means of focusing management action on only thechemicals of greatest concern. For some of these situations, especially those involving water andsediment, there may be different benchmarks for freshwater and marine systems, and it is not clear whichwas used in this case.

17
What is clear is that these numbers should not be used in a sophisticated risk assessment. Thedata behind these criteria may support a risk assessment, but the final "criteria value" can only be used toeliminate chemicals of concern. As HQs are refined, the exposure estimate should be refined to reflectsite-specific conditions, and the characterization of effects should also advance from a general benchmarkto an estimate of a toxic threshold, based on dose-response data for a representative or surrogatespecies.
3.6 Charge Question 6: Health Risk Assessment
Section 3.4.1 of the Report to Congress identifies several data sources that the Agencywould draw upon for choosing dose-response assessments to be used in residual riskassessments. The Report also states that EPA will develop a hierarchy for using suchsources. Given available dose-response information, is the hierarchy presented in thisassessment appropriate (see especially footnote #6, section 2.2.1)? For each chemicalincluded in the assessment, is the choice of dose-response assessment appropriate? Are thedose-response assessments appropriately incorporated into the assessment?
The Agency has used a reasonable approach to summarize the toxic effects and thedose-response values for the HAPs included in the multipathway analysis. The document succinctlysummarizes a tremendous body of information and accurately describes the endpoints upon whichreference doses are derived. The important information related to each is adequately summarized.
The toxic effects and dose-response analysis information are derived from multiple sourcesaccording to the following hierarchical structure: Integrated Risk Information System (IRIS), Agency forToxic Substances and Disease Registry (ATSDR) toxicology profiles, Health Effects AssessmentSummary Tables (HEAST) and State of California Environmental Protection Agency (CalEPA) values. However, the document does not provide the rationale for the specific ranking. The clarification providedat the March 1 meeting should be a part of the document, including the intent to makechemical-by-chemical decisions about which database to use and the often higher quality of information inthe CalEPA database (CalEPA, 19...) than is found in the older HEAST compendium (USEPA, 1994).
The residual risk exercise emphasizes, once again, the importance of having accurate, currentinformation in the Agency's IRIS database. As it has been stated in the past (NRC, 1994; USEPA,1999), the SAB continues to encourage the Agency to create and maintain a credible set of data in IRIS. Another SAB panel will review a Congressional-directed study of IRIS later this year.
While the case study has employed methods that are routinely used at the Agency, theSubcommittee has some concerns. The approach appears to utilize the default assumption that all healtheffects described are of comparable severity and concern. For example, risk estimates derived for someof the HAPs compounds are based on rather vague endpoints, such as body weight loss, which are notexplicitly associated with any disease process; whereas, in other cases, the assessment may center oneffects, such as pulmonary or neurotoxicological effects, that are of a more grave character. This

18
approach is another example of the conservative stance taken through much of the analysis. However,the risk assessor and the risk manager need to recognize and appreciate these differences in potentialseverity of health effects when comparing and combining the results of the analysis.
Another supposition which may ultimately prove problematic is the assumption that effects ofmixed exposures are additive. In reality, mixtures may produce effects that are additive, synergistic(potentiated), or even attenuated. The current default assumption is necessitated by the absence of anyinformation with which to more precisely model such effects and, therefore, represents a conservativeapproach.
A related point is the difference in confidence with respect to cancer potencies calculated fromhuman vs. experimental animal data. Unit risk estimates based on human data are generally maximumlikelihood estimates calculated from studies that, if anything, have biases towards underestimating humanincidence of carcinogenicity because they are usually based on worker populations, not children, who arearguably more susceptible. Exposure estimates in this case usually have substantial uncertainties that tendto bias comparisons of more vs. less exposed workers towards the null and, therefore, towards lowerestimates. On the other hand, animal-based unit risk estimates include a number of proceduralassumptions that are thought to usually lead to overestimates of risk, such as the use of 95% confidencelimits, choice of the most sensitive species for projection to humans, etc.
The Subcommittee is concerned about the potential problems associated with a residual riskassessment that must omit HAPs in assessments of the risk of noncancer endpoints due to the fact thatthere are no dose-response data on these compounds currently available and that Agency policy dictatesagainst using probabilistic values. For example, in the case of secondary lead smelters dioxins/furans areomitted from consideration as a non-cancer risk due to the lack of data. While the Agency indicated atthe March 1 meeting that dioxins/furans would be included in the next iteration of the process, othercompounds are, and presumably would continue to be, omitted due to the lack of data. The documentneeds to address this limitation directly and indicate how the decision making process will take thesevulnerabilities into account. As one possible way to address the problem, the Subcommitteerecommends that the Agency explore the use of quantitative structure-activity relationships (QSAR) toassess whether any of the organic HAPs with insufficient dose-response information might, in fact, be asignificant concern that is currently being overlooked. While QSAR would not play a definitive role in theanalysis, it could identify potential problem compounds that are otherwise ignored entirely in the currentcase study.
The Subcommittee understands that the Residual Risk Program is following current Agencyguidance by calculating hazard quotients (HQs) for non-carcinogens, with the implicit assumption of athreshold in the dose-response curve. However, the HQ approach is not a true risk assessment (i.e., aprobabilistic estimate of the likelihood of harm), is not based on a biologically compelling foundation, anddoes not explicitly address the possibility of low-dose effects above or below the reference dose (RfD),even for highly non-linear dose-response relationships. As a part of its overall effort, the Agency shouldcontinue work on developing and implementing a more scientifically based risk assessment procedure for

19
non-carcinogens that would lead to improved risk assessments. For example, some reports now suggestthat the slope defining Pb effects is actually steeper at blood lead levels below 10 ug/dL than above it.
As noted above, the Subcommittee is concerned about how some of the results of this analysiswill be treated. In particular, while the generation of hazard index (HI) values can be useful, despite itsimplicit limiting assumptions (e.g., additivity of all effects), there is no indication in the document of howthese values will be used in the final decision making process. Without some indication of how they willbe used and for what purpose, the Subcommittee is unable to comment effectively on the appropriatenessof HIs in this case.
Also, as discussed above, it is clear that the residual risk analysis results in an estimate ofincremental exposure and, in the case of cancer, incremental risk of disease. However, it is not clear howthe Agency plans to use the incremental exposure estimates in the case of non-cancer effects, when theseadditional exposures (that is, in addition to already existing exposures from other sources) might subjectsome elements of the population to a "level-of-concern"; e.g., HI>1.
Two examples are included in the document that relate the derived HQs to anticipatedconsequences of human exposures: the cases of lead and dioxins/furans. The lead case allows some typeof human health risk assessment, since blood lead levels associated with specific human health effectshave been well documented. However, in both cases, the outcome suggests problems with the models. Specifically, the derived blood lead values are so high that they would be associated with gross toxicity;e.g., acute encephalopathy and even mortality. If such effects are real, it is quite likely that the problemwould have already been discovered by the local medical community. Therefore, these derived bloodlead values are a clear indication that the multipathway model has problems and needs to be revised.
As noted above, the Agency indicates that some of these problems may not be problems of themodel per se, but rather problems associated with overestimates of fugitive emissions. While theSubcommittee agrees that overestimates of fugitive emissions may play a role here, there is no indicationof the extent of that role. On the other hand, it is quite clear that the model fails to consider biophysicalchemical processes that definitely play an important role and that the model has not benefitted from arigorous peer review. (The model was not a major focus of the SAB review of mercury (SAB, 1998a).) In fact, some consideration should be given to using the TRIM model in its incomplete version rather thancontinuing to use IEM-2M. A more integrated and complete uncertainty and variability analysis wouldhelp to clarify these matters.
Additionally, Table 6.9 compares modeled concentrations of dioxins/furans in human milk with measured concentrations in human breast milk. It shows that modeled concentrations are notably lowerthan those measured in human milk. These findings are interpreted as indicating that emissions ofdioxins/furans from secondary lead smelters are a minor contributor to overall dioxins/furans nationwide. An alternative interpretation (namely, that dioxin is not adequately modeled in the residual risk assessmentparadigm) is not even considered, which clearly seems to be an oversight.

20
Finally, at this stage in the of development of the assessment, the Agency has not generated any population risk estimates. The Subcommittee would like to emphasize the fundamental importance ofgenerating such estimates in the final document. Currently, there is little discussion of how this critical stepwill be taken.
3.7 Charge Question 7: Uncertainty and Variability Assessment
Did the assessment use appropriate currently available methods to identify the variablesand pathways to address the uncertainty and variability assessment? Are the methods usedto quantify variability and uncertainty acceptable? Are there other, more appropriatemethods available for consideration?
In short, the uncertainty and variability (U&V) assessment is one of the weakest parts in the draftcase study and appears to be a rather peripheral afterthought to a main analysis, rather than an example inwhich U&V considerations are fully integrated into a project. As noted above, this concern wasmentioned prominently in connection with the multipathway exposure model results.
The fact is that U&V analysis has advanced significantly over the past ten years. The combiningof traditional point-estimates of parameters, together with and their separate ranges of uncertainty, hardlyqualifies as even a "quick-and-dirty" analysis these days. Instead, readily available computing power andincreased experience with distributions for various quantities (e.g., EPA Exposure Factors Handbook(USEPA, 1997) have combined to made distributional analysis of U&V, even simple Monte-Carloanalysis, much more the standard expectation for the field. These techniques have by no means reachedthe level of being "cookbook manipulations". Rather, they do require skilled, knowledgeable judgmentson a case-specific bases. However, they are being applied with much greater frequency, providing thebasis for much more informed decisions, particularly in significant decision making contexts, such as theresidual risk program under discussion here (Cullen and Frey, 1999; Thompson, 1999; Hattis andFroines, 1992; Hattis and Burmaster, 1994; Hattis et al, 1999).
In the first instance, the terms "uncertainty" and "variability" need to be clearly defined andconsistently used. Variability refers to real differences in things or people that would be seen even withperfect measurement or estimation techniques; e.g., the differences in the body weights of the individualsin an exposed population around a lead smelter. Uncertainty, by contrast, refers to the imperfection inour knowledge of the values of a specific parameter; e.g., characteristics of the throughput of material at aparticular lead smelter. Generally, uncertainty can be reduced by gathering better information, but realvariability will be unchanged, although it can be better characterized by better information.
The failure to distinguish variability from uncertainty in the present analysis almost guaranteesconfusion. Variability and uncertainty are different things and require different techniques for estimation. For example, soil type may vary from facility to facility, but it may be relatively uniform at any one facility. If the soil type is not known at a particular facility, the distribution that describes variability among facilitieswhere soil type is known can be used to construct an uncertainty distribution for the particular facility.

21
Without understanding the distinction between uncertainty and variability, a risk manager cannotmake a fully informed decision based on the results of the U&V analysis. A properly prepared analysisof uncertainty and variability analysis should help a risk manager to answer the question, "What actionsmust I take in order to assure that no more than Y percent of the population exposed incurs a risk greaterthan X, with confidence Z?" In other words, the risk manager should be able to understand not only howrisk might vary from person to person, as described by X and Y, but also how sure we are about ourestimates, as described by Z (cf., Hattis and Anderson (1999), and Hattis and Minkowitz (1996)). Thatkind of goal for the U&V analysis is not made explicit in the Agency's case study.
Although it is challenging to carry out an analysis that fully separates considerations of uncertaintyand variability, and although it is sometimes a matter of perspective whether a given distribution describesuncertainty or variability, the Subcommittee did not find the Agency's justification for combining the two inits analysis convincing. For example, consumption rates of water and food really do vary from person toperson, and the corresponding calculated risks due to any specific smelter's emissions would also varyaccordingly. On the other hand, the distribution used for the annual average emissions of the smelter isdominated by uncertainty, since so few data are available from post-MACT facilities. However, there islittle expectation that annual average emissions (in g/sec) would vary substantially from year to year.
The Agency chose to use distributions for emissions and for some elements of the exposureanalysis, but not for the parameters of the fate and transport models or of the toxicity analysis. While theSubcommittee understands that it is currently Agency policy not to undertake distributional analyses oftoxicity information, the Agency should reconsider this policy. Some members of the Subcommitteebelieve that omitting the uncertainties in the toxicity data from the assessment vitiate much of the benefit ofperforming the U&V analysis, and that the literature does contain early illustrative efforts to estimateuncertainty and variability for risks of both cancer and non-cancer endpoints (Hattis et al. (1999); Hattisand Barlow (1996); Crouch (1996)). Moreover, omitting any distributional treatment of the transportand fate module makes any conclusions from the U&V analysis suspect. Although the Subcommitteeagrees that iterative calculations using the full ISCST-3 and IEM-2M models would be computationallyintractable, it does not seem unreasonable to introduce some overall uncertainty distribution to representthe uncertainties in risk introduced by all of the assumptions and parameter choices embedded in thosemodels. The governing notion is that the while distributions based on data are certainly preferred, the useof subjective distributions -- fairly (unbiased) developed, technically rationalized, and clearly presented --can provide useful and valuable insights that can credibly inform the decision making process.
In this case, the Subcommittee also found that the description of how some of the distributionswere derived to be incomplete, even for the parameters that were included in the analysis. Although inmany cases the Agency simply took distributions that had already been described for other Agencypurposes (e.g., the Exposure Factors Handbook (USEPA, 1997)), in others it seemed to arrive at adistribution with very little evident rationale. For example, the document states, "we assumed that annuallead emissions follow a log-normal distribution, with the emission rate falling within two orders ofmagnitude of the value given in the compliance report 95% of the time" (later corrected to 99% of thetime). Although the document is far from clear on this point, in oral presentations EPA representatives

22
indicated that this assumption was based on some analysis of emissions observations by a knowledgeablecontractor, Dr. Christopher Frey -- which was useful, reassuring information. In the next iteration of thedocument, this analysis should be presented in detail and, to the degree possible, the analysts shouldconsider the need for adjustments in observed emissions data across plants to account for differences in throughput characteristics, among other relevant factors. To the degree that day-to-day and/orplant-to-plant variations in emissions can be explained on the basis of factors such as throughput, theestimate of uncertainty in annual average emissions may be reduced.
Another major problem is that the current analysis does not follow existing EPA guidance on thedocumentation and presentation of distributional analysis (USEPA, 1997). Specifically, that guidanceemphasizes that the model itself and derivations of distributions used in the analysis must be transparentlypresented in sufficient detail that a reviewer can reproduce them. Therefore, the case study itself shouldhave included, as an appendix, both the extensive display of results for each stack, as well as thespreadsheet model equations and the mathematical form of the distributional assumptions that were used. The Subcommittee believes that any report of the results of a U&V model must include documentation ofthe model spreadsheet itself, the dependencies among parameters that are or (in the case ofindependence assumptions) are not built into the model, and the precise mathematical form of thedistributional assumptions. For example, from the current presentation it is not clear if correlations havebeen built into the emissions of lead and other HAPs from different stacks that might reflect differentprocessing rates on different days, or whether these are considered as independent.
Finally, the Agency's treatment of "upset conditions" is not clear. While there is a description ofthe assumptions made to account for such occurrences, the explanation/justification of the assumptions islacking. Since emissions associated with upset conditions can, in some cases, outweigh the impact ofemissions during normal operation, it is especially important that this situation be directly addressed andclearly explained.
In summary, the Subcommittee was unconvinced by the rationale for the selection of variablesand pathways to address in the U&V assessment and found the methods for quantifying the U&V suspectin at least some respects. The Subcommittee recommends that the Agency redo the analysis starting witha clearly stated management objective, incorporating a better degree of separation of variability fromuncertainty, and generating a more comprehensive treatment of the most important sources of uncertaintyand variability.
3.8 Charge Question 8: Presentation of Results
Does the Agency's document clearly present and interpret the risk results? Does it providethe appropriate level of information? Do the figures and tables adequately present thedata? Do the formats provide for a clear understanding of the material?
This Charge Question addresses the important issues of a) risk characterization, which goesbeyond numerical presentations of results to qualifications and discussions of uncertainty and data

23
limitations (USEPA, 1999, p. 70), and b) risk communication, which conveys those results in easilyaccessible terms to interested and affected parties. The focus of the discussion here is on the presentationof the results. The majority of Subcommittee views on the various aspects of the results themselves arefound in response to the earlier Charge Questions.
3.8.1 Initial Screening Analysis
According to EPA, the screening analysis is designed to obtain preliminary inhalation riskestimates for the 23 facilities and 50 HAPs. In the course of the analysis, many other simplifications andconservative assumptions are made, such as generic assumptions about releases of HAPs from smelterfacilities. The default release characteristics used in the SCREEN3 modeling are clearly presented inTable 2.2. The Agency has indicated that all of the assumptions used in the initial screening analysis arenot conservative and that best estimates (simplifying defaults) are used. A sensitivity analysis or otherqualitative discussion of the effect of these selections on the results should be included in order to give thereader a better appreciation of the robustness and the conservativeness of the initial screening analysis.
In some cases, the report identifies areas in which information was not available, e.g.,housekeeping procedures for fugitive emissions. During the Agency presentation at the meeting, fourpossible approaches to estimating fugitive emissions were presented: back calculating from leadmonitoring data, theoretical modeling, extrapolating from another source that has conducted fugitiveemission testing, and direct measurement. These approaches should be identified in the report, along withgeneral methods for dealing with missing data, to help the reader understand what would be required to gather this information.
The discussion of the screening (Section 2.2.4) portrays easily readable risk results for each HAPfor cancer/non-cancer risk. It presents maximum and minimum risk values for each individual organic andmetal HAP. The table should include an explanation of the maximum and minimum values; i.e., they aresimply the range of estimates determined for all of the facilities. The text discussion clearly indicates thebottom line (risks above one-in-a-million) and the fact that some of the HAPs are associated with highervalues. Procedures for arriving at the risk estimates and identifying where overestimates occurred areclearly presented.
Uncertainty estimates are not presented in the tables, nor are they discussed in this section. Thisshould be explained in the results section. The text should expand on the potential impact of thediscussion in footnote 8 concerning the lack of dose-response values for the ten HAPs that have not beenconsidered in the case study due to a lack of available dose-response information.
The form in which numbers are presented in Tables 2.3 and 2.4 (i.e., as exponents) is not easilycommunicated to the public, and perhaps an alternative means should be considered. The Agency shouldkeep this form for the Tables, but should consider using consistent cancer risk expressions in the narrativeof the case study, avoiding the use of different expressions for cancer risk. For example, the use of theexpression 8-in-10,000 should be changed to 800-in-a-million. This will allow the lay reader to place the

24
results into the common context of the less than one-in-a-million expression which appears in the CAAAand throughout the case study.
Section 2.2.4.2 identifies a large set of defaults and assumptions, without providing an explanationor rationale. More discussion of these defaults and assumptions is warranted, including statements abouthow they affect the final result. If the effects of the assumptions are unknown (as identified in thissection), some discussion of why this is the case should be included.
The conclusion section for the initial inhalation screening analysis (parts of Section 2.2.4.3), aretroublesome because of their lack of specificity with respect to the chemicals being discussed and thesources. For example, in the statement "Metal HAP risk results exceed these levels", the identity of themetal HAP is unclear. Furthermore, any conclusions for this section are questionable since, as is pointedout in the report, the largest source is fugitive dust emissions which are very uncertain due to uncertaintiesin emission rates and the failure of the estimates to agree with NAAQS measurements made in the vicinityof these facilities.
Section 2.4 (Overall Summary of the Initial Screening Analysis) is very brief and would benefitfrom a description of the organization of the initial screening analysis and how it leads to the multipathwayscreening analysis. The selection of facilities for the refined analysis needs to be placed into some type ofrisk management framework. These facilities were obviously selected since they represented the highestrisk (e.g. cancer risk > 9000-in-a-million and HQ > 70). However, a defined process is needed forselecting which facilities will be included in the refined analysis. For example, if the 100-in-a-millioncancer risk value were used only two of the 23 facilities would pass the screening criteria. The use of thiscancer risk range would be consistent with the benzene decision and the Commission of Risk Assessmentand Risk Management (CRARM) recommendations by having the total cancer risk from the facility beingin the range of less than one to one hundred in a million for the screening assessment. In addition, if ahazard quotient of 10 is used as an action level for the screening assessment, as recommended byCRARM, then a decision to eliminate facilities 6, 9, 12, 20, 25 and 29 for further analysis of noncancerhealth effects can be made. A section entitled 2.X Initial Screening Analysis: Selection of Facilities forRefined Multipathway Analysis should be added in the Chapter 2 results section in order to present thisrationale more clearly.
Section 2 needs to provide a better description of the 23 facilities that have undergone the initialscreening analysis. This information would include a general physical description of the facility size,location (urban, suburban, rural or industrial) and terrain, the annual amount of material throughput, thedegree of facility enclosures (total or partial enclosure of fugitive sources), and, perhaps most importantly,the current HAP emission inventories for these facilities. The inventory information could be obtainedfrom the 1996 or more current National Air Toxics Assessment (NATA) project that the Agency isworking on or HAP emission statements filed with State environmental agencies. Some of thisinformation is readily available from the "Locating and Estimating Air Emissions from Sources of Leadand Lead Compounds" (USEPA, 1998). This information would be very useful for the risk managerwhen evaluating the initial screen inputs and results and would serve as a check on those facilities which

25
would be selected for further refined analysis. The brief discussion contained in the case study isinadequate.
3.8.2 Multipathway Analysis
Section 3.3 (Results and Key Issues of the Multipathway Analysis), is much too long for a resultsand issues section. The heart of this material is on pp. 94-96, so a reorganization of this portion of thereport would be in order.
The Subcommittee found a need for a discussion about a few key issues, in addition to thosealready listed in Section 3.3.2. Specifically, these are the lack of consideration of background concentrations in the risk analysis and the effects of the adjustment of the nickel inhalation unit riskestimate which reduces the conservatism of the cancer risk estimates.
The Report to Congress (USEPA, 1999) discusses the need to include background risk and thedifficulty associated with this specific issue. The case study does not address background risk issuesaround any of the 23 facilities in the human health and ecological risk assessment. This is serious omissionfrom the case-study, and the Agency should address this issue at a minimum from aqualitative/quantitative point of view, well beyond the comparisons made in Chapter 6. The absence ofan assessment of background risk seriously impacts statements about the conservative nature of therefined screening assessment.
The use of only 25% of the inhalation unit risk estimate for nickel subsulfide needs to be explainedin greater detail, since it will have a large impact on the total cancer risk estimates in the case study.
Some Subcommittee members thought the tables and figures were clear and comprehendible;others felt they could be clarified. For example, the plots and bar charts presented as a part of theAgency's briefing on March 1 were very helpful and could be added to the document.
HAPs that were not included in non-cancer endpoints should be clearly identified, together withan explanation of why they were omitted.
3.8.3 Uncertainty and Variability Analysis
As indicated in Section 3.7 above, the Subcommittee had serious concerns about the handling ofthe U&V assessment. The comments below pertain primarily to the format and presentation, rather thanthe adequacy or completeness, of the underlying analysis. In short, the Subcommittee finds that thepresentations (e.g., graphical and tabular displays) are conceptually sound and effective. However, manyof the procedures used in the assessment are not as well-laid out as they need to be.
The tables and figures used throughout Section 4 provide a concise and well-thought outapproach for the presentation of variability for each scenario evaluated. They allow the reader to

26
evaluate the broad spectrum of risk and the impacts of the various exposure parameters used in therefined multipathway risk assessment. These tables and figures significantly enhance the comprehensibilityof the variability assessment results. For example, the use of a 13.3 m3 inhalation rate in themultipathway analysis (Table 4.3), when cross-referenced with Table 4.4, indicates that the inhalationvalue used is between the 25th and 50th percentile and is really not that much of an extreme conservative assumption. When the inhalation rate is coupled with the 70-year duration of exposure and the fraction ofthe day at home, the final risk estimate falls into the 95 percentile for inhalation risk. This is consistent with the recommendations contained in the NRC (NRC, 1994) and the CRARM (CRARM, 1997) reports and the language in the 1990 CAAA to estimate risk for "....the individual most exposed toemissions from a source......" This presentation format allowed the reader to understand in a rathersimplistic manner the amount of conservatism that was used in the refined multipathway risk analysis foreach exposure parameter. So, if the risk manager wanted to observe the impact of setting eachparameter (maximum inhalation rate, maximum exposure duration, maximum ingestion rate , maximumtime spent outdoors, etc.) and the impact it has on the risk estimates, it can be done rather quickly.
The inclusion of the point estimates in Tables 4.5 and 4.6 is an excellent way to concisely presentinformation to the risk manager. The use of a large circle to identify the final cancer risk estimates on theprobability figures (Figures 4.2a - 4.7b) that would be used by the Agency to characterize the risk for thefinal risk management decision would significantly enhance the presentation of the results and make themeasier to interpret. The tables and figures provide the risk manager with the ability to view the broadspectrum of risk predictions, which includes risks to the average exposed individual (AEI), the maximumindividual risk (MIR) and the maximum exposed individual (MEI).
The use of distributional analysis is unclear. The technique was used for some steps in the riskassessment, but not all. For example, the distributional analysis was clearly used for exposure estimates,because data from the Agency's Exposure Factors Handbook (USEPA, 1997) were used. However, itis not clear whether the same data source was used for the emission estimates.
As noted in 4.8.7 above, the selection of variables and methods of quantifying variability and thedistinction between uncertainty and variability is not clear. Such a discussion should be firmly grounded inthe Agency 's risk management goals and a clear understanding of how these results will be used to helpachieve those goals.
3.8.4 Risk Characterization
In Section 5.7 the focus is whether the HQ values are above or below 1. The Agency shouldconsider the robustness of such "bright line" decisions in light of the uncertainties involved. Section 5.8was clear and acceptable to the group.
3.8.5 Summary and Discussion

27
Keeping in mind the limitations and problems identified with the methodology above, this sectionpresents a good summary of results. Tables 6.1 and 6.2 provide a good overview summary of the finalresults for the refined multipathway risk assessments. The presentation of results could be greatlyenhanced with the addition of more site-specific information to the case study. The collection ofadditional data should not be an overwhelming task. The Agency should consider the importance of sucha refinement before the case study becomes a public document.
The discussion in Section 6.2.1.1 should be expanded. The pre-NESHAP monitoring data fromNew York indicates that the NAAQS for lead can be exceeded and that the stringent control of fugitivescan result in a dramatic lowering of ambient concentrations of lead and probably other metal HAPs in thevicinity of secondary lead smelters.
Section 6.2.1.5 needs to be expanded since it provides information on an excellent biomarker forpotential exposure; i.e., blood lead levels. The inclusion of this type of information would greatly enhancethe case study. The Center for Disease Control and Prevention (CDC) and State Health Departmentsshould be consulted to find out if there is any other information on blood lead levels in children who residein communities that are in close proximity to secondary lead smelters.
Table 6.7 should be modified by including the distance to the monitors, as well as a briefdiscussion of siting issues (e.g., predominant downwind or upwind monitoring locations) before anycomparisons are made. The same point can be made for the comparisons of the surface waterconcentrations. However, the Agency does appropriately acknowledge that the comparisons in Table6.8 are not meaningful.
In summary, the information in the report is generally well-presented in some instances and couldbe significantly improved in others, as noted above. However, it is important to gather and evaluate moresite-specific information, using the risk assessment tools presented in the case study, before any final riskmanagement decisions are made for this source category.

R-1
4. REFERENCES
Commission on Risk Assessment Risk Management (CRARM), 1997, "Framework for EnvironmentalHealth Risk Management", Final Report, Volume 1; "Risk Assessment and Risk Management inRegulatory Decision-making", Final report, Volume 2.
Crouch, E. A. C., 1966, “Uncertainty distributions for cancer potency factors: Laboratory animalcarcinogenicity bioassays and interspecies extrapolation.” Human and Ecological RiskAssessment 2: 103-129.
Cullen, A.C. and Frey, H.C., 1999, "Probabilistic Techniques in Exposure Assessment Handbook forDealing with Variability and Uncertainty in Models and Inputs", Plenum Press, New York.
Goble, R. and Hattis, D., 1995, “When the Ceteris Aren’t Paribus---Contrasts between Prediction andExperience in the Implementation of the OSHA Lead Standard in the Secondary Lead Industry,”Report to the Office of Technology Assessment, U.S. Congress, by the Center for Technology,Environment, and Development, Clark University, July.
Goble, R., Hattis, D., Ballew, M., and Thurston, D., 1983, “Implementation of the Occupational LeadExposure Standard,” Report to the Office of Technology Assessment, Contract #233-7040.0,MIT Center for Policy Alternatives, CPA 83-20, October.
Goble, R. and Hattis, D., 1995, “When the Ceteris Aren’t Paribus---Contrasts between Prediction andExperience in the Implementation of the OSHA Lead Standard in the Secondary Lead Industry,”Report to the Office of Technology Assessment, U.S. Congress, by the Center for Technology,Environment, and Development, Clark University, July.
Hattis, D., and Anderson, E., 1999, “What Should Be The Implications Of Uncertainty,Variability, And Inherent ‘Biases’/’Conservatism’ For Risk Management DecisionMaking?” Risk Analysis, Vol. 19, pp. 95-107.
Hattis, D., Banati, P., and Goble, R., 1999, "Distributions of Individual Susceptibility Among Humans forToxic Effects--For What Fraction of Which Kinds of Chemicals and Effects Does the Traditional10-Fold Factor Provide How Much Protection?" Annals of the New York Academy ofSciences, Volume 895, pp. 286-316, December.
Hattis, D. and Barlow, K., 1996, “Human Interindividual Variability In Cancer Risks--Technical AndManagement Challenges” Human and Ecological Risk Assessment, Vol. 2, pp. 194-220.
Hattis, D. and Burmaster, D. E., 1994, "Assessment of Variability and Uncertainty Distributions forPractical Risk Analyses" Risk Analysis, Vol. 14, pp. 713-730, October.

R-2
Hattis, D. and Froines, J., 1992,"Uncertainties in Risk Assessment," In Conference on Chemical RiskAssessment in the DoD: Science, Policy, and Practice, Harvey J. Clewell, III, ed., AmericanConference of Governmental Industrial Hygienists, Inc., Cincinnati, Ohio, pp. 69-78.
Hattis, D., and Minkowitz, W.S., 1996, “Risk Evaluation: Criteria Arising from Legal Traditions andExperience with Quantitative Risk Assessment in the United States.” Environmental Toxicologyand Pharmacology, Vol. 2, pp. 103-109.
Hattis, D., Banati, P., and Goble, R. “Distributions of Individual Susceptibility Among Humans for ToxicEffects--For What Fraction of Which Kinds of Chemicals and Effects Does the Traditional 10-Fold Factor Provide How Much Protection?” Annals of the New York Academy of Sciences,Volume 895, pp. 286-316, December, 1999.
Hattis, D. Banati, P., Goble, R., and Burmaster, D., 1999, “Human Interindividual Variability inParameters Related to Health Risks, Risk Analysis, Vol. 19, pp. 705-720.
National Research Council (NRC), 1994, Science and Judgment in Risk Assessment, National AcademyPress, Washington, DC.
Rimer, Kelly, 2000, USEPA personal communication to Dr. Barnes, March 24.
Science Advisory Board (SAB), 1997, "Review of the Agency's Draft Ecological Risk AssessmentGuidelines", EPA-SAB-EPEC-97-002.
Science Advisory Board (SAB), 1998a, "Review of the EPA's Draft Mercury Report to Congress",EPA-SAB-EHC-98-001.
Science Advisory Board (SAB), 1998b, "Review of the USEPA's Report to Congress on ResidualRisk", EPA-SAB-EC-98-013, USEPA, Washington, DC.
Science Advisory Board (SAB), 1999, "TRIM.FaTE Module of the Total Risk Integrated Methodology(TRIM)", EPA-SAB-EC-ADV-99-003, USEPA, Washington, DC. .
Science Advisory Board (SAB), 2000, "An Advisory on the Agency's Total Risk IntegratedMethodology (TRIM)", EPA-SAB-EC-ADV-00-004, USEPA, Washington, DC, May.
Thompson, K.M., 1999, "Developing Univariate Distributions from Data for Risk Analysis," Human andEcological Risk Assessment 5, 755-783
USEPA, 1994, Secondary Lead Smelting Background Information Document for proposed Standards,Volume I. Final Report. EPA 453/R-94-024b, Office of Air Quality Planning and Standards,Research Triangle Park, NC, June.

R-3
USEPA, 1994, "Health Effects Assessment Summary Tables (HEAST )" Supplements 1 and 2, Ordernumbers: EPA540R94059 and EPA540R94114, Department of Commerce National TechnicalInformation Service, Springfield, VA.
USEPA, 1997a, Risk Assessment Forum, Office of Research and Development, "Guiding Principles forMonte Carlo Analysis," EPA/630/R-97/001, March.
USEPA, 1997b, Office of Research and Development, "Exposure Factors Handbook", Vol. I, II, andIII, EPA/600/P-95/002Fa, August.
USEPA, 1998, Risk Assessment Forum, "Guidelines for Ecological Risk Assessment", Federal Register(93)26846-26924, 14 May.
USEPA, 1999, "USEPA's Report to Congress on Residual Risk", EPA-453/RR-99-001.
USEPA, 2000, "A Case Study Residual Risk Assessment for EPA's Science Advisory Board Review:Secondary Lead Smelter Source Category", EPA Contract No. 68-D6-0065, WorkAssignment no. 3-02, EC/R Project no. HRA-3002, prepared by EC/R Incorporated, January.

A-1
APPENDIX A
WRITTEN COMMENTS OF SUBCOMMITTEE MEMBERS
Each member of the SAB's Residual Risk Subcommittee prepared written comments, centeredon the Charge Questions. These materials were available at the meeting March 1-2, 2000. As a result ofthe public meeting, some of the Members altered their original drafts and asked that the revised versionsbe included in an Appendix to the Subcommittee's consensus Advisory. Other Members chose not tosubmit their comments for inclusion in the document.
Therefore, this Appendix contains the final written comments from those Subcommittee Memberswho chose to submit them for this purpose. These materials are included in this SAB document so thatthe Agency and the public can a) benefit from the specific comments and b) appreciate the range of viewsrepresented on the Subcommittee.
While all of these statements are commended to the Agency for careful consideration, unless acomment is addressed explicitly in the body of this SAB Advisory, it should be viewed as a statementfrom an informed individual, not as the collective view of the Subcommittee.
The comments are including in the following order:1. Dr. Biddinger2. Dr. Brown3. Dr. Cory-Slechta4. Mr. Gentile5. Dr. Hattis6. Dr. McFarland7. Dr. Middleton8. Dr. Taylor9. Dr. Zimmerman

A-2
1. Dr. Gregory BiddingerExxon-Mobil Company
Fairfax, VA
General Comments
1. A Risk Assessment strategy should be designed in alignment with a risk managementprocess.
Although this may seem like an obvious and generic point, I feel it is very relevant to make at theonset of these comments. It became clear during the review of this case study that the linkage betweenthe ecological risk assessment (ERA) and risk management process is weak and this weakness is likelydue to a lack of clear definition on how the risk management process will proceed. I believe this lack ofclarity as to how the ERA will be used to support any risk management decision makes it difficult to eitherdesign an ERA process that goes beyond a screening step or to define what are the Next Steps for ERAin this specific case study.
Recommendation: The footnote on Page 34 of Volume 1 indicates that OAQPS is working ondeveloping a risk management decision framework for the residual risk program. That framework shouldbe presented to the SAB review group to evaluate alignment between the risk assessments and the riskmanagement process. If the strategy is not final, revisions to the case study should be deferred until theframework is available.
2. With regards to Ecological Risk assessment, the Agency needs to define what is meant bythe management goal of ensuring that HAP emissions do not result in "an adverseenvironmental effect".
In order to evaluate the Questions associated with Charge 5, which is fundamentally, were theappropriate models used correctly, it is essential to understand what environmental attributes are beingprotected and at what spatial scale. In section 5.2.1 the agency sites Section 112(a)(7) of the Clean AirAct Amendments (CAAA) to say it is "any significant and widespread adverse effect, which mayreasonable be anticipated to ... or significant degradation of environmental quality over broadareas". The key and operative terms in these statements, which require clarification, include 1)significant, 2) widespread 3) adverse 4) environmental quality and 5) broad areas. Without a cleardefinition of what the agency believes is the intent of these words in the CAAA, it is not possible to assessthe correctness of the agencies actions. Based on an assessment strategy that uses hazard Quotients(HQ's) and conservative ecotoxicological screening benchmarks, I would have to assume the Agency'sgoal is to protect individuals in all populations and in all places.
Recommendation: The Agency needs to provide the appropriate clarifying discussion in Section 5 ofVolume 1 or through the development of a technical policy statement which can be cited in this section.

A-3
This exercise should not be viewed as a philosophical exercise. In developing this clarifying analysis theAgency should identify some practical rules or decision logic which can reasonably be used to eliminatesource categories from ecological risk. Some (but not the only) possible rules for not doing an ERAinclude:
a) Source categories with a few small facilities in different regions
b) Source categories with a few large facilities but no persistent or bioaccumulative HAP's.
c) Facilities in source categories where the primary releases (e.g. downwash, etc) are containedto the site
3. The Ecological Risk Assessment provided is a screening risk assessment and clearly is notintended to be used for risk management decisions other than "No Action " or FurtherAnalysis". But the recommendation(s) of the assessors for any follow-up options are missing.
The Agency is to be commended for so clearly stating in a number of places in the case study thatthe environmental hazard assessment undertaking is not adequate for making a final risk managementdecision that would require controls or other actions to mitigate ecological risks. This reviewer is left withthe question "What will the Risk manager be able to do with this analysis?" If the assessors felt that moresophisticated or detailed analysis was necessary than they should have at least said so, even if theybelieved performing that analysis was not in the scope at this point in the analysis. The case study isincomplete with the ERA as provided because the next steps are not clear. It would not at all be abreach of the risk assessor and risk manager roles for the assessors to provide some further definition ofwhat they could do to explore the significance of some of the High HQ's for various aspects of exposureto key metals (e.g. Antimony) from the Fugitive emissions at facilities 3,4 and 13.
Recommendations: The case study needs to include a section on Next step options withrecommendations for the risk manager to consider.
4. The sources of uncertainty in the ERA are understated.
In section 5.7.3 the report reviews the sources of uncertainty associated with the screening levelrisk assessment. This review on uncertainty doesn't completely account for the uncertainty associatedwith the exposure estimates. Although it does identify inclusion of assumption of bioavailability and theexclusion of some pathway it does not account or refer back to any analysis of the uncertainty associatedwith the dispersion and fate. The uncertainty reviewed in section 4 associated with emission rates,dispersion, environmental fate and pathway analysis could easily overwhelm the uncertainty described insection 5.7.3.
Recommendation: Section 5.7.3 should recognize the uncertainty passed through from the dispersion,fate and pathway models.

A-4
Charge Question 5: Ecological Risk Assessment
1. Given Currently Available Methods, Are the models used for the ecological assessmentappropriate?
In addressing this question it is important to consider my general comments listed above. Themethod of using Hazard Quotients (HQ's) and their summation, Hazard Indices (HI's) to screenecological hazards is well established for use in ranking and prioritizing hazards associated with chemicals. The method has had significant use in new product design and approval, Risk-Based Corrective Actionsat contaminated sites and prioritization of resources in regulatory programs. As is well stated in thedocument such a conservative technique is only used to remove chemicals from further risk managementconsideration (i.e. the risk is acceptable) or to indicate that there is a need for further analysis. What thiscase study does not do is take or even identify the next steps to refine the analysis of those chemicals thatfall above an HQ or HI of 1.0. One would have expected that some refinement of the exposure andeffects characterization for metals with the highest HQ's would have been explored. If only to see if lessconservative or site-specific modifications to the exposure characterization or full use of dose-responsedata for relevant surrogate species might have brought the HI exceedances into acceptable ranges. As itstands now we are left with some significantly high HQ's implying to an unsophisticated audience that aserious problem exists but without any framing of an approach to validate or refute such an implication. As a risk assessor, I recognize that this is only the first step and that these HQ's can drop orders ofmagnitude when they are refined, but any lay audience reading this review and seeing HQ's of 400 withno action recommended is likely to be alarmed.
Recommendation: The Agency needs to have a process that goes beyond the initial step of ecologicalrisk assessment that is taken in this draft case study and either a) refines the hazard screening process byimproving the estimates of exposure and selecting more appropriate Toxicity Reference Values (TRVs)or b) moves into a risk assessment process that is based on more complete and relevant profiles ofexposure and effects
2. Are the (available methods) applied correctly?
For the most part yes but one particular aspects of the application of the HQ approach goesbeyond current good practice, that is the summing of HQ across all chemicals. Summation of hazards forchemicals which are operating with the same mode of action on the same target organ or system may beacceptable. But summarizing across an array of benchmarks which are based on a variety of endpoints,some of which are NOAELs and some are LOAEL's is not conservative it is misleading. I can't see anyway that metals and organics could be considered additive to either the individual or at the population.
The only classes of chemicals in this case study which might allow such a summing techniquewould be the summation of HQ's for Dioxin/furan congeners and the summation of PAH's. But for

A-5
PAH's it would still be necessary to break the summations into high and low molecular weight categories.If this were being done for assessment of acute hazards I would be more accepting but with chronictoxicity criteria the endpoints could vary across growth, development, reproduction and survivorship
3. Are the ecological benchmarks appropriate?
It is not really possible to completely answer this question from the information given. Thebenchmarks that were selected represent the current state of the practice for screening benchmarks.Many of these benchmarks were developed for use at contaminated sites to focus management action ononly the serious chemicals of concern. For some of these lists especially the water and sedimentbenchmark series there may be different benchmarks for freshwater and marine systems. Which wereused? The lower of the two? Which ever was available? For screening purposes this is not likely going tobe a problem or certainly any error of application could be caught in the next round of refinements.
What is clear is that these numbers should not be used for any sophisticated risk assessment. Thedata behind these criteria may well support a risk assessment but the final "criteria value" can only be usedfor what has been done here which is to eliminate chemicals of concern. As HQ's are refined not onlyshould the exposure estimate be refined to reflect site specific conditions, but also the characterization ofeffects should advance from a general benchmark to an estimate of a toxic threshold based on dose-response data for a representative or surrogate species.
Recommendation:: If the Agency is going to do 174 source categories, it is worth the effort to developa matrix of Toxicity Reference Values (TRV's) for various receptors and endpoints for each of the HAPsthat could be used as screening values. If the complete dose-response relationships are available, thenthe same data could be used for a) screening (NOAELs), and b) first risk approximations (EC10 orEC20) and c) complete risk distributions (Slope of the dose-response curve). Although this is not a smalltask, such a front-loaded effort could stream-line much of the subsequent source category analyses. Ifthe Agency were to embark on such a task, I recommend leveraging this effort with interested industrycoalitions.
Section Specific Comments.
Section 5.1
The language in paragraph 1 of page 130 is confusing. Suggest discussing hazard potential ratherthan potential risks.
Are all of the cited EPA documents are available to the public? Is EPA 1999d available? If notshould it be cited?
Section 5.2.1As previously stated in general recommendation #2, this section should be expanded to give the

A-6
agencies interpretation of the management goal from the CAAA. This would require defining such termsas: 1) Significant,2) Widespread 3) Adverse 4) Environmental Quality and5) Broad Areas.
Section 5.3 This section is weak because of the lack of interpretation of the management goal in section 5.2.1.
It should be more clearly stated that the assessment endpoint is No or limited adverse effects to individualmembers of sensitive populations. There is no real consideration of impacts to structure or function. It isonly a simple extrapolation to suggest that if no individual is adversely affected than neither will the serviceof its population or the structure and function of communities and ecosystem it lives in be affected. Thisassessment is being done in a fashion to protect individuals; there is nothing wrong with this if that is theagency's interpretation of adverse environmental effects. I would suggest it is a bit stringent but for ascreening assessment not atypical. But ultimately the assessment of residual risk should be at a level ofpopulation or higher. Table 5.1
Citations for Suter et.al. and Will, M.E. et.al. are in conflict with the reference list.
Section 5.7.2
The discussion incorrectly states that all facilities had HQ's >1 for metals. Facility 2 was notreported in section 5.7.1.1 or in appendix E to have HQ's > 1 with or without fugitives emissions. Thisinconsistency needs to be corrected.
Section 5.8
As stated previously, this section should address recommendations to the manager about the needfor follow-up actions.
Sec. 2.3 The use of lists to identify Persistent and Bioaccumulative compounds isinappropriate.
Recommendation: The Agency needs to specifically design or adapt a process to support a ResidualRisk process.

A-7
2. Dr. Stephen L. Brown Risks of Radiation Chemical Compounds (R2C2)
Oakland, CA
These comments are submitted to alert the Subcommittee members to some issues I will want todiscuss in our meeting on points OTHER than on my main assignment--the uncertainty and variabilityanalysis. Along with my co-discussant, Dale Hattis, I will be submitting a formal, although preliminary,writeup on that subject.
Overall Effort
Overall, I have mixed feelings about the case study. On the one hand, its overall structure andcomponents are similar to those in many of the risk assessments conducted in the past few years by or forUSEPA and other environmental agencies such as the California EPA. It features some standard andgenerally well accepted models such as ISCST-3 as well as a detailed multipathway model, IEM-2M. Ituses values for many of the needed parameters that can be found in standard sources such as the IRISdata base of toxicity information and the Exposure Factors Handbook. It features a screening levelanalysis prior to the main analysis that is designed to help the latter focus on the most important HAPsand facilities. It includes a variability/uncertainty analysis and a risk characterization section that are bothrecommended in recent EPA guidance on the conduct and presentation of risk assessments. Many of itsassumptions are similar to those in other EPA risk assessments and therefore consistent with them.
On the other hand, it shares most of the deficiencies of those same comparison risk assessmentsand seems to introduce a few of its own. The conservative assumptions inherent in most Agency riskassessments are repeated here, and are not adequately balanced by the supposedly less biaseduncertainty analysis. Many of the case-specific assumptions are inadequately described, let alone welljustified, in the text supplied to the Subcommittee. Some of the predictions of the assessment are trulyastounding (e.g., the blood lead levels calculated when fugitive dust emissions are included in theassessment), yet there seems to have been little attempt to identify and correct the problems that mighthave led to such conclusions. Even though the case study is not supposed to be a final assessment for thesecondary lead smelter category, it should have included more thorough quality control to demonstratehow such an activity would be included in a final assessment.
In reviewing the assessment, I was struck by how similar the structure was to assessmentsconducted under AB2588, the California statute titled the Air Toxics Hot Spots Act. That act isspecifically designed to evaluate the risks from emissions to air by stationary sources in California. In thatcase, the risk assessments are conducted by the facility itself using guidance provided by the State, andthe assessments are reviewed by the local air district for conformity with that guidance and accuracy ofinputs and outputs. The facility may submit an alternative assessment with more site-specific informationand less conservative assumptions, including a distributional analysis in some cases, but the local authorityis not obligated to review those assessments. The standard assessment is usually conducted with the aidof a computer model such as ACE2588 or HRA96 that was designed to follow the guidance precisely.

A-8
Users are allowed to use some site-specific information, such as stack characteristics and the location ofactual water bodies used as drinking water sources. The models include not only direct inhalationexposures via concentrations calculated by ISCST-3 but also via multimedia pathways similar to those inIEM-2M (although IEM-2M features a more detailed water partitioning model because it was designedspecifically for mercury). Another similar multimedia risk assessment model designed for emissions to airis TRUE, developed by the Electric Power Research Institute for assessing fossil fuel power plants. TRUE includes a mercury model similar in design to IEM-2M. TRUE is generally less conservative thanthe AB2588 models, but is still described as conservative by its authors.
I will now provide comments by Section of the Case Study, more or less in page order.
Introduction
I was disappointed not to see a clearly articulated description of the decision that this type of riskassessment is to serve. Although the obvious application is to the residual risk requirements of theCAAA, it is not clear that EPA knows how it will interpret those requirements in evaluating the outputs ofthe risk assessments. For example, how will risks to highly exposed individuals be weighted incomparison to the population risks for the whole exposed population? How will a highly exposedindividual be defined? Some fixed percentile of a distribution? A qualitative representation of such apercentile, such as the RME? A hypothetical maximally exposed individual or MEI? What are thequantitative criteria that will trigger further risk reduction actions? Will those actions be applied to onlythose facilities whose calculated risks are above the criteria, or will the whole category be affected? What level of assurance will be demanded that the criterion is met in order to state that the residual riskrequirement is met? Without knowing rather well what questions will be asked, the Agency may notprovide useful answers.
In the Introduction, the concepts of the unit risk estimate (URE) and the reference concentration(RfC) are introduced for inhalation risks. Although it is clear that both of these numbers are applicable tocontinuous lifetime exposure to a constant concentration in air, it is not clear that calculated concentrationsmay need to be adjusted for exposure duration before being used to determine risk using the URE orRfC. This lack of clarity is not entirely dispelled in the later section on Dose Response. One stakeholdercommenter believes that the duration adjustment was appropriately made for ingestion exposures but notfor inhalation exposures. More generally, the document could use considerable improvement in theexposition of what was actually done in the risk assessment.
Initial Screening Level Residual Risk Analysis
The idea of screening level analyses to focus further risk analysis on the facilities and HAPs mostlikely to violate the residual risk limits is sensible. In fact, multi-level screens may be appropriate, not justone initial screen. However, the screening analysis as designed could be improved. First, screening ononly inhalation exposures may give a false sense of security about some facilities or chemicals if otherpathways are in fact substantial contributors to risk. For some HAPs emitted to air, pathways other than

A-9
inhalation may be orders of magnitude more important to risk, particularly if the fate parameters are suchthat concentrations in soil will build up over a long time before plateauing as removal processes becomeeffective. It may be necessary to build in some HAP-specific screening-level multipliers for multimediaeffects into the inhalation risk calculations. On the other hand, it appears that the screen for secondarylead smelters may have been too conservative in that all facilities and many of the individual HAPsexceeded the screening criteria when fugitive dust emissions are included. If a screen does not screen outanything, it is not very effective.
I am also not particularly impressed with the rationale for selecting the HAPs to take forward intothe multipathway analysis. The occurrence on a list of “PBT” (persistent, bioaccumulative, toxic)substances is, in my view, a weak substitute for a more quantitative classification. The actual risk posedby a substance depends on all three attributes, and others, in a complex way dependent on the actualconditions of fate, transport, and exposure. It is possible to examine complex multimedia models andcreate simplified models that reproduce their results in a crude fashion, preserving how the effects of half-life, BAF/BCF, and toxicity interact. I again recommend an effort to create HAP-specific multipliers forscreening purposes to help identify the HAPs that should enter the multimedia assessment.
Multipathway Residual Risk Analysis
As stated in my overall impressions, in many ways the multipathway analysis is equivalent to orbetter than other regulatory-responsive risk assessment models, featuring a widely accepted air dispersionmodel along with a highly detailed multimedia transport and fate model. My reservations have more to dowith implementation than with overall concept.
Perhaps my foremost reservation is about the emissions estimates. As I understand it, no facilityhas more than one set of tests (e.g., a one- to three-day measurement protocol) subsequent to achievingMACT. Furthermore, there is no evident attempt to correlate the emissions testing results with anyexplanatory input such lead throughput during that period, type of operation, or type of emission controlequipment. (The latter two factors do seem to be used as a guide to extrapolations from one set ofmeasured results to a different facility, however.) The document does not discuss any inherent temporalvariability, such as variation in throughput, that might make a snapshot of emissions inappropriate forcalculating an annual average. Perhaps these points are all discussed in the underlying data sources, butthey do not appear in the current document. As stated in my preliminary comments on uncertainty, thevariability seen in the lead emissions estimates may be more representative of day-to-day variations thanto annual average variability. There is no evident test of correlations between lead emission rates andHAP-to-lead emission ratios, that might occur, for example, if lead emissions followed lead throughputbut some other source (e.g., refractory brick) were the source of a different metal. The Agency clearlyhas little confidence in the fugitive dust emissions estimates--all derived from pre-MACT data, as Iunderstand it--but still presents risk results as some sort of upper bound on risk. I contend that such anupper bound is probably not reasonable, given the failure of monitoring data to confirm the concentrations

1I am not as sanguine about the virtues of “model validation” for the multimedia model as some of theother reviewers of the Case Study. The model is designed to estimate media concentrations averagedover some vaguely specified future time period after continuous operations at MACT conditions withno prior operation. Measurements of media concentrations that can be conducted in the present,however, will not capture the effect of future emissions, so might be underestimates, and will capture theeffect of higher pre-MACT emissions, so might be overestimates, of the desired validation quantity. Moreover, the proper temporal and spatial averaging techniques to make model predictions andmeasured concentrations strictly comparable are not easy to specify. Perhaps the best we can hope foris the identification of gross inconsistencies.
A-10
of lead or other HAPs offsite.1 Unless the Agency is prepared to undertake empirical studies of fugitivedust emissions from secondary lead smelters, it might be better advised not to do any quantitativeanalysis, simply stating that risks might be higher had fugitive dust been included. I suspect the same maybe true for other source categories.
Another major concern is the seeming inconsistency between the very detailed multimediamodeling, which includes such abstruse topics as sediment-water partitioning with BCF and BAFadjustments to fish concentrations side-by-side with an inability to locate stacks in relation to facilityboundaries or the assumption of home garden consumption at a nearby residence. It would seem toentail little work to telephone the facility for information or make a site visit in comparison to developingall the inputs for the IEM-2M model, yet such inexpensive efforts could improve confidence in the riskestimates greatly.
I generally agree with the hierarchy of choice for selecting toxicity values to be used in the model. Some commenters have questioned the use of CalEPA values as one of the possibilities, but as a memberof the Risk Assessment Advisory Committee, I have examined that Agency’s methods and believe them,on balance, to be as good or superior to USEPA’s. I therefore cannot fault OAR for using the IRISvalues when available and ATSDR, CalEPA, and HEAST values when IRIS is silent. Nevertheless,some of the toxicity numbers appear to affect the results markedly and should be viewed with caution. Iam especially concerned about the values for antimony and for manganese. The antimony RfC is basedon irritation, for which application of standard uncertainty factors may not be appropriate. The antimonyRfD is based on toxicity endpoints that include blood glucose and cholesterol, not clinical illness. Themanganese RfC is based on “impairment of neurobehavioral function,” an endpoint that is probably tosome extent subjective and less severe than endpoints used to define other toxicity values. I recommendthat EPA’s Risk Assessment Forum explore ways to make the IRIS data base more consistent (perhapsby explicitly considering severity of endpoint) and to verify any values that seem to drive risk assessments.
I note the importance of particle size distributions in defining deposition velocities and otherparameters for dry and wet deposition, which can greatly influence the overall deposition rates and risksfor the same estimated air concentration. I understand that the distribution for stack and controlledfugitive emissions was assumed to be similar to those observed in emissions from baghouses, andgenerally ranges downward from 10 microns. However, I did not find this assumption to be stated in the

2The Agency views lead as a non-cancer risk that nevertheless has no identifiable threshold, andtreats it with the IEUBK model. In reality, toxicity data rarely if ever identify a true threshold and theRfD or RfC is set as the practical equivalent of no risk. Probably more at issue is the assumption thatrisk of cancer is more likely to vary linearly with exposure at low exposure than is the risk of non-cancer effects.
A-11
document, nor did I find information on the assumed distribution for fugitive dust emissions or how theparticle size distributions were translated to deposition velocities. Generally speaking, reductions inparticle size tend to spread deposition over a greater area but reduce peak deposition at the RMElocation. However, if the particle size distribution is dominated by particles so large that they deposit on-site, reducing the particle size may actually increase the RME deposition.
Although the actual model inputs include a provision for chemical degradation after deposition,this mechanism of HAP removal from soil and water is not mentioned in the text. It should be. I alsounderstand that the locations of actual water bodies were used for the drinking water and fishconcentration calculations, not some hypothetical water body co-located with the RME, but again thisprocedure was not described in the text. I also am not sure whether these water bodies are actual, oronly potential, sources of drinking water for the local community. The text is also unclear about thefraction of all produce consumed that is assumed to be contaminated by the smelter. In some cases, itappears that a 100% assumption was used, whereas elsewhere, it appears that some standard EPAassumptions less than 100% were used. I am particularly concerned that any significant part of “grain”consumption is assumed to be locally produced, at least for home gardeners.
Non-cancer risks are represented by the hazard quotient/ hazard index structure that, with all itslimitations, is the standard Agency method for the so-called “threshold” toxicants.2 The averaging periodfor exposures to be used in non-cancer risk assessments is generally taken to be one year in Agencyassessments, and that practice seems to have been followed here. On the other hand, the averagingperiod for exposure to carcinogens is taken to be a lifetime, at least for all carcinogens treated as havinglinear dose-response relationships with no threshold. That assumption implies that cancer risk varieslinearly with duration of exposure if daily exposure is held constant. Although it is reasonably clear thatthe Agency has taken duration into account in exposure averaging for the ingestion routes of exposure,one of the stakeholder commenters has alleged that the Agency did not do so for the inhalation route,thereby overestimating risk by the ratio of a lifetime to the assumed duration of exposure. If true, thiserror should be corrected. If not, explanatory text should be added.
I would have expected that lead would be the most important risk from a secondary lead smelter. Cursory inspection of Tables 3.13-3.16 might suggest to the unwary that it is not, because no hazardquotients are presented for the ingestion routes, and the hazard quotients for inhalation are not as high asfor some other HAPs. However, this impression is due to two facts that are not as emphasized as theymight be. First, the inhalation hazard quotient is calculated from the primary NAAQS for lead, which isnot purely a health-based number. Second, the ingestion hazard quotient is not calculated at all, becausethe Agency refuses to promulgate an RfD because of the asserted non-threshold nature of lead.

A-12
Therefore, the significant analysis for lead is accomplished through the IEUBK modeling proceduredescribed in Section 3.3.1.4. From Table 3.23, it can be seen that predicted blood lead levels can bequite high, especially for the fugitive dust scenario. Although some discussion of the lack of conformanceof these predictions with observed blood lead values is presented, I think that the magnitude of thesevalues casts grave doubts about the validity of the modeling. See, however, Footnote 1 on the difficultiesof making comparisons of model predictions with measurements.
Initial Ecological Screening Analysis
Although my expertise is not on the ecological side, this section struck me as morestraightforward, polished and easier to understand than most of the health risk assessment sections. Inote that it is screening-level in terms of the evaluation of the significance of media concentrations, but ismore-than-screening-level in terms of the calculation of media concentrations, as it uses the same ISCST-3/IEM-2M outputs as does the multimedia health assessment. The text suggests that some organics andacid gases might be included in a more detailed assessment, but was not clear what reasons would inducethe Agency to include them.
The text states that single point estimates are used to evaluate media concentrations, but does notstate at what geographic location. I infer that they are probably the RME locations used for the healthassessment, but the location should be made explicit. Averages over some reasonable range for theorganisms assessed might be more reasonable.
Summary and Discussion of ResultsIn general, the summary is a reasonable representation of the procedures and findings from the
preceding sections. It also attempts to discuss a number of issues that might be troubling to a reader,including the comparison of modeled concentrations with measured ones. However, my overallimpression is that the risk characterization is more optimistic about the quality of the analysis than isjustified. For example, in Section 6.4, the Agency states: “For any particular pollutant, pathway andexposure scenario the resulting distributions can be used to identify the confidence or probability that riskswill be below or above specific risk levels (e.g., acceptable risk).” Given the deficiencies in theuncertainty analysis, let alone those in the deterministic assessment, I think that is a gross overstatement. Nor do I think that the uncertainty analysis in any way validated the deterministic assessment, althoughthat is also suggested here.
I also found the section on children’s health gratuitous, unconnected to the main analysis, and fullof overstatement. For example, the description of newborns having a “weaker immune system” omits thetemporary carryover immunity from the mother. Although children eat more food per unit body weightthan adults for some foods, they eat less for others (e.g., fish). And those differences are alreadycaptured in the exposure analysis by age. The fact that cancer risks, even if due to early-life exposures,are expressed later in life is not mentioned, and the reader is left with the impression of a potentialepidemic of children’s cancer due to lead smelters.
A-13
Finally, I want to share one procedure that I always followed when preparing AB2588assessments. Because I was usually contracted to a facility owner, I wanted to be sure that the resultswere not overstated through error, even if overstated through mandated assumptions. I therefore alwaystraced back the dominant risk drivers by pollutant, exposure pathway, and source. I often found simpleerrors to be responsible, such as entering a number that was expressed in different units than needed, oreven copying errors. Sometimes the problem was more subtle, such as including a route of exposure thatwas actually not possible for the specific facility. I am not convinced from reading the Case Study thatthe Agency took similar efforts to assure quality, and I recommend it do so. My experience can beextended for those who are worried about risks being understated by looking at pollutants that wereexpected to show higher risks but did not.

A-14
3. Dr. Deborah Cory-SlechtaDepartment of Environmental Medicine
University of RochesterRochester, NY
1. There are two major but related aspects of the residual risk analysis which are disconcerting.The first is the extensive degree of uncertainly in the models that have been developed and the total orcumulative uncertainty of the overall risk analysis. To the credit of its authors, the models are well thoughtout progressions that go from an initial identification of what may be the major contaminants from thesmelters to a multiple pathway analysis that includes multiple sources of exposures as well as multipletypes of receptors. Models for each component of these pathways feed into the overall derivation of theresulting HI values. The logic and inclusiveness of this progression is a major strength of the approach. Inaddition, the multiple pathway analysis approach includes consideration of different age groups, at leastearly age groups. However, the actual derivation of the HQ and HI values is almost totally dependentupon substituted values rather than upon actual data and these are propagated through the process. Thus,there is really no validation of the model that has been attempted to date. Certainly no systematic attemptto validate the model was undertaken; but even the assessment against some known entities is notconsidered. The outcome is really presented in the abstract. While there is repeated discussion of theuncertainties of the analyses, there is no discussion following either Chapters 3 or 4 of Volume I as to therealities and or the limitations of the findings. This represents a major weakness of the approach,recognizing what may be difficulties in obtaining data for the most relevant parameters of the models.
2. Also with respect to issues of validating and understanding the model, there is little indication ofhow the actual default assumptions used alter the outcomes and any tests to look at how modifying theseassumptions changes the outcomes, or drives the outcomes. Its not clear how the validity of the modelcan be established without understanding how its components work and influence outcomes.
3. The uncertainty analysis does little to provide additional reassurance with respect to the validityof the model. The description of the outcome of this analysis is presented but with little attention to itsconclusions and to how these conclusions relate to the validity of the residual risk model, particularly themultipathway analysis. For example, the plots presented with respect to outcome are somewhat difficultto comprehend and do not provide a straightforward assessment of uncertainty. The analyses presentedin Chapter 5 of Volume I are plotted in a manner that is not intuitively obvious and must be extracted. It isindicated, almost as an aside, that the range predicted for each cancer or non-cancer effect spans at leasttwo orders of magnitude. How acceptable is this range? What would typically be an acceptable range ofvalues from such an analysis?
4. Some of the predicted values from the residual risk assessment suggest problems with thedefault assumptions. For example, the residual risk assessment predicts blood lead values from Facilities3, 4 and 13 for infant blood lead levels of over 200 ug/dL. These are extraordinarily high, likely muchhigher than even encountered in an occupational context these days. Surely, if such blood lead valueswere being generated, they would result in obvious toxic effects and even lethality in infants and would beevident.

A-15
5. Similarly, the residual risk assessment derives exposure values for dioxins and furans werefound to be considerably lower than those reported in breast milk in all of the facilities. The residual riskassessment concludes that this means that emissions of dioxins/furans from secondary lead smelters are aminor contributor to overall dioxin/furan emissions nationwide. Not considered here is the alternativeexplanation that dioxins/furans may be inadequately modeled. The comments summarized in #s 3 and 4above suggest that by the simple potential mechanisms of validating the model, it does not work well.
6. Two major assumptions upon which the residual risk assessment is based are not adequatelyjustified nor explained. The assumption that cancer as an endpoint has no threshold, whereas non-cancerendpoints do exhibit thresholds has no obvious biological basis. It also is not well supported by morerecent reanalyses of data suggesting that Pb exposures below 10 ug/dL (a value used as a type of riskthreshold) may actually produce larger effects than those above 10 ug/dl. It is also notably inconsistentwith the rest of the document, since this is certainly not the most conservative approach. If this assumptionis to remain in the residual risk assessment, then some type of rationale for it should be provided.
7. Another assumption that is problematic is that the effects of HAPs are considered to beadditive. This may need to be a default assumption given the relative absence of a data base from whichto conclude otherwise. Assumptions of synergistic or potentiated effects may be overly conservative andthus not appropriate in this case. Again, however, some rationale for the reliance on this assumptionshould be provided.
8. The focus on dioxin as a cancer risk really fails to embrace the fact that these compounds havemarked effects on the immune system, the reproductive system, and perhaps the nervous system as well.This component of dioxin/furan effects should be included in the non-cancer effects.
9. Some of the distinctions between the subsistence farmer and the home gardener seemsomewhat arbitrary. For example, why wouldn’t the home gardener also be ingesting animal products, infact those grown on the subsistence farm; local processing and distribution of these products certainlyoccurs.
10. One major component of the document that seems to be missing is any real discussion of theoutcomes of the multipathway analysis with respect to known values as determined from other sourcesfor emissions of the various metals and organics chosen as well as any exposure data for thesecompounds in smelter workers and or groups living around smelters. How do values computed relate toany known emission or exposure data?
11. A related point is that the document does not really put the risks generated into an adequatepublic health context. What do these derived risk estimates mean with respect to public health? Thevalues generated are presented without really providing any discussion of their relationship to knowntoxicity levels for these compounds.
12. A minor point, but wouldn’t chicken be a better choice than pork with respect to total humanconsumption in the category of animal product ingestion?
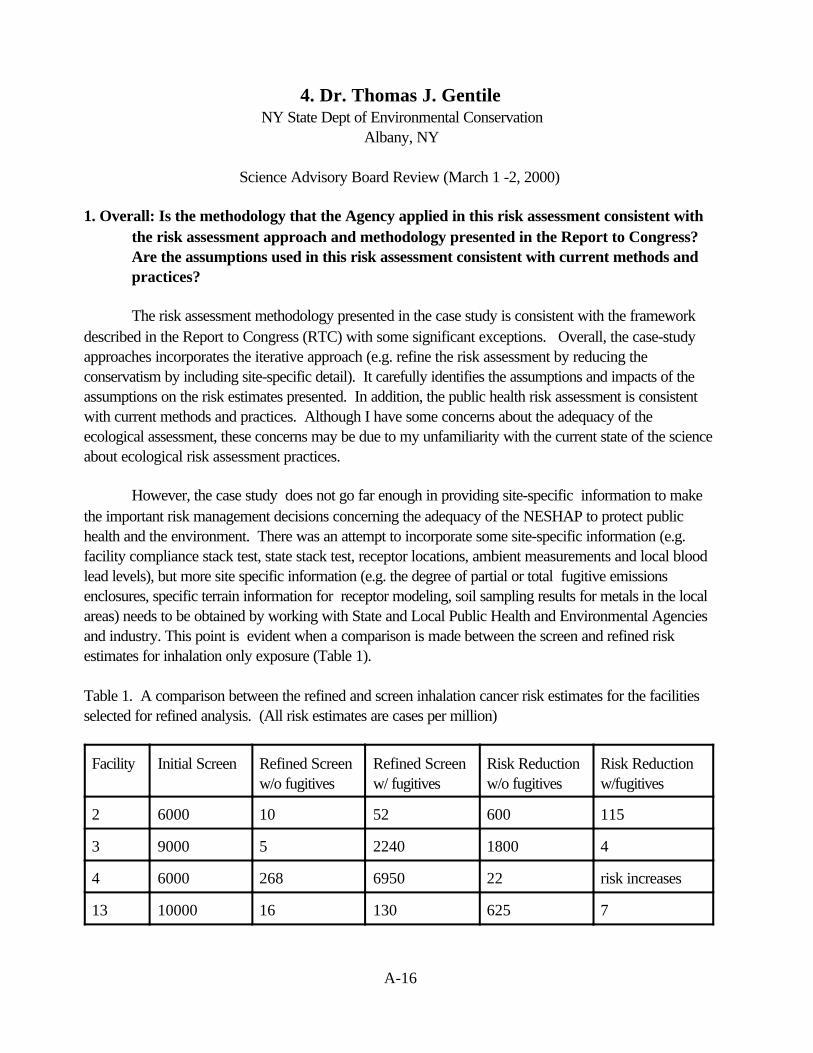
A-16
4. Dr. Thomas J. GentileNY State Dept of Environmental Conservation
Albany, NY
Science Advisory Board Review (March 1 -2, 2000)
1. Overall: Is the methodology that the Agency applied in this risk assessment consistent withthe risk assessment approach and methodology presented in the Report to Congress? Are the assumptions used in this risk assessment consistent with current methods andpractices?
The risk assessment methodology presented in the case study is consistent with the framework described in the Report to Congress (RTC) with some significant exceptions. Overall, the case-studyapproaches incorporates the iterative approach (e.g. refine the risk assessment by reducing theconservatism by including site-specific detail). It carefully identifies the assumptions and impacts of theassumptions on the risk estimates presented. In addition, the public health risk assessment is consistentwith current methods and practices. Although I have some concerns about the adequacy of theecological assessment, these concerns may be due to my unfamiliarity with the current state of the scienceabout ecological risk assessment practices.
However, the case study does not go far enough in providing site-specific information to makethe important risk management decisions concerning the adequacy of the NESHAP to protect publichealth and the environment. There was an attempt to incorporate some site-specific information (e.g.facility compliance stack test, state stack test, receptor locations, ambient measurements and local bloodlead levels), but more site specific information (e.g. the degree of partial or total fugitive emissionsenclosures, specific terrain information for receptor modeling, soil sampling results for metals in the localareas) needs to be obtained by working with State and Local Public Health and Environmental Agenciesand industry. This point is evident when a comparison is made between the screen and refined riskestimates for inhalation only exposure (Table 1).
Table 1. A comparison between the refined and screen inhalation cancer risk estimates for the facilitiesselected for refined analysis. (All risk estimates are cases per million)
Facility Initial Screen Refined Screenw/o fugitives
Refined Screenw/ fugitives
Risk Reductionw/o fugitives
Risk Reductionw/fugitives
2 6000 10 52 600 115
3 9000 5 2240 1800 4
4 6000 268 6950 22 risk increases
13 10000 16 130 625 7

A-17
The increase in risk for facility 4 as a result of the refined modeling raises concerns, which maygo beyond the lack of refinement of the fugitive dust emission estimates in the refined analysis. This needsto be explored in greater detail in the case-study. The obvious differences which impact the riskassessment between facility 4 and the others is the size of the facility as determined by the number ofemission points (n=13), the furnace type and the closer receptor impacts (Table 3.7 in case-study). However, the most troubling aspect is that Facility 4 had stack test data reported for all of the HAPswhich were assessed in the refined screening exercise. It also had the smallest incremental reduction inrisk (22 times) when just the process and process fugitive emissions impacts from inhalation exposure areconsidered. The other issue is that Facility 3 also had stack test data reported for all of the HAPs whichwere assessed in the refined screening analysis and had the largest incremental reduction in risk (1800times). An in depth analysis of these large differences in risk reductions (1800 versus 22) needs to beexamined more closely in the case study. In addition, they have probably been subject to stringent stateair toxics requirements under the California Air Toxics Hot Spots Program. Is there a State Air ToxicsHot Spot Risk Assessment for these facilities? If it is available has OAQPS conducted an independentevaluation of the results and actions which were taken to reduce risk?
This is extremely important since the refined analysis for facilities 3 and 4 was based more sitespecific emissions information. The increased risk observed for facility 4 in the refined analysis indicatesthat the initial screening assumptions may not be overly conservative in all cases. The only way to checkthis would be to obtain some basic site-specific information to insure that the parameters used in theinitial screen are always going to be conservative for all facilities.
In summary, a detailed site specific description of the four facilities selected for the refinedanalysis should be summarized and included in volume 1. The brief discussion in section 3.1.1 isinadequate and should be expanded. This qualitative expansion should include cross references to othersections where site specific data is used in the refined analysis. For example, the use of actual stackcharacteristics for the refined analysis which is found in Table 3.3, the use of local met data which is foundin Table 3.4 and the use of actual receptor locations which is found in Table 3.7. This would place all sitespecific or cross references to site-specific information into one important place and would help thereader conceptualize the differences between the facilities under evaluation.
In context of the framework presented in the RTC, it appears that the refined analysis can notanswer the question: Is human health risk acceptable ? The fugitive emissions issue (e.g. lack ofrefinement) and the lack of site-specific information clearly result in negative answer to the question: Areinformation and analysis sufficient to evaluate management options? This answer indicates that a furtherrefinement of the case-study or another iterative step is needed before an evaluation of the riskmanagement options can be considered.
The Agency is mandated under Section 112(f) to conduct the residual risk assessment and makea decision to implement further regulation or to make a decision that no further regulation is needed. Inresponse to the previous SAB review of the RTC, the Agency responded that, “ the decision made withthe results of the screening analysis is no further action or refine the analysis, while the decision madewith the results of the more refined analysis is no further action or consider additional emissions control.”

A-18
As discussed above, the results of the refined analysis provides the same answer as the initial inhalationscreen, that a more refined analysis is needed. Therefore, the case study has not achieved the ultimatedecision objective and another level of analysis or iteration is required. The case study should do a morein-depth refined analysis or an additional step-wise iteration to improve the case study for riskmanagement decision making.
An examination of the initial screen results indicates that it has provided important informationabout which hazardous air pollutants (HAPs) need to be considered in the multipathway and refinedanalysis. However, the results from the above Table are disconcerting. How can the refinement and theremoval of conservative assumptions and HAPs from consideration result in an increased inhalation riskfor receptors around facility 4? It is important to narrow the scope and refine the residual risk analysis inthe first step, however, extreme caution must be exercised when eliminating HAPs and facilities fromconsideration as a result of the initial screening. It is clear that the use of post NESHAP emission rates inthe initial screen would provide a better starting point for the case study.
The impact of consolidating emission points into a centroid emission point needs to be carefullyconsidered and analyzed. The Office of Air Quality Planning and Standards (OAQPS) should evaluatethe work that has been conducted with the Office of Pollution Prevention and Toxics (OPPT) on the RiskScreening Indicators Model concerning the use of centroid emissions locations versus the use of facilityspecific stack and location parameters. An analysis conducted by OPPT found that the impacts in thearea close to the facility fence lines was underestimated by a factor of three to seven when the centroidwas used to estimate emission impacts. As distance from the facility increased the centroid modelingprovided more consistent predictions when compared with the model using actual stack emissionparameters and location characteristics. Therefore, some of the conservatism of the initial screening andthe refined screening exercises may be questionable if receptors are in close proximity to the facilityfencelines.
The selection of facilities for the refined analysis needs to be placed into some type of riskmanagement framework. These facilities were obviously selected since they represented the highest risk(e.g. cancer risk > 9000 in a million and HQ > 70). However, a defined process is needed for selectingwhich facilities will be included in the refined analysis. For example, if the 100 in a million cancer riskvalue was used only 2 of the 29 facilities would pass the screening criteria. The use of this cancer riskrange would be consistent with the benzene decision and the Commission of Risk Assessment and RiskManagement (CRARM) recommendations by having the total cancer risk from the facility being in therange of less than one to one hundred in a million for the screening assessment. In addition, if a hazardquotient of 10 is used as an action level for the screening assessment as recommended by CRARM, thena decision to eliminate facilities 6, 9, 12, 20, 25 and 29 for further analysis of noncancer health effectscan be made. One can construe from the selection of only four facilities that a decision of no furtheraction may be made for the other 19 facilities based on the initial screening assessment.
In summary, there is a need to gather more site specific information for the initial and refinedanalyses than what was gathered and presented in the case-study.
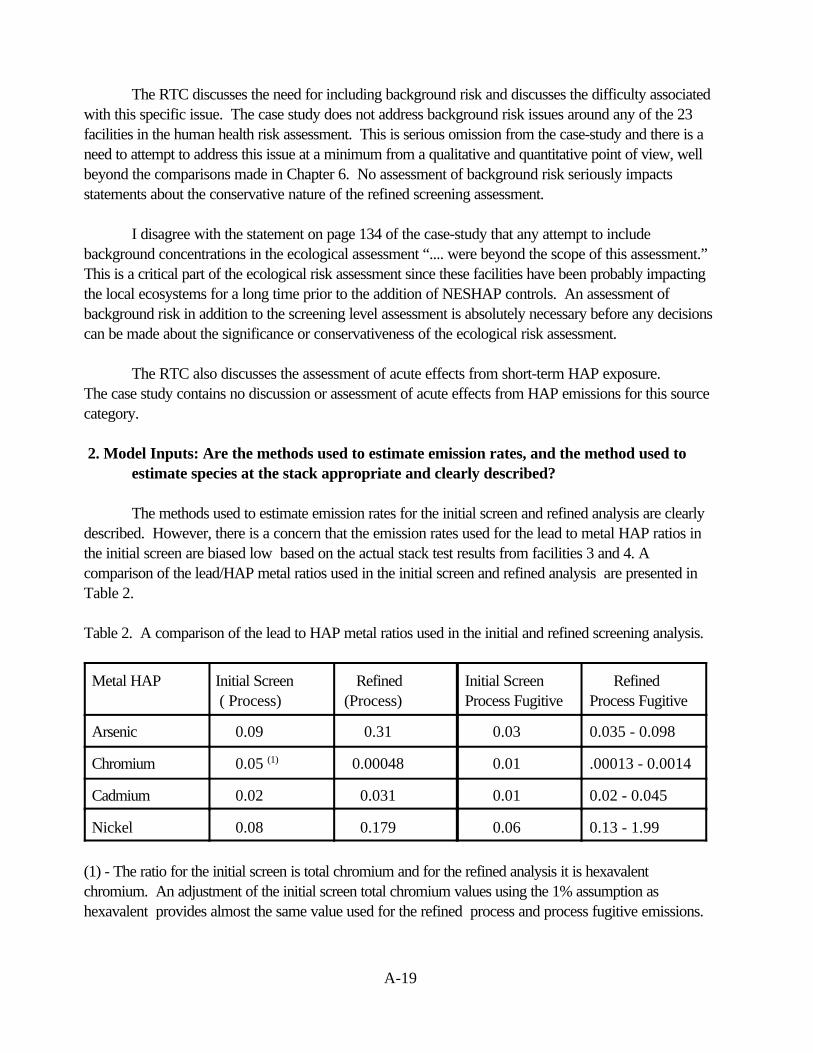
A-19
The RTC discusses the need for including background risk and discusses the difficulty associatedwith this specific issue. The case study does not address background risk issues around any of the 23facilities in the human health risk assessment. This is serious omission from the case-study and there is aneed to attempt to address this issue at a minimum from a qualitative and quantitative point of view, wellbeyond the comparisons made in Chapter 6. No assessment of background risk seriously impactsstatements about the conservative nature of the refined screening assessment.
I disagree with the statement on page 134 of the case-study that any attempt to includebackground concentrations in the ecological assessment “.... were beyond the scope of this assessment.” This is a critical part of the ecological risk assessment since these facilities have been probably impactingthe local ecosystems for a long time prior to the addition of NESHAP controls. An assessment ofbackground risk in addition to the screening level assessment is absolutely necessary before any decisionscan be made about the significance or conservativeness of the ecological risk assessment.
The RTC also discusses the assessment of acute effects from short-term HAP exposure.The case study contains no discussion or assessment of acute effects from HAP emissions for this sourcecategory.
2. Model Inputs: Are the methods used to estimate emission rates, and the method used toestimate species at the stack appropriate and clearly described?
The methods used to estimate emission rates for the initial screen and refined analysis are clearlydescribed. However, there is a concern that the emission rates used for the lead to metal HAP ratios inthe initial screen are biased low based on the actual stack test results from facilities 3 and 4. Acomparison of the lead/HAP metal ratios used in the initial screen and refined analysis are presented inTable 2.
Table 2. A comparison of the lead to HAP metal ratios used in the initial and refined screening analysis.
Metal HAP Initial Screen ( Process)
Refined (Process)
Initial ScreenProcess Fugitive
Refined Process Fugitive
Arsenic 0.09 0.31 0.03 0.035 - 0.098
Chromium 0.05 (1) 0.00048 0.01 .00013 - 0.0014
Cadmium 0.02 0.031 0.01 0.02 - 0.045
Nickel 0.08 0.179 0.06 0.13 - 1.99
(1) - The ratio for the initial screen is total chromium and for the refined analysis it is hexavalentchromium. An adjustment of the initial screen total chromium values using the 1% assumption ashexavalent provides almost the same value used for the refined process and process fugitive emissions.

A-20
The differences between the arsenic and nickel ratio values used in the initial screening analysisand the refined screen analysis clearly undermines the conservativeness of the initial screen risk resultspresented in Tables 2.4a and 2.4b. If the stack test results from facilities 3 and 4 are post NESHAP ,then a decision should have been made to use those results in the initial screen versus the median valuesestimated from Background Information Document (Table B1.3 - Appendix B).
The Agency should consider requesting stack emissions test for process and process fugitive atsome of the facilities in order to obtain better emission estimates for use in the screening assessment case-study.
The Agency carefully needs to reevaluate the fugitive emissions rates since the modeled annualconcentrations of lead with fugitives in Appendix C are unrealistically high for facilities 3 and 4. There is a need for site specific information on the effectiveness of fugitive emissions control after the implementationof the NESHAP housekeeping standards. Fugitive emissions from this source category are an issue andneed to be carefully evaluated. In 1987, there were two exceedances of the National Ambient Air QualityStandard (NAAQS) for lead (1.5 ug/m3) in the vicinity of a secondary lead smelter. The elevated leadconcentrations ( 2.46 and 1.61 ug/m3) at the monitor were the result of malfunctioning emissions controlequipment and fugitive emissions from the plant. Monitoring of lead around the plant was increased bythe addition of two downwind monitors. The plant upgraded the process emission controls, but theconcentrations of lead were still elevated, but below the NAAQS when compared to other monitoringsites in the State. Further investigations concluded that fugitive emissions from the plant were a problemthat needed to be addressed. The entire facility was enclosed and placed under negative pressure. HEPA filters were installed on all air exchange units and other housekeeping practices were required. This facility currently has 16 emission points. The annual geometric mean of lead at one monitoring sitedropped from a high of 0.71 ug/m3 (1987) to 0.06 ug/m3 (1993) after all of the facility upgrades were inplace. The highest quarterly average measured at the two remaining monitoring site in 1996 were 0.06ug/m3. These two monitors are located 275 meters from the facility fence line. The third site wasshutdown at the end of 1995.
The incorporation of this type of information into the case study and the refined screening analysis will result in a more informed risk management decision for this source category.
3. Models: Does the risk assessment use appropriate currently available dispersion models atthe screening level and at the more refined level of analysis? Are the models appliedcorrectly? Given the state of the science, does the risk assessment use an appropriatemultipathway model? The assessment uses the IEM-2M model, with somemodifications. Is the IEM-2M model appropriate for use in this regulatory context? With regard to the modification and application of the model, did EPA appropriatelymodify the model for use in this risk assessment, and did the Agency apply the modelcorrectly? Is there another model or another approach, that is available at this time thatEPA should consider?

A-21
The decision to use facilities 2,3,4, 13 because these represented facilities with the highest excesscancer rate and highest hazard index based on the initial screening produced a situation where only simpleterrain would be used in the refined analysis. This process could have biased the modeling results tounderestimate impacts at other facilities, with complex terrain, which were not designated for refinedanalysis. The Agency should reevaluate if any of the 29 facilities are in areas of complex terrain.
The exposure inputs into the IEM-2M and IEUBK model are conservative which is clearlyacknowledged by the Agency throughout the case study. The Agency should continue refine the riskassessment using site specific information as discussed in many of my other comments. There is a strongneed for another iteration to refine the case study which is acknowledged by the Agency in section 6.7. The case study should remain a Pre-Decisional Document until the next iterative refinement is conducted. OAQPS should work diligently with State and Local Health and Environmental Departments, the Agencyfor Toxics Substances and Disease Registry, Industry and the EPA Regions to further refine the casestudy. This step is absolutely necessary before any decision about unacceptable risk is made for themajority of the facilities identified in the case-study. The uncertainties associated with the fugitive emissionparameters are the driver for a more detailed risk assessment within the source category. This need is discussed by CRARM on page 23 of the RTC.
4. Choice of Receptors: The Agency identifies the home gardener as the appropriate receptorto estimate risk to the residential population and the farmer to embody high end riskestimates. Are these receptors appropriate for this task?
The receptors identified by the Agency are appropriate and adequately represent the maximum individualrisk (MIR) concept which is discussed in the RTC.
5. Ecological Risk Assessment: given the currently available methods, are the models used forthe ecological assessment appropriate? Are they applied correctly? Are the ecologicalbenchmarks appropriate?
The case study does not include a discussion of other ecological stressors (e.g. criteria pollutants) whichmay have an impact on the surrounding ecosystem. The effect of this omission on reducing theconservativeness of the ecological risk screen is mentioned on page 147. However, any refined analysisof ecological risk is going to have to account for these additional ecosystem stressors, especially theeffects on terrestrial plants exposed via direct contact with criteria pollutants (in this case sulfur oxides) inthe ambient air.
6. Health Risk Assessment: Given available dose-response information, is the hierarchypresented in the assessment appropriate (see especially footnote #6, section 2.21)?

A-22
The hierarchy presented in the assessment is appropriate. I agree with the use CaliforniaEnvironmental Protection Agency values over HEAST values for all of the reasons outlined in footnote#6.
For each chemical included in the assessment is the choice of dose response assessmentappropriate?
Overall, the choice of the available dose-response data used in the case study is appropriate. Ihave concerns about the elimination of HAPs from consideration in the case study if they have noavailable cancer or noncancer public health values. Seven organic HAPs are eliminated fromconsideration in the case study. It is difficult to assess the impact of the elimination of these organicHAPs from the case study. However, the effect may be negligible since emission rates in Appendix B forthe organic HAP emissions omitted from consideration are low. The Agency should consider thedevelopment of default or surrogate values based on the available toxicity information or structure activityrelationships with other HAPs which have dose response data. .
Why is propanol identified as a HAP in the case study? I can not locate it on the list of 188HAPs identified by the Clean Air Act.
The application of the use of risk ranges for benzene and 1,3-butadiene in the initial screen needsto be discussed. Do the cancer risk results presented in Table 2.3 use the high or low end of the range?
The use of only 25% of the inhalation unit risk estimate for nickel subsulfide needs to be explainedin greater detail, since it will have a large impact on the total cancer risk estimates in the case-study.
Are the dose response assessments appropriately incorporated into the assessment?
Yes, the available dose response assessments are appropriately incorporated into the assessment,with a few exceptions as noted above.
7. Uncertainty and Variability Assessment: Did the assessment use the appropriate currentlyavailable methods to identify the variables and pathways to address the uncertainty andvariability assessment? Are the methods used to quantify variability and uncertaintyacceptable? Are there other, more appropriate methods available for consideration?

A-23
8. Results Presentation: Does the document clearly present and interpret the risk results? Does it provide the appropriate level of information? Do the figures and tables adequately present the data? Do the formats provide for a clear understanding of the material?
It is very difficult to present such a large amount of information in a clear and concise manner. The case study does a good job of presenting and interpreting the risk results. The discussion of theinitial inhalation screening results should include a discussion of how the maximum and minimum riskvalues presented in Table 2.3 were defined. The Agency should indicate that they are simply the rangeof estimates determined for all 29 facilities.
The Agency should consider using a consistent cancer risk expressions in the narrative of thecase study. The lay reader will be confused by the constant interchangeable expressions of cancer risk. For example, the use of the expression eight in a ten thousand should be changed to 800 in a million. Thiswill allow the lay reader to place the results into the context of the less than one in one million expression which appears in the Act and throughout the case study.
The identification of the key issues and assumptions are clearly identified in the result sections ofthe the initial inhalation screen, the refined multipathway screen , the variability and uncertainty analysis,and the ecological screening assessment. The addition of a discussion about a few key issues concerningthe lack of a background risk analysis and the effects of the adjustment of the nickel inhalation unit riskestimate could be added to the key issues identified in Section 3.3.2.
The tables and figures used throughout Section 4 provide a concise and well thought outapproach for the presentation of variability and uncertainty for each scenario evaluated. They allow thereader to evaluate the broad spectrum of risk and the impacts of the various exposure parameters usedin the refined multipathway risk assessment. These tables and figures significantly enhance thecomprehendability of the variability and uncertainty assessment results. The inclusion of the pointestimates in Tables 4.5 and 4.6 is an excellent way to concisely present information to the risk manager. The tables and figures provide the risk manager with the ability to view the broad spectrum of riskpredictions, which includes the average exposed individual (AEI), the adjusted maximum individual riskand the maximum exposed individual (MEI).
Tables 6.1 and 6.2 provide a good overview summary of the final results for the refined
multipathway risk assessment. I have some concerns about Section 6.2.1 Comparison of ModeledConcentrations with Measured Environmental Concentrations. As discussed through out my commentsthis section can be greatly enhanced and another iterative refined multipathway risk assessment stepwhich relies on more site specific information should be added to the case study.
The effort which will be needed to gather the relevant information for this next step should not beconsidered overwhelming or beyond the scope of the case study. It should be considered as a necessary refinement which needs to be conducted before the case study becomes a public document. The

A-24
discussion in section 6.2.1.1 needs to be expanded. The pre-NESHAP monitoring data from New Yorkindicates that the NAAQS for lead can be exceeded and that the stringent control of fugitives can result ina dramatic lowering of ambient concentrations of lead and probably other metal HAPs in the vicinity ofsecondary lead smelters. Table 6.7 should be modified by locating the distance to the monitors andinclude a brief discussion of siting issues (e.g. predominate downwind or upwind monitoring location)before any comparisons are made. The same point can be made for the comparisons of the surfacewaters concentrations. However, the Agency does appropriately acknowledges that the comparisons inTable 6.8 are not meaningful.
Section 6.2.1.5 needs to be expanded since it provides information on an excellent biomarker forpotential exposure (e.g blood lead levels). The inclusion of this type of information would greatly enhancethe case study. The CDC and State Health Departments should be consulted to find out if there is anyother information on blood lead levels in children who reside in communities that are in close proximity tosecondary lead smelters.
In summary, there is a strong need to gather and evaluate more site specific information using therisk assessment tools presented in the case study before any final risk management decisions can be madefor this source category. The case study should undergo another iteration before being released to thepublic.
Editorial Notes:
The overview presented in section one the case study is very good
Section 2.2 needs to include the chemical abstract service registry numbers and the identity of thechemicals as they are primarily identified in Section 112 (b) of the Clean Air Act (e.g. 2 -methylphenol is identified by 112 (b) as o-creosol, iodomethane should be identified as methyl iodide,etc.)
Table 6.8 - the units (ug/l) are missing.
A-25
5. Dr. Dale HattisClark UniversityWorcester, MA
Below are my updated responses (following discussion at the meeting) to the questions posed tothe Secondary Lead residual risk review Subcommittee:
Charge Question 1. Overall--Is the methodology that the Agency applied in this riskassessment consistent with the risk assessment approach and methodologypresented in the Report to Congress? (EPA-453/R-99-001)? Are the assumptionsused in this risk assessment consistent with current methods and practices?
I have very considerable difficulty making an appropriate response to the first part of thisquestion. I was not provided with a copy of the Report to Congress that is specifically referred to. Fairlyrecently, I was sent a copy of a substantial earlier SAB review of that document from which I can makesome inferences about the risk assessment approach and methodology that was presented in the Reportto Congress. However there does seem to be very significant commentary in the SAB review of the needto “validate” models, and to conduct appropriate analyses of the population variability of regulated risksand give a fair estimation of the uncertainty in the variable risk distributions. The current document,though very extensive in many ways, does not seem to reflect a serious effort to assemble and analyze asubstantial body of post-MACT emissions and exposure (e.g., community blood lead) information that could be juxtaposed with the emissions estimates made in the early 1990’s when the MACT standardswere set. The documents do not appear to describe a systematic search for such information, do notpresent the specific emissions information that was collected, and do not document in nearly adequatedetail the specific analyses that were done with the emissions information. There is no visible attempt tojuxtapose model projections of either emissions or exposures (e.g., for blood lead) with such data and toform the bases for an updated set of distributional exposure and risk projections.
There is a great deal of discussion in the SAB review, and in the EPA residual risk assessment, ofthe need to conserve scarce EPA resources by limiting the analysis in various ways (by structuring theanalysis in a series of tiers beginning with generic conservative assumptions, restricting the HAPs covered,the facilities examined in detail, etc.). Sadly the implementation of this approach does not seem to havelead to an economical analysis that can be said to have succeeded in producing meaningful insights intothe likely level of risk posed to real people in the immediate vicinity of these facilities. There is no moreexpensive analysis than an analysis that does not produce results that can meaningfully inform publicpolicy choices. The screening level analysis as it stands probably is adequate to focuses EPA’s attentionon lead and a few metallic HAP’s, and away from the great majority of organic HAP’s, but that resultprobably could have been foreseen with considerably less work than appears to have been devoted tothis project. Certainly something is seriously amiss when the document can show projections ofessentially lethal blood lead levels (200 ug/dL and above) for the case where fugitive emissions areincluded—and very significant blood lead levels (68 ug/dL) even without fugitives for one of four modeledfacilities—without that leading to some attempt to pursue the issue with blood lead observations or some

A-26
deeper conclusion than that the fugitive emissions estimates are probably “conservative”. Maybe they are“conservative”, but then to blithely exclude both the fugitive emissions and all exposures to lead entirelyfrom the “variability/uncertainty analysis” without further reappraisal of the source of the apparentestimation problem seems to turn the screening results on their head. Any “tiered” analysis procedure thatleads the investigators to exclude such a major source of concern as lead from important parts of thesecondary lead smelter analysis has a serious fundamental problem, at least as implemented here. This isparticularly true in the light of the fact that emissions of the other HAP’s that are included in thevariability/uncertainty analysis are estimated as ratios to lead.
The context of this residual risk analysis is a long term possible consideration of the need for emissionscontrol measures that go beyond the available control technology-based standards that were mandated inthe first round of controls following the passage of the 1990 iteration of the Clean Air Act. Almost bydefinition, when you are building the informational basis for considering the need for technology-forcingmeasures, you need to have data that would be sufficient to support decisions that might involve verysubstantial technical and economic restructuring of an industry. At the same time, the context alsoinvolves considering the possibility that appreciable residual risks remain for people in communitiessurrounding these facilities that mean that the promise of the 1990 Act to provide an ample margin ofsafety for health protection is still not being fulfilled ten years after the promise was made. This contextdemands that EPA take the time and devote the resources needed to fairly assess the current publichealth problem posed by these facilities. Otherwise no actions based on such an analysis are likely tosurvive Congressional and Judicial oversight.
Charge Question 2. Model Inputs--Are the methods used to estimate emission rates, andthe method used to estimate species at the stack appropriate and clearly described?
Briefly, no. The primary data should be provided in the document and the detailed analysis stepsshould be given in sufficient detail to allow an informed reader to reproduce the analysis. Myunderstanding from the extra documents that have been provided to me in the context of thevariability/uncertainty analysis is that the existing data base is not extensive—consisting apparently of three“runs” (of undetermined duration) measuring Lead, Arsenic, Cadmium, and Nickel emissions fromvarious stacks at two different facilities—constituting in all about 168 separate measurements if I havecounted correctly. For a large number of other HAP’s and other facilities my understanding is that thereis some additional information available from recent (post 1990) measurements for four facilities, but thatthe primary sources of estimates of emissions is the 1994 Background Information Document for settingthe MACT standards. The bases of these estimates and their applicability to current conditions is notdiscussed.
In addition, the authors should take a more creative approach to assembling other types of datarelevant to emissions than they have apparently considered. For example, to estimate fugitive emissions,one clue might be air exposure levels measured for workers in this industry by OSHA industrialhygienists. [Some helpful background on the history of air and blood lead levels in the industry can befound in a couple of past reports I helped do for the Office of Technology Assessment—Goble et al.,(1995, 1983)]. Such air levels, when combined with general ventilation assumptions and baghouse

A-27
capture efficiencies, should provide some basis for new estimates of at least some process fugitiveemissions, as should air measurements from environmental monitoring conducted near the facilities, andchildren’s blood lead measurements that are routinely collected by agencies in several states, and whichmay therefore be available for communities near the facilities under study. In addition, it should allowsome estimation of fugitive emissions from other parts of the process than the battery breaking andmaterials handling steps that are presently included as contributing fugitives in the current process flowdiagram. What happens to the air around the workers working at other steps than the first two? Is itcaptured and treated to remove some dust? With what efficiency? Additionally, it would seem sensibleto make systematic comparisons of observed community air levels with those predicted from thedispersion models.
Charge Question 3. Models--Does the risk assessment use appropriate currently availabledispersion models both at the screening level and at the more refined level ofanalysis? Are the models applied correctly? Given the state of the science, doesthe risk assessment use an appropriate multipathway model? The assessment usesthe IEM-2M model, with some modifications. Is the IEM-2M model appropriate foruse in this regulatory context? With regard to the modification and application ofthe model, did the EPA appropriately modify the model for use in this riskassessment, and did the Agency apply the model correctly? Is there another modelor another approach, that is available at this time that EPA should consider?
These questions cannot be fairly answered from the information provided. There was just not asufficient presentation of the assumptions inherent in the IEM-2M model for me to evaluate it. I wasprovided with very large spreadsheets of the model, but without a great deal more time and appropriatedocumentation of the structure and assumptions built in to the model it is just impossible for me to make asensible evaluation. I don’t know and cannot easily infer, for example, how it differs from othermultimedia models that are available, such as CALTOX.
Charge Question 4. Choice of Receptors --The Agency identifies the home gardener as theappropriate receptor to estimate risks to the residential population and the farmerto embody high end risks. Are these receptors appropriate for this task?
I’m not at all convinced of this. My impression is that the chief pathway responsible fortransferring gasoline air lead to children when gasoline lead was still allowed was a dust-hand-mouthpathway. It seems to me that this pathway, together with more recent information on the efficacy ofcommunity soil cleanups in reducing blood lead levels, needs to be evaluated as part of any fuller analysisof the issue. I understand EPA’s desire to exercise its IEM-2M models, and this should certainly be onepart of the analysis, but key issues need to be addressed, such as the persistence of dust contaminatedwith lead and other metallic HAP’s in neighboring communities, rates of exchange between outdoor dustand indoor dust, and the magnitude and duration of exposures that result from emissions and deposition ofindestructible metallic compounds in urban and other communities.

A-28
Charge Question 5. Ecological Risk Assessment Given currently available methods, arethe models used for the ecological assessment appropriate? Are they appliedcorrectly? Are the ecological benchmarks appropriate?
This is not my area of expertise, and I have not evaluated this portion of the document.
Charge Question 6. Health Risk Assessment--Section 3.4.1 of the Report to Congressidentifies several data sources that the Agency would draw upon for choosing doseresponse assessments to be used in residual risk assessments. The Report alsostates that EPA will develop a hierarchy for using such sources. Given availabledose-response information, is the hierarchy presented in this assessmentappropriate (see especially footnote #6, section 2.2.1)? For each chemical includedin the assessment, is the choice of dose response assessment appropriate? Are thedose response assessments appropriately incorporated into the assessment?
I do not have the cited Report to Congress, and I have not thoroughly evaluated this aspect of thedocument. However I would suggest that at least for lead, where there are quantitative estimates ofrelationships between children’s blood lead levels and IQ, that the results be taken to estimate likelyindividual and population aggregate impacts in quantitative terms—how much relative deficit for howmany kids. Additionally, I believe that cancer impacts can and should be evaluated in populationaggregate terms as well as in terms of risks to particular percentiles of the estimated exposuredistributions. This would allow decision makers in Congress and EPA to assess the public healthproductivity of investments made under the residual risk provisions of the Clean Air Act.
Charge Question 7. Uncertainty and variability assessment--Did the assessment useappropriate currently available methods to identify the variables and pathways to address in the uncertainty and variability assessment? Are the methods used toquantify variability and uncertainty acceptable? Are there other, more appropriatemethods available for consideration?
Although there are some glimmers of creative analysis of data in the uncertainty/variability portionof the effort (e.g. the attempt to calculate metal HAP/lead ratios over a longer time period than coveredby the directly observations), the current analysis is very disappointing in numerous ways. First, thescope and objectives of the analysis fall far short of what any sensible decision maker will wish to have inorder to make informed choices under the residual risk mandate of the 1990 Clean Air Act. To fulfill themandate of the Clean Air Act, EPA needs to not only be confident that it has addressed the mostsignificant hazards posed by the industry under study, but to define what it means by an “ample” or“adequate margin of safety” in distributional terms, (e.g. X level of probability of harm of a particular typeor severity for the Yth percentile of the exposed population with Z degree of confidence—See forexample Hattis and Anderson, 1999; Hattis and Minkowitz, 1996). EPA then needs to develop ananalysis that addresses the likely real variability and fairly appraised uncertainty for at least the HAP’s andexposure pathways that are thought to pose the greatest potential for public health harm for the industriesstudied In the present context, omission of the variability and uncertainty of lead exposures and risks, and

A-29
omission of some analysis of the uncertainty in fugitive dust emissions and exposures means that theanalysis is substantially irrelevant to some of the most important concerns that arise from the earlierscreening and multipathway efforts.
The failure to distinguish variability from uncertainty in the present analysis almost guaranteesconfusion. Variability and uncertainty are different things and require different techniques for estimation. It is a shame that the individual variability in estimated exposures is essentially completely neglected eventhough existing dispersion modeling techniques, combined with data on the population distributionsaround the studied facilities, could readily produce such information. This information would seem centralto the required analysis. The fact that it is not undertaken, at least at this stage in the development of theproject, suggests that the current variability/uncertainty analysis is largely a placeholder for some latereffort that, it is hoped, will be planned as a more central part of some future analysis.
A second major problem is that the current analysis does not follow existing EPA guidelines onthe documentation and presentation of distributional analysis. Those guidelines, drawn up in part atworkshops that I attended, emphasize that the model itself and derivations of distributions used in theanalysis must be transparently presented in sufficient detail that a reviewer can reproduce them. I haverecently received several spreadsheets that contain portions of the model, but in the very limited timeavailable I have not been able to get them running sufficiently to even examine the model structure,distributional assumptions, and correlation/dependency assumptions made. The document itself shouldhave included as an appendix not the endless display of results for each stack, but the spreadsheet modelequations, and the mathematical form of the distributional assumptions that were used.
In summary, in the present effort, the uncertainty/variability analysis appears to have been anafterthought, perhaps undertaken at a late stage in the development of the principal results. Unlessanalyses of variability and uncertainty are undertaken integrated into the warp and woof of the primarystudy, they will likely continue to be unsuccessful and unsatisfactory in illuminating the major issuesinvolved in the evaluation of the real choices facing EPA decision makers, Congress, and the public.
Some more technical suggestions can be made for pursuing the probabilistic analysis in futurework:
a) In assessing the distribution of metal HAP to lead ratios, the analysts should explore thepossibility that some air exhaust streams might be systematically different than others. Inparticular arsenic, which is more volatile than the lead and most other inorganic HAP’smay appear in larger concentrations relative to lead in some air streams than othersdepending on the temperature of the process and exiting gas. The data should beexamined to see if such mechanism-based expectations are borne out in the availableobservations. If so, then some metal HAP to lead ratios could be varied across processstreams (and perhaps across facilities) to reflect the mechanism-based associations.
b) In representing the interindividual variability of exposure factors such as consumption ofdifferent kinds of produce and fish, the analysts should seek data to quantify variability
A-30
observed on different time scales than the 1-3 days that are typical for direct dietarystudies. Some downward adjustment clearly needs to be made to calculate variabilityover longer time scales from shorter term data. However, because some dietarypreferences are likely to be relatively consistent characteristics for individual people, it isnot reasonable to estimate long term dietary exposure variability either by simplyassuming that each separate 1 or 3-day period is a random draw from an observedpopulation distribution of consumption. Some data bearing on the difference in effectivevariability in fish consumption inferred for longer- vs shorter time frames is reviewed inHattis et al. (1999).
c) In Section 4.4 the document should clearly explain the implications of the assumptionsthat are being made. For example, the statement is made on p. 127 that because of datainsufficiency, no analysis of correlation among emission parameters and exposure factorswas undertaken. The statement should be clarified to say that the correlation could notbe undertaken because the data wasn't available for it.
Charge Question 8. Results Presentation--Does the Agency's document clearly present andinterpret the risk results? Does it provide the appropriate level of information? Dothe figures and tables adequately present the data? Do the formats provide for aclear understanding of the material?
As discussed above, the presentation of the basic inputs and methodology is very far from being
adequate to provide a document that is even transparent enough for a thorough review, let alone adocument that appropriately assess the uncertainty and variability for decision-maker and the dependenceof the results on key sets of assumptions. Without documentation of the derivation of the results and theiruncertainties, the results cannot be appropriately conveyed to decision makers and the public. Moreoverthe neglect of real population variability in both exposures and risks deprives the reader of importantinformation that is needed to arrive at risk management judgments.
References
Goble, R. and Hattis, D. “When the Ceteris Aren’t Paribus---Contrasts between Prediction andExperience in the Implementation of the OSHA Lead Standard in the Secondary Lead Industry,”Report to the Office of Technology Assessment, U.S. Congress, by the Center for Technology,Environment, and Development, Clark University, July, 1995.
R. Goble, D. Hattis, M. Ballew and D. Thurston, “Implementation of the Occupational Lead ExposureStandard,” Report to the Office of Technology Assessment, Contract #233-7040.0, MIT Centerfor Policy Alternatives, CPA 83-20, October 1983.
A-31
Goble, R. and Hattis, D. “When the Ceteris Aren’t Paribus---Contrasts between Prediction andExperience in the Implementation of the OSHA Lead Standard in the Secondary Lead Industry,”Report to the Office of Technology Assessment, U.S. Congress, by the Center for Technology,Environment, and Development, Clark University, July, 1995.
Hattis, D., and Anderson, E. “What Should Be The Implications Of Uncertainty, Variability, AndInherent ‘Biases’/’Conservatism’ For Risk Management Decision Making?” Risk Analysis, Vol.19, pp. 95-107 (1999).
Hattis, D., and Minkowitz, W.S. “Risk Evaluation: Criteria Arising from Legal Traditions and Experiencewith Quantitative Risk Assessment in the United States.” Environmental Toxicology andPharmacology, Vol. 2, pp. 103-109, 1996.
Hattis, D. Banati, P., Goble, R., and Burmaster, D. “Human Interindividual Variability in ParametersRelated to Health Risks, Risk Analysis, Vol. 19, pp. 705-720, 1999.

A-32
6. Dr. Michael J. McFarlandEngineering DepartmentUtah State UniversityRiver Heights, UT
Residual Risk AssessmentSecondary Lead Smelter Source Category
SAB Charge Question # 1:
Are the methods used to estimate emission rates and the method used to estimate species at thestack appropriate and clearly described?
Initial Inhalation Risk Screening
FINDINGS
The method used to estimate the HAP emission rates involve the use of several data sets from theBackground Information Document from which the MACT standards were initially derived. The first dataset (Table B.1.1) includes estimate emission rates (in metric tons/year) for each of the three emission sourcesincluding: 1) process stack emissions (both organic and metal HAPs), 2) process fugitive stack emissions and3) fugitive emissions. The second data set (Table B.1.2) includes ratios of specific organic HAP emissionsto total hydrocarbon emissions from the stacks of three (3) types of secondary lead smelter furnace types. The final data set includes the median metal specific HAP to lead ratios (Table B.1.3) as well as the totalmetal HAP to lead ratio for each of the three emission sources that include: 1) process stack emissions, 2)process fugitive stack emissions and 3) fugitive emissions.
Although Table B.1.3 indicated that the reported data were the median metal (total and specific)HAP to lead ratios, it is unclear whether Tables B.1.1 or B.1.2 were also reporting median values or anotherstatistical measure (e.g., mean or average) of the sampling data. Moreover, since the purpose of the initialinhalation screening analysis was to employ a lower tier conservative approach to screen those HAPs thatdid not pose a significant human health risk, it would seem more appropriate to use the upper limit of aconfidence interval (e.g., 95%) of the HAP ratios for estimating emission rates rather than mean (or median)values to estimate inhalation risk. Given the wide range in HAP ratios found in the data tables, use of anupper confidence limit would provide greater protection from deletion of species that may, in fact, representa significant human health and/or ecological risk. The same argument can be applied to the use of a meanor median total HAP emission rate (Table B.1.1) for estimating specific HAP emission rates. The large rangein reported data suggests that a more defensible risk screening evaluation would be achieved by selecting anupper limit of a prescribed confidence interval of emission rates for input into the general inhalation risk modelrather than the use of an average emission rate.

A-33
Another concern regarding the inhalation risk model inputs was the specific management of the acidgas data. Both chlorine (Cl2) and hydrogen chloride (HCl) emissions were included in Table B.1.2 andtreated as organic HAPs in the emission rate calculations. The concern with regard to the acid gas datastems not only from the placing of the inorganic acid gas emissions in the table for organic HAPs (i.e., TableB.1.2) but, it is also unclear as to whether the total organic HAP process emission rate data (Table B.1.1)includes the contribution from the acid gases.
Although there are some concerns regarding the input data quality for the initial inhalation riskscreening, the mathematical equations used to estimate the specific HAP emission rates are fundamentallysound. The specific metal HAP emission rates (EHAP) from each of the three emission sources (i.e., processstack emissions, process fugitive stack emissions and fugitive emissions) were estimated by substituting theestimated total metal HAP emission rates (metric tons/yr) for each emission sources (ETMH - Table B.1.1),the median metal HAP to lead ratio (RHAP – Table B.1.3) and the total metal HAP to lead ratio (RTMH –Table B.1.3) into Equation 1.
EHAP = (ETMH)/RTMH) (RHAP) Eq. 1
whereEHAP = Individual metal HAP emissions (i.e., antimony)ETMH = Total metal HEP emissionsRTMH = Ratio of total metal HAP emissions to lead emissionsRHAP = Ratio of individual metal HAP emissions from lead emissions.
The specific organic HAP emission rate (EVOC) from the process stack emission source was estimatedby substituting the estimated total hydrocarbon emission rate (metric tons/yr) from Table B.1.1 (ETHC) andthe ratio of specific organic HAP to hydrocarbon emissions (RVOC – Table B.1.2) into Equation 2.
EVOC = (ETHC)(RVOC) Eq. 2where
EVOC = Individual organ HAP emissions ETHC = Total hydrocarbon emissionsRVOC = Ratio of individual organic HAP emissions to total hydrocarbon emissions.
RECOMMENDATIONS
Although the data input descriptions were, in general, well written, there are several areas wheresignificant improvement could be made. The specific recommendations for this section of the review includethe following:
The data in Tables, B.1.1 and B.1.2 can be improved by explicitly stating the statistical measurementparameter being reported.
Consideration should be given to the use of upper confidence limits (of the HAP ratios) as inputs tothe inhalation risk model.

A-34
The text should provide greater clarity as to how the acid gas data are being managed.
To provide clarity in the use of the mathematical relationships, quantitative examples should beinserted into the text that illustrate the use of Equations 1 and 2.
An example should be provided (perhaps in an appendix) illustrating how raw emission data fromeach emission source (i.e., process stack emissions, process fugitive stack emissions and fugitive emissions)is managed to generate final risk numbers.
Multipathway Analysis
FINDINGS
The method used to estimate emission rates for the multipathway analysis included the use ofcompliance reports from stack tests for specific facilities (i.e., Facilities 2, 3, 4 and 13 – Table C.1.1) as wellas the EPA database developed in the Background Information Document (BID). The MACT standardsrequire that facilities report, at a minimum, both the total lead and total hydrocarbon emission rates. ForFacilities 3 and 4, additional compliance testing was conducted that allowed specific organic and metal HAPemissions to be estimated. These facility-specific emission estimates were then used to generate specificemission ratios including: 1) organic HAP to total hydrocarbon ratio and 2) metal HAP to total lead ratio.
To estimate specific organic HAP emissions for Facility 2, the organic HAP to total hydrocarbon ratiogenerated from Facility 3 data was multiplied by the total hydrocarbon emission rate from Facility 2.Similarly, to estimate specific organic HAP emissions for Facility 13, the organic HAP to total hydrocarbonratio generated from Facility 3 data was multiplied by the total hydrocarbon emission rate from Facility 13.Since diethylhexyl phthalate and naphthalene were not measured in Facility 3-stack test, EPA databaseinformation was used to generate the organic HAP to total hydrocarbon ratio for these species for Facility2 and 13.
To estimate specific organic HAP emissions for Facility 3 and 4, averages from three (3) stack testmeasurements for each facility were reported (adjusted for nondetects). Since diethylhexyl phthalate andnaphthalene were not measured in Facility 3-stack test, EPA database information was used to generate theorganic HAP to total hydrocarbon ratio for these species. It was not possible to estimate diethylhexylphthalate and naphthalene emissions in Facility 4 since the MACT standards do not require total hydrocarbonmeasurements for reverbatory furnaces.
To estimate specific metal HAPs for process emissions for Facility 2, the metal HAP to total leadratio developed for Facility 3 was multiplied by the lead emission rate found in the Facility 2 compliancereport. Similarly, for Facility 13, the metal HAP to total lead ratio developed for Facility 3 was multipliedby the lead emission rate found in the Facility 13 compliance report. Facilities 3 and 4 reported specific metalHAP emission rates for process emissions. It should be noted that Facility 3 did not test for antimony andFacility 4 did not test for manganese or mercury. The emissions of these metal species were estimated usingEPA database information to develop the metal to lead ratio, which was then multiplied by the lead emission

A-35
rate from the facility compliance report.
To estimate specific metal HAPs for process fugitive emissions for Facility 2, the average of thefugitive metal HAP emissions to total lead ratio developed for Facility 3 and 4 was multiplied by the leademission rate found in the Facility 2 compliance report. Similarly, for Facility 13, the average of the fugitivemetal HAP emissions to total lead ratio developed for Facility 3 and 4 was multiplied by the lead emissionrate found in the Facility 13 compliance report. Facilities 3 and 4 reported specific metal HAP emission ratesfor fugitive process emissions. Finally, the Background Information Document (BID) estimates for fugitiveemissions used in the initial inhalation screening were employed in the multipathway analysis.
With regard to metal speciation, 99% of the chromium emissions is assumed to be Chrome (III). Thisassumption was based on one furnace measurement and the fact that the secondary lead smelters operateunder a reducing environment. For mercury speciation, it was assumed that all of the evaluated mercury wasin the form of divalent particulate mercury (HgO).
Although the multipathway analysis employs site-specific data, it is unclear whether the comparabilityof the data been evaluated. In other words, in many cases, EPA database information is used in conjunctionwith site specific data to generate specific HAP emission rates with no verification that the data sets containelements of equivalent or similar quality. The absence of data quality evaluation leads to several fundamentalquestions that are summarized as follows:
What criteria were used to determine when Facility 3 data should be used for estimating organic HAPemissions from Facility 2 and 13 versus EPA database information?
Are emission estimates provided in Table C.1.1 averages, median or upper limits of a confidenceinterval?
How many samples comprise the emission values reported in Table C.1.1? Can ranges or standarddeviations be given?
Do the state compliance stack permits specify the number of samples to be taken? In other words,are all data of a known quality?
Descriptions of Facility 3 and 4 stack tests indicate that three stack test were conducted toestimate organic HAP emissions. Does this mean three samples?
It is unclear as to why the average of Facility 3 and 4 process fugitive metal HAP emissions wereused to derive a specific metal HAP to total lead ratio for Facility 2 and 13.
RECOMMENDATIONS
Since HAP emission rates were generated using various facility data sets as well as the EPAdatabase, the most important general recommendation is that the Agency verifies the comparability of the

A-36
data. In other words, use of data of varying quality in the risk assessment models would generate finalrisk numbers of questionable value. Therefore, the quality of each data set should be compared anddocumented prior to having its elements used in the risk assessment. Secondly, since there is no specificprotocol employed for estimating the HAP emissions from each of the four facilities, it is stronglyrecommended that quantitative examples be inserted into the text that illustrate each unique approach. Finally, additional recommendations regarding data inputs to the multipathway model include thefollowing:
a. Specify the type of statistical measurement being reported in Table C.1.1 (i.e., means, median,upper confidence limits, etc.).
b. Specify the number of samples that comprise the emission values reported in Table C.1.1 andprovide both ranges and standard deviations.
c. Provide an explanation as to why the average of Facility 3 and 4 process fugitive metal HAPemissions were used to derive a specific metal HAP to total lead ratio for Facility 2 and 13rather than some other statistical measurement.

A-37
7. Dr. Paulette MiddletonRAND Center for Environmental Sciences & Policy
Boulder, CO
1. Links to Other Key EPA Activities Dealing with HAPs
Other EPA activities that have direct bearing on the residual risk assessments should be noted in thedocument. These activities demonstrate that EPA is actively improving on the current framework. While thecurrent approaches used in the document under review here are acceptable in the current timeframe, manyof their shortcomings may be addressed as a result of these other ongoing efforts. Acknowledgment of this could be done upfront in the introduction wherediscussion of model appropriateness and future assessments are mentioned. They also could be placed atthe end of the report where next steps are sited and where it is noted that SAB comments will be consideredin next steps.
2. TRIM
In particular, it should be noted that EPA/OAQPS is developing TRIM as a flexible, state-of-the-artsystem for evaluating multimedia chemical fate, transport, exposure and risk of HAPs. The recent SAB/Environmental Models Subcommittee review of this effort found it to be effective and innovative and outlineda number of recommendations for improvement. When TRIM becomes available, it should provide an improvement over the modeling framework used in the currentreport.
3. SAB/EPA Workshops on the Benefits of Reductions in Exposure to Hazardous Air Pollutants
As stated in the description of these up and coming workshops, "HAPs have been the focus of anumber of EPA regulatory actions, which have resulted in significant reductions in emissions of HAPs. EPAhas been unable to adequately assess the economic benefits associated with health improvements from theseHAP reductions due to a lack of best estimate dose-response functions for health endpoints associated withexposure to HAPs and also due to a lack of adequate air quality and exposure models for HAPs. EPA isconducting two workshops to develop a proposed methodology to generate estimates of the quantified andmonetized benefits of reductions in exposure to HAPs. The first workshop will focus on developing best estimates ofdose-response functions that relate changes in HAP exposure to changes in health outcomes. The secondworkshop will focus on (1) integrating these dose-response functions with appropriate models of HAPconcentrations and human exposure and (2) translating these into economic benefits that would estimate changes in health risks resulting from regulations that reduce HAPemissions." The results of these workshop discussions, in particular the reviews of models and methods,could well provide additional valuable input to this ongoing evaluation of the residual risk review anddevelopment of next steps.
4. Questions and comments on the current study
A-38
a. Missing HAPs
Have all of the potential important HAPs been included in the screening analysis? Can understandingof the processes be used to better substantiate the list of HAPs considered for screening?
Why are the acid gases not included in the analysis?
Organics are not considered beyond the screening. Can this screening result be better substantiated?
b. Emission rates
The development of emission rates for individual HAPs needs to be more clearly described. Hereare some outstanding questions that need to be answered before providing a reasonable evaluation ofappropriateness of the emissions estimates used in the modeling (both screening and multi-pathway).
What exactly was measured at the representative sites and how were the measurements done? Howvalid are the extrapolations of representative measurements to annual averages? How valid are the extrapolations to other facilities?
Are the processes leading to the emissions fairly constant throughout the year? How variable are the fugitive emissions at a given site?
5. Modeling
The model choices have been defended reasonably well. However, as noted above, improvementsare needed and may be forthcoming with TRIM. Models seem to have been applied appropriately.However, several concerns are noted below regarding the assumptions in the modeling that could have animpact on the overall analyses.
6. Screening
There needs to be more convincing discussion of the representativeness of the building andmeteorology general parameters chosen.
Are the facilities being considered reasonably represented by the general building and stackconfigurations assumed? Stack height and building heights are particularly important variables.
Is the meteorology of the sites being screened adequately represented by the standard worst casemeteorology? Wind speeds and directions relative to the selected receptor sites are particularly importantvariables.
7. Multi-pathway

A-39
Again, are the assumptions about standard building parameters reasonable? The assumptions aboutbuilding parameters are retained in the multi-pathway analysis. This is probably reasonable provided theactual facilities are similar in construction.
What particle parameters and sizes are assumed in the modeling? This is very important to clarifysince the ISCST3 does show different results for assumptions about larger particle sizes. If all of the particlesconsidered are assumed to be less than 10 microns, then I doubt there is any difference in deposition and concentration patterns from those for the gases. This needs to be clarifiedsince the exposures are sensitive to assumptions about particle size and particle versus gas.
8. Receptors
A suggestion. The ISCST3 can produce patterns of concentrations and deposition at regulardistances from the source. It might be helpful to provide these patterns as well as analysis at specificreceptors. Patterns help provide an assessment of where risks might be important in the future. Is this type of analysis thought to be beneficial to the overall residual risk assessment?
9. Model/measurement comparisons
The results presented seem to be reasonable for the air models. However, the other comparisonsare difficult to understand and are being discounted. The way that these comparison are being presenteddetracts from the work and tends to make one more skeptical of the findings.
10. Uncertainty
It would be helpful to even more explicitly tie uncertainties to well-defined next steps.

A-40
8. Dr. George E. TaylorBiology Department
George Mason University Fairfax, VA
General CommentsG.E. Taylor, Jr.
A Case Study Residual Risk Assessment Secondary Lead Smelter Source Category
The SAB review of the draft Residual Risk Report to Congress was a challenge in light of the reportbeing framed in very general way. In my participation of that review, I was uneasy about the reviewsolely because I was unable to see the trajectory for the analysis in a quantitative sense.
The Secondary Lead Smelter Source Category analysis is a giant step forward and helps me be moreconfident that the analyses will be quantitatively based and linked to the literature on human health andecology. The Agency is commended for pursuing that tack.
There are a number of general issues that are of concern however in the draft document and thepresentations at the meeting. These general issues are outlined. Collectively, these suggest to me that thecurrent draft is well short of being scientifically defensible with respect to natural resources and ecology.
1. Attention to Ecology and Natural Resources
The attention to ecology and natural resources was a major concern in the Residual Risk Report toCongress, and I strongly encouraged the Agency to place ecology at parity with human health in thiseffort. Some assurances were made in that review exercise that ecology would be given moreattention.
In the case of the Secondary Smelters, the case for ecology and natural resources is again diminishedby the Agency. The effort is clearly well behind the analysis being conducted for human health and isnot at a stage where this reviewer can be comfortable with a positive review. In short, while we havemade some progress, there is insufficient analysis conducted to meet the legal mandate of the CAA.
This issue is a major one and warrants high visibility. My recommendation is for the committee toexhort the Agency to be more forthcoming with resources in order to get the task done in ascientifically sound manner.
2. Not a Risk Assessment But a Risk/Hazard Characterization
The title of the Agency’s report is A Case Study Residual Risk Assessment: Secondary LeadSmelter Source Category. Risk Characterization. Following the original review of the draftResidual Risk Report to Congress, this reviewer was expecting an analysis that was more nearly a

A-41
risk assessment. What was presented was a hazard characterization for ecology and naturalresources, and the analysis was preliminary at best. Moreover, the Agency stated that no furtherwork toward a risk assessment would be conducted for ecology and natural resources.
As a consequence, the current analysis does not meet the legal mandate of the CAA.
3. If this is the final product for this source category…
Because this report establishes a methodology for analyzing 179 source categories, it is veryimportant that this report be done right. In light of the Agency’s commitment to a preliminary hazardcharacterization in lieu of what is the legal mandate, I am concerned that this document will establisha precedent for all subsequent analyses so that ecology and natural resources are poorly addressed. As it now stands, the methodology produces a high number of false positives and fails to incorporatesome pathways and receptors that are the most sensitive ones in an ecosystem with respect topersistent and bioacccumulated chemicals.
The proposed methodology is not likely to be of value in assessing the residual risk to ecology andnatural resources and is likely to leave the risk manger with a formidable problem in handling thepurported risks.
4. Linkage to Risk Manager
The shortcomings of the current report are presented above and are worthy of attention. Above andbeyond these shortcomings is the linkage of the risk assessment to the task of the risk manager. There is no discussion of how the risk manager is likely to use this assessment.
It is recommended that a framework for the risk management be made a part of this report. Thesame recommendation was made for the previous report (Residual Risk Report to Congress) by theSAB.
5. Conclusion That the Analysis is Conservative
This assertion is stated throughout the report, and I am not in full agreement with that distinction withrespect to ecology and natural resources. My rationale is twofold. Most importantly, the omission offish eating birds (top carnivores) removes one of the top predators in terrestrial/aquatic systems andone of the receptors that is highly valued (charismatic megafauna). In my analysis of the report,mercury would easily have been identified as a risk had this trophic level been included; it probablywould have been the dominant risk. The argument that predatory fish are included does not sufficesince predatory birds consume predatory fish, so there is an additional trophic level forbioaccumulation. The argument that data do not exist to evaluate this receptor is not accurate.
The second point is more tangential. The analysis for ecology identified a number of HAPs withconcern in the screening exercise. Most, if not all, of these are likely to be “false positives”. For

A-42
example, antimony is screened as a risk, but I have never read a paper dealing with ecotoxicology toplants of antimony. The citation for the benchmark is an old paper published in an agricultural setting. The point is the false positives are almost to the point of being “silly” and can be easily discounted bythe risk manager. This “silliness” might establish a precedent for ecology and natural resources thatwould permeate all 179 analyses.
I would much prefer to see a screening exercise that covers the potential serious risks (e.g.,bioaccumulated HAPs in top carnivores) than marginal risks, and I think that is the objective of thelegal mandate.
6. HAPs That are Persistent and Bioaccumulated
The tenet is stated that any HAPs that is persistent and bioaccumulated is automatically carried to thenext level (multipathway not refined analysis?). I think those terms are confusing (e.g., if it isbioaccumulated, by definition it is persistent; some persistent HAPs may not be bioaccumulated). Iam not certain what this statement means.
Most HAPs by definition are persistent. Lead, Ni, Hg, etc…are elements and by definition arepersistent. Most of the HAPs are also accumulated to some extent simply because many arelipophilic either as elements or in the complexes they form. So, there must be a threshold forbioaccumulation. Does that have to be a trophic enhancement factor of 2?
7. Background Concentrations
This issue was raised in the previous review and I encourage the Agency to re-think its position. While there may be some rationale for assuming a zero background concentration in the screeningexercise, there are some major liabilities even at this level for pursuing this line of reasoning.
Even more difficult is the next level of analysis in which exposure-response functions might begenerated. Given that many of the HAPs are elements and are common geochemical constituents inthe crust, not addressing this issue is likely to undercut the conclusions significantly from a scientificbasis.
Specific Comments
This review supplements the forgoing analysis, which is more general. The comments herein are morespecific and either supportive of the above or individualistic.
1. More refined analysis. The argument is presented often about the next iteration, which is arefined analysis. The structure and refinements to be done in that analysis are not presented. Isthis to be a full risk assessment?
2. Screening for chronic effects protects for acute effects. While I can appreciate why shortcuts areused, I am not certain that this position is true. I can think of several cases where chronic

A-43
exposures would not protect against acute exposures. For example, if you had a fugitive emissionof a toxic chemical with a high 1 hour exposure, over the course of the season that exposurewould not be significant but may very well compromise some receptors (e.g., radiochemicals,ozone). Can you provide a citation that supports the position?
3. Background concentration. This issue was raised in the previous review, and I am not in favor ofthe position being taken in the report. While the screening exercise may opt to assume that thebackground concentration is zero, this is NOT a conservative decision. In fact, it maysignificantly negate many HAPs (particularly those that are elements common in the earth’s crust)from ever accumulating enough to exceed a threshold. I recommend that the Agency re-consider its position on background exposures, particularly asone moves on to more refined analyses. From my perspective, this omission negates theAgency’s position that the analysis is conservative. Moreover, I do not think you can conduct amore refined analysis without including a background exposure for either human health orecology. But, in the case of the latter, it is clearly critical.
4. Modifications to the multipathway model. It is noted that the analysis used the multipathwaymodel in the Mercury Report to Congress for this modeling effort but that the model wasmodified on a HAPs-specific basis. Those modifications are important to state since they couldunderpin the analysis.
5. Dispersion modeling. The report uses a dispersion model (Gaussian) to handle the off-sitetransport of HAPs. The guts of the model are not presented and key aspects are missing thatmight help skeptics relate to the code. Is deposition velocity (Vg) the operative parameters fordriving deposition? If so, what nonlinear relationship is being used? Is particle size a part of theemission data? If not, then Vg cannot be used.
6. Figure 3.1 is missing but discussed in the text.7. Plant Characteristics. Plants appear to be one of the critical parts of the model as the exposure to
humans is preceded by deposition to leafy vegetable. This part of the code needs to be reviewedfor such features as leaf area index, Vg, seasonality of phenology, yield, foliar leaching, etc. Mysuspicion is that none of these factors are part of the model, so it is unclear that the model handlesthe atmosphere-leaf transfer very well.
8. Figure 3.3. It is customary in compartment model diagrams to show compartments/statevariables as boxes and transfers as ovals or some other geometric shape. They mean verydifferent things. Also, is the half-life (T1/2) part of the model for HAPs? If so, a table of T1/2’sshould be published. This is an important parameter.
9. The argument is presented that the mercury concentration in fish is a function of the mercuryconcentration in water. Is that true? I do not see how this could be coded into an aquatic modelwith multiple trophic levels? The mercury concentration in water must be processed throughseveral intervening trophic levels before it gets to fish and thereafter it is bioaccumulated as afunction of the trophic level.
10. The summary for all sections is not a summary. The summaries relate the methodology but notthe summary of using the mythology for this exercise on lead smelters.
11. What are the endpoints in ecology and natural resources? In human health it is the farmer and hisfamily. Clearly state the endpoints for this hazard characterization.
12. It is stated that the structure and function of the ecosystems is an endpoint. I have difficulty with

A-44
that position.13. It is stated that rare and endangered species are an endpoint. Again, I have trouble with that
position.14. Are receptors the same as assessment endpoints?15. Why are carnivorous terrestrial wildlife omitted? These are likely to be the “charismatic
megafauna” of most interest and the ones at greatest risk form HAPs that are bioaccumulated.16. EC50 derivation. The argument is presented to derive some benchmarks from EC50’s by
dividing by a factor of 10. I am not certain that is justified. I would prefer to simply leave thebenchmarks as stated in the literature rather than deriving some. This will eliminate a number offalse positives and will help add credibility.
17. Summing HQ’s. As noted above, this approach needs to be done with extreme caution.18. Bioaccumulation. It is stated that bioaccumulation is assumed to be 100%. I am not sure what
that means. Does that mean 100% of the HAP in the system is bioaccumulated to the nexttrophic level? If so, what BAF is used?
19. All chemicals without data are analyzed further. This is difficult to imagine. But, if there areinsufficient data to conduct a screening analysis, how could there possibly be enough data to do amore refined analysis?
20. Fugitive Emissions. While I understand that fugitive emissions can be important, I am skeptical ofthe methodology that shows the entire assessment being driven by fugitive emissions. From myknowledge of ecology and human health, that simply does not compute.
21. False positives for ecology. This is where I think the methodology suffers, and I recommend thatsome remediation is in order. The ecology risk section concludes that several HAPs –antimony,chromium, and nickel- are a significant enough risk to warrant further study. I am not aware ofany report for antimony in plants that would warrant that conclusion and probably the same forchromium and lead and nickel. The creation of many false positions that are unrealistic will be selfdefeating in the long run.
22. False negatives for ecology. In contrast to the above concern, there are some HAPs that aremissing for methodological reasons. The most notable is mercury, which can be traced to theabsence of top carnivores in terrestrial ecosystems.
23. Appendix F, Table F.2. The equation for calculating dry deposition simply does not work asportrayed. The units do not cancel out to arrive at the correct units.
24. Appendix E. The hazards with fugitive emissions are an order of magnitude higher than thosewithout fugitive emissions. This seems inordinately high.
25. Distance for dispersion. The distance used for dispersion and assessment needs to be defined. Clearly it is not the distance traveled by the HAPs after emission, which for some of these (e.g.,mercury) is global.
26. Air stagnation events. How are air stagnation events handled in the model?27. Criteria pollutants. While I understand some of the legal mandate for this analysis, I suspect that
some of the most significant residual risk from these categories will be the impact of the criteriapollutants, notably ozone and PM2.5. This liability is best presented up front so the caveats arewell articulated.

A-45
9. Dr. Rae ZimmermanRobert Wagner Graduate School of Public Service
New York University New York, NY
Basis for Case Study selection
The rationale for the choice of secondary lead smelters as a case that will become a prototypeis only briefly described and should be expanded. Why is it significant and prototypical? Is it like otherindustrial emission sources?
The change in capacity or use of these smelters might be one reason for their being a significantcase. The discussion on p. 5 alludes to a reduction in the number of lead smelters nationwide in 1999over 1993-1994 levels. Capacity is really key, however. Has the capacity of the remaining smeltersincreased? Is the need for them changing, i.e., what is the quantity of lead-acid batteries needingrecycling?
One very strong reason for its selection is that it is central to the debate over electric cars (seedebate in Science, 1995). The contribution of lead smelters to air pollution in the course of recyclinglead-acid batteries is part of the overall assessment of the relative environmental impact of electric carsover the conventional automobile. Thus, the relative risk associated with secondary lead smeltersaddresses a much broader health debate.
Methodological Issues
A number of methodological issues need greater explanation or some references to justifymethodological approaches and choices.
a. p. 6 – the expediency of using a surrogate standard for all metals is clear, but why was leadselected?
b. p. 9 – what is the justification for using inhalation analysis for all HAPs rather than theingestion route also, e.g., via soil deposition and subsequent entrainment in exposureareas? p. 14 also notes that inhalation pathway is the most important route of exposure,which needs a short explanation.
c. Decisions are made throughout the analysis, and should be explained. For example:d. p. 9 How is the subset of facilities selected – just high emission rate rather than mix of
HAPs? In other words a facility with a high emission rate may have low concentrationsof HAPs.
e. p. 10 Receptor locations chosen as the point of maximum air concentration – was thisregardless of the number and type of HAPs?
f. p. 10 How were the three HAPs and three pathways selected for the variability anduncertainty analyses?
g. Is there any way of identifying which of the HAPs present in the emission stream are likely toreact with one another to increase or reduce residual risk?
h. The rationale behind the use of very numerous assumptions/defaults at any given point in theassessment is difficult to evaluate, e.g., p. 24, 32. On p. 24, for example, there are

A-46
numerous simplifying assumptions for the inhalation screening analysis. How do theseassumptions interact with one another and affect the results?
i. In areas where information is not known, can’t the Agency undertake some scenario buildingto at least identify some of the boundaries? For example:
1) Geographic differences in the location of the smelters and the effects of this variationon exposure are not included, but need to be factored in somehow into theanalyses. For example, p. 24-25 the building downwash or terrain options forSCREEN3 were not used because site specific information was not available.This is important, however, since the report specifically identifies that the use ofsuch options can result in higher values for air pollutants. What about usinglocational scenarios?
2) Where information on d/r for HAPs was not available the HAPs were excluded fromthe analysis (p. 33) – Does the uncertainty analysis at least include the fact that“HAPs for which quantitative d/r assessments are not available” were excludedfrom the quantitative analysis?
j. p. 30 The technique for aggregating cancer risks is additivity. The drawbacks of this yet theneed should be clearly stated, as well as how additivity is likely to affect the results.

B-1
APPENDIX B
A MORE DETAILED DESCRIPTION OF THE SAB PROCESS
The SAB Staff recruited Dr. Philip Hopke, Chair of the Chemistry Department at ClarksonUniversity, to serve as Chair of the Subcommittee. Working with the Chair, other SAB Members andConsultants, Agency Staff, and submissions from the American Industrial Health Council (AIHC) and theNatural Resources Defense Council (NRDC), the SAB Staff compiled a list of over 30 scientists andengineers who were subsequently surveyed for their interest in and availability for participating in thereview. The Chair and SAB Staff made the final selections for membership on the Subcommittee andassigned different members lead and associate responsibilities for each of the Charge Elements.
The Agency transmitted review materials to the Subcommittee members in late January. Inmid-February SAB Staff convened a conference call with Agency staff to identify gaps in the informationsent to the Subcommittee and to identify areas that the Agency should be prepared to clarify at the face-to-face meeting.
In addition, public comments were received from the follow parties and distributed to theSubcommittee Members before the meeting:
a. Association of Battery Recyclers and the Lead Industries Association:Robert Steinsurtzel and Michael Wigmore – Swidler Berlin Shereff Friedman (Counsel
for Association of Battery Recyclers)Jane Luxton and Cynthia A.M. Stroman -- King and Spalding
(Counsel for Lead Industries Association, Inc.)Dr. Teresa S. Bowers -- Gradient CorporationRussell S. Kemp -- Lake Engineering
b. Cambridge Environmental Inc: Dr. Edmund Crouch and Dr. Stephen Zemba
c. Indiana Department of Environmental ManagementMr. Michael Brooks
d. Residual risk Coalition:Dr. Elizabeth Anderson -- Sciences International, Inc.
e. Sanders Lead Company, Inc:Mr. Billy Nichols, Dames & Moore
On March 1-2, 2000 the Subcommittee convened in the Main Auditorium of EnvironmentalResearch Center at the USEPA laboratory in Research Triangle Park, NC. Minutes of the meeting areavailable. Each member of the Subcommittee submitted written comments on the Charge questions forwhich he/she had lead responsibility. Two members of the public (Dr. Elizabeth Anderson and Dr.Teresa Bowers, see a and d above) provided comments on the technical issues under discussion. Following a full day of discussion, Subcommittee members drafted and reviewed responses to the Chargequestions.

B-2
The Subcommittee members were given the opportunity to refine their pre-meeting commentsfor their inclusion in the Appendix A to the Advisory. These written materials formed the basis of thisSubcommittee Advisory that was drafted by the Chair and the SAB Staff and subsequentlymodified/approved by the Subcommittee. [An SAB "Advisory" is a term-of-art used to denote review ofan Agency document that is still undergoing development, in contrast to an SAB "Review" of a finalAgency product.] The Subcommittee-approved draft was sent to the SAB Executive Committee (EC)for action during a publicly accessible conference call on May 1, 2000. At that meeting the EC approvedthe Advisory, subject to final approval by designated vettors, Dr. Kenneth Cummins and Dr. LindaGreer.

C-1
APPENDIX C
GLOSSARY
AEI Average exposed individualATSDR Agency for Toxic Substances and Disease RegistryBID Background Information DocumentCalEPA California Environmental Protection AgencyCAAA Clean Air Acts Amendments of 1990CDC Centers for Disease Control and PreventionCRARM Commission on Risk Assessment and Risk ManagementHAPs Hazardous air pollutantsHEAST Health Effects Assessment Summary TablesHI Hazard indexHQ Hazard quotientIEM-2M Indirect Exposure MethodologyIRIS Integrated Risk Information SystemISCST3 Industrial Source Complex Short Term model MACT Maximum achievable control technologyMEI Maximum exposed individualMIR Maximum individual riskNAAQS National Ambient Air Quality StandardNATA National Air Toxics AssessmentNESHAP National Emission Standards for Hazardous Air Pollutants NRC National Research CouncilOAQPS Office Air Quality Planning and StandardsPAHs Polyaromatic hydrocarbonsQSAR Quantitative Structure-Activity RelationshipsPBTs Persistent bioaccumulative toxicantsRfD Reference DoseRTC Agency's 1998 Report to CongressSAB Science Advisory BoardTRIM Total Risk Integration ModelTRVs Toxicity Reference ValuesU&V Uncertainty and variability USEPA United States Environmental Protection Agency