united water united water idaho
TRANSCRIPT

• • • • • • • • • • • • • • • • • • • • • • • • • • • • • • • • • • • • • • • • • • •
United Water ®
United Water Idaho 8248 West Victory Road
PO Box 7488 Boise, ID 83707-1488
telephone 208 362 1300 facsimile 208 362 1479
HYDROGEOLOGY, GEOCHEMISTRY, AND WELL CONSTRUCTION
OF THE
TREASURE VALLEY HYDROLOGIC PROJECT MONITORING WELL #1,
ADA COUNTY, IDAHO
Oct. 22, 1999 Final Report to the TVHP Technical Advisory Committee
Tre astll'e Valley
Hydrologic Project
by
R. Dittus, J. Allred, and E. Squires United Water Idaho
• • • • • • • • • • • • • • • • • • • • • • • • • • • • • • • • • • • • • • • • • • •
CONTENTS
TABLE OF CONTENTS ......................................................................... .i
INTRODUCTION ............................................................................................................ 1
WELL CONSTRUCTION .............................................................................................. 1 Drilling ....................................................................................................... I Monitoring well design ............................................................................ 1 Completion ................................................................................................ 2
LITHOLOGY ............................................................................................................ .. 2 Grain-size percentage log ......................................................................... 3 Geophysical logs ...................................................................................... 4
GROUNDWATER CHEMISTRY .......................................................... 5
WATER-LEVEL MONITORING ............................................................... 7
SUMMARY AND CONCLUSIONS ............................................................. 7
LIST OF FIGURES
FIGURE 1. LOCATION MAP
FIGURE 2. DIAGRAM OF WELL CONSTRUCTION, TABLE OF WATER CHEMISTRY
FIGURE 3. GEOPHYSICAL AND LITHOLOGIC LOGS
FIGURE 4. GRAIN SIZE PERCENTAGE LOG
FIGURE 5. OCCURRENCE OF WOOD, IRON AND CALCITE CEMENT
FIGURE 6. HYDROGRAPH OF MONTHLY PIEZOMETER MEASUREMENTS
FIGURE 7. BOISE RIVER STREAMFLOW HYDROGRAPH
FIGURE 8. HYDROGRAPHS OF ZONES 1 AND 4
1

• • • • • • • • • • • • • • • • • • • • • • • • • • • • • • • • • • • • • • • • • • •
APPENDIX A.
APPENDIX B .
APPENDIX C .
APPENDICES
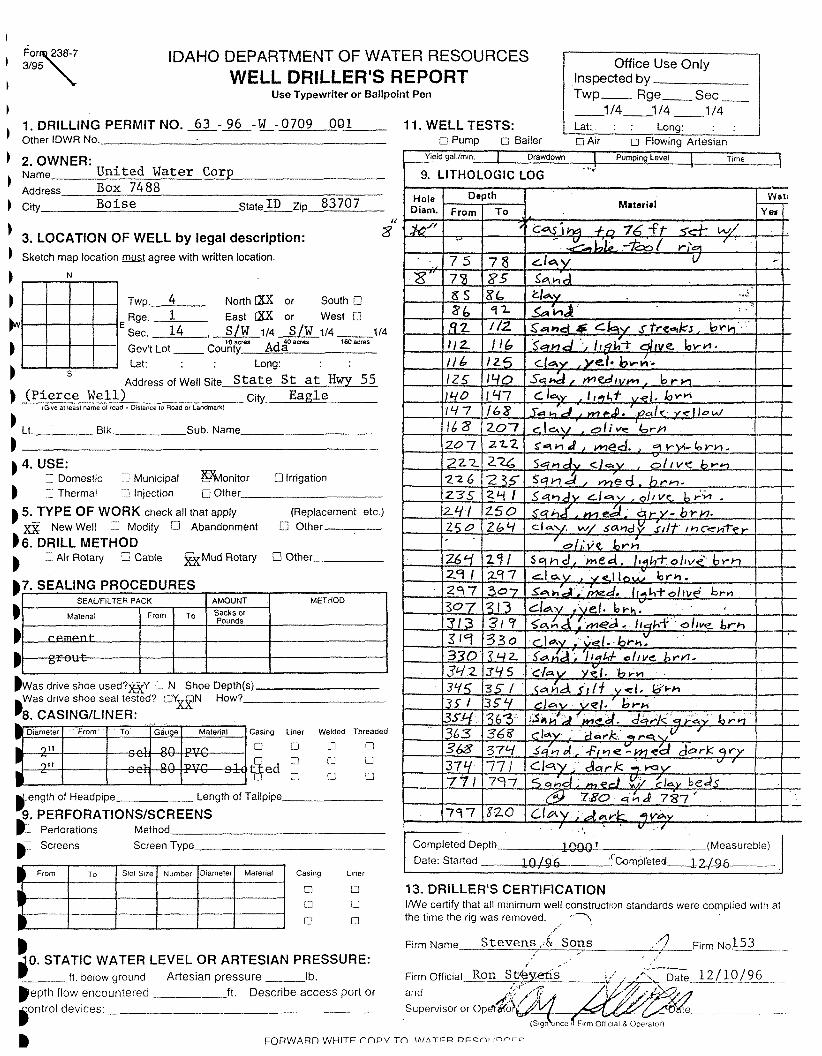
WELL DRILLERS REPORT
LABORATORY REPORTS OF WATER QUALITY
WATER-LEVEL RECORDER CHARTS

INTRODUCTION
In December 1996, United Water Idaho, Inc. (UWID) completed a 1,005-foot deep exploratory test-well in west Boise, Ada County, Idaho (legal location T4N, RlE, NW1
/ 4, SW1/ 4, SW 1/4, Sec. 14). The location ofthis well, now named the Treasure Valley
Hydro logic Project # 1 Monitoring Well (TVHP # 1 ), is shown on Figure 1. The well was originally drilled to evaluate for potential aquifer units that might be developed for municipal water supply for the City of Boise. Although an accumulated thickness of 100 feet of potentially productive aquifer sands were located, a series of water sampling piezometers completed to four depths showed some of the water quality to be less than desirable. Owing to elevated concentrations of dissolved iron, UWID decided against developing a municipal supply well at this site. Instead, UWID worked with the land owner, Mr. Bill Pierce, and with Mr. Hal Anderson of the Idaho Department of Water Resources (IDWR) who negotiated and secured a 50-year access agreement to the well in order to preserve it as a long-term observation well. The well is completed as a piezometer nest (Figure 2.), and is currently monitored by IDWR to document the annual water-level fluctuations in four sub-aquifer zones.
The well has been donated to the State ofldaho for continuing water chemistry and water-level monitoring. This report presents details of well construction, lithology, water chemistry, and water-level data obtained as a result of the drilling, completion, and monitoring of this well. UWID recognizes the need for a network of designated (longterm) observation wells in the Boise River Valley and has put special effort into preparing this report for the Treasure Valley Hydrologic Project.
WELL CONSTRUCTION
Drilling
The drilling of the exploratory test-well commenced in late October 1996 by Ron Stevens of Stevens & Sons Drilling, Inc. An 8-inch (.0250-inch wall) steel casing with drive shoe was drilled-and-driven through the unconsolidated sands and gravels of the present day Boise River floodplain using a Bucyrus Erie 22-L cable-tool drill. The oversized drive-shoe was stopped in a clay layer at 76 feet as a surface seal. A "Portadrill" direct mud-rotary rig was used to advance an 8-inch diameter bore from 76 to 1,005 feet below ground level (total drilled depth reached on 11/22/96). Drill cuttings, collected by the driller at 5-foot intervals during drilling, were examined in the Boise State University Department of Geoscience's soils lab.
Monitoring Well Design
UWID Gcoscicnces ran natural gamma-ray, single point resistance, and normal resistivity geophysical logs (Figure 3) in the mud-filled borehole on 11/22/96. Several sand units between 15 and 25 feet in thickness, and separated by clay units of variable thicknesses, were delineated below the bottom of the steel casing (76 feet) and above 362 feet. Below 362 feet, mudstone accounts for 90 percent of the drilled section with the

• • • • • • • • • • • • • • • • • • • • • • • • • • • • t t t t t t t t t t t t t t t
remaining 10 percent consisting of thin (2-to-10-foot thick) fine sand lenses oflow water production potential.
Based upon a comparison of the borehole geophysical logs with drill-cuttings from the bore, and taking into account distinct color differences within the drilled section, a "nest" of piezometers was constructed as follows .
Completion
The well was completed with 2-inch diameter schedule-80 flush-joint PVC pipe and factory-slotted PVC screens. Fresh drilling mud was circulated throughout the borehole prior to installation of flush-joint steel grout pipe (2-inch diameter) and four piezometer tubes. The viscosity of the drilling mud was lowered to facilitate pouring of the filter sand through the mud, from land surface (a Marsh Funnel viscosity of about 35 seconds was achieved). Caving sediments filled or bridged the borehole up to 410 feet sometime after geophysical logs were run and prior to well construction. A 53-foot thick cement pressure grout seal was placed on top of this bridged zone. This cement seal serves as a base for the piezometer nest .
Four, 2-inch diameter piezometers with slotted intervals were placed in the well as shown in Figure 2. Filter-pack was poured from the surface through the annular space between the drilled hole and the plastic casings. A weighted tag-line, inside the grout-pipe, was used to verify placement. Calculated volumes of cement grout were pumped through the grout pipe, at the top of each filter packed zone so that the grout was forced upwards . Between each grouting episode, the grout pipe was flushed with just enough water to displace the grout remaining in the pipe and to clear the pipe so a tag-line could be dropped through it. The process was repeated as alternating seals and filter envelopes were installed. Well construction is diagrammed in Figure 2. The uppermost seal is a highsolids (>21% bentonite by weight) bentonite grout. Powdered bentonite ("Industrial 200") from Teague Mineral Products pits in Adrian Oregon was used in this grout.
LITHOLOGY
Beneath the TVHP #1 site, the 30 foot thickness ofriver gravels (present day Boise River floodplain) are underlain by alternating sand and silty clay layers of variable thickness to 370 feet below ground level (bgl) (Figure 2). Three distinctly different color intervals, above 360 ft., were evident in the drill cuttings. Color changes occur at 167 ft. and 260 ft (Figure 3).Between about 370 feet and 500 feet, the silty clay steadily grades into a thick section of mudstone. A color change within the mudstone, from gray above to dark gray below occurs at about 700 feet. Sand lenses are present within the mudstone section between 780 feet and 900 feet.
The thick mudstone section encountered in the TVHP #1 well is probably correlative to the mudstone facies of the Terteling Springs Formation as mapped by Dr. Spencer Wood on the Boise North quadrangle (Spencer H. Wood, personal
2
t
• t
• t
• • • • • • • • • • • • • • • • • • • • • • • • • • • • • • • • • • • • • •
communication, 1999). The geologic section from 5 l 5-to-365 feet bgl is interpreted as continuous deposition in an overall coarsening upwards sequence. This gradual change is best shown on the open hole electrical logs of Figure 3 and to a lesser extent (because of sampling inconsistencies) on the grain size percentage log (Figure 4). This 150-foot thick section may represent a regressive pro-delta gradation to delta sands of the Glenn's Ferry or Pierce Gulch sands as they are currently being differentiated by Dr. Wood. His evolving conceptual model , envisions the upper 360 feet of sand dominated section as meandering braided stream deposits overlaying a pro-delta sequence. The thin, discontinuous, fine-grained sand lenses within the thick mudstone section may be shoal deposits or fining upwards turbidite deposits from shoreline sands avalanching off of the delta front .
Grain-size percentage log
A grain-size percentage log of the TVHP #1 drill cuttings is shown on Figure 4 . Boise State University graduate students Brian Cavanaugh and Mike Guilbert, of the Department of Geosciences, analyzed the drill cuttings mineralogy and grain-size distribution. In an attempt to be objective with respect to sample description, each five foot sample interval was wet-washed through a stack of U.S. Standard sieves and the percentage retained, by volume was measured. The silt and clay fractions were estimated by settling the wash-through water, and delineated from one another by setting time in a graduated cylinder .
The grain-size log cannot be directly correlated, by depth, with geophysical logs (or lithologic logs based on geophysics) owing to the "lag time" between when the cuttings were first drilled and when they arrived at the surface and also because of mixing within the drill stream. In addition, cavings from the borehole wall, and fine sand entrained within the drilling fluid affected the cuttings. The effects of the downhole mixing of drill cuttings within the mud stream increase with depth. For example, the thin sand layers, obvious on the geophysical logs between 770 feet and 900 feet, were not differentiable in the cuttings .
The grain-size percentage log covers the interval from 60-to-600 feet, and omits the lower 400 feet of the drilled section, which is dominantly olive gray, silty clay-tomudstone with a few interbedded sand lenses, two-to- IO feet thick. The total cumulative thickness of the sand section within the mudstone totals about 40-feet. These beds stand out clearly on the geophysical logs, but are not well represented in the drill samples because of mixing within the mud-stream as cuttings are pumped to the surface. within the drill stream combine to effectively mask the identity of these sediments .
The complete lithologic log, inferred from cuttings analysis and geophysical logs, is shown on Figure 3. Four distinguishable color intervals are noted. The grain-size log shows the major color changes to be shifted downward due to cuttings return lag-time. In the lithologic log of Figures 2 and 3, adjustments have been made using the geophysical logs to show the color changes at the interpreted actual depth .
3
The sediments are predominantly arkosic sands derived from the granitic rocks of the Idaho Batholith, with medium-to-coarse-grained sand dominating above 362 feet. Sixty percent of the grains pass through a #18 US Standard sieve and are retained on a #30 sieve. The sands are poorly sorted (well graded), and grains range from angular to sub-angular. The ratio of quartz to feldspar, which comprise essentially 100% of the sand grains, varies from 80/20-to-40/60. Comprising less than 5 percent of the samples are muscovite, biotite, and lithic fragments of igneous intrusive rocks, usually in trace amounts.
Sand-sized pieces of wood are present in the cuttings below 175 feet. Wood comprises up to 5 percent of most samples between 175 feet and 362 feet. The wood is typically black in color and first appears in the sticky clay at 175 feet with the transition from oxidized to reduced sediments. Trace amounts of wood are present throughout the lower drill cuttings, but some or all of these may be re-circulated cuttings from the overlying section.
Iron oxide cementation, and staining of sand grains, occurs down to a depth of 365 feet (the top of the silty clay/ mudstone transition). In the upper oxidized zone (above 175 feet) up to 30% of the sand grains are coated with a red, rusty colored crust which acts as a cement. The mineral pyrite is also present as a cementing agent and grain coating below the oxidized/ reduced boundary at 175 feet bgl.
Calcite cementation, identified by reaction with dilute hydrochloric acid, was found on the very fine sand grains within the mudstone between about 450 feet and 650 feet. The major mineralogic variations with depth are diagrammed on Figure 5.
Geophysical logs
Natural gamma-ray, single-point resistance, and 16-inch and 64-inch normal resistivity logs were run in the open, mud-filled borehole to 1005-feet on 11/22/96. Logs were run immediately after the drill column was removed from the hole. A temperature log was not run because the borehole fluid had been circulated just prior to logging thus negating the potential to obtain meaningful information from this log. Geophysical logs to 450 feet below ground are shown in Figure 3.
The grain-size percentage log would suggest that less than one quarter of the section above 362 feet is comprised of silt sized or finer particles. However, the geophysical logs indicate that the actual percentage of sands is approximately equal to the silts and clays (above 362 ft.). This discrepancy points out the influence, on samples, of recirculating sands within the drilling mud and the loss of silt-to-clay sized grains during sample collection.
Single point resistance log The single point resistance Jog most clearly shows the lithologic contacts between
the sand and silty clay beds. Sand units show measured resistance between about 110 and
4
• • • • • • • • • • • • • • • • • • • • • • • • • • • • • • • • • • • • • • • • t t t
150 ohms. Above 400 feet, silt and clay units measure about 100 ohms or less. The log below 500 ft. has generally lower resistance values than that measured above 400 ft. An interval of decreasing resistance, showing the transition from silty clay to a fissile mudstone, is apparent between 365 ft. and 515 ft. The steady decrease in measured resistance with depth, over this interval is interpreted to indicate increasing clay content, and diminishing coarse silt-to-sands. The higher-resistance excursions on the log between 760 feet and 900 feet are interpreted as thin sand units within the massive mudstone . Electrical logs were necessary to delineate these lower sands, as these beds were not readily apparent in the drill cuttings, and only weakly expressed on the natural gamma-ray log .
Natural gamma-ray log The formation above 400 feet has more definition than the underlying mudstone .
Natural gamma counts peak at 140 counts per second for the silts and clays above 400 feet. The mudstone section, between 400 and 770 feet is generally less radioactive than the overlying clay beds, averaging about 100 counts per second. The lower, 2-to-10-foot thick sand units have gamma counts similar to sands above 400 feet.
Normal resistivity logs The slight separation between the 16-inch (short) normal and 64-inch (long)
normal resistivity logs indicate that there was invasion of borehole fluids into most sandy units above 400 feet .
Both normal resistivities, below 400 feet and within the mudstone, are very closely spaced indicating that very little invasion of drilling fluids has occurred in the mudstone . The long-normal resistivity is quite low in the sands between 770 ft. and 900 ft. whereas the short-normal and single point resistances are fairly high. This contrast is probably due to the larger radius of investigation of the 64-inch normal reading which incorporates a percentage of the clayey sediments enveloping the very thin sand units. Groundwater chemistry may be a contributing factor as well. Higher salinity is expected on the deeper reading 64-inch normal log because of the stagnant or relatively slow moving groundwater within this low permeability section. The specific conductivity of the borehole fluid at the time oflogging was measured at 509 uS. Later, after the well was air-lift developed, the conductivity of water pumped from the aquifer zones was found to be in the 200-275 uS range. The calibration of the electric logs was checked prior to logging .
WATER CHEMISTRY
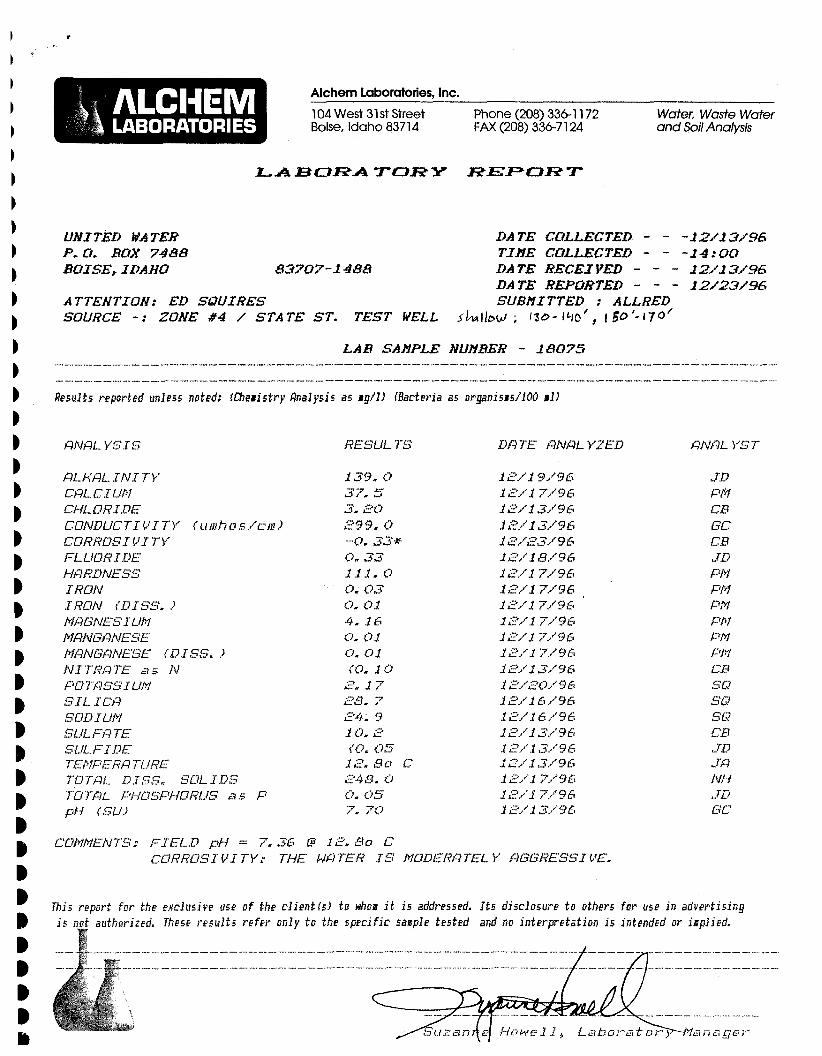
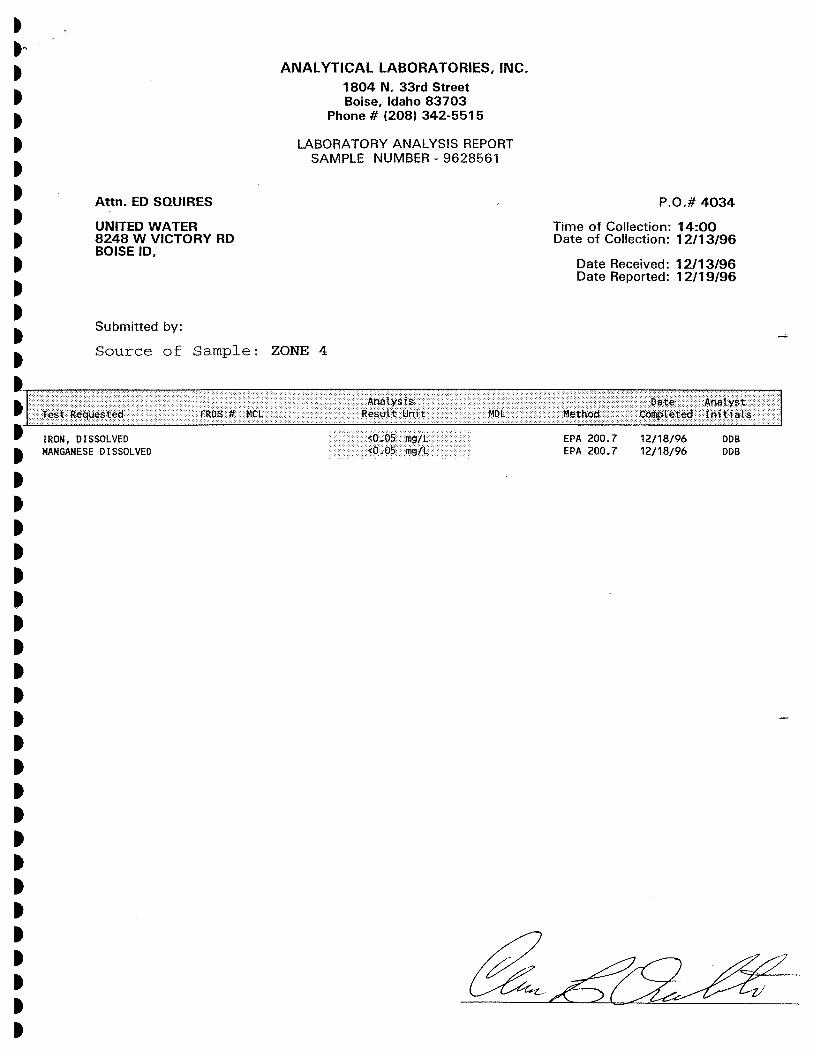
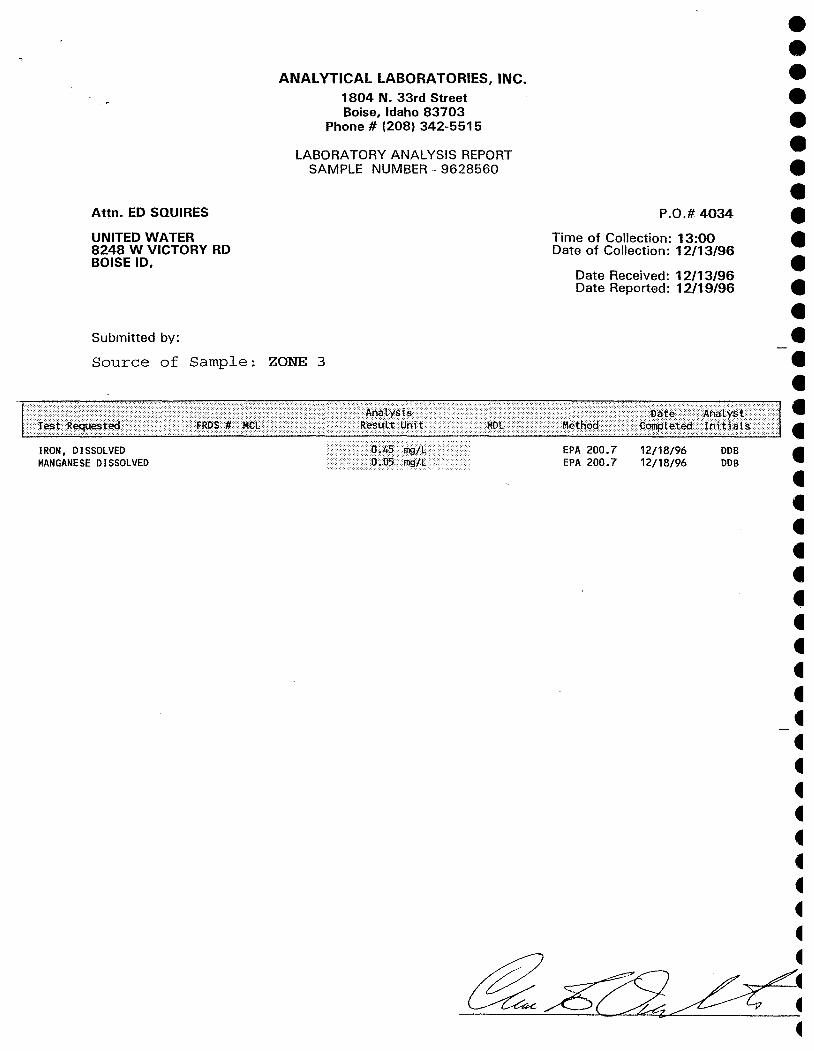
The piezometer tubes were developed by bailing and air-lifting on 12/12/96. Each piezometer tube was air-lift developed for 1 Yi to 2 hours at a flow rate of about 10 gallons per minute until clear and sand-free. On 12/13/96 water quality samples were collected from each tube. A submersible sampling pump was used to purge 5 to 10 well-bore volumes prior to sampling. A 0.45-micron filter was used to filter water analyzed for dissolved metals. Inorganic analyses for each zone are tabulated in Figure 2. Duplicate samples were submitted to separate commercial labs (Alchem Laboratories, Inc., and
5

• • • • • • • • • • • • • • • • • • • • • • • • • • • • • • • • • • • • • • • • • • •
Analytical Laboratories, Inc.) for analysis. Laboratory results for individual constituents generally agree within 10%. The variation in the sulfide results between the two laboratories suggests that the sample submitted to Alchem may have oxidized some sulfide to sulfate .
Groundwater from all four zones is quite similar. All are a calcium-bicarbonate water chemistry type with a very dilute total dissolved solids (TDS) ranging from l 64-to-200 milligrams per liter (mg/L) and a near-to-moderately alkaline field pH ranging from 7.03-to-7.42. With the exception of groundwater from zone-3, TDS ranges only from 164-to-l 88 mg/L. Groundwater from zone-3 has a slightly higher concentrations of iron, manganese, calcium, magnesium, potassium, and sulfated than the other three zones . Dissolved silica generally increases with depth and temperature. Other parameters are similar between zones .
A dissolved iron concentration of0.5 mg/L was measured in zone-3 water, while the other zones have iron concentrations less than 0.05 mg/L. Fine crystalline iron sulfide (pyrite) was found on between 1 O-and-40 percent of the sand grains, both, on and as part of the cement between the sand grains. Finer-grained sands have a higher percentage of iron sulfide than the coarser-grained sands. Iron sulfide was absent or present only in trace amounts throughout the shallower and deeper parts of the boring but yellow-brownto-brown iron oxyhydroxide occurs as both a stain and as a cementing agent throughout most of the boring .
The presence of dissolved iron in the groundwater ofzone-3 was observed during the purging of the piezometer. The groundwater turned from clear to a yellow color when left standing, exposed to atmosphere, in a bucket for 15 minutes. The 21 O-to-250-foot depth interval is apparently somewhat isolated from both the upper and lower sub-aquifer units at this location. Also, the amount of iron sulfide undergoing oxidation only slightly increases the concentrations of other constituents. The dissolution of the minerals contributing these constituents serves to neutralize the acidity created by the oxidation of iron sulfide to a pH of7.18, which is higher than the deepest zone-I groundwater (7.03) . The groundwater must be only slightly oxidizing in zone-3 compared to moderately-tohighly oxidizing in the other three zones to have a dissolved iron concentration of0.5 mg/L .
The color variations of freshly drilled sediments between the zones also serve as indicators of the oxidation-reduction potential of the groundwater. Drill-cuttings from zone-3 sub-aquifer unit are dark olive gray in color while the other zones are lighter hues of yellow-brown-to-pale gray. The light yellow-brown coloration in the shallowest depth interval (zone-4) is probably the most highly oxidized, zone-3 the most reduced, and the deeper sediments intermediate between these two shallow zones. The deeper zones are probably less oxidized because they of several interbedded thin clay zones that contain traces-to-abundant wood fragments. The organic wood materials, buried within the aquifer sediments, consume dissolved oxygen and thereby decrease the oxidationreduction potential even in these moderately oxidized sediments .
6

• • • • • • • • • • • • • • • • • • • • • • • • • • • • • • • • • • • • • • • • • t t
WATER-LEVEL MONITORING
A hydrograph, from April 1997 to December 1998, of monthly waterlevel measurements taken near the beginning of each month, is shown on Figure 6. The missing data points occurred during access negotiations with the owners of the property on which the test well is located. The graph clearly shows that pressure increases with depth, and that fluctuations in the individual aquifer zones mirror one another. The head in the shallowest completion (zone 4) is approximately three feet below that of the other zones. The heads in the three lower zones are typically within Yz foot of one another and show increasing potential with depth .
A seasonal water-level fluctuation of approximately 3 Yz-feet is apparent within all 4 zones. The water-level low occurs in December, and the water-level high occurs in the spring or early summer. The seasonal high and low water-levels coincide with increased flow in the Boise River, which begins in January or February (Figure 7 .
It is unlikely that the aquifer zones tapped by the piezometers are directly hydraulically connected to nearby surface water sources because of artesian pressures which occur at relatively shallow depths (below 200 feet). Confining conditions are suggested in even the shallowest (zone-4) aquifer completion intervals (130 ft. to 140 ft. and 150 ft. to 170 ft.). Also, the hydro graph does not indicate recharge from nearby laterals because recovery begins before March when canals begin to fill .
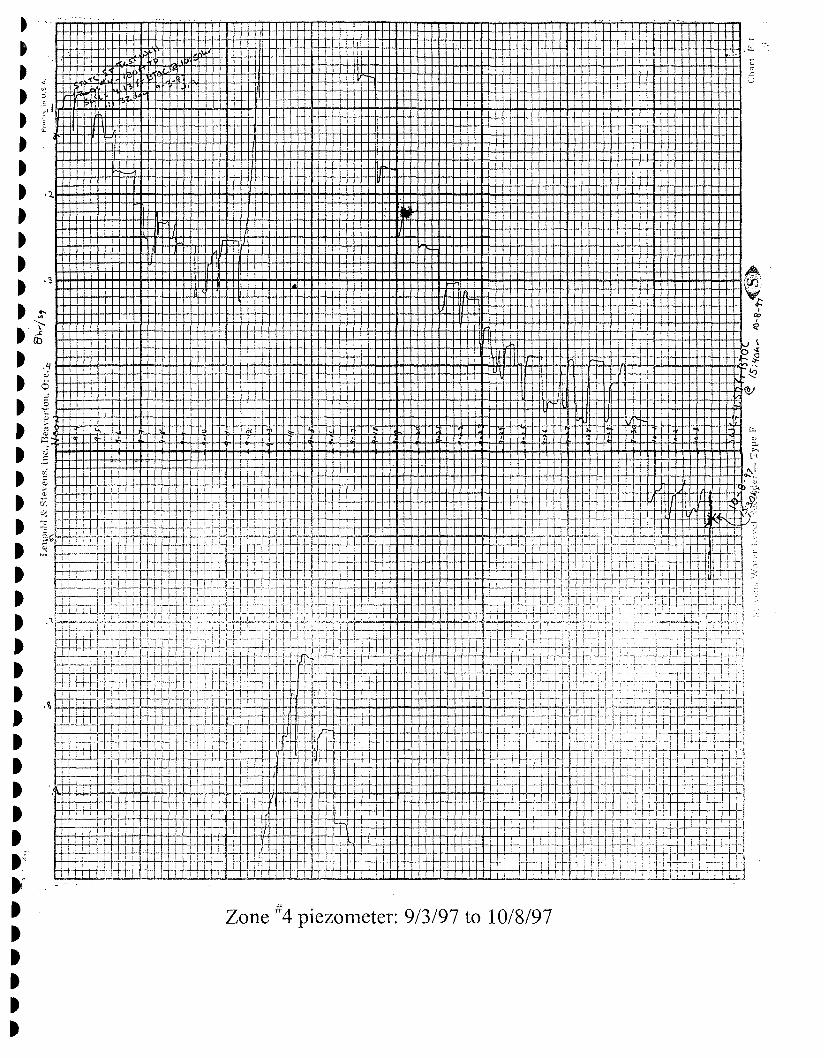
A record of the daily water-level fluctuation is shown on Figure 8. These data are from a Stevens F-type water-level recorder and show the continuous day-to-day waterlevel fluctuation. Zone-1 (the deepest zone) was measured from 4/17 /97 through 7 /1/97 . From 7/1/97 to 10/8/97 the recorder was measuring the water-level in zone-4 (the shallowest zone). The hydrograph for zone-1 begins when the head is at its highest. Ignoring smaller-scale fluctuations, both hydrographs in Figure 8 show an average decline of about 0.007 feet per day. The smaller-scale peaks and valleys, which range up to about 0.5 ft. from trough-to-crest, have not yet been evaluated for barometric effects .
SUMMARY AND CONCLUSIONS
The hydro geologic conditions and geologic section beneath the TVHP # 1 test well site have been investigated to a depth of 1005 feet bgl. Geophysical logs, grain-size distribution, lithologic log, and sub-aquifer water chemistry data are presented in this report. The following is a brief summary .
Underlying a 30-foot thickness of coarse, sandy river gravels, are alternating sand, silt and clay beds, about 2-to-40 feet in thickness, to a depth of 370 feet bgl. The sand layers comprise sub-aquifer units which are somewhat confined by lower permeability silts and clays. Sand and/ or predominantly sandy beds comprise about half of the section
7
• • • • • • • • • • • • • • t t t t t t t t t t t t
• • • t
• • t t t t t t t
---•
below the surficial river gravel to a depth of about 370 feet. Four piezometer tubes were completed into the thickest of the sand beds between 130 and 340 feet (Figure 2). Below a depth of370 feet the geologic section is comprised of silty clay which grades into a thick mudstone. Between 770 feet and 900 feet, the mudstone is punctuated by several fine to medium grained sand beds up to 10 feet in thickness (Figure 3) .
Water-level measurements of the four piezometer tubes show that aquifer pressures increase with depth beneath this area of west Boise, To date, a 21-month waterlevel record has been collected for each piezometer. The water-level measurement in the deepest piezometer, open to aquifer zones between 300 feet and 340 feet, reaches a maximum of about two feet above ground level in late Spring. There is a seasonal waterlevel fluctuation of about four feet in each of the piezometers (Figure 6). The lowest pressure-level in each aquifer zone occurs in January and the highest-pressure levels occur in June, mirroring stream flow rate changes in the Boise River (Figure 7). Further monitoring would suggest the variability of seasonal changes, and whether or not the mean water/pressure-levels are declining, rising, or maintaining. While no piezometer tubes tap the sand beds between 770 feet and 900 feet, these likely have artesian pressures greater than those of the monitoring well piezometers.
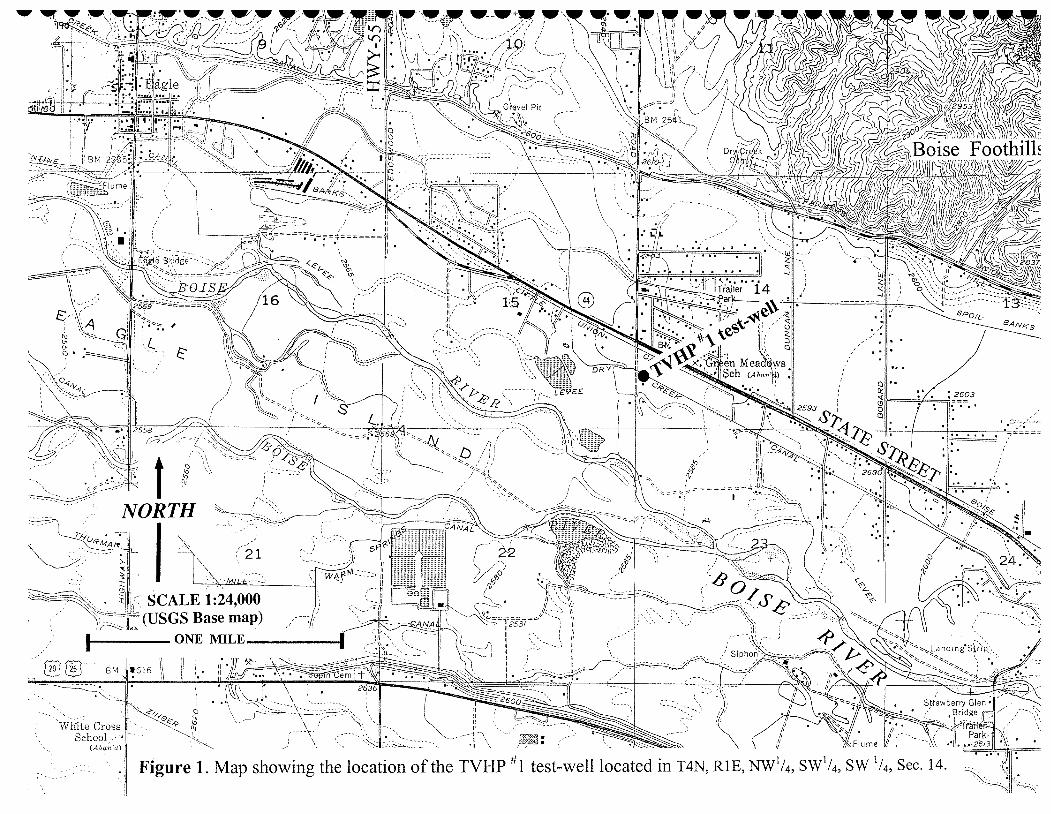
Overall, water chemistry is similar within the interbedded section between 130 feet and 340 feet. Distinct color changes are present. The most significant water-quality difference occurs in the aquifer zone between 210 feet and 250 feet (zone-3) where dissolved iron is present at a concentration of 0.5 mg/1, compared to less than 0.05 mg/I in the other zones.
The cooperative work of United Water Idaho with IDWR through the Treasure Valley Hydrologic Project to obtain a long-term lease agreement to this well establishes the first designated long-term monitoring well for the Treasure Valley. It is our hope that this well is the first of many wells in a network oflasting water-level and water quality monitoring points for the Treasure Valley. United Water Idaho is pleased to contribute to the growing body of knowledge being synthesized for Treasure Valley Hydrologic Project .
The authors would like to recognize the contributions of the following people: Spencer Wood (BSU) for review and for pointing out the Boise River's effects on aquifer pressures, Brian Cavenaugh and Mike Guilbert (BSU) for laboratory analysis of drill cuttings, Dick Glanzman (CH2M Hill) for geochemistry review, and Hal Anderson (IDWR) for consistent support and for his persistence in securing the long-term site easements.
8

• • • • • • • • • • • • • • • • • • • • • • • • • • • • • • • • • • • • • • • • • • •
FIGURES
~
NORTH . I SCALE 1:24,000
''>='-c_.j,,~~(USGS Base map)
11----- ONE MILE I
@J QQ BM j:,616 II II ! . .
,,,,_,, ', ' ''. <°/,y C,
Whlte Cross --~o~,,, ~ School .· • > ~~-
(Aba;'d) ' ~-~
' ' ' I
'
·-< • • H •
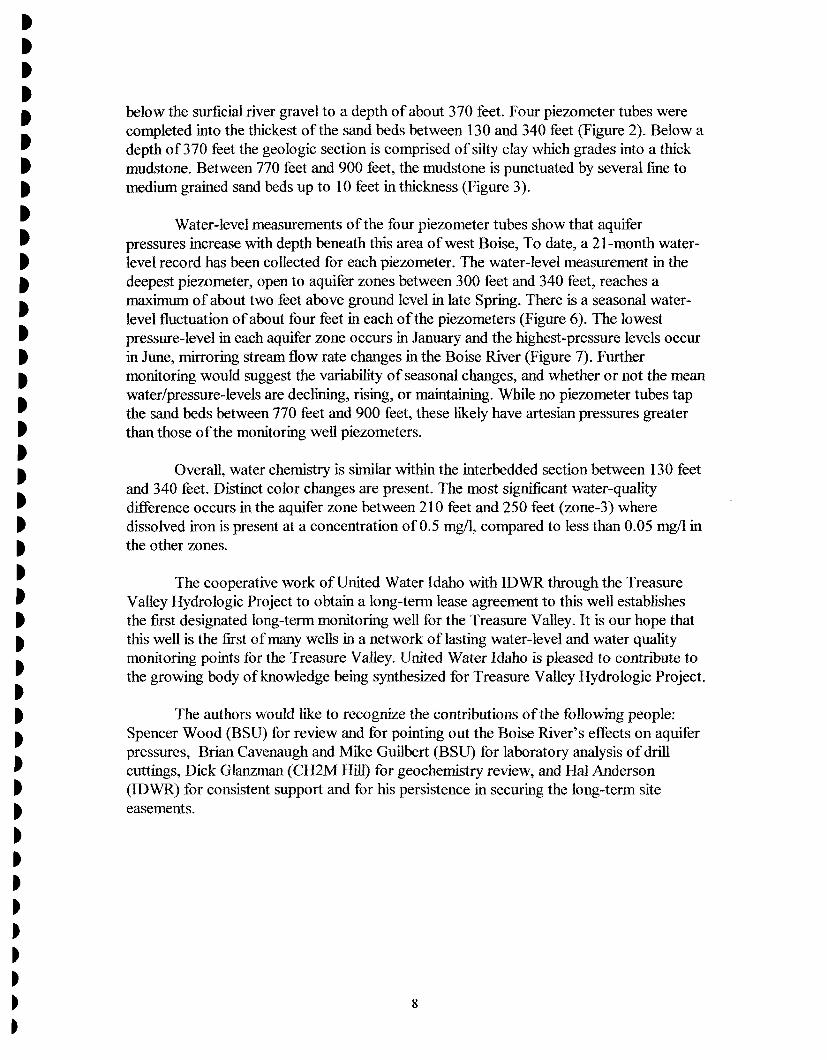
Figure 1. Map showing the location of the TVHP #1 test-well located in T4N, RlE, NW1/4, SW1/4, SW
1/4, Sec. 14.
• • • • • Treasure Valley Hydrologic Project Monitoring Well #1
• • • • • • • • • • • • • • • • • • • • • • • • • • • • • • • • • • • •
Comparison of Water Chemistry in Piezometer Completion Zones
in mg/1 unless note otherwise.)
Zone 4 Zone 3 Zone 2 · Zone 1 130-140 ft. 210-220 ft. 270-290 ft. 1300-310 ft. 150-170 ft. 240.250 ft I 330-340 ft.
y X y X y X y
Location: NW Section 14, T4N, RIE, B.M., Ada County, Idaho Well design by United Water Idaho Geosciences Well completed 12/5/96 by Stevens & Sons Well Drilling, Boise, ID .
.~igure ~· Composite di~gram showing well construction, • htholog1c geophysics and water chemistry at various depths.
Natural Gamma-Ray
Geophysical Logs
50
Single-Point Resistance
(ohms)
Normal Resistivity
150 0 (ohm-meters) 200
Depth Lithologic Log
(and Munsell soil color)
Top soil
Clay
Lt. Ye/. Brn (2.5Y 6/4)
Fine-med. sand sub-angular
Coarse sand,sub-angular
Sandy clay and sand interbeds
Med-crs. sand, sub-angular, iron cementation on coarse grains
130' _ ' -
140' -I
150' _
Lt. Ye/. Bm (2.5Y 614) \g -color change------- 170,
Dark Olive (5Y 312}
Clay, sticky, abundant bile wood fragments
Med-crs. sands, sub-angular to angular
oo Med-crs. sands, sub-angular <> o t I ' 'oo o angu ar, py~tte and iron 240, _ cemented grains •
Olive G,y. (5Y 512) -color cna1nm~·-·-·-·······
Pale (5Y 6/3)
Monitoring Well Construction
Approximate static water-levels
8-inch diameter cable-tool drilled borehole to 76 ft.
8-inch diameter (0.250"-thickness) steel casing with drive shoe drilled and driven to 76 ft .
712-inch diameter direct mud-rotary drilled borehole from 76 ft to 1005 ft.
Bentonite pressure grout seal (206 gal. 21 % solids)
+-!~~ 2-inch diameter schedule-SO threaded 0 0
191'
flush-joint PVC pipe with 0.020"-slot screens (screen settings as noted)
#6-9 Colorado Silica Sand, Inc . filter-pack poured from surface ( 13 ft3 volume)
Cement pressure-grout seal: 3 'h ft3 volume (made with 200 lbs. Portland Ash Grove Type II cement plus 12 gal. water)
#6-9 C.S.S.l. filter-pack (12 ft3 volume)
u...-- Cement pressure-grout seal: 2 ft3 volume (100 lbs. cement and 6 gal. Water)
#6-9 C.S.S.L filter-pack (17 ft3 volume)
* Filter-pack and seal placement verified by tagging during installation.
Cement pressure-grout seal: 181h. ft3 volume (1000 lbs. cement and 550 gal. Water)
cavings/ bridges filling borehole below bottom of cement seal
Figure 2.

•••••••••••••••••••••••••••••••••••••••••••
Depth (ft. bgl)
Geophysical Logs and Lithologic Log of the
Treasure Valley Hydrologic Project #1 test-well
Lithologic Log (log based on drill cuttings
samples and geophysical logs)
Geophysical Logs
~o
Single Point Resistance
ohms
:-~ Med. to coarse sands,
-1000-
sub-angular, and sandy clay
Lt. Ye/. Bm. 2.5Y6!4
---~•r'llnr change-----······· . . . . ----Dark Olive Gray
Med. to coarse sands, 5y 3/2 sub-angular to angular and sticky clays with wood fragments
Med. to coarse sands, angular, some iron cementation, and clays with wood
Pale Olive 5Y 6/3 ---color change---······-
Ollve Gray 5Y 4/2
Silty clay grading into mudstone
Dark Olive Gray 5Y3/2
lnterbedded fine-to-med. sands,and mudstones
c:::, c::i
Transition from unconsolidated clay to weakly indurated muds tone
Normal Resistivity
-0
-300
-500
-600 I
700
-· -800
-900
-1000
Figure 3. Geophysical logs and lithologic log of the TVHP #1 test-well. Geophysical logs were run in open mudfilled hole by UWID Geosciences on 11/22/96.
• • • • • • • • • • • • • • • • • • • • • • • • • • • • • • • • • • • • • • • • • • •
Depth ft. bgl
50
Grain-Size Percentage Log
0 10 20 30 40 50 60 70 80 90 100%
Gravels of the present day Boise River floodplain
(NO SAMPLES)
0 10 20 30 40 50 60 70 80 90 100%
U.S. Standard Sieve No.
10 18 30 50 100 200 silt clay
10( )pooo&§388::::::1mnmk1tS:i~,:e;t=======~
CUTTINGS GEOLOGIC GRAIN-SIZE
I RETAINED MATERIAL RANGE ON SIEVE NO. SIZE RANGE <'. . (inches)c ..
10 > Very Fine Gravel > 0.079 in. "18 Very Coarse Sand 0.079 - 0.039 "30 Coarse Sand 0.039 - 0.023 "50 Medium Sand 0.023 - 0.012
"100 Fine Sand 0.012 0.006 "200 Fine Sand to Silt 0.006 0.003
<"200 Silt/ Clay < 0.003
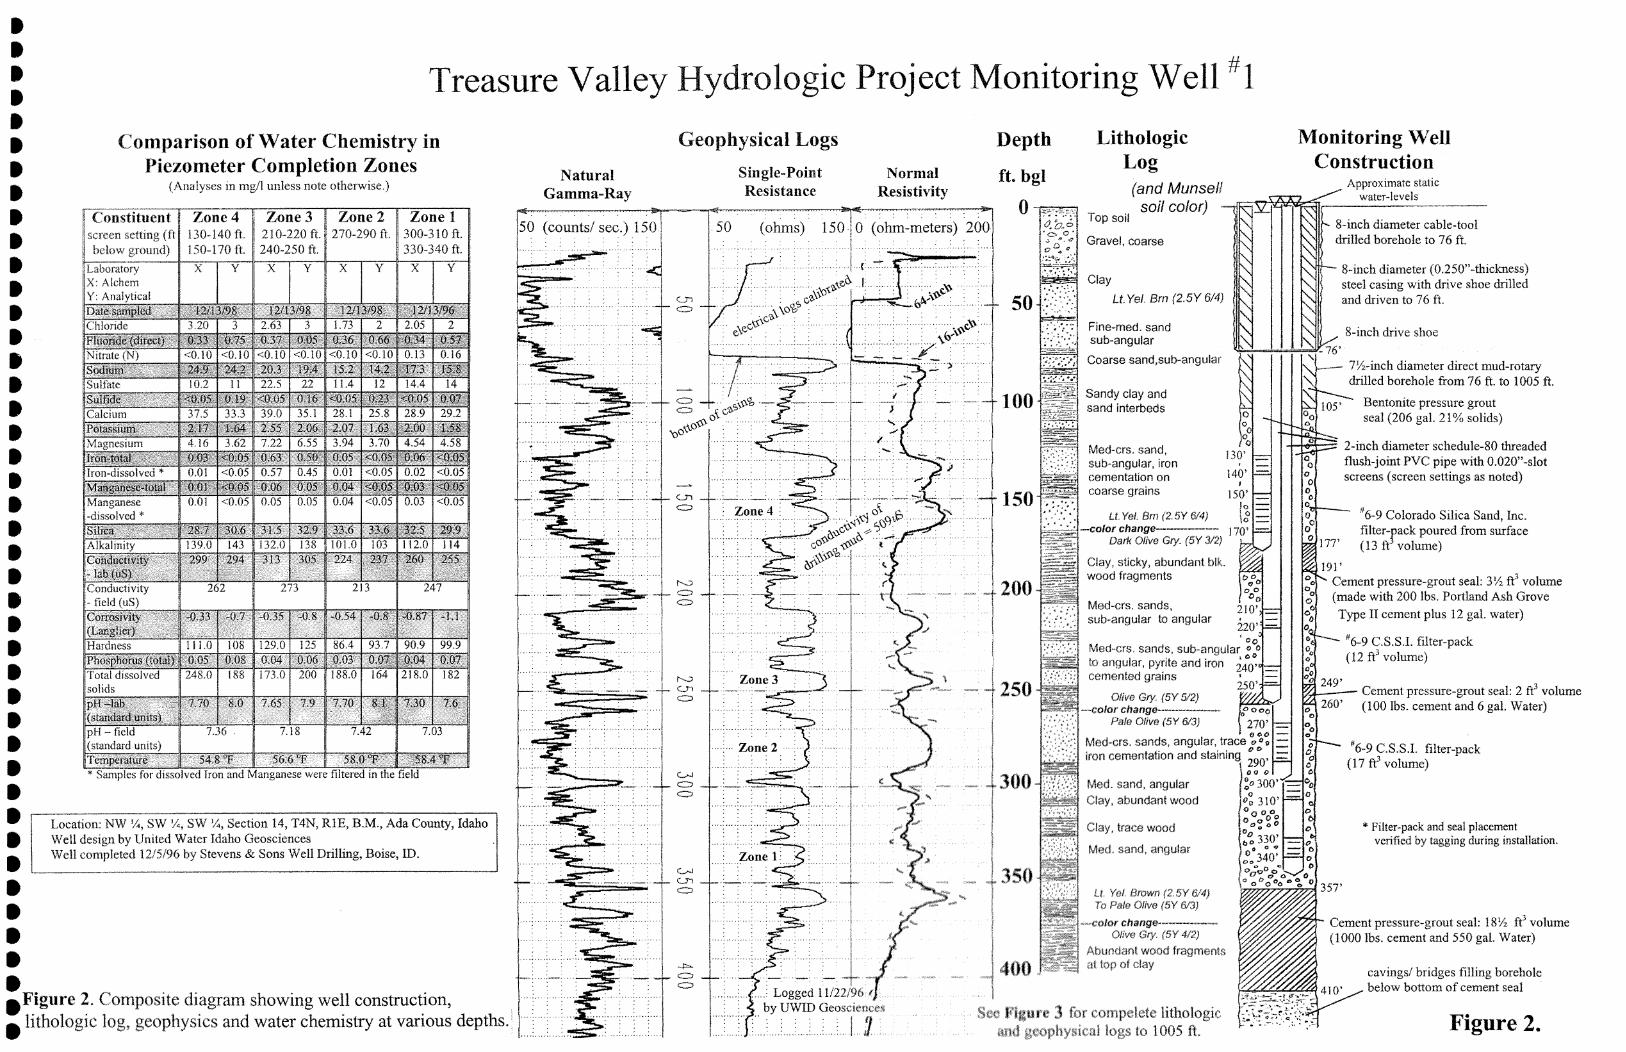
Figure 4. Grain-size percentage log of drill-cuttings from the TVHP #1 test-well. Each five-foot sample interval was wet-washed through a stack of U.S. Standard sieves and the relative percentages retained, by volume,were measured. The silt and clay fractions were estimated by settling the wash-through water, and delineated from one another by setting time in a graduated cylinder. Sieve analysis by Boise State University graduate students Brian Cavanagh and Mike Guilbert of the Department ofGeosciences. The log is meant to be an objective representation of grain size distribution with depth, however, recirculated sand, cavings, and the loss of clay and silt particles in the drill-cuttings can affect the log. The log cannot be directly correlated with geophysical logs owing to the cuttings return "lag time" .

•••••••••••••••••••••••••••••••••••••••••••
I
Dark Olive Gray l I I
Trace
I Trace Fe Staining I
I
No Pyrite
No Calcite Cement
Explanation: Major:> 30 % of grains cemented Medium: > 10 % of grains cemented Minor: <10 % of grains cemented Trace: Detectable
Olive Gray
-----·-
No Fe Cement/ Staining
I I Minor to Med. I
Olive Gray Lt. YeL Brown
Abundant No Wood (in clays)
Trace to Minor Med. to Major
I
Trace I Med. No Pyrite 1 to Major
No Calcite Cement
Cb ~o~
lt,o 0-()
~0+ 0~
~h ~+~ ~~ ~~
0. ~~ ~~ ~" q ~~
~+~
Figure 5. Occurrence of reduced wood chips, iron cemented or staining, fine pyrite crystals as cement, and calcite cement on sand grains in the TVHP #1 test well samples.

t t t t t t t t t t t t t t t t t t t t t t t t t t t t t t t t t t t t t t
• • • • •
=c-C: :::J 0 ... Cl
== 0 a:; ..0 .....
Cl) Cl)
~ a:; > Cl)
""i ... Cl) ..... Ill
==
-5.00 -1-----i
!, I
-6.00 L----"---'----'---'-' ~!--'-----'-----'----'-' -----'--.J__-~ _ _,____,_i ----l'------'
->:::+- Zone-1 (300'-310', 330'-340')
- - o · · Zone-2 (270' -290')
• Zone-3 (210'-220', 240'-250')
--o--- Zone-4(130'-140', 150'170')
Figure 6. Hydro graph of monthly water-level measurements of the TVHP #1 test-well piezometers. Measurements were taking near the beginning of each month, except June through August 1998, when land owners prevented access .

• • • • • • • •• • • • • • • • • • • • • • • • • • • • • • • • • • • • • • • • • • • •
tJ'l 11. (..)
C .... " II) ~ t. 11'
.i::. (.) (.? .... c::i
9000 l I
8000 I I
7000
6000 []
5000 l
4000 ·-·
3000
11 .
2000 I !
1000
0.0 April
i ! I l
! i 1
I I I l
. I
I~ I
~ ~I~
!
_.__ n~·-
! !
-
~~'1 I I l I
' ·- . .A
,f l -
i July
1997
I i l l
l I i i
! ....,.
I ! I l
I !
I l !
I l !
I ! I
I I l I i
I -1----
I
I ; ....... I I ' I ! ' ' ! ! j
! i
~ ~
(\.,-"- ' I I ; I
October January
I r
l I l
l I
' JI
i ,-- I -:
i l
April
I I
I I i
l
'
\
! 1
\.
I I July
1998
l l i I l
Figure 7. Flow rate of the Boise River at USGS streamflow gauging station number 13206000, located at the Glenwood Bridge, 2.2 miles southeast of the Treasure Valley Hydrologic Project #1 test-well (USGS data). Flow rate in the Boise River corresponds to hydrograph based on monthly water-levels measured in the TVHP #1 test-well over the same time period (see Figure 8) .
i
I 1 ,,

----• • t t
• • • • • t t
• t t t t 2.0
t 2.2
t 2.4 t S'
C ::s 2.6 t 0 ... Ol
t ?: 2.8 0
t Cl)
..c - 3.0 t
Cl) Cl)
!t:-
t Q) 3.2 > Cl)
t • 3.4 ... Cl) -t Cil ?: 3.6
t t 3.8
t 4.0
t t
• t
• -• -• •
· Zone-1 (Deepest completion) 2.6
1111111111 11111111 11 11111111 2.4
S' 2.2 C ::s
2.0 0 ... Ol
April May 1111 June 111111 lllli I II
lliil1tttttt i I I
ill± I I I I I
-~ ~"""'IJ I I Cl)
1.8 > 0 ..c Cil - 1.6 (I)
~ Q) 1.4 >
~·· ~\ " 1, ' n~ i.L Ii
I "'~ ~· I ~ ..
~. IJ .. .. 1 .. I
I I (I) I • 1.2 ... (I) -Cil ?: 1.0
0.8
I I ....1.. .. ·1 I
. f ' ! I
'' ' '' ' ' I 111 Zone 1 Completion Interval: 300 ft.-310 ft. and 330 ft.-340ft. I
April 18, 1997 through July 2, 1997 I I , 1 I Ii 11
Hydrograph of noon and midnight water-level recorder readings. I I I i ! \ \ l l 0.6
I I i ii I I I; I I' I I' I I I I I I 11 I I I I I I I I' ii I I I I I I 11' I I' I I I! I 11 I I 1, 1 I I I'
1997
Zone-4 (Shallowest completion) '' '' ' '' ' 11 I II I i II I I I'"""~ I 1111,11111111
i 111 September
I! I I . Illy I I t Ii~~,~~ I; 1, 11 I '
111 I I 11 11 i ! I I WJ 11 l i 11
I I! I I,. 11 ! I I i 11 I' I I I 1 I : i I I I 'I
I I I J' ! I I I I 11 ' 1 I I
... I I I I l 11 : ii I ~ L , I I • .\ l 11 11 ..
11 I : / i Ii I I
r1 ! I ' ,I.JI~' .. •( \r ! I' I L H 11 I ii
I 111, '' 'i' 11 1
1 I i I I .. .. 111 ~1 I llntt'!' ,,,, JI 1"1\ I I ~~ I I I' ' "' \ 1 • 11 i:. . \ !
1111 ! I I I I I I 11 ! I I I ~! I I I' '' I I ~ I I i; ! i
11111 i I [ I I ffi' I I , I i ~Mo· J 1, 11: I ~"l"T ...,., I I~ ! I! 11
'i .. , I . iJ .. i i i 11 i I' : I ,' I Iii . If I I i l i • " I i
I i I I .... , ~I Ii lll'.i.' 11 ! ii Iii! I i I I I ,,I' Ii
H iJH f. I Ii lJ I J 11-r- I !:t ! Ii I ! 11 l.
I ' ' I , ,... .• ! 11 : ' ! ! I I I ! I ti: W\I ' I :
rll IT i ... T;: I Ii I -++t-t--rl-i+~+~,~--~, ;-I I I I I! I i : ! i I I! 1 1111 1 ! ~ .• ~;
I i I l i I ! I jj I I i , I
'I i I 11 I I : j ! i i : I ; i ! ! • ~ ~ '!II ! :-+-H+L++-1 -- ~~-1
LlL'. : 111 1 : 1 1 i I n 11 rn 1 1 : 1
1 I • I I : 11 ! I! I I ! i 11 ! ! i I I i : I rH-~ Zone 4 Completion Interval: 130 ft.-140 ft. and 150 ft-170ft • : I j i I I . ;
! ii '' I i July 2, 1997 through October 4, 1997 h~Ti I. i I ': ! : : i; 1
; , • ; Hydrograph of noon and midnight water-level recorder readings. u I:: :r XrH I I [ l I, ~l- ·I,, ': )
J·c- ~[T] T . :.: .: ' '' ' ' , · 1' I ii I
I : i ' 'i Ii 11 ii 1
1 ! : I;: I '
: I : ! , I ' : i.''
1997
Figure 8. Hydrograph of water-levels for the deepest and shallowest of the four piezometer completion zones in the TVHP #1 test-well, showing the relatively smallscale fluctuations which are probably responses to changes in barometric pressure .

---• • • • • • • • • • • • • • • • • • • • • • • • • • • • • • • • • • • • • • • •
APPENDIX A
WELL DRILLER'S REPORT to the
Idaho Department of Water Resources
(note: sketch turned in with driller's report is UWID's proposed construction plan which is different from UWID's as-built diagram of this report.)
For~38°7
3/95 "'
IDAHO DEPARTMENT OF WATER RESOURCES WELL DRILLER'S REPORT
Office Use Only Inspected by _____ _
Use Typewriter or Ballpoint Pen Twp __ Age __ Sec __ __ 1/4 __ 1/4 __ 1/4 I
I 1. DRILLING PERMIT NO. _§l_-..2._L-R_- 0709 Other IDWR No.
I
• 2. OWNER: Name United Water Address Box 7488
Corp
OQl ---
• City Boise State_!Q_Zip_8_3_7_0_7 __ I(
• 3. LOCATION OF WELL by legal description: '8
• Sketch map location must agree with written location. • ___ N __ _
• Twp. 4 North [XX or South D
.,., E Age. 1 East [XX or West D ,.,·1---1---1--;..--1 Sec. 14 . S/W 1/4 S/W 1/4 __ 1/4 i., 10 acres Ad 40 acres 160 acres , Gov't Lot __ County_--=-=a=-------
Lat: Long:
• s Address of Well Site State St at Hwy 55 • (Pierce Well) City Eagle
(Give a1 least name of road + Distance to Road or Landmark)
: Lt. ____ Blk. _____ Sub. Name, ________ _
- 4. USE: _ Domestic __ Municipal ~onitor D Irrigation
- _ Thermal ::::::: Injection D Other ________ _
- 5._TYPE OF WORK check all that apply xx New Well '-' Modify O Abandonment
• 6. DRILL METHOD
(Replacement etc.)
0 Other----
• Air Rotary :::::J Cable :xx Mud Rotary 0 Other ____ _
• 7 SEALING PROCEDURES
• • • SEAUFIL TEA PACK
Material From
,..~...,ont-
~
0 .., .......
To
AMOUNT METHOD
Sacks or Pounds
twas drive shoe used?;ecY C N Shoe Depth(s) _______ _ • Was drive shoe seal tested? oYXXN How?
•a. CASING/LINER: Diameter From Casing Liner Welded Threaded
II D 0 0 D
II 0 D D D tJed 0 D D
length of Headpipe Length of Tailpipe ______ _
9. PERFORATIONS/SCREENS J.= Perforations Method _____________ _
i.--::: Screens Screen Type ____________ _
I • From To Slot Size Number Diameter Material Casing Liner
I D 0
D D
I• D D
!o. STATIC WATER LEVEL OR ARTESIAN PRESSURE: i, ___ ft. below ground Artesian pressure ___ lb.
tepth flow encountered Describe access port or
jontrol devices:
11. WELL TESTS: .Lat: Long: o Pump o Bailer O Air o Flowing Artesian
__!ield gaL/min. I Drawdown I Pumping Level I Time
9. LITHOLOGIC LOG . -~,,.
-Hole Depth Wat,
Material >--~ Diam. From To Ylllf
;/,(}·// , co-s ,~ -+n 76 -ft <et- w/ . ./"_ i..,t,. .-12:::o I r,'01
t' ..
75 78 ,do..y (./ ,
8 7'il 85 $'~1-1d lS' s 8(, c./.:,.,.y .. \:' 8b "11.. ~ i,.,J' ' . •.
R2. I /2. ~"" .-,d $ C. k:.v S fr(!,coik J bv-i-, ..
112. J lb ·se:rnd .., ,,~,,;-,. ...Jive i.,.,_.,...,. /J {;, /25 <..lc:i.v , ye.I• b"'"~. IZ5 140 Sc:;,.,;J, wied,v,,,..,, br""' 140 /47 clc::..v 1,...,t.,f v-el. /ov-t1 /L{ 7 / 6"8 S..::t, .. ;d _,..:..o. 'oGt.l< V<"l/ovJ
1&8 2.07 c::::.lc.v of i V'f! 'lorn
207 2 '2..'2 !: '"'\..., J , vned. ""'r~ '=,rYJ.
22. "2.. 2.~ 54"1dv <}.::,y ;:.,I, v~ J...,......, '2-Z 6 2 35"' Sq n .J / ,,,,.,'e d h,,.,...,. Z"'3S '2 L.! I $ ~"1.dY C:::.f""'lv 0/1 Vf' I-, ;YI • 2-l/ I zso ~qh.f ..,,.,ed~cn-v-brn. zi;o Zbt.f cl~y. w/ so.11d~ s,it ,nc-.,::-;,,-r ........ - ' ol.'.ve. brn 26~ 2. <J I SC1hcl, me~. /,.,t,,-r.o/,ve'·bY'h 2.9 ( 2.97 .::.I o..v v <..I lo••= l::ir-11 • 2~7 30"7 ~ ..... ,,.·-J.·/ med. l1 ... l-i+ol1vP: brn 3,07 1~13 dei..v .<,el, b ...... : ' '3' / 3 '31 er <;;;'Ol.~d ~:ME?.J ~ l1c:1h-f · alive, 1:,rn :s 14 330 cle:o.v :; v-ef •. Jo,..~': 3'10 ~L./2. ·.$'.::,.~.-I· '/1e,t,f cl1v<:. bl"YI~
3L/.2 3'-;S <.lc.v Yi/. t-,,...., 31./< 35" I . <~nd Stlt v-el, l::r ... >-> 3; I 3§ '-I ,-:Je-.v v'<?/,' h,-.>-i 3S4 -:;;b'3 :.s,,. j,,t.J f med. Jc:;,,../<. 'cr.;-c::.v ,6,,....., .. 363 368 Cl"'-Y .. dc::,rk-.' ...,y,.,,, .._,<I ' 368 37'-/ $,:i'n t>l, -Fin~ ':.m <e~ dark c.i t'Y
371.f 77/ Cfo.y - da r K -,. t"O v V I
71 J 797 .::::, c.:id. - ~,..) ':f// t/o.v beJ,;-.~ 'l:80 ,;; :, J 7'87'
797 gzo Cltxy ; ...J,..,rf-. ""V""v I V ./
Completed Depth ____ --cJle-1cO;,.OAO.J-''--------(Measurable)
Date: Started 10/96 ''Compl'ete<i_--1cl--<2..,_/..c;9<+6>----
13. DRILLER'S CERTIFICATION I/We certify that all minimum well construction standards were cor,nplied with at the time the rig was removed. ·····~
/
Firm Name __ S_t_e_v_e_n_s,,,,_._&_S_o_n,c-·s ____ ,e_· ·-7"J __ Firm No.1_5_3 __ _
I FORWARn WHITF r.nPv Tn 1AtllTC::Q Qc::cn, ,00c0
·-

Form 238°7 3/95 IDAHO DEPARTMENT OF WATER RESOURCES
WELL DRILLER'S REPORT Office Use Only
Inspected by _____ _ • • • • Use Typewriter or Ballpoint Pen Twp __ Age __ Sec __
/4 __ 1/4 __ 1/4 1. DRILLING PERMIT NO. _§]_-.2.§_-~- 0709 OQ-=-1 __ Other IDWR
2. OWNER: Name United Water Corp Address Box 7488 City Boise State~Zip 83707
3. LOCATION OF WELL by legal description: Sketch map location must agree with written location.
N
Twp. 4 North lZX or South D
wi--....... -~--~ E Rge. East [XX or West D Sec. 14 , S/W 1/4 S/W 1/4 __ 1/4
10 acres Ada4o acres 1so acres Gov't Lot __ County_--"'="-------Lat: Long:
s Address of Well Site State St at Hwy 55
(Pierce Well) City Eagle 1G1ve a1 leas! name of road + Distance lo Road or Landmark)
Lt. ____ Blk. _____ Sub. Name ________ _
4. USE: - Domestic = Municipal ~onitor D Irrigation
Thermal ::::' Injection C Other _________ _
5. TYPE OF WORK check all that apply
XX New Well C.: Modify D Abandonment
6. DRILL METHOD
(Replacement etc.) D Other ___ _
= Air Rotary 'J Cable XX Mud Rotary D Other ____ _
7. SEALING PROCEDURES SEAUFIL TER PACK AMOUNT METHOD
Ma1erial From To Sacks or Pounds
,... ,:,m,:,-n f-
·-0 ..... -.w
Was drive shoe used?)eCY D N Shoe Depth(s) ________ _ Was drive shoe seal tested? 0Yxx3N How? _________ _
8. CASING/LINER: Diameter From Casing "" Liners., Welded Threaded
II D D D D
II D D D D tJed D D D
Length of Headpipe Length of Tailpipe
9. PERFORATIONS/SCREENS Perforations
Screens
Method ______________ _
Screen Type ____________ _
From To Slot Size Number Diameter Material Casing
0
D
0
Liner
D
D
D
10. STATIC WATER LEVEL OR ARTESIAN PRESSURE: ___ ft. below ground Artesian pressure ___ lb.
Depth flow encountered _____ ... Describe access port or
control devices: __________________ _
' i
'
11. WELL TESTS: Lat: Long: oP ump DB ·1e a1 r DA Fl Art . If D owing es1an • Yield gal.lmin. Drawdown Pumping Level Time
IJ!!I --Water Temp.----------- Bottom hole temp. ___ •
Water Quality test or comments: ---------------1 Depth first Water Encountered
- - ., ... , .... -. 9. LITHOLOGIC LOG
Hole Depth Material
wjl -Diam. From To Yes • 6'2A 18'.3() $qnc::;{., J..41!. d _ -Cl Y'""V
cl;.v. ~k .. ..... v.~G .
I 1/:3(') I? 58 8£8 f?{,:, s,,,.~x -f,...,..,, -~-e...1/ Gl V'O. V ... ~63 871 <"'I~, ·,. da..-k. oYO\"v .
I
87 I 87/.. ~~ {..,,,,1 . F,,..,,(! ~ ,...,.,,~ .,..~,;.,,·· -g 7?, 8<:J I c:.lc::J1v·:.Jayk c:::i·"""'" V I, >
f?q/ 1~3 Sai,,/,.,(,. -+in<e -"'YPA ..., Ve:\\/ .
81 '3 8Cf7 'c../6. V V I
/ "\v-.:>.v I
847 C/0 I I F , I S~V\0, In, , QY""-V
'1 o I {005 C/.:. V V I
doi.-l:: .... v,::,., , (..) /
.. ,
.,.
.,
I H
0
r"\..1C:,I V '-'-'
uAn 1 ~ 1aa7 I •• ••' -
-wAJEF\~r,"~i;Jn'tJV
....... v .......
Completed Depth lQQQ' (Measurable)
Date: Started lQ,L% _ Completed l2,l96
13. DRILLER'S CERTIFICATION
-I
• --• I .. .. • .. •
..
• .. ... -
1• t -~
41 41 41 41
41
41
4 t 4 4
I/We certify that all minimum well construction standards were cor,nplied with at • the time the rig was removed. '"'"'\ 1111
Firm Name __ S_t_e_v_e_n_S-:r--/&_ .. ·_r"_S_o_n-'-_s ____ -'-. ·...,.//'--_Firm ._5_3 __ 4 / 4
FORWARD WHITE COPY TO WATER RESOURCES
4 4 4 4

t t t t t t t t t t t t t
• • • • • • • • • • • t t t t t t t t t t
• • • t t t t t t
o:
100
150
350
4-00
,, ' O, I
i_ !
l I •. , i '
; ! ! f l '. ! I
i ,·- i

APPENDIXB
LABORATORY REPORTS OF WATER QUALITY
I
I
I
~
• • • • • • • • • ---• • t t t t t
• • t t t
• • • t
• • • • • • • • • II
r
I\LCI-IEM LABORATORIES
Alchem Laboratories, Inc.
l 04 West 31st Street Phone (208) 336-1172 Boise, Idaho 83714 FAX (208) 336-7124
Water, Waste Water and Soil Analysis
LABORATORY REPORT
UNITED WATER P. 0. BOX 7488 BOISE~IDAHO
ATTENTION: ED SQUIRES
83707-1488
SOURCE - : ZONE #4 / STA TE ST. TEST WELL
DATE COLLECTED- - - -12/13/96 Til'JE COLLECTED - - -14 :00 D.ATE RECEIVED - - - 12/13/96 DATE REPORTED - - - 12/23/96 SUBNITTED: ALLRED
s~llt>vJ; 130-140', 160'-170'
LAB SAl'JPLE NUl'JBER - 18075
Results reported unless noted: (Che•istry ~nalysis as •gll) (Bacteria as organis•s/100 11)
RNRLYSIS
HLKHLINITY CRLCIUN CHLORIDE CONDUCTIVITY (umhos/cm) CORROSIVITV FLUORIDE HRRDNESS IRON IRON (DISS.) NHGNESIUN J't!HNGHNESE NRNGHNESE (DISS • .> NITRRTE as N POTRSSIUN SI LICH SOD I UN SULFHTE SULFIDE TENPER/:JTURE TOT/:JL DISS. SOLIDS TOTHL PHOSPHORUS as P pH (SU)
RESLIL TS
139. 0
3. i=.'{)
c.'99. 0 -(J. 33* (>. 33 111. 0 o. 03 o. 01 4.16 o. 01 o. 01 i'O. 10 2. 17
1 o. i=.' {0. 05 12. Bo C 248.0 0.05 7. 70
CONNENTS: FIELD pH = 7. 36 @ 12. Bo C
DHTE HN/:JL YZED
12/19/96 12/17/96 12/13/96
12/18/96 lc.'/17/96 lc.'/17/96 12/17/96 12/17/96 12/17/96 12/17/96 le.'/ 13/96 12/E.'0./96 12/16/96 12/16/96 12/13/96 li=.'/13/96 12/13/96 12/17/96 lE.'/17/96 lE:/13/96
CORROSIVITY: THE W/:JTER IS NODER/:JTEL Y HGGRESSIVE •
/:JNHL YST
JD pf,f
CB GC CB JD PN PN Pl''1 PN PN PN CB SD. SQ SD. CB JD JR NI-I JD GC
This report for the eJ1clusi~·e use of the client(s) to t1ho1 it is addressed. Its disclosure to others for use in ad~·ertising is not authorized. These results refer only to the specific sa11ple tested and no interpretation is intended or isplied •
4anager

) ,-- I\LCI-IEM 1 ~~ LABORATORIES
Alchem Laboratories, Inc.
l 04 West 31st Street Phone (208) 336-1172 Boise, Idaho 83714 FAX (208) 336-7124
LABORATORY REPORT
Water, Waste Water and Soil Analysis
UNITED WATER P. O. BO.,Y 7488 BOISE,.IDAHO
ATTENTION: ED SQUIRES
83707-1488
DATE COLLECTED - - -12/13/96 TI.HE COLLECTED - - -13:00 DATE RECEIJ1ED - - - 12/13/96 DATE REPORTED - - - 12/23/96 SUBNITTED: ALLRED
SOURCE -: ZONE #3 / STATE ST. TEST)WELL (2,o'-·2.201 11.10'- t.St>/
LAB SAJIPLE NUJIBER - 18074
Results reported unless noted: {Che•istry Rnalysis as •gll) (Bacteria as organis•s/100 •1)
RNRLYSIS
RLKRLINITY CRLCIUN CHLORIDE CONDUCTIVITY (umhos/cm) CORROSIVITY FLUORIDE HRRDNESS IRON IRON (DISS.) NRGNESIUN NRNG!JNESE NRNGRNESE (DISS • .> NITRRTE as N POTRSSIUN SILICR SOD I UN SULFRTE SULFIDE TENPERRTURE TOTRL DISS. SOLIDS TOTAL PHOSPHORUS as P pH (SU)
RESULTS
13C.'. 0 39. 6 i=.'. 63 313. 0 -o. 35* o. 37 129. 0 o. 63 (). 57 7. BE.' o. 06 o. (15
(0. 10 .-.. C",:::" i.::. _,_,
31. 5 E.'O. 3 .-,.-.,. ...:::.c. r:-~' (0. ()5
13. lo C 173. 0 0.04 7. 65
CO/'t1NENTS: FIELD pH = 7. 18 @ 13. 1 o C
DRTE !JM1-LYZED
12/19/96 1 ,=.'/ 1 7/96 12/13/96 1 ,=.'/ 13/96 1E.'.,/E..'3,.,"96 12/18/96 12/17/96 12/17/96 12/17/96 12/17/96 12/17/96 12/17/96 lc.'/13/96 lc.'/E.'0/96 1E.'/ 16/96 12/16/96 12/13/96 lc.'/13/96 12/13/96 12/17/96 12/17/96 lc.'/13/96
CORROSIVITY: THE WRTER IS NODERRTELY AGGRESSIVE.
ANRLVST
JD Pfrt CB GC CB JD PN PN PN PN P/'t1 PN CB SQ SQ SQ CB JD JfJ NI-I JD GC
This report for the exclusive use of the client{s) to who• it is addressed. Its disclosure to others for use in advertising is not authorized. These results refer only to the specific sa•ple tested and no interpretation is intended or i•plied.
• • • • • • • • • • • • • I I I I I
• • • t
• • • • • t t t 4 t 4 t 4 4 4 4 4 4 4 4 4

~ t ~~
t t t
• t t t t t t t t t t t t t t
• • • • • • • t
• t t t t t t t t
• • • • t
•
Alchem Laboratories, Inc. ~ · /\LCI-IEM l LABORATORIES 104 West 31st Street Phone (208) 336-1172 Water, Waste Water
and Soll Analysis Boise, Idaho 83714 FAX (208) 336-7124
LABOR A TORY
UNITED WATER P.O. BOX 7488 BOISE~IDAHO
ATTENTION: ED SQUIRES
83707-1488
SOURCE • ZONE #2 / STATE ST. TEST WELL (2.70'- 210")
REPORT
DATE COLLECTED - - -12/13/96 TINE COLLECTED- - - -12:00 DATE RECEIVED - - - 12/13/96 DATE REPORTED - - - 12/23/96 SUBNITTED: ALLRED
L.AB SAl'lPLE NUl'lBER - 18073
Results reported unless noted: (Che•istry Rnalysis as •gill (Bacteria as organis•s/100 •1}
lHVRL 'r'SIS
RLKRLINITY CRLCIU/'4 CHLORIDE CONDUCTI<,1ITY (umhos/cm) CORROSIVIT'V FLUORIDE HRRDNESS IRON IRON (DISS.) NRGNES I UN NRNGANESE NRNGRNESE (DISS.) NITRRTE as N POTf1SSIUN SILICR SOD I UN SULFRTE SULFIDE TENPERRTURE TOTRL DISS. SOLIDS TOTRL PHOSPHORUS as P pH (SU)
RESULTS
101. 0 /:.'8R 1 1. 7~
' ..;I
6:24. 0 -(). 54* o. 36 86. 4 0.05 o. 01 ...;1 • 94 o. 04 o. 04 {0. 10
E:. ()7
33.6 1= .-.
-'• C
11. 4 (0. 05 14. 1a C 188. 0 0.03 7~ 7{)
CONNENTS: FIELD pH = 7. 4£' @ 14. 1o C
DRTE RNRLYZED
1!::/19/96 1£'/17/96 16:/13/96 16:/13/96 16:/6:3/96 lc.'/18/96 12~/ 17.,i'96 16:/17/96 16:/17/96 16:/17/96 lc.'/17/96 16:/17/96 lc.'/13/96 16:/6:0/96 16:/16/96 16:/16/96 16:/13/96 16:/13/96 1C/1 13./'96 lc.'/17/96 16:/17/96 1£'/13/96
CORROSIVIT't': THE WRTER IS NODERRTELY l::;GGRESSIVE
RNRLYST
JD Pl;! CB BC CB JD PN PM PM PN PM PN CB SQ SC! SQ CB JD JR NH JD GC
This report for the exclusii,•e use of the clientfs) to who• it is addressed. Its disclosure to others for use in adi,·ertising is not authorized. These results refer only to the specific sa•ple tested and no interpretation is intended or i•plied •

/
7
-j I\LCI-IEM ll LABORATORIES
Alchem Laboratories, Inc.
l 04 West 31st Street Boise, Idaho 83714
LABORATORY
UNITED WATER P. O. BOX 7488 BOISE,IDAHO
ATTENTION: ED SQUIRES
83707-1488
SOURCE -: ZONE #1 / STATE ST. TEST WELL (300-!l'?'.1 330-'lLfO')
Phone (208) 336-1172 FAX (208) 336-7124
REPORT
RECEIVED
DEC 2 6 1996
UN~ iXm-1~ter and Soil Analysis
DATE COLLECTED - - -12/13/96 TinE COLLECTED-- - -11:00 DATE RECEIVED - - - 12/13/96 DATE REPORTED - - - 12/23/96 SUBHITTED: ALLRED
LAB SAnPLE NUnBER - 18072
Results reported unless noted: (Che•jstry Rnalysis as •gllJ (Bacteria as organisas/100 •l)
RNRLYSIS
nLKRLINITY CRLCIU/'r1 CHLORIDE CONDUCTIVITV (umhos/cm)
CORROSIVITY ---FLUORIDE HRRDNESS IRON IRON (DISS.) NRBNESIUN MRNBRNESE MRNBRNESE !'DISS.) NITRRTE as N POTRS8IUN SILICn SOD I UN SULFRTE SULFIDE TENPERRTURE TOTRL DISS. SOLIDS TOTRL PHOSPHORUS as. P pH (SU)
RESULTS
112. 0 i=.'8. 9 2. 05 260.0 -0. 87* 0.34 90. 9 o. 06 0.02 4. 54 0.03 0.03 (),r 13 2.00 38.'. r:-
-' 17. 3 14. 4 {0. 05 15. Oo C 218.0 o. 04 7. 3()
CONNENTS: FIELD pH = 7. 03 @ 15. Oo C
DRTE RNRLYZED
1 c.'/ 19/96 1 E.' .. / 1 7 .. /96 12/13/96 12/13/96
12/18/96 Jc.'/ 17/96 ii.?/ 17/96 12/17/96 · 12/ 17/96 12/17/96 12/17/96 12/13/96 1 c.'/i.?0/96 12/ 16/96 12/16/96 12/13/96 12/13/96 12/13/96 12/17/96 lc.'/17/96 12/13/96
CORROSIVITV: THE WRTER IS NODERATEL Y AGBRESSIVE.
;.'/NAL YST
JD Pf:1 CB BC CB JD PN PN PlrJ
Pt-J PN PN CB SGJ SQ
SD? CB JD Jf-1 NI-I JD BC
This report for the exclusive use of the client(s) to Hho• it is addressed. Its disclosure to others for use in advertising js not authorized. These results refer only to the specific saaple tested and no interpretation is intended or i1plied.
• • • • • • • • • • • • • • • • • • • • • • • • • • • • t
• • • • • t t t t 4 4 4 4 4
• • • • • • • • • • • • • • • • • • • • • • • • •
ANALYTICAL LABORATORIES, INC. 1804 N. 33rd Street Boise, Idaho 83703
Phone# (208} 342-5515
LABORATORY ANALYSIS REPORT SAMPLE NUMBER - 9628561
Attn. ED SQUIRES P.O.# 4034
UNITED WATER Time of Collection: 14:00 8248 W VICTORY RD Date of Collection: 12/13/96 BOISE ID,
Submitted by:
Source of Sample: ZONE 4
Date Received: 12/13/96 Date Reported: 12/19/96
Attn. ED SQUIRES
UNITED WATER 8248 W VICTORY RD BOISE ID,
Submitted by:
ANALYTICAL LABORATORIES, INC. 1804 N. 33rd Street Boise, Idaho 83703
Phone# (208) 342-5515
LABORATORY ANALYSIS REPORT SAMPLE NUMBER - 9628560
Source of Sample: ZONE 3
P.O.# 4034
Time of Collection: 13:00 Date of Collection: 12/13/96
Date Received: 12113/96 Date Reported: 12/19/96
• • • • • • • • • • • • • • • • • I I
• • • • • • • • t t t
• t
• t
• • 4 4 4
~~~ -

• •• • ' ' ' t t t t t t t t
•
ANALYTICAL LABORATORIES, INC. 1804 N. 33rd Street Boise, Idaho 83703
Phone# (208) 342-5515
LABORATORY ANALYSIS REPORT SAMPLE NUMBER - 9628559
Attn. ED SQUIRES P.O.# 4034
UNITED WATER Time of Collection: 12:00 8248 W VICTORY RD Date of Collection: 12/13/96 BOISE ID,
Submitted by:
Source of Sample: ZONE 2
Date Received: 12/13/96 Date Reported: 12/19/96
:111111!1i!R1llllllll~llllllllll • • • • t t t t t
• • • • • • • • • • • • • • • •

Attn. ED SQUIRES
UNITED WATER 8248 W VICTORY RD BOISE ID,
Submitted by:
ANALYTICAL LABORATORIES, INC. 1804 N. 33rd Street Boise, Idaho 83703
Phone# (208) 342-5515
LABO RA TORY ANALYSIS REPORT SAMPLE NUMBER - 9628558
Source of Sample: ZONE 1
P.O.# 4034
Time of Collectioh: 11 :00 Date of Collection: 12/13/96
Date Received: 12/13/96 Date Reported: 12/19/96
• • • • • • • • • • • • • • • • [TS"ES257JS~~ST7:~~~~~~~~~000~~~~~~. B~ms____~~--~M•B•-~=========I
• • • • • • • ' • • ' -• 4 t
• • 4 4 4 4 4 4
~~ 4
Attn. ED SQUIRES
UNITED WATER 8248 W VICTORY RD BOISE ID,
Submitted by:
ANALYTICAL LABORATORIES, INC. 1804 N. 33rd Street Boise, Idaho 83703
Phone# (208) 342-5515
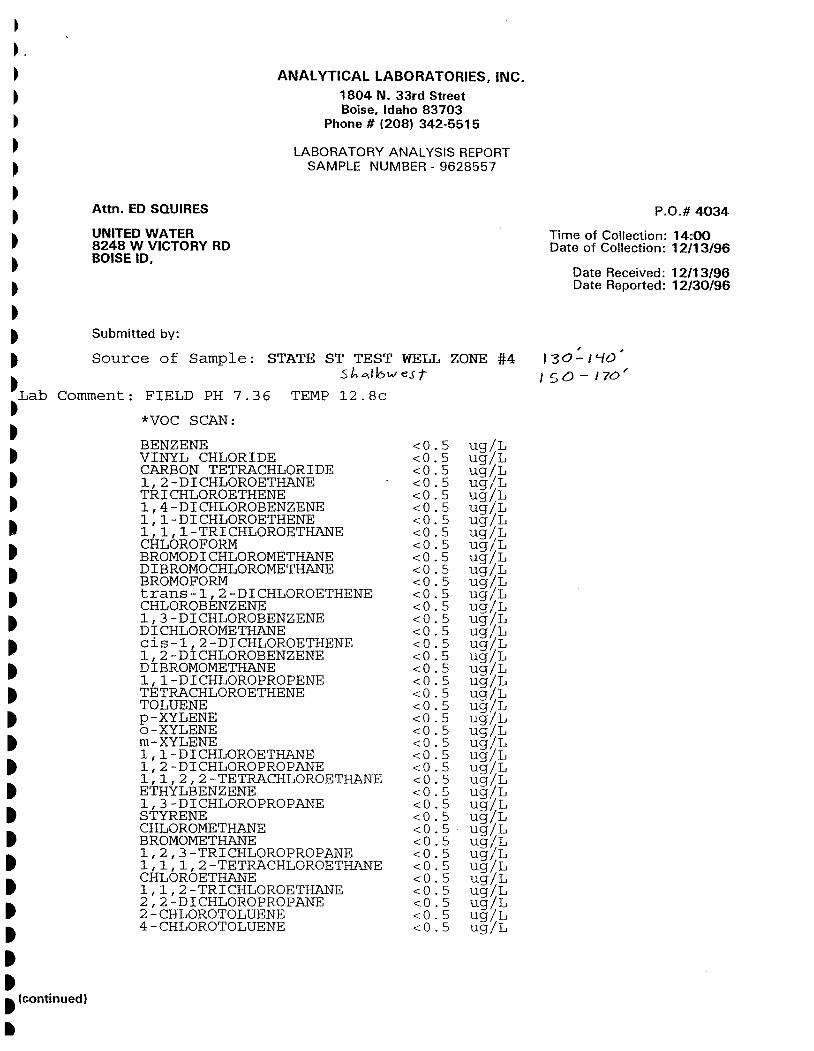
LABORATORY ANALYSIS REPORT SAMPLE NUMBER - 9628557
Source of Sample: STATE ST TEST WELL ZONE #4 Sli.oo.lbwest
•Lab t
Comment: FIELD PH 7.36 TEMP 12.8c
t
• t
• • t t t
• • t
• • • • • • • • • • • • • I (continued)
I
*VOC SCAN:
BENZENE VINYL CHLORIDE CARBON TETRACHLORIDE 1,2-DICHLOROETHANE TRICHLOROETHENE 1,4-DICHLOROBENZENE 1,1-DICHLOROETHENE 1,1,1-TRICHLOROETHANE CHLOROFORM BROMODICHLOROMETHANE DIBROMOCHLOROMETHANE BROMOFORM trans-1,2-DICHLOROETHENE CHLOROBENZENE 1,3-DICHLOROBENZENE DICHLOROMETHANE cis 1,2-DICHLOROETHENE 1,2-DICHLOROBENZENE DIBROMOMETHANE 1,1-DICHLOROPROPENE TETRACHLOROETHENE TOLUENE p-XYLENE o-XYLENE m-XYLENE 1,1-DICHLOROETHANE 1,2-DICHLOROPROPANE 1,1,2,2 TETRACHLOROETHANE ETHYLBENZENE 1,3-DICHLOROPROPANE STYRENE CHLOROMETHANE BROMOMETHANE 1,2,3-TRICHLOROPROPANE 1,1,1,2-TETRACHLOROETHANE CHLO RO ETHANE 1,1,2-TRICHLOROETHANE 2,2 DICHLOROPROPANE 2-CHLOROTOLUENE 4-CHLOROTOLUENE
<0.5 <0.5 <0.5 <0.5 <0.5 <0.5 <0.5 <0.5 <0.5 <0.5 <0.5 <0.5 <0.5 <0.5 <0.5 <0.5 <0.5 <0.5 <0.5 <0.5 <0.5 <0.5 <0.5 <0.5 <0.5 <0.5 <0.5 <0.5 <0.5 <0.5 <0.5 <0.5 <0.5 <0.5 <0.5 <0.5 <0.5 <0.5 <0.5 <0.5
ug/L ug/L ug/L ug/L ug/L ug/L ug/L ug/L ug/L ug/L ug/L ug/L ug/L ug/L ug/L ug/L ug/L ug/L ug/L ug/L ug/L ug/L ug/L ug/L ug/L ug/L ug/L ug/L ug/L ug/L ug/L ug/L ug/L ug/L ug/L ug/L ug/L ug/L ug/L ug/L
P.O.# 4034
Time of Collection: 14:00 Date of Collection: 12/13/96
Date Received: 12/13/96 Date Reported: 12/30/96
, 130-1'-IO
1 sa - 170"
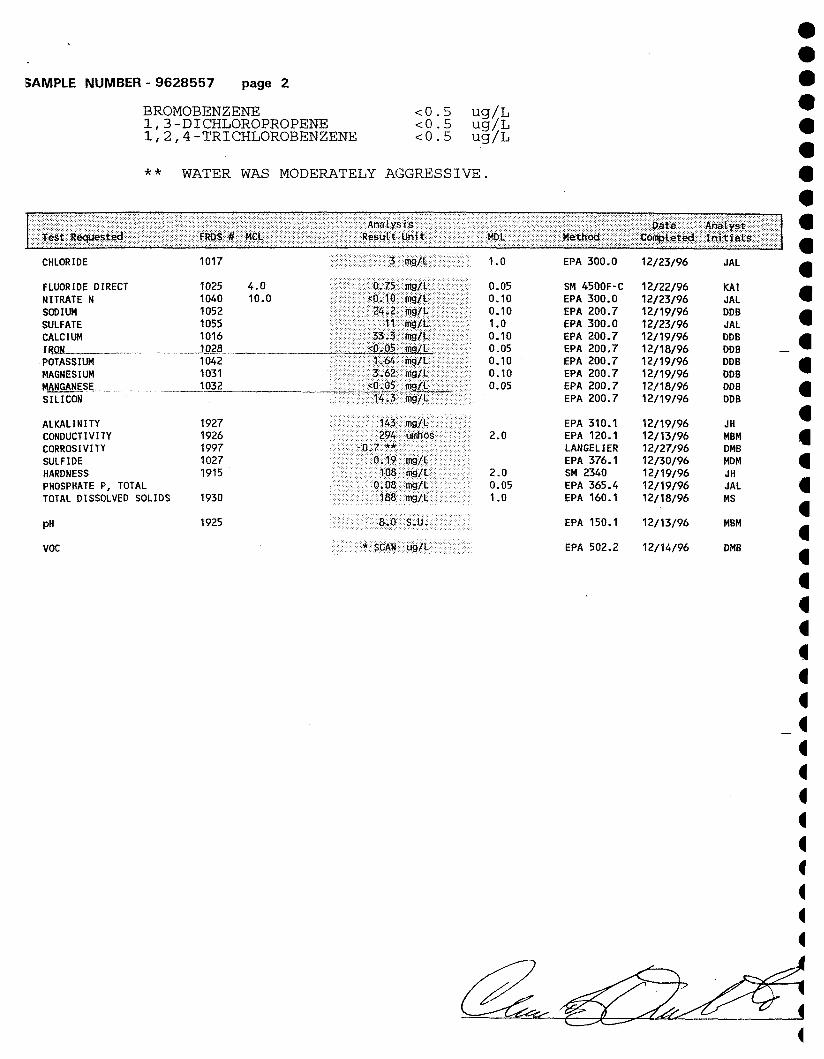
SAMPLE NUMBER - 9628557 page 2
BROMOBENZENE 1,3-DICHLOROPROPENE 1,2,4-TRICHLOROBENZENE
<0.5 <0.5 <0.5
ug/L ug/L ug/L
** WATER WAS MODERATELY AGGRESSIVE.
FLUORIDE DIRECT NITRATE N SODIUM SULFATE CALCIUM I l'{QtL___ ___________ .
POTASSIUM MAGNESIUM MANGANESI;_ SILICON
ALKALINITY CONDUCTIVITY CORROSIVITY SULFIDE HARDNESS PHOSPHATE P, TOTAL TOTAL DISSOLVED SOLIDS
pH
voe
1025 1040 1052 1055 1016
4.0 10.0
--J.Q.213 ---·----·----'"""'""'~~~'+"""+·•···· 1042 •·••· •.. ··•·. 1031
1927 1926 1997 1027 1915
1930
1925
0.05 0.10 0.10 1.0 0.10 0.05 0.10 0.10 0.05
2.0
2.0 0.05 1.0
SM 4500F-C EPA 300.0 EPA 200.7 EPA 300.0 EPA 200.7 EPA 200.7 EPA 200.7 EPA 200.7 EPA 200.7 EPA 200.7
EPA 310.1 EPA 120.1 LANGELIER EPA 376.1 SM 2340 EPA 365.4 EPA 160.1
EPA 150.1
EPA 502.2
12/22/96 12/23/96 12/19/96 12/23/96 12/19/96 12/18/96 12/19/96 12/19/96 12/18/96 12/19/96
12/19/96 12/13/96 12/27/96 12/30/96 12/19/96 12/19/96 12/18/96
12/13/96
12/14/96
KAI JAL DOB JAL DDB DOB DDB DOB DOB DDB
JH MBM DMB MDM JH JAL MS
MBM
0MB
• • • • • • • • • • • • • • • • • t
• • • • 41
• 41 41 t 41 4 4 4
• • • 4 4
• 4 4
&~ 4
• •• • • • • --• • • • • • •
Attn. ED SQUIRES
UNITED WATER 8248 W VICTORY RD BOISE ID,
Submitted by:
Source of Sample:
ANALYTICAL LABORATORIES, INC . 1804 N. 33rd Street Boise, Idaho 83703
Phone# (208} 342-5515
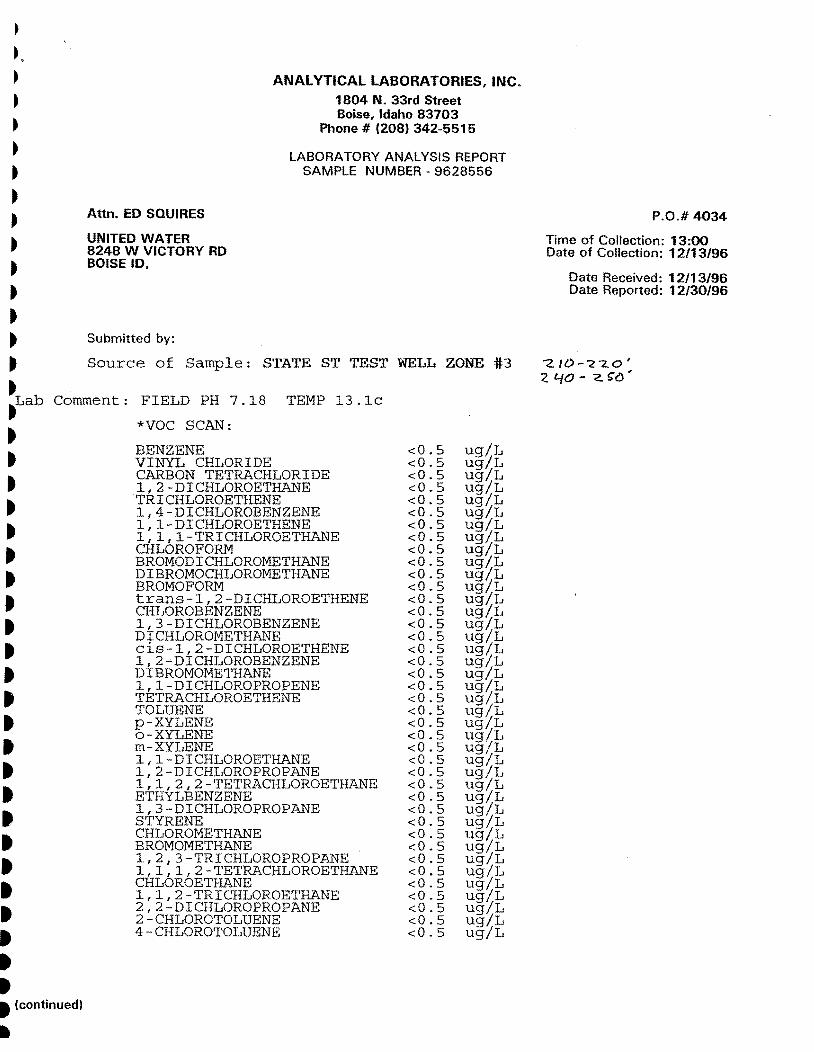
LABORATORY ANALYSIS REPORT SAMPLE NUMBER - 9628556
STATE ST TEST WELL ZONE #3
• .Lab Comment: FIELD PH 7.18 TEMP 13.lc
t t t t
• t t t t t t
• • • • • • • • • • •
*VOC SCAN:
BENZENE <0.5 ug/L VINYL CHLORIDE <0.5 ug/L CARBON TETRACHLORIDE <0.5 ug/L 1,2 DICHLOROETHANE <0.5 ug/L TRICHLOROETHENE <0.5 ug/L 1,4-DICHLOROBENZENE <0.5 ug/L 1,1-DICHLOROETHENE <0.5 ug/L 1,1,1-TRICHLOROETHANE <0.5 ug/L CHLOROFORM <0.5 ug/L BROMODICHLOROMETHANE <0.5 ug/L DIBROMOCHLOROMETHANE <0.5 ug/L BROMOFORM <0.5 ug/L trans-1,2-DICHLOROETHENE <0.5 ug/L CHLO RO BENZENE <0.5 ug/L 1,3-DICHLOROBENZENE <0.5 ug/L DICHLOROMETHANE <0.5 ug/L cis 1,2-DICHLOROETHENE <0.5 ug/L 1,2-DICHLOROBENZENE <0.5 ug/L DIBROMOMETHANE <0.5 ug/L 1,1-DICHLOROPROPENE <0.5 ug/L TETRACHLOROETHENE <0.5 ug/L TOLUENE <0.5 ug/L p-XYLENE <0.5 ug/L o-XYLENE <0.5 ug/L m-XYLENE <0.5 ug/L 1,1 DICHLOROETHANE <0.5 ug/L 1,2-DICHLOROPROPANE <0.5 ug/L 1,1,2,2-TETRACHLOROETHANE <0.5 ug/L ETHYLBENZENE <0.5 ug/L 1,3-DICHLOROPROPANE <0.5 ug/L STYRENE <0.5 ug/L CHLOROMETHANE <0.5 ug/L BROMOMETHANE <0.5 ug/L 1,2,3-TRICHLOROPROPANE <0.5 ug/L 1,1,1,2-TETRACHLOROETHANE <0.5 ug/L CHLOROETHANE <0.5 ug/L 1,1,2 TRICHLOROETHANE <0.5 ug/L 2,2-DICHLOROPROPANE <0.5 ug/L 2-CHLOROTOLUENE <0.5 ug/L 4-CHLOROTOLUENE <0.5 ug/L
• • I (continued) ..
P.O.# 4034
Time of Collection: 13:00 Date of Collection: 12/13/96
Date Received: 12/13/96 Date Reported: 12/30/96
'"2.10-"2 7_0 I
2 40 - z ~()'

SAMPLE NUMBER - 9628556 page 2
BROMOBENZENE 1,3-DICHLOROPROPENE 1,2,4-TRICHLOROBENZENE
<0.5 <0.5 <0.5
ug/L ug/L ug/L
• • • ** WATER WAS MODERATELY AGGRESSIVE.
• • • • • • • • • • • • • • • • • • • t
FLUORIDE DIRECT 1025 4.0 NITRATE N 1040 10.0 SODIUM 1052 SULFATE 1055 CALCIUM 1016 IRON 1028 POTASSIUM 1042 MAGNESIUM 1031 MANGANESE 1Q32 SILICON
ALKALINITY 1927 CONDUCTIVITY 1926 CORROSIVITY 1997 SULFIDE 1027 HARDNESS 1915 PHOSPHATE P, TOTAL TOTAL DISSOLVED SOLIDS 1930
pH 1925
voe
0.05 0.10 0.10 1.0 0.10 0.05 0.10 0.10 0.05
~ 32. Ii' .!i I '1<.C1
2.0
2.0 0.05 1.0
SM 4500F-C EPA 300.0 EPA 200.7 EPA 300.0 EPA 200.7 EPA 200.7 EPA 200.7 EPA 200.7 EPA 200.7 EPA 200.7
EPA 310.1 EPA 120.1 LANGELIER EPA 376.1 SM 2340 EPA 365.4 EPA 160.1
EPA 150.1
EPA 502.2
12/22/96 12/23/96 12/19/96 12/23/96 12/19/96 12/18/96 12/19/96 12/19/96 12/18/96 12/19/96
12/19/96 12/13/96 12/27/96 12/30/96 12/19/96 12/19/96 12/18/96
12/13/96
12/14/96
KAI JAL DOB JAL DOB DOB DOB DOB DOB DOB
JH MBM 0MB MOM JH JAL MS
MBM
0MB
t t
• • • t 4 4 4 4 4 4 4 f 4 4
~~~ 4

ANALYTICAL LABORATORIES, INC. 1804 N. 33rd Street Boise, Idaho 83703
Phone # (208) 342-5515
LABORATORY ANALYSIS REPORT SAMPLE NUMBER - 9628555
Attn. ED SQUIRES P.O.# 4034
UNITED WATER Time of Collection: 12:00 8248 W VICTORY RD Date of Collection: 12/13/96 BOISE ID,
Submitted by:
Date Received: 12/13/96 Date Reported: 12/30/96
Source of Sample: STATE ST TEST WELL ZONE #2 M 1<:lcl \ t c:.. o "e ~ 70 '- 2. <iO 1
•Lab Comment: FIELD PH 7.42 TEMP 14.lc
• • t t t t
• t
• • • • • • • • • • • • • • • • • • (continued) ..
*VOC SCAN:
BENZENE VINYL CHLORIDE CARBON TETRACHLORIDE 1,2 DICHLOROETHANE TRICHLOROETHENE 1,4-DICHLOROBENZENE 1,1-DICHLOROETHENE l,1,1-TRICHLOROETHANE CHLOROFORM BROMODICHLOROMETHANE DIBROMOCHLOROMETHANE BROMOFORM trans-1,2 DICHLOROETHENE CHLOROBENZENE 1,3 DICHLOROBENZENE DICHLOROMETHANE cis-1,2-DICHLOROETHENE 1,2-DICHLOROBENZENE DIBROMOMETHANE 1,1-DICHLOROPROPENE TETRACHLOROETHENE TOLUENE p-XYLENE o-XYLENE m-XYLENE 1,1-DICHLOROETHANE 1,2-DICHLOROPROPANE 1,1,2,2-TETRACHLOROETHANE ETHYLBENZENE 1,3-DICHLOROPROPANE STYRENE CHLOROMETHANE BROMOMETHANE 1,2,3-TRICHLOROPROPANE 1,1,1,2-TETRACHLOROETHANE CHLO RO ETHANE 1,1,2 TRICHLOROETHANE 2,2-DICHLOROPROPANE 2 CHLOROTOLUENE 4-CHLOROTOLUENE
<0.5 <0.5 <0.5 <0.5 <0.5 <0.5 <0.5 <0.5 <0.5 <0.5 <0.5 <0.5 <0.5 <0.5 <0.5 <0.5 <0.5 <0.5 <0.5 <0.5 <0.5 <0.5 <0.5 <0.5 <0.5 <0.5 <0.5 <0.5 <0.5 <0.5 <0.5 <0.5 <0.5 <0.5 <0.5 <0.5 <0.5 <0.5 <0.5 <0.5
ug/L ug/L ug/L ug/L ug/L ug/L ug/L ug/L ug/L ug/L ug/L ug/L ug/L ug/L ug/L ug/L ug/L ug/L ug/L ug/L ug/L ug/L ug/L ug/L ug/L ug/L ug/L ug/L ug/L ug/L ug/L ug/L ug/L ug/L ug/L ug/L ug/L ug/L ug/L ug/L

SAMPLE NUMBER - 9628555 page 2
BROMOBENZENE l,3-DICHLOROPROPENE l,2,4-TRICHLOROBENZENE
2.. 7o -'?.. rto'
<0.5 <0.5 <0.5
ug/L ug/L ug/L
** WATER WAS MODERATELY AGGRESSIVE.
FLUORIDE DIRECT NITRATE N SODIUM SULFATE CALCIUM IRON POTASSIUM MAGNESIUM MANGANESE SILICON
ALKALINITY CONDUCTIVITY CORROSIVITY SULFIDE HARDNESS PHOSPHATE P, TOTAL TOTAL DISSOLVED SOLIDS
pH
voe
1025 1040 1052 1055 1016 1028 1042 1031 1032
1927 1926 1997 1027 1915
1930
1925
4.0 10.0
0.05 0.10 0.10 1.0 0.10 0.05 0.10 0.10 0.05
2.0
2.0 0.05 1.0
SM 4500F-C 12/22/96 EPA 300.0 12/23/96 EPA 200.7 12/19/96 EPA 300.0 12/23/96 EPA 200.7 12/19/96 EPA 200.7 12/18/96 EPA 200.7 12/19/96 EPA 200.7 12/19/96 EPA 200.7 12/18/96 EPA 200.7 12/19/96
EPA 310.1 12/19/96 EPA 120.1 12/13/96 LANGELIER 12/27/96 EPA 376.1 12/30/96 SM 2340 12/19/96 EPA 365.4 12/19/96 EPA 160.1 12/18/96
EPA 150.1 12/13/96
EPA 502.2 12/14/96
KAI JAL DOB JAL DOB DOB DOB DDB DDB DOB
JH MBM DMB MOM JH JAL MS
MBM
DMB
• • • • • • • • • • • • • • • • • • • • • • • • • 41 41 41 4
_4 4 41 41 4 4 4 4 4 4 4 4 4
·~ • • • • • • • • • t
• • • • • Lab
-• • • • t
• • J • • • • • • • • • • • • • • • •
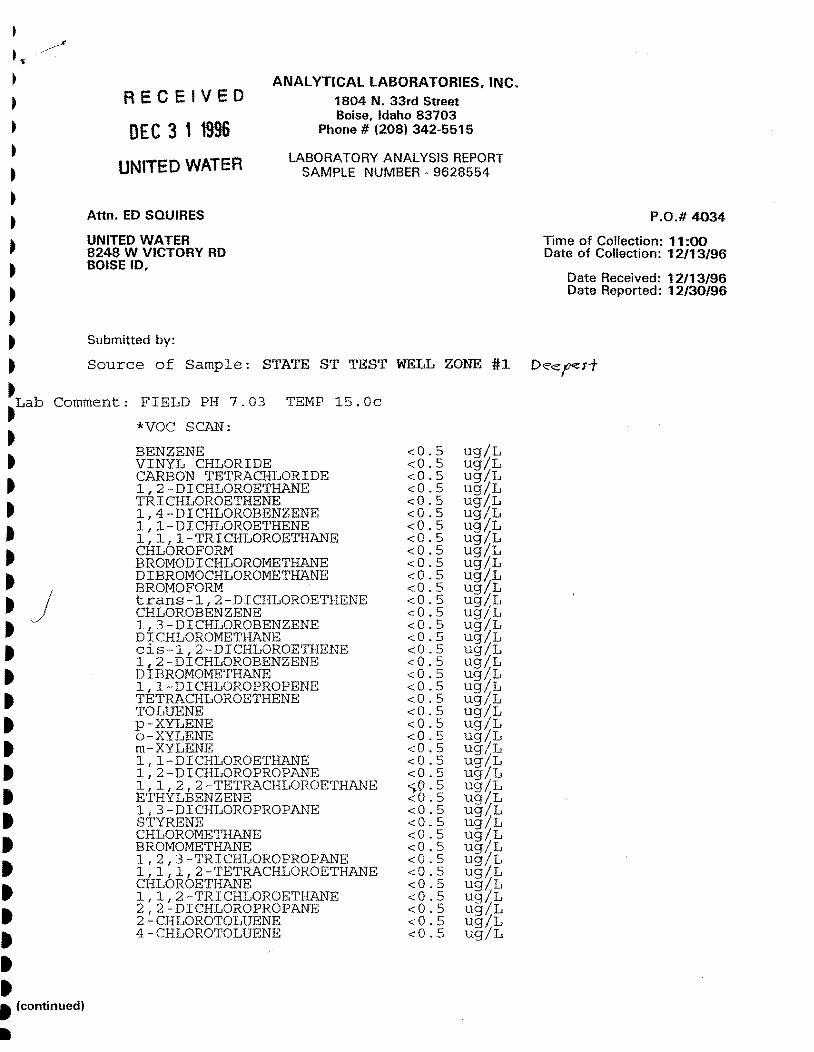
RECEIVED
DEC 3 1 1996 UNITED WATER
ANALYTICAL LABORATORIES, INC. 1804 N. 33rd Street Boise, Idaho 83703
Phone # (208) 342-5515
LABO RA TORY ANALYSIS REPORT SAMPLE NUMBER - 9628554
Attn. ED SQUIRES
UNITED WATER 8248 W VICTORY RD BOISE ID,
Submitted by:
Source of Sample: STATE ST TEST WELL ZONE #1
Comment: FIELD PH 7.03 TEMP 15.0c
*VOC SCAN:
BENZENE VINYL CHLORIDE CARBON TETRACHLORIDE 1,2-DICHLOROETHANE TRICHLOROETHENE 1,4-DICHLOROBENZENE 1,1-DICHLOROETHENE 1,1,1-TRICHLOROETHANE CHLOROFORM BROMODICHLOROMETHANE DIBROMOCHLOROMETHANE BR OMO FORM trans-1,2-DICHLOROETHENE CHLOROBENZENE 1,3-DICHLOROBENZENE DICHLOROMETHANE cis-1,2-DICHLOROETHENE 1,2-DICHLOROBENZENE DIBROMOMETHANE 1,1 DICHLOROPROPENE TETRACHLOROETHENE TOLUENE p-XYLENE a-XYLENE m XYLENE 1,1-DICHLOROETHANE 1,2-DICHLOROPROPANE 1,1,2,2 TETRACHLOROETHANE ETHYLBENZENE 1,3-DICHLOROPROPANE STYRENE CHLOROMETHANE BROMOMETHANE 1,2,3 TRICHLOROPROPANE 1,1,1,2-TETRACHLOROETHANE CHLOROETHANE 1,1,2-TRICHLOROETHANE 2,2 DICHLOROPROPANE 2 CHLOROTOLUENE 4-CHLOROTOLUENE
<0.5 <0.5 <0.5 <0.5 <0.5 <0.5 <0.5 <0.5 <0.5 <0.5 <0.5 <0.5 <0.5 <0.5 <0.5 <0.5 <0.5 <0.5 <0.5 <0.5 <0.5 <0.5 <0.5 <0.5 <0.5 <0.5 <0.5 ~(LS <0.5 <0.5 <0.5 <0.5 <0.5 <0.5 <0.5 <0.5 <0.5 <0.5 <0.5 <0.5
ug/L ug/L ug/L ug/L ug/L ug/L ug/L ug/L ug/L ug/L ug/L ug/L ug/L ug/L ug/L ug/L ug/L ug/L ug/L ug/L ug/L ug/L ug/L ug/L ug/L ug/L ug/L ug/L ug/L ug/L ug/L ug/L ug/L ug/L ug/L ug/L ug/L ug/L ug/L ug/L
t (continued)
P.O.# 4034
Time of Collection: 11 :00 Date of Collection: 12/13/96
Date Received: 12/13/96 Date Reported: 12/30/96

SAMPLE NUMBER - 9628554 page 2
BROMOBENZENE 1,3-DICHLOROPROPENE 1,2,4-TRICHLOROBENZENE
<0.5 <0.5 <0.5
ug/L ug/L ug/L
• • • ** WATER WAS MODERATELY AGGRESSIVE.
• • • • • • • • • • • • • • • • • • • •
FLUORIDE DIRECT 1025 4.0 NITRATE N 1040 10.0 SODIUM 1052 SULFATE 1055 CALCIUM 1016 IRON 1028 POTASSIUM 1042 MAGNESIUM 1031 MANGANESE 1032 SILICON -? s;
ALKALINITY 1927 CONDUCTIVITY 1926 CORROS IVITY 1997 SULFIDE 1027 HARDNESS 1915 PHOSPHATE P, TOTAL TOTAL DISSOLVED SOLIDS 1930
pH 1925
voe
0.05 0.10 0.10 1.0 0.10 0.05 0.10 0.10 0.05
= Z"f.'1. {~;O,_) Sll1"<1
2.0
2.0 0.05 1.0
SM 4500F-C EPA 300.0 EPA 200.7 EPA 300.0 EPA 200.7 EPA 200.7 EPA 200.7 EPA 200.7 EPA 200.7 EPA 200.7
EPA 310.1 EPA 120.1 LANGELIER EPA 376.1 SM 2340 EPA 365.4 EPA 160.1
EPA 150.1
EPA 502.2
12/22/96 12/23/96 12/19/96 12/23/96 12/19/96 12/18/96 12/19/96 12/19/96 12/18/96 12/19/96
12/19/96 12/13/96 12/27/96 12/30/96 12/19/96 12/19/96 12/18/96
12/13/96
12/14/96
KAI JAL DDB JAL DOB DDB DDB DOB DDB DDB
JH MBM DMB MDM JH JAL MS
MBM
DMB
41 t
• t t 4 4 4 4 4 4 4 4 4 4 4 ~
~~~J 4

• • • • • • • • • • • • • • • • • • • • • • • • • • • • • • • • • • • • • • • • • • •
APPENDIXC
CHARTS FROM WATER-LEVEL RECORDERS

t t t t t t t t t t t t t t t t t t t t t t
• • • • • • • • • • • • • • . ,, • t t t t t
" .,, ?-
"'
\ \
I I -; .. ~ t '1' ,,. ~ ' "
,< ,< ;. ;. ;;. ;.
... ,. :, ,._ ., "-' .:;:; .;, '.;: 1 ~ f ~ ;J. ...; .:. ;:;; ; r- ,;, .. ,. ::- ..
"' .;.. .;,
Zone #1 piezometer 4/17/97 to 5/1/97

Zone #1 piezometer: 5/30/97 to 7/1/97

Zone #4 piezometer: 7/1/97 to 8/2/97

<i++-Hc-H-H+++f-+++++H-++H+++H-tt++-H-J-Hc-H-H-H-tt-i-t-H-tl-++++-++-t++++++-H-+t-+++++H-H-+-hH-++-t~H-++-~~ "' :,
~ ,- P=ill=+HH+ II
,.,! I 1111
,.
I I I I I I ! ' I I
I I
I I I I i !
; I ! ! I i !
I I I
t+ ffl I
I I
I I i ! I i
I I I ,,
mi :-:: ~+h I' I I
1:'I r< n' ~ ~ ... " ~ ·~-~- ~ 'i, ... « ~ V I I
' I --1 I
I I I I I I
I
,,H-H-H-+++++++++-++++++++-H-++++-+++++++++++++++++-H++++++++++++++m++++t+++++t+-m+t+-+-++++-l-H+H+H···
I\
lfll++-+++H-+++++++++++1++-+++H+HH++-1-++++++-++++-+++H-+++++++++++++++1++-+++H-++H+H-++H-H+~
Zone #4 piezometer: 8/12/97 to 9/3/97
• ~
• -• --t t t t t
..
<:
"' ~
i• I £
•'2.
,':,
t .. "'
... ' ts
t t t t t
• • • • • • • t
• t t t t t t t .,( •• t t t t
• •
.'I ~ 6 r: ~ ;:; :.-" " ;.::: -~ t! ;:; :.-"' cl.
;:::;
~~
'
.,
..
I
I j
+H-i I j 1
I I I I I
•-+-I
I
. . ·····-··. ~· ·- .. ... 11 I I I I I
; I I I
ID± I
• '•
" ~-!> ...
II v . :
!
' .... Ii Ii I' rm m
I I ffl W-• II
• :, I I
~-- I I I I
I w
I l.J
I :)
I ~ I I
I I I
11
• ,.
I I ffi mm ~
I ~ m, .,.
" ' a .. r
"' ' . "'
.
~
" I J .
I I I J i
. I I I I ' I .?j
i I
II i I l :,. ~ .
I i I I ''' I-· -, ... I
I ''' • I
I + i I I I I 'I
I ' I I I ,. I I I, I -I I i I I 'I
I I I ,. I : ' ..... ....
l I n ! ' ,+ -r~ .. ,, .. LL. - '+•I-• I ;., ,;. .. U : .. ;.. . -----1:-i-
·i•;··>• ••; ·; .. , .. I
: I : ,+· I I I i I ii+(::':~+i i I
I . c· ' I l I I i I I \ I I I i i I I I I I I I : ~--! ! I I I I I I I i
I i ; .. I I I I I'' I ·i;. . ·---! l j i I
~ I . I I I I
I i +--l I. I ii i ! I
Ii ' I I I i :w , ... I 'I #Ft i .... ! i
I I I I I ! l I ! I I I .; ... . :
I I ' I II I I I : I ...
' f--·-H I I I I ;.,
I I ! i t,1 I I I ! I ' I
i I I I
' I I I I l I I i I i I , i I
n Ii i I I 'f ' I
I I I I I I I I
I I I I I. I
I I I I I 1 I I I I I 1 I 1 I I I I I I I I I ' !
' I I i I i : I 1 I I I,: i:,, I +t+ '. I I I ! I I ! I I I I I i I j
I. I I I I I Ii I I I, I '!. ! . I I l
Zone #4 piezometer: 9/3/97 to 10/8/97