universal health care 101: lessons for the eastern ... · lessons for the eastern caribbean and...
TRANSCRIPT

WP/09/61
Universal Health Care 101: Lessons for the Eastern Caribbean and
Beyond
Evridiki Tsounta


© 2009 International Monetary Fund WP/09/61 IMF Working Paper Western Hemisphere Department
Universal Health Care 101: Lessons for the Eastern Caribbean and Beyond
Prepared by Evridiki Tsounta1
Authorized for distribution by Paul Cashin
March 2009
Abstract
This Working Paper should not be reported as representing the views of the IMF. The views expressed in this Working Paper are those of the author(s) and do not necessarily represent those of the IMF or IMF policy. Working Papers describe research in progress by the author(s) and are published to elicit comments and to further debate.
Despite the increasing interest in universal health care, little is known about the optimal way to finance, design, and implement it. This paper attempts to fill this gap by providing some general policy recommendations on this important issue. While most of the paper addresses the Eastern Caribbean Currency Union (ECCU) countries, its policy implications are applicable to any country. The paper finds that the best financing option is country-specific―depending on a country’s economic, cultural, institutional, demographic and epidemiological characteristics, as well as political economy considerations. However, taxation should be the primary financing source. It also concludes that an appropriate and realistic benefit package would need to be designed to ensure the system’s financial viability. Regarding the optimal way to implement universal health care, certain preconditions are needed, including sound public administration, a small informal economy, and a transparent health financing system that builds social consensus. JEL Classification Numbers: H51, I11, I18 Keywords: Health economics, government expenditure Author’s E-Mail Address: [email protected] 1 The author is grateful to Paul Cashin, Catherine Pattillo, Nancy Wagner, Rupa Duttagupta, Yan Sun, Wendell Daal, Ding Ding, Kai Guo, Adam Leive, seminar participants at the First ECCB/IMF Research Seminar in the Eastern Caribbean Central Bank (ECCB), the Caribbean Development Bank, the International Monetary Fund and the Ministries of Finance at St. Lucia and St. Vincent and the Grenadines for insightful comments and suggestions. Cleary Haines, Joan Hewitt and Hildi WickerDeady provided excellent research and production assistance.

2
Contents Page
I. Introduction ......................................................................................................................3 II. What are the Available Financing Options for Universal Health Care? ...........................4 III. The Challenges of Population Aging and the Epidemiological Transition ......................5 IV. What Would Be the Optimal Tax: General Taxation Versus Mandatory Payroll/ Social Security Contributions? .....................................................................8 V. Providing Universal Coverage: A Single Provider or Numerous Providers?.................11 VI. Designing the Benefit Package.......................................................................................13 VII. Preconditions for Successfully Implementing Health Care Reforms............................15 VIII. Conclusions..................................................................................................................19
References .............................................................................................................................21 Boxes 1. National Health Insurance in Taiwan Province of China (POC)......................................12 2. The Targeting of Health Services to the Poor: An International Perspective...................14 3. The National Institute for Health and Clinical Excellence (NICE) ..................................15 4. Examples of Planning and Gradually Extending Universal Health Care: Republic of Korea and Taiwan Province of China...................................................................................18 Tables 1. Selected Countries with Universal Health Care...............................................................26 2. Selected Caribbean Countries Planning Universal Health Care Coverage......................27 3. ECCU: Official Development Assistance for Health, 1973–2005 ..................................28 Figures 1. ECCU: Long-Term Health Care Costs, 2005–35 .............................................................29 2. ECCU: Diabetes Prevalence by Age Group, 2000–30 .....................................................30 3. ECCU: Cost of Treating Diabetes, 2000–30 ....................................................................31 Appendices I. Proposed Universal Health Care System in St. Lucia ...................................................32 II. Projecting Long-term Health Care Costs Due to Population Aging ..............................34 III. Estimating Age-adjusted Health Spending ....................................................................35

3
I. INTRODUCTION
Universal health care has received considerable attention in recent years. In such a system, the population enjoys free of charge a specific list of health services, often linked to a list of diseases. These services are typically financed by the government, via mandatory payroll/social security contributions, general taxation, or a combination of both. For example, general tax-based funding is used in the United Kingdom, Australia, Canada, Denmark, Sweden, Cuba, Italy and Brazil, while mandatory payroll/social security contributions finance universal health care in Germany, Japan, France, Singapore, and Costa Rica. In most Caribbean countries, budgetary allocations from the central government are the dominant source of health financing (Table 1). Many Caribbean countries are actively considering introducing universal health care. Examples include the Eastern Caribbean countries of St. Lucia and St. Kitts and Nevis, which are moving in that direction primarily to tackle high-out-of pocket spending (Table 2, Appendix I). The rationales for public intervention in providing health care are well-documented in the literature. They relate to the issues of public goods, externalities, and insurance failures (Musgrove, 1996). Health financing goals―which include reducing inequality (by lowering out of pocket spending); preventing individuals from falling into poverty in the event of catastrophic medical expenses; and improving health outcomes by ensuring financial access to basic health services for all―are often cited as arguments supporting public intervention. For example, a World Bank (2006) study finds a strong negative relationship between government health spending and health outcomes as measured by maternal mortality and child mortality. They also find that a 10 percent increase in government health spending has a larger net impact in reducing under-five mortality and maternal mortality than a 10 percent increase in education, roads, or infrastructure. Despite the increasing interest in universal health care, there are few contributions on the optimal way to finance, design, and implement it.2 This paper attempts to fill this gap by providing some general policy recommendations on this important issue. While most of the paper addresses the Eastern Caribbean Currency Union (ECCU) countries, its policy
2 Exceptions are World Bank (2006), Hsiao and Heller (2007), and Tsounta (2008).
Under-Five Mortality Maternal Mortality
Dominica -4.09 -5.36Grenada -3.59 -3.96St. Kitts and Nevis -3.52 -3.77St. Lucia -3.62 -4.03St. Vincent and the Grens. -3.37 -3.33
Jamaica -3.32 -3.20Trinidad and Tobago -3.30 -3.15
Source: World Bank (2006).
Impact of a 10 Percent Increase in Government Health Spending on:
(percent change)

4
implications could apply to any country.3 More specifically, the study is intended to assist policymakers in designing, financing and implementing universal health care based on the experience of countries with such a health system. The analysis compares and contrasts the two main financing options, general taxation and mandatory payroll/social security contributions, taking into account the ECCU’s emerging demographic challenges and the increasing prevalence of chronic diseases, often referred to as the epidemiological transition. The study also investigates the successes and failures of countries that have introduced universal health care, in order to draw policy lessons on designing the benefit package and implementing universal coverage. This study finds that the best financing option is country-specific―depending on a country’s economic, cultural, institutional, demographic and epidemiological characteristics, as well as political economy considerations. However, certain basic guidelines need to be satisfied no matter which financing option is chosen. In particular, the financing option has to be: (i) domestically-based, (ii) sustainable, (iii) efficient, (iv) equitable, and (v) politically acceptable. It also concludes that an appropriate and realistic benefit package would need to be designed with a progressive scenario for extension to ensure the system’s financial viability. Regarding the optimal way to implement universal health care, certain preconditions are needed, including sound public administration, a small informal economy, and a transparent health financing system that builds social consensus. The necessary monitoring processes and incentives should also be put in place to ensure that abuse of the system is minimized, such as over-utilization of services. The paper is structured as follows. Section II outlines the possible financing options for universal health care. Section III estimates how population aging and the epidemiological transition could affect the future health costs in the ECCU. Given these costs, Section IV compares and contrasts the two widely used tax-methods of financing universal health care, general taxation and payroll/social security contributions. Section V discusses how universal health care could be provided, and Section VI analyzes how the benefit package could be designed. Section VII provides some general guidelines for a successful implementation of universal health care. Section VIII concludes. II. WHAT ARE THE AVAILABLE FINANCING OPTIONS FOR UNIVERSAL HEALTH CARE?
Health system reforms should be undertaken in the context of the government’s available and projected “fiscal space.” In principle, the fiscal space in any country could increase through tax measures (tax increases or better tax administration); lower government spending; additional borrowing; and external financing (e.g., grants from donors). Given that the ECCU countries are among the most highly indebted countries in international
3 Formally, the ECCU includes the six Fund-member countries of Antigua and Barbuda, Dominica, Grenada, St. Kitts and Nevis, St. Lucia, and St. Vincent and the Grenadines, and the two U.K. territories of Anguilla and Montserrat. In this paper, ECCU refers solely to the six Fund-member countries.

5
comparisons (IMF, 2008), additional borrowing to finance health spending is a less desirable route. Moreover, increased recurrent expenditure on health (salaries, medication) should not be financed by accumulating debt but rather using reliable and permanent sources of funding (long-term resources).
Similarly, the ECCU cannot rely on external sources for universal health care financing. In general, disbursements of official development assistance (ODA) have been disappointing in recent years to the region, and ODA for the health sector, in particular, is limited to mostly low-income countries. In addition, the health system’s sustainability cannot rely on donors’ commitments, which in recent years have been unpredictable due to: (i) political and budgetary decisions by the donors; (ii) administrative delays on the donor’s side; and (iii) substantial bureaucratic procurement and reporting requirements that often result in noncompliance with agreed conditionalities (Table 3 and World Bank, 2006). Even if donor assistance is provided, it is questionable whether the country would be able to sustain the same services once donor funding stops. Thus, health system reforms should largely be based on domestic sources of finance. Taxation should be the main source of financing. Given that health spending involves recurrent expenses, which would only rise with population aging and the shift towards chronic diseases, it is advisable that taxation be the main source of financing. Before analyzing appropriate taxes to finance universal health care, it is important to show the potential impact of population aging and the epidemiological transition on the ECCU’s future health costs.
III. THE CHALLENGES OF POPULATION AGING AND EPIDEMIOLOGICAL TRANSITION
The shift in demographics and the trend towards noncommunicable but chronic diseases will impose additional challenges in the health system of every country, with profound effects on the quantity and type of health services needed. For example, Ivaschenko (2005) finds that aging would have a positive and significant impact on health care costs for OECD countries. According to World Bank (2006), over the next 20 years, changes in population size and structure alone will increase total health spending needs by 47 percent in Latin America and the Caribbean. As noted by WHO (2002) with population aging, prevailing disease patterns will change, which will in turn have major implications on health care
0
50
100
150
200
1985 1990 1995 2000 2005
ECCU: Official Development Assistance, 1985–2005(In 2004 U.S. Dollars)
Source: Organization for Economic Co-Operation and Development, DAC Database.
0
5
10
15
20
25
30
35
40
Antigua &Barbuda
Dominica Grenada St. Kitts &Nevis
St. Lucia St. Vincent &Grens.
DisbursementsPending Commitments
ECCU: Official Development Assistance for Health(In millions of U.S. dollars at 2004 prices, total of 1973-2005)
Source: Organization for Economic Co-operation and Development.

6
expenditures, on the kinds of institutions and formal arrangements that will be needed to support family care giving, and on the distribution of resources along a typical lifespan. Population Aging The Eastern Caribbean region will face significant aging in the next three decades. While the working-age population (aged 15–59 years) is not projected to decrease in the next three decades, the old-age population is expected to increase rapidly. For example, the number of people over the age of 60 is projected to almost double by 2035, from 9.5 percent of the population in 2005 to 17 percent in 2035.4 Population aging could have significant budgetary implications, especially on health care expenditure. While data for the ECCU countries are not available, international data indicate that individuals generate greater health-related costs at the end of life than at any other point in their lifespan (Fogel, 2003; Mahal and Berman, 2001). Brimacombe et al. (2001), for example, have suggested that Canadians consume more than 50 percent of their lifetime health expenditures after the age of 65, because of the health needs that are necessitated by the aging process. Similarly, Honjo (2006) notes that elderly patients (aged 65+ years) cost the U.K. health system five times more than those under 65, while the Federal Statistical Office of Germany (2004) reports that health costs for those aged 65-85 are at least twice as high as the German national average. Based on these findings, this study estimates the health spending (in percent of GDP) that ECCU countries could face in the next three decades under three scenarios: per capita health cost for the elderly (aged 65 years and above) (i) equals; (ii) is twice; and (iii) is five times the national average.5 Demographic pressures alone could increase health spending significantly in the ECCU, as also noted in Monroe (2008). The projected increase in health spending (in percent of GDP) by 2035 due to demographics alone could be over two percentage points, under feasible assumptions for most countries (Figure 1). With more than two-thirds of the health spending already accrued by the public sector in the ECCU, the impact on public finances due only to population aging is thus projected to be large. It is important to note that this impact
4 The expected return of numerous expatriates to the ECCU, now in retirement age, would also imply increasing demand for social services, including heath care.
5 In all cases population projections are based on each country’s latest Actuarial Reports. Appendix II provides more details on the estimation method.
60
80
100
120
140
160
180
200
220
2005 2015 2025 203560
80
100
120
140
160
180
200
220
0–1516–5960+Total
Sources: International Labor Statistics; Country authorities; and Fund staff calculations.
ECCU: Population by Age Group, 2005–35 (Index 2005=100)

7
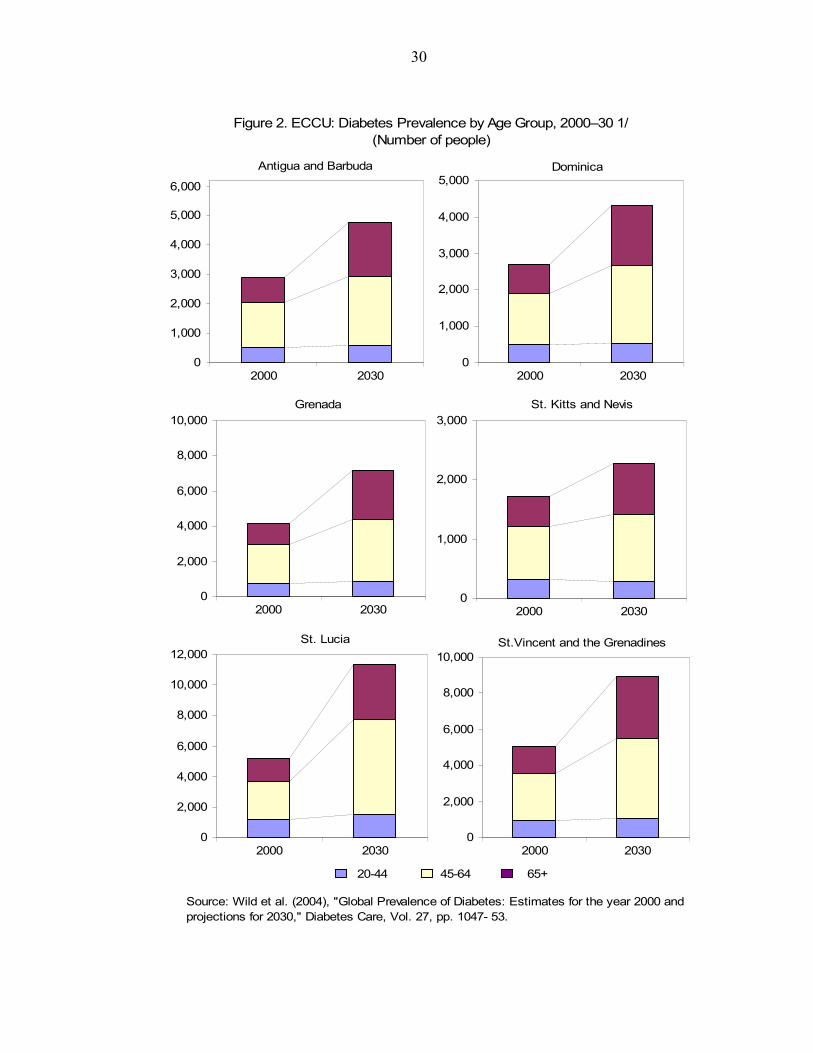
assumes that the organization and financing of the health system remains unchanged (e.g., no reform in the health system is undertaken). Epidemiological Transition Due to population aging and economic development, there is a shift of mortality from communicable causes to noncommunicable chronic diseases. This shift is expected to intensify in the coming decades since the demographic transition accelerates the epidemiological transition—as the mortality of infections, maternal and childhood causes of diseases decreases, the average age of the population increases, and as a result chronic, age-related illnesses become more prevalent (World Bank, 2006). Already in most middle- and high-income countries, including in the ECCU region, cardiovascular diseases, neoplasm malicious, and diabetes are among the leading causes of death. For example, diabetes is considered the most significant “new disease” of the epidemiological transition (Caribbean Commission on Health and Development, 2005). It is a chronic disease that requires lifelong, continuous medical care, and its economic impact is expected to be large in the next two decades. One in ten of the adult population in the Caribbean region and one in five people over the age of 40 are currently living with diabetes.6 According to Wild et al. (2004) diabetes was estimated to affect 22,000 residents in the ECCU in 2000, with the numbers projected to double by 2030.7 Aging of the population and 6 St. Lucia is ranked first in the incidence of diabetes worldwide, in per capita terms. According to the results of the Universal Health Care Diabetes and Hypertension pilot screening project released in April 2007, 28.1 percent of the population has abnormal glucose levels and 8.1 percent of those tested were diabetic. In addition, almost half of St. Lucians have abnormal systolic blood pressure, the highest in the world.
7 Wild et al.’s (2004) diabetes estimate is actually an understatement; they projected that the incidence of diabetes in St. Lucia would rise from 5,200 in 2000 to 11,300 by 2030. However, the Universal Health Care Diabetes and Hypertension (2007) pilot screening project, recorded 13,000 diabetic cases as early as 2007.
0
400
800
1200
1600
2000
AN
TIG
UA
&B
AR
BU
DA
Bar
bado
s
DO
MIN
ICA
GR
EN
AD
A
Jam
aica
ST.
KIT
TS &
NE
VIS
ST.
LU
CIA
ST.
VIN
CE
NT
& G
RE
NS
.
Trin
idad
&To
bago
Total communicable Diabetes mellitusCardiovascular diseases Cancers
Other, non-communicable
ECCU: Age-adjusted Total Death Rates by Cause, 2003(Per 100,000 population)
Source: World Health Organization.
132.7 137.5152.3
81.7 57.340.2
229.1 232.4 258.2
68.956.034.7
148.1 151.0171.124.2
20.3
0
100
200
300
400
500
600
700
800
900
1,000
2005 2015 2030
Cardiovascular diseases Malignant neoplasmsDiabetes mellitus Other Non-communicable diseasesHIV/AIDS Other Communicable diseases
Source: World Health Organization.
Region of the Americas: Causes of Death, 2005–30(Per 100,000 population)

8
increases in obesity trends are expected to further worsen the diabetes outlook. For example, diabetic cases are more concentrated in those aged 45 and above (Figure 2).8 For illustrating the costs from the epidemiological transition, the study estimates the cost of treating diabetes under two scenarios (Figure 3):
• Scenario 1 assumes that health costs rise in line with the average historical health inflation rate;
• Scenario 2 assumes that health cost inflation is two percentage points above the historical average.9
Assuming that the annual cost of treating diabetes is EC$1,100 per diabetic case, one could estimate the diabetes cost for the ECCU. This per diabetic cost estimate, which represents the actual cost of treating diabetes in Jamaica per case, includes both direct and indirect costs incurred due to the disease (Barcelo et al., 2003).10 The Jamaican study finds that more of the costs are direct; more than 50 percent of the total cost is explained by the laboratory diagnostic tests, and one-fourth of the cost is associated with doctor charges/visits. Based on the Jamaican proxy, this study finds that the cost of treating diabetes could rise significantly in the next 25 years for some ECCU countries (Figure 3).11 Even under the scenario where health costs rise with their historical trend, the cost of treating diabetes could triple for Dominica and St. Lucia by 2030. With population aging intensifying even further in the post 2030-period, the cost of treating diabetes is projected to rise even further, imposing an increasingly large burden on public finances, if the public sector continues to undertake the majority of the spending.
IV. WHAT WOULD BE THE OPTIMAL TAX: GENERAL TAXATION VERSUS MANDATORY PAYROLL/SOCIAL SECURITY CONTRIBUTIONS?
So far it has been established that taxation should be the main source of universal health care financing, given the projected increases in health spending amid population aging and the epidemiological transition. This section compares and contrasts universal health care
8 Diabetes is also higher among women since they face higher obesity rates, one of the leading causes of diabetes.
9 A survey by the PriceWaterHouseCoopers (2005) finds that nearly half of health care executives interviewed from 26 countries believe health care costs would, in the future, increase at a higher growth rate than in the past.
10 Direct costs include the cost of clinic visits, lab tests, drugs; indirect costs include the productivity loss due to time off for hospitalization and doctor’s visits. The total cost does not include a value for the life lost due to the disease. 11 Both scenarios project diabetic cases based on projections by Wild et al (2004). For St. Lucia, actual numbers are used up to 2007; for later years data are interpolated using the trend by Wild et al. (2004).

9
financing using the two most widely-used financing options, namely general taxation (such as VATs) and payroll/social security contributions.12 According to the IMF and the World Bank (2005), all taxes should be judged by the following five commonly-accepted criteria. The tax should promote:
• Revenue adequacy and stability, by raising a significant amount of revenue, be relatively stable, and be likely to grow over time.
• Efficiency, by minimizing economic distortions. • Equity, by treating different income groups fairly. • Ease of collection, by being simple to administer to keep costs at a minimum. • Political acceptability, by being transparent and its uses should be clearly defined to
promote acceptability.
Revenue adequacy and stability
The revenue potential from payroll contributions depends on the country’s labor market conditions, existing payroll tax rates, and the size of the informal economy. While revenues from both general taxation and payroll/social security contributions rise with economic growth, evidence from Eastern European and Central Asian countries that have introduced universal health care indicate that growth is not a necessary and sufficient condition for revenue adequacy. These countries, characterized by a large informal sector, many self-employed and under-employed, and already-high payroll or unemployment insurance tax rates, have failed to generate sufficient tax revenue (using payroll/social security contributions) to finance universal health care (World Bank, 2006; Normand and Weber, 1994). For example, Kazakhstan abandoned universal coverage financed mostly via social security contributions in 1999, after disappointingly low revenue collections―only 40 percent of the expected revenue was actually collected (Langenbrunner, 2005). Tax avoidance by labor and small businesses, and high levels of unemployment and self-employment were also cited for the low revenue generation in Russia, Albania and Romania (Langenbrunner, 2005). Taiwan Province of China (POC) also encountered financing difficulties following the introduction of universal health care, since its revenue base was not
12 For an extensive analysis, please refer to Tsounta (2008).
-3-113579
1113
Antigu
a & B
arbu
da
Domini
ca
Grenad
a
St. Kitts
& N
evis
St. Luc
ia
St. Vinc
ent &
the G
rens
.
Public healthTotalReal GDP
ECCU: Average Annual Growth Rate in Per Capita Health Spending and Income, 2000-03
(In percent)
Sources: World Health Organization; and IMF, World Economic Outlook.

10
keeping pace with income. Under Taiwan’s health financing system all plan participants had to pay a payroll-capped contribution (subsidized for the poor). With health costs rising faster than per capita GDP, the contributions were unable to cover health costs, and amid a heated political debate the ceiling was raised in 2002 (Cheng, 2003). Given that in the ECCU health costs have also been rising faster than per capita GDP, such a capped system would not be appropriate. In general, experiences from many countries that rely on payroll/social security contributions as a major source of health financing suggest that numerous conditions are needed for successful revenue generation. Strong economic growth is needed to raise sufficient revenues; a large formal economy to ensure a reliable source of payroll/social security contributions (Ensor and Thompson, 1998); strong tax administrative capacity to enforce collection; and reasonable contribution rates to finance health spending while providing incentives for the majority of the population to contribute. General taxation could better secure revenue adequacy for the ECCU. General taxation, in the form of indirect taxes such as VATs and sales taxes, could ensure that a broader base is taxed, including the unemployed and self-employed, the tourism sector and most of the large informal sector. VATs, for example, have already been introduced in the ECCU countries of Antigua and Barbuda, Dominica, and St. Vincent and the Grenadines, with tax yields and enforcement rates at higher levels than originally envisioned. Outside the region, some countries (for example, Ghana) have gone a step further and increased the VAT rate to finance universal health care. Efficiency The broad-based nature of general taxation provides efficiency gains (Coady et al., 2004). In contrast, payroll/social security contributions have been found in the case of Latin American and Caribbean countries to raise tax evasion and reduce the size of the formal labor market (Baeza and Packard, forthcoming). World Bank (2006) also notes that payroll contributions raise labor costs and thus hinder economic growth, employment and competitiveness. Equity While general taxes rely on a broad revenue base, they could be regressive. For example, a VAT is typically regressive, since low-income people pay a higher percentage of their
0
10
20
30
40
50
60
The
Bah
amas
Gre
nada
St.
Kitt
s &
Nev
is
Trin
idad
& T
obag
o
Bar
bado
s
Ant
igua
& B
arbu
da
Dom
inic
a
Jam
aica
Guy
ana
St.
Luci
a
Dom
inic
an R
epub
lic
Bel
ize
St.
Vin
cent
& G
rens
.
Caribbean: Estimated Size of the Informal Economy, Early 2000s(In percent of GDP)
Source: Vuletin (2007).
11
income in tax than high-income people. However, indirect taxes could be designed to be more progressive; for example, goods that are relatively important in the household budget of the poor (such as basic food and clothing) could be made exempt. In contrast, payroll/social security contributions have been found to be progressive only in some countries and regressive in others (van Dooslauer et al., 1999; Wagstaff et al., 1999; Normand and Busse, 2002). Ease of collection Tax collection per se is easier using payroll contributions; however, issues related to informality must also be considered. Payroll/social security contributions are automatically deducted from employees’ payrolls, which make their collection an easy proposition. However, in the case of the ECCU, collection could be hindered by the region’s large informal economy (Vuletin, 2007), and significant self-employed and agriculture sectors, as evidenced by the case of Antigua and Barbuda (Lalta et al., 2005). In addition, since incomes in the informal sector tend to be erratic, assessing them for payroll contributions would be particularly difficult (Normand and Weber, 1994). Spain and Iceland shifted their health financing from social security contributions to general taxation to avoid these problems (World Bank, 2006). Political acceptability Payroll/social security contributions are more politically acceptable than general taxation, since the latter is typically regressive. However, the political acceptability of general taxation could be enhanced if there is a specific individual entitlement that accompanies the tax (that is, a benefit tax), such as in the case of Ghana with its higher VAT tax rate (World Bank, 2006).
V. PROVIDING UNIVERSAL COVERAGE: A SINGLE PROVIDER OR NUMEROUS PROVIDERS?
In most countries with universal coverage, health services are largely delivered through a network of public providers. However, very often governments also contract services from non-governmental institutions and private providers, giving to the population a larger freedom to choose their service provider. However, this increasing freedom usually comes with higher administrative costs associated with multiple insurers. For example, countries with fewer providers have been the most successful at containing health cost increases, possibly by negotiating lower doctors’ fees (Box 1 and Evans, 2002). Irrespective of the number of health care providers, it is important to ensure that the correct incentives and the appropriate regulatory tools are in place to avoid excessive provision of services. Such a problem could induce cost escalation, as currently observed in many OECD countries. An infamous example was Aruba, Kingdom of the Netherlands which suffered escalating health costs following the expansion of its health insurance scheme to

12
Box 1. National Health Insurance in Taiwan Province of China (POC)1
Taiwan’s experience with the move to a national health system in 1995 has been favorable.
• The goal of the implementation was to provide equal access to health care to all citizens and control health spending. Prior to the reform, only 59 percent of the population was insured (under one of the ten available insurance plans), resulting in a large out-of-pocket coverage (around half of total health spending). The uninsured 41 percent of the population were mostly elderly and young children (below 14 years old).
• Taiwan POC was able to establish its national health insurance due to a confluence of two main factors: (i) there was a strong public demand for universal health insurance, also supported by the opposition, and (ii) there was sustained economic growth which led to an era of prosperity, thus making feasible the financing of a major new program (World Bank, 2006).
• The national health insurance system provides a comprehensive benefit package that covers preventive and medical services, prescription drugs, dental services, Chinese medicine, AIDS/HIV treatment and home nurse visits. Most preventive services are free (annual checkups, maternal and child health care, regular well childcare up to age six). However, in addition to a premium contribution (subsidized for the poor), a co-payment is charged for each outpatient visit to clinics (ranging from $1.5 to clinics with referral to US$11 to academic medical centers without referral), and a 10–30 percent coinsurance rate for inpatient services, depending on the length of stay. In general, the total amount that each patient has to pay is capped to 10 percent of average per capita national income for a calendar year). Poor households are exempt from all these costs.
• The two goals of the National Health Insurance System were achieved:
o Access to health care increased dramatically. By-end 1995, 92 percent of the population had enrolled, dropping the out of pocket spending from 48 percent in 1993 to 30 percent in 2000.
o Health spending inflation moderated. Following the reform, health spending increased only moderately (from 5.3 percent in 1995 to 6 percent in 2000) consistent with the historical trend. The moderate health spending inflation incurred despite an increase in health services by the previously uninsured users. For example, the average hospital admission rate increased from 110 per 1000 people in 1994 to 120 per 1000 in 1996. This favorable development could be facilitated by the simple payer’s system (versus the old ten-providers one), which enabled Taiwan POC to negotiate lower fees and lower administrative and transaction costs. The copayment and coinsurance schemes as global budgeting might have also contributed to the curtailing of health costs.
• The health system received high public satisfaction ratings, reaching 70 percent at some times (prior to 1995, ratings were around 30 percent). The system had also managed to decrease inequality in financing health care, as measured by the household’s contribution to health versus its total capacity to pay.
1/ This box is based on Lu, Jui-Fen Rachel and William C. Hsiao (2003), “Does Universal Health Insurance Make Health Care Affordable? Lessons from Taiwan,” Health Affairs, Vol. 22, No. 3, pp.77–88 ; Cheng Tsung-Mei (2003), “Taiwan’s New National Health Insurance Program: Genesis and Experience So Far,” Health Affairs, Vol. 22, No. 3, pp. 61–76 and Chiang, Tung-liang (1997), “Taiwan’s 1995 Health Care Reform,” Health Policy, Vol. 39, pp. 225–239..

13
cover all population segments, due to limited safeguard clauses. In Aruba, the fee-for-service payment method applied to specialists―without appropriate regulatory tools and limits―led to excessive provision of services, and thus cost escalation (PAHO, 2003). Under Aruba’s system, there was no monitoring authority to link each service provided with a patient’s name. As a result, doctors ended up receiving large payments by providing many services to the same patient. These oversights have later led to a drastic reform of the system (regarding coverage and premiums) with positive fiscal implications. Canada, on the other hand, was able to contain health costs, despite a similar fee-for-service arrangement, by establishing global budgets for hospitals and for physicians’ services. In addition, each Canadian province/territory manages the volume of services by monitoring the quantity of services delivered by each physician (Heller, 2007). In addition, the provider payment mechanism needs to carry incentives that encourage providers to behave efficiently and rationally in terms of the types, amounts, and quality of services they offer (Wouters, 1999). There is an extensive literature on the optimal provider payment system and it argues that consumer welfare is maximized when providers are given incentives to restrict supply of services provided via their reimbursement system. Ellis and McGuire (1990) find that the optimal provider payment is achieved as a mixed reimbursement system, with some part of payment prospective and some part of payment cost-based. Similarly Pauly (2000) claims that the optimal provider payment system would generally involve a mix of fee-for-service and predetermined (salary or capitation) payment, and may well involve positive patient cost sharing, to avoid moral hazard.
VI. DESIGNING THE BENEFIT PACKAGE
Economic, social, and political considerations usually dictate the mix of health services provided by a government. Given that all ECCU countries face budget constraints and very high debt levels, decisions on which services should be government-financed need to be taken with special consideration. The choice of the benefit package, no matter how it is financed or provided, could have important implications for the opportunity cost of the resources used and could generate far-reaching fiscal contingencies, given demographic and epidemiological changes. The package should respond to the population’s health needs and medical and clinical priorities. The first step in designing the appropriate benefit package is to recognize the health needs of the country. It is important that the country prioritizes the health services that would be included or excluded under universal health care coverage. Although epidemiological data are not collected systematically for the ECCU region, it is known that diabetes, cardiovascular and neoplasm diseases are the major causes of mortality. A universal, small package of services seems to be most appropriate for the government to finance initially. As noted in World Bank (2006), the overall benefit package should essentially encompass public goods, goods with externalities, and other interventions with proven impact on the health goals set by the country, and leave any other clinical care and catastrophic expenditures to be financed for the poor through some targeting mechanism.

14
With regards to pharmaceuticals, drugs benefits should apply to a defined and limited list of prescribed drugs, and generic prescribing should be implemented when possible, to contain costs. A streamlined benefit package should be used for the total population, and specific measures could be initiated to improve the targeting of spending to the poor. A study of seven African countries suggests that health services are mainly used by the high- and middle-income households due largely to access problems and high opportunity costs for the work-time that the poor lose to visit a doctor (Castro-Leal et al., 1999). As noted by Rawlings (2004), conditional cash transfers has been successfully used in many Latin American and Caribbean countries, where a direct cash payment is provided to poor households, contingent on specific behaviors (Box 2).13 Evidence suggests that well-designed conditional cash transfers have the potential to improve health and poverty outcomes, and improve human capital with relatively minimal administrative costs (World Bank, 2006).
Experts suggest that private financing is more suitable for private goods such as individual ambulatory and institutional care services, pharmaceuticals and medical interventions (World Bank, 1993; Musgrove, 1996; Barrett and Lalta, 2005). Many point to the Swiss compulsory basic health insurance scheme, which covers illness, accidents, certain preventive measures and maternity for all residents as a model for determining the basic 13 In some pilot programs, cash grants were based on an estimate of the economic cost of travel and waiting time for the beneficiary.
Box 2. The Targeting of Health Services to the Poor: An International Perspective 1
• Colombia established universal coverage under two kinds of basic coverage depending on the patient’s income. Payroll-tax contributors have access to a minimum level of defined coverage and non-payroll tax contributors (i.e., the poor) have access to a subsidized Mandatory Health Plan that covers some additional services (World Bank, 2006).
• In Suriname, extremely poor individuals receive a health card, which permits access to ambulatory, drugs and inpatient services from public and some private providers at zero or minimal cost. This program is part of the Ministry of Social Affair’s social safety net for the poor, and eligibility is based on field visits and applications (Lalta et al., 2005).
• In Jamaica, the Program for Advancement through Health and Education (PATH) seeks to increase educational attainment and improve health outcomes among the poor by making cash benefits available only when the targeted individual has met qualifications for school attendance and visits to health facilities (Lalta et al., 2005). The program targets children up to 6 years, persons 65 years and older, pregnant and lactating women, and poor adults.
1 This box is based on World Bank (2006).

15
level of care that needs to be universally provided (PriceWaterhouseCoopers, 2005). The French also distinguish between private and public goods in their benefit package. For example, patients pay 30 percent of the ambulatory care, 35–65 percent of the pharmaceuticals, and 40 percent of the laboratory costs. These costs are not payable for pregnant mothers, disabled children and people with specific diseases, such as diabetes and AIDS (Conference Board of Canada, 2004; UK National Audit Office, 2003). Similarly, the British health insurance system takes into account cost effectiveness and thus efficiency allocation in deciding which services would be publicly-financed and which would be privately purchased. Box 3 analyzes the functions of UK’s National Institute for Health and Clinical Excellence (NICE) in prioritizing which health services should be publicly financed.
VII. PRECONDITIONS FOR SUCCESSFULLY IMPLEMENTING HEALTH CARE REFORMS
This section considers certain conditions that are needed to ensure that universal health care is implemented efficiently, both in terms of provision and financing.
No matter the financing option chosen, several conditions are needed to ensure that the financing strategy is appropriate:
o Tax administration should be sound, so that the tax effort is translated into strong tax revenues.
Box 3. The National Institute for Health and Clinical Excellence (NICE)
The National Institute for Health and Clinical Excellence or NICE is a Special Health Authority of the National Health Service (NHS) in England and Wales, set up in 1999. NICE publishes clinical appraisals of whether particular treatments should be considered worthwhile by the NHS. These appraisals—that are fully independent of government and lobbying power—are based on clinical and cost-effectiveness, and have raised NICE’s international profile as a potential role model for the explicit prioritization of health services.
NICE was established in an attempt to defuse the so-called postcode lottery system of healthcare, where treatments that were available depended upon the area in which the patient happened to live. NICE’s main objective is to assist NHS’s efficient allocation of resources given budget constraints. In particular, NICE undertakes a benefit and expenditure analysis of various treatments and makes recommendations about which treatments can be given and in which circumstances in order to maximize the delivery of care within the available budget. The benefits are estimated using the concept of additional quality-adjusted life years following the treatment and this benefit is then compared with the cost per quality adjusted life-year gained. Thus the assessment takes into account both desired medical outcomes (i.e. the best possible result for the patient) and also economic arguments regarding differing treatments.

16
o Health care plans should be part of the government’s medium- and long- term strategy. The costs of implementing universal health care, for instance, should be carefully evaluated, taking into account its increasing future needs stemming from population aging and the epidemiological transition. In addition, the health plan’s cost should be incorporated into the medium-term expenditure framework, so as to ensure its current and future financial viability.
o Public financing of health care should be transparent. This would gather the support of the population, particularly if the advantages of the system are pointed out to build consensus (Normand and Weber, 1994).
o The informal sector should be tackled, so that no matter which financing policy is used, all health beneficiaries pay according to their ability.
Once financing is secured, appropriate planning is also essential for the successful provision of universal health care:
o It is important to ensure the effectiveness of health spending by enhancing public expenditure management and accountability. Budgetary allocations should be linked with the health system’s performance to generate a clear mechanism of accountability, as it is in the case of Rwanda under its poverty reduction plan (World Bank, 2006). Wagstaff and Claeson (2004) find that additional government spending on health has little impact on the key health indicators for the Millennium Development Goals in countries with poor governance. The authors define poor governance using the World Bank’s Country Policy and Institutional Assessment (CPIA) Index at or below 3.25 (scale 1 to 6).14 15 Thus, better expenditure management, monitoring and evaluation mechanisms are needed to ensure accountability, before government health spending intensifies (Wagstaff and Claeson, 2004). It is important to note that all ECCU countries with a CPIA Index have values above the 3.25 threshold.
14 The CPIA index assesses how conducive the policy and institutional framework is to fostering poverty reduction, sustainable growth, and effective use of development assistance.
15 Wagstaff and Claeson’s (2004) empirical analysis found that the elasticity of health outcomes with respect to expenditure depended on a country’s CPIA score. The elasticity increases in absolute size―government spending has a larger impact on health outcomes at the margin in better-governed countries. For example, at a CPIA score of 4 (one standard deviation above the mean), a 10 percent increase in the share of GDP devoted to government health spending results in a 7.2 percent decline in the maternal mortality ratio. At CPIA levels below 3.25 the impact of increased spending is statistically insignificant.
2.0
2.5
3.0
3.5
4.0
4.5
EconomicManagements
StructuralPolicies
Policies forsocial
inclusion
Public sectormanagement
2005 overall
St. Lucia St. Vincent & the Grens.Dominica Grenada
Country Policy and Institutional Assessment (CPIA) Scores by Indicator, 2005 1/
Source: World Bank data.1/ Scores range between 1 (lowest) and 6 (highest).

17
o An appropriate payment arrangement would need to be established to ensure that services are not over-utilized, possibly by introducing a mixed reimbursement system for providers. As discussed in Section V, a fee-for-service provider payment mechanism should only be applied if there are monitoring safeguards to ensure that providers do not have incentives to provide unnecessary and expensive services. If such safeguards are not available, then a capitation payment should be introduced to all providers.
o An appropriate benefit package would need to be designed. As discussed in the previous section, the package should be rather limited at the initial stage so as to ensure its financial sustainability. It should include the diseases that policymakers rank high in priority (most urgent to tackle), based on the country’s health objectives.
o It is also essential that policymakers design a realistic and progressive scenario of
extending universal health care. It should be realistic so that initial promises materialize and thus the support of major stakeholders is retained. In that respect, it is of utmost importance to carry out solid actuarial studies before implementing the system. The expansion should be progressive to ensure financial sustainability, particularly given that in its nature, health coverage is complex and thus requires time to understand and fully implement. Thus, undertaking the extension in steps will give sufficient time to the administrators to adjust the system accordingly, if needed (Box 4 and Ron et al., 1990).
o The health system should be efficient since inefficiencies have important implications
for its long-term financial sustainability. According to a PriceWaterhouseCoopers (2005) study based on a sample of 26 countries governments, hospitals and physicians are seen as having the greatest opportunity to eliminate wasteful spending in health care. In this paper, two methods are used to assess the efficiency of the ECCU health system:
• One method calculates health costs across countries, after accounting for the different demographic structure in each country; countries with older average populations would naturally have higher health cost pressures. This comparison finds that some ECCU countries (notably Grenada and Antigua and Barbuda) have very high age-adjusted health spending, and thus appear to have high inefficiencies (see Appendix III for details on the methodology).16
16 The age-adjusted numbers should be interpreted with some caution, since the methodology was originally intended to estimate inefficiencies of the health systems of developed countries.
Trin
idad
& T
obag
o
Uni
ted
Kin
dgom
St.
Kitt
s &
Nev
is
Jam
aica
Bar
bado
s
Dom
inic
a
Can
ada
St.
Luci
a
St.
Vin
cent
& G
rens
.
Ant
igua
& B
arbu
da
Uni
ted
Sta
tes
Bah
amas
Gre
nada
0
4
8
12
16
20
Age-adjusted Health Costs 1/ (In Percent of GDP)
Source: WHO, US. Census, and Fund staff estimates. 1/ Hypothetical health spending that would arise, if each country has the same proportion of its population above the age of 65, as Canada. (Esmail, 2006). It assumes an elasticity of health spending in percent of GDP to the share of population over 65 of 0.698.

18
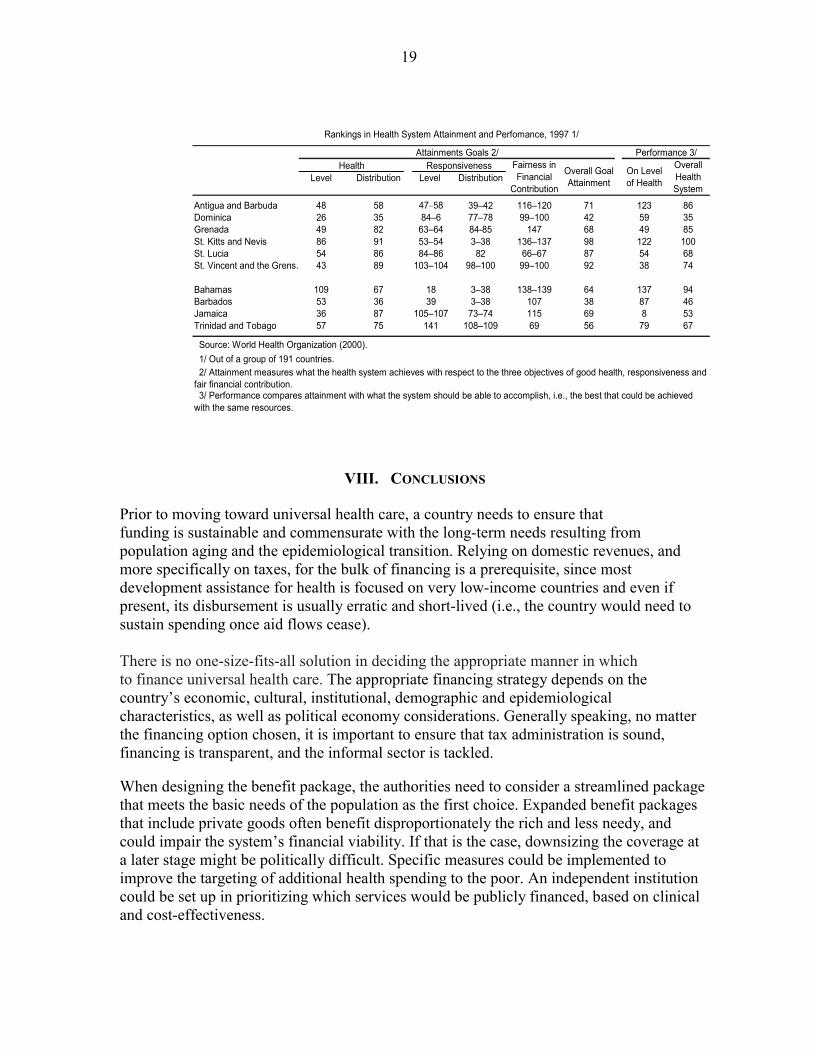
• A study by the World Health Organization (2000) finds that the health system in the ECCU region is rather inefficient in terms of goal attainment and performance.17 With the exception of Dominica, most ECCU countries have a relatively low ranking in terms of goal attainment—i.e., what the health system achieves with respect to the three objectives of good health, responsiveness and fair financial contribution. For example, St. Kitts and Nevis and St. Vincent and the Grenadines are ranked in 98th and 92nd place (out of a sample of 191 countries) on overall goal attainment (World Health Organization, 2000). Regarding health system performance, i.e., what the system could potentially accomplish given the same resources, again the ECCU region lacks behind other regional comparators. The WHO study also makes a distinction between the overall health spending level and how it is distributed in the population. Thus, tackling the health system’s inefficiencies could be pivotal prior to successfully implementing universal health care reforms.
17 The methodology of the WHO rankings has been heavily criticized given its primary reliance on imputed values instead of real data, the derivation of the weights for different indicators based on the opinions of WHO staff and people who had visited its website, and the sensitivity of the econometric specification (Williams, 2001; Musgrove, 2003; and Wagstaff, 2002).
Box 4. Examples of Planning and Gradually Extending Universal Health Care:
Republic of Korea and Taiwan Province of China
In 1989, the Republic of Korea legislated universal health insurance. This was the end-result of a successful health care reform process that was initiated in 1977, when only 8 percent of the population was covered by social security insurance (Peabody et al., 1995). The reform process included a steady extension of social security-based health coverage to all workers and their families, starting initially with workers of large enterprises (over 500 workers) and low-income households, and then gradually extended to employees of smaller enterprises and civil servants. In 1981, coverage was extended to enterprises employing 100 or less and by 1984 it was extended to smaller firms (up to 16 workers). By 1987, medical insurance coverage was expanded to the rural areas. In 1995, public authorities in Taiwan Province of China introduced legislation to create a mandatory health insurance scheme, which became fully operational in 2000 (World Bank, 2006). However, preparations had started more than a decade ago through the Council for Economic Planning and Development. The first planning stage took two years of studies and the plan included a progressive implementation of universal coverage. The first pilot project for the expansion started with the farmer’s group in 1987, and the results of the pilot projects and studies on trends of health expenditures were pivotal in enacting the legislation in 1995 (ILO/STEP 2002). __________________________ 1/ This box is based on World Bank (2006).
19
VIII. CONCLUSIONS
Prior to moving toward universal health care, a country needs to ensure that funding is sustainable and commensurate with the long-term needs resulting from population aging and the epidemiological transition. Relying on domestic revenues, and more specifically on taxes, for the bulk of financing is a prerequisite, since most development assistance for health is focused on very low-income countries and even if present, its disbursement is usually erratic and short-lived (i.e., the country would need to sustain spending once aid flows cease). There is no one-size-fits-all solution in deciding the appropriate manner in which to finance universal health care. The appropriate financing strategy depends on the country’s economic, cultural, institutional, demographic and epidemiological characteristics, as well as political economy considerations. Generally speaking, no matter the financing option chosen, it is important to ensure that tax administration is sound, financing is transparent, and the informal sector is tackled. When designing the benefit package, the authorities need to consider a streamlined package that meets the basic needs of the population as the first choice. Expanded benefit packages that include private goods often benefit disproportionately the rich and less needy, and could impair the system’s financial viability. If that is the case, downsizing the coverage at a later stage might be politically difficult. Specific measures could be implemented to improve the targeting of additional health spending to the poor. An independent institution could be set up in prioritizing which services would be publicly financed, based on clinical and cost-effectiveness.
Level Distribution Level Distribution
Antigua and Barbuda 48 58 47–58 39–42 116–120 71 123 86Dominica 26 35 84–6 77–78 99–100 42 59 35Grenada 49 82 63–64 84-85 147 68 49 85St. Kitts and Nevis 86 91 53–54 3–38 136–137 98 122 100St. Lucia 54 86 84–86 82 66–67 87 54 68St. Vincent and the Grens. 43 89 103–104 98–100 99–100 92 38 74
Bahamas 109 67 18 3–38 138–139 64 137 94Barbados 53 36 39 3–38 107 38 87 46Jamaica 36 87 105–107 73–74 115 69 8 53Trinidad and Tobago 57 75 141 108–109 69 56 79 67
Source: World Health Organization (2000). 1/ Out of a group of 191 countries. 2/ Attainment measures what the health system achieves with respect to the three objectives of good health, responsiveness and fair financial contribution. 3/ Performance compares attainment with what the system should be able to accomplish, i.e., the best that could be achieved with the same resources.
On Level of Health
Overall Health System
Rankings in Health System Attainment and Perfomance, 1997 1/
Overall Goal Attainment
Health ResponsivenessAttainments Goals 2/ Performance 3/
Fairness in Financial
Contribution

20
To avoid abuse, control measures should be established through monitoring utilization within established limits, especially if a fee-for-service provider payment scheme is used. Theory suggests that in addition to close monitoring, the optimal reimbursement of providers is one that includes a mixture of capitation and fee-for-service payments. It is also important to ensure that the health system is efficient and that public expenditure is well-managed and accounted for.
21
REFERENCES
Baeza, C., and T. Packard, forthcoming, Beyond Survival: Protecting Households From the Impoverishing Effects of Health Shocks. A Regional Study, (Washington, DC: World Bank).
Barcelo, A., C. Aedo, S. Rajpathak, and S. Robles, 2003, “The Cost of Diabetes in
Latin America and the Caribbean,” Bulletin of the World Health Organization, Vol. 81(1), pp. 19–27.
Barrett, R.D. and S. Lalta, 2005, “Health Financing Innovations in the Caribbean: EHPO
and the National Health Fund of Jamaica,” Sustainable Development Department Technical Paper Series, (Washington, DC: Inter-American Development Bank).
Bjornerud, S. and J. O. Martins, 2005, Disentangling Demographic and Non-demographic
Drivers of Health Spending: A Possible Methodology and Data Requirements, (Paris: OECD Economics Department).
Brimacombe, G., P. Antunes, and J. McIntyre, 2001, The Future Cost of Health Care In
Canada, 2000–2020: Balancing Affordability and Sustainability, (Ottawa: Conference Board of Canada).
Caribbean Commission on Health and Development, 2005, Report for the 26th Meeting of
the CARICOM Heads of Government. Castro-Leal, F., J. Dayton, L. Demery, and K. Mehra, 1999, “Public Social Spending in
Africa: Do the Poor Benefit?”, The World Bank Research Observer, Vol. 14(1), pp. 49–72.
Cheng, T., 2003, “Taiwan’s New National Health Insurance Program: Genesis and
Experience So Far,” Health Affairs, Vol. 22(3), pp. 61–76. Coady, D., M. Grosh, and J. Hoddinot, 2004, Targeting of Transfers in Developing
Countries: Review of Lessons and Experience, (Washington, DC: World Bank). Conference Board of Canada, 2004, Understanding Health Care Cost Drivers and
Escalators, (Ottawa: Conference Board of Canada). Ellis, R.P., and G. McGuire, 1990, “Optimal Payment Systems for Health Services,”
Journal of Health Economics, Vol. 9, pp. 375–396. Ensor, T., and R. Thompson, 1998, “Health Insurance as a Catalyst to Change in Former
Communist Countries?” Health Policy, Vol. 43, pp. 203–18.

22
Esmail, N., 2006, Health Insurance in the Bahamas, An Analysis of the Blue Ribbon Commission’s Proposals and An Examination of Alternate Policy Options, Commissioned by the Nassau Institute.
Esmail, N., and M. Walker, 2005, How Good is Canadian Health Care? (Vancouver: The
Fraser Institute). Evans, R. G., 2002, “Funding Health Care: Taxation and the Alternatives,” in E. Mossialos,
A. Dixon, J. Figueras, and J. Kutzin (eds.), Funding Health Care: Options for Europe, (Buckingham: Open University Press).
Federal Statistical Office of Germany, 2004, Cost of Illness 2004 by Diseases and Age,
available at: http://www.destatis.de/basis/e/gesu/gesutab23.htm. Fogel, R., 2003, “Forecasting the Demand for Health Care in OECD Nations and China,”
Contemporary Economic Policy, Vol. 21(1), pp. 1–10. Heller, P. S., 2007, “What Should Macroeconomists Know About Health Care Policy?” IMF
Working Paper No. 07/13, (Washington, DC: International Monetary Fund). Honjo, K., 2006, “Long Term Health Care Costs: Will They Make the Budget Sick?”, U.K.
Selected Issues Papers, IMF Country Report No. 06/87, pp. 66–78, (Washington, DC: International Monetary Fund).
Hsiao, W.C. and P. S. Heller, 2007, What Macroeconomists Should Know about Health
Care Policy?, (Washington, DC: International Monetary Fund). ILO/STEP (International Labor Office/Strategies and Tools Against Social Exclusion and
Poverty), 2002, Towards Decent Work: Social Protection for Health for All Workers and Their Families, (Geneva: ILO/STEP).
IMF (International Monetary Fund) and World Bank, 2005, Financing the Development
Agenda, (Washington, DC: World Bank and International Monetary Fund). IMF (International Monetary Fund), 2008, ECCU 2007 Regional Surveillance Staff Report,
IMF Country Report No. 08/96, (Washington, DC: International Monetary Fund). Ivaschenko, I., 2005, “Diagnosing the High Cost of U.S. Medical Care,” U.S. Selected
Issues, IMF Country Report No. 05/258, pp. 99–110, (Washington, DC: International Monetary Fund).
Lalta, S., M. Entwistle, R. Suarez, and R. Brohim, 2005, “Situation Analysis: The
Economic Environment and Financing of Health Services in the Caribbean,” Working Paper No. 2, (Caribbean Commission on Health and Development).

23
Langenbrunner, J. C., 2005, Health Care Financing and Purchasing in ECA: An Overview of Issues and Reforms, (Washington, DC: World Bank).
Mahal, A. and P. Berman, 2001, “Health Expenditures and the Elderly: A Survey for Issues
in Forecasting, Methods Used, and Relevance for Developing Countries,” Research Paper No. 01.23, (Cambridge, Mass: Harvard Burden of Disease Unit).
Monroe, H., 2008, “Can the ECCU Afford to Grow Old?” Eastern Caribbean Currency
Union-Selected Issues, IMF Country Report No. 08/96, pp. 81–90 (Washington, DC: International Monetary Fund).
Musgrove, P., 2003, “Judging Health Systems: Reflections on WHO's Methods,” The
Lancet, Vol. 361, Issue 9371, pp. 1817–1820. __________, 1996, “Public and Private Roles in Health: Theory and Financing Patterns,”
World Bank Discussion Paper 339, (Washington, DC: World Bank). National Health Insurance Task Force, 2003, Universal Health Care (Castries, St. Lucia). Normand, C., and R. Busse, 2002, “Social Health Insurance Financing,” in E. Mossialos,
A. Dixon, J. Figueras, and J. Kutzin (eds.), Funding Health Care: Options for Europe, (European Observatory on Health Systems and Policies, Berkshire, U.K: Open University Press).
Normand, C., and C. Weber, 1994, Social Health Insurance: A Guidebook for Planning,
(Geneva: World Health Organization and International Labor Office). OECD (Organization for Economic Co-Operation and Development), various years,
Development Database on Aid Activities, (Paris: OECD). PAHO (Pan American Health Organization), 2003, Health Care Financing: Universal
Health Insurance Coverage: Aruba―Unpublished Mission Report, (Washington, DC: PAHO).
Pauly, M. V., 2000, “Insurance Reimbursement,” in A.J. Gulyer and J.P. Newhouse (eds.)
Handbook of Health Economics, Vol. 1, pp. 538–560. Peabody, J.W., S. Lee, and S. R. Bickel, 1995, “Health for All in the Republic of Korea:
One Country’s Experience with Implementing Universal Health Care,” Health Policy, Vol. 31(1), pp. 29–42.
PriceWaterHouseCoopers, 2005, HealthCast 2020: Creating a Sustainable Future,
available at: http://pwc.no/extweb/pwcpublications.nsf/docid/22bd697752baa025852572c0006f835a.

24
Rawlings, L. B., 2004, “A New Approach to Social Assistance: Latin America’s Experience with Conditional Cash Transfer Programs,” Social Protection Discussion Paper Series, No. 0416, (Washington, DC: World Bank).
Ron, A., B. Abel-Smith, and G. Tamburi, 1990, Health Insurance in Developing Countries:
The Social Security Approach, (Geneva: International Labor Office). Tsounta, E., 2008, “Financing Universal Health Care: Lessons for the Eastern Caribbean
and Beyond,” Eastern Caribbean Currency Union-Selected Issues, IMF Country Report No. 08/96, pp. 91–101 (Washington, DC: International Monetary Fund).
United Kingdom National Audit Office, 2003, International Health Comparisons: A
Compendium of Published Information on Health Care Systems, the Provision of Health Care and Health Achievement in 10 Countries, (London: The National Audit Office).
Universal Health Care Diabetes and Hypertension, 2007, Findings Available at:
http://www.caribbeannetnews.com/news-955--20-20--.html. U.S. Census Bureau, various years, International DataBase, available at:
http://www.census.gov/ipc/www/idb/. van Doorslaer, E., A. Wagstaff, H. van der Burg, T. Christiansen, G. Citoni, R. Di Biase,
U. Gerdtham, M. Gerfin, L. Gross, U. Häkinnen, J. John, P. Johnson, J. Klavus, C. Lachaud, J. Lauritsen, R. Leu, B. Nolan, J. Pereira, C. Propper, F. Puffer, L. Rochaix, M. Schellhorn, G. Sundberg, and O. Winkelhake, 1999, “The Redistributive Effect of Health Care Finance in Twelve OECD Countries,” Journal of Health Economics, Vol. 18(3), pp. 291–313.
Vuletin, G., 2007, “The Size of the Informal Economy in the Caribbean,” in Eastern
Caribbean Currency Union—Selected Issues, IMF Country Report No. 07/97, pp. 44–66 (Washington, DC: International Monetary Fund).
Wagstaff, A., 2002, “ Reflections on and Alternatives to WHO’s Fairness of Financial
Contribution Index,” Health Economics, Vol. 11(2), pp. 103–15. Wagstaff, A., and M. Claeson, 2004, The Millennium Development Goals for Health: Rising
to the Challenges, (Washington, DC: World Bank). A. Wagstaff, E. van Doorslaer, H. van der Burg, S. Calonge, T. Christiansen, G. Citoni,
U. Gerdtham, M. Gerfin, L. Gross, U. Häkinnen, P. Johnson, U. John, J. Klavus, C. Lachaud, J. Lauritsen, R. Leu, B. Nolan, E. Perán, J. Pereira, C. Propper, F. Puffer, L. Rochaix, M. Rodríguez, M. Schellhorn, G. Sundberg, and O. Winkelhake, 1999, “Equity in the finance of health care: some further international comparisons,” Journal of Health Economics, Vol. 18(3), pp. 263–290.

25
Wild, S., G. Roglic, A. Green, R. Sicree, H. King, 2004, “Global Prevalence of Diabetes: Estimates for the Year 2000 and Projections for 2030,” Diabetes Care, Vol. 27, pp. 1047–53.
Williams, A., 2001, “Science or Marketing at WHO? A Commentary on ‘World Health 2000’,” Health Economics, Vol. 10(1), pp. 93–100.
World Bank, 2006, Health Financing Revisited: A Practitioner's Guide, (Washington, D.C.:
World Bank). __________, 1993, World Development Report 1993: Investing in Health,
(Washington, DC: World Bank). World Health Organization (WHO), 2003, The World Health Report 2003―Shaping the
Future, (Geneva: World Health Organization). __________, 2002, The World Health Report 2002: Reducing Risks, Saving Lives, (Geneva:
World Health Organization). __________, 2000, The World Health Report 2000: Health Systems: Improving
Performance, (Geneva: World Health Organization).

26
Package
Contribution
Service provision
Key Issues
Source: Lalta et al. (2005) 1/ Numbers in parentheses indicate the year of introduction of universal health care. Note: IP denotes inpatient care, and OP denotes outpatient care.
…
Ghana (2004)
2.5 percent national health insurance levy added to VAT; use 2.5 percent of wages from National Worker's Social Security; $0.66 monthly minimum subscription.
All residents. Government pays for the aged, poor and children of subscribers.
Public hospitals
…
No collection from self-employed.
Growing burden on government.
Growing burden on government.
Outflows exceed inflows.
Public, private and overseas facilities.
Public hospitals and overseas facilities.
Public, private and overseas facilities.
Public, private and overseas facilities.
7 percent of wages up to a ceiling, shared equally between employee and employer.
Fixed price package adjusted annually (around 3 percent of income); shared by employee and employer.
Fixed price set by private companies after government's approval; shared by employee and employer.
9 percent of wages shared (4 percent employee, 5 percent government). Fixed price for voluntary insured.
Coverage
Ambulatory care, IP, OP, overseas IP.
IP, OP, overseas IP. Ambulatory care, IP, OP, overseas IP.
Ambulatory care, IP, OP, overseas IP.
Table 1. Selected Countries with Universal Health Care 1/
All civil servants and dependents, and some voluntary insured (36 percent of population).
Bermuda (1971) Cayman Islands (1997) Suriname (1981)Antigua & Barbuda (1978)
All persons suffering from a list of nine chronic diseases.
All workers and unemployed spouses. Government pays for indigent, children, and the elderly.
All workers and dependents. Indigent covered by government through levy on worker's premiums.

27
Package
Contribution
Service provision
Source: Lalta et al. (2005)
1/ Numbers in parentheses indicate the year of the first proposal regarding introducing universal health care. Note: IP denotes inpatient care, and OP denotes outpatient care.
Public and private hospitals.
Belize (2002)All residents.
IP, OP, ambulatory care, some overseas services.
5 percent of workers' income; shared by employee and employer; government subsidies for indigent and pensioners.
Public and private hospitals.
IP, OP, ambulatory care, drugs, tests.
IP, OP, ambulatory care.
9 percent of wages-shared by employee and employer; government subsidies for indigent.
Fixed price premium-shared by employee and employer; government subsidies for indigent.
10.1 percent of earnings-shared by employee and employer.
Table 2. Selected Caribbean Countries Planning Universal Health Care Coverage 1/
IP, OP, drugs, some overseas services.
All residents.
St. Lucia (2004) St. Vincent & Grens. (1998)The Bahamas (2004)Coverage
Trinidad & Tobago (1995)All residents.
Percentage of income; government subsidies for indigent, elderly, children.
3.5–4 percent environmental levy on imports (excluding clothes and food). Estimated revenue: US$13 million.
All residents. All residents.
Jamaica (1997) All residents.
Public and private hospitals.
Public and private hospitals.
Public and private hospitals.
Public and private hospitals.
IP, OP, ambulatory care, some overseas services.
IP, OP, drugs, some overseas services.

28
Commitment Disbursement Commitment Disbursement Commitment Disbursement Commitment Disbursement Commitment Disbursement Commitment Disbursement
1973 0.0 0.0 0.0 0.0 42.1 0.0 0.0 0.0 0.0 0.0 0.0 0.01974 0.0 0.0 0.0 0.0 0.0 0.0 0.0 0.0 0.0 0.0 0.0 0.01975 0.0 0.0 0.0 0.0 0.0 0.0 0.0 0.0 0.0 0.0 0.0 0.01976 0.0 0.0 0.0 0.0 0.0 0.0 97.1 0.0 0.0 0.0 679.9 0.01977 0.0 0.0 0.0 0.0 808.2 0.0 680.9 0.0 0.0 0.0 0.0 0.01978 0.0 0.0 0.0 0.0 0.0 0.0 0.0 0.0 0.0 0.0 0.0 0.01979 0.0 0.0 0.0 0.0 0.0 0.0 0.0 0.0 0.0 0.0 0.0 0.01980 0.0 0.0 0.0 0.0 0.0 0.0 0.0 0.0 0.0 0.0 0.0 0.01981 0.0 0.0 0.0 0.0 0.0 0.0 0.0 0.0 0.0 0.0 5,679.9 0.01982 0.0 0.0 0.0 0.0 0.0 0.0 0.0 0.0 0.0 0.0 1,548.3 0.01983 0.0 0.0 422.8 0.0 0.0 0.0 0.0 0.0 0.0 0.0 0.0 0.01984 0.0 0.0 161.6 0.0 0.0 0.0 0.0 0.0 0.0 0.0 0.0 0.01985 0.0 0.0 0.0 0.0 3,248.9 0.0 0.0 0.0 0.0 0.0 0.0 0.01986 0.0 0.0 170.8 0.0 0.0 0.0 0.0 0.0 132.2 0.0 0.0 0.01987 0.0 0.0 0.0 0.0 0.0 0.0 290.9 0.0 0.0 0.0 3,498.7 0.01988 0.0 0.0 2,410.8 0.0 0.0 0.0 0.0 0.0 494.8 0.0 0.0 0.01989 0.0 0.0 8,636.4 0.0 358.4 0.0 0.0 0.0 238.9 0.0 71.9 0.01990 0.0 0.0 0.0 0.0 0.0 0.0 0.0 0.0 1,166.9 0.0 0.0 0.01991 0.0 0.0 0.0 0.0 0.0 0.0 0.0 0.0 685.3 0.0 0.0 0.01992 0.0 0.0 260.3 0.0 0.0 0.0 0.0 0.0 0.0 0.0 0.0 0.01993 0.0 0.0 1,326.3 0.0 0.0 0.0 61.4 0.0 383.9 0.0 79.7 0.01994 0.0 0.0 0.0 0.0 0.0 0.0 0.0 0.0 0.0 0.0 224.1 0.01995 0.0 0.0 0.0 0.0 0.0 0.0 3,635.3 0.0 0.0 0.0 1,236.2 0.01996 0.0 0.0 0.0 0.0 0.0 0.0 0.0 0.0 1,113.0 28.5 1,255.2 47.11997 0.0 0.0 516.5 0.0 210.3 0.0 0.0 107.0 782.5 0.0 27.7 607.91998 3,208.3 0.0 340.1 0.0 151.0 0.0 67.2 67.2 365.5 184.2 38.3 1,127.41999 2,546.1 172.5 0.0 0.0 0.0 0.0 4,278.8 90.6 0.0 27.5 0.0 717.92000 0.0 1,387.4 0.0 0.0 0.0 0.0 0.0 1,169.5 0.0 0.0 0.0 138.12001 0.0 111.1 0.0 0.0 0.0 0.0 0.0 4,401.8 0.0 100.5 88.2 0.02002 0.0 253.9 0.0 0.0 0.0 0.0 0.0 1,616.5 0.0 0.0 0.0 0.02003 464.4 21.5 380.9 148.7 354.3 58.8 0.0 22.5 342.4 178.6 234.1 0.02004 25.0 79.2 63.9 90.1 117.5 157.2 0.0 0.0 74.2 139.0 6.0 45.42005 1.6 73.5 58.0 149.0 2.1 64.4 1.6 1.5 24,761.7 131.8 1.6 1.5
33.6 2.6 5.3 82.0 2.6 18.3
Source: OECD, Aid Statistics.
Table 3. ECCU: Official Development Assistance for Health, 1973–2005
Antigua & Barbuda Dominica Grenada St. Kitts & Nevis
Disbursed (%)
(In thousands of 2004 U.S. Dollars)
St. Lucia St. Vincent & the Grens.

29
Figure 1. ECCU: Long-term Health Care Costs, 2005–35 1/(In percent of GDP)
Source: U.S. Census Bureau; World Health Organization; and Fund staff estimates.
4
5
6
7
8
9
2005 2015 2025 20354
5
6
7
8
9Antigua and Barbuda
5
6
7
8
9
10
2005 2010 2020 2025 2030 20355
6
7
8
9
10Dominica
6
7
8
9
10
11
12
13
2005 2015 2025 20356
7
8
9
10
11
12
13Grenada
5
6
7
8
9
10
2005 2015 2025 20355
6
7
8
9
10St. Kitts and Nevis
5
6
7
8
9
2005 2015 2025 20355
6
7
8
9St. Lucia
6
7
8
9
2005 2015 2025 20356
7
8
9St. Vincent and the Grenadines
Elderly cost =5 times the average cost Elderly cost =2 times the average cost Same cost for all age groups
30
Figure 2. ECCU: Diabetes Prevalence by Age Group, 2000–30 1/(Number of people)
Source: Wild et al. (2004), "Global Prevalence of Diabetes: Estimates for the year 2000 and projections for 2030," Diabetes Care, Vol. 27, pp. 1047- 53.
0
1,000
2,000
3,000
4,000
5,000
6,000
2000 2030
Antigua and Barbuda
0
1,000
2,000
3,000
4,000
5,000
2000 2030
Dominica
0
2,000
4,000
6,000
8,000
10,000
2000 2030
Grenada
0
1,000
2,000
3,000
2000 2030
St. Kitts and Nevis
0
2,000
4,000
6,000
8,000
10,000
2000 2030
St.Vincent and the Grenadines
0
2,000
4,000
6,000
8,000
10,000
12,000
2000 2030
St. Lucia
20-44 45-64 65+

31
0.0
0.6
1.2
1.8
2.4
2000 2010 2020 2030
Antigua and Barbuda
0.0
0.6
1.2
1.8
2.4
2000 2010 2020 2030
Dominica
0.0
0.6
1.2
1.8
2.4
2000 2010 2020 2030
Grenada
0.0
0.6
1.2
1.8
2.4
2000 2010 2020 2030
St. Kitts and Nevis
Figure 3. ECCU: Cost of Treating Diabetes, 2000–30 1/(In Percent of GDP)
0.0
0.6
1.2
1.8
2.4
2000 2010 2020 2030
St Vincent and the Grenadines
0.0
0.6
1.2
1.8
2.4
2000 2010 2020 2030
St. Lucia
Sources: Caribbean Commision on Health and Development (2005); Wild et al. (2004); and Fund staff calculations.
If health Inflation is equal to the historical average +2%. If health inflation is equal to the historical average rate.
Cost of treating diabetes could increase significantly in some ECCU countries.

32
Appendix I. Proposed Universal Health Care System in St. Lucia 18 St. Lucia, following the example of other Caribbean islands, is moving towards universal health care.19 The program will provide equal access to health care, defined in a published package of limited services and benefits to all St. Lucians or non-nationals residing in the country for at least six months. The list of hospital services provided will be patterned after the Oregon Health Plan approach for the prioritization of services, with emphasis on preventive services, comfort care and family planning services. The move to universal health care has been the direct result of authorities’ concern about the sustainability of the current financing system, poor quality of and inequity of care in the health delivery system, escalating health costs, and the rising number of residents who seek medical treatment without paying for it. The services, which will include inpatient, outpatient, and limited overseas care, and inpatient pharmacy services, will be primarily provided by the two general hospitals, and the new hospital, currently under construction.
A taskforce—set up to provide universal health care financing recommendations—noted that general taxation should be the appropriate financing option. The Taskforce, which estimated that the initial cost of universal health care would be over US$20 million (over 3 percent of GDP), considered various sources of financing, including transaction-based taxes, such as environmental levy, “sin” taxes and VAT, and salary deduction. The St. Lucia National Health Insurance Taskforce recommended that, in the first instance the
18 This appendix is based on the National Health Insurance Task Force Report available online at: http://www.stluciauhc.org/reports.php.
19 Antigua has universal coverage of certain services since 1978. Bermuda (in 1971), Cayman Islands (in 1997) Aruba, Kingdom of the Netherlands (in 2001), and Suriname (in 1981) have also introduced universal coverage. Other Caribbean islands that have been contemplating the introduction of UHC include Trinidad and Tobago (since 1995), Jamaica (since 1997), St. Vincent and the Grenadines (since 1998), Belize (since 2002) and Bahamas (since 2004).
Before After
Public 3.3 4.6 Of which: Universal Health Care 3.2
Private 2.2 1.8
Total 5.5 6.4Source: National Health Insurance Taskforce (2003).
Health Expenditure Before and After the Introduction of Universal Health Care
(In Percent of 2003 GDP)

33
environmental levy and budgetary contribution should be the main sources of the financing—supplemented with a small salary deduction. They noted that in the future, VAT could be considered to “supplement or replace some or all of the sources of finance.” The Taskforce noted that salary deductions could only be considered on a large-basis as an appropriate source of finance only when the informal sector was captured and emphasized the need for broad-based taxation, since it was sufficiently flexible to generate additional revenue, if needed. Property taxation, which was proposed by the Inland Revenue Department, was rejected as a health financing option due to its current poor collection performance (only a relatively small percentage of property taxes are currently collected).
Estimated Cost 21.7Financed by:Government Transfer 11.0Envriromental Levy 7.8SalaryDeduction 2.9
Source: National Health Insurance Taskforce (2003).
Financing of Universal Health Care (million US dollars)

34
Appendix II. Projecting Long-term Health Care Costs Due to Population Aging
This Appendix describes the methodology for calculating the long-term health care projections driven solely by changes in demographics. Traditionally, these projections are derived by multiplying the last actual observation on health care cost per age group by projections for population by age group. In this way, projected changes in real health care spending reflect only changes in demographics. To the best of the author’s knowledge, health care costs by age group are not available for the ECCU region. However, existing data from other countries could provide a rough proxy for constructing age-group specific health care costs for the ECCU. This study estimates the health spending (in percent of GDP) that ECCU countries would have to face in the next three decades under three scenarios. The first scenario assumes, similar to Honjo (2006), that health costs for those aged 65 and above is five times the cost of the rest of the population; the second scenario assumes that it is only twice as high as that of the rest of the population, and the most optimistic scenario assumes that health costs are equal across all population ages. In all scenarios, health costs are based on WHO data, while population projections are based on each country’s latest Actuarial Report. These projections should be viewed with caution since recent literature suggests that demographic changes may not be the key driver of future health care expenditure. Bjornerud and Martins (2005) show that demographic changes accounted for only 10 percent of the average growth in health spending across OECD countries over the last 30 years. Thus, while demographic changes might intensify health cost pressures, if population projections actually materialize to start with, other factors also need to be considered such as changes in health status, technological and medical progress, economic growth, and changes in the organization and financing of health care system.

35
Appendix III. Estimating Age-adjusted Health Spending This analysis follows the methodology of Esmail and Walker (2005), which was originally used to compare health spending in developed nations. It effectively normalizes health spending in a given nation to the level that it would have incurred, if its senior (over 65 years) population share equals the level of a benchmark country. Following the calculations used for The Bahamas (Esmail, 2006), Canada is used as the benchmark case. The calculation itself uses an elasticity of health spending in percent of GDP to the share of population over 65 of 0.698, as estimated by Esmail and Walker (2005) for Canada. This elasticity implies that for every 1 percent increase in the share of population over 65, the increase in the share of GDP spent on health care will be around 0.7 percent. Age-adjusted Health Spending Formula In calculating age-adjusted health spending, the senior population as a proportion of the total population in the base country (in this case Canada) and estimated country are used. The elasticity of health spending to the proportion of population above 65 is assumed to be 0.698. The formula is given by:
Age-adjusted health spending in Estimated Country = HE
EB *)]698.0*1[ −+
where: B: Senior’s proportion of population in benchmark country (in this case, Canada), based on U.S. Census Bureau International DataBase. E: Senior proportion of population in estimated country based on the country’s latest Actuarial Report. H: Health expenditure (in percent of GDP) in estimated country, based on WHO Health Statistics.