universal health coverage-pilot in tamil nadu: has it...
TRANSCRIPT

0
UHC-Pilot in Tamil Nadu: Has it delivered what was expected?
Universal Health Coverage-Pilot in Tamil Nadu:
Has it delivered what was expected?

1
Submitted to
Health and Family Welfare Department
Government of Tamil Nadu
By
Centre for Technology and Policy
Department of Humanities and Social Sciences, IIT Madras
February 2018
Project Team Members:
V R Muraleedharan Umakant Dash
S.D. Vaishnavi (SHReAs, Chennai) Rajesh M
R. Gopinath M.Hariharan
R.Babu P. Balamurgan
A. Emaya Varaman S. Arul Kumar
A. Mariyan Devan
Contributors:
Elna James Kattoor Sudha Rani D
Suggested citation: Muraleedharan V R, et al.(2018): “Universal Health Coverage-Pilot in
Tamil Nadu: Has it delivered what was expected?”, Centre for Technology and Policy,
Department of Humanities and Social Sciences, IIT Madras, Chennai, Tamil Nadu
For correspondence contact: Dr. V R Muraleedharan (Email: [email protected])
2
Foreword
Professor T Sundararaman, TISS Mumbai
Health and Wellness Centers is an idea whose time has come. Belatedly and hesitantly, but better late than never. This concurrent study of a pilot programme done in three blocks of Tamilnadu details some ‘baby steps’ towards the realization of this idea. It shows how with a relatively limited intervention, access and financial protection for primary health care services was dramatically increased within a few months in these three blocks. The Health and Wellness Center is the key strategy in India’s roadmap to Universal Health Coverage. The essence of the Health and Wellness Center concept is to expand the set of assured services that are available at the erstwhile health sub-center. Currently, even the well-functioning health sub-center is designed to provide a very restricted list of services, which includes only some elements of care in pregnancy, child immunization and a couple of national disease control programmes. Together, they could be catering to less than 5% of ambulatory health care needs. With the inclusion of care for the most acute minor illnesses, and for most chronic illnesses, this could rise to over 75% of all ambulatory care needs. All chronic illnesses would require a doctor or appropriate specialist for confirming diagnosis and making a treatment plan. But once this is made, the follow up required for medication compliance; monitoring disease control; counselling and early detection of complications, (all of which constitute the majority of ambulatory care visits) can be provided by a team of nurses or mid care providers. Pilot studies are not essential for proof of this concept. The experience of the National Health Services of the United Kingdom, and from Thailand and Brazil is already before us. We know from the latter experience that even in the context of a developing country, primary health care teams for about 1000 households providing such a comprehensive set of primary health care services, as well as facilitating access to a networked secondary care center when needed, is the most cost effective way of achieving universal health care. However, pilot studies are essential to understand implementation issues and build capacities that would be required for scaling up. Though pilot studies are always advocated before scaling up, this is seldom carried out. This study is an exception- as it attempts to put this precept into practice. The entire state public health leadership, both general administrators and the technical leadership have linked with the academic public health community to carry out a small study of great depth. This study is able to demonstrate that strengthening sub-centers can lead to a dramatic increase in access to ambulatory care, a reduction in out of pocket expenditure for the patient, as also the costs of care for the system. And it can do so within months- not years. These are early days yet. Currently only about half the population is aware of the expanded service basket available in these centers. Moreover, there are still some elements of essential primary health care that are yet to be put in place. But if these happen, as indeed it could, the out-patient load could double or even treble, before it plateaus. This rigorous study, wherein the study team has visited all pilot sub-centers four times during 2016-17, also raises a number of questions. These are issues related to human resource strategy, choice of technologies and questions of design. Clearly this is a work

3
in progress. But even as of now, it provides enormous grounds for optimism. What it needs to do in the next phase is to find the resources for taking up this programme in all blocks in these three pilot districts simultaneously with one pilot block in each of the remaining districts. And then in the third and final phase it must scale up to all blocks in all districts! Tamilnadu has already established an effective network of public hospitals and a state level publicly funded insurance programme. In such a context, such a scaling up of primary health care in the state would ensure that ‘all those in needs of healthcare are able to access healthcare without financial hardship.’ This is feasible and it is desirable. And if Tamilnadu shows the way, it would be a beacon for the other states of India and indeed for much of the developing world.
Prof T. Sundararaman Dean - School of Health Systems Studies Tata Institute of Social Sciences Mumbai February 2018

4
Acknowledgement
Our involvement and journey with UHC-pilot in Tamil Nadu has been quite organic and holistic. We are immensely happy to have been associated with this innovative public health intervention in Tamil Nadu, right from the conception of the UHC pilot in 2015 through the implementation of the pilot till end of 2017. We thank the Department of Health and Family Welfare, Govt of Tamil Nadu, for entrusting us with the task of preparing this Report on the experience of the UHC pilot in Tamil Nadu. We wish to thank the following officials from Government of Tamil Nadu:
1. Dr. Girija Vaidyanathan, I.A.S., Chief Secretary, Govt. of TN
2. Dr. J. Radhakrishnan. I.A.S., Principal Secretary, H&FW Dept
3. Dr. P. Umanath,I.A.S, Managing Director, TNMSC
4. Dr. Darez Ahamed I.A.S., Mission Director, NHM
5. Dr. K. Kolandaswamy, Director of Public Health and Preventive Medicine
6. Dr. T.S. SelvaVinayagam, Additional Director,TNHSP
7. Dr. N. Chitra, Additional Director (PHC), DPH
8. Tmt. Alaghumeena R, SPM, NHM
9. Tmt. K. Priya, SPM, NUHM
10. Dr. G. Thamaraiselvi, Joint Director (Immunization)
11. Dr. S. Uma, Joint Director, NHM
12. Dr.C. Sekar, Joint Director, Training DPH.
13. Dr.P. Sampath,DDHS, Perambalur
14. Dr. K. Vinaykumar, Deputy Director, NHM
15. Dr. B. Bharanitharan, DDHS, Pudukottai
16. Dr. P. Priya Raj, DDHS Krishnagiri
17. Dr. S. Raju, Deputy Director, Lab Services
18. Dr. A. Archana (BMO, Shoolagiri)
19. Dr. P.S.Tamilmani (BMO, Viralimalai)
20. Dr. P. Sesu (BMO, Veppur)
21. Dr. Sunil Gavaskar, RSRM, Government Stanley Medical College
22. Dr. Adithyan G.S, Consultant, NHM
23. Dr. Kolanghi Kannan S.G, APO, DPH & PM
24. Dr. Abilash, APO, DPH & PM
25. Thiru. G. Elangovan, BSS, Veppur
26. Thiru. K Selvaraj, HI, Viralimalai.
27. Dr K Sultan, Nodal Officer, Viralimalai.
28. Dr.R.Aravind, Nodal Officer, Veppur.
29. Dr.S.R. Ganesh, Nodal Officer, Shoolagiri
30. All Medical Officers of PHCs, UHC pilot blocks.
31. All VHNs, SHNs and CHNs, UHC pilot blocks.
5
We would also thank J.Singaravelan, T. Gnanajothy and M.Mari for carrying out household survey (HS-2) during November –December 2017. We wish to also thank Kamal Kishore for his assistance in data entry and analysis of Household Survey-2. Our special thanks to Shri Sivakumar Mahalingam, Chief Technology Officer, IKP Centre for Technologies in Public Health, who designed the UHC-App software, for his support at various stages of this study. Needless to say that the progress of UHC pilot at ground level is a result of the commitment and hard work of VHNs, SHNs and CHNs. We thank them for patiently sharing with us their experience in implementing the UHC pilot. During the course of our journey with UHC pilot, we have met several people (individually or in groups) residing in pilot blocks. They shared with us their expectations, disappointments and hopes. We gained much insights into the reality listening to their experience. We most sincerely wish to thank them. We can not adequately thank Professor T.Sundararaman (of TISS Mumbai) for his Foreword, and for his critical and helpful observations on this study. Sincerely V.R.Muraleedharan On behalf of everyone involved in this study.

6
Table of Contents
Executive Summary .................................................................................................................. 10
1. Introduction ..................................................................................................................... 13
2. Methodology .................................................................................................................... 15
3. Results based on Base-line Survey (HS-1) and Interim Household Survey (HS-2) ........... 17
3.1: SHOOLAGIRI BLOCK....................................................................................................... 17
3.1.1 Access ...................................................................................................................... 17
3.1.2 Out of Pocket Expenses (OOPE) .............................................................................. 19
3.1.3 Access and average OOPE for NCD patients (Cohort from HS-1 and HS-2) ........... 20
3.2: VIRALIMALI BLOCK ........................................................................................................ 22
3.2.1: Access ..................................................................................................................... 22
3.2.2 Out of Pocket Expenses (OOPE) .............................................................................. 24
3.2.3 Access and average OOPE for NCD patients (Cohort from HS-1 and HS-2) ........... 25
3.3: VEPPUR BLOCK .............................................................................................................. 26
3.3.1: Access ..................................................................................................................... 26
3.3.2 Out of Pocket Expenses (OOPE) .............................................................................. 28
3.3.3 Access and average OOPE for NCD patients (Cohort from HS-1 and HS-2) ........... 29
4. Results based on UHC-APP data base .............................................................................. 31
4.1 VHNs familiarity and use of TN UHC APP .................................................................. 31
4.2 Proportion of Block population accessing HSCs ........................................................ 33
4.3 Origin of patients accessing HSCs ............................................................................. 34
4.4 Age and Gender distribution ..................................................................................... 36
4.5 Block wise Outpatients utilization ............................................................................. 37
4.6 Drug distribution; Societal Impact ............................................................................ 40
4.7 Cost of provision per OP visit .................................................................................... 41
5. Way Forward .................................................................................................................... 43
6. Concluding Remarks ......................................................................................................... 53
7. Appendices (1 – 7)………………………………………………………………………………………54-65

7
List of Tables
Table 2.1: Sample Size and Morbidity Burden: Number of Persons Per 1000 population Reported as Suffering from Chronic ailment and Ailments of Short Duration: Baseline (HS-1) Vs Post UHC Survey (HS-2) ............................................................................................ 16
Table 3.1.1a: Number of persons Accessing public and private facilities for out-patient services: Shoolagiri Block Pre and Post UHC pilot period (Source HS-1 and HS-2) ................. 17
Table 3.1.1b: Origin of Ops: HSCs villages Vs Non-HSC villages in Shoolagiri block (Source HS-2) ........................................................................................................................... 18
Table 3.1.1c: Awareness of pilot-UHC-HSCs in Shoolagiri block (Source HS-2, 2017) ............. 19
Table 3.1.2a: Average out of pocket expenditure for Outpatient care in Shoolagiri block: (Source HS-1 and HS-2) ............................................................................................................ 19
Table 3.1.2b: Break-up of average out of pocket expenditure for Outpatient care Facility wise: Shoolagiri block (Source HS-2) ........................................................................................ 20
Table 3.1.2c: OOPE break-up by Medical and Non-Medical expenses facility wise: Shoolagiri block (Source HS-2) ................................................................................................. 20
Table 3.1.3a: Access and Average OOPE for a cohort of 32 NCD patients: Shoolagiri block (Source HS-1 and HS-2) ............................................................................................................ 21
Table 3.1.3b: NCD patients accessing private and public facilities: Shoolagiri block (Source HS-1 vs HS-2) .............................................................................................................. 21
Table 3.2.1a: Number of Persons Accessing to public and private facilities for out-patient services: Viralimalai Block Pre and Post UHC pilot period: (Source HS-1 and HS-2) ............... 22
Table 3.2.1b: Origin of OPs: HSCs villages Vs Non-HSC villages in Viralimalai block (Source HS-2) ........................................................................................................................... 23
Table3.2.1c Awareness of pilot-UHC-HSCs in Viralimalai block (Source HS-2, 2017).............. 23
Table 3.2.2a: Average out of pocket expenditure for Outpatient care in Viralimalai block: (Source HS-1 and HS-2) ............................................................................................................ 24
Table 3.2.2b: Break-up of average out of pocket expenditure for Outpatient care Facility wise: Viralimalai block (Source HS-2)....................................................................................... 24
Table 3.2.2c: OOPE break-up by Medical and Non-Medical expenses facility wise: Viralimalai block (Source HS-2) ................................................................................................ 25
Table 3.2.3a: Access and Average OOPE of a 29 NCD patient cohort Viralimalai block (Source HS-1 and HS-2) ............................................................................................................ 25
Table 3.2.3b: NCD patients accessing private and public facilities: Viralimalai block ............. 26
(Source HS-1 vs HS-2) ............................................................................................................... 26
Table 3.3.1a: Number of Person Accessing public and private facilities for out-patient services: Veppur Block Pre and Post UHC pilot period: (Source HS-1 and HS-2) .................... 26
Table 3.3.1b: Origin of OPs: HSCs villages Vs Non-HSC villages in Veppur block (Source HS-2) ........................................................................................................................... 27
Table 3.3.1c: Awareness of pilot-UHC-HSCs in Veppur block (Source HS-2) ........................... 27

8
Table 3.3.2a: Average out of pocket expenditure for Outpatient care in Veppur block: (Source HS-1 and HS-2) ............................................................................................................ 28
Table 3.3.2b: Break-up of average out of pocket expenditure for Outpatient care facility wise: Veppur block (Source HS-2) ............................................................................................ 28
Table 3.3.2c: OOPE break-up by Medical and Non-Medical expenses facility wise: Veppur block (Source HS-2) .................................................................................................................. 29
Table 3.3.3a: Access and Average OOPE for NCD patients Veppur block (Source HS-1 and HS-2) ............................................................................................................ 29
Table 3.3.3b: NCD patients accessing private and public facilities: Veppur block (Source HS-1 vs HS-2) ............................................................................................................... 30
Table 4.2: Proportion of Block population utilized HSCs from July-December 2017 .............. 33
Table 4.3: Origin of patients accessing HSCs from July-December 2017 ................................ 34
Table 4.4.1 Gender distribution block-wise July-December 2017 ........................................... 36
Table 4.4.2 Age and Gender wise distribution block-wise July-December 2017 .................... 36
Table 4.5 Average OPD and NCD/OGs as recorded by VHN 2 (clinical record) ....................... 38
Block wise/ Per HSC ................................................................................................................. 38
Table 4.6: TNMSC and Market value for drug dispensed at HSCs in all three pilot blocks during July – December 2017 .................................................................................................. 40
Table 4.7: Cost of Drugs distributed per outpatient visit at HSCs: All Pilot Blocks December 2017 ......................................................................................................................................... 42

9
List of Figures
Figure 4.1.1: Gap between UHC APP and Registry data month wise: Shoolagiri Block .......... 31
Figure 4.1.2: Gap between UHC APP and Registry data month wise: Viralimalai Block ......... 32
Figure 4.1.3: Gap between UHC APP and Registry data month wise: Veppur Block .............. 32
Figure 4.3.1: Origin of Patients accessing HSCs: Shoolagiri block ........................................... 34
Figure 4.3.2: Origin of Patients accessing HSCs: Viralimalai Block .......................................... 35
Figure 4.3.3: Origin of Patients accessing HSCs: Veppur block ................................................ 35
Figure 4.5.1 Out patient clinical visits in pilot blocks May-December 2017 ........................... 37
Figure 4.5.2: Disaggregated data: OPD, OG, and NCD: November and December 2017 ........ 39
Figure 4.8: Average cost of an OP visit in UHC pilot Blocks (December 2017) Source: UHC APP and Official NHM data ...................................................................................................... 42
Figure 5.1: Shoolagiri Block HSCs Village Population and number of villages covered under each HSC .................................................................................................................................. 49
Figure 5.2: Viralimalai Block HSCs Village Population and number of villages covered under each HSC ....................................................................................................................... 49
Figure 5.3: Veppur Block HSCs Village Population and number of villages covered under each HSC ........................................................................................................................ 50
Figure 5.4: Distance between Sikkalapalli village and Melumalai HSC: Shoolagiri Block ........ 51
Figure 5.4: Distance between Kongudupatti village and Maruthampatti HSC: Viralimalai Block ......................................................................................................................................... 52

10
Executive Summary
UHC-pilot in Tamil Nadu was launched in early 2017 in Shoolagiri Block (of Krishnagiri
HUD), Viralimalai Block (of Pudukkottai HUD) and Veppur Block (of Perambalur HUD.
Strengthening the primary health care service is the first step in the design and rolling
out of UHC-pilot. As a result, Health Sub-Centres (HSCs), which are the closest delivery
points to the community have logically become the building blocks of the UHC in the state.
The motivation and justification for this approach towards UHC is that these tail end
facilities have been the weakest link in the entire edifice of public healthcare delivery
system and therefore, from equity perspective, it is logical to first strengthen these
facilities providing basic primary care services.
UHC pilot was expected to have the following outcomes: (1) Over a period time, HSCs
would be able to cater to a larger and a significant portion of Out Patient care; (2) HSCs
would be able to divert patients seeking care from higher level public facilities
(PHC/CHC/General Hospitals) and particularly those seeking care from private
providers; (3) as a result, per capita public spending for OP care would reduce (as
patients get diverted from higher level facilities); and (4) the average out of pocket
expenditure (OOPE) for patients would also reduce, as a result.
By December 2017, the UHC pilot has completed about 8 months since its roll out. Are
there signs of expected outcomes of the UHC pilot?
This report attempts to answer the following two questions:
(i) to what extent the UHC pilot has effectively improved access to HSCs and
reduced OOPE for primary care in the community; and
(ii) to what extent and how well the UHC piloting in the State covers the scope of
the proposed components/services of Health and Wellness Centres by GoI?
The results presented here are based entirely on primary information collected through
two rounds of household surveys (one baseline survey carried out prior to introduction
of UHC-pilot, and the second survey carried out during November-December 2017,
nearly 8 month since `the roll out of UHC-pilot, and primary information collected from
all 67 pilot HSCs in the three UHC-blocks.
The report provides unambiguous evidence in support of increased access to HSCs,
diversion of patients from higher level public facilities, diversion of patients from private
hospitals, significant reduction in OOPE for patients seeking care from both public and
private facilities, and significantly lower government spending per OP visit in pilot HSCs.
Briefly, the following key results should be highlighted:

11
1. HSCs now account for 17.8% of all OPs in Shoolagiri Block, 14.8% in Viralimalai
Block, and 23.1% in Veppur Block, respectively; in all three blocks, HSCs
accounted for less than 1% of all OPs during pre-UHC pilot;
2. Share of private hospitals for OP care have dropped significantly -- during pre-
UHC pilot period (2015-16) and Dec.2017): from 51% to 21% in Shoolagiri block;
from 47.8% to 24.2% in Viralimalai Block; from 40.9% to 23.9% in Veppur Block;
3. OOPE has shown significant fall among those seeking care from public facilities:
from Rs.261 per OP visit to Rs.59 per OP visit in Shoolagiri Block; from Rs.351 to
Rs.rs.26 in Viralimalai Block; from Rs.395 to Rs.67 in Veppur Block;
4. This is the average of patients attending any of public facility (up to Government
Hospital). As a result of the diversion of patients taking place (as noted above),
OOPE of patients attending HSCs have come down even more significantly: It is
Rs.5.9 per OP visit in Shoolagiri Block; Rs.2.9 per OP visit in Viralimalai Block and
Rs.5.16 per OP visit in Veppur Block.
5. Geographic reach of these HSCs has improved beyond the villages where they are
located: In Viralimalai Block, nearly 47% of all OPs are from habitations away from
villages where HSCs are located; in case of Shoolagiri and Veppur, the reach is
much lower, at 17% and 16%, respectively. Over time, with systematic campaign
and other measures, the geographic reach of these facilities is bound to increase,
as evidence shows.
6. A small cohort of NCDs showed that with availability of drugs at the local HSC
about one on four to one in five patients in all blocks preferred to collect their
drugs and have follow up locally, going to the PHC only on referral for a quarterly
check up by the medical officer. Senior citizens are more likely to make this choice.
This is likely to increase as more patients get registered for NCDs and awareness
of this facility (which is currently low) increases.
7. Proportion of block population accessing HSCs has increased progressively over
the past six months (July-Dec 2017) : 14.5% of Shoolagiri Block, 13.6% of
Viralimalai and 10.9% of Veppur Block, have used pilot HSCs at least once during
July-December 2017;
8. Male patients account for nearly 35% of all OPs attending HSCs;
9. More than 50% of all OPs are from the age group 15-59;
10. Outpatient attendance in all three blocks has steadily and significantly increased
over the months: as of December 2017, each HSC serves 10.7 outpatients per day
in Shoolagiri Block; 13 outpatients per day in Viralimalai Block and 10 outpatients
in Veppur; They were all having less than 3 outpatients per day as of July 2017;
11. Outpatient care for NCD patients have also shown similar improvement since June
2017. All NCD patients are diagnosed and put on treatment at the PHC level and
given one month’s drugs there. They then access medicines and follow up care at
the HSC for next two months or so returning to the PHC to renew their treatment
plan once in every three to four months. .

12
12. All this means, substantial fall in the overall reduction in the financial burden on
the patients who would have otherwise visited private facilities. This is through
reduction in expenditures on drugs, diagnostics, and transportation.
13. More importantly, diversion of patients from PHC/CHC/GH, to HSC would have
reduced per capita public expenditures for OP care; our estimates indicate that for
every OP visit diverted from PHC/CHC/GH (on an average) to HSCs, a saving of at
least about Rs.200 is effected – from about Rs.300 to below Rs.100, in cost of care.
14. Evidently, it makes sense therefore to scale up this UHC pilot and reduce the
overall financial burden on the government to provide primary care; the amount
saved could well be spent on further strengthening the public healthcare delivery
system;
15. With several “baby steps” made thus far, despite several constraints faced while
being implemented, UHC-pilot provides ample and unambiguous evidence to
scale;
16. Experience of the field functionaries (VHNs) also shows clear signs of their gaining
confidence in providing patient-care and the engagement with local community
members. More importantly, VHNs willingness to stay in staff-quarters has
brought about a very positive change in the perception of the people on the efforts
being made in strengthening public health care system.
17. The UHC pilot also shows the need to revisit various norms in place in establishing
primary care facilities: population to be covered, number of habitations to be
covered and distance of habitations from facilities – all should be considered.
18. The next phase of UHC pilot will have to address HR norms at HSC level and above
as we move forward.
UHC does not end with providing out-patient care at HSCs; but provision of primary clinical care at HSCs IS a major step the design and roll out of UHC. Over a period of time, the package of primary care services will become more comprehensive and quality of primary care services will undergo positive changes as a result of roll out of various additional interventions across the state from HSCs through PHC-CHC.

13
1. Introduction
UHC-pilot in TN was launched in early 2017 in Shoolagiri Block (of Krishnagiri HUD),
Viralimalai Block (of Pudukkottai HUD) and Veppur Block (of Perambalur HUD).1
Shoolagiri block has a population of 1,84,940 and is served by 25 Health Sub-Centres
(HSCs), 4 PHCs and one CHC. Viralimalai block has a population of 1,41,409 and is served
by 21 HSCs, 6 PHCs and one CHC. Veppur block has a population of 1,54,789, and is served
by 21 HSCs, 6 PHCs and one CHC.
Strengthening the primary health care services, is the first step in the design and rolling
out of UHC-pilot. As a result, Health Sub-Centres (HSCs), which are the closest delivery
points to the community have logically become the building blocks of the UHC in the state.
Following a scoping study for UHC during 2015-162, steps for rolling out primary care
services at HSCs were initiated from early 2017. This meant, beefing up physical
infrastructure of all HSCs in respective UHC pilot blocks, filling up all vacancies of existing
VHN posts and creation of an additional post for a second VHN in all HSCs3, provision of
adequate drugs, including certain drugs for NCDs, and basic diagnostics.
Sequentially speaking, in order to run the clinic and deliver outpatient care at HSC level,
on a daily basis (from 9am to 5pm), attention was first paid on the physical structure of
the UHC to ensure that HSC have electricity, water, toilet in functional form. Then comes
availability of drugs and presence of an additional VHN, the whole day. Every HSC in this
area has therefore two VHNs now as its human resources.
UHC does not end with providing out-patient care at HSCs; but provision of primary
clinical care at HSCs IS a major step in the design and roll out of UHC. Over a period of
time, the package of primary care services will become more comprehensive and quality
of primary care services will undergo positive changes as a result of roll out of various
additional interventions across the delivery system from HSCs through PHC-CHC.
The motivation and justification for this approach towards UHC is that these tail end
facilities have been the weakest link in the entire edifice of public healthcare delivery
system, and therefore, from equity perspective, it is logical to first strengthen these
facilities providing basic primary care services.
1 Letter from Mission Director, State Health Society, No 8330/SHS/P5/2016, dated 29/09/2017; 19/11/2016 and 13/04/2017. 2 G.O. (D) No.675 Health and Family Welfare (P2), Department Dated: 30.06.2014. The scoping study included a Household Survey, Facility Survey, including logistics, inventory of equipment, etc. Refer the section on Methodology for details of these primary surveys. 3 G.O. 204, dated 12/08/2016

14
UHC pilot was expected to have the following outcomes: (1) Over a period time, HSCs
would be able to cater to a larger and a significant portion of Out Patient care; (2) HSCs
would be able to divert patients seeking care from higher level public facilities
(PHC/CHC/General Hospitals) and particularly those seeking care from private
providers; (3) as a result, per capita public spending for OP care would reduce (as
patients get diverted from higher level facilities); and (4) the average out of pocket
expenditure (OOPE) for patients would also reduce, as a result.
This report attempts to answer the following two questions:
(1) to what extent the UHC pilot has effectively improved access to HSCs and
reduced OOPE for primary care in the community; and
(2) to what extent and how well the UHC piloting in the State covers the scope
of the proposed components/services of Health and Wellness Centres by GoI?
By the end of December 2017, UHC pilot has had nearly 8 months of experience. The
rolling out process faced a number of challenges typically encountered during the initial
stages in the implementation of such ambitious public health interventions.
The initial months (from February till April 2017) were spent addressing ground level
challenges, in getting the buildings ready, recruitment of additional VHNs and also filling
vacancies, etc. All VHNs were trained in UHC-APP in maintaining patient records. It took
a few months to make many features of the UHC-APP functional. In addition to the UHC-
APP, all VHNs maintain a hard-copy of patient records as well, as uploading them on daily
basis depends on net connectivity, web-service providers, electricity, etc.
The report is organised as follows: Section 2 describes the nature of primary data-bases
used for this study; Section 3 presents results of the UHC pilot interventions based on the
primary household surveys; Section 4 presents an analysis of patient related information
collected directly from HSCs using the Registry and UHC-APP.4 Section 5 on “Way
forward” provides some reflections on Objective 2 (mentioned above). The report closes
with a few concluding remarks.
4 UHC APP- used by VHNs at HSCs digitally records patient related health details along with details of his/her family members. APP also has provision to maintain record of medicines prescribed, diagnostics carried out both by VHNs and Medical Officers at PHCs/CHCs, and follow up details. Patients’ contact numbers and Aadhar numbers/Ration Card Numbers are also maintained.

15
2. Methodology: This study uses primary data collected from household surveys carried out in UHC pilot
blocks, and from HSCs located in UHC-pilot blocks.
The following primary surveys provide information required to address our objectives:
(1) Household Survey 1 (HS-1): A baseline primary household survey in all three blocks
were carried out during 2015-16, following the methodology adopted by the 71st Round
NSS Report (2014)5. The survey covered a sample of 1000 households from 25 villages
from each block to collect information on household health seeking behaviour for both
OP and IP care, type of facilities utilised, nature of ailments reported for OP and IP
services, overall expenses made towards OP and IP, including amount spent on drugs,
diagnostics, overall monthly household consumption, etc.6
(2) Facility Survey-1 (FS-1): A baseline primary survey of all HSCs in all three UHC pilot
blocks on gaps in physical infrastructure, other facilities (such as availability of water,
electricity, toilets etc.), vacancies in VHNs, drugs, etc., was carried out during October
2015 and June 2016. As part of this survey, the Research Team also carried out one Group
Discussion with VHNs (in each block) to elicit their views on gaps in facilities and
expectations of community members, and village level group discussions to elicit directly
expectations of community members for services to be made available at HSCs.
(3) Interim progress of UHC: Household Survey-2 (HS-2):
During November- December 2017, nearly 8 months after the launch of the UHC-pilot,
another primary household survey in each pilot block was carried out. We followed the
same design/methodology as in baseline household surveys. The same 25 villages were
chosen as in baseline but the sampled households were different. Also, it should be noted
here that during HS-2, a much larger sample of households and therefore a larger number
of household members were included. Table 2.1 shows the extent of over sampling in
each block and also the reported morbidity (chronic and ailments of short duration).
Oversampling was not uniformly distributed in all 25 villages. But in each village, a
minimum of 40 households were sampled. During HS-2, we have also collected
information on a sample of NCD patients identified during the base-line (HS-1) from the
5 For details of the sampling /design methodology adopted by NSS 71st Round on “Social Consumption: Health”, refer Appendix B of the Report: [http://mospi.nic.in/sites/default/files/publication_reports/nss_rep574.pdf] 6 A very large number of field investigators were trained and deployed for these surveys. It is important to note that all field investigators were then VHN-trainees undergoing their final term of their training programme at Hosur and Tiruvalankulam training institutes. Appendix 1 provides names of all field investigators and respective supervisors and officials involved in
these surveys.
16
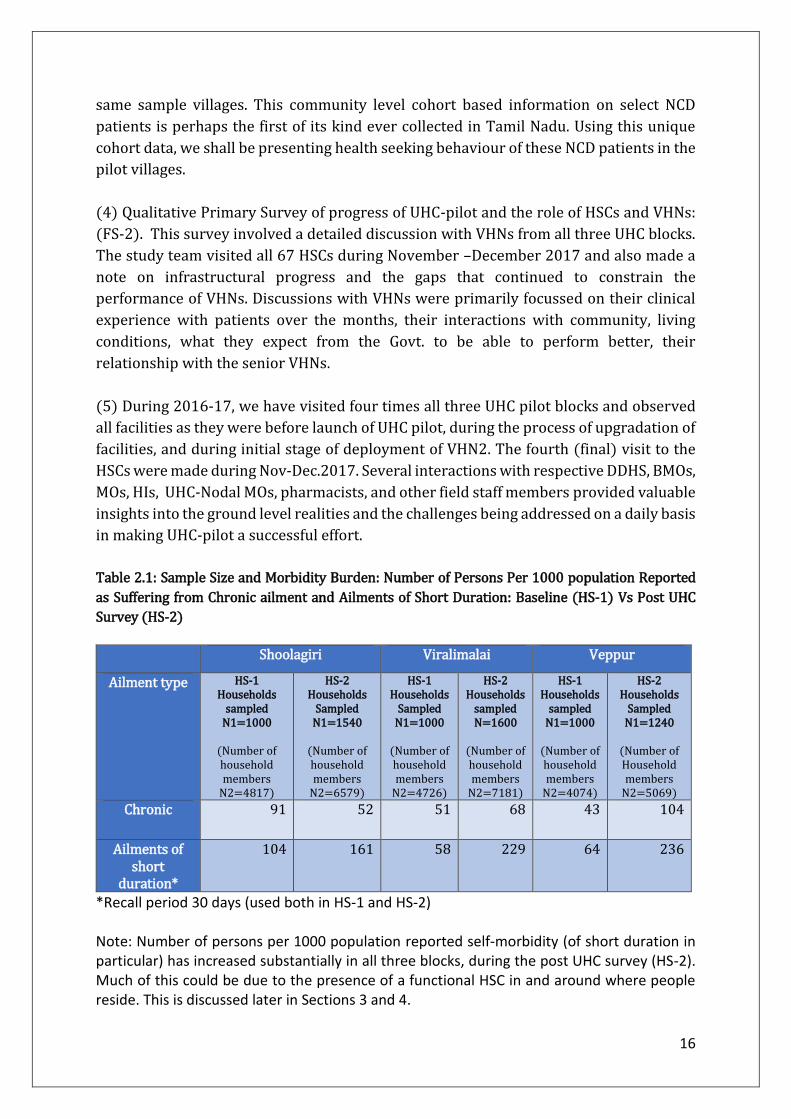
same sample villages. This community level cohort based information on select NCD
patients is perhaps the first of its kind ever collected in Tamil Nadu. Using this unique
cohort data, we shall be presenting health seeking behaviour of these NCD patients in the
pilot villages.
(4) Qualitative Primary Survey of progress of UHC-pilot and the role of HSCs and VHNs:
(FS-2). This survey involved a detailed discussion with VHNs from all three UHC blocks.
The study team visited all 67 HSCs during November –December 2017 and also made a
note on infrastructural progress and the gaps that continued to constrain the
performance of VHNs. Discussions with VHNs were primarily focussed on their clinical
experience with patients over the months, their interactions with community, living
conditions, what they expect from the Govt. to be able to perform better, their
relationship with the senior VHNs.
(5) During 2016-17, we have visited four times all three UHC pilot blocks and observed
all facilities as they were before launch of UHC pilot, during the process of upgradation of
facilities, and during initial stage of deployment of VHN2. The fourth (final) visit to the
HSCs were made during Nov-Dec.2017. Several interactions with respective DDHS, BMOs,
MOs, HIs, UHC-Nodal MOs, pharmacists, and other field staff members provided valuable
insights into the ground level realities and the challenges being addressed on a daily basis
in making UHC-pilot a successful effort.
Table 2.1: Sample Size and Morbidity Burden: Number of Persons Per 1000 population Reported
as Suffering from Chronic ailment and Ailments of Short Duration: Baseline (HS-1) Vs Post UHC
Survey (HS-2)
Shoolagiri Viralimalai Veppur
Ailment type HS-1 Households
sampled N1=1000
(Number of household members
N2=4817)
HS-2 Households
Sampled N1=1540
(Number of household members
N2=6579)
HS-1 Households
Sampled N1=1000
(Number of household members
N2=4726)
HS-2 Households
sampled N=1600
(Number of household members
N2=7181)
HS-1 Households
sampled N1=1000
(Number of household members
N2=4074)
HS-2 Households
Sampled N1=1240
(Number of Household members
N2=5069)
Chronic 91 52 51 68 43 104
Ailments of short
duration*
104 161 58 229 64 236
*Recall period 30 days (used both in HS-1 and HS-2) Note: Number of persons per 1000 population reported self-morbidity (of short duration in particular) has increased substantially in all three blocks, during the post UHC survey (HS-2). Much of this could be due to the presence of a functional HSC in and around where people reside. This is discussed later in Sections 3 and 4.
17
3. Results based on Base-line Survey (HS-1) and Interim Household Survey (HS-2)
Sections 3.1-3.3 present results with respect to “Access to HSCs”, and “Out of Pocket
Expenses (OOPE)”, comparing the baseline Household Survey (HS-1) and Interim
Household Survey (HS-2).
3.1: SHOOLAGIRI BLOCK:
3.1.1 Access
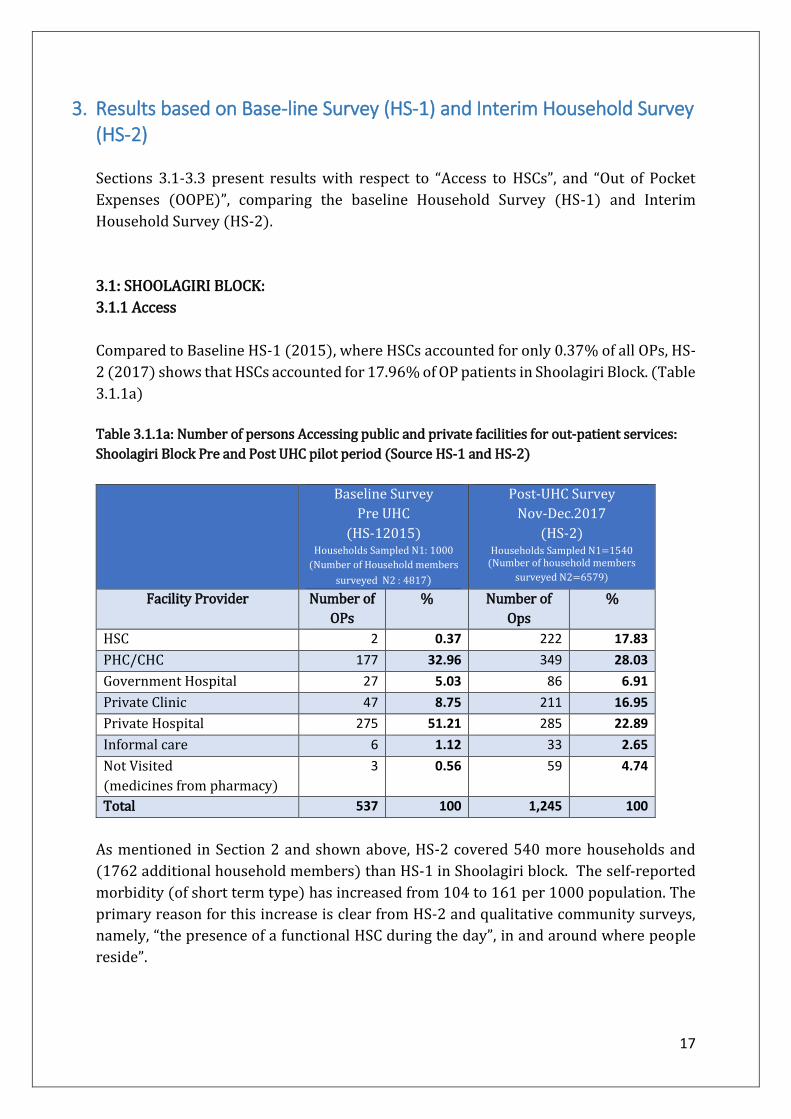
Compared to Baseline HS-1 (2015), where HSCs accounted for only 0.37% of all OPs, HS-
2 (2017) shows that HSCs accounted for 17.96% of OP patients in Shoolagiri Block. (Table
3.1.1a)
Table 3.1.1a: Number of persons Accessing public and private facilities for out-patient services:
Shoolagiri Block Pre and Post UHC pilot period (Source HS-1 and HS-2)
Baseline Survey
Pre UHC
(HS-12015) Households Sampled N1: 1000
(Number of Household members
surveyed N2 : 4817)
Post-UHC Survey
Nov-Dec.2017
(HS-2) Households Sampled N1=1540
(Number of household members
surveyed N2=6579)
Facility Provider Number of
OPs
% Number of
Ops
%
HSC 2 0.37 222 17.83
PHC/CHC 177 32.96 349 28.03
Government Hospital 27 5.03 86 6.91
Private Clinic 47 8.75 211 16.95
Private Hospital 275 51.21 285 22.89
Informal care 6 1.12 33 2.65
Not Visited
(medicines from pharmacy)
3 0.56 59 4.74
Total 537 100 1,245 100
As mentioned in Section 2 and shown above, HS-2 covered 540 more households and
(1762 additional household members) than HS-1 in Shoolagiri block. The self-reported
morbidity (of short term type) has increased from 104 to 161 per 1000 population. The
primary reason for this increase is clear from HS-2 and qualitative community surveys,
namely, “the presence of a functional HSC during the day”, in and around where people
reside”.
18
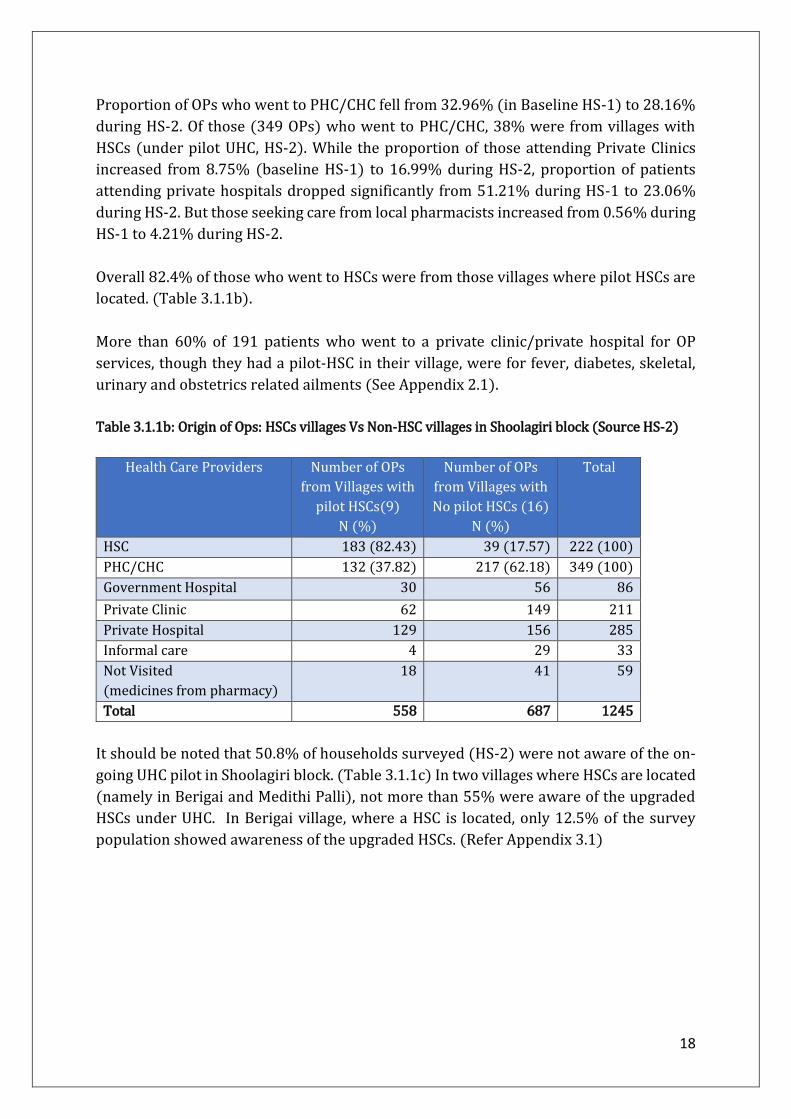
Proportion of OPs who went to PHC/CHC fell from 32.96% (in Baseline HS-1) to 28.16%
during HS-2. Of those (349 OPs) who went to PHC/CHC, 38% were from villages with
HSCs (under pilot UHC, HS-2). While the proportion of those attending Private Clinics
increased from 8.75% (baseline HS-1) to 16.99% during HS-2, proportion of patients
attending private hospitals dropped significantly from 51.21% during HS-1 to 23.06%
during HS-2. But those seeking care from local pharmacists increased from 0.56% during
HS-1 to 4.21% during HS-2.
Overall 82.4% of those who went to HSCs were from those villages where pilot HSCs are
located. (Table 3.1.1b).
More than 60% of 191 patients who went to a private clinic/private hospital for OP
services, though they had a pilot-HSC in their village, were for fever, diabetes, skeletal,
urinary and obstetrics related ailments (See Appendix 2.1).
Table 3.1.1b: Origin of Ops: HSCs villages Vs Non-HSC villages in Shoolagiri block (Source HS-2)
Health Care Providers Number of OPs
from Villages with
pilot HSCs(9)
N (%)
Number of OPs
from Villages with
No pilot HSCs (16)
N (%)
Total
HSC 183 (82.43) 39 (17.57) 222 (100)
PHC/CHC 132 (37.82) 217 (62.18) 349 (100)
Government Hospital 30 56 86
Private Clinic 62 149 211
Private Hospital 129 156 285
Informal care 4 29 33
Not Visited
(medicines from pharmacy)
18 41 59
Total 558 687 1245
It should be noted that 50.8% of households surveyed (HS-2) were not aware of the on-
going UHC pilot in Shoolagiri block. (Table 3.1.1c) In two villages where HSCs are located
(namely in Berigai and Medithi Palli), not more than 55% were aware of the upgraded
HSCs under UHC. In Berigai village, where a HSC is located, only 12.5% of the survey
population showed awareness of the upgraded HSCs. (Refer Appendix 3.1)

19
Table 3.1.1c: Awareness of pilot-UHC-HSCs in Shoolagiri block (Source HS-2, 2017)
Households
N
Households
%
Aware and sought care at HSC 335 33.5
Aware but didn't seek care at HSCs* 157 15.70
Not aware about pilot HSC 508 50.8
Total 1,000 100
*Respondents provided many reasons for not seeking care from HSCs: they wish to
consult a physician, or prefer to have “injections” in addition to medicines. HSCs do not
administer injections. Many respondents have also pointed out “lack of transport facility”
between their villages and where HSCs are located.
3.1.2 Out of Pocket Expenses (OOPE)
OOPE varies significantly across type of providers. Table 3.1.2a shows OOPE per OP visit
to public facilities dropped significantly from Rs.261 (HS-1) to Rs.Rs.59.38 during HS-2.
OOPE was lowest at Rs.5.98 per visit among those who accessed pilot HSCs, while
increases to Rs.55.87 and Rs.211.5 per visit among for those who accessed PHCs/CHCs
and Public Hospitals, respectively. (Refer Table 3.1.2b)
Table 3.1.2a: Average out of pocket expenditure for Outpatient care in Shoolagiri block: (Source
HS-1 and HS-2)
Shoolagiri Public
Mean
(Median)
Private
Mean
(Median)
Informal
Mean
(Median)
Pharmacy
Mean
(Median)
All
Mean
(Median)
Baseline Survey HS-1
(May-August 2016)
261.72
(100)
3632.49
(1000)
1336.66
(1150)
25
(15)
987.85
(500)
Interim UHC Survey HS-
2 (Nov – Dec 2017)
59.38
(20)
863.51
(520)
367.42
(200)
195.33
(60)
394.35
(100)
Source: HS-1 and HS-2
OOPE was highest among those accessing private facilities, both during HS-1 and HS-2, at
Rs.3632 and Rs.863, respectively.
Transportation costs accounts for more than 90% of OOPE among those accessing public
institutions. During HS-2, none among those accessing HSCs, spent any amount on
medicines or diagnostics. (Table 3.1.2c). Medicines at Government Hospitals consumed
about Rs.24 on average.

20
Table 3.1.2b: Break-up of average out of pocket expenditure for Outpatient care Facility wise:
Shoolagiri block (Source HS-2)
Shoolagiri Block-HS-2
(Nov – Dec 2017)
Health Care Providers Mean Median
HSC 5.98 0
PHC/CHC 55.87 50
Government Hospitals 211.5 100
Public 59.38 20
Private Clinics 607.80 400
Private Hospitals 1052.82 650
Private 863.51 520
Table 3.1.2c: OOPE break-up by Medical and Non-Medical expenses facility wise: Shoolagiri block
(Source HS-2)
Shoolagiri Block HS-2
HSC PHC/C
HC
Govt.
Hospital
Private
Clinics
Private
Hospitals
1 Consultation Fee 0 0 0 133.7 218.80
2 Diagnostic Test INSIDE 0 0 5.81 142.80 277.08
3 Diagnostic Test
OUTSIDE
0 0 17.44 16.42 24.07
4 Medicines INSIDE 0 .57 0 185.57 354.96
5 Medicines OUTSIDE 0 4.32 24.70 44.97 13.12
6 Transportation 5.93 37.5 130.91 60.76 122.22
7 Informal Payments .04 12.78 32.90 24.15 45.74
8 Total 5.98 55.87 211.5 607.80 1052.82
3.1.3 Access and average OOPE for NCD patients (Cohort from HS-1 and HS-2)
A sample/cohort of 32 NCD patients surveyed during the baseline HS-1 were surveyed
again during HS-2. Details of their health seeking behaviour and OOPE are given below:
From May/June 2017, HSCs under the pilot have begun to provide drugs for NCD
patients7; four of the 17 NCD patients dependent on public facilities are drawing their
drugs from HSCs; (Table 3.1.3a). Average out of pocket expenditure of NCD patients
visiting government facilities has dropped substantially from Rs. 153 (HS-1) to Rs. 40
(HS-2); (Table 3.1.3a).
7 The salient features of the NCD intervention are outlined in Section 4.

21
Table 3.1.3a: Access and Average OOPE for a cohort of 32 NCD patients: Shoolagiri block (Source
HS-1 and HS-2)
N Average OOPE
Provider Baseline Survey HS-1
HS-2
Baseline Survey HS-1
HS-2 Survey
HSC 0 4 0 12.5 PHC 9 12 193.33 50.0 CHC 6 0 92.5 0 Public Hospital 0 0 0 0 Private Clinic 4 4 1622.5 487.5 Private Hospitals 13 5 1899.23 1022 Informal 0 1 0 474 Pharmacy 0 6 0 528.33 Total 32 32 1046.09 354.81
Proportion of patients using private clinics / hospitals has fallen from 53%% (HS-1) to
28% (HS-2); (Table 3.1.3a). Seven of the 17 NCD patients have switched from private
clinics/hospitals to HSCs/PHCs; three of these eight patients access HSCs; six of 16 NCD
patients have switched from public facilities to private clinics/informal providers; (Table
3.1.3b). Refer Appendix 4.1 for details.
Table 3.1.3b: NCD patients accessing private and public facilities: Shoolagiri block (Source
HS-1 vs HS-2)
HS-2 Survey
(N) Public Private Informal/
Pharmacy Total
Bas
elin
e H
S-1
Su
rvey
(N
)
Public 9 3 3 15
Private 7 6 4 17
Informal 0 0 0 0
Total 16 9 7 32

22
3.2: VIRALIMALI BLOCK:
3.2.1: Access
Proportion of OPs utilizing HSCs in Viralimalai block has increased from 0.71% (during
HS-1) to 14.08% (during HS-2). PHC/CHCs share of the OP care has fallen from 32.6%
(HS-1) to 26.87% (HS-2).
But overall the proportion shows that utilization of Public facilities has increased from
45% (baseline HS-1) to 67% during HS-2, proportion of patients utilizing private
hospitals dropped significantly from 47.87% during HS-1 to 24.22% during HS-2.
Informal and Seeking care from pharmacist has increase from nil (HS-1) to 0.41% and
2.18% respectively.
Table 3.2.1a: Number of Persons Accessing to public and private facilities for out-patient services:
Viralimalai Block Pre and Post UHC pilot period: (Source HS-1 and HS-2)
Baseline
Pre UHC HS-1 2015
HS-1 Households Sampled N1=1000
(Number of household members
surveyed N2=4726
HS-2
Nov-Dec.2017 (HS-2)
HS-2 Households sampled N=1600
(Number of household members
Surveyed ) N=7181
Facility Provider Number of
OPs
% Number of
OPs
%
HSC 2 0.71 239 14.08
PHC/CHC 92 32.62 456 26.87
Government Hospital 34 12.06 450 26.52
Private Clinic 19 6.74 97 5.72
Private Hospital 135 47.87 411 24.22
Informal care - - 7 0.41
Not Visited
(medicines from pharmacy)
- - 37 2.18
Total 282 100 1,697 100
As mentioned in Section 2 and shown above, HS-2 covered 600 more households and
(2455 additional household members) than HS-1 in Viralimalai block. The self-reported
morbidity (of short term type) has increased from 58 to 229 per 1000 population. The
primary reason for this increase is clear from HS-2 and qualitative community surveys,
namely, “the presence of a functional HSC during the day”, in and around where people
reside”.
Geographic access to HSC is far better in Viralimalai than Shoolagiri Block: about 43% of
all OPs was from the villages where HSCs are located. The rest 57% have come from non-

23
HSC villages. Likewise, 25.8% of OPs utilizing PHC/CHC was from the villages where they
are located; the rest 74.2% were from non-PHC/CHC villages. Patients who went to a
private clinic/private hospital for OP services, though they had a pilot-HSC in their village,
were majorly for fever, diabetes, skeletal, urinary and obstetrics related ailments (See
Appendix 2.2).
Table 3.2.1b: Origin of OPs: HSCs villages Vs Non-HSC villages in Viralimalai block (Source HS-2)
Health Care
Providers
Number of OPs from
Villages with pilot
HSCs(11)
N (%)
Number of OPs
from Villages with
No pilot HSCs (14)
N (%)
Total
HSC 103 (43.10) 136 (56.90) 239 (100)
PHC/CHC 118 (25.88) 338 (74.12) 456 (100)
Government Hospital 115 335 450
Private Clinic 23 74 97
Private Hospital 113 298 411
Informal care 4 3 7
Not Visited 8 29 37
Total 484 1,213 1,697
Table 3.2.1c shows 47.4% of the sampled Household are aware and sought care at the
Pilot HSCs in the block, and about 41.2% of the sample Household are not aware about
their Pilot HSCs. It should be noted that overall awareness is much higher in villages
where the pilot HSCs are functioning compared to other villages. (Refer Appendix 3.2)
Table3.2.1c Awareness of pilot-UHC-HSCs in Viralimalai block (Source HS-2, 2017) Households
N
Households
%
Aware and sought care at HSC 474 47.4
Aware but didn't seek care at HSCs* 114 11.4
Not aware about pilot HSC 412 41.2
Total 1,000 100
*Respondents provided many reasons for not seeking care from HSCs: they wish to
consult a physician, or prefer to have “injections” in addition to medicines. HSCs do not
administer injections. Many respondents have also pointed out “lack of transport facility”
between their villages and where HSCs are located

24
3.2.2 Out of Pocket Expenses (OOPE)
Average OOPE per OP visit to public facilities has significantly reduced from
Rs.351 (during HS-1) to Rs.26 (during HS-2) in Viralimalai Block. The mean expense of
private facility has reduced from 2843 (during HS-1) to 1246 (during HS-2), though
remains the highest average OOPE both during HS-1 and during HS-2. Average OOPE on
Informal care and from pharmacist are about 227 and 211 per person, respectively.
Table 3.2.2a: Average out of pocket expenditure for Outpatient care in Viralimalai block: (Source
HS-1 and HS-2)
Average OOPE was lowest at Rs.2.90 per visit among those who visited HSCs, while it
increases to Rs.14.84 and Rs. 49.68 per visit among for those accessed PHCs/CHCs and
Public Hospitals, respectively. HS-2 average OOPE was highest among those accessing
private facilities, at Rs.299.83 in private clinics, and Rs. 1470.30 in private hospitals.
(Table 3.2.2b)
Table 3.2.2b: Break-up of average out of pocket expenditure for Outpatient care Facility wise:
Viralimalai block (Source HS-2)
Viralimalai Block-Post UHC Implementation Survey
(Nov – Dec 2017)
Health Care Providers Mean Median
HSC 2.90 0
PHC/CHC 14.84 0
Government Hospitals 49.68 20
Public 26.04 0
Private Clinic 299.83 230
Private Hospitals 1470.30 550
Private 1246.81 500
As noted in the case of Shoolagiri block, here too transportation accounts for almost all
of average OOPE in public facilities. (Table 3.2.2c)
Viralimalai Public
Mean
(Median)
Private
Mean
(Median)
Informal
Mean
(Median)
Pharmacy
Mean
(Median)
All
Mean
(Median)
HS-1
(May-August
2016)
351.25
(150)
2843.90
(500)
- - 2843.90
(500)
HS-2
(Nov – Dec 2017)
26.04
(0)
1246.81
(500)
227.14
(100)
211.89
(65)
396.36
(20)

25
Table 3.2.2c: OOPE break-up by Medical and Non-Medical expenses facility wise: Viralimalai block
(Source HS-2)
Viralimalai
HSC PHC/CH
C
Govt.
Hospital
Private
Clinic
Private
Hospitals
1 Consultation Fee 0 0 0 76.26 230.34
2 Diagnostic Test INSIDE 0 0 0 3.09 224.45
3 Diagnostic Test OUTSIDE 0 0 .62 0 39.17
4 Medicines INSIDE 0 .53 2.00 178.19 755.02
5 Medicines OUTSIDE 0 0 .60 2.78 16.71
6 Transportation 2.28 12.01 35.23 37.06 111.51
7 Informal Payments 0.62 2.18 11.06 3.64 44.64
8 Total 2.90 14.84 49.68 299.83 1470.30
3.2.3 Access and average OOPE for NCD patients (Cohort from HS-1 and HS-2)
A sample of 29 NCD patients surveyed during the baseline HS-1 were surveyed again
during the HS-2. Details of their health seeking behaviour and OOPE are given below:
NCD drugs are made available at HSCs as a part of UHC pilot; four of the 19 NCD patients
dependent on public facilities are drawing their drugs from HSCs; (Table 3.2.3a). Average
out of pocket expenditure of NCD patients visiting government facilities has dropped
substantially from Rs. 361 (HS-1) to Rs.35 (HS-2).
Table 3.2.3a: Access and Average OOPE of a 29 NCD patient cohort Viralimalai block (Source
HS-1 and HS-2)
N Average Expenditure
Provider Baseline HS-1 Survey
HS-2 Survey
Baseline HS-1 Survey
HS-2 Survey
HSC 0 4 - 0 PHC 7 8 160 29.5 CHC 5 0 774 - Public Hospital 5 7 232 60 Private Clinic 1 3 1500 870 Private Hospitals 11 7 3485.45 1912.57 Informal 0 0 - - Pharmacy 0 0 - - Total 29 29 1585.86 574.27

26
Proportion of patients using private clinics / hospitals has fallen from 41% (HS-1) to 34%
(HS-2). Three of the 12 NCD patients have switched from private clinics/hospitals to
HSCs/PHCs. Only one out of 17 NCD patients has switched from public facilities to private;
(Table 3.2.3b). Refer Appendix 4.1 for details.
Table 3.2.3b: NCD patients accessing private and public facilities: Viralimalai block
(Source HS-1 vs HS-2)
HS-2 Survey
(N) Public Private Informal/
Pharmacy Total
Bas
elin
e H
S-1
Su
rvey
(N
)
Public 16 1 0 17
Private 3 9 0 12
Informal 0 0 0 0
Total 19 10 0 29
3.3: VEPPUR BLOCK:
3.3.1: Access
HSCs account for 23% of all OPs in Veppur block (during HS-2), a very significant increase
from 0.38%, during HS-1. Overall, utilization of public facility in Veppur block has
significantly increased from 54% in HS-1 to 71% in HS-2. The fall in the share of private
hospitals from 40.9% (during HS-1) to 23.1% (during HS-2) is noteworthy.
Table 3.3.1a: Number of Person Accessing public and private facilities for out-patient services:
Veppur Block Pre and Post UHC pilot period: (Source HS-1 and HS-2)
Baseline Survey
Pre UHC 2015
(HS-1) Number of Households sampled N1=1000 (Number of household members surveyed
N2=4074)
Post UHC survey
Nov-Dec.2017
(HS-2) Number of Households Sampled N1=1240 Number of Household members N2=5069
Facility Provider Number of OPs % Number of OPs %
HSC 1 0.38 281 23.11
PHC/CHC 82 31.06 295 24.26
Government Hospital 61 23.11 289 23.77
Private Clinic 11 4.17 38 3.13
Private Hospital 108 40.91 282 23.19
Informal care - - - -
Not Visited
(medicines from pharmacy)
1 0.38 31 2.55
Total 264 100 1216 100

27
As mentioned in Section 2 and shown above, HS-2 covered 240 more households and
(995 additional household members) than HS-1 in Veppur block). The self-reported
morbidity (of short term type) has increased from 64 to 236 per 1000 population. The
primary reason for this increase is clear from HS-2 and qualitative community surveys,
namely, “the presence of a functional HSC during the day”, in and around where people
reside”.
Table 3.3.1b shows 83.2% of patients accessing HSCs were from the villages where pilot
HSCs are located. And about 20% of patients visiting PHC/CHCs were from villages where
pilot HSCs are located.
Table 3.3.1b: Origin of OPs: HSCs villages Vs Non-HSC villages in Veppur block (Source HS-2)
Facility Provider Number of OPs from
Villages with pilot
HSCs(10)
N (%)
Number of OPs from
Villages with No pilot
HSCs (15)
N (%)
Total
HSC 234(83.27%) 47 (16.73%) 281 (100%)
PHC/CHC 60(20.33%) 235 (79.67%) 295 (100%)
Government Hospital 126 163 289
Private Clinic 17 21 38
Private Hospital 107 175 282
Informal care - - -
Not Visited 12 19 31
Total 504 712 1,216
Patients who went to a private clinic/private hospital for OP services, though they had a
pilot-HSC in their village, were majorly for fever, diabetes, skeletal, urinary and obstetrics
related ailments (See Appendix 2.3).
Table 3.3.1.c shows 46.7% of the sampled Household were aware and sought care at the
Pilot HSCs in the block, and about 50.6% of the sample Household were not aware about
their Pilot HSCs. It should be noted that overall awareness is much higher in villages
where the pilot HSCs are functioning compared to other villages. (Refer Appendix 3.3)
Table 3.3.1c: Awareness of pilot-UHC-HSCs in Veppur block (Source HS-2)
*Respondents provided many reasons for not seeking care from HSCs: they wish to
consult a physician, or prefer to have “injections” in addition to medicines. HSCs do not
Households
N
Households
%
Sought care at HSC 467 46.70
Aware but didn't Seek care at HSCs* 27 2.70
Not aware about HSC 506 50.60
Total 1,000 100

28
administer injections. Many respondents have also pointed out “lack of transport facility”
between their villages and where HSCs are located
3.3.2 Out of Pocket Expenses (OOPE)
Average OOPE per OP visit to public facilities has significantly reduced from
Rs.395.16 (HS-1) to Rs.67.52 (HS-2). The mean expense of private facility has also
reduced from 4349 (HS-1) to 2098 (HS-2). Average OOPE on self-care by consuming drug
from pharmacist is 47.87(HS-2). (Table 3.3.2a)
Table 3.3.2a: Average out of pocket expenditure for Outpatient care in Veppur block: (Source
HS-1 and HS-2)
Average OOPE was lowest at Rs.5.16 per visit among those who visited HSCs. It is Rs.40.42
and Rs. 155.82 per visit among for those who accessed PHCs/CHCs and Public Hospitals,
respectively.
OOPE was highest among those accessing private facilities: Rs.646 in private clinics and
Rs.2293 in private hospitals.
Table 3.3.2b: Break-up of average out of pocket expenditure for Outpatient care facility wise:
Veppur block (Source HS-2)
Veppur Block-Post UHC Implementation Survey
(HS-2 Nov – Dec 2017)
Health Care Providers Mean Median
HSC 5.16 0
PHC/CHC 40.42 30
Government Hospitals 155.82 50
Public 67.52 20
Private Clinic 646.05 450
Private Hospitals 2293.63 900
Private 2097.98 800
Veppur Public
Mean
(Median)
Private
Mean
(Median)
Informal
Mean
(Median)
Pharmacy
Mean
(Median)
All
Mean
(Median)
Baseline Survey
(May-August
2016)
395.16
(100)
4349.96
(1600)
- 100
(100)
2176.70
(500)
Post UHC Survey
(Nov – Dec 2017)
67.52
(20)
2097.98
(800)
- 47.87
(30)
601.35
(50)

29
As in other two blocks, transportation expenses accounted almost all of the OOPE for
patients accessing public facilities. Whereas, for those accessing private facilities, in
addition to transportation expenses, expenses towards consultation, diagnostics and
drugs were quite substantial.(above Rs.1700 per visit).
Table 3.3.2c: OOPE break-up by Medical and Non-Medical expenses facility wise: Veppur block
(Source HS-2)
Veppur
HSC PHC/CHC Govt.
Hospital
Private
Clinic
Private
Hospitals
1 Consultation Fee 0 0 0 115.78 208.43
2 Diagnostic Test
INSIDE
0 0 1.73 50 571.88
3 Diagnostic Test
OUTSIDE
0 1.18 11.59 21.05 51.77
4 Medicines INSIDE 0 0 0 342.63 967.90
5 Medicines
OUTSIDE
0 2.61 14.83 15.78 85.75
6 Transportation 3.08 23.95 76.77 80.26 234.55
7 Informal
Payments
2.08 12.83 51.29 20.52 164.94
8 Total 5.16 40.42 155.82 646.05 2293.63
3.3.3 Access and average OOPE for NCD patients (Cohort from HS-1 and HS-2)
Drugs for NCD patients are provide at HSCs in pilot UHC blocks; five of the 23 NCD
patients dependent on public facilities are drawing their drugs from HSCs during HS-2;
(Table 3.3.3a). Average out of pocket expenditure of NCD patients visiting government
facilities has dropped substantially from Rs. 112 (HS-1) to Rs.42 (HS-2).
Table 3.3.3a: Access and Average OOPE for NCD patients Veppur block (Source HS-1 and HS-2)
N Average OOPE
Provider Baseline HS-1 Survey
HS-2 Survey Baseline HS-1 Survey
HS-2 Survey
HSC 0 5 - 0 PHC 8 7 54.75 47.14 CHC 1 6 100 53.33 Public Hospital 4 5 230 64 Private Clinic 1 0 670 - Private Hospitals 14 4 9327.85 5580 Informal 0 1 - 10000 Pharmacy 0 0 - - Total 28 28 4739.92 1182.29

30
Proportion of patients using private clinics / hospitals has fallen from 53%% (HS-1) to
14% (HS-2); (Table 1). 12 of the 15 NCD patients have switched from private
clinics/hospitals to HSCs/PHCs; two of these 12 patients access HSCs; two of 13 NCD
patients have switched from public facilities to private clinics/informal providers; (Table
3.3.3b). Refer Appendix 4.1 for details.
Table 3.3.3b: NCD patients accessing private and public facilities: Veppur block (Source HS-1 vs
HS-2)
HS-2 Survey
(N) Public Private Informal/
Pharmacy Total
Bas
elin
e H
S-1
Su
rvey
(N
)
Public 11 1 1 13
Private 12 3 0 15
Informal 0 0 0 0
Total 23 4 1 28
31
4. Results based on UHC-APP data base
A number of observations can be made on the progress of UHC pilot based on UHC APP
software data base. As we shall note in this section, several of its features lend a deeper
analysis of utilization pattern which will help strengthen directly the delivery system.
4.1 VHNs familiarity and use of TN UHC APP
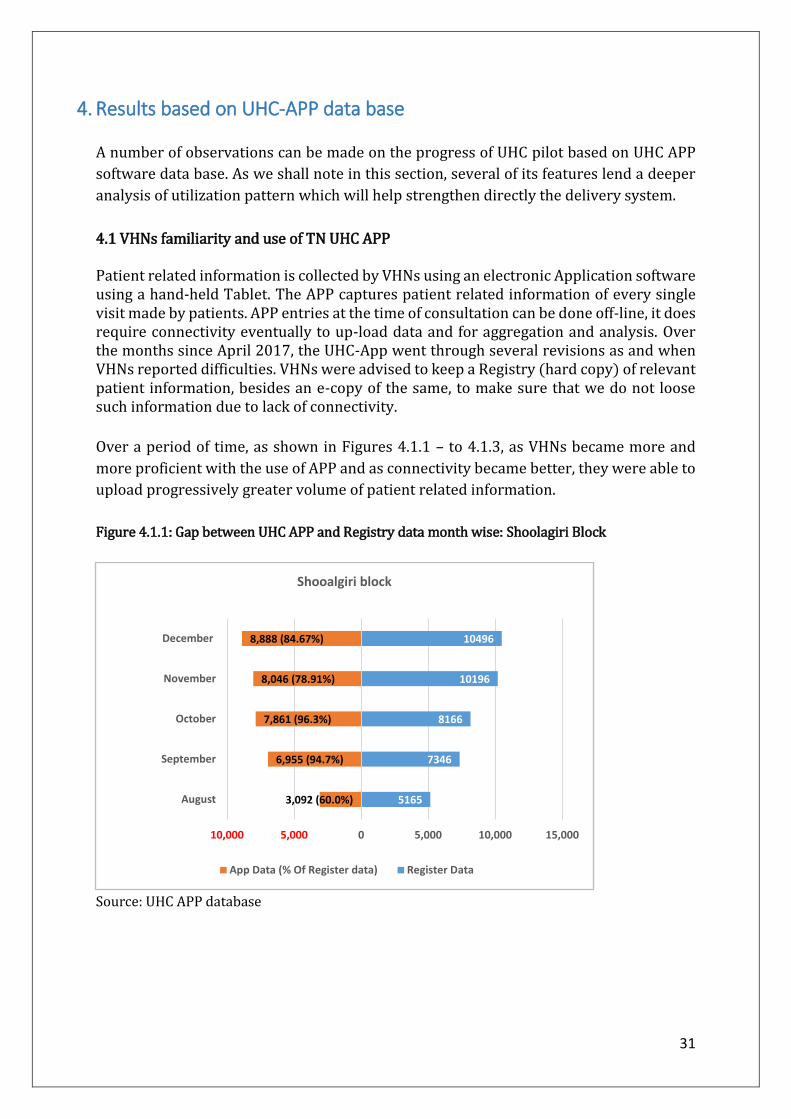
Patient related information is collected by VHNs using an electronic Application software using a hand-held Tablet. The APP captures patient related information of every single visit made by patients. APP entries at the time of consultation can be done off-line, it does require connectivity eventually to up-load data and for aggregation and analysis. Over the months since April 2017, the UHC-App went through several revisions as and when VHNs reported difficulties. VHNs were advised to keep a Registry (hard copy) of relevant patient information, besides an e-copy of the same, to make sure that we do not loose such information due to lack of connectivity.
Over a period of time, as shown in Figures 4.1.1 – to 4.1.3, as VHNs became more and
more proficient with the use of APP and as connectivity became better, they were able to
upload progressively greater volume of patient related information.
Figure 4.1.1: Gap between UHC APP and Registry data month wise: Shoolagiri Block
Source: UHC APP database
5165
7346
8166
10196
10496
3,092 (60.0%)
6,955 (94.7%)
7,861 (96.3%)
8,046 (78.91%)
8,888 (84.67%)
10,000 5,000 0 5,000 10,000 15,000
August
September
October
November
December
Shooalgiri block
App Data (% Of Register data) Register Data

32
Figure 4.1.2: Gap between UHC APP and Registry data month wise: Viralimalai Block
Source: UHC APP database
In all three UHC pilot blocks, APP entry has grown significantly, over the months. By
December 2017, Shoolagiri block shows a remarkable improvement in the APP uptake
from Registry, compared to other two blocks, which also shows considerable
improvement.
Figure 4.1.3: Gap between UHC APP and Registry data month wise: Veppur Block
Source: UHC APP database
In our view, the progressive use of UHC APP by VHNs at HSC level is in itself a clear
demonstration of an important feature of the present UHC pilot. Developing an electronic
7850
8506
7792
9278
8570
4,588 (58.0%)
6,133 (72.1%)
7,002 (89.9%)
7,856 (84.67%)
6,614 (77.17%)
10,000 5,000 0 5,000 10,000 15,000
August
September
October
November
December
Viralimalai block
App Data (% Of Register data) Register Data
5560
6699
7791
8105
8456
4,045 (73.0%)
4,709 (70.3%)
5,128 (89.9%)
5,562 (68.62%)
5,706 (67.47%)
10,000 5,000 0 5,000 10,000
August
September
October
November
December
Veppur block
App Data (% Of Register data) Register Data

33
patient information system will be useful in the future as UHC develops over time
integrating with other levels of care, particularly in developing a sound referral system.
Increased use of APP will enormously increase the overall administrative efficiency,
thereby release the amount of time VHNs will have for patient care. Increased use of APP
by higher officials (DDHSs/BMOs with appropriate dash-boards) for further analysis of
health care needs and pattern of ailments reported will strengthen the overall delivery
system and make it more responsive.
4.2 Proportion of Block population accessing HSCs
Table 4.2: Proportion of Block population utilized HSCs from July-December 2017: Shoolagiri Veppur Viralimalai
Unique
Individuals
(OP+NCD+OG)
Revisits’
N (%)
Total Unique
Individuals
(OP+NCD+OG)
Revisits’
N (%)
Total Unique
Individuals
(OP+NCD+OG)
Revisits’
N (%)
Total
July 2,887 250
(7.9)
3,137 3,110 413
(11.7)
3,523 2,465 492
(16.6)
2,957
August 2,640 464
(14.9)
3,104 2,904 1,159
(28.5)
4,063 3,204 1,510
(32.0)
4,714
September 5,485 1,717
(23.84)
7,202 3,158 1,928
(37.9)
5,086 3,985 2,246
(36.0)
6,231
October 5,366 2,616
(32.77)
7,982 2,733 2,582
(48.5)
5,315 3,564 3,542
(49.8)
7,106
November 5,182 3,139
(37.7)
8,321 2,641 2,967
(52.9)
5,608 3,661 4,470
(54.9)
8,131
December 5,232 3,326
(38.8)
8,558 2,278 3,347
(59.5)
5,625 2,404 4,131
(63.21)
6,535
Total 26,792
16,824
19,283
Block
Population
184940
154789
141409
% of block
individuals
utilized
14.5%
10.9%
13.6%
Source: UHC APP database
Table 4.2 shows that in Shoolagiri block, 14.5% of its population, has accessed HSCs
under UHC pilot at least once during July-December 2017. Likewise, in Veppur and
Viralimalai blocks, 10.9% and 13.6% of their respective population have accessed HSCs
under UHC pilot, at least once during July-December 2017.
This is a very important positive impact of the present UHC pilot. In less than a year since
the launching of the UHC pilot, population coverage has increased substantially. This is
despite no active and vigorous IEC campaign, which should be a major component of the
next phase of this pilot.

34
4.3 Origin of patients accessing HSCs:
On the origin of patients attending HSCs, the APP shows a more encouraging results: For
example, in Shoolagiri block (Table 4.3), only 47% of OPs were from the villages where
HSCs are located. Nearly 38% were from the neighbourhood regions. This is in quite
contrast to the results from HS-2 which shows that only about 16% of OPDs were from
neighbour villages (in Shoolagiri block, section 3.1.1b). But we must be careful here: HS-
2 reports access during the previous 30 days of survey date, whereas APP data reflects
the entire sample of attendance of patients during the past six months. The APP captures
all “repeat” patients also – an important dimension of the UHC pilot, we shall highlight
later in this section.
Figures 4.3.1 – 4.3.3 show origins of patients HSC-wise. [Note considerable number of
patients have not been mapped of their origins. This is due to either VHNs not entering
this information, or the name of their habitations are not listed in the software data-
based. This needs to be rectified soon].
Table 4.3: Origin of patients accessing HSCs from July-December 2017
Shoolagiri Viralimalai Veppur Total
HSC village 18,349
(47.49)
13,758
(38.48)
9,338
(31.87)
41,445
(39.97)
Nearby Village 15,271
(39.53)
12,103
(33.85)
7,143
(24.38)
34,517
(33.29)
NOT Mapped 5,014
(12.98)
9,892
(27.67)
12,820
(43.75)
27,726
(26.74)
Total 38,634
(100)
35,753
(100)
29,301
(100)
1,03,688
Source: UHC APP database
Figure 4.3.1: Origin of Patients accessing HSCs: Shoolagiri block
Source: UHC APP database
411
1131
547 605
1562
927
442136
13261075
243
1042627
71
690880 804 671
1765
1017755 731
192 192507
272
498
956488
0
418
617
256
652
591
804
1670
2391555 398
1551
744
271
225
900
541412
340 201
67217
35 430
329
225
142 754
170
29
144
32
229
83
305
117
80
59
68
11323
255
70
532557
216
0
500
1000
1500
2000
2500
3000
Nu
mb
er o
f O
P+N
CD
+OG
Name of the HSC
HSC Village Nearby Village Not Mapped

35
Figure 4.3.2: Origin of Patients accessing HSCs: Viralimalai Block
Source: UHC APP database
Figure 4.3.3: Origin of Patients accessing HSCs: Veppur block
Source: UHC APP database
Note: Murukkankudi HSC is functioning at Namayur Village
501722
463217
889 1040609
103 194 257 130
1233
795393
195
1394
902 931
1652
481657
628437
402 765
837 563
201
217388
580
343
165 1157
496
317
6131218
964
488
373
951
856
247619
80
86 487
520
504
1078
32
1597
413
149
325
477
592
849
118
212
292
359
0
500
1000
1500
2000
2500
3000
3500
Nu
mb
er o
f O
PD
+NC
D+O
G
Name of the HSC
HSC Village Nearby Village Not Mapped
643469
45
2692
333533
20
557
89305
115 25
1622
426690
21222 98 65
378
0
242
148
23
411
2589
35
2255
83
49
47
1625
400
69
33
13 33126 79
180
88
27 481 1675
86
24
604
2
61
1489
60754
299
43
2116
677
382
1784
501
887243
625
0
500
1000
1500
2000
2500
3000
3500
Nu
mb
er o
f O
PD
+NC
D+O
G
Name of the HSC
HSC Village Nearby Village Not Mapped

36
4.4 Age and Gender distribution:
What is even more remarkable of this pilot is that male patients account for nearly 35%
of all OPs. (Table 4.4.1)
Table 4.4.1 Gender distribution block-wise July-December 2017:
Gender Shoolagiri block
N (%)
Viralimalai block
N (%)
Veppur block
N (%)
All three Pilot
blocks
N (%)
Female 24,721 (64.01) 23,093 (64.60) 18,460 (63.0) 66,274 (63.93)
Male 13,901 (35.99) 12,653 (35.40) 10,841(37.0) 37,395 (36.07)
Total 38,622 (100) 35,746 (100) 29,301 (100) 103,669 (100)
Source: UHC APP database
Age wise distribution shows that those in age groups 15-35 and 36-59, account for from
about 55% (in Veppur) to 67% (in Shoolagiri) of all OPs. Veppur has an exception of
having 30% of its OPs accounted by those above 60 years! (Table 4.4.2)
Table 4.4.2 Age and Gender wise distribution block-wise July-December 2017: Shoolagiri Viralimalai Veppur
Age
Group
Female
N (%)
Male
N (%)
Total
N (%)
Female
N (%)
Male
N (%)
Total
N (%)
Female
N (%)
Male
N (%)
Total
N (%)
Under
15
5,243
(21.21)
4,827
(34.72)
10,070
(26.07)
3,632
(15.73)
3,690
(29.16)
7322
(20.48)
2,027
(10.98)
2,283
(21.06)
4,310
(14.71)
Between
15 – 35
10,778
(43.60)
3,832
(27.57)
14,610
(37.83)
7,155
(30.98)
2,718
(21.48)
9,873
(27.62)
4,530
(24.54)
1,426
(13.15)
5,956
(20.33)
Between
36 – 59
5,968
(24.14)
3,313
(23.83)
9,281
(24.03)
8,390
(36.33)
3,830
(30.27)
12,220
(34.19)
7,019
(38.02)
3,192
(29.44)
10,211
(34.85)
Over 60 2,732
(11.05)
1,929
(13.88)
4,661
(12.07)
3,916
(16.96)
2,415
(19.09)
6,331
(17.71)
4,884
(26.46)
3,940
(36.34)
8,824
(30.12)
Total 24,721
(100)
13,901
(100)
38,622
(100)
23,093
(100)
12,653
(100)
35,746
(100)
18,460
(100)
10,841
(100)
29,301
(100)
Source: UHC APP database

37
4.5 Block wise Outpatients utilization: Figure 4.5.1 shows month wise use of HSCs in respective UHC blocks. There has been a
steady rise in the use of HSCs. This represents regular outpatients, NCD patients and OG
patients. The steady rise is due to several factors, including supply side and demand side
factors.
Figure 4.5.1: Outpatient clinical visits in pilot blocks May-December 2017
Source: The source for this information is from the Notebook (Registry) maintained by VHNs at
HSC. This contains all patient related information which are later entered by the VHNs into the
UHC APP` (off-line), and uploaded to the Main Server through a network service provider.
HSCs in all three UHC pilots witnessed slow but steady improvements in physical
infrastructure, and deployment of the second VHNs8. It took considerable time, training
and support for additional VHNs to get acclimatised to the new job requirements and to
gain confidence to examine patients. Wherever the second VHNs stayed in respective HSC
quarters, residents of these villages were able to access HSCs even during evening hours
beyond 5pm.
Our impression is that by November/December 2017, almost all HSCs had all supply side
inputs and almost 70% of additional VHNs were staying in HSC quarters. This, along with
vigorous IEC campaign, the overall performance (measured in terms of OPD attendance,
and other qualitative measures) will improve over the next six to 12 months. Most new
VHNs have shown clear willingness to continue to work under current work-
environment. There are clear signs of VHNs getting “connected” with local residents as
professionals and as part of local communities.
8 Refer Appendix 5-7 shows infrastructural and HR positions of HSCs in all three blocks, as of March 2016 (pre UHC) and December 2017, post-UHC.
2862
4074
58175165
7346
8166 7933
7965
1551
5013
7766 7850
8497
7792
9278
8108
1535
2964
6476
5560 6699
7791
6979
7636
0
1000
2000
3000
4000
5000
6000
7000
8000
9000
10000
May June July August September October November December
OP
D C
linic
al V
isit
s
Shoolagiri Block (25 HSCs) Viralaimali Block (21 HSCs) Veppur Block (21 HSCs)

38
The overall impression is that these second VHNs over the next 6 to 12 months will have
much more confidence and display ability to deliver better care and coverage of services,
with adequate support in the form of additional manpower and other support.
Table 4.5 Average OPD and NCD/OGs as recorded by VHN 2 (clinical record)
Block wise/ Per HSC:
Shoolagiri Block
(Average Per day per
HSC)
Viralimalai Block
(Average Per day per
HSC)
Veppur Block
(Average Per day per
HSC)
Month-
2017
OP OP+NCD+OG OP OP+NCD+OG OP OP+NCD+OG
April 2.72 NA 2.34 NA 6.16 NA
May 4.24 NA 2.73 NA 2.7 NA
June 5.81 7.09 9.13 10.4 3.23 6.13
July 7.71 9.3 12.33 14.79 7.79 12.33
August 6.27 7.65 11.64 13.84 6.66 9.8
September 9.16 11.3 13.4 15.57 8.36 12.26
October 10.25 13 12.63 14.8 10.5 14.8
November 10.02 12.69 14.67 17.67 9.65 13.29
December 10.76 12.74 13.11 15.44 10.67 14.54
Source: The Registry (as in Table 4.5.1)
This is evident from Figure 4.5.2, which shows break up of Out-patients and NCD and OG
patients attending HSCs. By OG patients we refer to both care in pregnancy and general
women’s health issues. In NCDs we include only those registered for NCD chronic illness
care. In all blocks, since early June, the NCD and OG components have been included
under UHC pilot. As a result there has been a steady improvement in the average number
of patients covered. This reflects the enhanced ability of VHNs in providing follow up care
for NCD patients and also in their ability (increasingly) to correctly suspect/screen for
possible cases and refer such patients to PHC MO for a confirmatory diagnosis before
being included under the NDC register.
The salient features of the NCD intervention are given below:
It is important to note here that all NCD patients are tractable from UHC APP and Registry maintained by the VHNs. HSCs are equipped with diagnostics kits to screen for whether a patient is diabetic and/or hypertensive. If the VHN suspects the patient to be diabetic and/or hypertensive, the patient is then asked to visit the respective PHC, where he/she is examined by the medical officer (with additional laboratory tests) who confirms the status. Here, at PHC, he /she is also examined for co-morbidity conditions, namely for cardiac respiratory conditions, Thyroid and Cholesterol, as well as for complications of diabetes and hypertension. Once the patient is confirmed as suffering from diabetes and/or hypertension and co-morbidity conditions, the MO prescribes relevant drugs and

39
ask the patient to collect them from the respective HSC/VHN who referred this patient to PHC. VHN dispenses relevant drugs for a month, and asks the patient to get back after month for monitoring and dispensing next month’s drugs. At the end of the third month, the patient is referred back to the respective PHC, along with the readings of the previous three months for Diabetes and Hypertension, for another examination of the patient by the Medical Officer. Typically, the patient is asked to report one week before the expiry of his/her stock to ensure no break in compliance due to lack of drugs with the patient. This is how the referral system is designed. There are bottlenecks and impediments to be addressed on ground: sometimes there could be shortage of drugs in the Drug Warehouse at district headquarters; or the patient could not report for personal reasons. On many occasions, we have heard VHNs urging the patient over phone to collect drugs due from the HSC. When the drugs are in short supply, they are dispensed for shorter duration (15 days, instead of 30 days) – in such situations, VHN reminds the patient later to collect drugs for the remaining days, before the next round of monitoring. This active follow up by the VHN is the key- it shows a dramatic change in mindset from that of a curative clinic, to a preventive and promotive population based primary care service (secondary prevention as it is technically known). The following drugs are dispensed by at HSCs on prescriptions by an MO from PHC:
a. For Hypertension - Amlodipine Tab IP - 2.5mg, Atenolol Tab IP - 50mg, Enalapril Maleate Tab IP - 2.5mg b. For Diabetes - Glimipride Tab IP 1mg, Glipizide Tab IP - 5mg, Glybenclamide Tab IP, Metformin Tab IP - 500mg c. For Cholesterol Atorvastatin Tab IP d. For Cardio Aspirin Tab IP, Clopidogrel Tab IP - 75mg
The above system is now almost in place as VHNs have gained experience and the confidence level is visibly higher in “engaging with the patients”. We shall visit this issue in the next section. Figure 4.5.2: Disaggregated data: OPD, OG, and NCD: November and December 2017
Source: The Registry (as noted in Table 4.5.1)
6518 (82.16%)5269 (75.50%)
8010 (86.33%)6730 (84.4%)
5604 (73.4%)6885 (84.9%)
911 (11.48%)
294 (4.21%)
369 (3.98%)
738 (9.2%)
435 (9.3%)
345 (4.3%)504 (6.35%)
1416 (20.29%)
899 (9.69%)
497 (6.2%)1597 (6.2%)
878 (10.8%)
0
2000
4000
6000
8000
10000
Shoolagiri(Total=7933)
Veppur(Total=6979)
Viralimalai(Total=9278)
Shoolagiri(Total=7965)
Veppur(Total=7636)
Viralimalai(Total=8108)
November December
Nu
mb
er
of
Co
nsu
ltat
ion
s
VHN-2 Clinical data
OP OG NCD

40
4.6 Drug distribution; Societal Impact:
A major use of the APP is that it can help compute total units of drugs distributed on a
daily basis patient wise. Table 4.6 shows a very important result of the UHC pilot. It shows
the total volume of drugs distributed and their comparative rupee value using their unit
price at which TNMSC has purchased them and the market price of these drugs.9
Appendix 4.2 gives details of all 20 regular drugs dispensed by VHNs at HSC.
Table 4.6: TNMSC and Market value for drug dispensed at HSCs in all three pilot blocks during
July – December 2017
Month Regular Drug NCD Drug Total
TNMSC
Drug
Value
(Rs.)
Total
Drug
Market
Value
(Rs.)
Units
Dispensed
TNMSC
Value
(Rs.)
Market
Value
(Rs.)
Units
Dispensed
TNMSC
Value
(Rs.)
Market
Value
(RS.)
July 73056 51632 232150 35457 5172 77402 56805 309552
August 241180 137965 657957 162736 23211 298337 161176 956294
September 272068 176792 762260 124232 17403 233708 194196 995969
October 318963 203532 945226 179345 24864 331198 228397 1276425
November 292159 196034 859317 148549 20433 278965 216468 1138282
December 260552 175384 777275 129300 17632 242114 193017 1019390
Total
(Half-
yearly)
14,57,978 9,41,343 42,34,188 7,79,619 1,08,718 14,61,727 10,50,062 56,95,916
Note: The above table is based on UHC APP data, which has captured 77.69% of register data from July-
December month. The total amount is likely to be much higher if all 100% of patients consulted and
dispensed with drugs could be captured by the APP.
Total value of all drugs distributed from all three blocks at TNMSC price is Rs.10.50 lakhs.
Whereas this amounts to Rs.56.95 lakhs at market price. This shows the amount of money
patients attending the HSCs in the pilot region would have spent out of pocket, had they
attended private provided in the absence of these HSCs. This represents that upper limit,
the per capita OOPE would have been Rs.41 and Rs.101 for regular and NCD drugs,
respectively.
9 Market prices of all drugs distributed from pilot HSCs were collected from a local pharmacy shop in Shoolagiri town in December 2017.

41
4.7: Cost of provision per OP visit
While the pilot has progressed in many dimensions as shown in the preceding sections,
it is important to have an estimate of cost of outpatient services provided through HSCs
under UHC pilot.
Table 4.7 shows the cost of drugs distributed (at TNMSC price) per OP visit. For regular
OPs, It varies from Rs. 6.61 per consultation in Shoolagiri to Rs.12.30 per consultation in
Viralimalai. For NCD drugs, the cost of drugs per consultation is between Rs.7.22 and Rs.
8.11.
What proportion of the total cost of OP services per consultation is accounted for by cost
of drugs? Figure 4.8 shows a rough calculation of the total cost of OP care per patient visit.
This includes all capital costs and recurring costs incurred in HSCs as part of UHC pilot.10
Three points should be noted here:
a. The average total cost per OP visit ranges from Rs.64 to Rs.97. This is far below
the average OP cost per visit at public facilities, as estimated by an earlier study,
which is about Rs.300 using 2013-14 data (TN-SHA 2017).
b. Therefore, every outpatient diverted from higher-level public facilities to HSC
would help save about Rs.200 per visit. This is an enormous savings of public
resources, which could be redeployed to strengthen further the public health
system.
c. Drugs account from 7% to 19% depending upon the OP. The larger the number of
OPs attending HSCs, cost per patient per visit will come down. Accordingly, the
share of drugs will rise. Viralimalai has the lowest total cost per OP visit (Rs.64.12)
and drugs (for regular OPs) constitute 19.8% of the total cost per OP visit.
Shoolagiri has a much higher total cost per OP visit (Rs.94.07) and drugs
constitute only Rs.7.03 of the total cost per OP visit.
10 Capital cost includes annualized values of all expenses made towards purchase of various equipment, including clinical instruments, cost of additional amount spent in upgrading the
physical infrastructure etc. Recurring cost include salary of VHNs, cost of drugs, other expenses such as electricity, water, etc. Capital expenses incurred for the pilot are assumed to have a life span of just 5 years.

42
Table 4.7: Cost of Drugs distributed per outpatient visit at HSCs: All Pilot Blocks December 2017
Cost of Drugs Distributed
at TNMSC Price (Rs.)
Number of OP consultations
Cost of Drugs Per OP consultation (Rs.)
Regular NCD Regular NCD Regular NCD
Shoolagiri 55815 3170 8449 439 6.61 7.22
Veppur 46464 9001 4434 1272 10.48 7.08
Viralimalai 73104 5460 5941 673 12.30 8.11
Source: UHC APP database
Figure 4.8: Average cost of an OP visit in UHC pilot Blocks (December 2017) Source: UHC APP and
Official NHM data:
94.0797.48
64.12
0.00
20.00
40.00
60.00
80.00
100.00
120.00
Shoolagiri Veepur Viralimalai
Ave
rage
co
st o
f an
OP
vis
it (
Rs.
)

43
5. Way Forward:
We now turn to the second objective of the report, namely, the following:
(i) to what extent and how well the UHC piloting in the State covers the scope of
the proposed components/services of Health and Wellness Centres by GoI?.
UHC pilot in TN commenced in early 2017, and practically began to deliver clinical out-
patient services from April 2017. Until about April, most HSCs were being reconstructed,
refurbished, and basic physical infrastructural gaps were being addressed. In fact, even
by end of November 2017, a few HSCs were suffering from lack of basic amenities, such
as water, and electricity. VHNs were in place in most places but many had to function
with one VHN till end of November. UHC APP underwent more than 25 revisions as and
when problems were identified at field level. Internet connectivity posed serious
constraints in uploading patient-data on a daily basis.
UHC pilot is now about a year old – and what it is delivering now – as shown in the last
section – is a result of enormous amount of efforts put in at various levels in all three pilot
blocks, and the constant nudging and support provided at district and state level
administrative machinery.
Yet, UHC pilot so far is very much like a one-year old infant. The first step of this infant is
to learn to deliver primary clinical care at HSC level. The first step of this infant also
consists of several smaller tiny steps, including new infrastructural inputs, recruitment
and deployment of additional Village Health Nurses (called the 2nd VHN), who needs to
work in harmony with the senior VHNs (called the 1st VHN). Both VHNs together form
organic parts of HSCs, which needs time to evolve and deliver better clinical care. [Note
that there is no official designation as 1st VHN or 2nd VHN. We use these “terms” to refer
to the fact that there are two VHNs].
The results presented in the earlier sections show clear signs of positive impact of UHC
pilot, in improving access to and utilization of HSCs, significant reduction in the OOPE as
a result, and significant diversion of patients from private providers to HSCs.
In this section, we wish to highlight two critical issues in relation to the second
objective/question stated above: (a) how well are the VNHs able to cope with the work
at HSCs and how does the community view their service; and (b) as the range of services
to be provided increases, we will have to revisit the “NORMS” being used, for establishing
new HSCs in pilot blocks and for deployment of additional VHNs / Health and Wellness
Workers?
We visualise that the next phase (over the next one year or so) of the UHC pilot, will
require time and efforts, and attention to these two issues.

44
Section 5.a
i) During the past six to eight months, there are also clear positive signs of adaptation of
VHNs to the local community. This is extremely important to emphasize this aspect of the
UHC pilot.
Several members of the communities we met in all three blocks uniformly remarked thus:
“We are very happy to see this HSC now functioning everyday…For many years, until a
few months ago, these [HSCs] were open once a week at best and that too for a few hours
only…”
Community interaction
–Samanapalli HSC
Shoolagiri block
Community interaction
–Nallaganakothapalli HSC
Shoolagiri block

45
Some other remarked:
“The land for this HSC was donated by my grandfather more than 20 years ago. The
building was built with efforts contributed by the members of the village, but I had not
seen this open for more than 10 years now….Now under the UHC pilot, we see this open
every day from morning till evening …”
ii) Some made very positive comments on the VHNs’ dedication to work”:
“Our VHN stays in the quarter’s provided in the facility and she is always accessible even
during evening hours, after 5 o’clock…We are proud to have her and we shall look after
her as our daughter…”
Left to Right in Picture BMO Dr.Archana, Local resident, Prof. Muraleedharan, Local resident, Asha worker, VHN-1 and VHN-2
-Hoshahalli HSC Shoolagiri Block
–Amuthakondapalli HSC
Shoolagiri block

46
iii) Several VHNs have expressed their satisfaction with the nature of their work and with
the support they receive from the local people. As one VHN put it:
“I am quite happy with our local people…They often drop by to enquire about my well-
being and even offer food for lunch and tea and snacks during afternoon sessions…”
This we noticed in several of villages particularly during our visits pilot blocks during
November-December 2017.
iv)What we observed is an increase in the confidence level of the VHNs in their ability to
examine patients, deliver care and refer them to PHC for additional care and follow up.
As one VHN said:
“I have now more confidence in myself...in my ability to examine and deliver drugs… Over
the past 6 months, I have learned how to respond to patients expectations, though it is a
bit difficult to convince them when they demand “injections”…”
v) The 2nd VHNs’ relationship with senior VHNs have become much stronger and they are
supportive of each other visibly in several facilities.
We have observed two features of this UHC pilot: Confidence of the VHNs delivering
primary care, and their relationship with local communities and senior VHNs.
The stronger this relationship is in the initial stages of UHC pilot, the stronger the
foundations, growth and impact of UHC will be in the long run. Needless to say, that there
are instances of strained relationships between them, which naturally would have
T.Nallur HSC
Viralimalai Block
47
affected effective delivery of services at HSCs. These are being addressed by respective
MOs, BMOs and higher level officials, sometimes even by officials at state level.
The over-arching observation is thus: given time, adequate support, nurturing and
training, the ability of VHNs to deliver services more than what they deliver now will get
enhanced significantly. This is already evident from the results shown so far: Over the
past six months, number of OPs covered have increased, proportion of repeat patients
have increased, number of NCDs and OG referred have increased, familiarity with UHC
APP improved vastly, number of APP entries have increased significantly, time spent for
OP care increased as a result of staying in HSC quarter’s. And, VHNs interactions with
community and senior VHNs have become more harmonious resulting in improved
quality of care. More importantly, permanency of employment have given them a sense
of security and stability in life. VHNs now are more willing to stay in staff quarters than
their say about two decades ago: the villages have much higher access to electricity,
water, other requirements for daily life, better roads and a larger number of people living
around the facility; what is more remarkable is the each one of them has a MOBILE
PHONE!! -- all together give them an enormous sense of security that their seniors did
not have two decades ago.
vi) Wherever ASHAs are present as in Shoolagiri and Veppur blocks, HSCs have shown
better consistency in their outputs.
vii) With the introduction of NCD staff member (who is drawn from the local SHGs), HSCs’
ability to cover a wider cross section of population will also increase. These NCD
members have already been put in place – since late November 2017 – and they were
seen uniformly in all pilot HSCs during our visit in Nov-December assisting respective
VHNs as part of their initial exposure to the UHC system.
The proposed model of Health and Wellness Centres (HWCs), which will replace the
Health Sub-Centres (HSCs) are expected to provide the following 12 services
1. Comprehensive Maternal Health care services to be provided in those sites
equipped to services as “delivery points”;
2. Comprehensive neonatal and infant health care services;
3. Comprehensive childhood and adolescent health care services;
4. Comprehensive contraceptive services;
5. Comprehensive reproductive services;
6. Comprehensive management of communicable diseases;
7. Screening and Comprehensive management of non-communicable diseases;
8. Basic ophthalmic care services;
9. Basic ENT care services;
10. Screening and basic management of mental health ailments;
11. Basic dental health care;
12. And Basic geriatric health care services;

48
The first seven of the 12 services are already being addressed by HSCs under the UHC
pilots in TN. Each one has a history, and therefore the quality and reach will vary
accordingly. But the efforts are visibly to include and enlarge the set of services. For
example, item 7 on NCD screening and management is one of the recent inclusion, as
described in Section 4.5. Not everything happens within the HSCs: one of the two VHNs
from each HSC, who does the out-reach functions, whom we refer to as the “mobile arm”
of the HSC, takes care of several aspects of the first seven services through their visits to
villages/anganwadies. The training modules for services (from 8 to 10 above) are ready;
the VHNs in the pilot blocks are expected to have their training on these modules over
the next 6 months; the modalities including duration of training for these modules for
various batches are being worked out (source: interviews with officials from NHM, TN).
Interviews with State level officials are working on the remaining two modules, namely
on basic dental and geriatric care.
Evidence of improvement in quality of these services is already shown in through the
interim survey of VHNs/HSCs and the fact that close to 35% of OP visits is accounted by
“repeat” patients – which is indicative of patients’ confidence in the service delivery
system.
Section 5.b
While they get trained in these additional services, and as they begin to consult patients
with a wider spectrum of ailments, we should ask “whether they are able to cope with the
increased patient load” and to what extent additional human resources (either in form of
VHNs and/or Staff Nurse) would be required to ensure no fall in the overall quality of
services delivered at HSCs?”
This UHC pilot should be the testing ground for revisiting the HR norms, not only at HSC
level but also at PHC and CHC levels. This is a unique opportunity to examine this issue.
The Need to revisit HR norms across primary care facilities (HSCs/PHCs/CHCs) is
evident, as illustrated by the experience gained thus far in building the network of HSCs
in pilot UHC blocks over the past 10 months. Consider the Populations and number of
habitations covered by HSCs in all three blocks. Take for example, Shoolagiri Block
(Figure 5.1)
i) As is evident from Figure 5.1, 15 of the 25 HSCs each cover more than 7000
population. Parandapalli and Odaiyanallur HSCs, each covers more than
10,000 persons.

49
Figure 5.1: Shoolagiri Block HSCs Village Population and number of villages covered under each
HSC:
Source: Respective HSCs/VHNs
This scenario is not very different in Viralimalai block as well. 15 of the 21 HSCs each have
at least crossed 6000 population and two of these (Mathrimpatti and Athipalam) have
also crossed 10,000 mark. (Refer Figure 5.2)
Figure 5.2: Viralimalai Block HSCs Village Population and number of villages covered under each
HSC
Source: Respective HSCs/VHNs
51
46
53
39
58
15
61
69
62
95
63
22
64
68
65
64
66
66
69
95
70
40
70
82
71
50
71
72
72
39
75
65
77
91
78
87
79
95
87
80
88
88
90
41
91
15 10
20
0
10
21
6
11 10 9
1214
9
1311
8 810
4
10
5
12
8
14
10
17
1214
12
9 10
20
0
5
10
15
20
25
0100020003000400050006000700080009000
1000011000
Gu
dis
ath
anap
alli
Ne
rika
m
Pan
nap
alli
A.C
het
tip
alli
Enu
son
ai
Do
rip
alli
Bu
kkas
agar
am
Ku
mb
alam
Am
uth
ako
nd
apal
li
Ath
imu
gam
Kam
and
ho
dd
i
Bee
rjep
alli
Ho
sah
alli
Ber
ikai
Hal
esee
bam
Uth
anap
alli
Sam
anap
alli
Nal
laga
nak
oth
apal
li
Kar
ub
ella
Mel
um
alai
Sim
ple
ther
adi
Kal
inga
vara
m
Mar
uth
and
apal
li
Per
and
apal
li
Od
dai
yan
nu
r
Nu
mb
er o
f vi
llage
s u
nd
er H
SC
Po
pu
lati
on
co
vera
ge u
nd
er H
SC
Shoolagiri Block HSCs Village Population
Population Coverage by HSC Number of Villages under HSC Village population Norm
47
35
48
62
51
56
54
97
56
75
58
86
60
36
60
85
61
89
64
96
65
52
65
79
65
95
66
41
67
30
68
03
68
39
81
20
93
68
10
14
0
10
42
5
13 16 20 1811 13
19 22 19
1018
25 28 23 22
1318
2215
22 22
0
10
20
30
40
50
60
0
2000
4000
6000
8000
10000
12000
Pal
and
amp
atty
Avo
or
Kal
amav
ur
Nam
bam
pat
ty
Per
amb
ur
Ne
erp
alan
i
T.N
allu
r
Vir
alu
r
Mel
apat
chak
ud
i
Aga
rap
atty
Raj
agir
i
Raj
alip
atty
Mar
uth
amp
atty
Akk
aln
ayak
kan
p…
Ko
du
mb
alu
r
Kal
kud
i
Then
kan
iyu
r
Bo
oth
aku
di
Mat
hu
r
Mat
hri
pat
ty
Ath
ipal
lam
Nu
mb
er o
f vi
llage
s u
nd
er H
SC
Po
pu
lati
on
co
vera
ge u
nd
er H
SC
Viralimalai Block HSCs Village Population
Population Coverage by HSC Number of Villages under HSC Village population Norm

50
While Veppur Block does not have any HSC covering above 8100 population, 12 of the
21 HSCs have cover more than 7000 population coverage.
The existing norm is that each HSC (in plain areas) will cover 5000 population.
ii) Figures 5.1 – 5.3 also show the number of habitations covered by each of the HSCs in
the pilot blocks. Viralimalai has the distinction of having a HSC (in Maruthampatty) with
as many as 28 habitations with a population of 6595. The HSC at Agarapatti has the lowest
number of habitations (10) with a population of 6496, very close to the HSCs at
Maruthampatty, which has the highest number of habitations!
Figure 5.3: Veppur Block HSCs Village Population and number of villages covered under each HSC
Source: Respective HSCs/VHNs.
iii) Besides population and number of habitations coverage, norms for establishing
HSCs should explicitly consider the distance between habitations and the HSCs to which
they are administratively assigned – that is the distance patients will have to travel to
reach HSCs/PHCs as well the distance VHN1 will have to travel for out-reach work.
Habitations in Viralimalai and Shoolagiri blocks are far and widespread. Given the low
frequency of buses plying between the place of residence of VHNs and these habitations,
the effective coverage becomes very low.
54
33
54
44
56
99
58
13
59
95
60
57
62
23
62
40
65
84
71
02
71
75
72
29
73
04
73
80
74
98
76
31
76
93
79
71
80
16
81
50
81
52
4 4 5 5 3 4 2 4 4 4 3 4 4 4 4 4 46
5 4 413579111315
0100020003000400050006000700080009000
Nu
mb
er o
f vi
llage
s u
nd
er H
SC
Po
pu
lati
on
co
vera
ge u
nd
er H
SC
Veppur Block HSCs Village Population
Population Coverage by HSC Number of Villages under HSC Village population Coverage for HSC- Norm

51
Consider the following two illustration:
Sikkalapalli village is 12.6 Kilometres from the nearest Melumalai HSC, in Shoolagiri
Block. As shown in Figure 5.4, it takes 23 minutes by a car to reach the HSC from this
village.
Figure 5.4: Distance between Sikkalapalli village and Melumalai HSC: Shoolagiri Block
Source: Google Maps
Consider the village Kongudupatti in Viralimalai block. The nearest HSC is in
Maruthampatti, which is about 13.5Km and it takes about 31 minutes by a car to reach
the HSC from this village!
Given the infrequent bus services between these villages and respective HSCs, it is
evident that the reach of these public facilities will be restricted to those who live close
by villages. Our results also support this point, as shown in Section 3.

52
Figure 5.4: Distance between Kongudupatti village and Maruthampatti HSC: Viralimalai Block
Source: Google Maps
The case for revisiting the HR norms is strong. This is borne out clearly in the UHC pilot
blocks, as shown above. But as the pilot UHC progresses, as the range of services
delivered expands, and as the overall quality needs to be maintained across the primary
care facilities (HSC-PHC-CHC), and the number of habitations to be covered remain the
same –– the case for revisiting HR norms becomes more compelling.
The next phase of UHC pilot will have to address HR norms at HSC level and above as we
move forward.

53
6. Concluding Remarks:
Both qualitative and quantitative “evidence” of UHC pilot in the three blocks leads us to
two sets of observations. They are:
I: Has UHC achieved what was expected? : YES, the tiny steps made so far, shows definite
signs of progress:
1. UHC pilot has brought about a ‘significant change” in improving access to primary
care at sub-centre level;
2. UHC pilot has brought about a dramatic fall in the overall dependence on private providers, particularly those seeking care from private hospitals;
3. UHC pilot has brought about a substantial fall in the out of pocket expenditure among those seeking OP care from both public and private providers – and
4. UHC pilot clearly shows the per capita public expenditure per OP visits falls significantly when provided at HSC level. Thus resulting in enormous savings for the government expenditure, when patients are diverted from PHC/CHC/GH to HSCs.
II. To what extent and how well UHC pilot covers the scope of the proposed component and services HWC of the GoI? : Evidence is positive … It is important to visualise the current state of UHC pilot as evolving into a much
integrated larger organic unit encompassing PHCs and CHCs, including a range of
services. Right now the seeds of UHC pilot are being sown at HSC level and they have
shown signs of capacity to grow and deliver.
With careful nurturing (by way of good training programmes) without hurrying the VHNs
to “perform” and “show” results, by allowing them to mature over time, along with careful
efforts to “integrate HSCs with PHC/CHC” as is already happening with the “hub and
spoke” model being used for laboratory tests (between PHCs and CHCs), and
complementary human resources, with strict enforcement of population norms (in order
that VHNs do not get overwhelmed with excessive load), the current VHN based UHC pilot
for providing comprehensive primary care services as envisaged by GoI through Health
and Wellness Centres (HWCs) , is likely to become a reality. There are clear signs of
commitment at all levels, bureaucratic and political. We need more time to pursue the
pilot and also to scale progressively. Access and financial burden on the poor for primary
care need immediate attention.
*** *** ***
54
Appendix-1
We thank the following persons for their assistance in carrying out the Household Surveys HS-1, and HS-2
Shoolagiri Block (Team from Institute of Vector Control and Zoonoses)
Abdul Khaer. M (Senior Entomologist), Dr. Jothy Basu. D. (Veterinary Assistant Surgeon), Thirumal Venkatesan. T (Senior Entomologist), Nirmala. V. (Principal ANM Training Centre), Marandahalli Krishnagiri District; Dr Sampath (BMO, Shoolagiri)
Health Inspector Trainees: Abusalia. I, Bhaskar. R, Jayabal. G, Immanuvel Rajkumar. M.R, Balasubramaniyam. A, Kumaravel. M, Radha Krishnan. T, Saravanan. P, Ekamaram. S, Natesan. K.S, Uma Shankar. S, Kaliyappan. E, Babu. M.V, Durai Raj. V, Udayakumar. S, Vadivel. K, Thirumal Selvam. K, Ramachandiran. L, Srinivasan. B, Thiyagamoorthi. N, Venkat Raman. M, Sivagurunathan. T, Sankar. D, Sanmugam. M, Sivarajan. M, Murugesan. D, Mathivanan. S, Malik. D, Saravanan. S, Kumar. M ; VHN Trainees: Saraswathi. S, Thenmozhi. S, Gunasundari. K, Venkateshwari. R, Anitha. S, Saritha. P, Banumathi. S, Suguna. S, Chitra. C, Devika. D, Rajalakshmi. M, Annajothy. K, Usharani. R, Indumathi. R, Selvi. A, Vinitha. L, Kanaga Lakshmi. M, Tamilselvi. A, Johnma. E, Sathiya. R
Veppur and Viralimalai Block Household Survey (May-August 2016)
Dr. Tamilmani (Viralimalai block BMO), Dr. Sesu (Veppur block BMO), Mr.Selvaraj (Health Inspector Viralimalai block) and Dr Elango (Block HI, Veppur), Dr. Aravind (Nodal MO-UHC, Veppur), Dr. K.Sultan (Nodal MO-UHC, Viralimalai block), Dr. S.R Ganesh (Nodal MO-UHC, Shoolagiri block)
Regional Training Institute – Thiruvarangulam.
Dr. Kalaivani. B, (Deputi Director of Health Service), Dr. Rajendiran.V, (Aranthargi Health Officer); Tutors: Praba.G, Jeyalakshmi. M, Anantha Parkavi. C, Rajam. T, Vasantha. R. (Principal In charge ANM Training School)
Multipurpose Female Health Workers from Department of Public Health-Regional Training Institute of Public Health at Thiruvarangulam (Pudukkottai)
First Batch MFHW: M. Chandrakala, S.R. Deepa, S.Jayasudhe, C.Jayabarathi, S.Jeevarani,
P.Kanimozhi, P.Kavitha, A.Kavitha, A.Lakshmi, K.Malliga, S.Mangaiyarkarasi, V.Nithyaa,
S.Parimala, P.Panchali, R.Punitha, R.Puspha, C.Rathinamani, T.Rajeswari, R.Rathiga,
N.Ruba, D.Ranjanadevi, S.Sasirekha, K.Senthamilselvi, P.Selvi, P.Selvi, B.Santhi,
S.Sellammal, K.Sudha, N.Thiravidachelvi, C.Umarani; Second Batch MFHW: S.Abirami,
D.Baby, P.Chandra, P.Chandra, C.Chithra, M.Chithra, M.Deepa, T.Durga Devi, V.Elaya
Rani, J.Jaya, S.Jayanthi, K.Kavitha, M.Kokila, R.Malarvizhi, S.Nalini, P.Rajakumari, S.Reeta,
A.V.Revathi, G.RevathY, D.Semmalar, J.Senthil Vadivu, S.Sudha, K.Sujatha, L.Umadevi,
K.Vimala

55
Appendix-2.1
Ailments of outpatient’s accessing PHC care from HSC located Village - Shoolagiri block (Source HS-2)
Ailment PHC/CHC Government Hospital
Private Clinic
Private Hospital
Informal Pharma
Fever* 78 14 26 61 0 2
Diabetes 6 0 0 8 0 2
Psychiatric & Neurological 4 0 3 0 0 1
EAR & Nose 1 2 1 3 0 1
Hypertension 4 0 0 3 0 0
Respiratory 10 1 7 6 1 7
Gastro 2 0 2 4 1 2
Skin 4 1 6 2 0 0
Skeletal 5 2 6 10 1 1
Urinary 1 1 0 11 0 1
Obstetric 3 3 1 2 0 0
HIV/AIDS 0 0 0 0 0 0
TB 0 0 0 1 0 0
Injury 3 3 3 9 0 1
Others
11 1 7 9 1 0
132 30 62 129 4 18
*includes malaria, typhoid

56
Appendix-2.2
Ailments of outpatient’s accessing PHC care from HSC located Village - Viralimalai block (Source HS-2)
Ailment PHC/CHC Government Hospital
Private Clinic
Private Hospital
Informal Pharma
Fever* 51 62 11 49 0 0
Diabetes 16 6 0 15 0 0
Psychiatric & Neurological 6 4 4 6 0 0
EAR & Nose 0 2 0 1 0 0
Hypertension 9 7 1 7 0 2
Respiratory 21 8 2 4 0 4
Gastro 3 7 1 4 2 1
Skin 1 1 0 6 0 0
Skeletal 6 7 3 9 2 1
Urinary 0 0 0 1 0 0
Obstetric 0 2 0 1 0 0
HIV/AIDS 0 2 0 0 0 0
TB 0 0 0 0 0 0
Injury 3 4 0 5 0 0
Others 2 3 1 5 0 0
118 115 23 113 4 8
*includes malaria, typhoid

57
Appendix-2.3
Ailments of outpatient’s accessing PHC care from HSC located Village - Veppur block (Source HS-2)
Ailment PHC/CHC Government Hospital
Private Clinic
Private Hospital
Informal Pharma
Fever* 19 61 15 49 0 5
Diabetes 8 0 0 7 0 0
Psychiatric & Neurological 8 0 1 5 0 0
EAR & Nose 0 1 0 1 0 0
Hypertension 2 8 0 5 0 0
Respiratory 6 11 0 11 0 4
Gastro 2 4 0 9 0 0
Skin 0 2 0 3 0 0
Skeletal 8 13 0 10 0 3
Urinary 0 0 0 1 0 0
Obstetric 0 0 0 0 0 0
HIV/AIDS 0 0 0 0 0 0
TB 0 0 0 0 0 0
Injury 0 3 0 3 0 0
Others 7 1 1 3 0 0
60 126 17 107 0 12
*includes malaria, typhoid

58
Appendix –3.1
Table: Awareness of pilot-UHC-HSCs in Shoolagiri block from HS-2: Village wise [The
stared villages have pilot-HSCs located]
Village Surveyed HH
Aware
about
HSC
Total HH
Surveyed
% of HH
aware
Village wise,
distribution of
sampled patients
utilizing pilot HSCs
HS-2
Enu sonai* 39 40 97.5% 8
Maruthanda Palli* 38 40 95.0% 57
Ayarana Palli* 36 40 90.0% 10
Nalla Gana Kotha Palli* 36 40 90.0% 42
Ulagam 33 40 82.5% 2
Panna Palli* 31 40 77.5% 10
Kaman Thotti* 30 40 75.0% 14
Melumalai* 29 40 72.5% 24
Bukka Sagaram* 28 40 70.0% 11
Midithe Palli 22 40 55.0% 2
Berigai* 21 40 52.5% 7
Balagondarayana Durgam 19 40 47.5% 9
Beer Palli 16 40 40.0% 5
Maranda Palli 16 40 40.0% 1
Chenna Palli 15 40 37.5% 3
Adda Kurukki 12 40 30.0% 0
Moornapalli 12 40 30.0% 2
Kattu Naicken Thotti 11 40 27.5% 3
Petha sigara Palli 11 40 27.5% 0
Eluva Palli 7 40 17.5% 0
Hale Kotta 7 40 17.5% 8
Kurubarapalli 7 40 17.5% 1
Thyagarasana Palli 7 40 17.5% 3
Shoolagiri 5 40 12.5% 0
Venkatesh Puram 4 40 10.0% 0
Total 492 1000 49.2% 222
*HSC Located Village

59
Appendix 3.2
Table: Awareness of pilot-UHC-HSCs in Viralimalai block from HS-2: Village wise [The
stared villages have pilot-HSCs located]
Village Surveyed HH Aware
about
Pilot HSC
Total HH
Surveyed
% of HH
aware
Village wise,
distribution of
sampled patients
utilizing pilot HSCs
Thengaithinnipatti * 40 40 100.0% 1
Palandampatti * 40 40 100.0% 9
Melapachakudi 39 40 97.5% 25
Kalkudi * 38 40 95.0% 43
Rajagiri * 38 40 95.0% 25
Kodumbalur * 38 40 95.0% 1
Nambampatty * 38 40 95.0% 24
Neerpalani * 38 40 95.0% 4
Buthakudi * 37 40 92.5% 21
Viralur * 36 40 90.0% 24
Kalamavur * 35 40 87.5% 18
Mathur* 27 40 67.5% 23
Kathalur 25 40 62.5% 6
Thennampaddy 25 40 62.5% 1
Poyyamani 23 40 57.5% 5
Sengalagudi 21 40 52.5% 0
Viruthapatti 18 40 45.0% 0
Meenaveli 10 40 25.0% 1
Viralimalai 5 40 12.5% 0
Poruvai 5 40 12.5% 0
Sooriyur 5 40 12.5% 6
Theenthiryanpatty 4 40 10.0% 1
Melabuthakudi 3 40 7.5% 1
Singatha 0 40 0.0% 0
Mandaiyur 0 40 0.0% 0
Total 588 1000 58.8% 239
*HSC Located Village

60
Appendix 3.3
Table: Awareness of pilot-UHC-HSCs in Veppur block from HS-2: Village wise [The stared
villages have pilot-HSCs located]
Village Surveyed HH Aware
about Pilot
HSC
Total HH
Surveyed
% of HH
aware
Village wise,
distribution of
sampled
patients utilizing
pilot HSCs
Sirukudal * 40 40 100.0% 34
Thungapuram south * 39 40 97.5% 23
Sithali(Keelapuliyur South) 38 40 95.0% 25
Elumoor west * 38 40 95.0% 11
Olaipaadi * 38 40 95.0% 25
Vadakalur * 36 40 90.0% 29
Keelaperambalur * 36 40 90.0% 31
Thirumandurai * 34 40 85.0% 9
Paravaai * 33 40 82.5% 38
Vayalapaadi * 24 40 60.0% 13
Kilumathur 19 40 47.5% 1
Malavarayanallur 18 40 45.0% 8
Elumoor East (aayakaadu) 15 40 37.5% 7
Milaganatham 15 40 37.5% 11
Nannai 15 40 37.5% 1
Perimapalayalam 10 40 25.0% 1
Vasistapuram 10 40 25.0% 3
Keelapuliyur 8 40 20.0% 5
Thungapuram north 8 40 20.0% 3
Assur 7 40 17.5% 1
Opium 7 40 17.5% 2
Maruvathur (Perali South) 3 40 7.5% 0
Varagur 2 40 5.0% 0
Kolapaadi 1 40 2.5% 0
Pennakonam 0 40 0.0% 0
Total 494 1000 49.4% 281
*HSC Located Village

61
Appendix- 4.1
Switch of NCD patient’s facility wise from HS-1 vs HS-2:
Shoolagiri Block (N=32) Viralimalai Block (N=29) Veppur Block (N=28) HS-1 Survey
Provider HS-2 Survey
Provider HS-1 Survey
Provider HS-2 Survey
Provider HS-1 Survey
Provider HS-2 Survey
Provider CHC HSC CHC HSC CHC HSC CHC Pharma CHC PHC PHC HSC CHC Pharma CHC PVT Hosp. PHC HSC CHC PHC CHC Public Hosp. PHC PHC CHC PVT Clinic CHC Public Hosp. PHC PHC CHC PVT Hosp. PHC PHC PHC PHC PHC Pharma PHC PHC PHC PHC PHC PHC PHC PHC PHC Public Hosp. PHC PHC PHC PHC PHC Public Hosp. PHC PHC PHC PHC PVT Clinic CHC PHC PHC PHC Public Hosp. PVT Hosp. CHC PHC PHC PHC Public Hosp. PVT Hosp. CHC PHC PHC PVT Clinic PVT Clinic PVT Hosp. CHC PHC PHC PVT Hosp. HSC PVT Hosp. CHC PHC PVT Hosp. PVT Hosp. HSC PVT Hosp. CHC PVT Clinic HSC PVT Hosp. PVT Clinic PVT Hosp. HSC PVT Clinic HSC PVT Hosp. PVT Clinic PVT Hosp. HSC PVT Clinic PHC PVT Hosp. PVT Hosp. PVT Hosp. PHC PVT Clinic PVT Hosp. PVT Hosp. PVT Hosp. PVT Hosp. PHC PVT Hosp. HSC PVT Hosp. PVT Hosp. PVT Hosp. PVT Hosp. PVT Hosp. Informal PVT Hosp. PVT Hosp. PVT Hosp. PVT Hosp. PVT Hosp. Pharma PVT Hosp. PVT Hosp. PVT Hosp. PVT Hosp. PVT Hosp. Pharma PVT Hosp. PVT Hosp. PVT Hosp. Public Hosp. PVT Hosp. Pharma PVT Hosp. Public Hosp. PVT Hosp. Public Hosp. PVT Hosp. PHC Public Hosp. HSC Public Hosp. Informal PVT Hosp. PHC Public Hosp. PHC Public Hosp. PHC PVT Hosp. PHC Public Hosp. PHC Public Hosp. PVT Hosp. PVT Hosp. PVT Clinic Public Hosp. Public Hosp. Public Hosp. Public Hosp. PVT Hosp. PVT Clinic Public Hosp. Public Hosp. PVT Hosp. PVT Clinic PVT Hosp. PVT Hosp. PVT Hosp. PVT Hosp.

62
Appendix- 4.2 List of regular drugs dispensed at HSCs by VHNs:
Name of Drugs
Albendazole Suspension IP - 400mg/10ml IFA
Albendazole Tab IP - 400mg Ibuprofen Tab IP - 200mg
Aluminium Hydroxide Tab NFI Iron and Folic Acid Syrup IP
Amlodipine Tab IP - 5mg Methyldopa Tab IP - 250mg
Amoxycillin Cap IP - 250mg Metoprolol Succinate Extended Release
Ampicillin Inj IP - 500mg (IM/IV Use) Metronidazole Tab IP - 200mg
Ascorbic Acid Tab IP - 100mg Multivitamin Tab NFI Formula
Calcium (Elemental) Caps Norfloxacin Tab IP - 400mg
Carbamazepine Tab IP - 200mg ORS Powder IP
Cephalexine Cap IP - 250mg Omeprazole Cap IP - 20mg
Ciproflaxacin Tab IP - 500mg Paracetamol Inj - 150mg/ml
Clotrimozole Cream IP - 2% W/W Paracetamol Syrup IP
Co-Trimoxazole Oral Suspension IP Paracetamol Tab IP - 500mg
Co-Trimoxazole Tab IP Pheniramine Maleate Inj IP - 22.75mg/ml
Compound Benzoic Acid Ointment IP Phenoxy Methyl Penicillin Potassium T..
Dexamethasone Tab IP - 0.5mg Phenytoin Sodium Tab IP - 100mg
Diazepam Tab IP - 5mg Povidone Iodine Ointment USP - 5% W/w
Diclofenac Gel BP Povidone Iodine Solution IP - 5% W/V
Diclofenac Sodium Tab IP - 50mg Promethazine Syrup IP
Dicyclomine Hcl Tab IP - 10mg Ranitidine Hcl Tab IP - 150mg
Domperidone Tab IP - 10mg Salbutamol Sulphate Tab IP - 4mg
Doxycycline Cap IP - 100mg Silver Sulphadiazine Cream IP - 1% W/W
Enalapril Maleate Tab IP - 5mg Tetanus Toxoid (Adsorbed) Inj IP
Flucanazole Tab IP - 150mg Vitamin A Tab
Folic Acid Tab IP - 5mg Vitamin B Complex Tab NFI
Gentamycine Eye Drops IP - 0.3% W/V Zinc Tab BP

63
Appendix– 5
Table: Shoolagiri block Infrastructure and HR position: Pre-UHC (2016) vs Post UHC
(Dec.2017).
Pre UHC - As of March 2016 Post UHC - As of December
2017
Number
required
Number
Available
Number
required
Number
Available
HR
Status
1st VHN 25 15 25 25
2nd VHN
(Posted under
UHC
Implementation)
NA NA 25 25
Asha Worker NA 16 NA 34
Building
Type
Government
Building
25
16
25
17
Rented Building 9 6
Pudhu Valvu
Thittam
- 1
Agricultural
Building
- 1
Electricity 25 10 25 25
Running water supply 25 5 25 23*
Toilet Facility 25 6 25 23*
*Beerjepalli and A.Chettipalli HSC (Rented Building)

64
Appendix -6
Table: Viralimalai block Infrastructure and HR position: Pre-UHC (2016) vs Post UHC
(Dec.2017).
Pre UHC - As of March 2016 Post UHC - As of December 2017
Number
required
Number
Available
Number
required
Number
Available
HR
Status
1st VHN 21 21 21
2nd VHN
(Posted under
UHC
Implementation)
NA NA 21 21
Asha Worker NA - NA -
Building
Type
Government
Building
21
21
21
20
Rented Building 0 0
Pudhu Valvu Thittam 0 1
Electricity 21 20 21 21
Running water supply 21 13 21 20
Toilet Facility 21 20 21 21

65
Appendix -7
Table: Veppur block Infrastructure and HR position: Pre-UHC (2016) vs Post UHC
(Dec.2017).
Pre UHC - As of March 2016 Post UHC - As of December 2017
Number
required
Number
Available
Number
required
Number
Available
HR
Status
1st VHN 21 15 21 20
(1 on
suspension)
2nd VHN
(Posted under
UHC
Implementation)
NA NA 21 16 on regular
5 on contract
Asha Worker NA - NA 12
Building
Type
Government Building
21
17
21
17
Rented Building 4 1
Pudhu Valvu Thittam - 3
Electricity 21 16 21 19
Running water supply 21 16 21 17
Toilet Facility 21 16 21 17