universality in the ac conductance of keratinized tissues · universality in the ac conductance of...
TRANSCRIPT
Universality in the AC Conductanceof Keratinized Tissues
UNIVERSITY OF OSLO
MASTER THESIS BY
SISAY MEBRE ABIE
Submitted to Department of Physics
November 14, 2014

I
Universality in the AC Conductance ofKeratinized Tissues
Master Thesis by
Sisay Mebre Abie
Submitted to Department of Physics.
November 14, 2014
Abstract
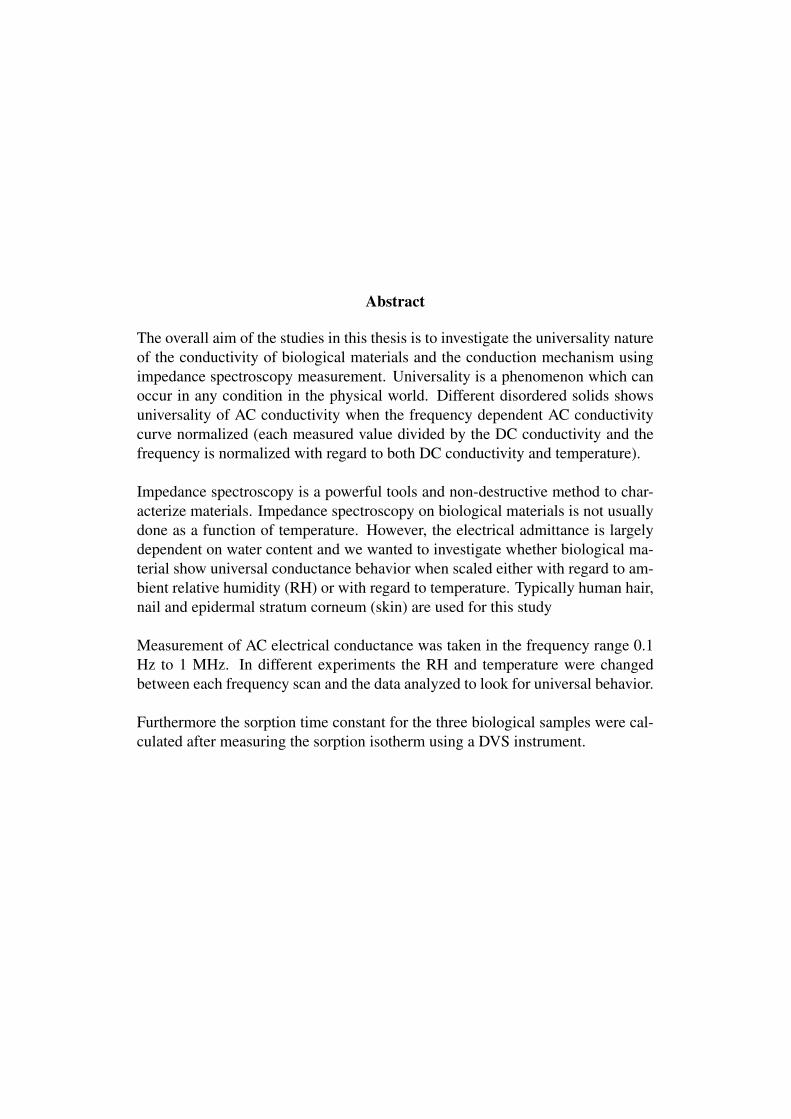
The overall aim of the studies in this thesis is to investigate the universality natureof the conductivity of biological materials and the conduction mechanism usingimpedance spectroscopy measurement. Universality is a phenomenon which canoccur in any condition in the physical world. Different disordered solids showsuniversality of AC conductivity when the frequency dependent AC conductivitycurve normalized (each measured value divided by the DC conductivity and thefrequency is normalized with regard to both DC conductivity and temperature).
Impedance spectroscopy is a powerful tools and non-destructive method to char-acterize materials. Impedance spectroscopy on biological materials is not usuallydone as a function of temperature. However, the electrical admittance is largelydependent on water content and we wanted to investigate whether biological ma-terial show universal conductance behavior when scaled either with regard to am-bient relative humidity (RH) or with regard to temperature. Typically human hair,nail and epidermal stratum corneum (skin) are used for this study
Measurement of AC electrical conductance was taken in the frequency range 0.1Hz to 1 MHz. In different experiments the RH and temperature were changedbetween each frequency scan and the data analyzed to look for universal behavior.
Furthermore the sorption time constant for the three biological samples were cal-culated after measuring the sorption isotherm using a DVS instrument.
Contents
1 Introduction 11.1 Motivation . . . . . . . . . . . . . . . . . . . . . . . . . . . . . . 11.2 Goal . . . . . . . . . . . . . . . . . . . . . . . . . . . . . . . . . 21.3 Thesis Structure . . . . . . . . . . . . . . . . . . . . . . . . . . . 2
2 Background and Literature Review 32.1 The Dielectric Properties of Keratinized Tissue . . . . . . . . . . 3
2.1.1 Skin . . . . . . . . . . . . . . . . . . . . . . . . . . . . . 72.1.2 Hair . . . . . . . . . . . . . . . . . . . . . . . . . . . . . 92.1.3 Nail . . . . . . . . . . . . . . . . . . . . . . . . . . . . . 10
2.2 Conductivity . . . . . . . . . . . . . . . . . . . . . . . . . . . . . 112.2.1 Temperature and frequency dependence of conductivity . . 132.2.2 Dielectric relaxation phenomena in complex materials . . 162.2.3 Conductivity of biomaterials . . . . . . . . . . . . . . . . 182.2.4 Effect of water in electrical properties of keratinized tissue 19
2.3 Scaling and universality . . . . . . . . . . . . . . . . . . . . . . . 192.3.1 Cause of Universality . . . . . . . . . . . . . . . . . . . . 21
3 Instrumentation And Measurement Procedure 263.1 Sample Preparation . . . . . . . . . . . . . . . . . . . . . . . . . 263.2 Impedance Spectroscopy . . . . . . . . . . . . . . . . . . . . . . 26
3.2.1 Bode plot . . . . . . . . . . . . . . . . . . . . . . . . . . 293.2.2 Nyquist plot . . . . . . . . . . . . . . . . . . . . . . . . . 30
3.3 CTS-Temperature Test . . . . . . . . . . . . . . . . . . . . . . . 313.4 Dynamic Vapor Sorption (DVS) . . . . . . . . . . . . . . . . . . 313.5 Measurement and Procedure . . . . . . . . . . . . . . . . . . . . 33
4 Results 354.1 Time Constant of Sorption of water in keratinized tissue . . . . . . 35
4.1.1 DVS Measurement of Stratum Corneum Sorption . . . . . 354.1.2 DVS Measurement of Nail And Hair Sorption . . . . . . . 36
4.2 Impedance of Keratins Tissue . . . . . . . . . . . . . . . . . . . . 37
I
CONTENTS
5 Analysis and Discussion 425.1 Time Constant of Sorption of water in keratinized tissue . . . . . . 42
5.1.1 Time Constant of Stratum Corneum Sorption . . . . . . . 425.1.2 Time Constant of Nail And Hair Sorption . . . . . . . . . 43
5.2 Impedance of Keratins Tissue . . . . . . . . . . . . . . . . . . . . 465.3 Conductance of Keratins Tissue . . . . . . . . . . . . . . . . . . . 465.4 AC Conductance Universality In Keratins Tissue . . . . . . . . . . 49
5.4.1 AC Conductivity Scaling Result of Hair . . . . . . . . . . 505.4.2 AC Conductance Scaling Result of Nail . . . . . . . . . . 515.4.3 AC Conductance Scaling Result of SC . . . . . . . . . . 52
5.5 General Discussion . . . . . . . . . . . . . . . . . . . . . . . . . 54
6 Conclusion 586.1 Conclusion . . . . . . . . . . . . . . . . . . . . . . . . . . . . . 586.2 Future Work . . . . . . . . . . . . . . . . . . . . . . . . . . . . . 59
II
List of Figures
2.1 Dispersion of Biological Tissues . . . . . . . . . . . . . . . . . . 72.2 Skin Structure . . . . . . . . . . . . . . . . . . . . . . . . . . . . 92.3 Percolation Network . . . . . . . . . . . . . . . . . . . . . . . . 222.4 Resistor-capacitor circuits network . . . . . . . . . . . . . . . . . 23
3.1 Samples of the project . . . . . . . . . . . . . . . . . . . . . . . . 273.2 Solartron 1260 Impedance/Gain-Phase Analyzer . . . . . . . . . . 283.3 Wessel and Bode plot for Series RC circuit . . . . . . . . . . . . . 293.4 Wessel and Bode plot for Parallel RC circuit . . . . . . . . . . . . 303.5 CTS-temperature test chamber . . . . . . . . . . . . . . . . . . . 323.6 Schematic diagram of dynamic vapor sorption (DVS) . . . . . . . 33
4.1 Skin DVS Measurement of Absorption . . . . . . . . . . . . . . . 364.2 Hair DVS Measurement . . . . . . . . . . . . . . . . . . . . . . 374.3 Nail DVS Measurement . . . . . . . . . . . . . . . . . . . . . . . 384.4 Hair Impedance Measurement at 25 0C . . . . . . . . . . . . . . . 394.5 Hair Impedance Measurement at 80% . . . . . . . . . . . . . . . 394.6 Skin Impedance Measurement at 25 0C . . . . . . . . . . . . . . 404.7 Skin Impedance Measurement at 80% . . . . . . . . . . . . . . . 404.8 Nail Impedance Measurement at 25 0C . . . . . . . . . . . . . . . 414.9 Nail Impedance Measurement at 80% . . . . . . . . . . . . . . . 41
5.1 Time Constant of Skin Absorption . . . . . . . . . . . . . . . . . 435.2 Time constant of hair and nail absorption . . . . . . . . . . . . . . 445.3 Time constant of hair and nail desorption . . . . . . . . . . . . . . 455.4 Hair Conductance at 25 0C . . . . . . . . . . . . . . . . . . . . . 475.5 Hair Conductance at 80% . . . . . . . . . . . . . . . . . . . . . 485.6 Nail Conductance at 25 0C . . . . . . . . . . . . . . . . . . . . . 495.7 Nail Conductance at 80% . . . . . . . . . . . . . . . . . . . . . . 505.8 Skin Conductance at 25 0C . . . . . . . . . . . . . . . . . . . . . 515.9 Skin Conductance at 80% . . . . . . . . . . . . . . . . . . . . . 525.10 Hair conductance scaling at different Temperature . . . . . . . . . 535.11 Hair conductance scaling at different RH . . . . . . . . . . . . . . 54
III
LIST OF FIGURES
5.12 Nail Scaled conductance result for different RH . . . . . . . . . . 555.13 Nail Scaled conductance result for different Temperature . . . . . 565.14 Skin Scaled conductance result for different RH . . . . . . . . . . 575.15 Skin Scaled conductance result for different Temperature . . . . . 57
IV

LIST OF FIGURES
Acknowledgements
This thesis work wouldn’t have succeeded without the help, support and encour-agement of my supervisor, teachers, & friends.
I am so thankful to my supervisor Ørjan Grøtten Martinsen and Joakim Berglifor their ideas, helpful discussions and encouragements. I can say that their sug-gestion and constructive criticism brought this paper to existence.
I express my warm thanks to Yuri Galperin for his helpful suggestion and discus-sions.
I would also like to use this opportunity to highly appreciate & extend my grat-itude to all physics department instructors & administration staff for their kindsupport, help & services I have been getting throughout my stay in the school.
I would also like to extend my gratitude to Gro Smistad and Espen Trondsen fortheir special support and advise during my experimental work
I am also grateful to my families and friends who have been with me throughoutmy study Especially, Habtamu Abie, Aweke Asmare, Aklilu Tilahun and AbrhamDegu, deserve my special appreciation & gratitude for their special support.
V
LIST OF FIGURES
Keywords: Impedance, Conductivity, Universality, Scaling (Normalization), Tem-perature, Relative Humidity .
Abbreviations:
• RH: Relative humidity
• SC: Stratum Corneum
• TEMP: Temperature.
• DVS: Dynamic Vapor Sorption
• AC, DC: Alternating Current, Direct Current
VI
Chapter 1
Introduction
1.1 MotivationUniversality and scaling are phenomena which can occur in any condition, type,shape and nature in the physical world. For various reasons in the past few years,the universality and the scaling behavior of the conductivity spectra have receivedmuch attention. The theoretical and experimental investigation reported in differ-ent scientific literature [1, 2, 3] indicate that different materials such as glasses,amorphous semiconductors, electron conducting polymers etc shows remarkablysimilar frequency dependence of the AC conductivity. This applies both to elec-tronic and ionic conduction. Typically, the curves showing the conductivity asa function of frequency overlap when the conductivity is normalized (each mea-sured value divided by the DC conductivity) and the frequency is normalized withregard to both DC conductivity and temperature. This phenomenon is commonlycalled universality.
The present thesis is an experimental investigation of whether biological materialshow universal conductance behavior when scaled either with regard to ambientrelative humidity (RH) or with regard to temperature.
The impedance Spectroscopy technique is a powerful tool and a non-destructivemethod that can be used to provide information regarding the physical, electricaland chemical properties of materials. Impedance spectroscopy on biological ma-terials is not usually done as a function of temperature. However, the electricaladmittance is largely dependent on water content.
AC electrical conductance was measured in the frequency range 0.1 Hz to 1 MHz.In different experiments the RH and temperature were changed between each fre-
1
1.2. GOAL
quency scan and the data were analyzed to look for universal behavior. Typicalbiological materials that were used are pieces of human hair, nail and epidermalstratum corneum (skin).
1.2 GoalThe main goal of this thesis is to determine the possible existence of the con-ductance universality nature in keratinized tissue using electrical impedance spec-troscopy measurement and normalization of the measurement result.
A secondary aim beyond the scope of this thesis is the implementation of functionsof the result to determine the electrical properties and the conduction mechanismsof keratinized tissue.
1.3 Thesis StructureThe structure of the thesis is as follows:
• Chapter-1: Introduces readers to the main aim and motivation of the project.In addition to this it provide the over all stracture of the thesis.
• Chapter-2: Provides background information about some of the existingdielectric theory which is related to this project. Furthermore it contains thedefinition of conductivity and the nature of conductivity in disordered andbiological materials and the universality and scaling concepts.
• Chapter-3: This chapter provides sample preparation and brief discussionabout basic instruments used in the project. Furthermore it provides proce-dural steps of the measurements of samples electric impedance.
• Chapter-4: Provides the dynamic vapor sorption (DVS) measurement re-sults and impedance measurement result of the samples
• Chapter-5: provides the data analysis of the sorption time constant of thethree samples, plus their impedance and conductivity data analysis includ-ing conductance normalized result and discussion.
• Chapter-6: Provides the possible conclusion of the results and recommen-dation for future work
2
Chapter 2
Background and LiteratureReview
This chapter focuses on general explanation of the theory of electric conductivityand dielectric nature of biological materials.
2.1 The Dielectric Properties of Keratinized Tis-sue
Based on their electrical nature materials including biological tissue, can be broadlyseparated into three categories: conducting, insulating and semiconductors. Inconductors, such as metals that are generally good electrical conductors, the elec-tric charges move freely in response to the application of an electric field. As thename indicates semiconductors are material which has electric conductivity be-tween that of conductor and insulator. In semiconductor the current conductionoccurs through the movement of free electrons and holes collectively known ascharge carriers. Whereas in an insulator (dielectric), the charges are fixed andnot free to move. Due to this, dielectrics are materials that are poor conductors ofelectricity. For more than a century the dielectric response of different materials ofsolids and liquids has been an active topic of research by different group or depart-ment, such as Chemists, Physicists and electrical engineers for various numbersof reasons. Chemists have been trying to obtain information about the molecularstructure, interaction and dynamics of the substances under study; Physicists havebeen looking for the fundamental processes existing in the materials, electricalengineers seeking for improved insulating materials.
Since every material has a unique set of electrical characteristics that are depen-dent on its dielectric properties, accurate measurements of these properties can
3
2.1. THE DIELECTRIC PROPERTIES OF KERATINIZED TISSUE
provide scientists and engineers with valuable information to properly integratethe material into its intended application for more solid and advanced design pa-rameters. For example, the loss of a cable insulator, the impedance of a substrate,or the frequency of a dielectric resonator can be related to its dielectric properties.
Furthermore the information that is obtained from dielectric properties measure-ment is also useful in different industrial applications like for improving absorbent,and packaging designs, microwave processing of food, rubber, plastic and ceram-ics.
Some of the important dielectric properties includes dielectric constant, dielec-tric loss, loss factor, power factors, AC conductivity , DC conductivity , electricalbreakdown strength and other equivalent or similar properties. The term dielec-tric usually refers to the variation of these properties with frequency, temperature,relative humidity, voltage and composition.
Living organisms conduct electric currents to some degree because they containdipoles as well as charges that can move, and also have dielectric properties [4, 5].For materials that are heterogeneous in structure, charges may become trapped atinterfaces. When the atoms or molecules of a dielectric are placed in an externalelectric field net migration of charge does not occur but the nuclei are pushed withthe field resulting in an increased positive charge on one side while the electronclouds are pulled against it resulting in an increased negative charge on the otherside. Therefore if we are interested on the electric field produced by this deformedmolecules, let us consider it as a two point chargesQ and−Q which are separatedby a distance d. Two such point charge are known as an electric dipole. Whenthe dielectric has huge array of electric dipole then the dielectric in such state issaid to be polarized and this process is known as polarization. The distorted atomshave electric dipole moments of
pi = Qidi (2.1)
where Qi is total charge of ith nuclei and di is a distance between the center ofnegative charge and nucleus.
If there are n dipoles per unit volume of the dielectric, the polarization P is
P = limV→0
(1
V
∑i=1
pi) = nαε0E = χε0E (2.2)
where n is the number of dipoles in dielectric’s of volume V , α is the palarizabil-ity and χ = nα is the dielectric susceptibility that depends on the temperature,
4
2.1. THE DIELECTRIC PROPERTIES OF KERATINIZED TISSUE
pressure, and composition of the material.
Susceptance is a macroscopic parameters and is interrelated with a microscopicalfactor called polarizability α(Cm
2
V) then P = nεE.
Polar molecules generally polarize more strongly than non-polar molecules. Innon-polar media there is a simple relationship between the polarization and themolecule structure, the Clausius- Mosotti equation [6].
εr − 1
εr + 1=nα
3ε0(2.3)
where ε0 is the relative permittivity (the macroscopic quantity) and n = NV
is thenumber density.
The validity of the Clausius-Mossotti equation found some limitation. This limita-tion was noticed when the large difference between the refractive index of visiblelight and the dielectric constant for for different compound and gasses observed.It can be extended to comprise the contribution from polar molecules. By usingLangevin’s calculations for the average orientation of permanent magnetic mo-ments in an external field to the electric case and accepting Lorentz’s approachfor the internal field Debye succeeded in deriving an extension of the Clausius-Mossotti equation which is given as
εr − 1
εr + 1=
4πNA(α2 +
µ203KT
)
Vm(2.4)
where Vm is the molar volume and NA is Avogadro constant, µ0 permanent dipolemoment the kT factor is due to the stastical distribution of polar molecules caus-ing the orientation polarization.
In the Debye equation the dielectric constant depends not only on the molecu-lar polarizability, but also on the permanent moment of the molecules. With theDebye equation the temperature dependence of the dielectric constant could beelucidated to a great extent, especially for low pressure gases, in addition to thisthe Debye equation offered the possibility of calculating molecular dipole mo-ments from measurements of the dielectric constant [7, 8].
The Debye and Clausius-Mossotti equation are in best agreement with gases butin less agreement with liquids and least with solid. Different authors includingOnsager, Van Arkel and Snoek [9, 10] made attempts to explain the deviation ofthe Debye equation in the case of polar liquids and tried to extend the theory.
5
2.1. THE DIELECTRIC PROPERTIES OF KERATINIZED TISSUE
Many of these authors assumed that the apparent dipole moment was lowered byassociation [6, 11].
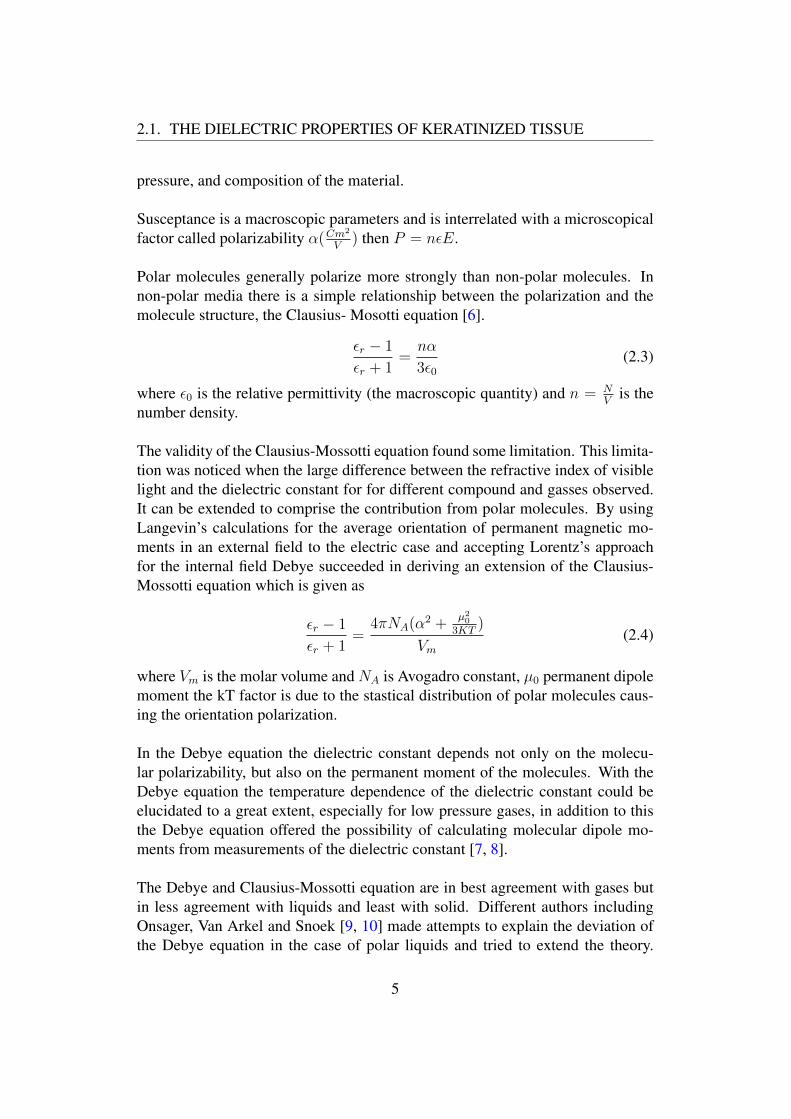
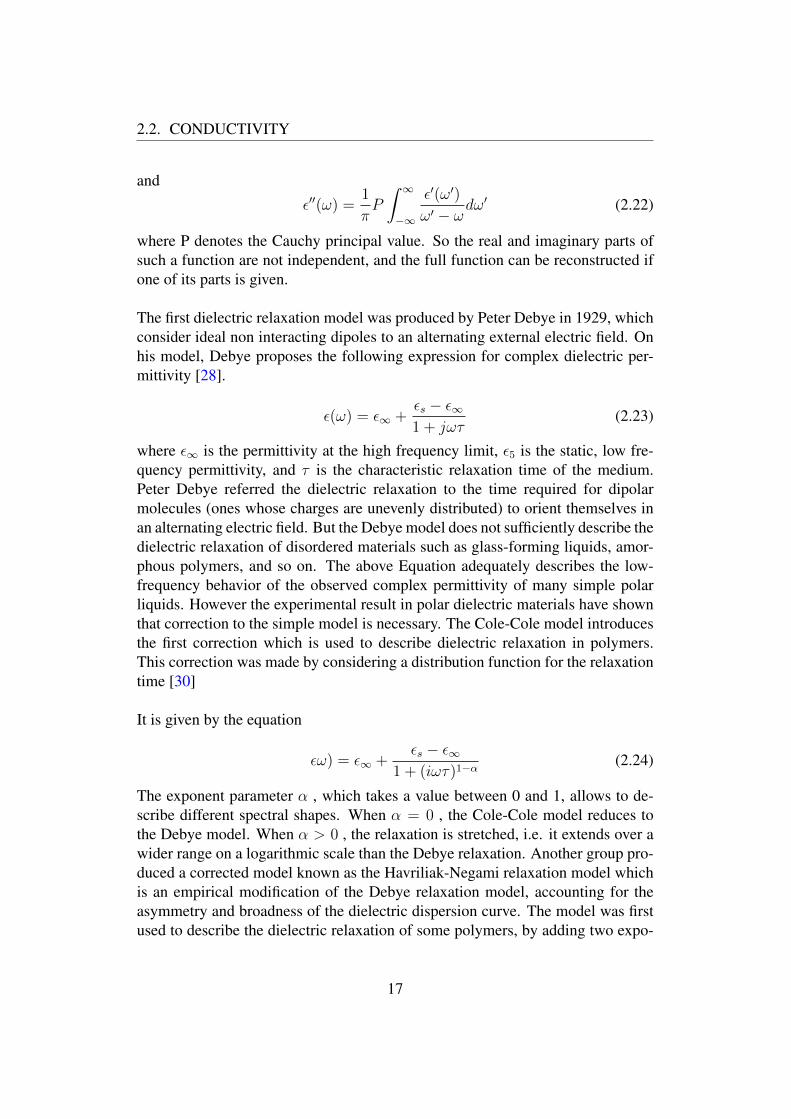
According to different studies reviewed in [6, 9, 10, 12], the dielectric propertiesof a biological tissue result from the interaction of an electromagnetic field withits constituents at the cellular and molecular level. The tissue has different re-sponse for different regions of the electromagnetic spectrum. In other words themeasurement of the dielectric properties of tissue is not only affected and com-plicated by tissue inhomogeneity, anisotropy, the physiological state of the tissue,and electrode polarization [13]. In addition to this the dielectric properties oftissues are highly frequency and temperature dependent [14]. The dielectric spec-trum of tissue consists of three main regions which is known as alpha, beta andgamma dispersion [4, 5, 15].
• Alpha dispersion: The alpha dispersion covers in low frequency of hertz tokilohertz range. This is associated with the relaxation of ions tangential tocharged membrane surface.
• Beta dispersion:The beta dispersion occurs in the intermediate frequencyrange which extended to 3-4 frequency decades centered in the hundredsof kilo hertz regions, and due to the polarization of the membranes and themacromolecules.
• Gamma dispersion : The gamma dispersion occurs in the gigahertz region,this dispersion arises mainly from the relaxation of free water within thetissues
As a dielectric material, biological tissue has the ability to store electromagneticenergy. This is accompanied by the displacement of positive and negative chargesunder the influence of applied electric field. The mechanism of charge displace-ment or polarizatation depends on the types of dielectric materials and the fre-quency of the applied field. There are different kinds of polarization and the totalpolarizability is given by
α = αe + αi + αd (2.5)
where αe is electronic, αi is ionic, and αd is dipolar (orientation) polarizabilities.
• Electronic polarization: Electronic polarization occurs due to the displace-ment of the negatively charged electron cloud relative to the positive nucleusof atoms in the external applied electric field. This displacement of chargesmakes one side of the atoms somewhat positive and the opposite side nega-tive that create a dipole in the atoms.
6
2.1. THE DIELECTRIC PROPERTIES OF KERATINIZED TISSUE
Figure 2.1: The schematic of the dispersion of biological tissues.
• Ionic polarization: Ionic polarization occurs in the materials which haveionic character of bonds. It then by definition has internal dipoles whichexactly cancel each and other are unable to rotate. The external field theninduces net dipoles by slightly displacing the ions from their resting posi-tion. A good model materials for this case simple ionic crystal like NaCl.
• Orientation polarization: Orientation polarization occurs in the materialswhich have molecules with their own dipole momentum which can rotatefreely. The external fields align these dipoles to some extent and thus inducea polarization of the materials. A good example for this case is water.
The electronic contribution is present in any type of substance, but the presenceof the other two terms depends on the material under consideration.
2.1.1 SkinMany therapeutic and diagnostic techniques rely upon the application of electricalfields or the measurement of electrical properties. or the interaction of the elec-tromagnetic radiation with the target tissue since skin is the interface of the bodywith environmental agents including electromagnetic fields; the knowledge of itsdielectric properties is of importance in the assessment of human exposure and
7
2.1. THE DIELECTRIC PROPERTIES OF KERATINIZED TISSUE
in numerous biomedical applications. There is also interest within the cosmet-ics industry to use the dielectric properties of skin as an indicator of the efficacyof dermatological and cosmetic treatments [16]. The skin is the largest organ ofthe body which protects us from microbes and the elements, helps regulate bodytemperature, and permits the sensations of touch, heat, and cold. Skin is a veryinteresting tissue because of its highly inhomogeneous structure, which thus leadsto inhomogeneous dielectric properties.
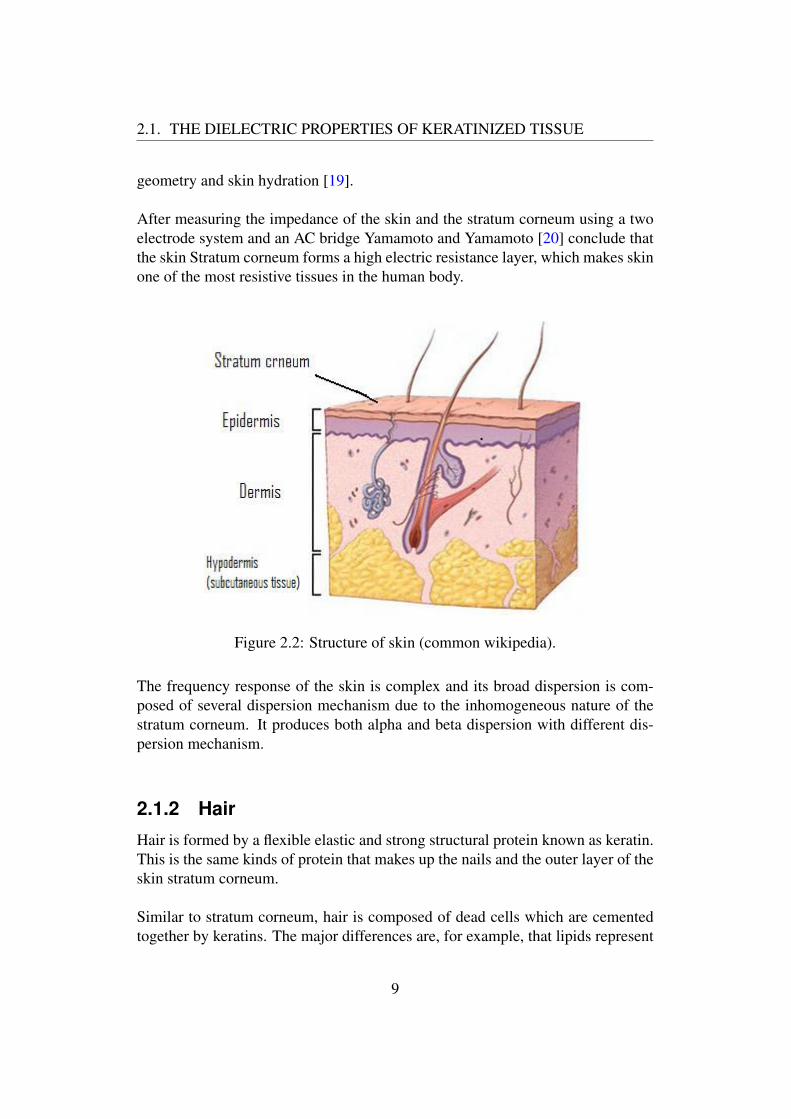
Skin has three layers:
• Epidermis: the outermost layer of skin, provides a waterproof barrier andcreates our skin tone. Its thickness varies in different types of skin. It is thethinnest on the eyelids at 0.005 mm and the thickest on the palms and solesat 1.5 mm [17]. It contains special cells called melanocytes which producethe pigment melanin that gives the skin colour. The epidermis containsdifferent layers, but the one that defines its dielectric properties the most isthe outermost layer, the stratum corneum. This layer is composed of dead,flat skin cells that shed about every two weeks.
• Dermis:Beneath the epidermis, contains tough connective tissue, hair folli-cles, and sweat glands.
• Hypodermis: The deeper subcutaneous tissue is made of fat, connectivetissue, larger blood vessels, and nerves
The stratum corneum is a solid state substance, not necessarily containing liq-uid water, but with moisture content dependent on the surrounding air humidity.Stratum corneum is not soluble in water, but the surface will be charged and adouble layer will be formed in the water side of the interphase. Stratum corneumcan absorb large amounts of water (e.g. doubling its weight). Stratum corneummay be considered as a solid state electrolyte, perhaps with few ions free to moveand contribute to DC conductance. The stratum corneum contains such organicsubstances as proteins and lipids, which may be highly charged but bound, andtherefore contributing only to AC admittance [6].
Human skin has high impedance to alternating current of low frequency. Thisimpedance is greatly dominated by stratum corneum at a frequency below 10 kHz[18].
The impedance of the skin at low frequency AC is influenced by different factorslike the way in which contact is made with the skin surface, electrode size and
8
2.1. THE DIELECTRIC PROPERTIES OF KERATINIZED TISSUE
geometry and skin hydration [19].
After measuring the impedance of the skin and the stratum corneum using a twoelectrode system and an AC bridge Yamamoto and Yamamoto [20] conclude thatthe skin Stratum corneum forms a high electric resistance layer, which makes skinone of the most resistive tissues in the human body.
Figure 2.2: Structure of skin (common wikipedia).
The frequency response of the skin is complex and its broad dispersion is com-posed of several dispersion mechanism due to the inhomogeneous nature of thestratum corneum. It produces both alpha and beta dispersion with different dis-persion mechanism.
2.1.2 HairHair is formed by a flexible elastic and strong structural protein known as keratin.This is the same kinds of protein that makes up the nails and the outer layer of theskin stratum corneum.
Similar to stratum corneum, hair is composed of dead cells which are cementedtogether by keratins. The major differences are, for example, that lipids represent
9
2.1. THE DIELECTRIC PROPERTIES OF KERATINIZED TISSUE
about 10 percent of the mass of the stratum corneum, but only 2% of the mass ofhair. Each strand of hair consists of three layers.
• Medulla: The innermost layer which is only present in large thick hairs.
• Cortex: The middle layer which provides strength and both the color andthe texture of hair.
• Cuticle: The outermost layer of hair. The cuticle is thin and colorless andserves as a protector of the cortex.
The hair grows from the papilla and with the exception of that point of generationis made up of dead, cornfield cells. It consists of a shaft that project above theskin, and a root that is embedded in the skin. The hair root is enclosed withina hair follicle. At the base of the hair follicle is the dermal papilla. The dermalpapilla is feed by the bloodstream which carries nourishment to produce new hair.The dermal papilla is a structure very important to hair growth because it containsreceptors for male hormones and androgens. Androgens regulate hair growth. Theelectrical conduction mechanisms are most probably similar in these materials andhair is therefore to some extent a proper model of pure stratum corneum.
2.1.3 NailNail is formed by a flexible elastic and strong structural protein known as keratin.This is the same kinds of protein that makes up the hair and the outer layer of theskin. But it is harder than stratum corneum which is due to the hard alpha karatinin the nail as opposed to the more soft beta karatin in the stratum corneum [6].
The fingernail acts as a protective plate and enhances sensation of the fingertip.The protection function of the fingernail is commonly known, but the sensationfunction is equally important. The fingertip has many nerve endings allowing us toreceive volumes of information about objects we touch. The nail acts as a counterforce to the fingertip providing even more sensory input when an object is touched.
Despite the natural position and its readily availability which makes it easy toperform electrical measurements on, the electrical admittance of human nail hasnot been extensively investigated. The electrical admittance of keratinized tissueis typically logarithmically dependent on water content or ambient RH, and theelectrical properties of nail resemble those of stratum corneum and hair [17, 21].
10
2.2. CONDUCTIVITY
2.2 ConductivityThe conductivity of the materials is usually thought of as the property which de-pends up on the ease with which electric charges can be transferred through thematerials by the application of electric fields. Of course electrical conductivity isproperties of a material that measure the ability of the material accommodates themovement of electric charges. It is the ratio of the current density to the electricfield strength. Its SI unit is Siemens per meter.
j = σE (2.6)
which is in the form of Ohm’s law.
According to Kittel [22] the magnitude of electrical conductivity is determined by
σ =nτe2
m(2.7)
where m is mass of electron, e is the electron charge.
1. The density of charge carriers per unit volume (n).
2. The charge carriers (the charge carriers will be electron, hole or ions) (e).
3. The average drift velocity of the carriers per unit electric field and the re-laxation time τ .
Furthermore the nature of the chemical bonding plays a virtual role in determin-ing the types of conductivity whether ionic or electronic [23], and this completelyindependently of any particular physical process, whether by "free" carriers as inmetals and crystalline semiconductors or by hopping transport polaronic (polaronis a quasiparticle which used in condensed matter physics to understand the inter-action between electrons and atoms in a solid material) etc.
The electrical conductivity can be measured in two forms as DC and AC conduc-tivity ( σdc and σac) respectively).
The DC conductivity provides only a quantitative measure of the materials, as-suming that there is single dynamic response characterizing the ionic conductor.Thus, DC conductivity provides less information of the entire dynamic behaviorof the sample. Whereas, AC conductivity can shed considerable light on the mi-croscopic nature of the ionic conducting process in the material.[24]
11
2.2. CONDUCTIVITY
Ac conductivity is the electrical conductivity in the presence of alternating currentfield. Unlike dc conductivity this conductivity depends upon the frequency of theAC field.
If there is an electric field E, the electrons acquire a drift velocity Vd then theequation of motion of the conduction electron is given by
m(dVddt
+Vdτ) = (−e)E (2.8)
where the second term proportional to the drift velocity represents the frictionalforce which plays a role in resisting the accelerated motion of the electron. whenthe steady state reached the dVd
dt = 0 as a result the above equation solved as
Vd =(−e)τEm
(2.9)
The current density is given by
j = (−Ne)Vd (2.10)
thus the current density can be rewrite as
j =(Ne2τ)E
m(2.11)
where (Ne) is the charge per unit volume. With in light of equation 2.9 to 2.11leads to the expression of DC conductivity as
σdc =N2e τ
me
(2.12)
Having this the expression AC conductivity is given as
σ =σ0
1− iωτ(2.13)
When we rationalize the above equation we will get
σ =σ0
1 + ω2τ 2+
iωω0τ
1 + ω2τ 2(2.14)
Hence conductivity is a complex quantity which can be rewritten as
σ = σ′ + iσ′′ (2.15)
12
2.2. CONDUCTIVITY
where σ′ is the real part which is given by
σ′ =σ0
1 + ω2τ 2(2.16)
And σ′′ the imaginary part which is given by
σ′′ = +iσ0ωτ
1 + ω2τ 2(2.17)
The fact is that the imaginary conductivity represents the ease of displacement ofelectric charge in a dielectric while its real part (i.e. the AC conductivity ) is thequantity to which the rate of heat development in the materials is proportional. Foraqueous biological materials, the conductivity arises mainly from the mobility ofhydrated ions and other processes.
2.2.1 Temperature and frequency dependence of con-ductivity
In crystalline solids crystal structure plays a key to the various electronic conduc-tion phenomenon’s in both metals and semiconductors. But, of course, not all thesolids are crystalline and not all the conductors are electronic.A metal has largeweakly temperature-dependent DC conductivity, a nonmetal has a much smallerDC conductivity which, however, increases strongly with increasing temperature[22]. Only for disordered nonmetals is AC conduction different from dc observedfar below phonon (crystal lattice vibration) frequencies. Any feasible electronicapplication of disordered material implies that the material can conduct an electriccurrent via some kind of charge-transport mechanism. In disordered solids suchas polymers and glass the conduction of mobile charges includes electron, holeand polaron hopping.
Here we can try to the discuss some of the charge carrier mechanisms in disor-dered materials. In the ordered crystalline semiconductors transport properties arebased on band theory with defined electronic energy structure consisting of energybands and energy gaps. But here in disordered materials transport properties aredetermined by the presence of localized electron states [25] and the electronicenergy spectrum of disordered materials can be treated as quasi-continuous. Theenergy levels related to the spatially localized states usually fill the energy spec-trum continuously [26]. Localized states can either play the role of traps termi-nating charge carrier transport via extended states or they can be used by chargecarriers in the so-called hopping transport mode, in which the carriers move via
13
2.2. CONDUCTIVITY
direct tunneling between the localized states.In disordered materials there existssome energy level that separates the extended states from the localized ones. Thisenergy level is called the mobility edge.
Since the density of states (DOS) defined as the concentration of states per unitenergy, per unit volume usually decreases when the energy moves away fromthe mobility edges towards the center of the mobility gap, the energy regions oflocalized states in the vicinity of the mobility edges are called band tails. Fur-thermore the temperature dependence of the electrical conductivity indicates thefundamental transport mechanisms of charge in disordered materials. Only at highenough temperature the electrical conductivity of disordered materials dominatedby the electron transport via delocalized states above the mobility edge, becauseat delocalized states an essential fraction of charge carriers fill these states. Withdecreasing temperature, the concentration of such electrons decreases exponen-tially and consequently their contribution to electrical conductivity diminishes.
Under such circumstances, tunneling transitions of electrons between localizedstates in the band tails dominate charge transport in disordered semiconductors.This transport regime is called hopping conduction [7, 27] since an incoherent se-quence of tunneling transitions of charge carriers resembles a series of their hopsbetween randomly distributed sites. Each site in this picture provides a spatiallylocalized electron state with some energy E.
According to numerous experimental studies disordered solids shows a similarbehavior in regard to their frequency and temperature dependent conductivity. Atypical frequency dependence of the conductivity spectrum shows three distin-guished region
1. Low frequency dispersion.
2. An intermidate frequency plateau.
3. In extended dispersion at high frequency
At low frequencies, one observes a constant conductivity while at higher fre-quencies the conductivity becomes strongly frequency dependent. In disorderedmaterials, hopping frequency and trapping phenomena are expected to have ma-jor influences on the electrical properties. The generality of this behavior formany widely different classes of materials was pointed out by Jonscher and hisco-workers [28].
14
2.2. CONDUCTIVITY
The AC conductivity of most disordered semiconductors depends on frequencyaccording to a power law. This power law has been observed in numerous materi-als at different temperatures in a wide frequency range [1, 2, 28]. And is expressedin the form of
σ(ω) = σdc+ Aωs (2.18)
where ,σ is the conductivity , ω is angular frequency and the pre factor A andthe frequency exponent (the power law exponent) s are both weakly dependent ontemperature and it is generally found that 0 ≤ s ≤ 1, tending to the limiting valueof unity at low temperatures. The first term σ0 is the low frequency (or D.C.)conductivity and found to be thermally activated with Arrhenius exponential lawequation (Arrhenius equation is a formula used to describe thermally-induced pro-cesses/reactions such as temperature variation of diffusion coefficients, populationof crystal vacancies, creep rates).
σdc = σo exp[−(EAkT
)β] (2.19)
where the pre-exponential factor σdc depends on the underlying system and thepower exponent β depends on the material and also sometimes on the temperaturerange in which the conductivity is studied; EA is the activation energy and k isthe Boltzmann constant It has been observed this type of behavior in many othermaterials including polar polymers and ionic conductors.
A vast collection of experimental study and modeling indicates that there are sev-eral kinds of charge transport or charge carrier mechanisms which are usuallycharacterized by carrier drift mobility and its dependence on the applied electricfield, temperature, frequency and other relevant parameters [7, 25] .
These frequency and temperature dependent conduction mechanisms are in com-mon in disordered solids. As mentioned above in the high frequency region, theconductivity increase with frequency. The frequency dependence of the conduc-tivity or so called universal dynamic response(UDR) of ionic conductivity is re-lated by a simple expression given by Jonscher’s Powar Law [2] shown in theabove equation.
According to different scholars [1, 3] the power-law description is slightly inac-curate, because the exponent must generally increase somewhat with frequencyin order to fit with experimental data. A more general approach is to consider
15
2.2. CONDUCTIVITY
the scaling formalism associated with the time-temperature superposition (TTS)principle [3].
2.2.2 Dielectric relaxation phenomena in complex mate-rials
According to Yuri Feldman [29] complex material is a very broad and generalclass of materials, which include associated liquids, polymers, biomolecules, col-loids, porous materials, composites ferroelectrics and liquid crystals. The valuableinformation about the structure of the material and its dielectric behavior for fun-damental studies as well as for technological applications can be obtained throughobserving the dynamic response under time-varying electric field. To measurethe dynamic response [8], we can use either the time domain approach or thefrequency-domain approach. These two approaches are equally powerful meth-ods for studying dielectric phenomena. In fact the two approaches are Fouriertransforms of one another [28]. In the time-domain approach, we measure thetime dependent polarization immediately after the application of a step-functionelectric field, or measure the decay of the polarization from an initial steady statevalue to zero after the sudden removal of an initial polarizing field. This decayis generally referred to as dielectric relaxation. One of the most attractive as-pects in the dielectric response of compex materials is the dielectric relaxationphenomenon, which can show the direct connection that often exists between thedipolar species and the charge carriers in the materials. Different researchers pro-duced various model of permittivity for different materials and most of these pro-duced models typically fit the complex dielectric permittivity data according to arelaxation theoretical model. The complex permittivity ε of a medium as a func-tion of the field’s frequency ω can be expressed as [28].
ε(ω) = ε′(ω)− iε′′(ω) (2.20)
where ω is the angular frequency, ε′ is the real component, which is in phase withthe applied electric field, ε′′ is the imaginary component, which is in quadraturewith the applied field. Both the real and imaginary componets of the complexdielectric permittivity are related each other by the Kramers-Krong relation asshown below.
ε′(ω) =1
πP
∫ ∞−∞
ε′′(ω′)
ω′ − ωdω′ (2.21)
16
2.2. CONDUCTIVITY
and
ε′′(ω) =1
πP
∫ ∞−∞
ε′(ω′)
ω′ − ωdω′ (2.22)
where P denotes the Cauchy principal value. So the real and imaginary parts ofsuch a function are not independent, and the full function can be reconstructed ifone of its parts is given.
The first dielectric relaxation model was produced by Peter Debye in 1929, whichconsider ideal non interacting dipoles to an alternating external electric field. Onhis model, Debye proposes the following expression for complex dielectric per-mittivity [28].
ε(ω) = ε∞ +εs − ε∞1 + jωτ
(2.23)
where ε∞ is the permittivity at the high frequency limit, ε5 is the static, low fre-quency permittivity, and τ is the characteristic relaxation time of the medium.Peter Debye referred the dielectric relaxation to the time required for dipolarmolecules (ones whose charges are unevenly distributed) to orient themselves inan alternating electric field. But the Debye model does not sufficiently describe thedielectric relaxation of disordered materials such as glass-forming liquids, amor-phous polymers, and so on. The above Equation adequately describes the low-frequency behavior of the observed complex permittivity of many simple polarliquids. However the experimental result in polar dielectric materials have shownthat correction to the simple model is necessary. The Cole-Cole model introducesthe first correction which is used to describe dielectric relaxation in polymers.This correction was made by considering a distribution function for the relaxationtime [30]
It is given by the equation
εω) = ε∞ +εs − ε∞
1 + (iωτ)1−α(2.24)
The exponent parameter α , which takes a value between 0 and 1, allows to de-scribe different spectral shapes. When α = 0 , the Cole-Cole model reduces tothe Debye model. When α > 0 , the relaxation is stretched, i.e. it extends over awider range on a logarithmic scale than the Debye relaxation. Another group pro-duced a corrected model known as the Havriliak-Negami relaxation model whichis an empirical modification of the Debye relaxation model, accounting for theasymmetry and broadness of the dielectric dispersion curve. The model was firstused to describe the dielectric relaxation of some polymers, by adding two expo-
17
2.2. CONDUCTIVITY
nential parameters to the Debye equation as shown below.
ε(ω) = ε∞ +εs − ε∞
(1 + (iωτ)1−α)β(2.25)
where the exponents α and β describe the asymmetry and broadness of the corre-sponding spectra.
When the symmetry parameter β is equal to 1 the Havriliak-Negami equationsreduced to the Cole-Cole equation. Another special case of Havriliak-Negami re-laxation (β < 1 , α = 0) is known as Cole-Davidson relaxation [30, 29].
2.2.3 Conductivity of biomaterialsThe body can be considered as a composite volume conductor comprising a num-ber of spatially distributed tissues with differing electrical properties [31]. Con-ductivity is one of the basic and important properties characterizing the electricalproperties of biological materials. The conductivity σ is the proportionality fac-tor between the electric current density and the electric field, and is a measure ofthe ease with which ’delocalised’ charge carriers can move through the materialunder the influence of the field. Unlike metallic conductors, electrical conductionwithin biological tissues is due to ions. In the presence of an electric field, theconductivity arises mainly from the movement of mobile hydrated ions within theaqueous biological medium [32]. This ion mobility is also temperature dependent.
Tissue is a very inhomogeneous material; conductivity, relative permittivity andother electrical properties vary widely between different biological tissues andthese parameters also vary with the frequency of the applied field. For instantaccording to Schwan [33] and Grimnes [5] the dielectric permittivity of biologi-cal tissues typically decreases with increasing frequency in three major steps (i.e.dispersions) which are designated the α ,β and γ dispersions,
The α dispersion (10 Hz to a few kHz) is generally considered to be associatedwith the relaxation of ions tangential to charged membrane surfaces, while thebeta dispersion (1 kHz to several MHz) [34], associated with the polarization ofcellular membranes and protein and other organic macromolecules (and probablybound water). The γ dispersion (>10 GHz) arises mainly from the relaxation offree water within the tissues.
18
2.3. SCALING AND UNIVERSALITY
2.2.4 Effect of water in electrical properties of keratinizedtissue
Water is one of most important environmental factors that can affect and mod-ify the physical and chemical properties of hairs, skin and nails [35, 36]. As weknow skin plays an important role as interface between the internal body and theexternal environment and it controls the exchange between the inside and outsideenvironments. Body hair contributes to tempreture homeostastis and protects theskin from ultraviolet irradiation. Nail is also used for search for food for someanimals [35]. Of course water is not found only in the external environment of thebody, but it is also the basic constituent of the different body tissue and is oftencrucial to maintain their functional characteristics.
Keratins are a family of proteins which are made up of amino acids, karatins con-tain amino acid cystin which have many side-chain endings that helps to form astrong covalent bond with water molecules. Furthermore the physical propertiesof the keratin tissue, such as flexibility and permeability are dependant on thedehydration. Electrical conductivity is sensitive to any change in chemical com-position, structure of study material and also permits to state whether the observedchanges are permanent or temporary. Different researcher observed the decreasein stratum corneum impedance to increase in water content. In the independentinvestigation of the relationship of dielectric constant and water content of stra-tum corneum observed that an increment of dielectric constant accompanied byincrease of hydration [37]. The relationship between the resistivity and watercontent measurement can provide information about stratum corneum hydrationcharacteristics [38].
Increase of water content in keratin tissue has been found to increase, in general,molecular mobility. Similar to an increase in temperature. Particularly, the watercontent-dependent electrical conductivity has been found to reflect ionic mobili-ties in the water-swollen keratin tissues.
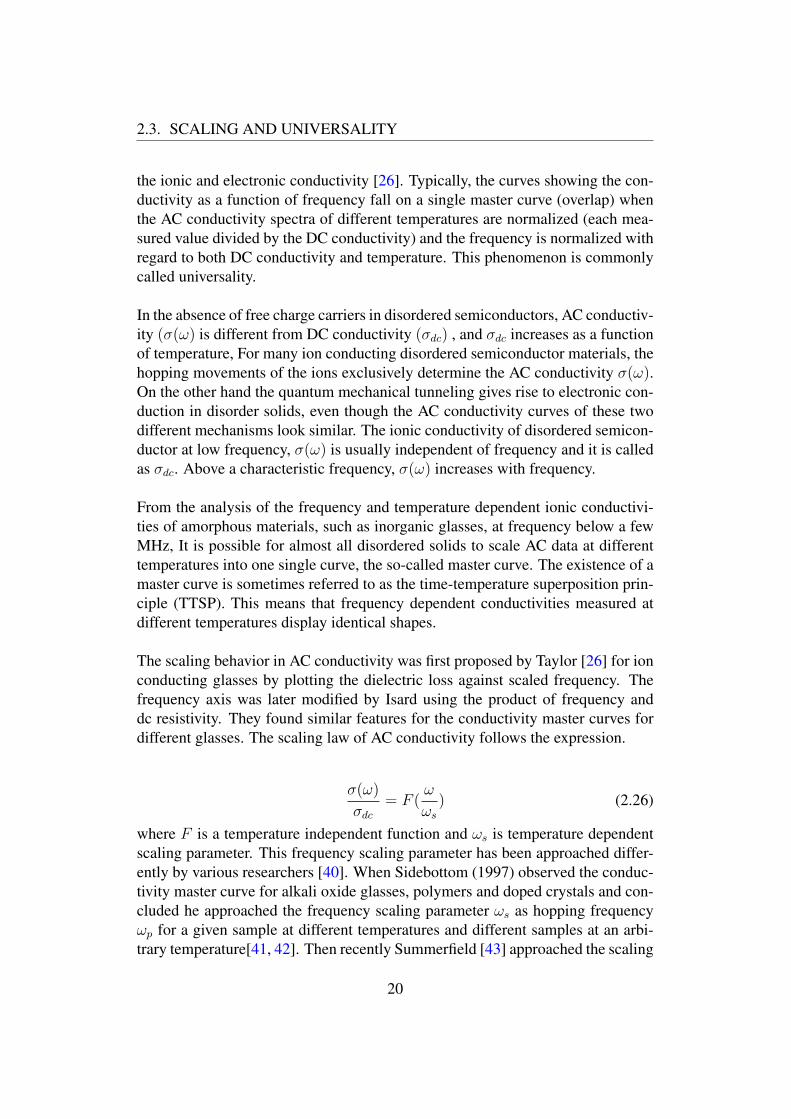
2.3 Scaling and universalityThere are many examples and evidence from the literature that the electrical prop-erties of a large number of materials, such as glasses, amorphous semiconductors,electron conducting polymers etc, shows evidently similar frequency dependentAC conductivity curves [1, 39]. In most of these solids, the AC conductivityfollows the Arrhenius equations with universally similar AC conductivity. Theshapes of the curves are so analogous that it is impossible to distinguish between
19
2.3. SCALING AND UNIVERSALITY
the ionic and electronic conductivity [26]. Typically, the curves showing the con-ductivity as a function of frequency fall on a single master curve (overlap) whenthe AC conductivity spectra of different temperatures are normalized (each mea-sured value divided by the DC conductivity) and the frequency is normalized withregard to both DC conductivity and temperature. This phenomenon is commonlycalled universality.
In the absence of free charge carriers in disordered semiconductors, AC conductiv-ity (σ(ω) is different from DC conductivity (σdc) , and σdc increases as a functionof temperature, For many ion conducting disordered semiconductor materials, thehopping movements of the ions exclusively determine the AC conductivity σ(ω).On the other hand the quantum mechanical tunneling gives rise to electronic con-duction in disorder solids, even though the AC conductivity curves of these twodifferent mechanisms look similar. The ionic conductivity of disordered semicon-ductor at low frequency, σ(ω) is usually independent of frequency and it is calledas σdc. Above a characteristic frequency, σ(ω) increases with frequency.
From the analysis of the frequency and temperature dependent ionic conductivi-ties of amorphous materials, such as inorganic glasses, at frequency below a fewMHz, It is possible for almost all disordered solids to scale AC data at differenttemperatures into one single curve, the so-called master curve. The existence of amaster curve is sometimes referred to as the time-temperature superposition prin-ciple (TTSP). This means that frequency dependent conductivities measured atdifferent temperatures display identical shapes.
The scaling behavior in AC conductivity was first proposed by Taylor [26] for ionconducting glasses by plotting the dielectric loss against scaled frequency. Thefrequency axis was later modified by Isard using the product of frequency anddc resistivity. They found similar features for the conductivity master curves fordifferent glasses. The scaling law of AC conductivity follows the expression.
σ(ω)
σdc= F (
ω
ωs) (2.26)
where F is a temperature independent function and ωs is temperature dependentscaling parameter. This frequency scaling parameter has been approached differ-ently by various researchers [40]. When Sidebottom (1997) observed the conduc-tivity master curve for alkali oxide glasses, polymers and doped crystals and con-cluded he approached the frequency scaling parameter ωs as hopping frequencyωp for a given sample at different temperatures and different samples at an arbi-trary temperature[41, 42]. Then recently Summerfield [43] approached the scaling
20
2.3. SCALING AND UNIVERSALITY
frequency as σdcT and σdcTx
or σdcTnc
respectively. For a given composition at dif-ferent temperatures and different composition at an arbitrary temperature, wherex is mole fraction of mobile ions, and nc is carrier concentration. They applythis method to sodium borate glasses [40] of different compositions. However,the superposition of the master curves show deviation with different compositionswhen it is scaled by σdcT . This deviation in the master curve is accounted byscaling the frequency axis by σdcT
x, but after checking for different sodium ger-
manate glasses, Sidebottom [44] concluded that the master curves for differentcompositions are not exact for this modification, there are small differences inshape between the master curves. He endorsed the differences in shape of mastercurves, to the changes in the ion hopping length with changing alkali oxide con-tent of the glasses along with the cation number density. Then he proposed a newscaling approach which uses the scaling frequency parameters as σdc
ε04ε in Sidebot-tom scaling for a given sample at different temperatures and different samples atan arbitrary temperature. Later on in 2000, Schroder and Dyre [1] proved that thetemperature dependent conductivity spectra of a given glass can be superimposedonto a master curve upon application of Sidebottom scaling approach, if the shapeof these spectra does not depend on temperature.
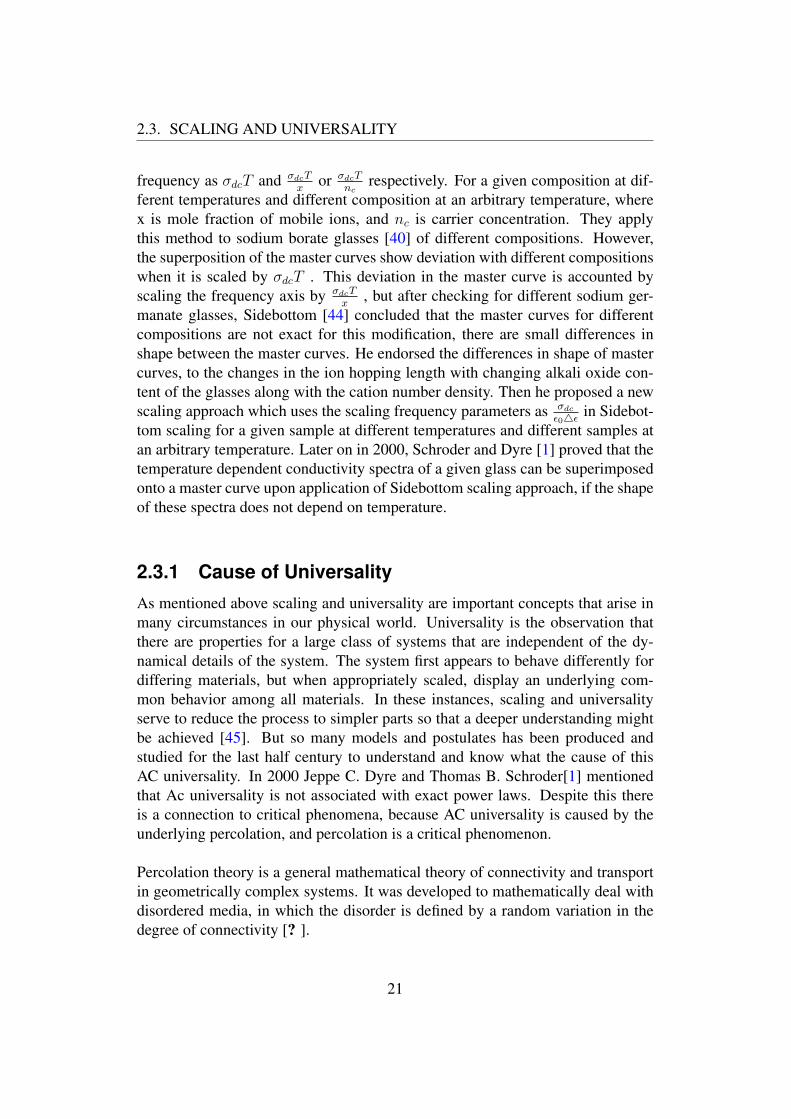
2.3.1 Cause of UniversalityAs mentioned above scaling and universality are important concepts that arise inmany circumstances in our physical world. Universality is the observation thatthere are properties for a large class of systems that are independent of the dy-namical details of the system. The system first appears to behave differently fordiffering materials, but when appropriately scaled, display an underlying com-mon behavior among all materials. In these instances, scaling and universalityserve to reduce the process to simpler parts so that a deeper understanding mightbe achieved [45]. But so many models and postulates has been produced andstudied for the last half century to understand and know what the cause of thisAC universality. In 2000 Jeppe C. Dyre and Thomas B. Schroder[1] mentionedthat Ac universality is not associated with exact power laws. Despite this thereis a connection to critical phenomena, because AC universality is caused by theunderlying percolation, and percolation is a critical phenomenon.
Percolation theory is a general mathematical theory of connectivity and transportin geometrically complex systems. It was developed to mathematically deal withdisordered media, in which the disorder is defined by a random variation in thedegree of connectivity [? ].
21
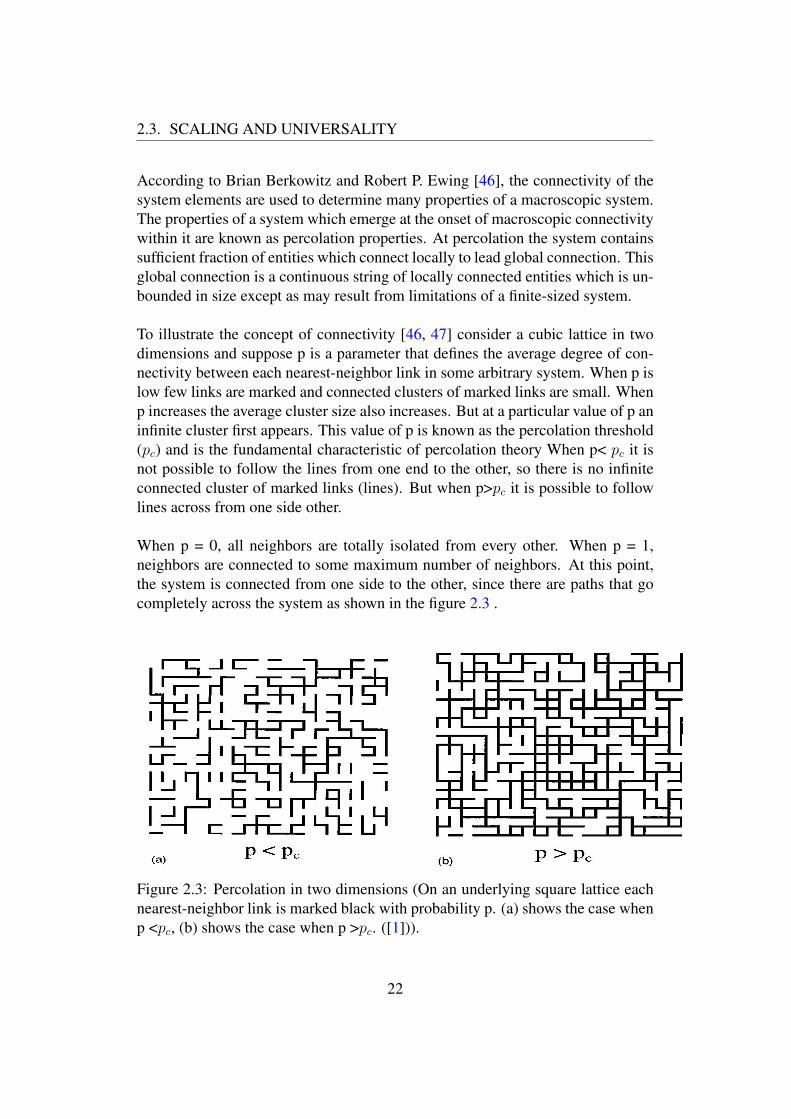
2.3. SCALING AND UNIVERSALITY
According to Brian Berkowitz and Robert P. Ewing [46], the connectivity of thesystem elements are used to determine many properties of a macroscopic system.The properties of a system which emerge at the onset of macroscopic connectivitywithin it are known as percolation properties. At percolation the system containssufficient fraction of entities which connect locally to lead global connection. Thisglobal connection is a continuous string of locally connected entities which is un-bounded in size except as may result from limitations of a finite-sized system.
To illustrate the concept of connectivity [46, 47] consider a cubic lattice in twodimensions and suppose p is a parameter that defines the average degree of con-nectivity between each nearest-neighbor link in some arbitrary system. When p islow few links are marked and connected clusters of marked links are small. Whenp increases the average cluster size also increases. But at a particular value of p aninfinite cluster first appears. This value of p is known as the percolation threshold(pc) and is the fundamental characteristic of percolation theory When p< pc it isnot possible to follow the lines from one end to the other, so there is no infiniteconnected cluster of marked links (lines). But when p>pc it is possible to followlines across from one side other.
When p = 0, all neighbors are totally isolated from every other. When p = 1,neighbors are connected to some maximum number of neighbors. At this point,the system is connected from one side to the other, since there are paths that gocompletely across the system as shown in the figure 2.3 .
Figure 2.3: Percolation in two dimensions (On an underlying square lattice eachnearest-neighbor link is marked black with probability p. (a) shows the case whenp <pc, (b) shows the case when p >pc. ([1])).
22
2.3. SCALING AND UNIVERSALITY
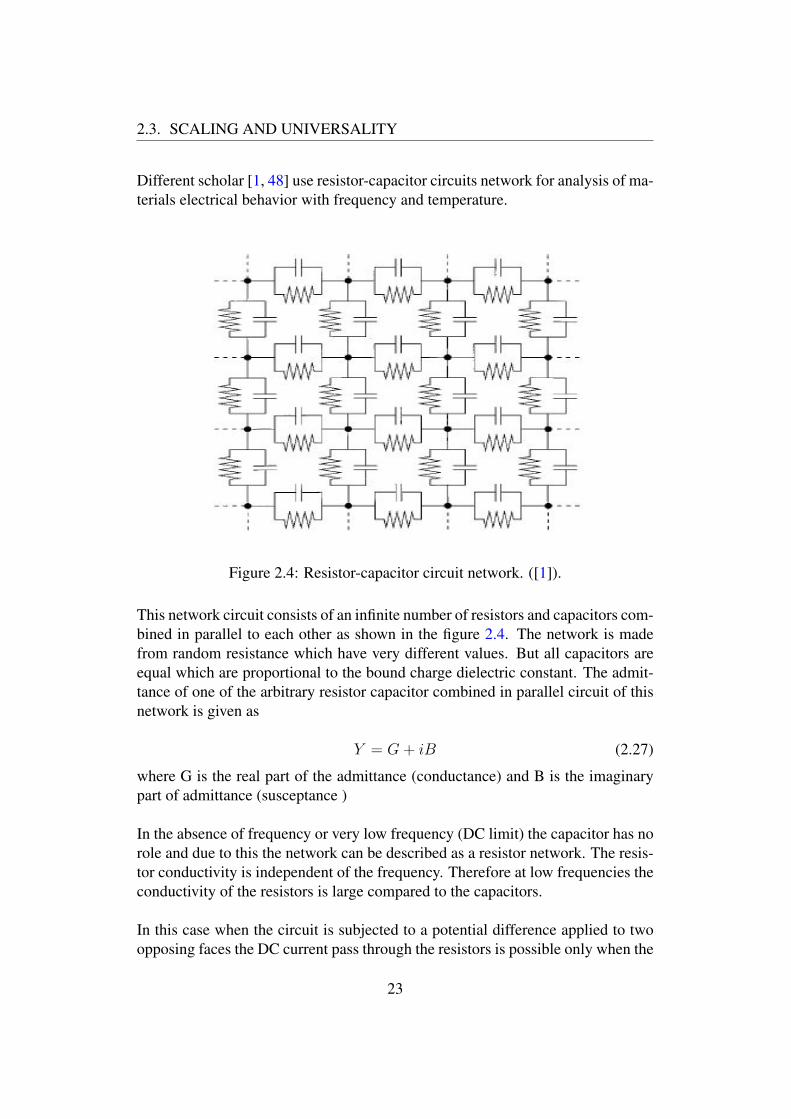
Different scholar [1, 48] use resistor-capacitor circuits network for analysis of ma-terials electrical behavior with frequency and temperature.
Figure 2.4: Resistor-capacitor circuit network. ([1]).
This network circuit consists of an infinite number of resistors and capacitors com-bined in parallel to each other as shown in the figure 2.4. The network is madefrom random resistance which have very different values. But all capacitors areequal which are proportional to the bound charge dielectric constant. The admit-tance of one of the arbitrary resistor capacitor combined in parallel circuit of thisnetwork is given as
Y = G+ iB (2.27)
where G is the real part of the admittance (conductance) and B is the imaginarypart of admittance (susceptance )
In the absence of frequency or very low frequency (DC limit) the capacitor has norole and due to this the network can be described as a resistor network. The resis-tor conductivity is independent of the frequency. Therefore at low frequencies theconductivity of the resistors is large compared to the capacitors.
In this case when the circuit is subjected to a potential difference applied to twoopposing faces the DC current pass through the resistors is possible only when the
23
2.3. SCALING AND UNIVERSALITY
fraction of resistors exceeds pc . When percolation is reached the admittance ofthe set of random resistors is dominated by the largest resistors in the pass of thecurrent in the network.
As the frequency increases the AC conductivity (susceptance) of the capacitorsbegin to increase and at specific frequency ωm the susceptibility of the capacitorbecome equal to that of the conductivity of the resistors [1, 48].
That means at frequency ωm the conductivity of an arbitrary square pieces ofconductors (parallel combined resistor and capacitor) in the network can be givenas [49]
Gc =1
Rc
=σdcξ
2
ξ= σdcξ = ωmC (2.28)
Where ξ is the length of the square conducting piece in the network, C is the ca-pacitor.
Dividing all side by C then the critical frequency can be expressed as
ωm =Gc
C=
1
RcC=σdcξ
C(2.29)
Different sources [50, 51, 52] indicate that the capacitor of a material is inverselyproportional to temperature.
C ∝ 1
T(2.30)
using equation 2.29 and 2.30 the critical frequency can be defined as
ωm ∝σdcξ
( 1T)
(2.31)
Thus(ωmσdcT
) ∝ ξ (2.32)
For the given materials the length ξ is not totally constant but displays very smallvariation with temperature [51] therefore the right hand side is approximately con-stant.
As the frequency increases further beyond this point the susceptibility of the ca-pacitor becomes higher and higher. At high frequencies the ac conductivity ofcapacitors is much larger than the resistors and the resistors can be regarded as
24
2.3. SCALING AND UNIVERSALITY
open circuits.
Moreover, the capacitance of the materials is also affected by the relative humid-ity. This effect depends on the types of capacitor, types of dielectric materials usedand the air gap between the two plates of the capacitor. Different materials havedifferent ability to absorb water molecules which follow-on change in dielectricconstant and therefore capacitance is proportional to the percentage relative hu-midity of the surrounding atmosphere [49].
That meansC ∝ %RH (2.33)
Thus, the critical frequency ωm which the conductivity of resistor and capacitorbecame equal can be given as
ωm ∝σdcξ
(%RH)(2.34)
By rearranging this equation it can be rewritten as
(ωm%RH
σdc) ∝ ξ (2.35)
For the given materials the length ξ is constant. It is independent of relative hu-midity therefore the right hand side is approximately constant. Therefore changesin the ambient humidity affect the measured capacitance with change in dielectricconstant.
25
Chapter 3
Instrumentation AndMeasurement Procedure
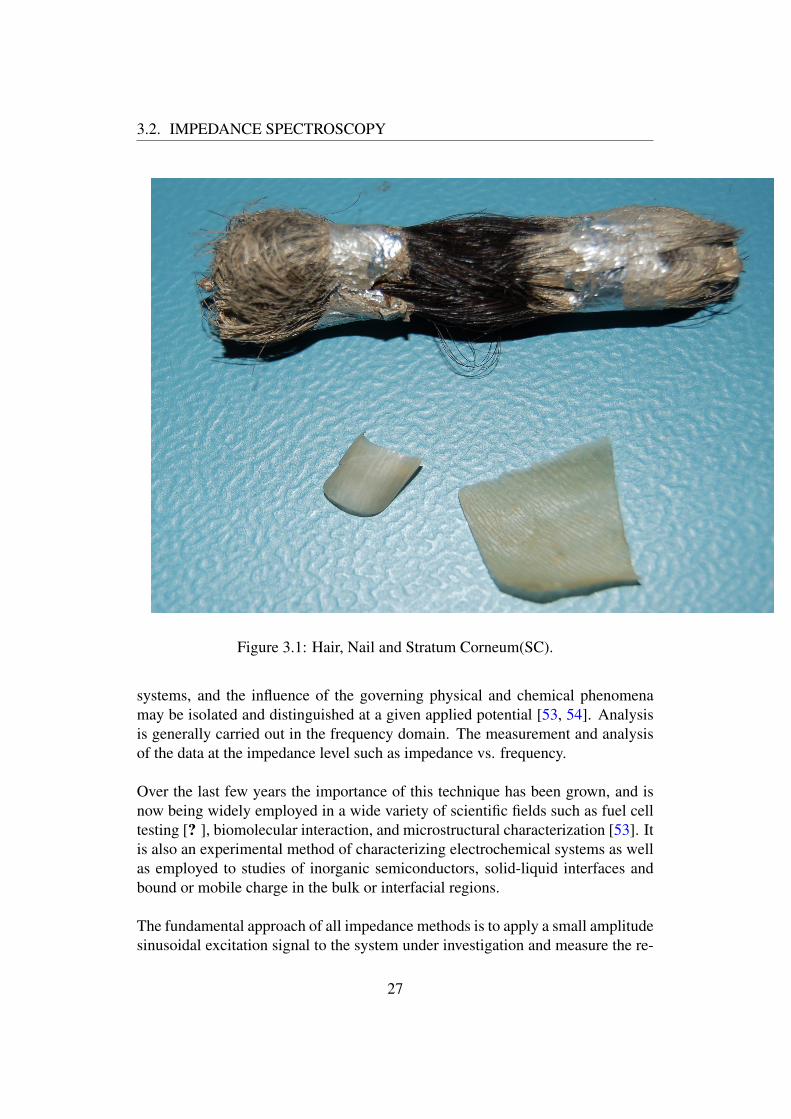
3.1 Sample PreparationThe samples used for this work were hair, skin and nail. The stratum corneumsample was taken from the heel of a healthy volunteer using an instrument knownas aesculup acculon dermatome. This skin piece was about 2 by 2 cm with thick-ness of 0.2 mm. The hair specimens for impedance measurements were preparedby arranging bundle of hairs (more than 5000 hairs) of length 2.5 cm parallel toeach other and they hold together by 60 minute conductive epoxy. The 60 MinuteConductive Epoxy is a two parts, silver epoxy used in prototype, strong mechani-cal and conducting bonds, high electrical conductivity. Before gluing up them thehair was treated (washed) by pure water and then dried. After drying the bundlehair middle part was covered by plastic and paper to protect any contact of con-ducting glue. The other sample which was used in the project was nail which wasobtained from volunteers.This nail piece was about 1 by 0.8 cm. Before measure-ment it was properly washed by pure water and dried. The picture of all the threesample of the project is presented in figure 3.1
3.2 Impedance SpectroscopyImpedance spectroscopy is a powerful and a non-destructive method for char-acterizing the electrical properties of materials and their interfaces with a singleexperimental procedure encompassing a sufficiently broad range of frequencies,It includes the small-signal measurement of the linear electric response of the ma-terials of interest (including electrode effects) and the subsequent analysis of theresponse to yield useful information about the physicochemical properties of the
26
3.2. IMPEDANCE SPECTROSCOPY
Figure 3.1: Hair, Nail and Stratum Corneum(SC).
systems, and the influence of the governing physical and chemical phenomenamay be isolated and distinguished at a given applied potential [53, 54]. Analysisis generally carried out in the frequency domain. The measurement and analysisof the data at the impedance level such as impedance vs. frequency.
Over the last few years the importance of this technique has been grown, and isnow being widely employed in a wide variety of scientific fields such as fuel celltesting [? ], biomolecular interaction, and microstructural characterization [53]. Itis also an experimental method of characterizing electrochemical systems as wellas employed to studies of inorganic semiconductors, solid-liquid interfaces andbound or mobile charge in the bulk or interfacial regions.
The fundamental approach of all impedance methods is to apply a small amplitudesinusoidal excitation signal to the system under investigation and measure the re-
27
3.2. IMPEDANCE SPECTROSCOPY
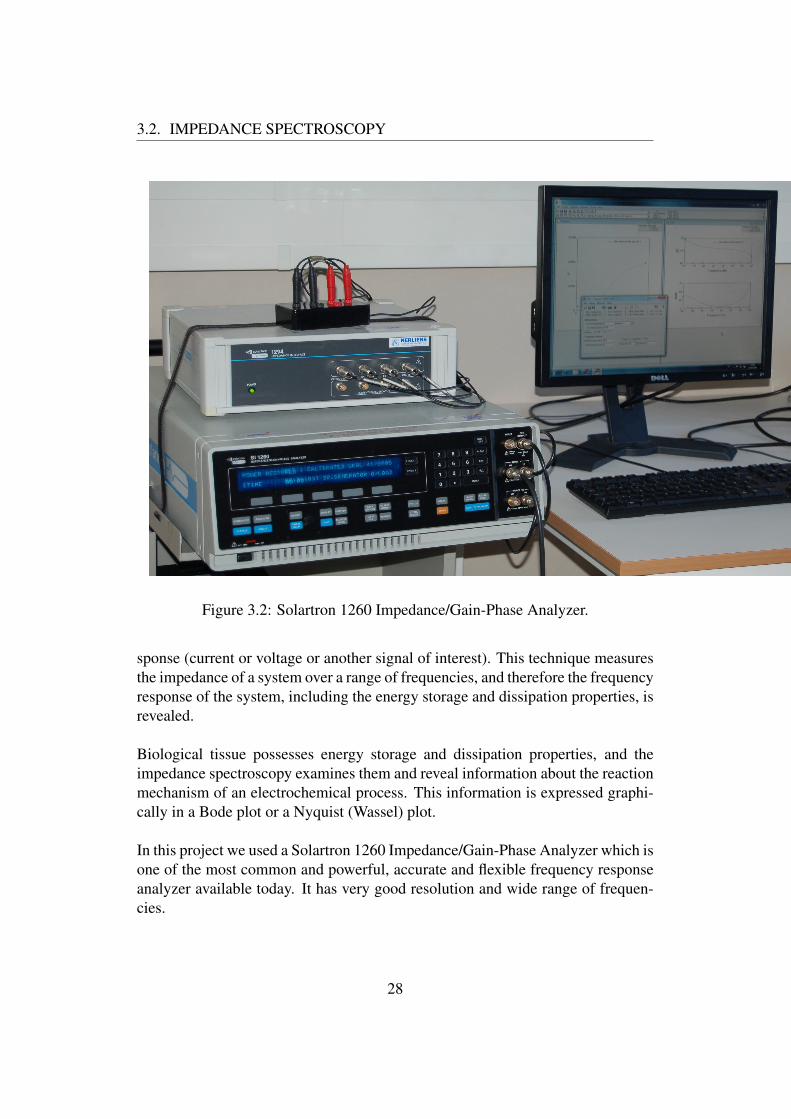
Figure 3.2: Solartron 1260 Impedance/Gain-Phase Analyzer.
sponse (current or voltage or another signal of interest). This technique measuresthe impedance of a system over a range of frequencies, and therefore the frequencyresponse of the system, including the energy storage and dissipation properties, isrevealed.
Biological tissue possesses energy storage and dissipation properties, and theimpedance spectroscopy examines them and reveal information about the reactionmechanism of an electrochemical process. This information is expressed graphi-cally in a Bode plot or a Nyquist (Wassel) plot.
In this project we used a Solartron 1260 Impedance/Gain-Phase Analyzer which isone of the most common and powerful, accurate and flexible frequency responseanalyzer available today. It has very good resolution and wide range of frequen-cies.
28
3.2. IMPEDANCE SPECTROSCOPY
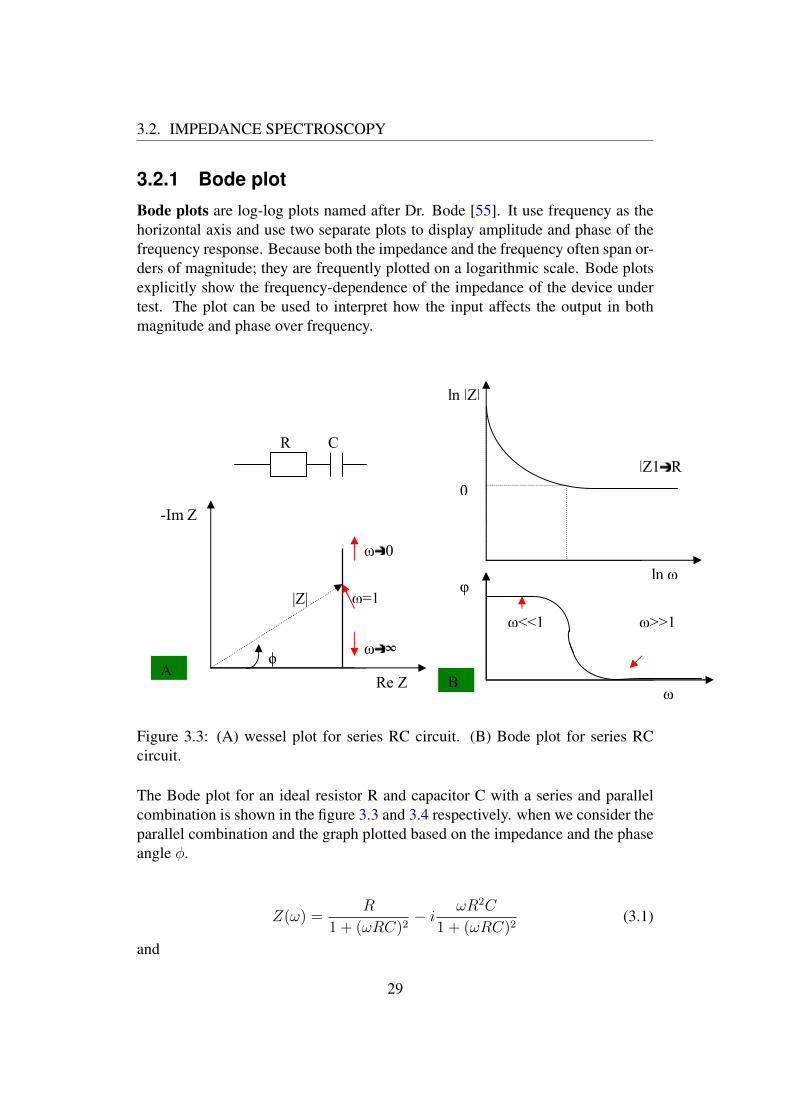
3.2.1 Bode plotBode plots are log-log plots named after Dr. Bode [55]. It use frequency as thehorizontal axis and use two separate plots to display amplitude and phase of thefrequency response. Because both the impedance and the frequency often span or-ders of magnitude; they are frequently plotted on a logarithmic scale. Bode plotsexplicitly show the frequency-dependence of the impedance of the device undertest. The plot can be used to interpret how the input affects the output in bothmagnitude and phase over frequency.
A) Wassel plot for series RC circuit B) Bode plot for series RC circuit
ϕ
|Z|
R C
Re Z
-Im Z
ω 0
ω ∞
ω=1 φ
ω
ln |Z|
ln ω
ω>>1 ω<<1
A B
|Z1 R 0
Figure 3.3: (A) wessel plot for series RC circuit. (B) Bode plot for series RCcircuit.
The Bode plot for an ideal resistor R and capacitor C with a series and parallelcombination is shown in the figure 3.3 and 3.4 respectively. when we consider theparallel combination and the graph plotted based on the impedance and the phaseangle φ.
Z(ω) =R
1 + (ωRC)2− i ωR2C
1 + (ωRC)2(3.1)
and
29
3.2. IMPEDANCE SPECTROSCOPY
φ =ZimZRe
(3.2)
where Zim and ZRe are imaginary and real part of the impedance in equation 3.1
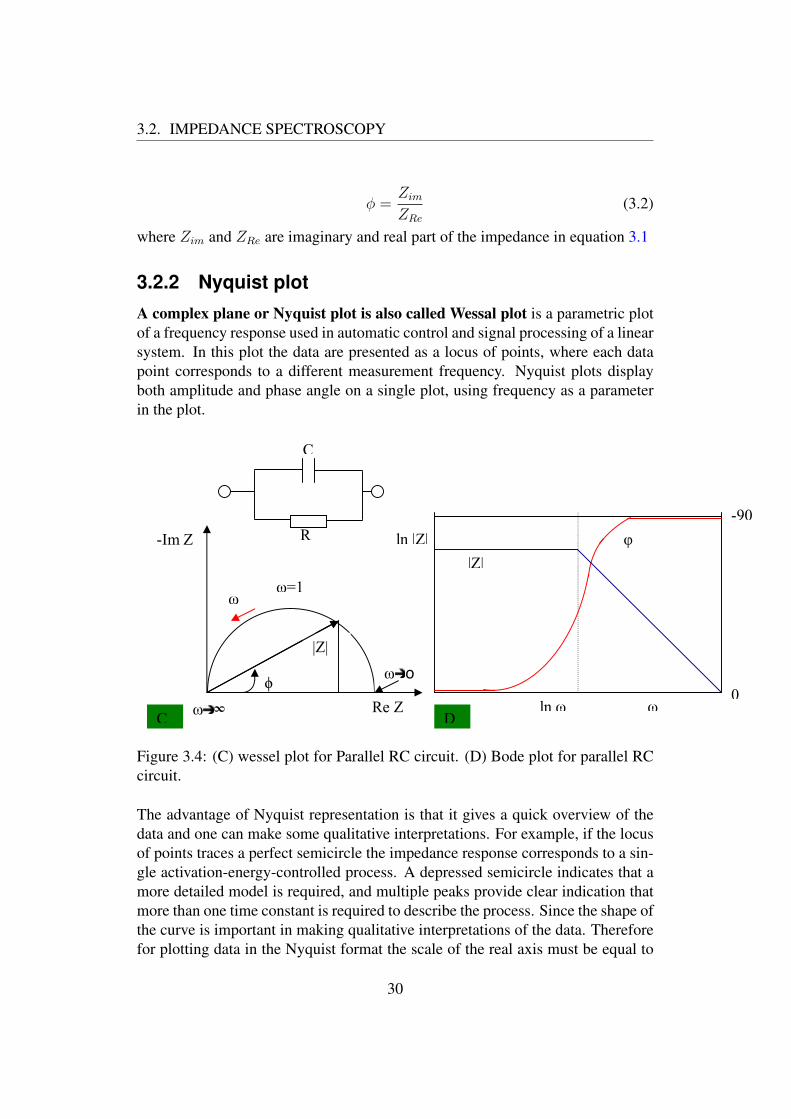
3.2.2 Nyquist plotA complex plane or Nyquist plot is also called Wessal plot is a parametric plotof a frequency response used in automatic control and signal processing of a linearsystem. In this plot the data are presented as a locus of points, where each datapoint corresponds to a different measurement frequency. Nyquist plots displayboth amplitude and phase angle on a single plot, using frequency as a parameterin the plot.
ϕ
|Z|
R
C
Re Z
-Im Z
ω ∞
ω o
ω=1
φ
ω
ln |Z|
ln ω C D
|Z|
ω
0
-90
Figure 3.4: (C) wessel plot for Parallel RC circuit. (D) Bode plot for parallel RCcircuit.
The advantage of Nyquist representation is that it gives a quick overview of thedata and one can make some qualitative interpretations. For example, if the locusof points traces a perfect semicircle the impedance response corresponds to a sin-gle activation-energy-controlled process. A depressed semicircle indicates that amore detailed model is required, and multiple peaks provide clear indication thatmore than one time constant is required to describe the process. Since the shape ofthe curve is important in making qualitative interpretations of the data. Thereforefor plotting data in the Nyquist format the scale of the real axis must be equal to
30
3.3. CTS-TEMPERATURE TEST
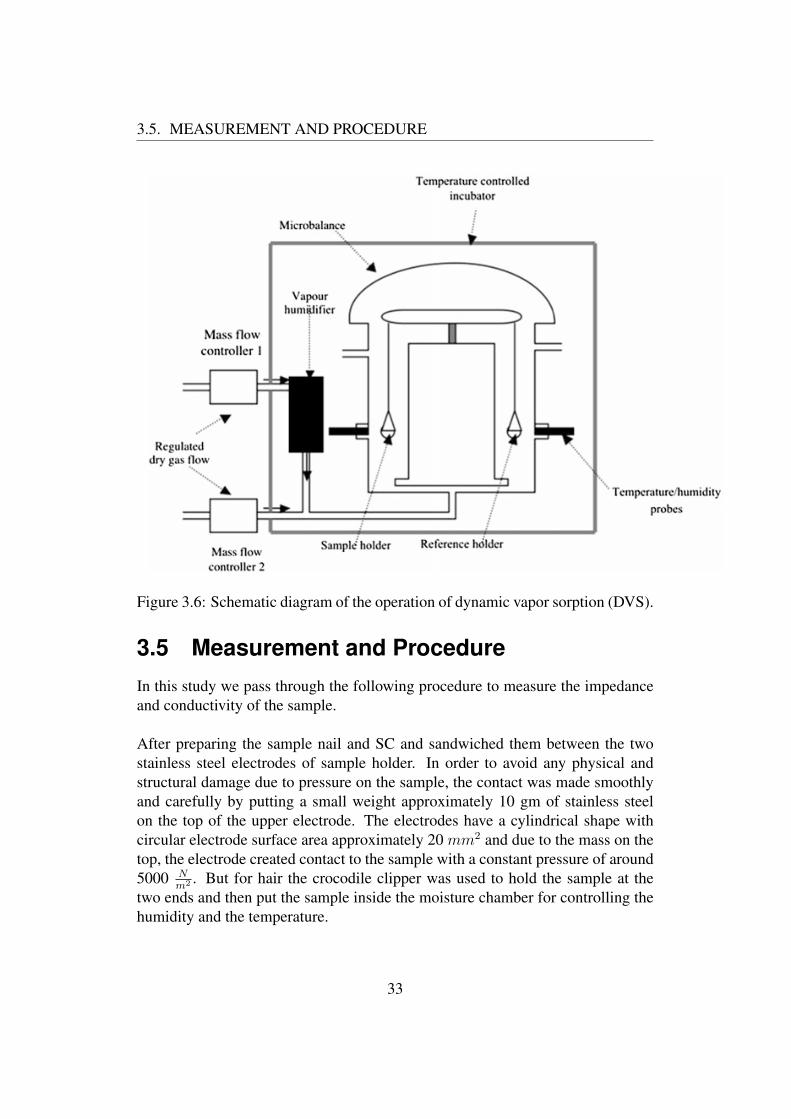
the imaginary axis so as not to distort the shape of the curve. While using theNyquist representation care has to be taken not to lose the frequency dimension ofthe data [53, 55, 56]. The Nyquist plot for an ideal resistor R and capacitor C inseries and parallel connection is shown in the figure 3.3 and 3.4
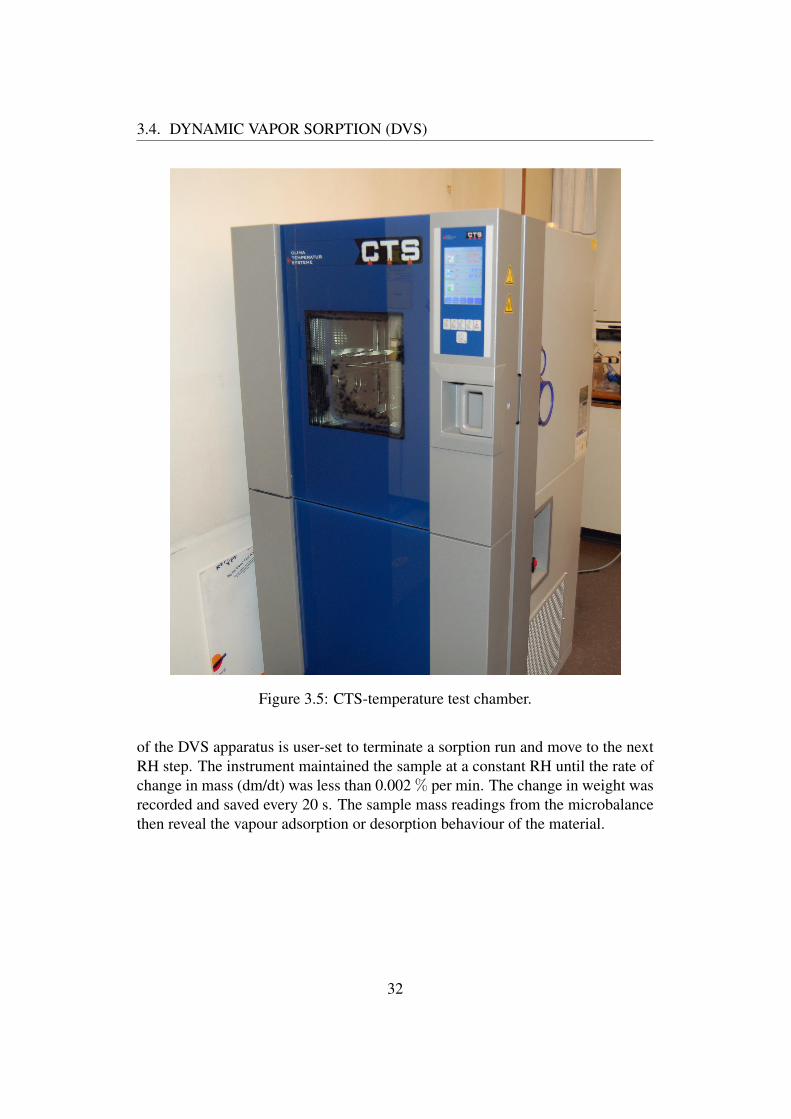
3.3 CTS-Temperature TestSome systems allow temperature and humidity control to be added to the materialsimpedance test system to characterize the way that materials change with temper-ature and humidity. There are wide ranges of temperature controllers availablefrom various manufacturers. In this work we use CTS-temperature test chamberwhich has a high temperature adjustment rate, simple programming on a coloredtouch panel. In addition to this CTS-temperature test chambers are also controlthe relative humidity (RH) very accurately.
3.4 Dynamic Vapor Sorption (DVS)Another important instrument that we used in our work is the dynamic vapor sorp-tion (DVS) which is developed by Surface Measurement System (London, UK,1997). DVS is a temperature-controlled incubator that contains two chambers,the reference chamber and the sample chamber, within which the specified rel-ative humidity is produced. The changes in relative humidity in each chamberoccur by mixing a specific ratio of saturated vapor (100 percent relative humiditygenerated by passing the air (nitrogen gas) through a vapor humidifier) and thedry air is controlled by mass flow controller. Temperature and relative humidityprobes monitor the conditions in each chamber. Within each respective chamber,a reference pan and a sample pan are hanging on a wire that is attached to a Cahnmicrobalance. The balance is highly sensitive to the changes in moisture that oc-cur throughout the incubator.
In this study, the pieces of the three samples was placed onto a cleaned sample pan.A constant flow of dry nitrogen gas (200 cm3min−1) is mixed into a stream of ni-trogen containing water vapor at saturation and this mixed stream passes throughthe measurement chamber to maintain a set RH.
Furthermore this device is an automated apparatus that can change the relativehumidity or temperature according to specification set by the user. The software
31
3.4. DYNAMIC VAPOR SORPTION (DVS)
Figure 3.5: CTS-temperature test chamber.
of the DVS apparatus is user-set to terminate a sorption run and move to the nextRH step. The instrument maintained the sample at a constant RH until the rate ofchange in mass (dm/dt) was less than 0.002 % per min. The change in weight wasrecorded and saved every 20 s. The sample mass readings from the microbalancethen reveal the vapour adsorption or desorption behaviour of the material.
32
3.5. MEASUREMENT AND PROCEDURE
Figure 3.6: Schematic diagram of the operation of dynamic vapor sorption (DVS).
3.5 Measurement and ProcedureIn this study we pass through the following procedure to measure the impedanceand conductivity of the sample.
After preparing the sample nail and SC and sandwiched them between the twostainless steel electrodes of sample holder. In order to avoid any physical andstructural damage due to pressure on the sample, the contact was made smoothlyand carefully by putting a small weight approximately 10 gm of stainless steelon the top of the upper electrode. The electrodes have a cylindrical shape withcircular electrode surface area approximately 20 mm2 and due to the mass on thetop, the electrode created contact to the sample with a constant pressure of around5000 N
m2 . But for hair the crocodile clipper was used to hold the sample at thetwo ends and then put the sample inside the moisture chamber for controlling thehumidity and the temperature.
33
3.5. MEASUREMENT AND PROCEDURE
The sample stayed approximately 24 hours inside the moisture chamber to be sta-bilized in the required state before any electrical measurement and immediatelyafter measurement was carried out either temperature or RH was increased again.
AC impedance at different calibrated temperature and relative humidity was mea-sured using a Solatron 1290 (Hampshire, UK) impedance analyzer with 1294dielectric interface. During impedance measurement the sample scanned at 36frequency points over the frequency range 0.01 Hz to 1 MHz with employingconstant voltage signal amplitude of 400 mV for skin and 2000 mV for hair andnail at 5 permutations settings.
Electrical impedance was displayed as Real Z (R,resistive component in ohms)and Im Z ,capacitive reactance component in ohms. Finally we can change theimpedance measurement in to admittance which is composed of real part(conductance),this paper main target and imaginary part (susceptance) measurement using theZview software setup which use the mathematical relation between impedanceand admittance.
34
Chapter 4
Results
4.1 Time Constant of Sorption of water in ker-atinized tissue
The aim of this section is to present the dynamic vapor sorption (DVS) measure-ment results of stratum corneum, hair and nail
The DVS measurement on the sample stratum corneum (SC), nail and hair areused to determine the relationship between water activity and moisture contentat a constant temperature. And the time constant of the absorption process as afunction of the sample relative humidity. The time needed for hair, nail and SCto reach equilibrium with the environment in the DVS measurement chamber washighly dependent on the relative humidity of the surrounding air [57]. The sched-ule for the DVS was set to record the sample mass at each of the following RHsteps of adsorption at 0, 20, 40, 60, 80 and 95% RH and at a constant temperatureof 25 ±0.1 0C and in reverse sequence at 95, 80, 60, 40, 20, 0% RH for the des-orption.
4.1.1 DVS Measurement of Stratum Corneum SorptionThe SC is naturally poor in water; water is essential to maintenance of normalfunction and structure of SC. Due to this it has properties of sorbance. It is athermodynamic rule that water can diffuse from more wetted area to less one untilthe system reach equilibrium. The SC took and released water with a certain timeconstant.
The data of DVS absorption measurement of the skin sample had been taken by
35

4.1. TIME CONSTANT OF SORPTION OF WATER IN KERATINIZEDTISSUE
Martinsen et.al [37]. According to their result shown on the figure 4.1 the absorp-tion process was not completed at each step in RH before the next step was in-troduced. Hence, a regression method was used to calculate the time constant(seesection 5.1.1)
Figure 4.1: Steps in chamber RH (left curve) and resulting change in skin samplemass (right curve)([37]).
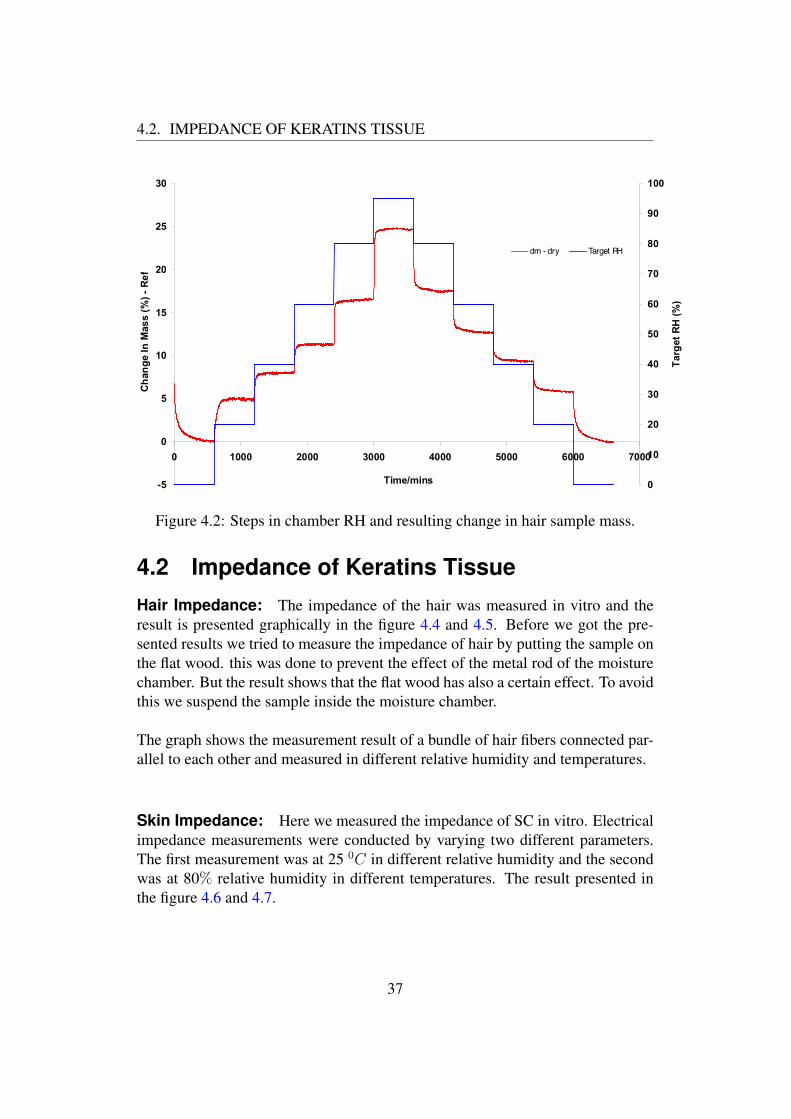
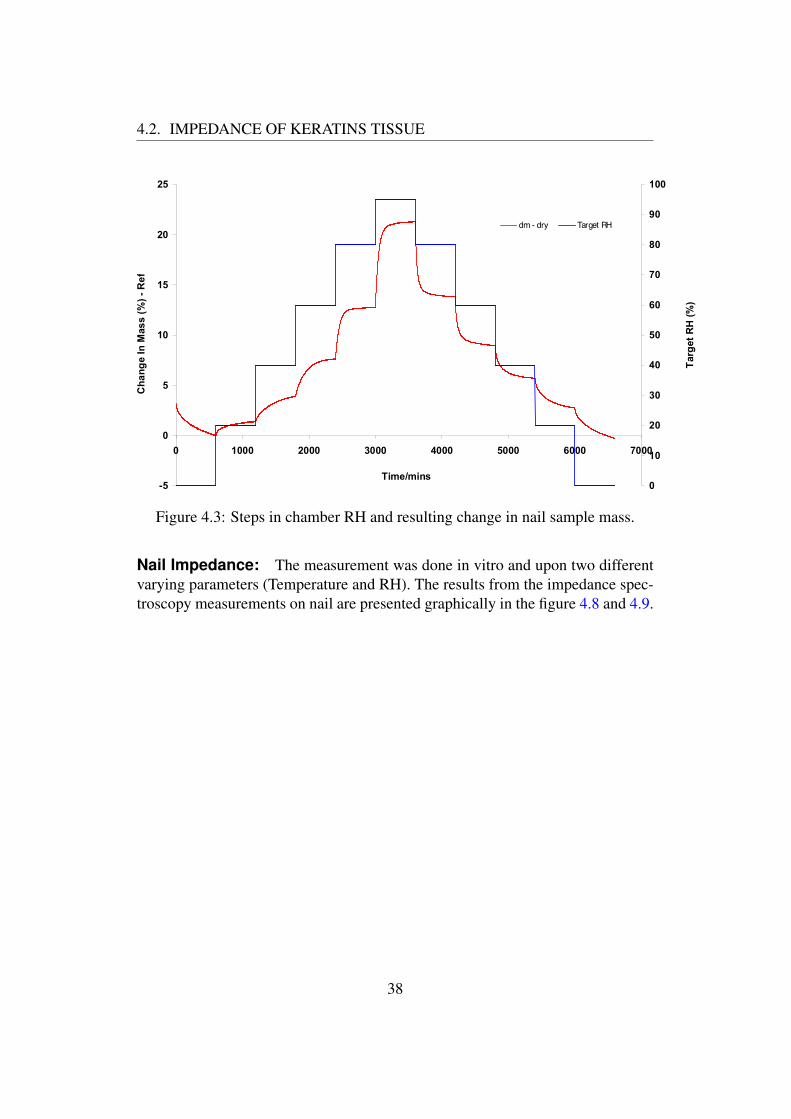
4.1.2 DVS Measurement of Nail And Hair SorptionThe result shown in the figures 4.2 and 4.3 are from the DVS sorption measure-ment of samples of hair and nail respectively. Each measurement was carried outwith RH steps of 20%. The blue one is the target relative humidity and the redshows the increment and decrement of the mass of the sample due to adsorptionand desorption of moisture. According to the result shown in the figure 4.2 and4.3, the RH of the sample did not always reach the targeted RH when the testingprogram changes the RH from one value to the next. But the change in weight inthe sample clearly seen as having an exponential curve (the adsorption part showsexponential growth and desorption part exponential decay).
36
4.2. IMPEDANCE OF KERATINS TISSUE
-5
0
5
10
15
20
25
30
0 1000 2000 3000 4000 5000 6000 7000
Time/mins
Cha
nge
In M
ass
(%) -
Ref
0
10
20
30
40
50
60
70
80
90
100
Targ
et R
H (%
)
dm - dry Target RH
Figure 4.2: Steps in chamber RH and resulting change in hair sample mass.
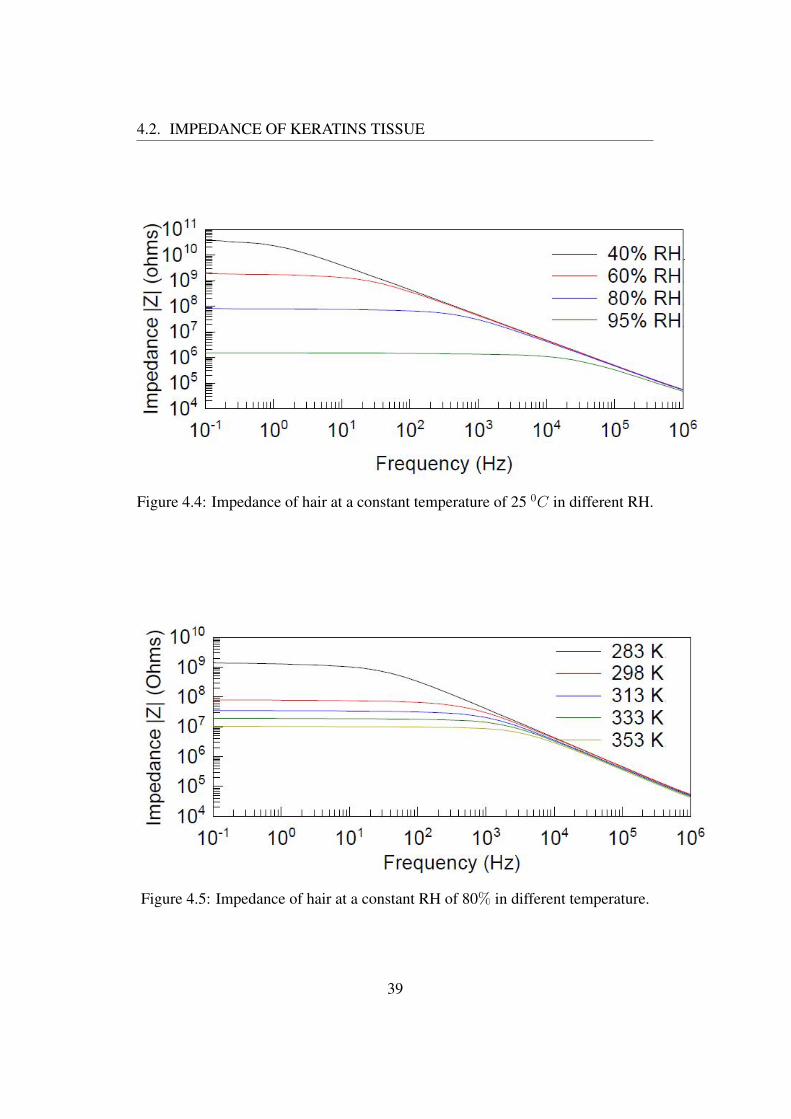
4.2 Impedance of Keratins TissueHair Impedance: The impedance of the hair was measured in vitro and theresult is presented graphically in the figure 4.4 and 4.5. Before we got the pre-sented results we tried to measure the impedance of hair by putting the sample onthe flat wood. this was done to prevent the effect of the metal rod of the moisturechamber. But the result shows that the flat wood has also a certain effect. To avoidthis we suspend the sample inside the moisture chamber.
The graph shows the measurement result of a bundle of hair fibers connected par-allel to each other and measured in different relative humidity and temperatures.
Skin Impedance: Here we measured the impedance of SC in vitro. Electricalimpedance measurements were conducted by varying two different parameters.The first measurement was at 25 0C in different relative humidity and the secondwas at 80% relative humidity in different temperatures. The result presented inthe figure 4.6 and 4.7.
37
4.2. IMPEDANCE OF KERATINS TISSUE
-5
0
5
10
15
20
25
0 1000 2000 3000 4000 5000 6000 7000
Time/mins
Cha
nge
In M
ass
(%) -
Ref
0
10
20
30
40
50
60
70
80
90
100
Targ
et R
H (%
)
dm - dry Target RH
Figure 4.3: Steps in chamber RH and resulting change in nail sample mass.
Nail Impedance: The measurement was done in vitro and upon two differentvarying parameters (Temperature and RH). The results from the impedance spec-troscopy measurements on nail are presented graphically in the figure 4.8 and 4.9.
38
4.2. IMPEDANCE OF KERATINS TISSUE
Figure 4.4: Impedance of hair at a constant temperature of 25 0C in different RH.
Figure 4.5: Impedance of hair at a constant RH of 80% in different temperature.
39

4.2. IMPEDANCE OF KERATINS TISSUE
Figure 4.6: Impedance of skin at a constant temperature of 25 0C in different RH.
Figure 4.7: Impedance of skin at a constant RH of 80% in different temperature.
40

4.2. IMPEDANCE OF KERATINS TISSUE
Figure 4.8: Impedance of nail at a constant temperature of 25 0C in different RH.
Figure 4.9: Impedance of nail at a constant RH of 80% in different temperature.
41
Chapter 5
Analysis and Discussion
5.1 Time Constant of Sorption of water in ker-atinized tissue
The aim of this topic is not to describe the detail of sorption of keratins tissue, butto determine the time constant that this tissues required to reach to equilibriumwith the targeted relative humidity.
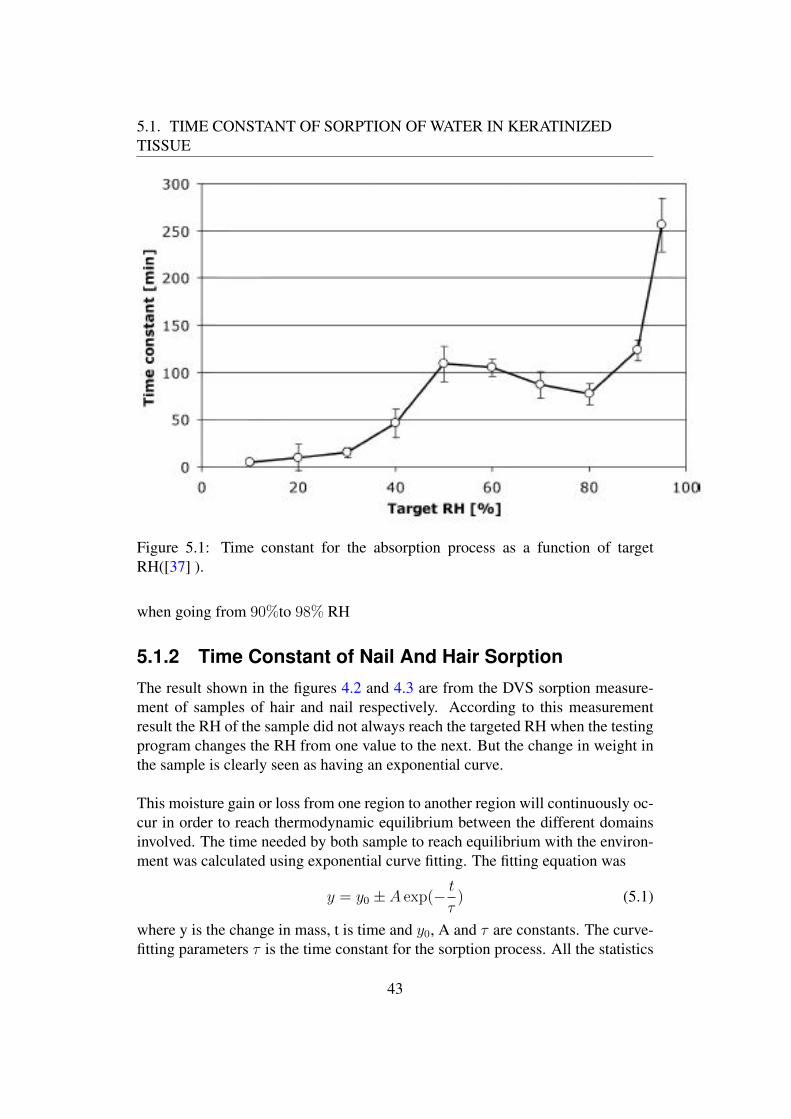
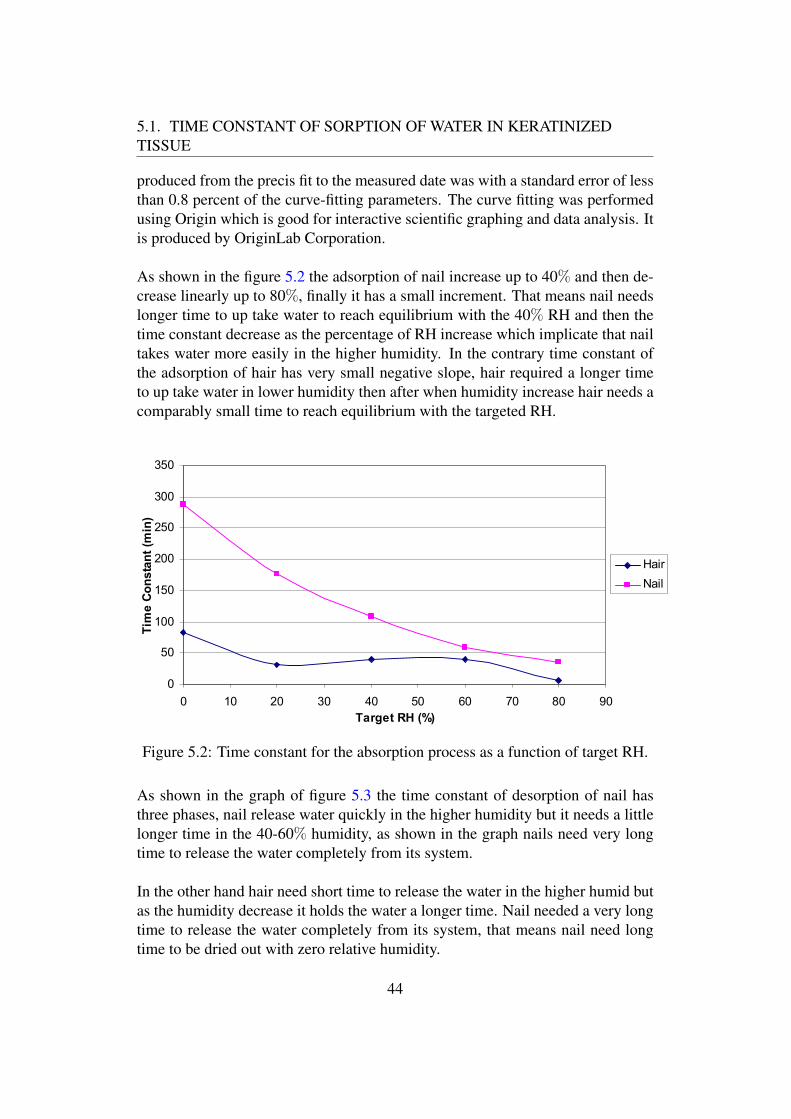
5.1.1 Time Constant of Stratum Corneum SorptionIt is a thermodynamic rule that water can diffuse from more wetted area to lessone until the system reach equilibrium. The SC uptake and released water with acertain time constant. Time needed for the SC to reach equilibrium with the envi-ronment calculated using the numerical extrapolation of this data and the solutionof Ficks second law. According to the result shown in the figure 5.1 the time con-stant has triphasic behavior. The time constant for the absorption process varies asa function of hydration level. The time constant increases with increasing targetRH up to about 50%, then decreases up to about 80% and finally increases againabove 80%. The more detailed analysis of the skin absorption can be found in[37, 57].
In general the time constant increases very rapidly at very low and high valuesof RH and with slower changes at mid-range values. The time constant rangesfrom 5 to 256 minutes. This means, waiting for 24 hours is more than enough andappropriate to reach the targeted ambient relative humidity to be stable for thisproject AC conductivity measurement. As mentioned in the report [37] the SCneeds or some one has to wait at least 17 hours to reach 98% of the final weight
42
5.1. TIME CONSTANT OF SORPTION OF WATER IN KERATINIZEDTISSUE
Figure 5.1: Time constant for the absorption process as a function of targetRH([37] ).
when going from 90%to 98% RH
5.1.2 Time Constant of Nail And Hair SorptionThe result shown in the figures 4.2 and 4.3 are from the DVS sorption measure-ment of samples of hair and nail respectively. According to this measurementresult the RH of the sample did not always reach the targeted RH when the testingprogram changes the RH from one value to the next. But the change in weight inthe sample is clearly seen as having an exponential curve.
This moisture gain or loss from one region to another region will continuously oc-cur in order to reach thermodynamic equilibrium between the different domainsinvolved. The time needed by both sample to reach equilibrium with the environ-ment was calculated using exponential curve fitting. The fitting equation was
y = y0 ± A exp(− tτ) (5.1)
where y is the change in mass, t is time and y0, A and τ are constants. The curve-fitting parameters τ is the time constant for the sorption process. All the statistics
43
5.1. TIME CONSTANT OF SORPTION OF WATER IN KERATINIZEDTISSUE
produced from the precis fit to the measured date was with a standard error of lessthan 0.8 percent of the curve-fitting parameters. The curve fitting was performedusing Origin which is good for interactive scientific graphing and data analysis. Itis produced by OriginLab Corporation.
As shown in the figure 5.2 the adsorption of nail increase up to 40% and then de-crease linearly up to 80%, finally it has a small increment. That means nail needslonger time to up take water to reach equilibrium with the 40% RH and then thetime constant decrease as the percentage of RH increase which implicate that nailtakes water more easily in the higher humidity. In the contrary time constant ofthe adsorption of hair has very small negative slope, hair required a longer timeto up take water in lower humidity then after when humidity increase hair needs acomparably small time to reach equilibrium with the targeted RH.
Desorption
0
50
100
150
200
250
300
350
0 10 20 30 40 50 60 70 80 90Target RH (%)
Tim
e Co
nsta
nt (m
in)
HairNail
Figure 5.2: Time constant for the absorption process as a function of target RH.
As shown in the graph of figure 5.3 the time constant of desorption of nail hasthree phases, nail release water quickly in the higher humidity but it needs a littlelonger time in the 40-60% humidity, as shown in the graph nails need very longtime to release the water completely from its system.
In the other hand hair need short time to release the water in the higher humid butas the humidity decrease it holds the water a longer time. Nail needed a very longtime to release the water completely from its system, that means nail need longtime to be dried out with zero relative humidity.
44
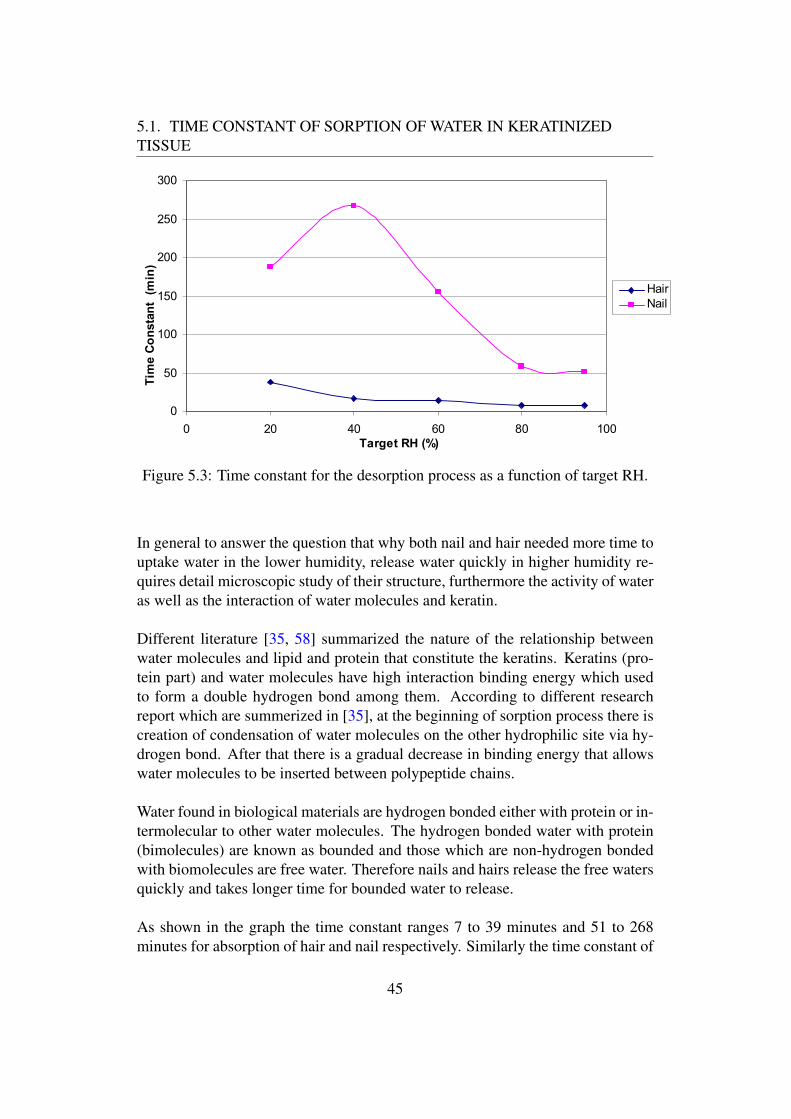
5.1. TIME CONSTANT OF SORPTION OF WATER IN KERATINIZEDTISSUE Adsorption
0
50
100
150
200
250
300
0 20 40 60 80 100Target RH (%)
Tim
e Co
nsta
nt (
min
)
HairNail
Figure 5.3: Time constant for the desorption process as a function of target RH.
In general to answer the question that why both nail and hair needed more time touptake water in the lower humidity, release water quickly in higher humidity re-quires detail microscopic study of their structure, furthermore the activity of wateras well as the interaction of water molecules and keratin.
Different literature [35, 58] summarized the nature of the relationship betweenwater molecules and lipid and protein that constitute the keratins. Keratins (pro-tein part) and water molecules have high interaction binding energy which usedto form a double hydrogen bond among them. According to different researchreport which are summerized in [35], at the beginning of sorption process there iscreation of condensation of water molecules on the other hydrophilic site via hy-drogen bond. After that there is a gradual decrease in binding energy that allowswater molecules to be inserted between polypeptide chains.
Water found in biological materials are hydrogen bonded either with protein or in-termolecular to other water molecules. The hydrogen bonded water with protein(bimolecules) are known as bounded and those which are non-hydrogen bondedwith biomolecules are free water. Therefore nails and hairs release the free watersquickly and takes longer time for bounded water to release.
As shown in the graph the time constant ranges 7 to 39 minutes and 51 to 268minutes for absorption of hair and nail respectively. Similarly the time constant of
45
5.2. IMPEDANCE OF KERATINS TISSUE
hair and nail desorption ranges 6 to 83 minutes and 36 to 287 minutes respectively.In conclusion, it seems waiting 24 hours is more than enough and appropriate timeto get the target RH to be stable for conductivity measurement.
5.2 Impedance of Keratins TissueHair Impedance: As shown in figure 4.4 and 4.5 the impedance of the hairvaries according to the variation of humidity and temperature. It has inverse re-lation to both humidity and temperatures. It decreases as relative humidity andtemperature increase and vice versa. This properties is more pronounced in thelower frequency region below 10 kHz but when we move to the higher frequencyregion above 10 kHz the impedance of hair in different condition seems the sameand become equal around 1 MHz. At lower temperature and RH the impedance isalmost independent of frequency which indicate that it is dominated by resistance.
Skin Impedance: As shown in the figure 4.6 and 4.7 the impedance of thestratum corneum is affected by temperature and relative humidity. The variationof temperature and water content of the skin (SC) has pronounced effect on theimpedance of the skin, the impedance of the SC decrease with increments of tem-perature and moisture. Detail investigations is needed to know the SC moleculardynamics caused by the hydration and dehydration as well as change temperaturethat influences the impedance. Unfortunately this was beyond the available re-search resource as well as outside of the project target. It is well known that thestratum corneum has both capacitance and resistance nature. This capacitance andresistance nature of the SC is dependent on the mobility of the keratin chains andwater molocules [37].
Nail Impedance: As shown in figure 4.8 and 4.9 the nail electric impedanceis affected by moisture and temperature variation as that of hair and skin. Theimpedance of nail decrease as the temperature and the percentage of RH increased.The nail impedance in the lower relative humidity shows a small variation butabove 60 % relative humidity the impedance shows large variation
5.3 Conductance of Keratins TissueDifferent materials display different electrical properties; conductivity is one ofthe electrical properties which determine the behaviors of materials under the in-
46
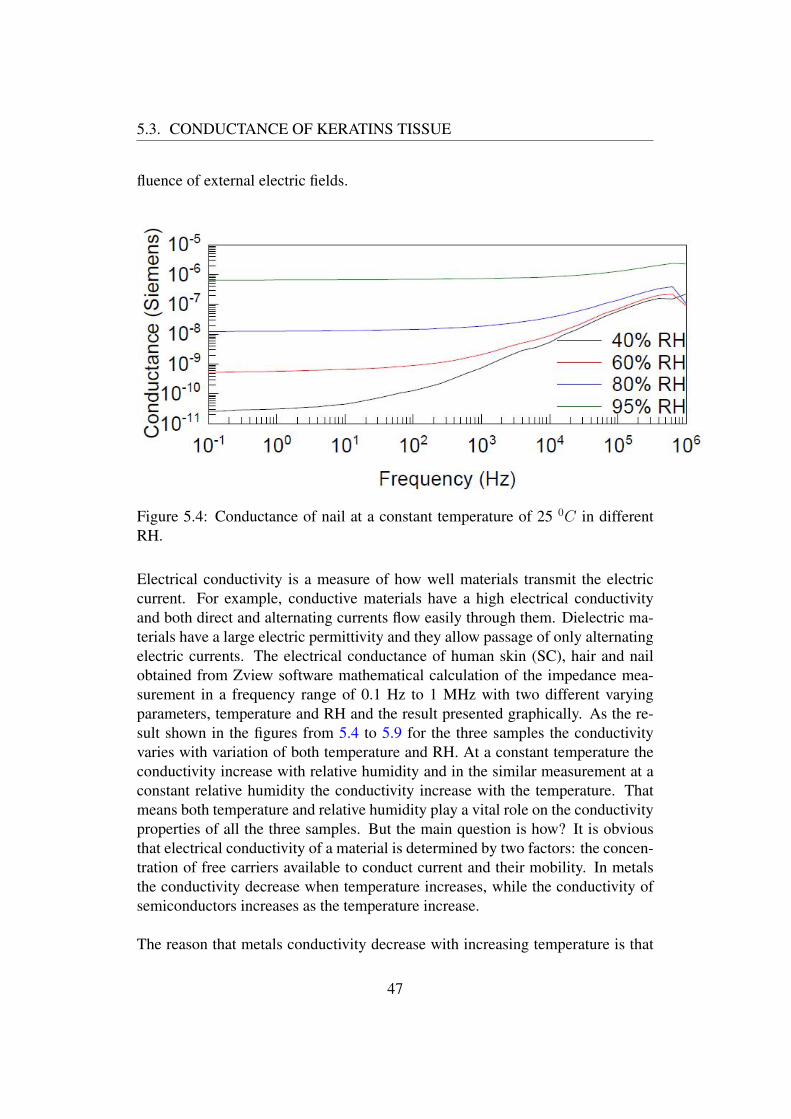
5.3. CONDUCTANCE OF KERATINS TISSUE
fluence of external electric fields.
Figure 5.4: Conductance of nail at a constant temperature of 25 0C in differentRH.
Electrical conductivity is a measure of how well materials transmit the electriccurrent. For example, conductive materials have a high electrical conductivityand both direct and alternating currents flow easily through them. Dielectric ma-terials have a large electric permittivity and they allow passage of only alternatingelectric currents. The electrical conductance of human skin (SC), hair and nailobtained from Zview software mathematical calculation of the impedance mea-surement in a frequency range of 0.1 Hz to 1 MHz with two different varyingparameters, temperature and RH and the result presented graphically. As the re-sult shown in the figures from 5.4 to 5.9 for the three samples the conductivityvaries with variation of both temperature and RH. At a constant temperature theconductivity increase with relative humidity and in the similar measurement at aconstant relative humidity the conductivity increase with the temperature. Thatmeans both temperature and relative humidity play a vital role on the conductivityproperties of all the three samples. But the main question is how? It is obviousthat electrical conductivity of a material is determined by two factors: the concen-tration of free carriers available to conduct current and their mobility. In metalsthe conductivity decrease when temperature increases, while the conductivity ofsemiconductors increases as the temperature increase.
The reason that metals conductivity decrease with increasing temperature is that
47
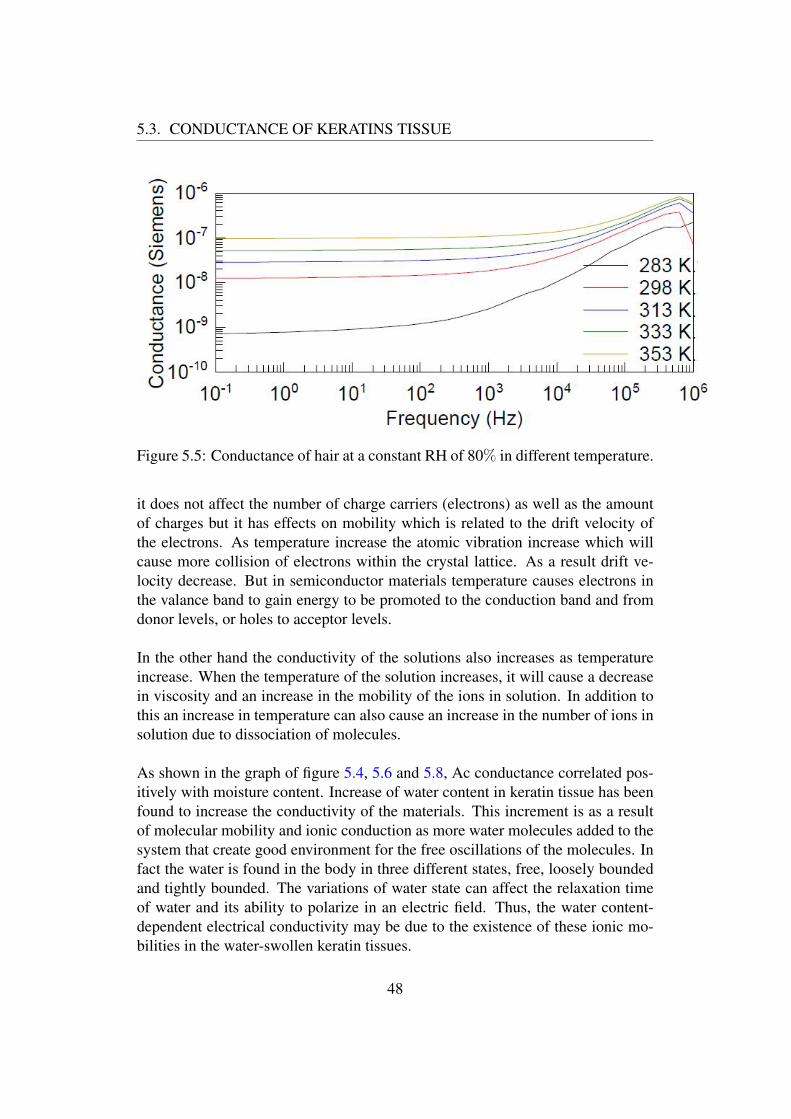
5.3. CONDUCTANCE OF KERATINS TISSUE
Figure 5.5: Conductance of hair at a constant RH of 80% in different temperature.
it does not affect the number of charge carriers (electrons) as well as the amountof charges but it has effects on mobility which is related to the drift velocity ofthe electrons. As temperature increase the atomic vibration increase which willcause more collision of electrons within the crystal lattice. As a result drift ve-locity decrease. But in semiconductor materials temperature causes electrons inthe valance band to gain energy to be promoted to the conduction band and fromdonor levels, or holes to acceptor levels.
In the other hand the conductivity of the solutions also increases as temperatureincrease. When the temperature of the solution increases, it will cause a decreasein viscosity and an increase in the mobility of the ions in solution. In addition tothis an increase in temperature can also cause an increase in the number of ions insolution due to dissociation of molecules.
As shown in the graph of figure 5.4, 5.6 and 5.8, Ac conductance correlated pos-itively with moisture content. Increase of water content in keratin tissue has beenfound to increase the conductivity of the materials. This increment is as a resultof molecular mobility and ionic conduction as more water molecules added to thesystem that create good environment for the free oscillations of the molecules. Infact the water is found in the body in three different states, free, loosely boundedand tightly bounded. The variations of water state can affect the relaxation timeof water and its ability to polarize in an electric field. Thus, the water content-dependent electrical conductivity may be due to the existence of these ionic mo-bilities in the water-swollen keratin tissues.
48
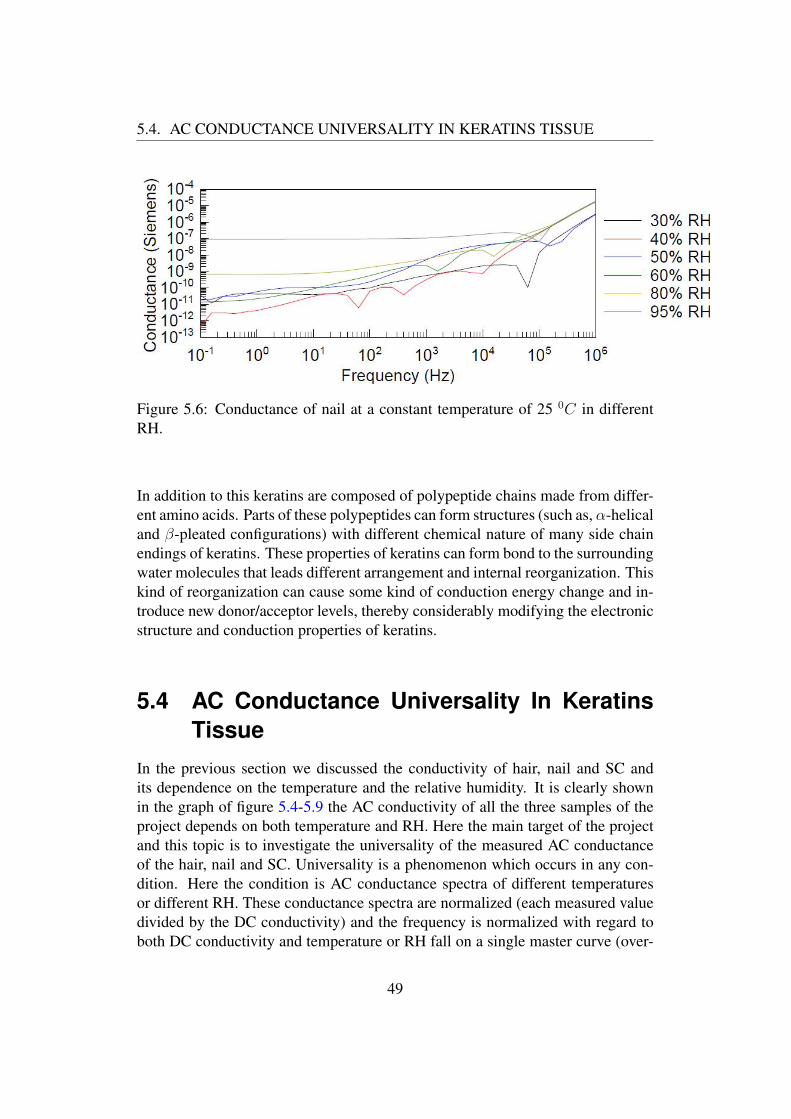
5.4. AC CONDUCTANCE UNIVERSALITY IN KERATINS TISSUE
Figure 5.6: Conductance of nail at a constant temperature of 25 0C in differentRH.
In addition to this keratins are composed of polypeptide chains made from differ-ent amino acids. Parts of these polypeptides can form structures (such as, α-helicaland β-pleated configurations) with different chemical nature of many side chainendings of keratins. These properties of keratins can form bond to the surroundingwater molecules that leads different arrangement and internal reorganization. Thiskind of reorganization can cause some kind of conduction energy change and in-troduce new donor/acceptor levels, thereby considerably modifying the electronicstructure and conduction properties of keratins.
5.4 AC Conductance Universality In KeratinsTissue
In the previous section we discussed the conductivity of hair, nail and SC andits dependence on the temperature and the relative humidity. It is clearly shownin the graph of figure 5.4-5.9 the AC conductivity of all the three samples of theproject depends on both temperature and RH. Here the main target of the projectand this topic is to investigate the universality of the measured AC conductanceof the hair, nail and SC. Universality is a phenomenon which occurs in any con-dition. Here the condition is AC conductance spectra of different temperaturesor different RH. These conductance spectra are normalized (each measured valuedivided by the DC conductivity) and the frequency is normalized with regard toboth DC conductivity and temperature or RH fall on a single master curve (over-
49
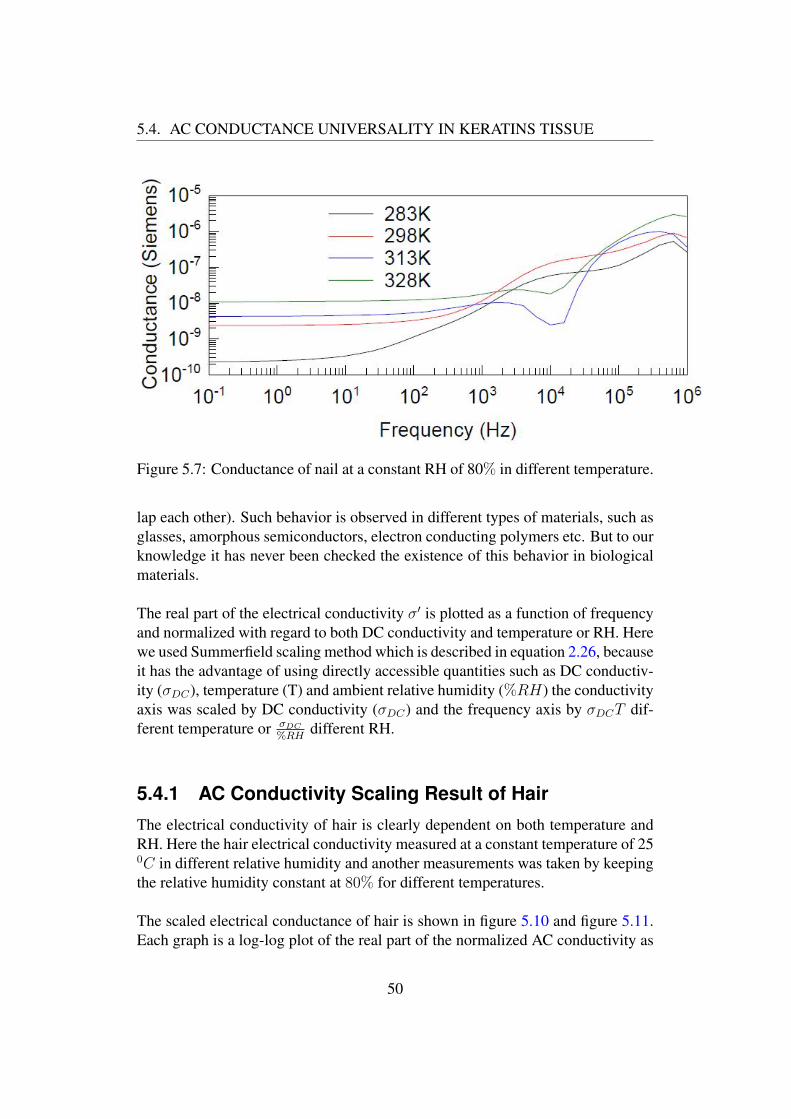
5.4. AC CONDUCTANCE UNIVERSALITY IN KERATINS TISSUE
Figure 5.7: Conductance of nail at a constant RH of 80% in different temperature.
lap each other). Such behavior is observed in different types of materials, such asglasses, amorphous semiconductors, electron conducting polymers etc. But to ourknowledge it has never been checked the existence of this behavior in biologicalmaterials.
The real part of the electrical conductivity σ′ is plotted as a function of frequencyand normalized with regard to both DC conductivity and temperature or RH. Herewe used Summerfield scaling method which is described in equation 2.26, becauseit has the advantage of using directly accessible quantities such as DC conductiv-ity (σDC), temperature (T) and ambient relative humidity (%RH) the conductivityaxis was scaled by DC conductivity (σDC) and the frequency axis by σDCT dif-ferent temperature or σDC
%RHdifferent RH.
5.4.1 AC Conductivity Scaling Result of HairThe electrical conductivity of hair is clearly dependent on both temperature andRH. Here the hair electrical conductivity measured at a constant temperature of 250C in different relative humidity and another measurements was taken by keepingthe relative humidity constant at 80% for different temperatures.
The scaled electrical conductance of hair is shown in figure 5.10 and figure 5.11.Each graph is a log-log plot of the real part of the normalized AC conductivity as
50
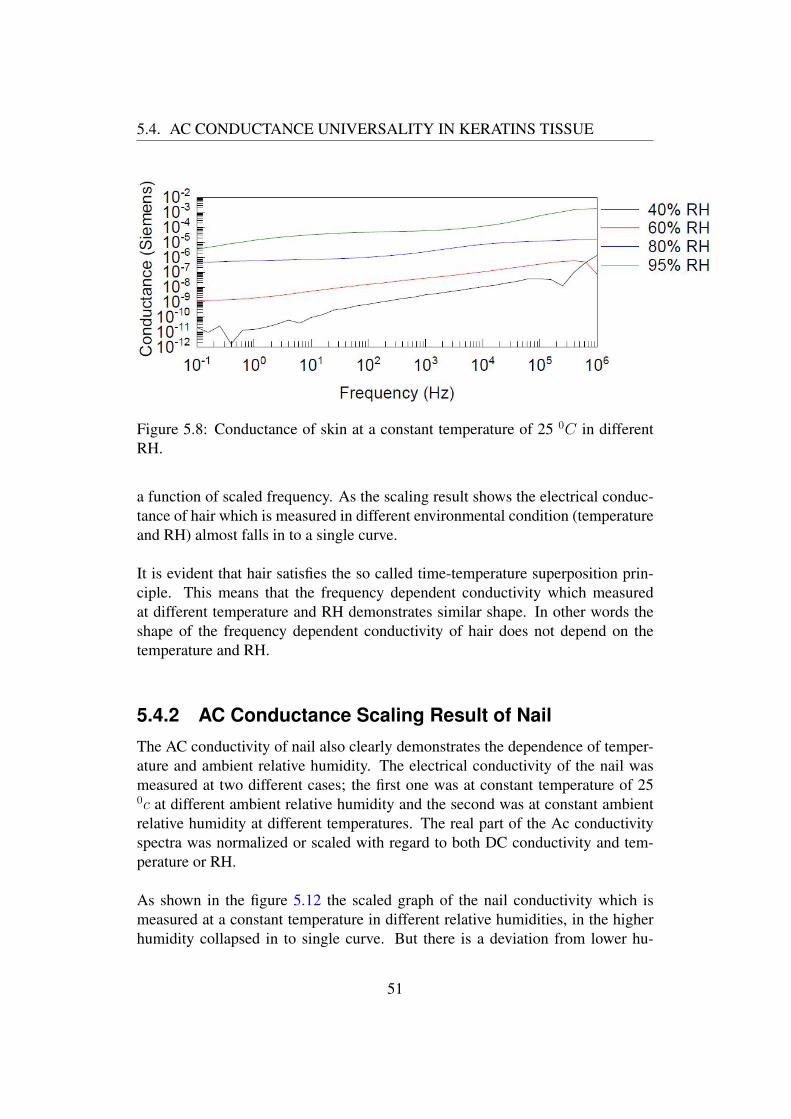
5.4. AC CONDUCTANCE UNIVERSALITY IN KERATINS TISSUE
Figure 5.8: Conductance of skin at a constant temperature of 25 0C in differentRH.
a function of scaled frequency. As the scaling result shows the electrical conduc-tance of hair which is measured in different environmental condition (temperatureand RH) almost falls in to a single curve.
It is evident that hair satisfies the so called time-temperature superposition prin-ciple. This means that the frequency dependent conductivity which measuredat different temperature and RH demonstrates similar shape. In other words theshape of the frequency dependent conductivity of hair does not depend on thetemperature and RH.
5.4.2 AC Conductance Scaling Result of NailThe AC conductivity of nail also clearly demonstrates the dependence of temper-ature and ambient relative humidity. The electrical conductivity of the nail wasmeasured at two different cases; the first one was at constant temperature of 250c at different ambient relative humidity and the second was at constant ambientrelative humidity at different temperatures. The real part of the Ac conductivityspectra was normalized or scaled with regard to both DC conductivity and tem-perature or RH.
As shown in the figure 5.12 the scaled graph of the nail conductivity which ismeasured at a constant temperature in different relative humidities, in the higherhumidity collapsed in to single curve. But there is a deviation from lower hu-
51
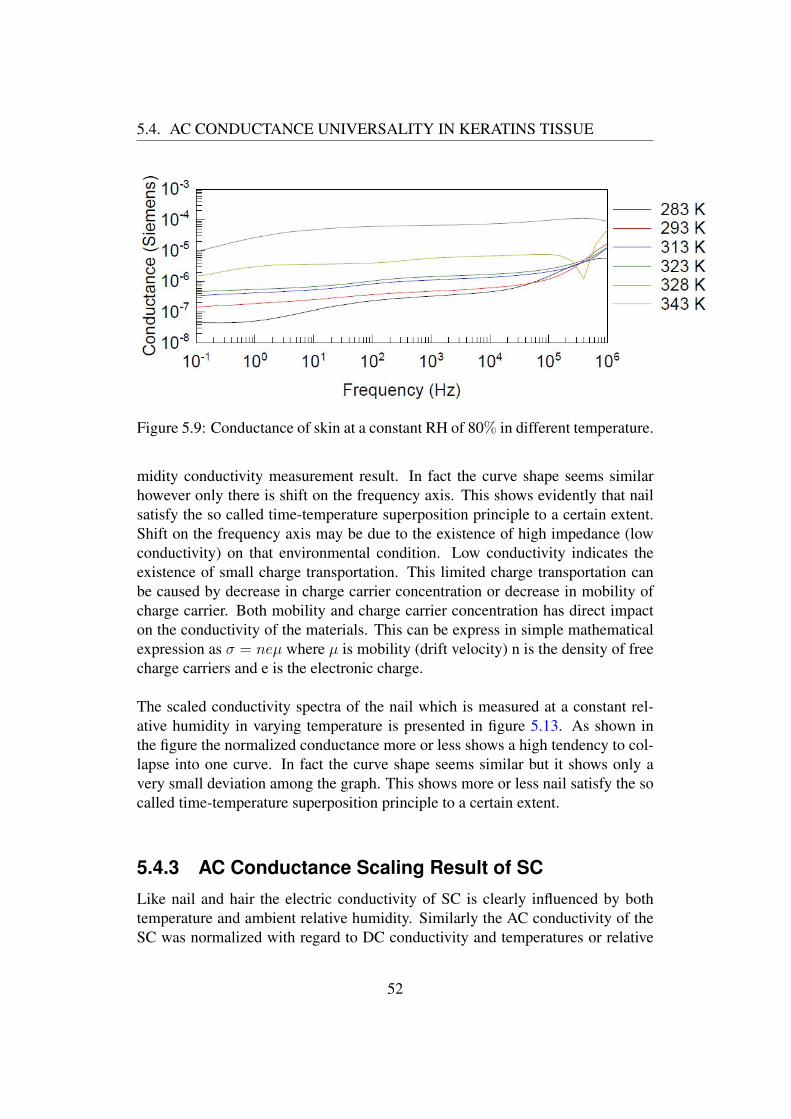
5.4. AC CONDUCTANCE UNIVERSALITY IN KERATINS TISSUE
Figure 5.9: Conductance of skin at a constant RH of 80% in different temperature.
midity conductivity measurement result. In fact the curve shape seems similarhowever only there is shift on the frequency axis. This shows evidently that nailsatisfy the so called time-temperature superposition principle to a certain extent.Shift on the frequency axis may be due to the existence of high impedance (lowconductivity) on that environmental condition. Low conductivity indicates theexistence of small charge transportation. This limited charge transportation canbe caused by decrease in charge carrier concentration or decrease in mobility ofcharge carrier. Both mobility and charge carrier concentration has direct impacton the conductivity of the materials. This can be express in simple mathematicalexpression as σ = neµ where µ is mobility (drift velocity) n is the density of freecharge carriers and e is the electronic charge.
The scaled conductivity spectra of the nail which is measured at a constant rel-ative humidity in varying temperature is presented in figure 5.13. As shown inthe figure the normalized conductance more or less shows a high tendency to col-lapse into one curve. In fact the curve shape seems similar but it shows only avery small deviation among the graph. This shows more or less nail satisfy the socalled time-temperature superposition principle to a certain extent.
5.4.3 AC Conductance Scaling Result of SCLike nail and hair the electric conductivity of SC is clearly influenced by bothtemperature and ambient relative humidity. Similarly the AC conductivity of theSC was normalized with regard to DC conductivity and temperatures or relative
52
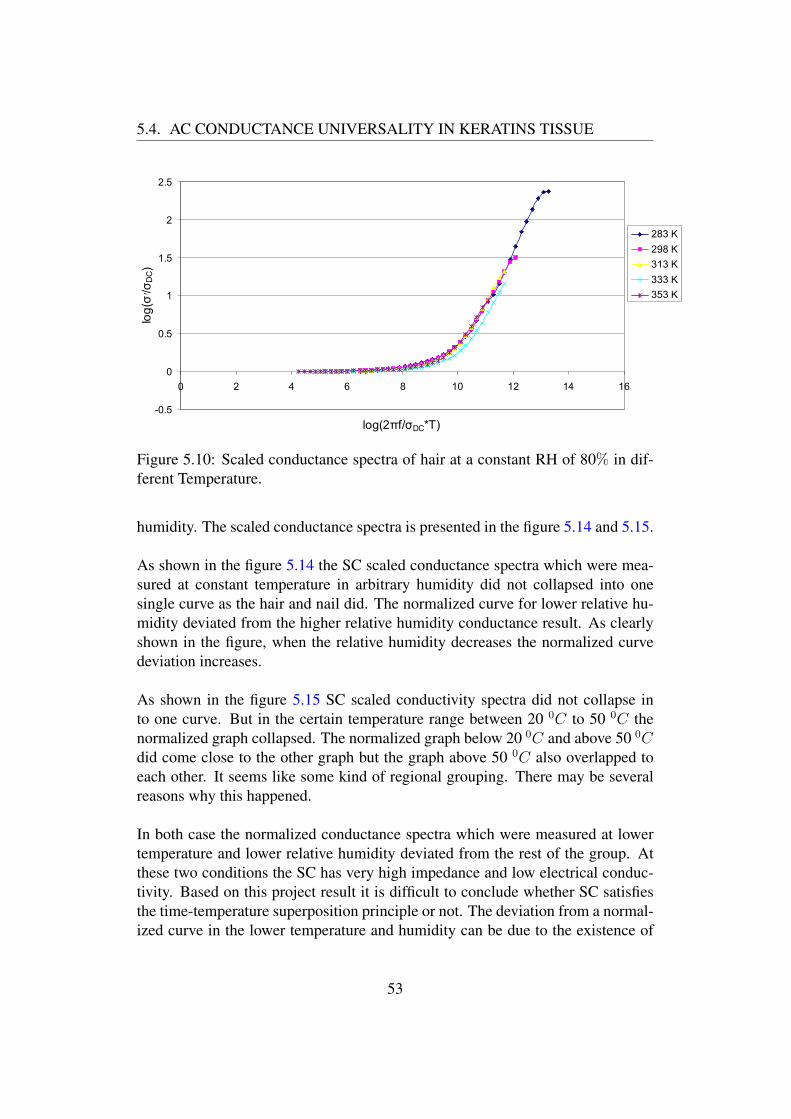
5.4. AC CONDUCTANCE UNIVERSALITY IN KERATINS TISSUEDifferent temp curve
-0.5
0
0.5
1
1.5
2
2.5
0 2 4 6 8 10 12 14 16
log(2πf/σDC*T)
log(σ σ/׳
DC)
283 K298 K313 K333 K353 K
Figure 5.10: Scaled conductance spectra of hair at a constant RH of 80% in dif-ferent Temperature.
humidity. The scaled conductance spectra is presented in the figure 5.14 and 5.15.
As shown in the figure 5.14 the SC scaled conductance spectra which were mea-sured at constant temperature in arbitrary humidity did not collapsed into onesingle curve as the hair and nail did. The normalized curve for lower relative hu-midity deviated from the higher relative humidity conductance result. As clearlyshown in the figure, when the relative humidity decreases the normalized curvedeviation increases.
As shown in the figure 5.15 SC scaled conductivity spectra did not collapse into one curve. But in the certain temperature range between 20 0C to 50 0C thenormalized graph collapsed. The normalized graph below 20 0C and above 50 0Cdid come close to the other graph but the graph above 50 0C also overlapped toeach other. It seems like some kind of regional grouping. There may be severalreasons why this happened.
In both case the normalized conductance spectra which were measured at lowertemperature and lower relative humidity deviated from the rest of the group. Atthese two conditions the SC has very high impedance and low electrical conduc-tivity. Based on this project result it is difficult to conclude whether SC satisfiesthe time-temperature superposition principle or not. The deviation from a normal-ized curve in the lower temperature and humidity can be due to the existence of
53
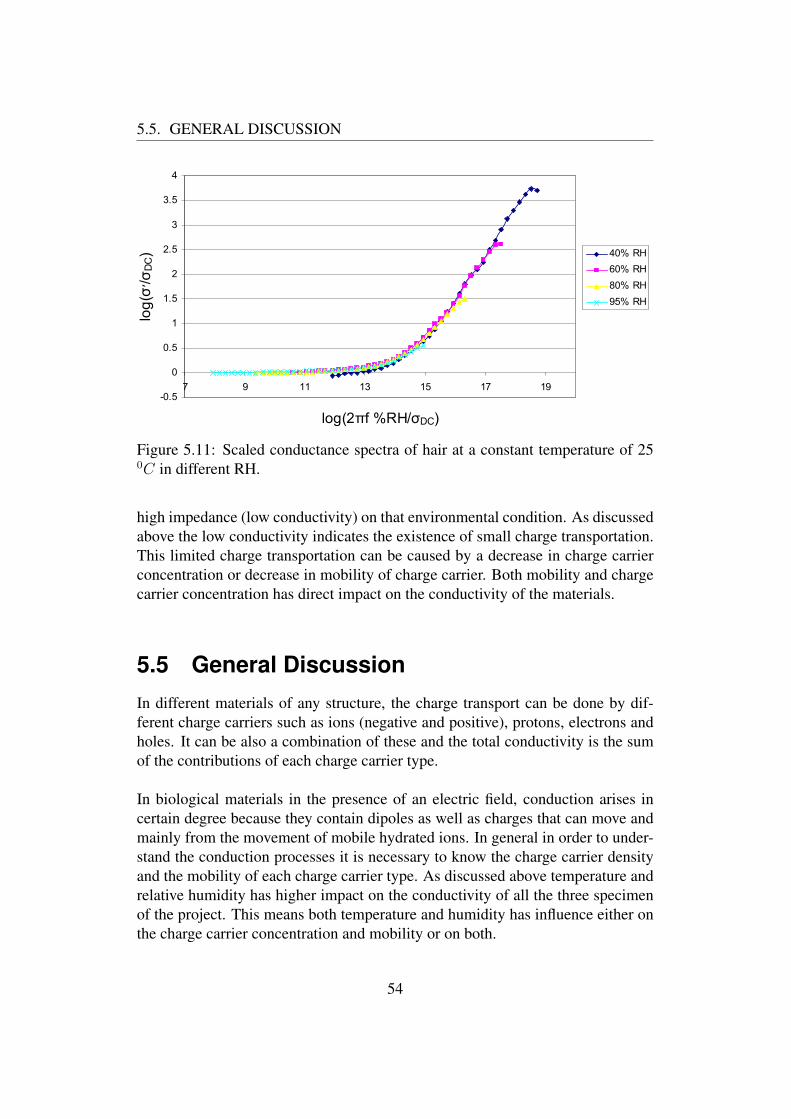
5.5. GENERAL DISCUSSION
-0.5
0
0.5
1
1.5
2
2.5
3
3.5
4
7 9 11 13 15 17 19
log(2πf %RH/σDC)
log(σσ/׳
DC) 40% RH
60% RH80% RH95% RH
Figure 5.11: Scaled conductance spectra of hair at a constant temperature of 250C in different RH.
high impedance (low conductivity) on that environmental condition. As discussedabove the low conductivity indicates the existence of small charge transportation.This limited charge transportation can be caused by a decrease in charge carrierconcentration or decrease in mobility of charge carrier. Both mobility and chargecarrier concentration has direct impact on the conductivity of the materials.
5.5 General DiscussionIn different materials of any structure, the charge transport can be done by dif-ferent charge carriers such as ions (negative and positive), protons, electrons andholes. It can be also a combination of these and the total conductivity is the sumof the contributions of each charge carrier type.
In biological materials in the presence of an electric field, conduction arises incertain degree because they contain dipoles as well as charges that can move andmainly from the movement of mobile hydrated ions. In general in order to under-stand the conduction processes it is necessary to know the charge carrier densityand the mobility of each charge carrier type. As discussed above temperature andrelative humidity has higher impact on the conductivity of all the three specimenof the project. This means both temperature and humidity has influence either onthe charge carrier concentration and mobility or on both.
54
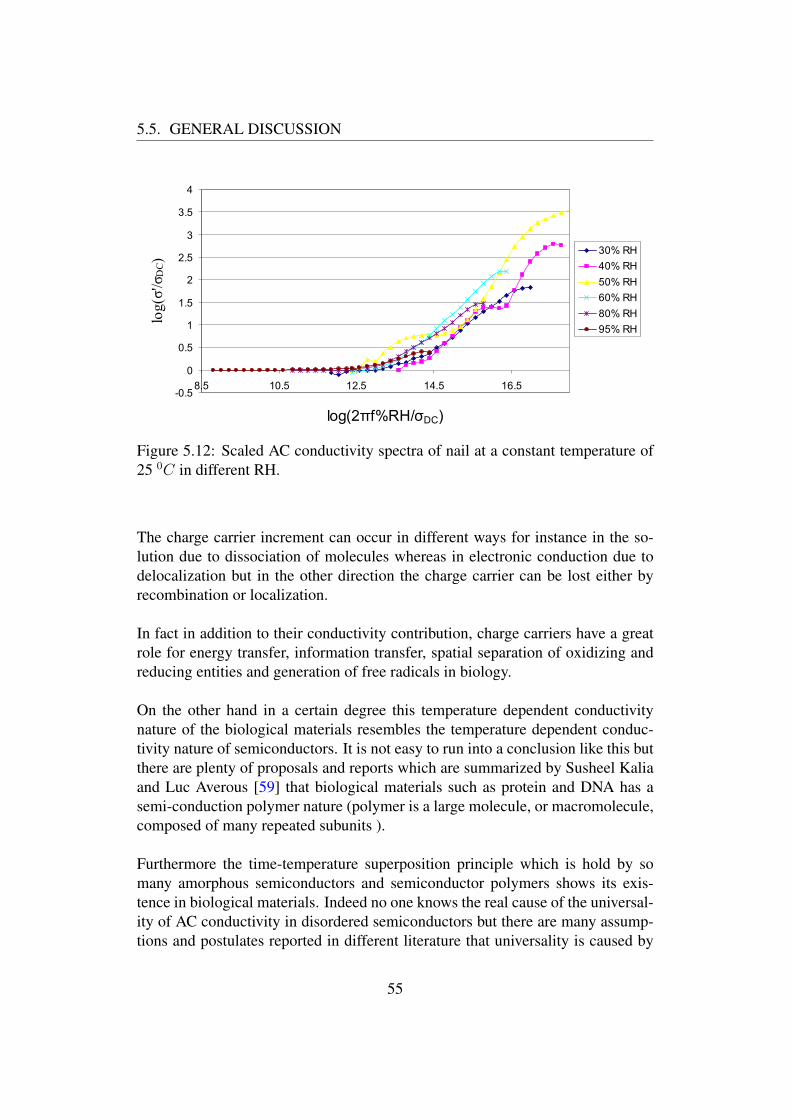
5.5. GENERAL DISCUSSION
nail
-0.5
0
0.5
1
1.5
2
2.5
3
3.5
4
8.5 10.5 12.5 14.5 16.5
log(2πf%RH/σDC)
log(σ'/σ
DC)
30% RH40% RH50% RH60% RH80% RH95% RH
Figure 5.12: Scaled AC conductivity spectra of nail at a constant temperature of25 0C in different RH.
The charge carrier increment can occur in different ways for instance in the so-lution due to dissociation of molecules whereas in electronic conduction due todelocalization but in the other direction the charge carrier can be lost either byrecombination or localization.
In fact in addition to their conductivity contribution, charge carriers have a greatrole for energy transfer, information transfer, spatial separation of oxidizing andreducing entities and generation of free radicals in biology.
On the other hand in a certain degree this temperature dependent conductivitynature of the biological materials resembles the temperature dependent conduc-tivity nature of semiconductors. It is not easy to run into a conclusion like this butthere are plenty of proposals and reports which are summarized by Susheel Kaliaand Luc Averous [59] that biological materials such as protein and DNA has asemi-conduction polymer nature (polymer is a large molecule, or macromolecule,composed of many repeated subunits ).
Furthermore the time-temperature superposition principle which is hold by somany amorphous semiconductors and semiconductor polymers shows its exis-tence in biological materials. Indeed no one knows the real cause of the universal-ity of AC conductivity in disordered semiconductors but there are many assump-tions and postulates reported in different literature that universality is caused by
55
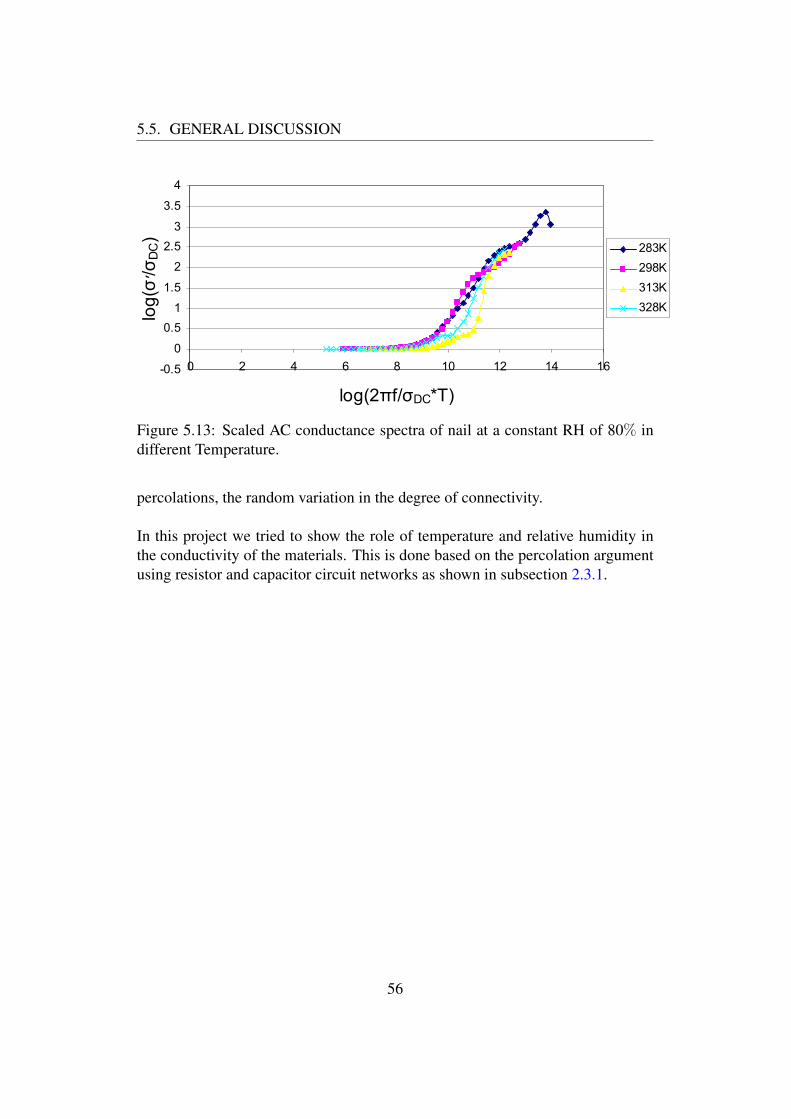
5.5. GENERAL DISCUSSIONNail at diff Temp
-0.5
0
0.51
1.5
2
2.53
3.5
4
0 2 4 6 8 10 12 14 16
log(2πf/σDC*T)
log(σ σ/׳
DC)
283K298K313K328K
Figure 5.13: Scaled AC conductance spectra of nail at a constant RH of 80% indifferent Temperature.
percolations, the random variation in the degree of connectivity.
In this project we tried to show the role of temperature and relative humidity inthe conductivity of the materials. This is done based on the percolation argumentusing resistor and capacitor circuit networks as shown in subsection 2.3.1.
56
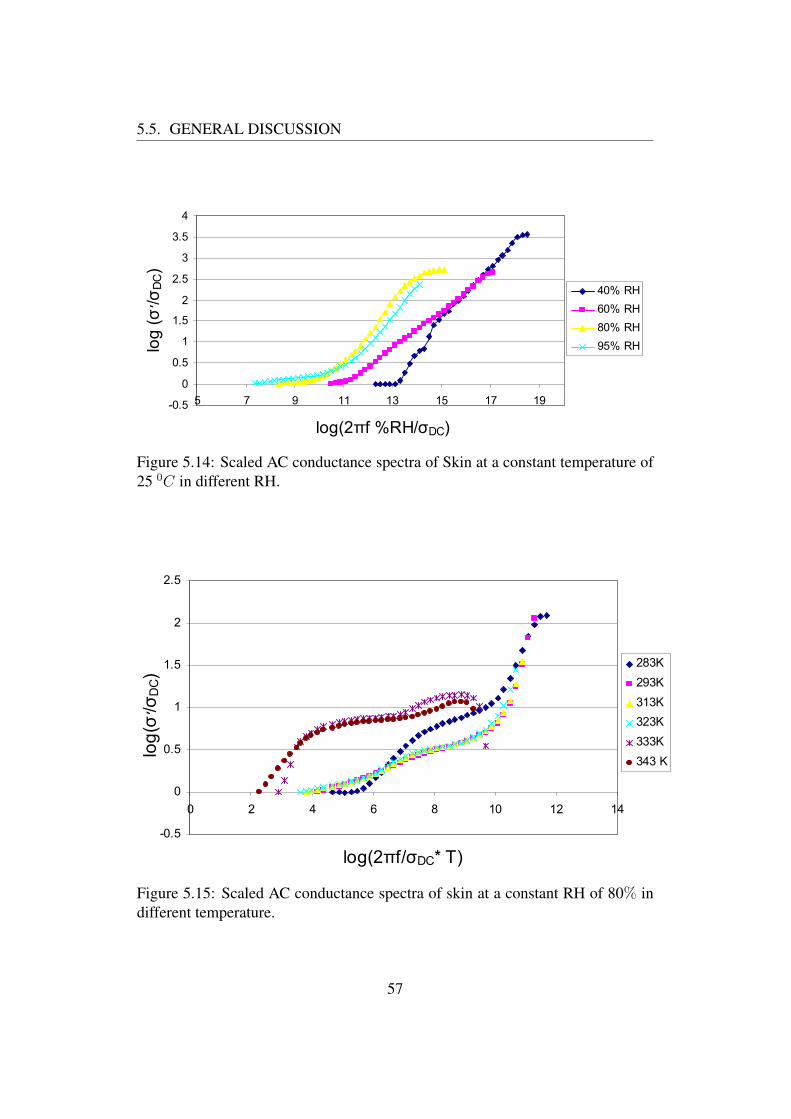
5.5. GENERAL DISCUSSION
skin diff RH
-0.5
0
0.5
1
1.5
2
2.5
3
3.5
4
5 7 9 11 13 15 17 19
log(2πf %RH/σDC)
log
(σσ/׳
DC)
40% RH60% RH80% RH95% RH
Figure 5.14: Scaled AC conductance spectra of Skin at a constant temperature of25 0C in different RH.
skin in all temp
-0.5
0
0.5
1
1.5
2
2.5
0 2 4 6 8 10 12 14
log(2πf/σDC* T)
log(σ σ/׳
DC)
283K293K313K323K333K343 K
Figure 5.15: Scaled AC conductance spectra of skin at a constant RH of 80% indifferent temperature.
57
Chapter 6
Conclusion
6.1 ConclusionTemperature and percentage of relative humidity has a pronounced effect on theelectric properties of keratinazed tissues. Impedance shows inverse relation withboth temperature and humidity whereas conductance shows direct relation. Forall the three samples the conductance in the lower frequency (from 0.1 Hz to 10KHz) and higher humidity (above 60%) is dominated by DC conductivity be-cause the conductance is almost independent of frequency. On the other hand athigh humidity and lower frequency (From 0.1 Hz to 1 KHz) the impedance exhibitfrequency independence, that means at this situation the impedance is dominatedby resistance of the resistor.
Hair and nail shows sign of the existence of universality of AC conductance. butin Stratum corneum it is hard to draw any conclusion whether this property existor not. It needs further investigation.
The cause of this universality is still unclear even for the keratiiazed tissue. Elec-trical conductivity is sensitive to any change in chemical composition, structure ofstudy material. Therefore, in order to know the exact cause of universality in ACconductance of biological materials especially on hair and nail it needs detailedmicroscopic studies. That means one has to know and understand what happenedto the physical structure and chemical compositions of the materials due to thechange of both temperature and humidity, and the mechanism and the path of thecharge from one end to the other.
Finally precision is estimated by making repeated measurements on a sample un-der specified conditions. Repeated impedance measurements on the same sam-
58
6.2. FUTURE WORK
ples had been done more than one at different parameters (Conditions). The resultshows very small minor differences between the two measurements. This showsthe result is reproducible and reliable.
6.2 Future WorkThis section includes the possible improvements that could be implemented in or-der to make theory more powerful and more complete. In our work we limit themeasurement and in two certain condition, at constant temperature for differentrelative humidity and vise verse. There are some interesting conditions that haveto be considered in the future work. Since relative humidity is dependent on thetemperature, it would be an idea to make the over all impedance and conductancemeasurement at constant water content instead of relative humidity. It could bepossible to see the actual relation between the water content and the electricalproperties of the materials. The water content value could vary depending on theneeds.
Furthermore in future investigations it would be feasible to add a new temperaturerange (down to zero and above 60 0C ) to perform a large temperature range ACconductance universality check of the electrical properties of biological materials.
59
Bibliography
[1] J. C. Dyre and T. B. Schroder. Universality of ac conduction in disorderedsolids. The American Physical Society, 72:873–893., 2000.
[2] A. K. Jonscher. Universal relaxation law. Chelsea Dielectrics Press, Lon-don, 1996.
[3] S. Murugavel and M. Upadhyayr. A.c. conduction in amorphous semicon-ductors. Journal of the Indian Institute of Science, 91:2:303–317, 2011.
[4] R. Pethig and D. B. Kell. The passive electrical properties of biological sys-tems: their significance in physiology, biophysics and biotechnology. Phys.Med. Biol, 32:8,933–970., 1987.
[5] S. Grimnes, Ø. G. Martinsen, and H. P. Schwan. Interface phenomena anddielectric properties of biological tissue. Marcel Dekker, Inc, 2643-2652,2002.
[6] S. Grimnes and Ø. G. Martinsen. Bioimpedance and Bioelectricity ba-sics(2nd Editon). Elsevier, 2008.
[7] S. Baranovski. Charge Transport in Disordered Solids with Applications inElectronics. Wiley, 2006.
[8] K. Chi Kao. Dielectric phenomena in solids. Elsevier Academic Press, 2004.
[9] S. Gabriel, R. W. Lau, and C. Gabriel. The dielectric properties of biologicaltissues: Ii. measurements in the frequency range 10 hz to 20 ghz. Phys. Med.Biol, 41:2251, 1996.
[10] S. Gabriel, R. W. Lau, and C. Gabriel. The dielectric properties of biologicaltissues: Iii.parametric models for the dielectric spectrum of tissues. Phys.Med. Biol, 41:2271–2293, 1996.
[11] C. J. Bottcher. Theory of electric polarization(2nd Editon). Elsevier, 1993.
60
BIBLIOGRAPHY
[12] C. Gabriel, S. Gabriel, and E. Corthout. The dielectric properties of biolog-ical tissues: I. literature survey. Phys. Med. Biol, 41:2231–2249, 1996.
[13] D. Miklav, N. Pavelj, and F. X. Hart. Electric properties of tissues. JohnWiley and Sons, Inc., 2006.
[14] A. Peyman, S. Holden, and C. Gebriel. Dielectric properties of tissue at amicrowave frequencies. MTHR, 54(16):453–474, 2009.
[15] C. Gabriel, A. Peyman, and E. H. Grant. Electrical conductivity of tissue atfrequencies below 1 mhz. Phys. Med. Biol, EI-19 No.5,:4863–78, 2009.
[16] R. Pethig. Dielectric properties of biological materials biophysical and med-ical application. IEEE, EI-19 No.5,:453–474, 1984.
[17] Ø. G. Martinsen and S. Grimnes. Dielectric properties of some keratinisedtissues. part 1: Stratum corneum and nail in situ. Med Biol Eng Comput,35:177–180, 1997.
[18] Ø. G. Martinsen, S. Grimnes, and E. Haug. Measuring depth depends onfrequency in electrical skin impedance measurements. Skin Research andTechnology, 5(3):179–181, 1999.
[19] T. Yamamoto and Y. Yamarnoto. Analysis for the change of skin impedance.Med. Biol. Eng. Comput, 15:219–227, 1977.
[20] T. Yamamoto and Y. Yamarnoto. Electrical properties of the epidermal stra-tum corneum. Med. Biol. Eng, pages 151–158, 1976.
[21] Ø. G. Martinsen, S. Grimnes, and E. S. Kongshaug. Dielectric propertiesof some keratinised tissues. part 2: Human hair. Med Biol Eng Comput,35:172–176., 1997.
[22] C. Kittel. Introduction to solid state physics (8th Editon). John Wiley andSons, Inc, 2004.
[23] J. Zhang and D. L. Sidebottom. Modeling the ac conductivity dispersion ofmixed alkali germanate glasses. Non-Crystalline Solids, 288:18–29, 2001.
[24] C. Polk. Handbook of Biological Effects of Electromagnetic fields(2nd Edi-ton). CRCPress, 1986.
[25] S. V. Novikov. Charge carrier transport in disordered polymers.arXiv:1303.4910, 2013.
61
BIBLIOGRAPHY
[26] S. Baranovski. Charge Transport in Disordered Solids with Applications inElectronics(2nd Editon). John Wiley and Sons, Ltd, 2006.
[27] N. Tessler, Y. Preezant, N. Rappaport, and Y. Roichman. Charge transport indisordered organic materials and its relevance to thin-film devices: A tutorialreview. WILEY and Weinheim, 21:2741–2761, 2009.
[28] A. K. Jonscher. Dielectric relaxation in solids, review articles. Appl. Phys,32:R57–R70, 1999.
[29] Y. Feldman, A. Puzenko, and Y. Ryabov. Non-debye dielectric relaxation incomplex materials. Chemical Physics, 284:139–168, 2002.
[30] A. Tarasov and K. Titov. Dielectric relaxation in solids, review articles.Geophys. J. Int., 195:352–356, 2013.
[31] L. A. Geddes and E. L. Baker. The specific resistance of biological material-a compendium of data for the biomedical engineer and the physiologist. MedBiol Eng, 5:271–93, 1967.
[32] R. Pethig. Dielectric properties of body tissues. Clin Phys Physiol Meas,8:Suppl A:5–12, 1987.
[33] H. P. Schwan. Electrical properties of tissues and cell suspensions: Advancesin biological and medical physics. PubMed, 5:147–209, 1957.
[34] C. Gabriel, A. Peyman, and E. H. Grant. Electrical conductivity of tissue atfrequencies below 1 mhz. Phys. Med. Biol, 54:4863–4878, 2009.
[35] J. Fluhr, P. Elsner, E. Berardesca, and H. I. Maibach. Bioenginnering of theWater and the Stratum Corneum(2nd Editon). CRC PRESS, 2005.
[36] Ø. G. Martinsen, S. Grimnes, and S. H. Nilsen. Water sorption and electricalproperties of a human nail. Skin Research and Technology, 14:142–146,2008.
[37] Martinsen Ø. G., Grimnes S., Nilson J. K., Tronstad C., Jang W., HongsigK., Kunsoo S., Naderi M., and Thielmann F. Gravimetric method for in vitrocalibration of skin hydration measurements. Biomedical Engineering, IEEE,55(2):728–732, 2008.
[38] S. D. Campbell, K. K. Kraning, E. G. Schibli, and S. T. Momii. Hydrationcharacterstics and electrical resistivity of stratum corneum using a nonein-vesive four-point microelectronic method. Journal of Investigative Derma-tology, 69:290–295, 1977.
62
BIBLIOGRAPHY
[39] T. B. Schroder and J. C. Dyre. Scaling and universality of ac conduction indisordered solids. Physical review letters, 84 (2):310–313, 2013.
[40] R. Murugaraj. Ac conductivity and its scaling behavior in borate and bis-muthate glasses. J Mater Sci, 42:10065–10073, 2007.
[41] D. L. Sidebottom, P. F. Green, and R. K. Brow. Scaling behavior in theconductivity of alkali oxide glasses, polymers, and doped crystals. Journalof non-crystalline solids, 203:300–305, 1996.
[42] D. L. Sidebottom. Influence of cation constriction on the ac conductivitydispersion in metaphosphate glasses. Physical Review B, 61:14507, 2000.
[43] B. Roling, A. Happe, K. Funke, and M. D. Ingram. Carrier concentrationsand relaxation spectroscopy: New information from scaling properties ofconductivity spectra in ionically conducting glasses. Physical review letters,78 (11):2160(4), 1997.
[44] D. L. Sidebottom. Universal approach for scaling the ac conductivity in ionicglasses. Physical review letters, 82 (18):3653, 1997.
[45] D. L. Sidebottom and J. Zhang. Scaling of the ac permittivity in ion-conducting glasses. Physical review B, 62 (9):5503, 2000.
[46] B. Berkowitz and R. P. Ewing. Percolation theory and network modelingapplications in soil physics. Surveys in Geophysics, 19 (1):23–72, 2000.
[47] B. J. Last and D. J. Thouless. Percolation theory and electrical conductivitys.Physical review letters, 27 (25):1719–1722, 1971.
[48] S. Panteny, R. Stevens, and C. R. Bowent. Frequency dependent permittivityand ac conductivity of random electrical networks. Taylor & Francis Inc,315:199–208, 2005.
[49] J. P. Bentley. Principle of measurement systems (4th Editon). Pearson Edu-cation Limited, 2005.
[50] A. Amir. Universal frequency dependent conduction of electron glasses.EPL, 107:47011, 2014.
[51] B. I. Shklovskii and A. L. Efros. Electronic properties of doped semicon-ductors, springer series in solid state sciences 45. Springer-Verlag, 1984.
[52] H. Bottger and V. Bryksin. Hoping conduction in solids. Akadamic Verlag,1985.
63

BIBLIOGRAPHY
[53] E. Barsoukov and J. Ross Macdonald. Impedance spectroscopy: Theory,Experiment, and Applications. WILEY, 2005.
[54] K. Kalyanasundaram (J. Bisquert and F. Fabregat-Santiago). Dye-sensitizedsolar cells. EPLS Press, 2010.
[55] Zoher Z. Karu. Signals and systems made ridiculously simple. ZiZi Press,1995.
[56] J. Ross Macdonald. Impedance spectroscopy. Annals of Biomedical Engi-neering, 20 (3):289–305, 1992.
[57] G. K. Johnsen, Ø. G. Martinsen, and S. Grimnes. Sorption studies of humankeratinized tissues. Journal of Physics conference series, 224:012094, 2010.
[58] M. Gniadeka, O. Faurskove, D. H. Chrstensen, and H. C. Wulf. Stracture ofwater, proteins and lipid in intact human skin, hair and nail. The sociaty forinvestigation dermatology Inc, 393-398, 1998.
[59] S. Kalia and L. Avorous. Biopolymers: Biomedical and environmental ap-plications. Scrivener Publishing, 2011.
64