universidad!san!francisco!de!quito!usfq!repositorio.usfq.edu.ec/bitstream/23000/4888/1/120740.pdf ·...
TRANSCRIPT
UNIVERSIDAD SAN FRANCISCO DE QUITO USFQ
Colegio de Ciencias e Ingeniería
Detección y Reconocimiento de Guiños Basado en Análisis EEG Utilizando Redes Neuronales.
Proyecto de Investigación .
Adrián Santiago Silva Guerrero Sebastián Israel Toscano Andrade
Ingeniería Electrónica
Trabajo de titulación presentado como requisito para la obtención del título de
Ingeniero Electrónico
Quito, 23 de julio de 2015

2
UNIVERSIDAD SAN FRANCISCO DE QUITO USFQ
COLEGIO DE CIENCIAS E INGENIERÍA
HOJA DE CALIFICACIÓN DE TRABAJO DE TITULACIÓN
Detección y Reconocimiento de Guiños Basado en Análisis EEG Utilizando Redes Neuronales.
Adrián Santiago Silva Guerrero
Sebastián Israel Toscano Andrade
Calificación:
Nombre del profesor, Título académico Ing. René Játiva , DEA
Firma del profesor
Quito, 23 de julio de 2015.

3
Derechos de Autor
Por medio del presente documento certifico que he leído todas las Políticas y Manuales de la
Universidad San Francisco de Quito USFQ, incluyendo la Política de Propiedad Intelectual USFQ, y estoy de
acuerdo con su contenido, por lo que los derechos de propiedad intelectual del presente trabajo quedan sujetos a
lo dispuesto en esas Políticas.
Asimismo, autorizo a la USFQ para que realice la digitalización y publicación de este trabajo en el
repositorio virtual, de conformidad a lo dispuesto en el Art. 144 de la Ley Orgánica de Educación Superior.
Firma del estudiante: _______________________________________ Nombres y apellidos: Sebastián Israel Toscano Andrade Código: 00104018 Cédula de Identidad: 172113965-5 Firma del estudiante: _______________________________________ Nombres y apellidos: Adrián Santiago Silva Guerrero Código: 00104780 Cédula de Identidad: 171816015-1 Lugar y fecha: Quito, julio de 2015
4
Detection and Classification of Eyewinks based on EEG Analysis using Artificial Neural Networks
Sebastian Toscano, Adrian Silva, Diego Benitez Universidad San Francisco de Quito USFQ
Colegio de Ciencias e Ingenierías “El Politécnico” Campus Cumbayá, Casilla Postal 17-1200-841
Quito, Ecuador {sebastian.toscanoa, adriansil92}@gmail.com, [email protected]
Abstract— This paper proposes an automatic eyewink interpretation system based on EEG signal analysis for human-machine interface to benefit people with disabilities. Our system investigates the use of the Emotiv EPOC as a relatively low cost new method for acquiring EEG signals and the implementation of Artificial Neural Networks (ANN) for the classification algorithm. The proposed algorithm has been found effective in detecting and classifying the eyewinks that then can be translated to valid command for human-machine interface. The performance of the proposed approach is investigated using two types of ANN topologies, and the results obtained indicate a high rate of classification accuracy.
Keywords—EEG; Eyewink detection; Brain Computer Interface, Neural network classification
I. INTRODUCTION Brain computer interface (BCI) refer to a type of system
that combines electroencephalographic activity (EEG) measuring technology with computational development in order to convert brain activity into tangible applications. In the past, the interest on the design of BCIs was mainly focused in medical applications. However, due to the increasing desire of scientists and engineers to develop new technologies, nowadays it is also possible to find BCIs in applications such as videogames, manipulation of small vehicles, among others. For example, a related work describing how a BCI can be used to control a drone for assistance of the handicapped can be found in [1]. Other example is presented in [2] where the possible application of BCIs in the development of brain-controlled avatars for videogame users is discussed. Certainly, there is a vast range of possibilities for employing BCIs and therefore the main motivation on developing this project was to explore the use of low cost portable EEG devices for this porpoise and to also understand the behavior of a BCI.
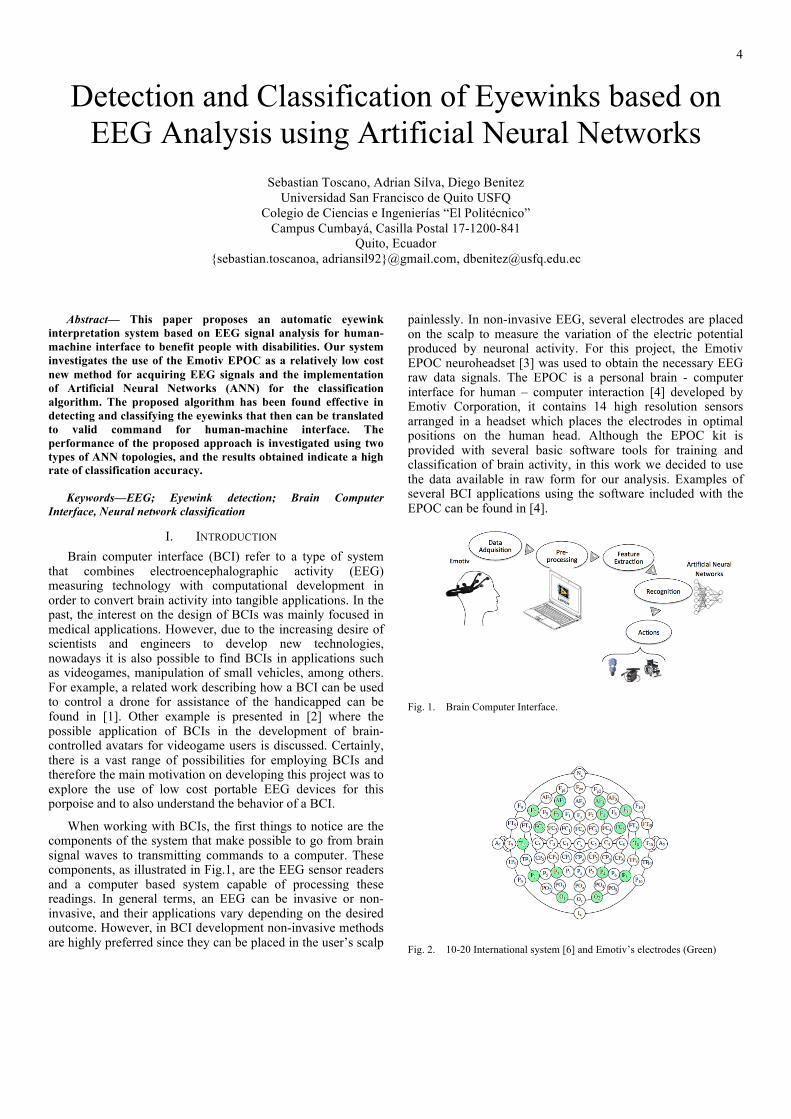
When working with BCIs, the first things to notice are the components of the system that make possible to go from brain signal waves to transmitting commands to a computer. These components, as illustrated in Fig.1, are the EEG sensor readers and a computer based system capable of processing these readings. In general terms, an EEG can be invasive or non-invasive, and their applications vary depending on the desired outcome. However, in BCI development non-invasive methods are highly preferred since they can be placed in the user’s scalp
painlessly. In non-invasive EEG, several electrodes are placed on the scalp to measure the variation of the electric potential produced by neuronal activity. For this project, the Emotiv EPOC neuroheadset [3] was used to obtain the necessary EEG raw data signals. The EPOC is a personal brain - computer interface for human – computer interaction [4] developed by Emotiv Corporation, it contains 14 high resolution sensors arranged in a headset which places the electrodes in optimal positions on the human head. Although the EPOC kit is provided with several basic software tools for training and classification of brain activity, in this work we decided to use the data available in raw form for our analysis. Examples of several BCI applications using the software included with the EPOC can be found in [4].
Fig. 1. Brain Computer Interface.
Fig. 2. 10-20 International system [6] and Emotiv’s electrodes (Green)

5
The aim of this project was to develop a prototype BCI interface based on LabVIEW capable of acquiring, analyzing, processing and finding appropriate classification parameters related to the brain activity during eyewinks that can be interpreted as simple direction or control commands.
A. EEG Emotiv EPOC neuroheadset The neuroheadset EPOC is an EEG device that benefits
from the ability of the nervous tissue to generate quantifiable electric potentials to measure brain activities. The electrodes are metallic with a plastic base and are located on the scalp to measure brain activity. The electrodes must be wet with a few drops of a saline conductive solution to increase conductivity and to improve their performance.
The headset is equipped with a total of 14 electrodes for measuring plus two other electrodes that work as reference points. The electrodes are located on the scalp as suggested by the international system 10-20 [6] as shown in Fig. 2. The positions are labeled as AF3, F7, F3, FC5, T7, P7, O1, O2, P8, T8, FC6, F4, F8, and AF4 using the Common Mode Sense (CMS) active electrode and the Driven Right Leg (DRL) passive electrode as references (P3 and P4). In addition, the neuroheadset incorporates a signal amplifier, a C-R high-pass filter at 0.16Hz, an analog low-pass filter at 85Hz, a notch filter at 50Hz to neutralize the high frequency noise as well as the noise introduced by the electric grid and a simple Analog to Digital Converter at 128 samples per second to enable a sequential sampling. These features allow EPOC to quantify brain signals and represent them in different channels, as illustrated in Fig. 3.
B. Frecuency ranges The signals measured from an EEG can be categorized
within five frequency ranges that are related to different brain activity. Gamma waves range from 31Hz and up, Beta waves from 12 to 30Hz, Alpha waves from 7.5Hz to 12Hz, Theta waves from 3.5Hz to 7.5Hz and Delta waves from 0.5Hz to 3.5Hz [7].
C. Artificial Neural Networks In this work, Artificial Neural Networks (ANN) were used
for identification and subsequently classification of the brain signals produced by eyewinks. Inspired by biological neurons, numerous artificial neurons can be interconnected, like biological neurons in the brain, to form a one-layer neural architecture capable of solving approximation, estimation and pattern recognition problems [5]. In pattern recognition, is common to find architectures where the output of a single-layer network is used as an input for other single-layer network, forming what is known as a multilayer network, as shown in Fig. 4.
Multilayer networks are highly used in patter recognition problems since they can be trained to produce a desired output t from a given input p. The methods to train the network, as well as the number of layers, vary depending on the dimensions of the problem. However, a two-layer network should be able to solve most of the pattern recognition problems [5].
II. METHODOLOGY As mentioned, the raw EEG signals were acquired with the
neuroheadset EPOC to be processed. On the other hand, the preprocessing, processing, training and recognition were implemented on a LabVIEW based interface. Even thought EPOC comes with original software, the main goal of the project was achieved without using Emotiv’s test bench software. However, the API library from Emotiv was used to program the reception of signals on the interface.
A. EEG Patter Recognition: Parameter Definition and Data Delimitation The first step was to determine the features that would
work as inputs to the system. As described before, brain waves can be categorized into five groups depending on their location on the power spectrum. For this reason, it was determined that the EEG signals should be processed in the frequency domain as well. Here, the power spectrum of recorded EEG signals with approximately 1.5 seconds was calculated to obtain the parameters needed. However, before the power spectrum was computed some pre-processing was required. This process will be explained in the upcoming section.
After the preprocessing, the power spectrum of the signals was divided into five categories characterized by the frequency ranges of Gamma, Beta, Alpha, Theta and Delta. Later, the average was obtained for every range and turned into a single input vector p with five entries per channel.
Fig. 3. Selected channels of EEG adquiered by the Emotiv EPOC as shown in LabView interface
Fig. 4. Multilayer Network

6
In EEG signals, eyewink related activity show peaks in the signal that are significantly higher than those related to other brain activity [8].
For this reason the output vectors t were defined as three different events i.e. Left, Right and Neutral. Where a Left event is characterized by a wink with the left eye, and similarly a Right event is characterized by a wink with the right eye. On the other hand, the Neutral event is produced when neither of the two events occurs, which allowed blinking and the absence of winks to be considered as neutral. Vectors of three entries were defined as the output events, described as follows:
Left = [1 1 1], Right =[-1 -1 -1], Neutro = [-1 1 -1]
Initially the input vector contained five entries for every channel. However, after monitoring the brain activity when performing the events to be recognized, it was noticed that the average of the Gamma range was not representative; therefore it was decided to leave the input vectors with only four entries per channel corresponding to Beta, Alpha, Theta and Delta, waves respectively. Additionally, it was observed that not every channel presented high activity during the testing of events, consequently only the channels that showed the highest activity were selected, corresponding to AF3, AF4, F7, F8, T7 and T8 channels. Finally, the input vector was determined to have twenty-four features (six channels with four frequency ranges) with a three-entry vector as output vector.
B. Data Acquisition and Features Extraction Since most of the pre-processing of the signal is done
inside the neuroheadset and cannot be altered, the LabVIEW pre-processing mainly involved removing the DC offset, windowing and zero padding. During data acquisition the signals were sent from the EPOC headset into the BCI and tested for the desired events. Fig. 5 shows a sample of left wink followed by a right wink. Here, it can also be noticed that not all channels showed important activity as discussed in the last section.
In order to extract the four entries necessaries per channel in real time, a Hamming window was applied to the signals. This window was selected so the processing was focused mainly around the peaks rather that at the borders. Along with the Hamming window, the zero padding technic was used to increase the density of points on the sample, adding as many zeros as needed so the number of points on the sample reaches the closest power of 2, in this case the number of zeros needed varied since the size of the entry is not constant. Once this two technics were implemented, the power spectrum density was extracted from the signals.
Finally, the power spectrum was divided into the four frequency ranges that were mentioned earlier, obtaining the input vector p needed to train the network.
Fig. 5. Sample EEG waveforms of Left eyewink event followed by a Right eyewink event.
C. Network Arcitecture
As previosuly mentioned a two layer network should be able to solve most of the pattern recognition problems. However, along with the multilayer network, a single three perceptron network was also designed and tested, with the aim of studying the performance of both networks for solving this classificaton problem The results obtained are presented in the Discussion section. The single-layer perceptron network is quite simple, since the weights are updated using the supervised learning rule as training method. In this method, the input vector p is multiplied with the weight vector W to obtain an output a. Later, a is compared with the desired vector t to determine the nature of the event. Here, if the result is not the expected the weights change according to the supervised learning rule. This process continues until a space that divides the possible outputs is found.
For the multilayer network, it was necessary to determine the number of neurons needed for the input layer. M.T Hagan and H.B Demuth discuss in [5] that there is not an exact method to determine this number, so what should be done is start with more neurons than needed and keep reducing until reaching an operational minimum. In this case, a two neuron input layer was selected along with a three-neuron output layer. Here, the output layer was determined to three neurons since the number of entries in the output vector must be the same as neurons in the layer.
The selected training method for the multilayer network was a variation of the Conjugated Gradient Back Propagation algorithm (CGBP) described in [5]. The algorithm was implemented as follows:
1) Calculate the sensivities of the network using the Back Propagation Method as in (1).
SN = - 2F(𝑛)N(t-a) (1)
Where 𝐹(𝑛) contains the first derivatives of the networks transfer function for the M neurons in the layer N, S represents the matrix of sensitivities of the M neurons in that layer and a is the output of the sigmoid hyperbolic tangent transfer function in (2).

7
𝑎 = !!!!!!
!!!!!! (2)
2) Find the gradient of E(x) using the sensivility coeficients calculated in the step 1, as shown in (3) and (4).
!"!!! = 𝑆!𝑎!!!! (3)
!"!!!
= 𝑆! (4)
Where E(x) is the performance index in (5), and shows the error between the calculated output and the desired value; and x is the vector formed by the weights W and the bias b.
E (x) = [(t-a)T(t-a)] (5)
From (3) and (4) the gradient of E(x) is obtained as:
∇𝐸(𝑥) = 𝑆!𝑎!!!!
𝑆! (6)
3) Select the first search direction as the inverse of the gradient of E(x). In other words, choose the first input vector p0 as the opposite of the gradient:
p0 = - ∇𝐸(𝑥) (7)
4) Update the weights using (8) taking into account that the first weights on x0 are random and ∝! is the learning rate.
xk+1 = xk + ∝!pk (8)
5) Evaluate E(xk) and keep updating the weights while E(xk) keeps decreasing. This process continues until E(xk) is less than a tolerance value.
6) Once the value of E(xk) reaches an acceptable level, the next sample from the training set is selected and the process starts again using the last weights calculated. The algorith continues until the weights W produce E(xk) < tolerance for every sample on the training set.
The reader should take into account that the method describe in this section is a variation of the CGBP discussed in [5]. The original CGBP for neural network uses The Golden Search to minimize the error. However, during testing it was noticed that setting a tolerance value reduced the convergence time significantly while keeping a high performance.
D. Training the Network The BCI was designed so the recognition can be done
using two different modes, which are: “Global Mode”, where all previously recorded training samples for all subjects were used as training set, and “Personal Mode” where a single user’s samples compose the training set, in other words making the training and recognition tailored to a single user.
Additionally, the user can also select the type of ANN architecture to use: Multilayer or Perceptron.
1) Global mode: As mentioned, this feature utilizes a previously trainned set of signals from various users, and therefore the system does not require to be individually trained by the user to begin recognizing events. The objective, is to leave a set of weights and bias W that can be used as parameters on the neural network to produce acceptable recognition for any person. Opposed to the Personal Mode, the samples for the Global mode were recorded separately, since it required a higher amount of samples for acceptable performance.
In order to set this mode, 25 samples were recorded for each of the three events (75 samples per user). In other words, the training consisted in measuring the signals while the user emulated a single event (e.g Left eyewink) and stored to be used as inputs for the ANN, Fig. 6, Fig. 7 and Fig. 8 show examples of EEG activity during Left, Right and Neutral events. To test the Global mode, a total of 225 events were recorded using three different subjects and combined to create an input sampling database. Later, the ANN were trained using the CGBP as learning rule for the multilayer, and the supervised learning for the perceptron. The resulting weights an bias, XM (multilayer) and XP (perceptron) that produce the desired output vectors were then saved and used as parameters for the network in the real-time recognizing mode.
2) Personal mode: In this mode, a single user has the possiblity to obtain the network’s parameters X using the assisted training provided by the BCI, as ilustrated in Fig. 9.
Fig. 6. Example of Left eyewink event.
Fig. 7. Example of Right eyewink event.

8
Fig. 8. Example of Neutral event.
The main difference with the global mode, is that only the samples measured for a single user are used as imputs for training. Here, the BCI permits the user to record up to 8 samples per event (24 total) and use them to train the network. With the assisted trainning, the user knows when to emulate the event showed by an animation on the BCI as illustarted on Fig. 9.
The resulting parameters X, can be either used directly or
saved as a binary file for later recognition. In the case that X is saved for later use, once in the recognition mode the user is able to load the file and test the real-time classification using any of the two architectures.
E. Events Recognizion
The recognition of events is a real-time feature of the BCI that can be used with the model of the ANN training with either the Personal or Global mode, in each either case the respective previously trained values of X are used as parameters for the network. Fig. 10 shows the BCI interface used for real-time recognition; an animation and an indicator will denote the type of event detected.
To detect an event, for each incoming point of the signal, a small k-sized Hamming window (e.g. with a duration of 1.5 seconds) is selected to be processed one after another. This procedure causes an overlapping of windows assuring the detection of all the possible events. The spectrogram of the signal is then constructed from the power spectrum of every window and a feature vector p is obtained.
Fig. 9. BCI’s Interface showing the trainning feature.
Fig. 10. BCI’s Interface showing the Recognition feature.
The network then performs the classification using p as input and the calculated values of W resulting from the previous training. As a result, the classifier gives an output vector a corresponding to one of the events of interest.
Since there is one window for every point of the signal, there will be one output vector a per each point on the signal. This last characteristic is highly important since it permitted the implementation of a voting-type system. This technique consisted on analyzing the output vectors obtained for an event to find the most repetitive outcome. Finally, the output vector that appeared the most for a single event is considered as the absolute response.
F. Testing the Network
Once the Network was ready, it was essential to test its performance. For this, a total of 300 samples (100 for each event) per subject were considered for recognition. The experiment was realized with two male subjects within the ages of 21 and 23 years old. During the test the subjects were requested to emulate one of the events 100 times before moving to the next one, where the response given by the BCI was recorded for every sample. To categorize the neutral event, the subjects were asked to stay relaxed and looking forward.
Finally, this experiment was repeated for both recognizing modes and architectures. At the end, a total of 1200 samples were taken (two modes with two architectures) for later analysis.
III. RESULTS Once the testing set was acquired, the system’s response
was catalogued in a confusion matrix as shown in Table I. Where the true positives are located along the matrix diagonal (e.g. Left events classified as Left). Table I also shows the number of samples incorrectly classified as negatives (e.g Left events classified as Right or Neutral), the negative samples categorized as positive (false positives) and the negative events classified as negative (true negatives). With the results from Table I, the true positive rate (TPR) and the true negative rate (TNR) were also calculated as shown in Table II.

9
TABLE I. CONFUSION MATRIX
Sample
Response
Multilayer: Global Mode
Left Right Neutral
Left 92 3 2
Right 4 95 27
Neutral 4 2 71
Total 100 100 100 Sample
Response
Multilayer: Personal Mode
Left Right Neutral
Left 94 0 8
Right 1 97 1
Neutral 5 3 91 Sample
Response
Perceptron Network: Global Mode
Left Right Neutral
Left 88 5 7
Right 10 91 13
Neutral 2 4 80 Sample
Response
Perceptrón Network: Personal Mode
Left Right Neutral Left 74 0 0
Right 1 96 1
Neutral 25 4 99
TABLE II. TPR AND TNR
Multilayer: Global Mode Event Parameter Left Right Neutral
TPR 0.92 0.95 0.71
TNR 0.975 0.845 0.97
Accuracy 0.96 0.88 0.88 Multilayer: Personal Mode
Event Parameter Left Right Neutral
TPR 0.94 0.97 0.91 TNR 0.96 0.99 0.96 Accuracy 0.95 0.98 0.94
Perceptron: Global Mode Event Parameter Left Right Neutral
TPR 0.88 0.91 0.8 TNR 0.94 0.885 0.97 Accuracy 0.92 0.89 0.91
Perceptron: Personal Mode Event Parameter Left Right Neutral
TPR 0.74 0.96 0.99 TNR 1 0.99 0.855
Accuracy 0.91 0.98 0.9
IV. DISCUSSION From Table II, it can be seen that the multilayer network in
global mode presented a high detecting and classifying performance for the Left and Right events. Here, the TNR indicates that 95% of the Right events were correctly classified. However, only 71% of neutral events were distinguished as true positives, leaving a 29% of events that were mistakenly detected as negatives. These results do not necessarily show a designing flaw in the network, but they indicate that in global mode the expected performance for and specific subject cannot be as high as when trained with the same user’s samples, furthermore the global mode was constructed using only a limited number of subjects, this should be extended for future studies. A similar case is observed in the TNR regarding the Right event recognition, since only an 84.5% of Left and Neutral events were catalogued as non-Right. In spite of this, the Multilayer network on Global Mode showed accuracies higher than 0.87, putting the system far from being a random classifier (Accuracy = 0.5). Similar results are observed for the remaining modes, showing a satisfactory performance in a general view.
If we now present a comparative analysis of the performance of both architectures in the different modes, it is observed that the highest accuracies are obtained when using personal training for both architectures, which was exactly as expected. The main focus of this study was to identify how the Multilayer offered better results than the Perceptron Network. Regarding the performance of the Global Mode, both architectures show accuracy levels higher than 0.87. The results presented in this paper certainly showed that the main goal was achieved. A BCI with satisfactory levels of reliability was developed, capable of detecting and recognizing one-eyed winks.
After the BCI was tested and fully functional it was decided to develop some small applications in order to demonstrate possible uses for this type of interfaces. The BCI is capable, for example, of transmitting commands to an Arduino microcontroller and control a servomotor, move small mobile-robot and turn on/off a light bulb, using the wink commands. These applications were chosen as examples to illustrate how a BCI could be used in house automation or assistance for people with disabilities.
V. CONCLUSION In this work, an effective algorithm for eyewink detection
and classification system based on EEG analysis and ANN that can be used for human-machine interface was proposed. Although limited experimentation, the results indicate that the proposed algorithm has proven to be simple and accurate method for eyewink identification. Future work will include increasing the library of trained events and extending the algorithm for detection and classification of other EEG events such as interpretation of toughs for arms and limbs movement.

10
ACKNOWLEDGMENT The authors wish to express their gratitude to the “Colegio
de Ciencias e Ingeniería” of Universidad San Francisco de Quito USFQ for financially supporting this work.
REFERENCES [1] Y. Yu, D. He, W. Hua, S. Li, Y. Qi, Y. Wang & Pan. “FlyingBuddy2: A
Brain-controlled Assistant for the Handicapped”. 2013 [2] M.Kh. Hazrati, U.G. Hofmann, "Avatar navigation in Second Life using
brain signals," in Intelligent Signal Processing (WISP), 2013 IEEE 8th International Symposium on , vol., no., pp.1,7, 16-18 Sept. 2013.
[3] Available at https://emotiv.com/epoc.php [4] R. Zak, J. Svejda, R. Senkerik and R. Jasek, “Analysis Of EEG Signal
For Using In Biometrical Classification,” in Proceedings 28th European Conference on Modelling and Simulation ECMS, F. Squazzoni, F. Baronio, C. Archetti, M. Castellani (Editors), 2014.
[5] M.T Hagan and H.B. Demuth, “Neuron Model and Network Architectures”, in Neural Network Designs, 2nd ed., Boston: PWS Pub, 1996, pp. 2,3
[6] S. Sanei, J.A. Chambers, EEG Signal Processing, 1st ed. 2007. pp. 289 [7] E.A. Larsen, “Classification of EEG Signals in a Brain-Computer
Interface System”, Norwegian University of Science and Technology, June 2011.
[8] B. Chambayil, R. Singla and R. Jha, “EEG Eye Blink Classification Using Neural Network,” Proceedings of the World Congress on Engineering, vol. 1, June 2010.
[9] J. Caciopppo, L. Tassinary and G. Berntson, “ Normative EEG Activity”, in Handbook of Psychophysiology New York: 2007, pp. 60 – 65.
[10] P. Tremblay, D. Shiller and V. Gracco, “On the time-course and frequency selectivity of the EEG for different modes of response selection: Evidence from speech production and keyboard pressing”, Clinical Neurophysiology 119, November 2007.
[11] S. Schneider, D.M Rouffet, F. Billaut and H. K. Struder, “Cortical Current Density Oscilations in the Motor Cortex Correlated With Muscular Activity During Pedaling Exercise”, Neuroscience 228, October 2012.