universitÉ de montrÉal relationships …
TRANSCRIPT

UNIVERSITÉ DE MONTRÉAL
RELATIONSHIPS BETWEEN PERFORMANCE MEASUREMENT SYSTEMS,
INTRAPRENEURIAL CULTURE AND INNOVATION CAPABILITIES:
A LONGITUDINAL FIELD CASE STUDY
VICTORIA LAKIZA
DÉPARTEMENT DE MATHÉMATIQUES ET DE GÉNIE INDUSTRIEL
ÉCOLE POLYTECHNIQUE DE MONTRÉAL
MÉMOIRE PRÉSENTÉ EN VUE DE L’OBTENTION
DU DIPLÔME DE MAÎTRISE ÈS SCIENCES APPLIQUÉES
(GÉNIE INDUSTRIEL)
AVRIL 2018
© Victoria Lakiza, 2018.
brought to you by COREView metadata, citation and similar papers at core.ac.uk
provided by PolyPublie

UNIVERSITÉ DE MONTRÉAL
ÉCOLE POLYTECHNIQUE DE MONTRÉAL
Ce mémoire intitulé :
RELATIONSHIPS BETWEEN PERFORMANCE MEASUREMENT SYSTEMS,
INTRAPRENEURIAL CULTURE AND INNOVATION CAPABILITIES:
A LONGITUDINAL FIELD CASE STUDY
présenté par : LAKIZA Victoria
en vue de l’obtention du diplôme de : Maîtrise ès sciences appliquées
a été dûment accepté par le jury d’examen constitué de :
M. BOURGAULT Mario, Ph. D., président
Mme DE MARCELLIS-WARIN Nathalie, Doctorat, membre et directrice de recherche
Mme DESCHAMPS Isabelle, D. B. A., membre et codirectrice de recherche
M. PELLERIN Robert, Ph. D., membre
iii
ACKNOWLEDGEMENTS
This work was supported by Mitacs through the Mitacs Accelerate Program, sponsored by the
government of Canada and Quebec. I am thankful to Mitacs for its commitment to bridging the gap
between research and practice and making the type of research that I did viable. Yet, such field
research would not have been possible without the participation of the Partner Company and many
of its employees. I am particularly grateful to the director of the IRDT group who made this
partnership a reality and whose dauntless optimism is so necessary to drive real change within
companies.
My thanks go to Nathalie de Marcellis-Warin for taking on the direction of my thesis when it was
already very advanced and providing valuable feedback in spite of how busy she already was. My
eternal gratitude is given to Isabelle Deschamps, my ‘academic mom’, who accepted to direct my
thesis since the beginning and who gave me much more time, support and counsel that I would
have ever hoped for. Isabelle’s commitment to her students is simply unparalleled and her unique
multidisciplinary background and approach are truly inspiring.
I would also like to thank my fellow researchers, Amélie Beaulieu, Guillaume Houllier and
Jonathan Brodeur. Thank you for all the conversations that helped me achieve a more complete
understanding of the Case, and for the fun time doing so. My thanks also go to Daphnée Lacasse
for her interest in my subject and all the great questions that allowed me to deepen my thinking and
to substantially improve my conceptual framework.
My eternal gratitude goes to my parents who are responsible for some of my core values and
ambitions which brought me to where I am today. They have always been there for me in their own
way even if they often did not understand what I chose to do and why. I would also like to thank
my mother-in-law, Wanda, for ‘sacrificing’ so much of her time to take care of Nicolas so I have
time to work and complete my thesis.
The person that I will never be able to thank enough is Dana, my partner in all the things. He made
it possible for me to do my master’s degree with encouragement and all the types of support
possible. From taking care of our son, of myself, of our home, to giving feedback on my articles,
my chapters and most importantly my thinking, I cannot imagine having done it without him.

iv
Lastly, I am so grateful for our little guy, Nicolas, who, by his arrival into this world made me
prioritize better and forced me to take more time to complete my thesis. While this may sound
contradictory, the additional time allowed me to process better and to mature my thoughts. I am
convinced that this resulted in a deeper analysis and higher quality work.

v
RÉSUMÉ
Tandis que l’innovation est une source clé de succès à long-terme, les compagnies établies perdent
souvent leurs Capacités d’Innovation au profit de l’efficacité opérationnelle. D’un côté, la Culture
Corporative Intrapreneuriale a souvent été corrélée avec des Capacités d’Innovation élevées. D’un
autre côté, les Systèmes d’Évaluation de la Performance (PMS) jouent un rôle dans les types de
projets qui sont priorisés, et peuvent ainsi nuire à l’innovation.
Cette étude explore les relations entre la Culture Intrapreneuriale, les PMS et les Capacités
d’Innovation, un sujet rare dans la littérature. L’objectif est d’atteindre une meilleure
compréhension des dynamiques transformationnelles requises pour aider une compagnie établie à
redynamiser ses Capacités d’Innovation. Une approche de recherche inductive a été jugée
appropriée pour cette étude puisque l’intention est de mieux comprendre des dynamiques humaines
complexes. Un concept de recherche itérative, basé sur une combinaison de quatre stratégies de
recherche ainsi que de multiples méthodes de collecte de données, a été développé pour aider à
combler l’écart entre la pratique et la littérature sur le sujet de recherche. Le modèle ‘Niveaux de
Perspective’ a été utilisé pour organiser et analyser les données.
Grâce à la stratégie de recherche intervention il a été possible d’expérimenter directement les défis
principaux et les tensions liés à la redynamisation des Capacités d’Innovation dans une compagnie
orientée vers l’exécution. Les défis principaux identifiés grâce à cette étude de cas sont : (1)
l’aversion au risque, (2) la mentalité d’exécution, (3) le manque d’alignement interne, (4) le
manque d’alignement environnemental, et (5) le bas niveau de maturité des processus d’innovation.
Trois prérequis inter-reliés à une mise en œuvre réussie d’indicateurs de performance clés (KPIs)
pour mesurer le succès des projets d’innovation ont été identifiés : (1) un niveau minimal de
maturité des processus d’innovation, (2) l’alignement stratégique, et (3) l’engagement envers
l’innovation.
La méthodologie de la théorisation enracinée a été utilisée pour conceptualiser les observations
terrain et développer quatre propositions de recherche et un cadre conceptuel qui pourraient être
plus amplement explorés dans de futurs projets de recherche. La première proposition suggère
qu’une compagnie orientée vers l’exécution qui introduit des objectifs stratégiques, PMS et
systèmes de récompenses alignés avec l’innovation, pourrait stimuler des initiatives innovantes et
supporter un développement futur de Capacités d’Innovation et d’une Culture Intrapreneuriale. La

vi
seconde proposition stipule qu’autrement les employés sont susceptibles de résister à la mise en
œuvre d’initiatives et mesures d’innovation, et de prioriser des KPIs orientés vers l’exécution
même pour mesurer l’innovation, renforçant ainsi la culture orientée vers l’exécution et nuisant au
développement de Capacités d’Innovation. De plus, certains apprentissages de cette étude
suggèrent que lorsque l’objectif est de redynamiser les Capacités d’Innovation dans une compagnie
orientée vers l’exécution, il est plus efficace de commencer par l’introduction de KPIs qui stimulent
des comportements favorables à l’innovation plutôt que des KPIs qui visent à mesurer le succès
des activités d’innovation (Proposition 3). Lorsque la compagnie atteint un niveau plus élevé de
maturité des processus de gestion de l’innovation et développe une Culture plus Intrapreneuriale,
la mise en œuvre de KPIs pour mesurer la performance de l’innovation aura plus de chances de
succès (Proposition 4). Cette étude se conclue avec une hypothèse qui pourrait être plus amplement
explorée lors de recherches futures : différents types de KPIs sont appropriés pour différents
niveaux de maturité des processus de gestion de l’innovation.
Les contributions principales de cette étude sont les apprentissages sur les relations dynamiques
entre la Culture Intrapreneuriale, les PMS et les Capacités d’Innovation qui ont été possibles grâce
au design de recherche terrain unique utilisé.

vii
ABSTRACT
While innovation is a key driver of long term success, established companies often lose their
Innovation Capabilities for the sake of operational efficiency. On one hand, Intrapreneurial
Corporate Cultures have often been correlated with high Innovation Capabilities. On the other
hand, Performance Measurement Systems (PMS) play a role in the types of projects that are
prioritized, and can hinder innovation.
This study explores the relationships between Intrapreneurial Culture, PMS and Innovation
Capabilities, a subject that is sparse in the literature. It aims to achieve a better understanding of
the transformational dynamics required to help an established company rejuvenate its Innovation
Capabilities. As the intent of this study is to better understand complex human dynamics, an
inductive research approach was considered appropriate. An iterative research design with a
combination of four research strategies and multiple data collection methods was developed to help
bridge the gap between practice and literature on the research subject. The ‘Levels of Perspectives’
iceberg model was used to help organize and analyze the data.
As a result of the intervention-research strategy, it was possible to experience firsthand key
challenges and tensions of the rejuvenation of Innovation Capabilities in an execution-oriented
company. The key challenges identified through this Case Study are the company’s (1) risk
aversion, (2) execution mindset, (3) lack of internal alignment, (4) lack of environmental
alignment, and (5) low level of maturity of innovation processes. Three interrelated prerequisites
to the successful implementation of Key Performance Indicators (KPIs) to measure innovation
success were identified: (1) minimal level of maturity of innovation processes, (2) strategic
alignment, and (3) commitment to innovation.
Grounded Research Theory was used to make sense of the field observations and provide four
research propositions, as well as a conceptual framework that could be further explored in future
research. Our first proposition suggests that an execution-oriented company that introduces well-
aligned innovation-oriented strategic objectives, PMS and reward systems could stimulate
innovation initiatives and support the future development of Innovation Capabilities and of an
Intrapreneurial Culture. Our second proposition states that otherwise, the employees are likely to
resist implementation of innovation initiatives and measures, and prioritize execution-oriented
KPIs, even to measure innovation, further reinforcing the execution-oriented culture and impeding

viii
the development of Innovation Capabilities. Moreover, learnings from this study suggest that when
the goal is to rejuvenate Innovation Capabilities in an execution-oriented company, it is more
effective to begin with the introduction of KPIs that stimulate behaviours conducive to innovation
rather than KPIs that aim to measure the success of innovation activities (Proposition 3). When the
company reaches a higher level of innovation management process maturity and develops a more
Intrapreneurial Culture, the implementation of KPIs to measure innovation performance will be
more likely to succeed (Proposition 4). This study is concluded with a hypothesis that could be
further explored in future research: different types of KPIs are appropriate for different levels of
innovation process management maturity.
This study’s main contributions are the learnings on the dynamic relationships between
Intrapreneurial Culture, PMS and Innovation Capabilities made possible by the unique field
research design used.

ix
TABLE OF CONTENTS
ACKNOWLEDGEMENTS ..................................................................................... iii
RÉSUMÉ ................................................................................................................... v
ABSTRACT ............................................................................................................ vii
TABLE OF CONTENTS ..........................................................................................ix
LIST OF TABLES ................................................................................................. xiii
LIST OF FIGURES ................................................................................................. xv
LIST OF SYMBOLS AND ABBREVIATIONS ................................................. xvii
LIST OF APPENDICES .........................................................................................xix
CHAPTER 1 INTRODUCTION ........................................................................... 1
1.1 Research Purpose ............................................................................................................. 1
1.2 Research Relevance .......................................................................................................... 2
1.3 Research Structure ............................................................................................................ 3
1.4 Research Site .................................................................................................................... 4
1.4.1 Company Background .................................................................................................. 4
1.4.2 The Mandate within the Partner Company .................................................................. 5
1.4.3 The Company’s Existing PMS ..................................................................................... 6
1.4.4 The Company’s Corporate Culture .............................................................................. 6
1.5 Significance of the Study ................................................................................................. 7
CHAPTER 2 LITERATURE REVIEW ................................................................. 9
2.1 Innovation ......................................................................................................................... 9

x
2.1.1 Innovation and Firm Performance .............................................................................. 10
2.1.2 Innovation Capabilities .............................................................................................. 12
2.2 Intrapreneurial Culture ................................................................................................... 13
2.2.1 Intrapreneurship ......................................................................................................... 13
2.2.2 Corporate Culture and Innovation .............................................................................. 14
2.2.3 Intrapreneurial Culture and Innovation ...................................................................... 16
2.2.4 Role of Management Practices in Intrapreneurship ................................................... 17
2.2.5 Intrapreneurial vs Execution-oriented Culture ........................................................... 18
2.3 Performance Measurement Systems .............................................................................. 19
2.3.1 Control Function ........................................................................................................ 21
2.3.2 Functions of PMS ....................................................................................................... 22
2.3.3 Overview of PMS History .......................................................................................... 23
2.3.4 Overview of PMS to Measure Innovation Performance ............................................ 24
2.3.5 PMS in SMEs ............................................................................................................. 27
2.3.6 PMS and Intrapreneurial Culture ............................................................................... 29
2.3.7 Innovation-oriented vs Execution-oriented PMS ....................................................... 29
2.4 Critical Review ............................................................................................................... 32
CHAPTER 3 METHODOLOGY ........................................................................ 36
3.1 Research Approach ........................................................................................................ 37
3.2 Research Strategies ........................................................................................................ 39
3.2.1 Grounded Theory ....................................................................................................... 39
3.2.2 Intervention-research .................................................................................................. 41
3.2.3 Action-research .......................................................................................................... 41
3.2.4 Case Study .................................................................................................................. 42

xi
3.3 Research Time-horizon .................................................................................................. 42
3.4 Research Participants ..................................................................................................... 43
3.5 Data Collection and Analysis Choices ........................................................................... 45
3.5.1 Iterative Flow between Data Collection, Analysis and Interpretation ....................... 45
3.5.2 Data Reliability and Validity...................................................................................... 47
3.5.3 Data Collection Methods ............................................................................................ 49
CHAPTER 4 RESEARCH FINDINGS ............................................................... 57
4.1 Results of Innovation Quotient Questionnaire ............................................................... 57
4.1.1 Results of Innovation Quotient Questionnaire by Building Block ............................ 58
4.1.2 IQ Questionnaire Results by Category ....................................................................... 63
4.2 Key Observations Regarding the Efforts to Rejuvenate Innovation Capabilities .......... 67
4.2.1 Risk Aversion ............................................................................................................. 69
4.2.2 Execution Mindset ...................................................................................................... 72
4.2.3 Lack of Internal Alignment ........................................................................................ 73
4.2.4 Lack of Environmental Alignment ............................................................................. 79
4.3 Analysis of the Innovation Process Maturity ................................................................. 79
4.4 Key Challenges to Rejuvenating Innovation Capabilities through Innovation KPI
Development .............................................................................................................................. 83
4.5 Summary of Deductions with Regards to the Guiding Questions ................................. 86
4.5.1 Deductions Regarding Guiding Questions 1 and 2 .................................................... 86
4.5.2 Deductions Regarding Guiding Questions 3 and 4 .................................................... 87
4.5.3 Deductions Regarding Guiding Question 5 ............................................................... 89
4.6 Conceptual Framework .................................................................................................. 90
CHAPTER 5 CONCLUSION ............................................................................. 95

xii
5.1 Discussion ...................................................................................................................... 95
5.1.1 Prerequisites to a Successful Implementation of KPIs to Measure Innovation Success
95
5.1.2 How is it Possible to Change an Organizational Culture? ......................................... 97
5.2 Concluding Proposition and Future Research ................................................................ 98
5.3 Contributions and Limitations ...................................................................................... 100
BIBLIOGRAPHY .................................................................................................. 101
APPENDICES ....................................................................................................... 113

xiii
LIST OF TABLES
Table 2.1: Research Parameter Choices ........................................................................................... 9
Table 2.2: Coverage of the Key Research Concepts in the Literature Review .............................. 10
Table 2.3: Overview of the Links between the Literature Review and the GQs ........................... 11
Table 2.4: Key Characteristics of an Intrapreneurial Culture making it Favorable to Innovation . 20
Table 2.5: Characteristics of Innovation-oriented PMS ................................................................. 31
Table 2.6: Characteristics of an Effective PMS as per Literature Review ..................................... 33
Table 3.1: Overview of the Research Design Choices ................................................................... 36
Table 3.2: The Longitudinal Research Phases at the Partner Company, adapted from Lakiza and
Deschamps (2018) .................................................................................................................. 44
Table 3.3: Distribution of the Study Participants across Departments and Hierarchy Levels ....... 45
Table 3.4: Mitigation Objectives and Approaches to Address Threats to Reliability .................... 47
Table 3.5: Mitigation Objectives and Approaches to Address Threats to Validity ....................... 48
Table 3.6: Summary of the Data Collection Methods used ........................................................... 49
Table 3.7: Documents Reviewed Following Identification through other Data Collection Methods
................................................................................................................................................ 50
Table 3.8: Objectives and Number of Participants for each Type of Interview ............................. 51
Table 3.9: Main Workshop Objectives .......................................................................................... 53
Table 3.10: List of Observation Opportunities and the Researcher's Level of Participation ......... 55
Table 3.11: List of Meetings and their Respective Objectives ...................................................... 56
Table 4.1: Levels of Perspectives Iceberg Regarding Risk-aversion with Sample Quotes ........... 70
Table 4.2: Levels of Perspectives Iceberg Regarding Risk-aversion with the Data Sources ......... 71
Table 4.3: Levels of Perspectives Iceberg Regarding the Execution Mindset with Sample Quotes
................................................................................................................................................ 74

xiv
Table 4.4: Levels of Perspectives Iceberg Regarding the Execution Mindset with the Data Sources
................................................................................................................................................ 75
Table 4.5: Levels of Perspectives Iceberg Regarding the Lack of Internal Alignment with Sample
Quotes ..................................................................................................................................... 76
Table 4.6: Levels of Perspectives Iceberg Regarding the Lack of Internal Alignment with the Data
Sources ................................................................................................................................... 77
Table 4.7: Levels of Perspectives Iceberg Regarding the Lack of Environmental Alignment with
Sample Quotes ........................................................................................................................ 80
Table 4.8: Levels of Perspectives Iceberg Regarding the Lack of Environmental Alignment with
the Data Sources ..................................................................................................................... 81
Table 4.9: Overview of Key Challenges to Innovation KPI Development at the Partner Company
................................................................................................................................................ 84
Table C.1: Questionnaire Questions for the Values and Behaviours Building Blocks ................ 118
Table C.2: Questionnaire Questions for the Climate and Resources Building Blocks ................ 119
Table C.3: Questionnaire Questions for the Processes and Success Building Blocks ................. 120
Table D.1: Questionnaire Scores for the Values, Behaviours and Climate Building Blocks ...... 121
Table D.2: Questionnaire Scores for the Resources, Processes and Success Building Blocks .... 122

xv
LIST OF FIGURES
Figure 3.1 Key Data Collection Methods and Research Process Flow .......................................... 38
Figure 3.2: Overview of the Added Value of Each of the Four Research Strategies ..................... 40
Figure 4.1: High-level Results of IQ Questionnaire (General and Building Block Scores) .......... 58
Figure 4.2: IQ Questionnaire Scores for the Values Building Block ............................................. 59
Figure 4.3: IQ Questionnaire Scores for the Behaviours Building Block ...................................... 60
Figure 4.4: IQ Questionnaire Scores for the Climate Building Block ........................................... 60
Figure 4.5: IQ Questionnaire Scores for the Resources Building Block ....................................... 62
Figure 4.6: IQ Questionnaire Scores for the Processes Building Block ........................................ 62
Figure 4.7: IQ Questionnaire Scores for the Success Building Block ........................................... 63
Figure 4.8: Percentage of Respondents per Function ..................................................................... 64
Figure 4.9: Block Scores Based on Respondents Function ............................................................ 65
Figure 4.10: Percentage of Respondents based on their Hierarchical Level .................................. 65
Figure 4.11: Block Scores Based on Hierarchical Level ............................................................... 66
Figure 4.12: Percentage of Respondents based on the Employees' Seniority ................................ 66
Figure 4.13: Block Scores Based on Seniority ............................................................................... 67
Figure 4.14: Simplified Levels of Perspectives Iceberg Model ..................................................... 68
Figure 4.15: Summary of Key Characteristics Common to 10 Selected BPMs ............................ 82
Figure 4.16: Proposed Conceptual Framework .............................................................................. 91
Figure 4.17: Two Possible Paths of Innovation KPI Introduction in Execution-oriented Culture 92
Figure 4.18: The Path toward the Innovation Zone ....................................................................... 92
Figure 4.19: Completion of Path A towards the Sustained Innovation Zone ................................ 93
Figure 4.20: Introduction of Execution-oriented KPIs to Measure Innovation Success ................ 94

xvi
Figure E.1: Score Distributions for the Entrepreneurial Factor ................................................... 123
Figure E.2: Score Distributions for the Creativity Factor ............................................................ 123
Figure E.3: Score Distributions for the Learning Factor .............................................................. 124
Figure E.4: Score Distributions for the Energize Factor .............................................................. 124
Figure E.5: Score Distributions for the Engage Factor ................................................................ 125
Figure E.6: Score Distributions for the Enable Factor ................................................................. 125
Figure E.7 Score Distributions for the Collaboration Factor ....................................................... 126
Figure E.8: Score Distributions for the Safety Factor .................................................................. 126
Figure E.9: Score Distributions for the Simplicity Factor ........................................................... 127
Figure E.10: Score Distributions for the People Factor ............................................................... 127
Figure E.11: Score Distributions for the Systems Factor ............................................................. 128
Figure E.12: Score Distributions for the Projects Factor ............................................................. 128
Figure E.13: Score Distributions for the Ideate Factor ................................................................ 129
Figure E.14: Score Distributions for the Shape Factor ................................................................ 129
Figure E.15: Score Distributions for the Capture Factor ............................................................. 130
Figure E.16: Score Distributions for the External Factor ............................................................. 130
Figure E.17: Score Distributions for the Enterprise Factor .......................................................... 131
Figure E.18: Score Distributions for the Individual Factor .......................................................... 131
Figure F.1: Percentage of Respondents by Department ............................................................... 132
Figure G.1: Application of Proposition 2 in Conceptual Framework .......................................... 133
Figure G.2: Application of Propositions 3 and 4 in Conceptual Framework ............................... 133

xvii
LIST OF SYMBOLS AND ABBREVIATIONS
AIM Agile Innovation Management
BCG The Boston Consulting Group
BPM Business Process Management
BSC Balanced Scorecard
CE Corporate Entrepreneurship
CEO Chief Executive Officer
CV Corporate Venturing
ECV External Corporate Venture
EO Entrepreneurial Orientation
EVC Economic Value for Customers
EVP Executive Vice President
FEI Front-End of Innovation
GQ Guiding Question
ICV Internal Corporate Venture
IoT Internet of Things
IPMS Innovation Performance Measurement System
IQ Innovation Quotient
IRDT Innovation, Research & Development, and Technology
ISPIM International Society for Professional Innovation Management
KPI Key Performance Indicator
LHF Low Hanging Fruits
MIC-CSE Multisectorial Industrial Research Chair in Coatings and Surface Engineering
MoM Minutes of Meeting

xviii
NPD New Product Development
OTD On-Time-Delivery
PMO Project Management Office
PMS Performance Measurement System
PDP Product Development Process
R&D Research & Development
R&NPD Research & New Product Development
RQ Research Question
SME Small & Medium-sized Enterprise
SWOT Strengths, Weaknesses, Opportunities and Threats
VoC Voice of Customers
VP Vice president

xix
LIST OF APPENDICES
APPENDIX A – INTERVIEW GUIDES .................................................................................... 113
APPENDIX B – HIGH-LEVEL WORKSHOP OUTLINES ...................................................... 116
APPENDIX C – IQ QUESTIONNAIRE STATEMENTS .......................................................... 118
APPENDIX D – COMPLETE IQ QUESTIONNAIRE RESULTS ............................................ 121
APPENDIX E – IQ SCORES DISTRIBUTION GRAPHS......................................................... 123
APPENDIX F – PERCENTAGE OF RESPONDENTS BY DEPARTMENT ........................... 132
APPENDIX G – APPLICATION OF RESEARCH PROPOSITIONS IN CONCEPTUAL
FRAMEWORK .................................................................................................................... 133

1
CHAPTER 1 INTRODUCTION
This chapter introduces the necessary research context and background. Section 1.1 explains the
purpose of the study and presents its research question. Section 1.2 introduces the relevance of this
study for innovation management research. The research structure and its guiding questions are
briefly presented in section 1.3. The background necessary to understand the context of the Partner
Company is presented in section 1.4. Section 1.5 describes the significance of this research and
presents an overview of the thesis.
1.1 Research Purpose
The author’s desire to better understand and describe organizational change dynamics as well as
identify key management and organizational levers to drive change within a tech-oriented
Company are at the root of this research project. The author’s interest toward this research subject
first came from her professional experience in developing an intrapreneurial culture as well as
implementing a full Performance Measurement System (PMS) in a traditional engineering
consulting company. The author’s purpose in doing this research is to gain better understanding on
how to help a well-established traditional company transition toward a more dynamic and
intrapreneurial enterprise with higher Innovation Capabilities.
This can be done through various means. While searching to narrow the subject of the study, an
opportunity to join the second phase of an ongoing longitudinal research on innovation
management in a manufacturing company presented itself. More information on this longitudinal
study is available in section 3.3. One of the partner company’s needs was the development of
innovation Key Performance Indicators (KPIs). A preliminary literature review confirmed the
adverse effects that PMS can have on the development of Innovation Capabilities (Christensen,
1997). This allowed us to narrow the research subject, as the author had experience with the
challenges associated with the development of a PMS as well as interest in its role in the
development of Innovation Capabilities. This resulted in the following Research Question (RQ):
What are the interrelations between Corporate Culture, PMS and Innovation Capabilities?
The author joined the research group with the mandate to support the partner company in the
development of innovation KPIs. The details of this mandate are described in section 1.4.2.

2
1.2 Research Relevance
Approximately half of the Fortune 500 companies from the 1970s and the 1980s have disappeared
or have been acquired (Galanakis, 2006). The lifespan of current Fortune 500 companies is
constantly decreasing (L. Morris, 2009). Innovation has been identified as “the major factor of
economic growth and wealth” by the EU (1995) and OECD (1997) (Galanakis, 2006). This is
supported by a number of scholars who recognize a positive link between innovation and firm
performance (Alegre, Lapiedra, & Chiva, 2006; Turró, Urbano, & Peris-Ortiz, 2014).
However, as companies grow and establish more efficient operations, they often lose their
Innovation Capabilities (Christensen, 1997; Pinchot III, 1985). For the purposes of this study, the
definition of Innovation Capabilities by Olsson, Wadell, Odenrick, and Bergendahl (2010) is used:
the “ability to continuously develop innovations as a response to a changing environment”. Indeed,
the development of an organization with a good balance between efficient operations to ensure
short-term profitability, and space for creativity and innovation to ensure future prosperity is a
significant challenge (O'Reilly III & Tushman, 2004; Perez-Freije & Enkel, 2007; Pinchot III,
1985; Sundgren, Dimenäs, Gustafsson, & Selart, 2005). Tellis, Prabhu, and Chandy (2009) believe
that companies tend to invest great resources into protecting the stream of revenue coming from
their current products and services, vetoing any change that might threaten the security of their
profits. According to Kanter (1985), there are three steps toward innovation:
1. Providing the flexibility and speed of action required for innovation. This implies dealing with current systems, structures and practices that might represent roadblocks;
2. Providing incentives and resources for entrepreneurial projects;
3. Pursuing business synergies.
Technical innovation can materialize in different ways in companies, such as Research &
Development (R&D), New Product Development (NPD) and Technological Development. A
number of studies suggest that control systems and PMS have a significant impact on NPD process
performance (Cooper & Edgett, 1996; Griffin, 1997; Hart, Hultink, Tzokas, & Commandeur, 2003;
Jiménez-Zarco, Martínez-Ruiz, & González-Benito, 2006; Neely et al., 2000; Neely, Richards,
Mills, Platts, & Bourne, 1997). Indeed, the wrong type of PMS can hinder the firm’s Innovation
Capabilities (Christensen, 1997; Perez-Freije & Enkel, 2007; Ries, 2011). Moreover, according to
surveys by McKinsey (Chan, Musso, & Shankar, 2008) and The Boston Consulting Group (BCG)
3
(Andrew, Manget, Michael, Taylor, & Zablit, 2010), most enterprises believe they have to improve
their Innovation Performance Measurement Systems (IPMS), as less than 41% think that they are
effective.
Intrapreneurial Corporate Cultures have often been strongly correlated with innovation (Covin &
Miles, 1999; Ireland, Covin, & Kuratko, 2009; Schumpeter, 1934; Zahra, 1995). However, there is
little research on the interactive relationships between control mechanisms and intrapreneurship
(Goodale, Kuratko, Hornsby, & Covin, 2011; M. H. Morris, Allen, Schindehutte, & Avila, 2006).
There is also a paucity of literature on the impacts of the use of IPMS on Innovation Capabilities
(Godener & Soderquist, 2004) and little work on how to provide a complete PMS to evaluate NPD
performance and success (Jiménez-Zarco et al., 2006).
Hence, when looking to understand how to rejuvenate Innovation Capabilities in an established
company, there is an interest in exploring the relationships between PMS, Intrapreneurial Culture,
and Corporate Innovation Capabilities.
1.3 Research Structure
This study is part of phase II of a broader longitudinal intervention-research on the development
of innovation management processes and tools with the same Partner Company, as explained in
more detail in section 3.3. Grounded Theory is the preferred research strategy of the director of this
longitudinal research.
The author’s professional background in change management is particularly appropriate for field
research in order to bridge the gap between literature and practice (Rousseau, 2006; Schein, 1999).
Therefore, joining a field intervention in a partner company seemed like an appropriate fit. Such
an approach implies that this study is explorative. Its design, mainly based on the Grounded Theory
Methodology, is iterative, as the research steps are adapted based on previous outcomes. This is
explained in more detail in Chapter 3 and illustrated in Figure 3.1. In addition to the RQ presented
in section 1.1, guiding questions (GQs) were developed to help orient the preliminary literature
review as well as the observations in the beginning of the mandate:
GQ 1: What are the dynamic relationships and mutual reinforcement mechanisms between
a company’s Culture and its PMS?

4
GQ 2: How do the specific contexts created by the combinations of Culture and PMS
influence, improve or deteriorate the company’s Innovation Capabilities?
GQ 3: What kind of PMS is more appropriate to stimulate Innovation Capabilities in an
established company?
GQ 4: How could PMS reinforce or kill the seeds of the Intrapreneurial Culture needed to
foster long-term Innovation Capabilities?
GQ 5: What dimensions of an Intrapreneurial Culture are most important to implement or
change in order to stimulate Innovation Capabilities?
1.4 Research Site
This section first provides the background of the Partner Company in section 1.4.1. Section 1.4.2
explains the specific mandate of the author of this thesis within the Company. Finally, the existing
PMS as well as Corporate Culture are described respectively in sections 1.4.3 and 1.4.4.
1.4.1 Company Background
The Partner Company (hereafter referred to as the “Company”) is a specialized manufacturer
offering a wide range of both customized solutions and specialized products. It evolves within a
fragmented industry with hundreds of competitors. Over several decades, the Company has grown
organically by broadening its product offerings and acquiring strategic competitors. Throughout its
history, there has been a series of significant inventions and innovations driven by the company’s
founder, who retired only a few years ago. The Company evolves according to the 3-generation
model proposed by Hiebl (2015): following the first generation entrepreneur-inventor, the second
generation shows a focus on operations and acquisitions at the expense of the entrepreneurial spirit,
while the third tries to rejuvenate innovation by implementing innovation management best
practices, processes and tools (Brodeur, Deschamps, & Lakiza, 2017).
Recently facing a steady sales decrease in well-established markets and product lines, the Company
embarked on a major revitalization journey with multiple organizational changes including a new
innovation strategy. Structural changes involved the creation of a Project Management Office
(PMO), and an Innovation, R&D and Technology (IRDT) group within the Engineering
department. The IRDT group, formed by merging several specialized engineering groups, began

5
the implementation and formalization of several innovation management processes, methods, tools
and best practices, including Robert Cooper’s Stage-Gate ® (Cooper, 2008) which was the subject
of the first Case Study during the first phase of our longitudinal research (Brodeur et al., 2017). At
the Company, the IRDT group and the marketing department share responsibility for innovation.
Consequently, while the research group was primarily part of the IRDT group during the field
research, an important part of the interactions included work with marketing stakeholders.
The Company’s revitalization journey also included the appointment of their first non-family
member as the Company’s President and CEO. During the first years of his mandate his main focus
became to fix the Company’s operational issues that were causing major delivery delays. The PMO
was created to contribute to this goal and was given important resources as well as legitimacy.
1.4.2 The Mandate within the Partner Company
Our research team began its longitudinal field study in summer 2015 when these different changes
were being initiated. Each researcher oversaw a specific innovation management subject, as
explained in more detail in section 3.3. With respect to the specific research covered in this thesis,
the author was on the field for the duration of phase II of the longitudinal research, from June 2016
to May 2017. The longitudinal research was financed by the Mitacs Accelerate program, which
contributes to bridging the gap between literature and practice by supporting graduate student
mandates in industry. It has two primary objectives:
• Knowledge transfer by testing theories in industry;
• Knowledge development by bringing learning back to literature.
In line with the first objective and in addition to the research subject of this thesis, the author was
given a specific mandate at the Partner Company. The mandate was to support the development of
innovation Key Performance Indicators (KPIs) with the goal of measuring the success of
innovation endeavours. The Company wanted to measure its overall technical innovation
performance. This included their NPD projects, their R&D and Technology development efforts
as well as innovation on customer orders. The objective was to propose a small number (3 to 5) of
simple indicators covering the overall performance of all the types of technical innovation projects.
In addition to the subject of this thesis and the innovation KPI development project, the role of the
author of this thesis within the research group was to ensure overall synergy among the work of

6
the three researchers present during phase II and to better understand the Company’s organizational
culture and change management dynamics.
1.4.3 The Company’s Existing PMS
During the author’s presence in the field, the Company had multiple data management systems that
were specific to the departments that were using them. They were mainly developed in-house
throughout the Company’s history. Few links existed between the systems and little access was
given to a system of a different department.
At the time of this study, the new CEO had recently implemented a new executive scorecard. Half
of the ten KPIs chosen were short-term financial indicators and none of the KPIs were about
innovation (Lakiza & Deschamps, 2018). In addition, an initiative of the IRDT group to develop
indicators to assess the performance of their NPD projects was carried out during the first phase of
the longitudinal research. This initiative was performed independently of the research team. This
effort resulted in the proposition of 38 indicators. Only 24 were implemented. The other 14 were
not implemented as they were difficult to measure with the existing data management systems.
These NPD indicators were developed based on a brainstorm and were not strategically linked to
the executive scorecard. In addition, most of the indicators had no specific goal attached (Lakiza
& Deschamps, 2018). This set of performance indicators had too much data, most of which is easy
to collect but not necessarily useful. According to Neely (1998), this is a typical problem. Some
stakeholders mentioned that the 14 indicators that were not implemented seemed like the most
important ones.
1.4.4 The Company’s Corporate Culture
Based on work done during phase I of the longitudinal research at the Company (Brodeur et al.,
2017; Deschamps, Lakiza, Beaulieu, Houllier, & Brodeur, 2016; Deschamps et al., 2017), this
study is built on the following premises:
• At the Partner Company, Innovation is generally treated as a set of initiatives as opposed to being part of a well-integrated strategy;
• The Company’s top priority at the time of our study is to fix operational issues such as on-time-delivery (OTD) and important resources are being invested to do so;

7
• Throughout the Company’s history, sales-driven innovation has always been prioritized over long-term technological and product development;
• Throughout the Company’s history, innovation was mostly led by a small number of inventive individuals who had the power to bypass formal processes because they were family members or friends;
• The Company is risk-averse and short-term oriented.
Based on these premises, we infer that this study is conducted within what we call an ‘execution-
oriented Company’. In this study, ‘execution’ refers mainly to short-term actions as opposed to
long-term, systemic and strategic thinking. We define the execution-oriented culture as “a
reactive, stagnant and risk averse culture where day-to-day operations are prioritized over long
term development” (Lakiza & Deschamps, 2018). In such a culture, a relatively small group of
isolated people push for the development of innovation management. Therefore, it is an opportunity
to observe innovation rejuvenation efforts within a context where it is not a priority and it is not
fully aligned with the overall Company strategy. The employees are used to executing orders
without making sure that what they are working on is actually useful and with little formal
encouragement to be intrapreneurial. Consequently, the current Company environment does not
seem favorable to innovation. It is typical for a Company with past innovation success to not pay
sufficient attention to new technologies, business models and competitors (Rao & Weintraub,
2013). This is how, after one innovative generation, a company can become a bureaucracy the next
generation (Rao & Weintraub, 2013).
Moreover, during phase I of the longitudinal research it was possible to observe the Company’s
highly centralized and informal management style and decision-making approach (Brodeur et al.,
2017). As a result, even though the Company has near 2000 employees, it was assessed during
phase I that on several levels it operates like a medium enterprise (Deschamps et al., 2016). Indeed,
most of the challenges typically experienced by Small and Medium-sized Enterprises (SMEs) when
implementing PMS, were present at the Partner Company (for more detail see section 2.3.5).
1.5 Significance of the Study
The intent of this study is to contribute to the knowledge development on the dynamic relationships
between a company’s Corporate Culture, its PMS and its Innovation Capabilities. The literature
pertaining to these three concepts is reviewed in Chapter 2. Based on a single case study, this

8
research cannot test hypotheses nor serve to develop generalizable results. Yet, our aim is to make
sense of field observations in industry in order to put forward propositions and a conceptual
framework that could be further tested in future research. Chapter 3 describes the methodology and
the detailed research design used to carry out this research.
The author hopes to contribute to the thinking of practitioners wishing to rejuvenate their
company’s Innovation Capabilities. This study provides learning on potential challenges
practitioners can meet when trying to implement an IPMS within an execution-oriented Company.
These challenges, as well as the research findings and propositions, are presented in Chapter 4. The
author’s hope is that this study will help bridge the gap between practice and literature regarding
the chosen subject. The conclusions of this thesis, as well as thoughts on future research, are
presented in Chapter 5.

9
CHAPTER 2 LITERATURE REVIEW
For this study, the literature was reviewed using primary, secondary and tertiary sources. To begin,
a search of tertiary sources was done using the ABI Inform and Compendex databases. The chosen
research parameters are presented in Table 2.1. The research terms were defined using relevance
trees developed based on the research question presented in section 1.1 as well as the five guiding
questions presented in section 1.3. State of the art articles were prioritized in the beginning to better
understand the key terms and get to know the main authors in order to refine future searches. This
also helped identify key seminal articles and other relevant references. The literature review was
judged sufficient when further searches started to refer mainly to articles already read (Saunders,
Lewis, & Thornhill, 2011).
Table 2.1: Research Parameter Choices
Research Parameter Choices Language of Publication English, French, Spanish, Russian, Ukrainian
Subject Area Innovation management Business Sector Manufacturing, engineering
Geographical Area North America, Europe Publication Period Last 10 years
Literature Type Journals, books, conference proceedings
This chapter presents the key highlights of the literature reviewed. Section 2.1 summarizes the
main concept definitions on innovation and Innovation Capabilities. It is followed by a more
comprehensive review of literature on Intrapreneurship and Corporate Culture in section 2.2.
Section 2.3 provides an overview of the relevant literature on innovation performance measurement
and how it can be used in the contexts of innovation and Intrapreneurship. Table 2.2 summarizes
how the key research concepts are covered by this literature review. Table 2.3 presents an overview
on how the literature review sections help respond to the GQs. A short critical literature review
based on the GQs concludes this chapter in section 2.4.
2.1 Innovation
In this study, the definition of innovation by Galanakis (2006) is used: “the creation of new
products, processes, knowledge or services by using new or existing scientific or technological
knowledge, which provide a degree of novelty either to the developer, the industrial sector, the
nation or the world and succeed in the marketplace”. It is important to highlight the last part of this
10
definition, as the terms innovation and invention are sometimes used interchangeably. Innovation
is an invention that also involves commercialisation (Galanakis, 2006; Pinchot III, 1985; Porter,
1990). Roberts (2007) makes a clear distinction between innovation and invention by presenting it
as follows: Innovation = Invention + Exploitation where invention focuses on generating a new
idea and making it feasible while exploitation aims to adapt the invention for a market and
commercialize it.
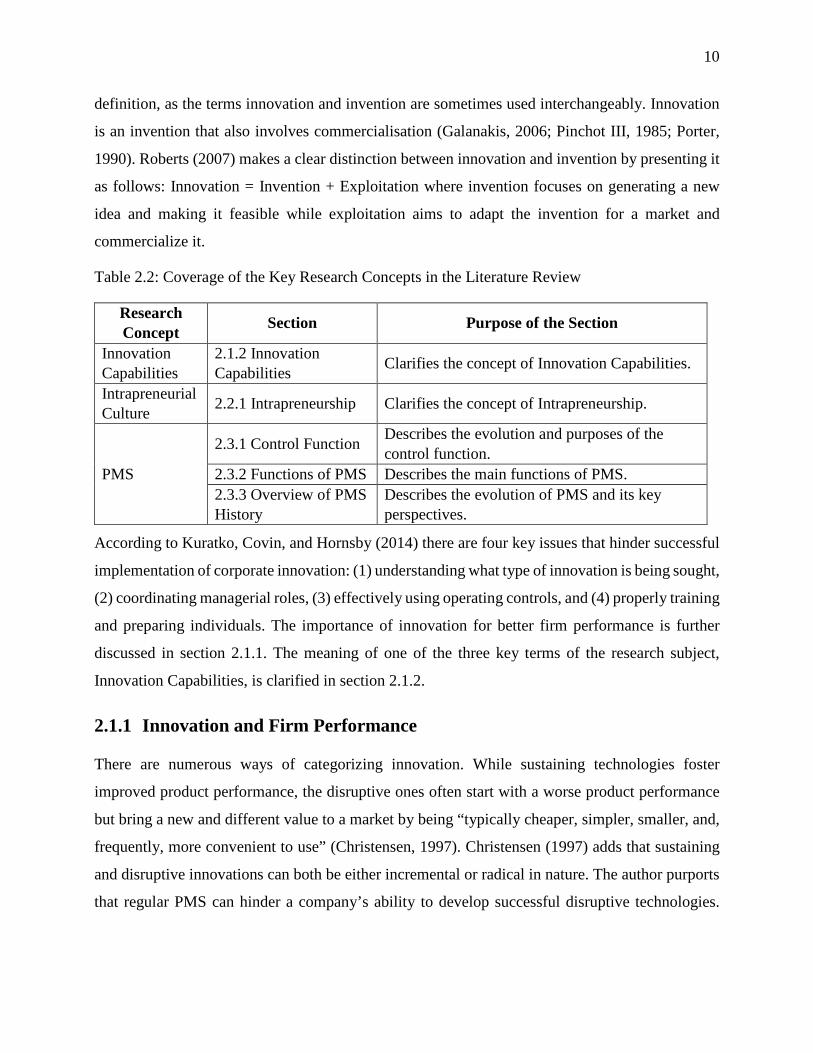
Table 2.2: Coverage of the Key Research Concepts in the Literature Review
Research Concept Section Purpose of the Section
Innovation Capabilities
2.1.2 Innovation Capabilities Clarifies the concept of Innovation Capabilities.
Intrapreneurial Culture 2.2.1 Intrapreneurship Clarifies the concept of Intrapreneurship.
PMS
2.3.1 Control Function Describes the evolution and purposes of the control function.
2.3.2 Functions of PMS Describes the main functions of PMS. 2.3.3 Overview of PMS History
Describes the evolution of PMS and its key perspectives.
According to Kuratko, Covin, and Hornsby (2014) there are four key issues that hinder successful
implementation of corporate innovation: (1) understanding what type of innovation is being sought,
(2) coordinating managerial roles, (3) effectively using operating controls, and (4) properly training
and preparing individuals. The importance of innovation for better firm performance is further
discussed in section 2.1.1. The meaning of one of the three key terms of the research subject,
Innovation Capabilities, is clarified in section 2.1.2.
2.1.1 Innovation and Firm Performance
There are numerous ways of categorizing innovation. While sustaining technologies foster
improved product performance, the disruptive ones often start with a worse product performance
but bring a new and different value to a market by being “typically cheaper, simpler, smaller, and,
frequently, more convenient to use” (Christensen, 1997). Christensen (1997) adds that sustaining
and disruptive innovations can both be either incremental or radical in nature. The author purports
that regular PMS can hinder a company’s ability to develop successful disruptive technologies.

11
Regular PMS typically encourage sustaining activities in order to please existing customers by
providing them with improved performance.
Table 2.3: Overview of the Links between the Literature Review and the GQs
Guiding Question Section Purpose of the Section GQ1: Dynamic relationships and mutual reinforcement mechanisms between Culture and PMS
2.3.6 PMS and Intrapreneurial Culture
Discusses the tensions between PMS and intrapreneurship. There is little literature on the actual reinforcement mechanisms that are an interest of this study.
GQ2: How do contexts created by combinations of Culture and PMS influence Innovation Capabilities?
While this is touched upon in the literature on the links of PMS and intrapreneurship, no literature was found specifically on this triple relationship. This supports the need to explore this subject further.
GQ3: What kind of PMS is more appropriate to stimulate Innovation Capabilities in an established company?
2.3.4 Overview of PMS to Measure Innovation Performance
Covers the literature on suitable PMS and metrics for innovation, areas of measurement as well as gaps between practice and literature, and gaps between the popular metrics and the useful ones.
2.3.7 Innovation-oriented PMS vs Execution-oriented PMS
This section and Table 2.5 summarize the key characteristics of PMS that seem more appropriate for innovation.
GQ4: How could PMS reinforce or kill the seeds of the Intrapreneurial Culture needed to foster Innovation Capabilities?
2.3.6 PMS and Intrapreneurial Culture
Discusses the tension between PMS and intrapreneurship.
GQ5: What dimensions of an Intrapreneurial Culture are most important to implement or change in order to stimulate Innovation Capabilities?
2.2.2 Corporate Culture and Innovation
Describes the importance of Culture for innovation, cultural dimensions influencing Innovation Capabilities, and diagnosis of an innovative Corporate Culture.
2.2.3 Intrapreneurial Culture and Innovation
Discusses key dimensions of an Intrapreneurial Culture for Innovation.
2.2.4 Role of Management Practices in Intrapreneurship
Leadership is one of the key dimensions identified in literature for successful intrapreneurship and innovation.
2.2.5 Intrapreneurial vs Execution-oriented Culture
This section and Table 2.4 summarize the key characteristics of an Intrapreneurial Culture that can stimulate innovation.

12
While sustaining and incremental innovation is important to meet today’s market demands,
disruptive and radical innovation is necessary to ensure a company’s long-term survival
(Christensen, 1997; Galanakis, 2006; Godener & Soderquist, 2004; Koetzier & Alon, 2013;
Pinchot III, 1985; Tidd, Bessant, Pavitt, & Wiley, 1998; Utterback, 1994). Without disruptive
innovation, chances are that current or future competitors will come up with something that will
eventually change the industry’s basis of competition and put some of the most successful
companies out of business (Christensen, 1997; Utterback, 1994).
Following a study of 184 manufacturing firms in Turkey, Gunday, Ulusoy, Kilic, and Alpkan
(2011) claim that innovation has a positive impact on manufacturing firms’ performance. Tellis et
al. (2009) propose that “radical innovation is an important driver of growth, success, and wealth of
firms and nations”. Thus, recognizing the key role that innovation plays in firm performance,
companies invest significant resources in R&D and NPD.
2.1.2 Innovation Capabilities
In order for innovation to become part of a company’s DNA, work has to be done to improve the
organization’s Innovation Capabilities. For the purposes of this study, the definition by Olsson et
al. (2010) is used: “Ability to continuously develop innovations as a response to a changing
environment”. Some authors separate Innovation Capabilities in two (Liao, Fei, & Chen, 2007;
Tuominen & Hyvönen, 2004): technical, which is about developing new products or technology,
and managerial, which includes the market and marketing transformation abilities.
Following a literature review on Innovation Capabilities, Saunila (2016) highlights its four key
common characteristics:
• Potential or ability to produce innovations;
• Internal capability;
• Requires continuous improvement;
• Aims to add value.
Saunila (2016) also proposes seven determinants of Innovation Capability:
• Leadership culture;
• Work climate and well-being (innovation culture, communication, collaboration, shared values);

13
• Ideation and organizing structures (rewards, level of decentralisation, cross-functional communication);
• Know-how development;
• Exploiting external knowledge (knowledge of external environment, networking, learning about customers and competitors);
• Regeneration (organizational learning, attitude to risk).
A company’s Innovation Capabilities can be a key driver of its success (Kallio, Kujansivu, &
Parjanen, 2012). Consequently, Innovation Capability can be viewed as a predictor of firm
performance (Saunila, 2016).
2.2 Intrapreneurial Culture
Intrapreneurial Culture is further explored in this section. First, the concept of intrapreneurship is
clarified in section 2.2.1. Guiding Question 5 is explored in detail through sections 2.2.2 to 2.2.5.
The importance of Corporate Culture in the context of innovation is discussed in section 2.2.2. The
specifics of an Intrapreneurial Culture and its key dimensions conducive to innovation are
presented in section 2.2.3. The role of managerial practices favorable for intrapreneurship is
summarized in Section 2.2.4. To conclude, the characteristics of an Intrapreneurial Culture
favorable to the development of Innovation Capabilities are contrasted with those of an execution-
oriented culture in section 2.2.5.
2.2.1 Intrapreneurship
According to Hisrich and Kearney (2011), “entrepreneurship is the dynamic process of creating
incremental wealth and stimulating the surrounding environment” and is a universal concept that
can be applied in organizations of any size and type. Consequently, intrapreneurship can be seen
as a sort of entrepreneurship. Indeed, intrapreneurship is referred to by many authors as “corporate
entrepreneurship” (CE) (Hisrich & Kearney, 2011; Kuratko & Audretsch, 2013; M. H. Morris et
al., 2006).
Definitions of intrapreneurship have varied significantly over the last couple of decades (Kuratko
& Audretsch, 2013). In an effort to clarify the domains of intrapreneurship, Kuratko and Audretsch
(2013) refer to a categorization by M. H. Morris, Kuratko, and Covin (2010) that first suggests two
major categories: corporate venturing (CV) and strategic entrepreneurship. CV can be further

14
subdivided into internal corporate ventures (ICVs) and external corporate ventures (ECVs), both
having in common the creation of new businesses within an established enterprise. On the other
hand, strategic entrepreneurship does not necessarily result in the creation of new business and is
characterized by a broader variety of formal and informal entrepreneurial initiatives. These
initiatives can manifest themselves through different types of innovation, such as strategic,
processes, business model, etc., and can occur anywhere in the firm.
In the context of this thesis, a definition of intrapreneurship by Baruah and Ward (2014) is used:
“the innovation practice within an organization through which employees undertake new business
activities and pursue different opportunities”. This thesis focuses primarily on strategic
entrepreneurship. While there are many similarities and some differences between intrapreneurship
in established organizations and entrepreneurship that implies the creation of a completely new
business, the essence of the entrepreneurial spirit behind both is the same (Hisrich & Kearney,
2011). Thus, in this thesis, entrepreneurship and intrapreneurship, as well as intrapreneurial and
entrepreneurial culture and behaviour, are used interchangeably and refer to entrepreneurship
within established firms.
2.2.2 Corporate Culture and Innovation
Following a review of a range of definitions, Triandis (1996) found that most researchers agree
that corporate culture is reflected in shared cognitions. “Corporate Culture has more to do with the
mind than with the organizational chart” (Thomas J. Peters as cited in Kuratko, Hornsby, Naffziger,
and Montagno (1993)). Katzenbach and Harshak (2011) describe corporate Culture as “deeply
embedded, self-reinforcing behaviours, beliefs and mind-sets that determine ‘how we do things
around here’” and claim that it has a significant impact on the firm’s actions and performance.
Indeed, the company’s identity is grounded in its culture (Katzenbach & Harshak, 2011). In this
study, a definition by Tellis et al. (2009) that views Corporate Culture as “a core set of attitudes
and practices that are shared by the members of the firm” is used.
Following a study of 759 firms across 17 major nations including Canada and USA, Tellis et al.
(2009) claim that corporate culture is the strongest driver of radical innovation across nations
compared to a number of factors such as R&D spending, patents and firm size. Investment in skilled
labour was the second strongest driver in this research. Some studies suggest that companies with

15
strong and inspiring cultures, such as Procter & Gamble, Apple and Starbucks, have a better
financial performance (Katzenbach & Harshak, 2011).
Following a systematic literature review of over 100 papers, Smith, Busi, Ball, and Van Der Meer
(2008) claim that organizational culture both impacts and is impacted by all other factors that
influence a company’s ability to manage innovation. Among the determinants identified by Saunila
(2016), work climate and well-being, as well as leadership culture, are considered to be the first
aspects to work on in order to improve a company’s Innovation Capabilities. According to Ballé,
Morgan, and Sobek II (2016) learning is central to sustained innovation.
Rao and Weintraub (2013) believe that an innovative company culture is based on six interrelated
building blocks. Three of the six blocks are more tangible and easy to measure: resources, processes
and success. These are often more attractive to managers aiming to rejuvenate their firm’s
innovative capabilities. The other three blocks are values, behaviour and climate. They are more
human-centered and intangible, and thus more difficult to measure. These blocks are more often
neglected as managers tend to be less confident in navigating through these human aspects. As Rao
and Weintraub (2013) put it “the soft stuff is the hard stuff”. However, it is these ‘people issues’
that “have the greatest power to shape the culture of innovation and create a sustained competitive
advantage” (Rao & Weintraub, 2013).
Based on these blocks, the authors propose an Innovation Quotient (IQ) questionnaire to help
companies evaluate how innovative their culture is and to better understand their strengths and
weaknesses regarding innovation. Over three years, this test has been administered to 1,026
managers at 15 companies of diverse industries and geography. While there is no perfect score,
Rao and Weintraub (2013) believe that truly innovative companies are very strong in at least one
of the building blocks.
According to Katzenbach and Harshak (2011), the best way to diagnose a corporate culture is by
looking closely at the employees’ behaviours. Rao and Weintraub (2013) believe that employees’
behaviours are the result of a company’s values, which show through the actions and investments
of its leaders much more than on official company value statements. The company’s values also
impact people’s definition of success (Rao & Weintraub, 2013).

16
2.2.3 Intrapreneurial Culture and Innovation
Intrapreneurship can be viewed as “the sum of a company’s innovation, renewal, and venturing
efforts” (Zahra, 1995). A number of scholars view innovation as a form of intrapreneurship (Ireland
et al., 2009; Schumpeter, 1934). While definitions of both innovation and intrapreneurship vary
significantly in literature, innovation is always a significant part of intrapreneurship and, according
to Covin and Miles (1999), is the single common element across intrapreneurial firms.
Although some scholars may use the notions of innovation culture and intrapreneurial culture
interchangeably, an explicit choice to study intrapreneurial culture and not innovation culture was
made for this study. In fact, a high-tech environment or an SME based on the inventiveness of its
founder could have a strong innovation culture without necessarily having the other characteristics
necessary to make it intrapreneurial, such as proactivity, risk taking and future orientation. An
Intrapreneurial Culture is thus defined in this study as an environment where each employee can
seize the opportunity to put to work their intrapreneurial potential.
According to Covin and Slevin (1991), for a firm to be considered intrapreneurial, it must
simultaneously exhibit a certain level of each of the three components of what Miller (1983) calls
the “Entrepreneurial Orientation” (EO): innovativeness, risk-taking and proactivity. Dynamism,
flexibility and opportunism are also characteristics often attributed to intrapreneurial firms
(Kuratko, Hornsby, & Goldsby, 2012). Such companies encourage creativity, risk-taking and
teamwork (Kuratko et al., 1993), and focus on managing uncertainty, empowering employees and
encouraging experimentation (M. H. Morris et al., 2006). According to Kuratko, Hornsby, and
Covin (2014), “corporate entrepreneurship flourishes in established firms when individuals are free
to pursue actions and initiatives, regardless of the ‘rules’”.
Kuratko, Hornsby, et al. (2014) have identified five key dimensions for a corporate environment
favourable to intrapreneurship: (1) top management support, (2) work discretion/autonomy, (3)
rewards/reinforcement, (4) time availability, and (5) organizational boundaries. The firms that
score higher on these dimensions have a better chance of successfully implementing an innovative
strategy (Hornsby, Kuratko, & Zahra, 2002; Ireland, Kuratko, & Morris, 2006). Moreover, findings
by Hornsby, Kuratko, Shepherd, and Bott (2009) show that 3 of the 5 dimensions (management
support, rewards/reinforcement and discretion/autonomy) (Kuratko, Hornsby, et al., 2014) are
significantly correlated with the quantity of ideas implemented.

17
Numerous studies have shown a positive impact of intrapreneurship on financial as well as non-
financial corporate performance (Covin & Slevin, 1989; Davis, Morris, & Allen, 1991; Wiklund
& Shepherd, 2005; Zahra, Jennings, & Kuratko, 1999). Several authors believe that in today’s
globalization context, intrapreneurship is essential to innovation (Gómez‐Haro, Aragón‐Correa, &
Cordón‐Pozo, 2011) and is the best path to high organizational performance (Garvin & Levesque,
2006; Kuratko, 2009; M. H. Morris et al., 2010).
2.2.4 Role of Management Practices in Intrapreneurship
Management practices have a “direct and significant impact on the performance of both the
breakthrough initiative and the traditional business” (O'Reilly III & Tushman, 2004). Each
managerial level has a distinct role to play in strategic renewal of organizations (Floyd & Lane,
2000).
According to Burgelman (1984), one of the main roles of senior-level managers is to structure the
organization so it encourages and allows intrapreneurship. Moreover, a study of transformational
Chief Executive Officers (CEOs) of 152 firms by Ling, Simsek, Lubatkin, and Veiga (2008)
suggests that CEOs have a significant role in shaping top characteristics required of top
management in order to create an intrapreneurial culture.
The role of middle-level managers is often one of “change agents and promoters of innovation,”
connecting ideas and strategies with the right people (Kuratko & Audretsch, 2013). They are often
the champions who nurture intrapreneurial initiatives as well as guide and support intrapreneurs
through organizational structure and obstacles (Kuratko & Audretsch, 2013). Doing so might
require redirecting resources from day-to-day operations toward intrapreneurial initiatives with a
higher potential strategic fit (Burgelman, 1984; Ren & Guo, 2011). In order to accomplish this,
they must have enough discretionary decision-making power which in turn requires a certain level
of decentralization. According to Kuratko and Audretsch (2013), the “middle management level is
where entrepreneurial opportunities are given the best chance to flourish”.
Based on the model by Floyd and Lane (2000), first-level managers have experimenting, adjusting
and confronting roles. Kuratko et al. (1993) suggest that corporate managers must adapt their
approach to manage intrapreneurs differently from traditional employees. The authors add that
some traditional management approaches can discourage potential intrapreneurs from engaging in

18
Intrapreneuring. Sykes and Block (1989) propose a list of traditional management practices that
are detrimental to an intrapreneurial culture.
While several studies suggest that higher managerial levels have increasingly superior structural
ability to implement and support intrapreneurial efforts (Burgelman, 1983a, 1983b, 1984; Hornsby
et al., 2009; Hornsby et al., 2002), a joint effort from all managerial levels is key to developing
entrepreneurial behaviours necessary to drive the company’s future success (Kuratko, Hornsby, &
Bishop, 2005).
2.2.5 Intrapreneurial vs Execution-oriented Culture
There is no consensus as to whether intrapreneurship and bureaucracies are polarities that cannot
coexist within the same organization (Duncan, Ginter, Rucks, & Jacobs, 1988). While some authors
think that intrapreneurship within a bureaucratic organization is impossible (Morse, 1986), others
believe it can be achieved within companies of any type and size (Burgelman, 1984; Kuratko &
Montagno, 1989). Some even argue that the coexistence of both is absolutely necessary (Kanter,
1985). Kuratko et al. (1993) describe a culture that encourages innovation as one of “entrepreneurs
and designers” while the typical culture in established companies as one of “bureaucrats and
controllers”. T. E. Brown, Davidsson, and Wiklund (2001) highlight that entrepreneurial and
administrative behaviours vary in the ways managers approach opportunity and manage resources.
The authors also highlight differences in the company structures and the design of reward systems.
A few examples of established companies that have been successful with Intrapreneuring are 3M,
IBM, Hewlett-Packard, General Electric and Polaroid (Kuratko et al., 1993).
According to O'Reilly III and Tushman (2004), few companies are successful at balancing their
existing products and operations with innovating and preparing for the future. By examining those
who are, the authors discovered the ambidextrous organizations which separate their exploitative
and explorative units with different processes, structures and cultures. However, a close link
between both units at the senior executive level is paramount, with senior teams and managers
ensuring synergy across the different parts of the organization and capitalizing on shared resources
(O'Reilly III & Tushman, 2004). All this is done with clear common organizational objectives in
mind. The ambidextrous organizations were considerably more successful at launching
breakthrough products or services. The ambidextrous organizational design was also the best at
19
keeping or increasing the performance of the companies’ existing products compared to functional
designs, cross-functional teams or unsupported teams.
Table 2.4 summarizes the key characteristics of an Intrapreneurial Culture that make it favorable
to innovation as reviewed in the literature. This table helps better establish what defines an
Intrapreneurial Culture while not being part of an execution-oriented one.
2.3 Performance Measurement Systems
Saunila and Ukko (2013) claim that measurement can help improve Innovation Capabilities.
However, “the role of performance measurement in developing innovation capability is […]
ignored in the current literature”, especially for SMEs (Saunila, 2016).
Cook, Vansant, Stewart, and Adrian (1995) define performance measurement as “the periodic
measurement of progress towards explicit short and long-run objectives and the reporting of the
results to decision makers in order to attempt to improve program performance”. A key goal of
performance measurement is to minimize the gap between intention and outcome (Loch, Stein, &
Terwiesch, 1996). In this study, the definition of PMS by Neely et al. (2000) is used: “a balanced
and dynamic system that is able to support the decision-making process by gathering, elaborating
and analysing information”.
This section first clarifies the meaning and functions of PMS in sections 2.3.1 to 2.3.3. An overview
of the control function is presented in section 2.3.1. Section 2.3.2 dives into the possible functions
of a PMS. An overview of the general history and evolution of PMS and their key perspectives is
presented in section 2.3.3. GQ 3 is explored in section 2.3.4 that covers the specifics of PMS more
appropriate to measure innovation. The challenges and particularities of PMS in SMEs are
discussed in section 2.3.5 as it was assessed that the Company exhibits some SME characteristics.
Consequently, it was relevant to identify how such characteristics may influence performance
measurement. Follows an overview of literature on the dynamics of PMS and intrapreneurship in
section 2.3.6, contributing to GQs 1 and 4. To conclude, innovation-oriented PMS are compared
with execution-oriented ones in section 2.3.7.

20
Table 2.4: Key Characteristics of an Intrapreneurial Culture making it Favorable to Innovation
Characteristic References
Proactivity, experimentation and initiatives
Covin and Slevin (1991); Gibson and Birkinshaw (2004); Kuratko (2009); Kuratko, Hornsby, et al. (2014); Miller (1983); M. H. Morris et al. (2006); O'Reilly III and Tushman (2004); Pinchot III (1985); Rao and Weintraub (2013); Wiklund and Shepherd (2005)
Highly valued professional development and continuous learning (individual and organizational)
Ballé et al. (2016); Kuratko et al. (1993); Rao and Weintraub (2013); Tellis et al. (2009), Ries (2011)
Risk taking and risk tolerance
Christensen (1997); Covin and Slevin (1991); Kuratko et al. (1993); Miller (1983); M. H. Morris et al. (2006); Pinchot III (1985); Rao and Weintraub (2013); Tellis et al. (2009); Wiklund and Shepherd (2005)
Informal groups working on initiatives, heavyweight development teams, ‘skunkworks’
Christensen (1997); Cirka (1997); Floyd and Lane (2000); Galbraith (1975); Gibson and Birkinshaw (2004); Pinchot III (1985); Clark and Wheelwright (1992); Katzenbach and Harshak (2011); Kuratko et al. (1993)
Reward systems and incentives for intrapreneuring
Christensen (1997); Gibson and Birkinshaw (2004); Kuratko, Hornsby, et al. (2014); O'Reilly III and Tushman (2004); Pinchot III (1985); Tellis et al. (2009)
Future Orientation O'Reilly III and Tushman (2004); Rao and Weintraub (2013); Tellis et al. (2009)
Empowerment and support of intrapreneurs
Gibson and Birkinshaw (2004); Kuratko, Hornsby, et al. (2014); M. H. Morris et al. (2006); Pinchot III (1985); Rao and Weintraub (2013); Tellis et al. (2009)
Employee Autonomy Clark and Fujimoto (1991); Kuratko, Hornsby, et al. (2014); M. H. Morris et al. (2006); Pinchot III (1985, 1993); Rao and Weintraub (2013); Shih and Yong (2001); Tellis et al. (2009)
Acceptance of failure Christensen (1997); Rao and Weintraub (2013); Ries (2011)
Flexibility and dynamism
Covin and Slevin (1991); Gibson and Birkinshaw (2004); Govindarajan (1988); Kanter (1985); Kuratko et al. (2012); Marginson (2002); Pinchot III (1985); Rao and Weintraub (2013); Ries (2011)
Innovativeness and creativity
Covin and Miles (1999); Covin and Slevin (1991); Ireland et al. (2009); Kuratko et al. (1993); Miller (1983); M. H. Morris et al. (2006); Schumpeter (1934); Wiklund and Shepherd (2005); Zahra (1995)
Opportunism Kuratko et al. (2012); Pinchot III (1985) Dedicated resources (time, money, space)
Kuratko, Hornsby, et al. (2014); Pinchot III (1985); Rao and Weintraub (2013)
21
2.3.1 Control Function
Typically, a company’s control systems are very simple and often informal in the beginning (M.
H. Morris et al., 2006). The controls and their effect on the organizational culture are impacted by
the company's size (Greiner, 1972; M. H. Morris et al., 2006). With the company growing, the
“control practices arise from conscious managerial efforts as well as informal mechanisms that
emerge through the spontaneous interactions of employees over time” (M. H. Morris et al., 2006).
All this materializes in a complex web of items that are sometimes counterproductive as they were
created to address different needs (M. H. Morris et al., 2006). Moreover, formalization comes into
play and the control systems become more complex, eventually getting to the point where they
encourage bureaucracy and micro-management (Shih & Yong, 2001). Departments develop their
own identities, make their own decisions and develop their own controls (M. H. Morris et al., 2006),
contributing to the creation of silos. Sometimes the control systems even become an end in
themselves thus resulting in employees’ distrust (Morrow, Hansen, & Pearson, 2004). Operational
efficiency becomes more important than strategic effectiveness (Simons, 1995). This becomes the
new company culture and the bigger the organization is, the more resistance there will be to change
this culture moving forward (Katzenbach & Harshak, 2011).
The key purposes of the control function are to reduce the risks associated with uncertainty, support
efficient execution of established routines and standardize (Goodale et al., 2011). Consequently,
they are generally designed for high efficiency, conformance, reduced risk and uncertainty, as well
as promotion of standards and specific roles (M. H. Morris et al., 2006). However, according to
Govindarajan (1988), as tasks vary in uncertainty they require different behaviours for an effective
performance. According to Galbraith (1975), uncertainty limits the effectiveness of formal control
systems. Hence, because the control systems have an impact on employees’ behaviours, they must
be tailored to task uncertainty (Govindarajan, 1988). While various researchers proposed different
definitions of the elements that constitute control systems (M. H. Morris et al., 2006), performance
measurement is always a part of controls.
According to Pinchot III (1993), bureaucracies were a suitable form of organization in an industrial
age when the aim was to exploit economies of scale with well-delimited areas of responsibility and
functional specialization. However, in an era with a greater need for self-determination, he calls
for an ‘intelligent organization’ based on self-management and flatter structures. M. H. Morris et

22
al. (2006) add that control systems must adapt to this new reality. According to the contingency
theory, with increasing uncertainty and a more complex environment, the appropriate
organizational structures and controls will be different (M. H. Morris et al., 2006).
Cirka (1997) puts control strategies in three categories based on what they do: (1) regulate the
organization’s inputs; (2) govern employees’ behaviours; or (3) measure achievement and outputs.
According to M. H. Morris et al. (2006), “the implementation of measures […] brings order,
coordination, accountability and efficiency to an otherwise chaotic situation”.
2.3.2 Functions of PMS
PMS are mainly studied from either the accounting or the operational point of view (Garengo,
Biazzo, & Bititci, 2005). Kerssens-van Drongelen (1999) identified seven possible PMS functions:
• Provide insight into deviations of performance from objectives to allow management to decide if steering measures are necessary;
• Provide insight into deviations of performance from objectives to allow staff to decide if steering measures are necessary;
• Fuel learning on the system that is being controlled to enable better planning and control in the future;
• Facilitate alignment and control of objectives;
• Support decision making regarding performance based rewards;
• Provide input to support and justify decision making;
• Motivate employees through feedback.
In sum, the high level purpose of measurement is either to encourage desired behaviour or limit
unwanted behaviour (M. H. Morris et al., 2006). When the purpose of measurement is not well
understood by the employees, it appears to them as a distraction from their work on what they
believe being the company’s goals (Neely et al., 2000).
According to Bititci, Turner, and Ball (1999), while a PMS should be dynamic, most companies
use static models. Indeed, the managers are too often not capable of distinguishing measures
necessary for control from measures useful to support improvement, or do not understand the
complex causal relationships between high level strategy and everyday action (Bititci et al., 1999).

23
2.3.3 Overview of PMS History
PMS were originally used to evaluate the achievement of specific, most often financial, goals
(Neely et al., 1997). The PMS models used accounting and financial metrics as they were originally
under the control function (Bremser & Barsky, 2004; Kaplan & Norton, 1992; Neely et al., 2000).
Performance measurement is still most often nested under the finance function (Bremser & Barsky,
2004), even to measure innovation.
In the 1980s, executives’ dissatisfaction with the short-term focus of financial measures resulted in
the addition of operational metrics (Kaplan & Norton, 1992) as well as an interest to measure
success through customer satisfaction and human capital perspectives (Jiménez-Zarco et al., 2006).
In the information economy, companies rely more and more on resources that are difficult to
measure (Bremser & Barsky, 2004). Some authors even argued that senior managers should not be
looking at the business from a financial perspective anymore as it is by taking care of the other,
often softer aspects of the business that the financial results will follow (Kaplan & Norton, 1992).
Consequently, senior management as well as other functions than finance started to get involved
in PMS (Jiménez-Zarco et al., 2006; Kaplan & Norton, 1992; Neely et al., 2000).
Kaplan and Norton (1992) believed that while financial measures were appropriate during the
industrial era, a more balanced approach of looking at a company’s performance was needed going
forward. They proposed the most popular model in practice and in literature (Garengo et al., 2005).
The Balanced Scorecard (BSC) aims to help managers balance four key business perspectives: the
customer, the internal business, the innovation and learning, and the financial perspectives. These
perspectives are meant to allow for balance between short-term and long term objectives, between
outcomes and their drivers, as well as between hard and soft measures (Kaplan & Norton, 1996).
The Company’s strategy is transformed into specific measurable objectives that are cascaded down
through the hierarchy and is ultimately reflected in the employees’ performance evaluations
(Bremser & Barsky, 2004; Kaplan & Norton, 1996).
In their comparison of six of the most popular generic models as well as two models developed
specifically for SMEs since the nineties, Garengo et al. (2005) observed an evolution from
bureaucratic systems to more reactive ones. They also perceived a slight decrease in the importance
of strategic alignment as well as a growing importance of the stakeholder perspective in the PMS
design over time.

24
2.3.4 Overview of PMS to Measure Innovation Performance
“What you measure is what you get” (Kaplan & Norton, 1992). According to Kuratko, Covin, et
al. (2014), the absence of a PMS can jeopardize the success of innovation projects. A company
cannot be sure to detect poor performance and take appropriate corrective actions in the areas that
do not have performance indicators (Busby & Williamson, 2000; Godener & Soderquist, 2004).
However, the evolving and dynamic nature of innovation makes its performance measurement a
significant challenge (Kirchhoff, Linton, & Walsh, 2013). It requires connecting past cost data with
potential future long-term results (Bremser & Barsky, 2004). Indeed, R&D activities have to be
continuous and coherent over the long term, at least 5 years, for R&D results to be meaningful
(Lazzarotti, Manzini, & Mari, 2011). In addition, the idiosyncratic nature of innovation makes it
difficult to compare innovation performance with competitors (Sawang, 2009).
Moreover, there is a gap between IPMS proposed in the literature and what is required to fulfill the
needs of innovative firms (Dewangan & Godse, 2014). Ojanen and Vuola (2005) claim that “it is
absolutely essential to clarify the main purpose of the innovation control system”. Furthermore,
while there is a general agreement on the need of a multi-dimensional approach to measure
innovation performance, there is little consensus on the dimensions to use (Dewangan & Godse,
2014).
2.3.4.1 Areas of Innovation Performance Measurement
Based on a literature review, Godener and Soderquist (2004) identify seven complementary areas
of what they call R&NPD (Research and New Product Development) performance measurement:
1. Financial performance measurements;
2. Customer satisfaction measurements;
3. Process management measurements;
4. Innovation measurements;
5. Strategic measurements;
6. Technology measurements;
7. Knowledge management measurements.

25
The first four are very close to the four BSC perspectives as well as to the categories identified by
Griffin and Page (1996) during their survey of measures used in practice (Godener & Soderquist,
2004). The customer satisfaction measurement is one of the main dimensions of contemporary
PMS models according to a number of authors (Garengo et al., 2005). Atkinson, Waterhouse, and
Wells (1997) state that to perform, a company must know its stakeholders’ expectations. According
to a study on the effectiveness of R&D performance measurement, Kerssens-van Drongelen and
Bilderbeek (1999) claim that customer focus might be the most important characteristic that
distinguishes effective PMS.
Following an extensive literature review, Werner and Souder (1997) favour the aggregation of
quantitative and qualitative measures for a collective R&NPD performance measurement by R&D,
marketing and planning. Furthermore, Jiménez-Zarco et al. (2006) state that the measures must
indicate the future potential of the innovation endeavours and anticipate the market needs and
preferences.
Several authors support that innovation performance measurement is idiosyncratic to the
company’s and project’s contexts (Bremser & Barsky, 2004; Brophey, Baregheh, & Hemsworth,
2013; Brophey & Brown, 2009; Godener & Soderquist, 2004; Griffin & Page, 1996; Jiménez-
Zarco et al., 2006). Consequently, the most appropriate innovation measures are not always the
same ones. Following a study of IPMS literature, Dewangan and Godse (2014) propose five
guiding principles for the development of an effective performance measurement system:
• Multi-dimensional (financial and non-financial, hard and soft measures, leading and lagging indicators);
• Measuring performance of various stages within the innovation cycle;
• Addressing organizational stakeholder goals;
• Supporting a cause and effect relationship;
• Easy to implement and use (aligned with existing PMS and cascaded through various
hierarchical levels).
2.3.4.2 Review of the Gaps between the Popular Metrics and the Useful Ones
Godener and Soderquist (2004) regrouped the possible uses of R&NPD performance measurement
from literature into five categories:

26
1. Communication of objectives, agreements and rules;
2. Definition of corrective actions based on diagnosis and control;
3. Resource allocation;
4. Decision making on individual rewards and incentives;
5. Learning and continuous improvement.
Following an extensive review covering 40 years of literature, Werner and Souder (1997) purport
that the most complex metrics, which are also more costly to develop and use, are often the most
useful ones. Based on a survey of NPD practitioners that is known as ‘the definitive cataloguing of
success metrics’ , Griffin and Page (1993) found that there was little overlap between the measures
used and those that the practitioners believed would be more useful. When asked why they would
not measure what they believe would be useful to measure, the managers’ answers were as follows
(Griffin & Page, 1993):
1. Lack of appropriate systems in place (37% of respondents);
2. Company culture does not support measuring (17%);
3. No one is held accountable for the results (12%);
4. Short-term orientation (10%);
5. Lack of understanding of the development process (10%);
6. No time to measure (8%);
7. Measuring is unimportant (6%).
Jiménez-Zarco et al. (2006) suggest the use of the BSC approach to measure performance at the
various stage-gate steps by adapting the indicators for each stage. They suggest adding the
following four perspectives to the initial perspectives proposed by Kaplan and Norton (1992):
market, competence-based criteria, product and marketing. While many authors think that the BSC
can be used for innovation performance measurement (Bremser & Barsky, 2004; Gama, Silva, &
Ataíde, 2007; Kerssens-van Drongelen & Bilderbeek, 1999; Kerssens-van Drongelen, Nixon, &
Pearson, 2000), some scholars question the effectiveness of this model to assess innovation
performance, in particular for smaller firms (McAdam, 2000; Oriot & Misiaszek, 2012). According
to McAdam (2000), the BSC reduces the flexibility necessary for SMEs.

27
There is no consensus among scholars (Jiménez-Zarco et al., 2006) nor practitioners (Griffin &
Page, 1993; Griffin & Page, 1996) on the choice of model of measurement nor the success
innovation dimensions to use. Indeed, Griffin and Page (1996) found over 75 measures in use for
product development success with little consensus on which are the most useful (Griffin & Page,
1993). The authors believe that the most appropriate measures of product development success
depend on the company’s strategy and consequently may vary for different types of development
projects (new to the world vs product line extension, etc.) (Griffin & Page, 1996). According to
Griffin and Page (1993), three independent dimensions make up NPD project success: consumer-
based, financial and technical or process-based. They claim that a perfectly successful project on
all three dimensions does not exist (Griffin & Page, 1996).
Donnelly (2000) documented the most used R&D performance measures. However, the most
popular measures are not always well integrated with the company’s strategy and in 40% of the
cases the new products do not achieve the desired results (Donnelly, 2000). While the most popular
measures of new product success are financially-based indicators (Jiménez-Zarco et al., 2006),
there is no evidence of their usefulness for innovation decision-making (Godener & Soderquist,
2004). Following an investigation of UK service firms, Storey and Kelly (2001) found that financial
measures are mostly used by less innovative firms while the ‘truly’ innovative ones favour soft
indicators to measure performance. The customer-focused indicators are often used by the fast-
followers (Storey & Kelly, 2001). Kaplan and Norton (1992) believe that a holistic approach to a
company’s performance is important to prevent sub optimization.
2.3.5 PMS in SMEs
Following a literature review on performance measurement within manufacturing SMEs, Garengo
et al. (2005) highlight three aspects differentiating small and large firms: uncertainty, evolution
and innovation. They identified five common characteristics of performance measurement in
SMEs:
• It is difficult to involve SMEs (especially their top managers) in a performance measurement project and make sure they carry it out to completion due to a lack of time available for non-operational activities.
• Most SMEs either do not use a performance measurement model or use it incorrectly by not properly adapting it to their specific context – they do not take the time to fully understand the implications of the model they choose and of the adaptations they make.

28
• SMEs lack a holistic approach to performance measurement implementation – they often focus on operational and financial perspectives.
• Performance measurement is often informal and poorly aligned with strategy (Chennell et al., 2000). In addition, it often focuses on control of past activities much more than on forecasting future processes.
• Limited data analysis resources add to the ambiguity of measures which results in low data legitimacy.
All these conditions were experienced at the Partner Company. Garengo et al. (2005) also compiled
the characteristics of SMEs that can be obstacles to the successful implementation of PMS:
• Lack of human resources;
• Low managerial capacity;
• Limited capital resources;
• Reactive approach;
• Tacit knowledge and low formalization of processes;
• Misconception of performance measurement.
All these obstacles were also experienced at the Partner Company.
Many authors highlight the importance of PMS for SMEs to be simple (M. G. Brown & Svenson,
1988; Garengo et al., 2005; Laitinen, 1996, 2002; Neely et al., 1996) in order to provide focused,
useful and easy to understand information. Indeed, SMEs often do not have the resources to
implement and use complex models (Garengo et al., 2005; Laitinen, 1996; McAdam, 2000). It is
however paramount to ensure that the simplicity of the PMS is not done at the expense of its
completeness (McAdam, 2000) and usefulness (Werner & Souder, 1997). This is a challenging
task in the context where a PMS for SMEs should support uncertainty, risk management and
innovation processes (Garengo et al., 2005).
An additional challenge to performance measurement of innovation activities in SMEs is the fact
that the innovation activities and resources often cross the boundaries of conventional R&D and
NPD teams and are dispersed within the company (Lazzarotti et al., 2011), as it was the case at the
Partner Company. The PMS must be dynamic and flexible to respond to the needs of SMEs
(Garengo et al., 2005). Finally, Greatbanks and Boaden (1998) claim that SMEs often do not
understand their own success factors and have poor strategic planning.
29
2.3.6 PMS and Intrapreneurial Culture
As intrapreneurship is not fundamentally “focused, cumulative, productive, or strategically
relevant”, an intrapreneurial environment in itself does not guarantee superior innovation and firm
performance (Goodale et al., 2011). This supports the need for adequate operations control
mechanisms to ensure that intrapreneurship is indeed contributing to the company’s goals and
future. Several authors argue that control systems provide guidance and direction to the company’s
innovation efforts thus contributing to higher effectiveness (Kuratko, Covin, et al., 2014;
Marginson, 2002). On the other hand, control systems can inhibit employee creativity and
intrapreneurial efforts (Christensen, 1997; M. H. Morris & Kuratko, 2002; Pinchot III, 1985; Shih
& Yong, 2001). Moreover, the introduction of an innovation PMS can become a significant cultural
challenge (Kerssens-van Drongelen & Cooke, 1997). According to Kuratko, Hornsby, et al. (2014),
a company that wants to develop an environment conducive to intrapreneurship must strive to
measure the dimensions associated with an innovative environment.
Covin and Slevin (2002) see operations control systems as part of the organization’s ‘hardware’
from “which individuals take their behavioural cues”. Such systems have an impact on employees’
behaviours and can either favor or impede innovation efforts and intrapreneurship. Consequently,
a good alignment of operations controls with an intrapreneurial strategy is required for successful
innovation (Goodale et al., 2011; Ivanov & Avasilcăi, 2014). Hornsby et al. (2009) add that
individual evaluation and reward systems must be aligned with an innovation strategy. This is
consistent with numerous researchers who support the importance of the role of control systems in
innovation success (Das & Joshi, 2007; Khazanchi, Lewis, & Boyer, 2007; Naveh, 2007).
2.3.7 Innovation-oriented vs Execution-oriented PMS
While traditional PMS mostly focus on financial performance and operational efficiency (Kaplan
& Norton, 1992), such indicators are not adequate for innovation performance measurement that
requires a focus on more intangible aspects (Gama et al., 2007; Kaplan & Norton, 2001) and on
continuous improvement (Dewangan & Godse, 2014). According to Covin and Slevin (1991),
higher levels of entrepreneurship are associated with control systems that focus on results rather
than processes, and that are more informal and loose. M. H. Morris et al. (2006) refer to ‘freedom
within a framework’ (Collins, 2001) and ‘opportunistic flexibility’ to advocate for a good balance

30
of ‘loose-tight’ properties (Peters & Waterman, 1982) within control systems encouraging
innovation in established organizations.
As M. H. Morris et al. (2006) nicely put it: controls “are a reflection of human nature” as their
design reflects the nature of management and their assumptions on the nature of employees. The
authors believe that in order to align the goals of the employees with those of the organization, self-
control and social control play a more important role than procedure control (M. H. Morris et al.,
2006). Hence, they highlight the importance of informal control mechanisms in complex settings
requiring intrapreneurial and operational coexistence. Their research confirms that control systems
have a non-linear impact on intrapreneurship in organizations. M. H. Morris et al. (2006) add that
when controls focus on efficiency and micro-management, they can become a major obstacle to
intrapreneurship. The authors explain that theoretically, “control systems are designed in a manner
that facilitates effective outcomes, where these outcomes include risk reduction, elimination of
uncertainty, highly efficient operations, goal conformance, and specific role definitions”.
Moreover, Kaplan and Norton (1992) believe that strategy and vision – not control – are at the
center of IPMS. This is coherent with Hitt, Hoskisson, Johnson, and Moesel (1996) who conclude
that innovative companies favour strategic controls over financial ones. Following an investigation
on the use and desired use of measures to evaluate NPD success within practitioners, Griffin and
Page (1996) found that while the firms with the most innovative strategies focus on measures of
recent and future company growth, those with the least innovative strategies choose metrics more
oriented toward efficiency.
Tellis et al. (2009) found a positive relationship between radical innovation and R&D activities.
Indeed, one approach to R&D performance evaluation is to look at the associated expenditures
(Bremser & Barsky, 2004) as they can be a measure of a firm’s commitment to innovation (Tellis
et al., 2009). According to Gama et al. (2007), an innovation-oriented PMS would have more
indicators regarding the invested resources than traditional PMS that have mostly financial
measures. However, inputs such as R&D resources do not guarantee the development of new
innovative products (Acs & Audretsch, 1987; Griliches, 1990) nor their commercial success (Tellis
et al., 2009; Von Hippel, 2005). Busby and Williamson (2000) add that the typical approach to
measuring engineering design by comparing cost and schedule discrepancies has many flaws. It
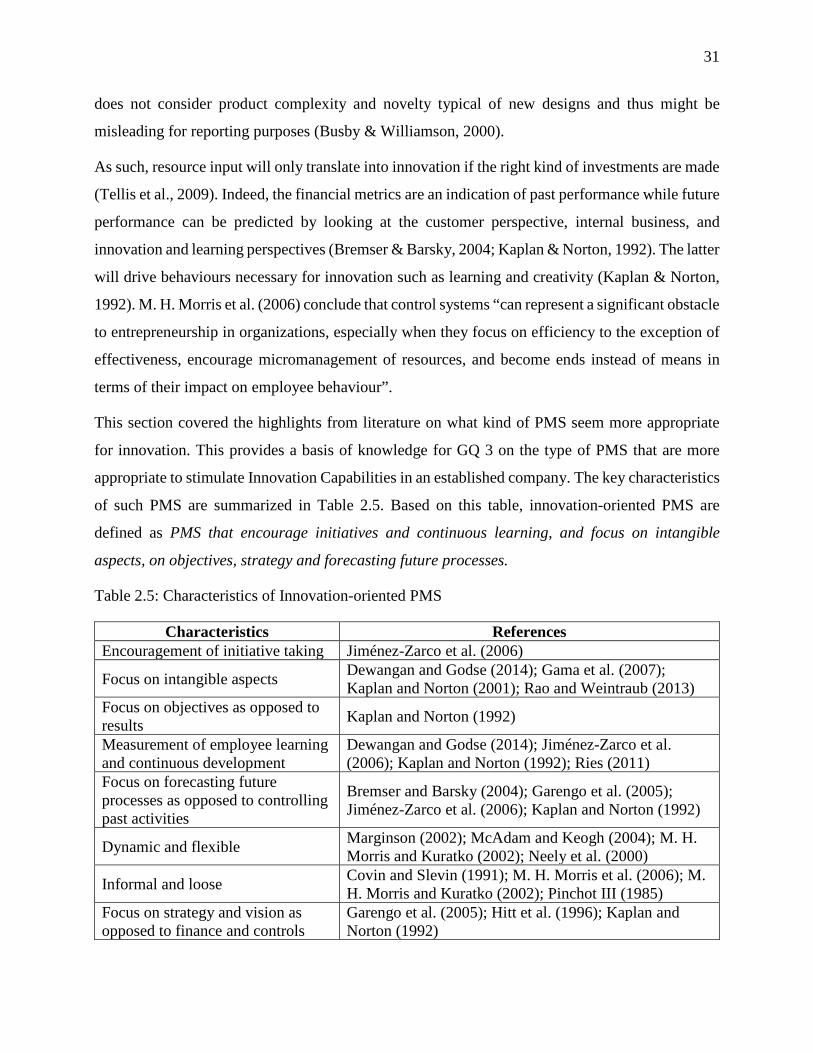
31
does not consider product complexity and novelty typical of new designs and thus might be
misleading for reporting purposes (Busby & Williamson, 2000).
As such, resource input will only translate into innovation if the right kind of investments are made
(Tellis et al., 2009). Indeed, the financial metrics are an indication of past performance while future
performance can be predicted by looking at the customer perspective, internal business, and
innovation and learning perspectives (Bremser & Barsky, 2004; Kaplan & Norton, 1992). The latter
will drive behaviours necessary for innovation such as learning and creativity (Kaplan & Norton,
1992). M. H. Morris et al. (2006) conclude that control systems “can represent a significant obstacle
to entrepreneurship in organizations, especially when they focus on efficiency to the exception of
effectiveness, encourage micromanagement of resources, and become ends instead of means in
terms of their impact on employee behaviour”.
This section covered the highlights from literature on what kind of PMS seem more appropriate
for innovation. This provides a basis of knowledge for GQ 3 on the type of PMS that are more
appropriate to stimulate Innovation Capabilities in an established company. The key characteristics
of such PMS are summarized in Table 2.5. Based on this table, innovation-oriented PMS are
defined as PMS that encourage initiatives and continuous learning, and focus on intangible
aspects, on objectives, strategy and forecasting future processes.
Table 2.5: Characteristics of Innovation-oriented PMS
Characteristics References Encouragement of initiative taking Jiménez-Zarco et al. (2006)
Focus on intangible aspects Dewangan and Godse (2014); Gama et al. (2007); Kaplan and Norton (2001); Rao and Weintraub (2013)
Focus on objectives as opposed to results Kaplan and Norton (1992)
Measurement of employee learning and continuous development
Dewangan and Godse (2014); Jiménez-Zarco et al. (2006); Kaplan and Norton (1992); Ries (2011)
Focus on forecasting future processes as opposed to controlling past activities
Bremser and Barsky (2004); Garengo et al. (2005); Jiménez-Zarco et al. (2006); Kaplan and Norton (1992)
Dynamic and flexible Marginson (2002); McAdam and Keogh (2004); M. H. Morris and Kuratko (2002); Neely et al. (2000)
Informal and loose Covin and Slevin (1991); M. H. Morris et al. (2006); M. H. Morris and Kuratko (2002); Pinchot III (1985)
Focus on strategy and vision as opposed to finance and controls
Garengo et al. (2005); Hitt et al. (1996); Kaplan and Norton (1992)

32
In the context of the innovation KPI development mandate within the Partner Company, it was
necessary to start with a good understanding of the key characteristics of an effective PMS. Thus,
Table 2.6 presents an overview of such characteristics from the literature review as well as how it
applies to the specifics of our Case Study. This summary served as the basis for the KPI choices
and propositions.
2.4 Critical Review
This section presents a short summary of the key insights from literature regarding the five Guiding
Questions presented in section 1.3 and how they are relevant to the situation at the Partner
Company.
GQ 1: What are the dynamic relationships and mutual reinforcement mechanisms between
a company’s Culture and its PMS?
Control systems have influence on employees’ behaviours which in turn contribute to a given
Corporate Culture. Consequently, the introduction of innovation PMS in a non-innovative
Corporate Culture can present a major cultural challenge (Kerssens-van Drongelen & Cooke,
1997). An attempt to do so resulted in resistance at the partner Company as explained in more
detail in Chapter 4. In order to avoid conflicts when asking employees to be innovative, it is
important that their performance evaluation and reward systems are aligned with an innovation
strategy (Hornsby et al., 2009). This was not the case at the Partner Company. In fact, alignment
in general was a major issue during this project as explained in Chapter 4.
GQ 2: How do the specific contexts created by the combinations of Culture and PMS
influence, improve or deteriorate the company’s Innovation Capabilities?
No literature was found specifically on this triple relationship supporting the relevance of further
research on the subject.
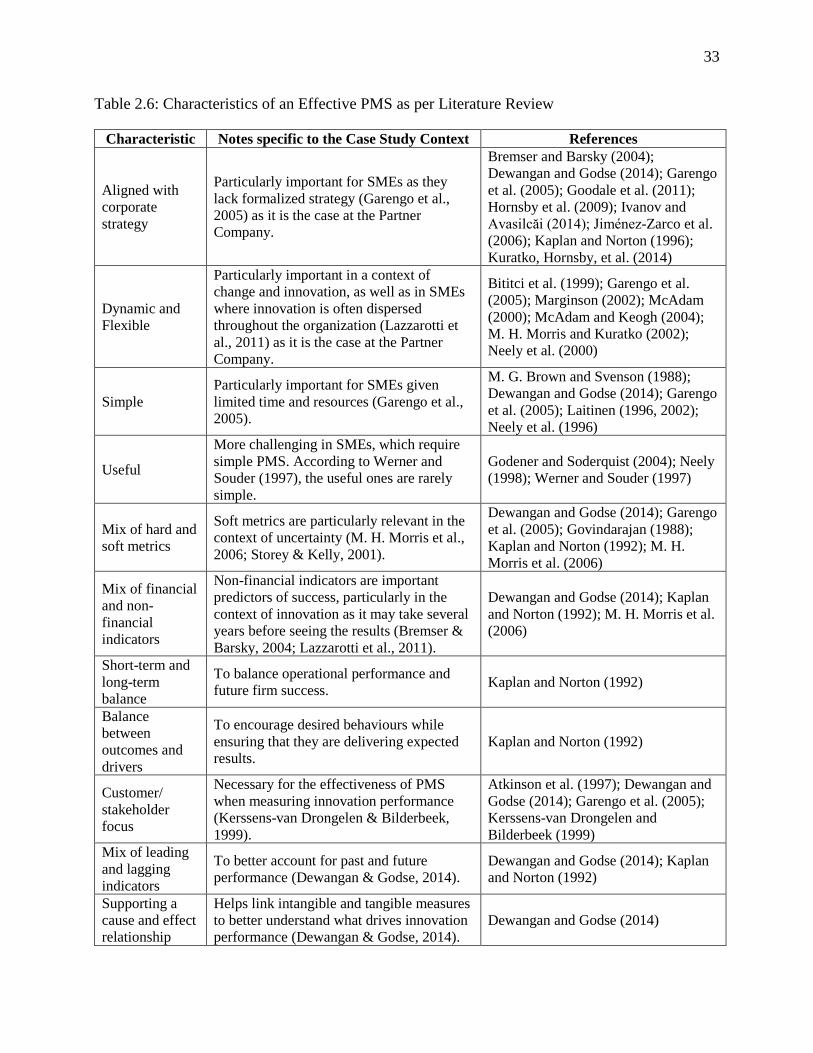
33
Table 2.6: Characteristics of an Effective PMS as per Literature Review
Characteristic Notes specific to the Case Study Context References
Aligned with corporate strategy
Particularly important for SMEs as they lack formalized strategy (Garengo et al., 2005) as it is the case at the Partner Company.
Bremser and Barsky (2004); Dewangan and Godse (2014); Garengo et al. (2005); Goodale et al. (2011); Hornsby et al. (2009); Ivanov and Avasilcăi (2014); Jiménez-Zarco et al. (2006); Kaplan and Norton (1996); Kuratko, Hornsby, et al. (2014)
Dynamic and Flexible
Particularly important in a context of change and innovation, as well as in SMEs where innovation is often dispersed throughout the organization (Lazzarotti et al., 2011) as it is the case at the Partner Company.
Bititci et al. (1999); Garengo et al. (2005); Marginson (2002); McAdam (2000); McAdam and Keogh (2004); M. H. Morris and Kuratko (2002); Neely et al. (2000)
Simple Particularly important for SMEs given limited time and resources (Garengo et al., 2005).
M. G. Brown and Svenson (1988); Dewangan and Godse (2014); Garengo et al. (2005); Laitinen (1996, 2002); Neely et al. (1996)
Useful
More challenging in SMEs, which require simple PMS. According to Werner and Souder (1997), the useful ones are rarely simple.
Godener and Soderquist (2004); Neely (1998); Werner and Souder (1997)
Mix of hard and soft metrics
Soft metrics are particularly relevant in the context of uncertainty (M. H. Morris et al., 2006; Storey & Kelly, 2001).
Dewangan and Godse (2014); Garengo et al. (2005); Govindarajan (1988); Kaplan and Norton (1992); M. H. Morris et al. (2006)
Mix of financial and non-financial indicators
Non-financial indicators are important predictors of success, particularly in the context of innovation as it may take several years before seeing the results (Bremser & Barsky, 2004; Lazzarotti et al., 2011).
Dewangan and Godse (2014); Kaplan and Norton (1992); M. H. Morris et al. (2006)
Short-term and long-term balance
To balance operational performance and future firm success. Kaplan and Norton (1992)
Balance between outcomes and drivers
To encourage desired behaviours while ensuring that they are delivering expected results.
Kaplan and Norton (1992)
Customer/ stakeholder focus
Necessary for the effectiveness of PMS when measuring innovation performance (Kerssens-van Drongelen & Bilderbeek, 1999).
Atkinson et al. (1997); Dewangan and Godse (2014); Garengo et al. (2005); Kerssens-van Drongelen and Bilderbeek (1999)
Mix of leading and lagging indicators
To better account for past and future performance (Dewangan & Godse, 2014).
Dewangan and Godse (2014); Kaplan and Norton (1992)
Supporting a cause and effect relationship
Helps link intangible and tangible measures to better understand what drives innovation performance (Dewangan & Godse, 2014).
Dewangan and Godse (2014)

34
GQ 3: What kind of PMS is more appropriate to stimulate Innovation Capabilities in an
established company?
There is a gap between the measures proposed in literature and those required to fulfill the needs
of innovative firms (Dewangan & Godse, 2014). A review of 40 years of literature by Werner and
Souder (1997) suggests that the most useful metrics are often the more complex and more costly
to develop and use. This could help explain the gap found by Griffin and Page (1993) between the
measures used by the practitioners and those they wish to use. This was seen with the NPD
indicators development project at the Partner Company mentioned in section 1.4.3. Moreover,
during the author’s mandate at the Company it was possible to observe a tendency to favour the
simplest and most accessible indicators without questioning their usefulness. In addition, the
development of more complex metrics that were believed to be more useful was put on hold or
abandoned. While there is no clarity in literature on the most appropriate measures to stimulate
Innovation Capabilities, some characteristics of PMS favorable to innovation do emerge, as
presented in Table 2.5.
GQ 4: How could PMS reinforce or kill the seeds of the Intrapreneurial Culture needed to
foster long-term Innovation Capabilities?
There is a fundamental tension between control systems and intrapreneurship. On the one hand,
the control systems aim to optimize, standardize and reduce uncertainty (Goodale et al., 2011). On
the other hand, intrapreneurship is all about uncertainty and getting out of the box (M. H. Morris
et al., 2006; Wiklund & Shepherd, 2005). While intrapreneurship is closely linked to innovation,
intrapreneurship itself does not guarantee successful innovation. This is why a number of authors
argue the importance of PMS in guiding innovation efforts towards higher performance (Kuratko,
Covin, et al., 2014; Marginson, 2002). However, other authors have shown how PMS can inhibit
employees’ creativity and intrapreneurship (Christensen, 1997; M. H. Morris & Kuratko, 2002;
Pinchot III, 1985; Shih & Yong, 2001).
Hence, some indicators can support intrapreneurship while others can kill it. This is why it can be
counterproductive to prioritize whichever measures are readily available or easy to implement as
it was done at the Partner Company. Innovation performance measurement is idiosyncratic
(Bremser & Barsky, 2004; Brophey et al., 2013; Brophey & Brown, 2009; Godener & Soderquist,
2004; Griffin & Page, 1996; Jiménez-Zarco et al., 2006). Therefore, appropriate indicators for a

35
given situation must be chosen. Thus, for successful innovation, the controls must be aligned with
an intrapreneurial strategy (Goodale et al., 2011; Ivanov & Avasilcăi, 2014). Such a strategy, as
well as alignment, were absent at the Company at the time of study.
GQ 5: What dimensions of an Intrapreneurial Culture are most important to implement or
change in order to stimulate Innovation Capabilities?
As presented in sections 2.2.2 and 2.2.3, the existing literature supports the importance of the role
played by the Corporate Culture in developing Innovation Capabilities. Several dimensions of the
Corporate Culture were highlighted as important to develop in order to stimulate Innovation
Capabilities:
• Learning (Ballé et al., 2016; Ries, 2011; Saunila, 2016);
• Leadership (Kuratko, Hornsby, et al., 2014; Saunila, 2016);
• Work climate and well-being (Saunila, 2016);
• Work discretion and autonomy (Kuratko, Hornsby, et al., 2014; Saunila, 2016);
• Rewards and incentives (Kuratko, Hornsby, et al., 2014; Saunila, 2016);
• Time availability (Kuratko, Hornsby, et al., 2014; Saunila, 2016);
• Organizational structures and boundaries (Kuratko, Hornsby, et al., 2014; Saunila, 2016).
In addition, key characteristics of an intrapreneurial culture that can stimulate innovation found in
literature are presented in Table 2.4.

36
CHAPTER 3 METHODOLOGY
This study is an in-depth investigation of how organizational culture and PMS influence a
company’s Innovation Capabilities. Such a subject inspired an iterative research design mainly
based on an inductive, theory building approach along with a choice of four different research
strategies (Grounded Theory, Intervention Research, Action Research and Case Study) and
multiple data collection methods. This type of empirical study cannot serve to test hypotheses and
develop generalizable results (Hlady-Rispal, 2016). It allows sense-making and development of
propositions or frameworks to be further tested. Each of the research design choices are explained
in more detail in this chapter while an overview of the design choices is presented in Table 3.1
along with the references to the relevant sections.
Table 3.1: Overview of the Research Design Choices
Category Research Design Choices Research Approach (section 3.1) Inductive / Theory Building
Research Strategies (section 3.2)
Grounded Theory (section 3.2.1) Intervention-research (section 3.2.2) Action-research (section 3.2.3) Case Study (section 3.2.4)
Research Time-horizon (section 3.3) Longitudinal Research
Data Collection Methods (section 3.5.3)
Prior Data (section 3.5.3.1) Document Review (section 3.5.3.2) Interviews (section 3.5.3.3) Workshops (section 3.5.3.4) Questionnaire (section 3.5.3.5) Observations (section 3.5.3.6) Meetings (section 3.5.3.7)
The research design is iterative and not fully predictable at the beginning of the study as it depends
on how observations and organizational dynamics at each step unfold. While it is impossible to
plan this type of research completely, three high-level stages were planned and carried out: Field
Preparation, On-site research and Final Analysis. The detailed research steps were adjusted
continuously based on ongoing observations and evolved over a continuous interaction between
knowledge development and knowledge transfer (see section 1.4.2). Thus, theory and practice flow
in parallel with continuous literature review, data collection, and analysis and interpretation feeding
one another.
37
The iterative dynamic and the key research steps are presented in Figure 3.1. Although there were
continuous links between literature review, observations, and analysis and interpretations, they are
omitted in Figure 3.1 to simplify the visual representation. After each key data collection step, there
was continuous observation, and analysis and interpretation. These links were similarly omitted.
Re-occurring events such as regular meetings with the IRDT director were not represented on
Figure 3.1. Finally, the various colours in Figure 3.1 are used to better distinguish the links.
This chapter details the different research design choices that were made. It begins with the
inductive research approach that allows sense-making based on observation in section 3.1. Four
appropriate research strategies are then presented in section 3.2 and followed by explanations on
the longitudinal time-horizon choice in section 3.3. An overview of the research participants is
presented in section 3.4. Finally, all data collection methods used as part of our mixed-model
research design are presented in section 3.5.
3.1 Research Approach
As explained in Chapter 1, our research is driven by problems observed in industry. We are
interested in an in-depth understanding of complex organizational dynamics. More specifically, we
are looking for the best management levers to develop and implement Innovation Capabilities in
order to respond to the problems many companies face when they grow and lose their
entrepreneurship. The inductive, theory building approach was chosen as it is more appropriate for
studies searching to understand complex human interactions as opposed to the deductive,
hypothesis testing approach (Saunders et al., 2011). However, this type of empirical study cannot
serve to test hypotheses and develop generalizable results (Hlady-Rispal, 2016; Saunders et al.,
2011). Instead of validating a theory with data, the inductive approach implies collecting data, often
qualitative, to propose theories or frameworks through sense-making. This approach generally
implies a more flexible research structure and a close understanding of the research context
(Saunders et al., 2011). Moreover, a much larger portion of research on innovation is based on the
deductive approach (Hlady-Rispal, 2016). Consequently, there is value in complementing it with
insights from a more exploratory and open-ended field research.

38
Figure 3.1 Key Data Collection Methods and Research Process Flow

39
3.2 Research Strategies
A combination of four interrelated research strategies was used for this study and is presented in
more detail in the following paragraphs. Saunders et al. (2011) highlight that the strategies are not
mutually exclusive and it is possible to use several research strategies as part of one main strategy.
The Grounded Theory strategy, presented in section 3.2.1, is the global strategy chosen for this
study. It guides the overall iterative data collection and analysis approach, and capitalizes on the
observations made through the other research strategies to make sense of how change unfolds in
practice. It is used to conceptualize the observations into propositions and a conceptual framework.
The main tactical strategy used is Intervention-research (see section 3.2.2) through the innovation
KPI development project at the Partner Company. The Action-research strategy presented in
section 3.2.3 and the Case Study strategy presented in section 3.2.4 are the complementary
strategies used in this research. An overview of the added value of each of the four research
strategies is presented in Figure 3.2.
3.2.1 Grounded Theory
We want to avoid falling into the traps of being limited by existing best practices. The aim is to
open ourselves up to potential new knowledge and understanding regarding our research question.
Grounded Theory is therefore a relevant strategy for this study as it can be used to develop or
propose theory based on an interpretative process and analysis of data collected through series of
field observations (Saunders et al., 2011). Such a strategy can provide particularly rich results when
combined with the three other chosen strategies as the sense making process is based on a deep-
dive of the research subject in a specific context.
Suddaby (2006) discusses the common misconceptions about grounded theory. The author
highlights that grounded theory is not about the raw data as, contrary to a phenomenological study,
the grounded theory researcher is not interested in the specific words and stories. The grounded
theory researcher must ‘lift’ the data to a ‘slightly higher level of abstraction’ (Suddaby, 2006).
Moreover, grounded theory is not theory testing or content analysis. It is a messy, non-linear
interpretative process. Thus, the researcher must develop a ‘feel for their data’ and should treat the
process as a highly creative one (Suddaby, 2006).

40
In grounded theory, data collection, coding, memoing and analysis are a constant iterative process.
It begins with open coding. Throughout the comparison of new data with existing and emerging
codes, a core category and its closely related categories should emerge. The coding process happens
in tandem with memoing, which implies field notes about the data and the conceptual connections
between the different categories (Holton, 2010). The goal of memoing is “to develop ideas with
complete conceptual freedom” in order to “raise the data to a conceptual level” (Holton, 2010).
Holton (2010) explains that the sorting of memos, which also happens continually, generates more
memos on higher conceptual levels. “As coding and memoing progress, patterns begin to emerge”
(Holton, 2010). The memos are integrated with existing literature related to the emerging theory,
generating new memos. This iterative process eventually leads to the materialization of a theory or
a conceptual framework.
Case Study: Complementary Strategy • Used for in-depth understanding; • Appropriate for highly complex
human and organizational dynamics (Merriam, 2002; Stake, 2000)
• Preferred strategy (Yin, 2013): • for ‘how’, ‘what’ or ‘why’
questions; • when the investigator has little
control over events; • when focusing on a
contemporary phenomenon within some real-life context.
Action-research: Complementary Strategy
• Bridges the gap between research and practice;
• Key strength: focus on tangible change within the partner organization (Saunders et al., 2011);
• Allows one to capture the sense-making processes of stakeholders as they unfold, avoiding bias by predictable patterns of action and decision making promoted by best practices.
Intervention-research: The Tactical Strategy • Participate in action; • Test different approaches and observe their consequences; • Optimize the approach for the particular context of the research.
Grounded Theory: The Global Strategy • Sense making of how change unfolds in practice; • Potential to develop and propose frameworks, theories or new research opportunities.
Figure 3.2: Overview of the Added Value of Each of the Four Research Strategies

41
3.2.2 Intervention-research
Intervention-Research allows the researcher to actively participate in company initiatives and test
different approaches to observe the consequences. These conditions give the researcher the
opportunity to observe through direct participation in order to understand and analyze in-depth the
decision-making and behaviours of innovation stakeholders in diverse functional groups and at
various hierarchical levels. The author’s intervention was done mainly through the innovation KPI
development mandate. This project required several interventions and interactions with multiple
innovation stakeholders. These interactions allowed for a better understanding of stakeholders’
reactions to new approaches. The data collection methods used in the context of the required
interventions were Workshops (section 3.5.3.4), Meetings (section 3.5.3.7) and Observations
(section 3.5.3.6).
Moreover, the quality of the intervention-research strategy was highly increased by the richness of
the observations possible through full-time action-research. These observations helped design more
appropriate and effective interventions. The combination of intervention-research with action-
research results in higher interpretation and analysis reliability.
3.2.3 Action-research
At the time of this study, the Company was going through a leadership transition from second to
third-generation family members. The analysis of how each generation has influenced the
Company’s growth and approach to innovation (Hiebl, 2015) suggests that the Company’s
management approach is anchored in intuitive and emotional management and decision-making
styles as opposed to a more rational approach based on management theories (Freel, 2000;
McAdam, Keogh, Reid, & Mitchell, 2007; Schmitt et al., 2015). The full-time presence of the
author on site for 11 months, allowed for multiple observation perspectives of the change unfolding
within the Partner Company beyond the Intervention-research mandate. Thus, following
recommendations from past research in this type of context, Action-Research was a
complementary strategy used in this study through informal observations in the field (Schmitt et
al., 2015).
Moreover, we are interested in better understanding how to support organizations in rejuvenating
their Innovation Capabilities. Rousseau (2006) speaks of the ‘research-practice gap’ as the failure
42
of managers in using management knowledge from research to improve their organizations as well
as the difficulties of transferring research findings into the workplace. One way to close the gap is
to involve practitioners in the research (Schein, 1999) which can be done by using the Action-
research strategy (Saunders et al., 2011).
The resulting observations allow us to capture the very personal sense-making processes of
stakeholders as they unfold. Such an approach helps avoid bias by predictable patterns of action
and decision making like the ones promoted by best practices from the literature. One of the key
strengths of the action-research strategy is its focus on tangible change within the partner
organization (Saunders et al., 2011). The data collection methods used as part of this strategy are
Interviews (section 3.5.3.3), Questionnaire (section 3.5.3.5) and Observations (section 3.5.3.6).
3.2.4 Case Study
According to T. Morris and Wood (1991), the Case Study strategy is particularly relevant when
the researchers seek to obtain a deep understanding of the processes being enacted within a specific
research context. Yin (2013) claims that the “case study is the preferred strategy “when ‘how’,
‘what’ or ‘why’ questions are being posed, when the investigator has little control over events, and
when the focus is on a contemporary phenomenon within some real-life context”. This is the case
of our study as the RQ and GQs are ‘how’ or ‘what’ questions that are investigated within a real
enterprise. The Case Study was also chosen as a complementary strategy, since the study is based
on a single company.
Other authors support the use of the case study strategy for research into highly complex human
and organizational dynamics (Merriam, 2002; Stake, 2000) as is the case with the development of
Innovation Capabilities within an established company. A Case Study strategy implies the use of a
combination of several data collection techniques and therefore requires triangulation (Saunders et
al., 2011).
3.3 Research Time-horizon
Our research group is interested in studying how organizational dynamics evolve and in
understanding the change required to develop better Innovation Capabilities in an established firm.
Studying change and development is the main strength of longitudinal research (Saunders et al.,

43
2011). It is thus an appropriate choice, as a significant period of time is necessary to observe and
understand the evolution of organizational dynamics at the center of this study (Hlady-Rispal,
2016). Such a methodology requires the researcher to be (Moisdon, 2016; Schmitt et al., 2015):
• present at the Company on a regular basis;
• in direct and frequent contact with the stakeholders;
• an integral member of the innovation team.
The field research presented in this thesis is part of an on-going multi-year action-research program
at the Partner Company which began in June 2015 and is still on-going. The researcher was in the
field full-time for 11 months, from June 2016 to May 2017, concurrently with two other
researchers. While this study is based mainly on the author’s field presence during phase II of the
longitudinal study, data and research observations from phase I and the beginning of phase III were
also used. This provides a better longitudinal perspective than what would normally be possible in
11 months. Table 3.2, adapted from Lakiza and Deschamps (2018), presents the three research
phases along with the knowledge development and knowledge transfer focus of each phase. The
specific objects of this study are presented in bold in this table.
3.4 Research Participants
In the context of this field study the researcher was working from within the IRDT group under the
Engineering department and was given a specific mandate by the IRDT Director, who reports
directly to the VP of Engineering. The proximity to different stakeholders throughout the study
was accordingly limited based on the position within the Company structure. While the researcher
had numerous opportunities to interact with several VPs, she was not in a position to witness
firsthand how important innovation is for the executives and how committed they really are to
revitalize the Company through innovation.
The researcher’s position within the Company’s structure also explains the higher number of
participants from within the Engineering department. Moreover, as the participation in the study is
voluntary, most of the main participants were the people who played an important role in
innovation and who were more closely involved with the researcher’s mandate within the
Company. A few people less involved in innovation but highly interested were also included. Table
3.3 presents the distribution of the study participants across departments and hierarchy levels.

44
While the number of participants from Marketing is close to that of many other departments, it is
to be noted that Marketing is a much smaller department compared to all others. Consequently,
most people from Marketing involved in innovation were included in the study.
Table 3.2: The Longitudinal Research Phases at the Partner Company, adapted from Lakiza and
Deschamps (2018)
Phase I Phase II Phase III 2015-2016 2016-2017 2017-2018 Researcher 1 Researchers 2, 3 & 4 Researchers 5, 6 & 7
Res
earc
h Th
emes
Planning & Early Implementation of Innovation Tools
Further Implementation and Integration of Innovation Capabilities
Continuous Organizational Change: Development, Implementation, Diffusion, Use and Acceptance
Kno
wle
dge
Dev
elop
men
t
Implementation of Product Development Processes (PDP) and basis for Innovation Strategy
Roles of innovation PMS and culture
Tools for R&D-marketing interface at FEI
Tools for Uncertainty-Novelty assessment
Multifunctional integration during major product innovations: Digitalization of products (IoT)
Development and use of market scanning & analysis tools to facilitate radical/ disruptive innovations
Development of methods for Open & Collaborative Innovation and expansion of technological innovations
Kno
wle
dge
Tran
sfer
- Partial stage-gate implementation - Development of basic methods for Business case - Preliminary data analysis for Strategic Arenas
Establish-ment of basic innovation measures
Assessment of idea generation processes
Diagnostic of Maturity Levels and needs for information system and management
Planning the introduction of IoT in one product line
More quantitative data analysis tools to improve objective & fair technology and new opportunities analysis
Extension of number and types of collaborators to raise innovation levels and productivity
While Table 3.3 compiles the main participants throughout the field research, it excludes part of
the people who participated in the Innovation Quotient (IQ) Questionnaire (for more details see
section 3.5.3.5). A larger group than the regular participants was invited to fill in the questionnaire
and, since the participants who answered online were anonymous, it is impossible to know how
exactly they overlap with the regular study participants.

45
Table 3.3: Distribution of the Study Participants across Departments and Hierarchy Levels
Department CEO/EVP VP Director Manager Staff Total IRDT (Engineering) 1 4 3 8 Rest of Engineering 1 3 4 8 Marketing 1 3 4 Sales 1 1 1 3 Customer Service 1 2 3 IT/Strategy 1 1 1 3 Operations 1 1 2 Human Resources 1 1 2 CEO 1 1 Total 3 5 6 5 15 34
The study participants all have their own backgrounds and biases which guide their input through
the various data collection methods used. Moreover, as the participation in the study was not
mandatory, some people’s level of participation was influenced by their interest in innovation
and/or organizational culture. The influence of participants’ biases on the research findings was
limited by the use of numerous data collection methods, data triangulation, and confirmation of
analysis and interpretations with fellow researchers.
3.5 Data Collection and Analysis Choices
This study qualifies as mixed-model research as it combines quantitative and qualitative data
collection and analysis methods (Saunders et al., 2011). This approach is relevant when there is a
need for triangulation to corroborate research findings within a study (Bryman, 2016). When
conclusions coming from two or more different data sources or data collection methods are similar,
it gives more confidence in the interpretation and analysis, as it reduces various sources of bias that
are inevitable when conducting research with humans (Saunders et al., 2011).
First, the iterative flow between data collection, analysis and interpretation is explained in section
3.5.1. Subsequently, data reliability and validity are discussed in section 3.5.2. Finally, each of the
data collection methods used in this study is detailed in section 3.5.3.
3.5.1 Iterative Flow between Data Collection, Analysis and Interpretation
Data analysis is a sense making process that implies “taking something apart” (Stake, 2000). In
qualitative field research there is no specific beginning to data analysis (Stake, 2000) as it involves
continuous iteration between data collection and data analysis (Strauss & Corbin, 1998).

46
Consequently, data analysis began during the first days in the field to identify patterns and
questions in order to guide and facilitate subsequent data collection.
Any new observation made with one of the methods presented below was noted and a plan was
made to attempt to corroborate it by using a different data collection method in the future. In
addition, to limit participants’ biases, it was important to obtain similar information from different
participants. Similar findings were then clustered and discussed with the fellow researchers on-site
in order to verify the author’s interpretation and limit potential researcher biases. Once it was
agreed upon with all the on-site researchers, the subject was discussed with the academic supervisor
to strengthen the analysis and interpretation as well as decide on relevant next steps following the
recent findings.
Data was collected through the various means described in this section. Reoccurring observations
were compiled and triangulated. Emerging patterns were discussed with fellow researchers on a
weekly basis and with the academic supervisor monthly or anytime major questions or observations
arose. Mid-term preliminary observations and propositions were assembled and presented at the
ISPIM (International Society for Professional Innovation Management) Conference in Toronto in
March 2017 (Lakiza, Deschamps, & Brodeur, 2017). They were reviewed again during the last
month of field research in order to be presented to the Company as well as for the grant application
for phase III of the research (Deschamps et al., 2017). A final analysis was done during the months
following the end of phase II on site research.
The researcher’s background working in manufacturing as well as with intrapreneurs, and building
an intrapreneurial culture as well as implementing a PMS in a SME plays an important role in the
sense-making process (Creswell, 2005). The researcher’s experience guided the understanding of
participants’ stories, interpretation and next steps for data analysis. This is one of the reasons why
conferring with fellow researchers and the academic supervisor was so crucial for the entire
duration of the study.

47
3.5.2 Data Reliability and Validity
In order to ensure the reliability of the research findings, attention was paid to the four threats to
reliability described by Robson (2002). Table 3.4 presents the mitigation objectives and approaches
taken to address each of these threats. Robson (2002) also addresses threats to validity. The
mitigation objectives and approaches for each of the five threats are presented in Table 3.5.
Table 3.4: Mitigation Objectives and Approaches to Address Threats to Reliability
Threats to Reliability
(Robson, 2002)
Mitigation Objectives Mitigation Approaches
Subject or participant error
Limit bias due to the variation of the degree of enthusiasm that an employee can have toward his work and his colleagues throughout the work week and evolving work environment.
• Researcher’s daily presence in the field for a significant period of time (11 months);
• Use of multiple data collection methods, some using direct interaction with participants while others allowing observation of their actions and interactions with others from other departments and hierarchical levels;
• Repeated interactions with the same participants on the same subjects over time.
Subject or participant bias
Limit bias created by employees saying what their employers want them to say.
• Respondent’s anonymity was ensured for all individual interactions with the researcher – a Certificate of Ethical Compliance was issued for this study and Ethical guidelines were followed;
• As most participants took part in individual as well as group interactions with the researcher, it was possible to compare their varying opinions in different environments – multiple data collection methods gave numerous opportunities to validate or reject any specific answer by a participant.
Observer error
Ensure consistency in the ways the same questions are asked of different participants.
• The IQ Questionnaire questions were used as is (Rao & Weintraub, 2013);
• The structured parts of interviews and workshops were administered by the same researcher.
Observer bias
Limit false interpretations.
• Corroborating analysis and interpretation with fellow researchers and academic supervisor;
• Possibility to test analysis and interpretations over time.
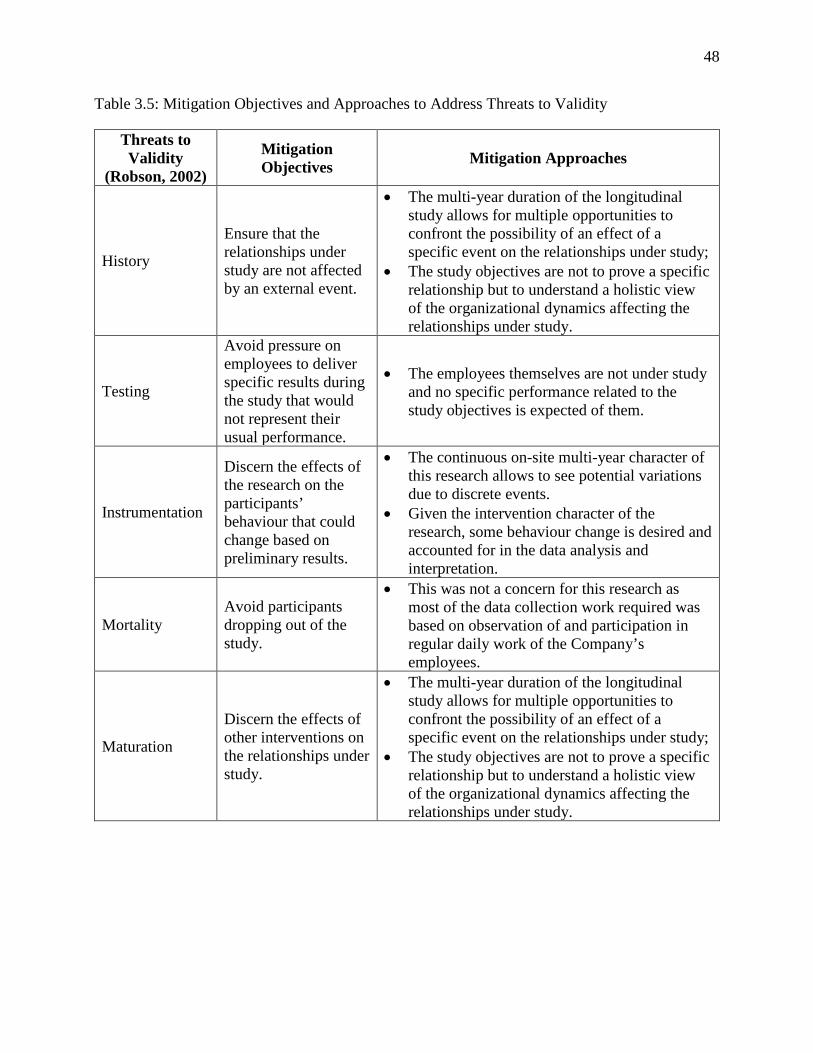
48
Table 3.5: Mitigation Objectives and Approaches to Address Threats to Validity
Threats to Validity
(Robson, 2002)
Mitigation Objectives Mitigation Approaches
History
Ensure that the relationships under study are not affected by an external event.
• The multi-year duration of the longitudinal study allows for multiple opportunities to confront the possibility of an effect of a specific event on the relationships under study;
• The study objectives are not to prove a specific relationship but to understand a holistic view of the organizational dynamics affecting the relationships under study.
Testing
Avoid pressure on employees to deliver specific results during the study that would not represent their usual performance.
• The employees themselves are not under study and no specific performance related to the study objectives is expected of them.
Instrumentation
Discern the effects of the research on the participants’ behaviour that could change based on preliminary results.
• The continuous on-site multi-year character of this research allows to see potential variations due to discrete events.
• Given the intervention character of the research, some behaviour change is desired and accounted for in the data analysis and interpretation.
Mortality Avoid participants dropping out of the study.
• This was not a concern for this research as most of the data collection work required was based on observation of and participation in regular daily work of the Company’s employees.
Maturation
Discern the effects of other interventions on the relationships under study.
• The multi-year duration of the longitudinal study allows for multiple opportunities to confront the possibility of an effect of a specific event on the relationships under study;
• The study objectives are not to prove a specific relationship but to understand a holistic view of the organizational dynamics affecting the relationships under study.

49
3.5.3 Data Collection Methods
A robust case study draws from multiple sources of evidence (Yin, 2013) and triangulation is key
in order to obtain reliable outcomes (Saunders et al., 2011; Stake, 2000; Yin, 2013). Several
primary and secondary data collection methods were used in this study so that key findings were
corroborated by results obtained using at least two additional methods. Data collected during phase
I of the longitudinal research was analyzed before the beginning of phase II on site. During the 11
months on-site the following data collection methods were used: document review, interviews,
workshops, an Innovation Quotient questionnaire, observations and meetings. The seven data
collection methods used are presented in Table 3.6 and categorized by primary versus secondary,
and those used through action-research vs intervention-research. The use of each method is
explained in more detail in this section while the interaction between data and analysis coming
from each of these methods is shown in Figure 3.1.
Table 3.6: Summary of the Data Collection Methods used
Primary Data Collection Methods Secondary Data Collection Methods Action-research Intervention-research 3.5.3.3 Interviews 3.5.3.5 Questionnaire 3.5.3.6 Observations
3.5.3.4 Workshops 3.5.3.6 Observations 3.5.3.7 Meetings
3.5.3.1 Data Collected Prior to Phase II 3.5.3.2 Document Review
3.5.3.1 Data Collected Prior to Phase II
As previously mentioned, the author was present in the field during phase II of the longitudinal
research. However, data collected during phase I, by Jonathan Brodeur and Isabelle Deschamps, is
also used for this study (Brodeur et al., 2017; Deschamps et al., 2016). The methods used to collect
data during phase I were the same methods as those used for this study and described in the
following sub-sections. Key observations from phase I were discussed in detail among the research
team in order to be explored further during phase II.
Additional steps were taken to consolidate the understanding of the system under study and help
better prepare for the presence in the field. A stakeholder mapping exercise inspired by FSG’s
Guide to Actor Mapping (Gopal & Clarke, 2016) was carried out with the first researcher in order
to understand (1) the key relationships among the main innovation stakeholders within the
Company; as well as (2) the positioning of the company within its industry and main markets with

50
careful attention to system pressures (Horowitz, 2014). The latter was further explored through an
industry analysis for the Canadian market (Lakiza, 2016; Yucel, 2015).
3.5.3.2 Document Review
As it is impossible for the researcher to be present throughout the Company’s history, a document
review can provide important data that the researcher could not witness themselves (Stake, 2000).
Key documents pertaining to innovation management and KPIs identified through other data
collection methods are presented in Table 3.7 (also see Figure 3.1).
Table 3.7: Documents Reviewed Following Identification through other Data Collection Methods
Document Identification Method Document Description
Reporting of Phase I of longitudinal research PDP Projects Portfolio Catalogue
Project charter interviews
− The Company’s Annual Reports 2015 and 2016; − IRDT Vision 2020 documents:
o IRDT Vision 2020 Project Charter; o IRDT Vision 2020 Voice-of-Customer (VoC) Survey; o IRDT Vision 2020 VoC Survey Compiled Results;
− PDP KPI development and tracking documentation; − Engineering department SWOT analysis documentation; − Innovation Center Business Plan; − Sample employee evaluation.
Interviews on past KPIs AIM (Agile Innovation Management) Monthly Project Reports
Access to the Company’s electronic innovation management folders was granted to the researchers.
Consequently, it was possible to see the innovation management documentation and detect if
something important was missing in the list of documents identified for review in Table 3.7.
3.5.3.3 Interviews
According to Stake (2000), ideally the data that we are looking for would be available through
observation only, as the interviews are always biased by the interviewee’s background, profile and
interests. However, it is impossible for the researcher to be present during all important events over
time. Hence, the interviews are necessary to complete the observations, especially in a longitudinal
study. Interviewing is a crucial data source as it allows one “to find out from [people] those things
we can’t observe” (Patton, 1987). Moreover, “the interview is the main road to multiple realities”

51
(Stake, 2000) as it allows the researcher to uncover different ways that people view the same
situation. Conversely, when multiple interviewees share the same point of view on a specific
subject it is possible to establish patterns, make key observations and triangulate data. A collection
of interviews paints a better picture than what any one individual can observe or experience (Stake,
2000).
A semi-structured approach (Merriam, 2002) was used for each of the interviews with mostly open-
ended questions in order to favor open and free discussion (Esterberg, 2002; Kvale, 1996). The
prepared interview questions were complemented with the use of follow-up and probing questions,
when possible, to encourage participants to elaborate on the subjects of interest (Denzin & Lincoln,
2008; Stake, 2000). The interviews had different objectives and were conducted with a various
number of stakeholders as presented in Table 3.8. The interview guides as well as more context on
the interviews are available in Appendix A.
Table 3.8: Objectives and Number of Participants for each Type of Interview
The interviews were conducted with employees coming from different departments and
hierarchical levels ranging from junior design engineer to Executive Vice-President (EVP). The
choice of employees for each type of interview was decided jointly by the researcher and the IRDT
director using the following guidelines:
• Close involvement with product development and innovation:
o At the time of study, only people from the Engineering and Marketing departments fit this criterion.
Interview Number of participants
Interview Objectives
Get to know stakeholders
Collect past data
Achieve shared understanding among stakeholders
Understand main motivations and barriers
Obtain feedback
Project Charter Discussions
16
Previous KPI data collection
10
Mid-term Innovation KPI proposal
11

52
• Decision-making power regarding innovation:
o This criterion added a few VPs from other departments to the list that contained mostly Engineering and Marketing employees.
• A mix of employees from different hierarchical levels, to allow for a more holistic view of the innovation management processes and practices.
• Interviewee relevance and their access to desired data for each of the interviews.
The interviews typically lasted for 30 to 60 minutes. A first interview with each new stakeholder
included an introduction of the researcher’s background to set the context and gain their trust
(Patton, 1987). During the interview, notes were taken on the main answers and key comments.
According to Stake (2000), during an interview, it is more important to listen carefully to gather
the meaning behind the words than to take precise notes on the words that are said. Therefore, after
each interview, a short period of time was set aside to take notes on the key ideas that were
communicated and for memoing. As the interviews were held as part of the employees’ work
routine, no audio recording was used because this would have been unnatural to the interviewees.
Moreover, according to Stake (2000), “the tape recorder is of little value unless ultimately an audio
presentation is intended”.
3.5.3.4 Workshops
A workshop is a period of extended group discussion and practical work that allows for an in-depth
exploration of a subject. Two 3-hour workshops were developed and run during phase II on site.
The high-level workshop outlines are available in Appendix B. These workshops also had the
general objective of helping the Company develop innovation KPIs. In addition to objectives
specific to each workshop, an essential part of the data collection was the observation of the
interactions among the attendees during the workshops. A well-designed workshop sparks
discussions, opens up subjects and uncovers data that would sometimes be impossible to bring up
otherwise. The main objectives of both workshops are presented in Table 3.9.
The first workshop was run twice due to lack of common availability: with 8 people the first time
and 3 the second. The second workshop had 5 attendees. In both cases, employees at different
hierarchical levels and coming from both engineering and marketing were present, ranging from
design engineer to VP. Given the time commitment and human resource costs in attending these
workshops, they were held with a minimal number of available attendees while still making sure

53
that some key stakeholders were present for each of them. For the first workshop, the key
stakeholders were the direct innovation decision-makers (VPs of Marketing and Engineering)
while for the second they were some of the directors working more closely with existing innovation
processes.
Table 3.9: Main Workshop Objectives
Workshop Objectives 1: KPI Requirements Definition
− Collect input on what innovation means to different stakeholders and what kind of innovation performance they would like to see at their company;
− Collect input on what it means in regard to the Company’s new Vision.
2: Innovation System Mapping
− Understand synergy (or lack thereof) among the different departments in regard to innovation;
− Understand effectiveness (or lack thereof) of existing innovation processes and flows;
− Further understand system pressures on innovation success within the Company.
Workshops 1 and 2
− Better understand individual biases in order to take them into account when analyzing data collected from individual interactions;
− Collect vital observations about the Company’s culture; − Help broaden individuals’ perspectives and achieve shared understanding
among stakeholders, thereby allowing for richer discussions with individual stakeholders following the workshops;
− Uncover past and present data to further explore in one-on-one interactions.
The workshops were also a good way to triangulate information as well as test the interpretation of
data collected through other means. At least one of the two other researchers present on site during
phase II attended each of the workshops in order to verify and corroborate findings from the
exercise. Their notes were included in the final Minutes of Meeting (MoM).
3.5.3.5 Questionnaire
Based on the observations from phase I and the first few months of phase II, it was important to
consolidate our interpretation of the state of the Company’s organizational culture regarding
innovation. To do so, a questionnaire developed by Rao and Weintraub (2013) to establish a
company’s Innovation Quotient (IQ), or how innovative is its culture, was used. This questionnaire
is based on six building blocks of an innovative culture and was chosen as it can be easily used by
the Company’s employees to identify strengths, weaknesses and inconsistencies. This can help

54
start conversations toward a more innovative culture. The full questionnaire is presented in
Appendix C.
The questionnaire was conducted with 31 respondents of different departments and varying
hierarchical levels and seniority, defined here as time spent within the Company (see section 4.1.2
for more details on the distribution of participants in each category as well as results comparisons
by category). Two ways of taking the survey were offered: self-administered by the participants
online (13 respondents) or interviewer-administered (18 respondents). The latter allowed for
additional comments and discussions resulting in richer data. In both cases, the participants were
notified of the purpose of the study, the expected benefits, the protection of their confidentiality
and their right to withdraw from the study at any time. They had the opportunity to ask any
questions about the study or the questionnaire at any time before, during or after its administration.
The choice of invited participants was done based on their role with respect to innovation as well
as their level of decision-making power. Consequently, there is a bias toward a higher proportion
of senior managers compared to the Company’s population as well as a higher number of
participants from the Engineering department. The participation in the survey was optional.
Therefore, the employees who chose to participate might have a bias or particular interest in
innovation compared to those who did not.
3.5.3.6 Observations
We have the opportunity of having seven researchers on site at different periods of time, some
overlapping. This allows each researcher to validate their observations with others as well as with
the academic supervisor. Consequently, as previously mentioned, only observation data and data
interpretations that were confirmed by other researchers were further used in this study.
To understand a company’s culture it is important to pay attention to its “quiet, sometimes hidden,
manifestations” that can often be seen through its informal channels (Schein, 2009). Being present
on site daily as part of a team at the Company allowed for multiple observation angles and
opportunities through various formal meetings and discussions, as well as the informal Company
life such as lunch time discussions. While observations were also being noted during most of the
other data collection methods described in this chapter, the main opportunities for observation that
were not part of the core research activities referred to in the other data collection methods are

55
listed in Table 3.10. Among these opportunities, the researcher played various roles, from simply
being present without participating, to sometimes developing workshops to support the team.
Table 3.10: List of Observation Opportunities and the Researcher's Level of Participation
Observation Opportunity Researcher’s Level of Participation Innovation Center workshops, documents and KPIs
Observer, little contribution besides researching and providing past KPIs, feedback to IRDT director
Engineering Vision 2020 / Operational Plan workshops
Support in process workshop development and facilitation
IRDT Team Meetings Observer, little contribution, feedback to IRDT director
Front-End of Innovation (FEI) Workshops (developed and run by one of the two other concurrent researchers)
Support in workshop development and data interpretation
Multisectorial Industrial Research Chair in Coatings and Surface Engineering (MIC-CSE) workshops (developed and run by one of the two other concurrent researchers)
Support in workshop development and data interpretation
Each observation opportunity had three key objectives:
• Understand stakeholder dynamics;
• Understand company priorities;
• Understand company culture.
A mix of both quantitative and qualitative observation approaches was used during this research.
The quantitative approach was used through aggregation of repeated observations. The qualitative
method calls for “finding good moments to reveal the unique complexity of the case” (Stake, 2000)
to describe a story which shows how the various key observations fit together.
Before each observation opportunity, a list was prepared of what to pay attention to as well as
previous observations that could possibly be repeated or contradicted. During observations, the
focus was on this list while also paying attention to other conditions that may influence
interpretation and analysis of collected data. Same as for the interviews, any opportunity to observe
demands a scheduled time shortly after to take notes on observations and preliminary interpretation
(Stake, 2000). Additional time was planned to discuss the observations with the other researchers
and occasionally with the academic supervisor.

56
3.5.3.7 Meetings
Meetings are a part of the day-to-day company life. As part of the intervention-research strategy,
the author had to run numerous meetings over the 11 months on-site in order to advance the
innovation KPI development mandate. The main meetings that took place as part of this mandate
as well as the primary objectives for each of them are presented in Table 3.11. Meetings were often
a good way to verify, complete and triangulate data obtained through other means.
Table 3.11: List of Meetings and their Respective Objectives
Meeting Plan and review plans
Progress Review
Achieve shared understanding among stakeholders
Obtain Feedback
Take Decisions
Weekly meetings with IRDT director
KPI Charter Presentation to Engineering in the beginning of mandate / phase II
Draft KPI Proposal to CEO & COO at mid-term
Monthly meetings with Marketing & Engineering VPs
‘Low hanging fruits’ (LHF) KPI development meetings (weekly during the last two months)
Economic Value for Customers (EVC) development meetings (bi-weekly during the last two months)
Bi-monthly Mitacs follow-up meetings

57
CHAPTER 4 RESEARCH FINDINGS
This chapter presents the key results and field observations, as well as the research propositions.
An overview of the IQ questionnaire results is presented in section 4.1. The main research
observations gathered through all data collection methods and grouped in four categories are
presented in section 4.2 using the Levels of Perspective iceberg model. Then, the challenges met
due to the low level of maturity of the Company’s innovation processes and teams are discussed
using a summary of ten business process management (BPM) maturity models in section 4.3. The
innovation KPI development challenges connected to the four categories covered in section 4.2 and
to the low process maturity described in section 4.3, are explained in section 4.4. The deductions
regarding each of the five guiding questions resulted in four propositions that are explained in
section 4.5. Finally, a conceptual framework was developed based on three of the four propositions
and is presented in section 4.6.
4.1 Results of Innovation Quotient Questionnaire
The IQ questionnaire was introduced at mid-term of the second phase of the longitudinal research.
Its main objective was to verify and confirm some of the key observations thus far. The
questionnaire designed by Rao and Weintraub (2013) addresses many of the observations that were
made during the first phase and the beginning of the second phase of the longitudinal research.
Consequently, it was judged appropriate for the task at hand.
The questionnaire is composed of 54 statements available in Appendix C. The statements must be
ranked on a scale of 1 to 5, where 1 means ‘not at all’ and 5 stands for ‘to a very great extent’. It
should be noted that as the lowest possible score is 1, the middle value of the scale is 3, not 2.5.
Each of the 54 statements is attached to an ‘Element’. Three ‘Elements’ form a ‘Factor’. Three
factors form a ‘Building Block’. The average of the six ‘Building Block’ scores provides the
general IQ score.
The analysis components suggested by Rao and Weintraub (2013) were used for the questionnaire
analysis and are as follows:
• Average for each question/element;
• Distribution of the responses for each element;

58
• Average for each factor;
• Average for each building block;
• Average of the 6 building blocks (represents the IQ);
• Comparison of all these components across:
o Departments;
o Hierarchy levels;
o Seniority.
Figure 4.1 presents the results for the six building blocks as well as the general IQ score. As shown
in Figure 4.1, all these scores are below 3. According to Rao and Weintraub (2013), innovative
companies score high for at least one of the building blocks. This is not the case for our Partner
Company. A complete table of results at all four levels, including the score for each of the 54
elements, is available in Appendix D.
Figure 4.1: High-level Results of IQ Questionnaire (General and Building Block Scores)
The following sub-sections highlight the results most relevant to the research subject. The results
are first presented by ‘Building Block’ in section 4.1.1. Then, the results are compared across
Company functions, hierarchy levels and seniority in section 4.1.2.
4.1.1 Results of Innovation Quotient Questionnaire by Building Block
The following subsections present all average scores for each ‘Building Block’. Moreover, the key
results linked to other study observations and themes, as well as relevant participants’ comments
are highlighted. Detailed distribution graphics for all 54 elements are available in Appendix E.
4.1.1.1 Values
According to Rao and Weintraub (2013), “values drive priorities and decisions, which are reflected
in how a company spends its time and money”. The ‘Values’ block is the Company’s highest
Tota
lBl
ock
General Score2.5
Values2.6
Behaviours2.6
Climate2.5
Resources2.5
Processes2.1
Success2.7

59
scoring block with a score of 2.7, and is composed of the ‘Entrepreneurial’, ‘Creativity’ and
‘Learning’ factors. The three factors obtained very similar scores with respectively 2.8, 2.6 and
2.8. Figure 4.2 shows all the scores for the ‘Values’ building block.
Figure 4.2: IQ Questionnaire Scores for the Values Building Block
The highest element scores of this block were ‘Hungry’ with 3.1, and ‘Curiosity’ with 3.2. Many
respondents commented that there is a desire to experiment, but that it is not easy to accomplish
because of how the Company is structured. Numerous initiatives never make it outside of the
Company as they are blocked somewhere in the chain of command or there is simply no follow
through. Many respondents specifically mentioned that the Company is very conservative and risk
averse, with little desire to change until there is no choice left.
Three other elements of this block support the assessment that the Company is risk averse. The
‘Ambiguity’ element, which assesses appetite and tolerance for ambiguity, scored 2.7. The
‘Autonomy’ element, which focuses on the freedom to pursue opportunities, scored 2.6. Finally,
the ‘Failure OK’ element, which discusses how the employees’ view failure, exhibits the lowest
score of the ‘Values’ block with 2.3.
4.1.1.2 Behaviours
“Behaviors describe how people act in the cause of innovation” (Rao & Weintraub, 2013). The
‘Behaviours’ block is composed of the ‘Energize’, ‘Engage’ and ‘Enable’ factors with the
respective scores of 2.9, 2.2 and 2.9. There is a significant gap between the ‘Energize’ score of 2.9
and the ‘Engage’ score of 2.2. The former is about how the Company leaders ‘Inspire’, ‘Challenge’
and ‘Model’ the right innovation behaviours. The latter is about how the leaders actually work with
their staff to help them achieve their innovation efforts. This contrast suggests that the leaders’
Bloc
kFa
ctor
Elem
ent
Values2.7
Entrepreneurial2.8
Hung
ry3.
1
Ambi
guity
2.7
Actio
n-or
ient
ed2.
5
Creativity2.6
Imag
inat
ion
2.7
Auto
nom
y2.
6
Play
ful
2.5
Learning2.8
Curio
sity
3.2
Expe
rimen
t3.
0
Failu
re O
K2.
3

60
actions toward innovation are not fully coherent with their words. In addition, while initiative
taking is essential for innovation and an Intrapreneurial Culture (Kuratko, 2009; Rao & Weintraub,
2013), the ‘Initiative’ element exhibits the lowest score of this block and one of the lowest scores
of all 54 elements with 1.9. Figure 4.3 shows all the scores for the ‘Behaviours’ building block.
Figure 4.3: IQ Questionnaire Scores for the Behaviours Building Block
4.1.1.3 Climate
According to Rao and Weintraub (2013), “an innovative climate cultivates engagement and
enthusiasm, challenges people to take risks within a safe environment, fosters learning and
encourages independent thinking”. The ‘Climate’ block scored 2.5 and is composed of the
‘Collaboration’, ‘Safety’ and ‘Simplicity’ factors with the respective scores of 2.4, 2.9 and 2.2.
Figure 4.4 presents all the scores for the ‘Climate’ block.
Figure 4.4: IQ Questionnaire Scores for the Climate Building Block
The ‘Trust’ element, from the ‘Safety’ factor, specifically explores the coherence between the
actions and the expressed values of the Company’s employees. It scored 2.5, thus contributing to
Bloc
kFa
ctor
Elem
ent
Behaviours2.6
Energize2.9
Insp
ire3.
1
Chal
leng
e3.
0
Mod
el2.
5
Engage2.2
Coac
h2.
0
Initi
ativ
e1.
9
Supp
ort
2.6
Enable2.9
Influ
ence
2.6
Adap
t3.
0
Grit
3.0
Bloc
kFa
ctor
Elem
ent
Climate2.5
Collaboration2.4
Com
mun
ity2.
0
Dive
rsity
2.9
Team
wor
k2.
4
Safety2.9
Trus
t2.
5
Inte
grity
3.0
Ope
nnes
s3.
3
Simplicity2.2
No
bure
aucr
acy
2.3
Acco
unta
bilit
y2.
3
Deci
sion-
mak
ing
1.9

61
the evidence of the gap between words and actions previously discussed in the ‘Behaviours’ block.
Moreover, several respondents mentioned that the Company values are not well known. Many of
those who were familiar with the values said they did not know how to connect their actions to
those values.
Internal alignment is further explored in the ‘Collaboration’ factor with ‘Teamwork’ at 2.4 and
‘Community’ at 2.0. The latter specifically addresses the existence of a common innovation
language and is one of the lowest scores of all 54 elements. Most of the respondents agreed on the
score of the ‘Community’ element as 80% of the participants scored 1 or 2.
The ‘Simplicity’ factor also provides results particularly relevant for this study. First, the ‘No
bureaucracy’ element scored 2.3, contributing to the assessment of an execution-oriented culture.
The two other elements, ‘Accountability’ and ‘Decision-making’, respectively scored 2.3 and 1.9.
These results exhibit the challenges of taking responsibility and making decisions concerning
innovation initiatives at the Company.
4.1.1.4 Resources
Rao and Weintraub (2013) break down the ‘Resources’ block into three factors: ‘People’,
‘Systems’ and ‘Projects’. ‘People’ scored highest amongst the three with 3.1. ‘Systems’ and
‘Projects’ respectively scored 2.3 and 2.5, lowering the block score to 2.6. Two of the ‘Systems’
element scores show how the lack of appropriate systems contributes to the Company’s lack of
internal and environmental alignment. The ‘Communication’ score of 2.3 confirms the lack of
internal collaboration tools. The ‘Ecosystem’ score of 2.4 shows deficiency in leveraging external
relationships to pursue innovation. All scores for the ‘Resources’ block are presented in Figure 4.5.
The ‘Projects’ factor scores are particularly interesting as they explore the existence of dedicated
‘Time’, ‘Finance’ and ‘Space’ for innovation. The three elements respectively scored 2.2, 2.7 and
2.6 confirming that innovation is not a priority and benefits from few dedicated resources. Most of
all, the employees do not make time for innovation.
4.1.1.5 Processes
“Processes are the route that innovations follow as they are developed” (Rao & Weintraub, 2013).
While the other five blocks have very similar scores, this one is the lowest at 2.1. It is composed
of the ‘Ideate’, ‘Shape’ and ‘Capture’ factors referring to the different stages of innovation. They

62
scored respectively 2.3, 1.9 and 2.0, showing that, although ideation processes are weak, the
effective execution of innovation projects and their marketing are even weaker. All scores for the
‘Processes’ block are presented in Figure 4.6.
Figure 4.5: IQ Questionnaire Scores for the Resources Building Block
Figure 4.6: IQ Questionnaire Scores for the Processes Building Block
The ‘Prioritize’ element scored 2.3 and shows the lack of a clearly articulated risk portfolio.
Moreover, there is a significant lack of feedback loops between the Company and its customers as
portrayed by the ‘Iterate’ score of 1.7 which is the lowest of the 54 element scores.
Finally, the efficiency of innovation processes is very low as all the element statements that
mentioned speed of execution (Prototype, Fail Smart, Launch and Scale) scored either 2.0 or 2.1.
In addition, during the administration of these specific questions, many respondents mentioned that
their innovation projects and processes turnaround is too slow and speed is a major problem. Some
employees even qualified the Company’s processes as its ‘biggest organizational obstacle’.
Bloc
kFa
ctor
Elem
ent
Resources2.6
People3.1
Cham
pion
s2.
9
Expe
rts
2.9
Tale
nt3.
4
Systems2.3
Sele
ctio
n2.
3
Com
mun
icat
ion
2.3
Ecos
yste
m2.
4
Projects2.5
Tim
e2.
2
Mon
ey2.
7
Spac
e2.
6
Bloc
kFa
ctor
Elem
ent
Processes2.1
Ideate2.3
Gene
rate
2.4
Filte
r2.
3
Prio
ritize
2.3
Shape1.9
Prot
otyp
e2.
1
Itera
te1.
7
Fail
smar
t2.
0
Capture2.0
Felx
ibili
ty2.
2
Laun
ch2.
0
Scal
e2.
0

63
4.1.1.6 Success
The ‘Success’ block with its score of 2.6 covers three levels of success: ‘External’ with a score of
2.6, ‘Enterprise’ with 2.8 and ‘Individual’ with 2.3. Figure 4.7 presents all scores for the ‘Success’
block.
Figure 4.7: IQ Questionnaire Scores for the Success Building Block
The three ‘External’ factor questions explored the Company’s success through the lenses of its
‘Customers’, ‘Competitors’ and ‘Financial’ performance. They were the most difficult to score for
the majority of employees, many of which said that they ‘have no idea’ on how the Company is
perceived. This further confirmed the Company’s disconnect from the external systems it is part
of.
The ‘Individual’ success explores the employees’ satisfaction with their participation in innovation
work, their professional growth potential and the rewards they get for being innovative. With 2.3,
this factor scored lower than the two other perspectives of ‘Success’. Its lowest element is ‘Reward’
with 1.9. This element scoring distribution is one of the most consistent with 75% of respondents
scoring 1 or 2. No one scored it 4 or 5.
4.1.2 IQ Questionnaire Results by Category
The results have been compared based on the respondents’ function, hierarchy level and seniority.
The high level of these comparisons is presented in the following subsections. While these
comparisons can raise relevant questions, the sample for each category is small and thus cannot
serve to draw conclusions.
Bloc
kFa
ctor
Elem
ent
Success2.6
External2.6
Cust
omer
s2.
7
Com
petit
ors
2.6
Fina
ncia
l2.
5
Enterprise2.8
Purp
ose
2.7
Disc
iplin
e2.
7
Capa
bilit
ies
3.0
Individual2.3
Satis
fact
ion
2.5
Grow
th2.
6
Rew
ard
1.9

64
4.1.2.1 Results Based on Functions
Employees from 10 departments responded to the questionnaire. For several departments there was
only one or two respondents, which cannot be considered representative of the entire department.
To simplify the presentation of the results, the 10 departments were grouped into four functions as
follows:
• Engineering: most respondents are from this department, so it was not grouped with any other;
• Marketing, Sales, and Customer Service & Distribution: these three departments all focus on customers and had similar scores;
• Operations is composed of Operations and Manufacturing Operations;
• Others is composed of IT, Strategic Planning, and Continuous Improvement: these were the remaining three departments with one or two respondents each, and their responses were similar.
The percentage of respondents from each function is presented in Figure 4.8. An equivalent figure
with the 10 departments is available in Appendix F.
Figure 4.8: Percentage of Respondents per Function
The scores across the four functions for the six building blocks are presented in Figure 4.9. The
Engineering and Marketing scores are always close, with Engineering slightly higher in four of the
six blocks. These are the two groups most involved with innovation and that communicate the most
about it. This might explain their similar perspectives on the state of innovation at the Company as
seen through these scores. The ‘Others’ score is systematically and significantly lower for the six
building blocks. This might be influenced by the nature of the work that these departments do.
They are mostly composed of people who think about how to improve things and better prepare
for what is next. Consequently, they might be extra critical of the current state.
45%
26%
13%
16%
Percentage of respondents by FunctionEngineering
Marketing, Sales & Customer Service
Operations
Others
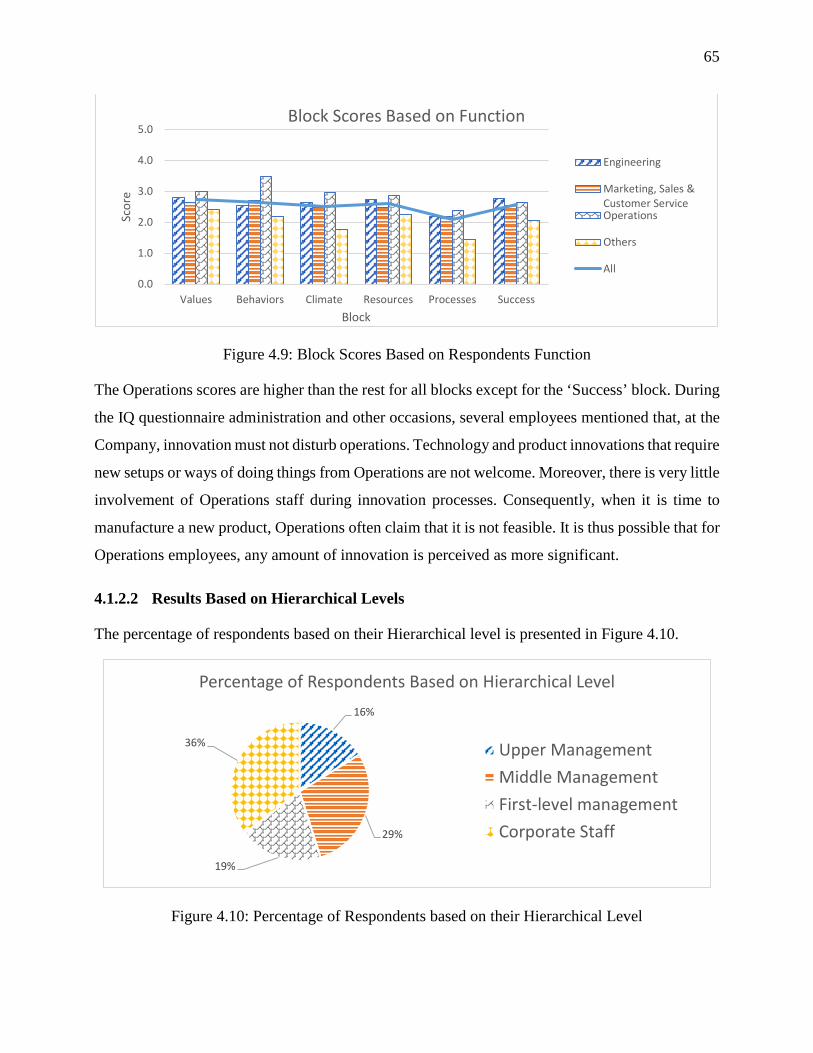
65
Figure 4.9: Block Scores Based on Respondents Function
The Operations scores are higher than the rest for all blocks except for the ‘Success’ block. During
the IQ questionnaire administration and other occasions, several employees mentioned that, at the
Company, innovation must not disturb operations. Technology and product innovations that require
new setups or ways of doing things from Operations are not welcome. Moreover, there is very little
involvement of Operations staff during innovation processes. Consequently, when it is time to
manufacture a new product, Operations often claim that it is not feasible. It is thus possible that for
Operations employees, any amount of innovation is perceived as more significant.
4.1.2.2 Results Based on Hierarchical Levels
The percentage of respondents based on their Hierarchical level is presented in Figure 4.10.
Figure 4.10: Percentage of Respondents based on their Hierarchical Level
0.0
1.0
2.0
3.0
4.0
5.0
Values Behaviors Climate Resources Processes Success
Scor
e
Block
Block Scores Based on Function
Engineering
Marketing, Sales &Customer ServiceOperations
Others
All
16%
29%
19%
36%
Percentage of Respondents Based on Hierarchical Level
Upper ManagementMiddle ManagementFirst-level managementCorporate Staff

66
The scores across the four Hierarchy levels are presented in Figure 4.11. According to Rao and
Weintraub (2013), upper-management often scores higher than their staff for a number of elements.
At our Partner Company, the upper-management scores are the highest for all blocks except
‘Values’. The middle management scored the lowest in all blocks except ‘Values’. This may be the
result of the classical situation where middle management is stuck between VPs and their staff,
with the latter being asked for things they have no idea how to achieve. Moreover, the staff and
first-level management scores are close for most of the blocks. This could be a reflection of the
Company’s high level of centralization and low level of delegation (as discussed in section 4.2.1).
Figure 4.11: Block Scores Based on Hierarchical Level
4.1.2.3 Results Based on Seniority
Figure 4.12 illustrates the percentage of respondents of different Seniority levels at the Company.
Figure 4.12: Percentage of Respondents based on the Employees' Seniority
0.0
0.5
1.0
1.5
2.0
2.5
3.0
3.5
4.0
4.5
5.0
Values Behaviors Climate Resources Processes Success
Scor
e
Block
Block Scores Based on Hierarchical Level
UpperManagement
MiddleManagement
First-levelmanagement
Corporate Staff
All
39%
26%
35%
Percentage of respondents by Seniority
Less than 3 yearsBetween 3 and 10 yearsOver 10 years

67
The score variations based on the employees’ Seniority are presented in Figure 4.13. The
employees that have been with the Company for less than three years scored systematically and
significantly lower on all six building blocks. This group is composed mainly of employees that
are younger and/or have recently joined the Company but have significant previous experience.
The scores for the two other groups are very close for all blocks except ‘Behaviours’. The Company
has a high proportion of its employees who have worked there for their whole career and thus have
greater difficulty in imagining how things could be different. This might influence their scoring
and explain the gap with younger employees and employees with previous experience.
Figure 4.13: Block Scores Based on Seniority
4.2 Key Observations Regarding the Efforts to Rejuvenate
Innovation Capabilities
Longitudinal field research provides a unique opportunity to dive deeper into understanding the
relationships under study. To do this systematically, a simplified version of the Levels of
Perspectives iceberg model (Kim, 2002; Senge et al., 1999) was used, as presented in Figure 4.14.
Such a model is appropriate when trying to understand and study relationships and change in
organizations as it allows a more holistic understanding of the system that we want to transform.
The first level is comprised of Events. The second level goes beyond discreet activities (Events)
and aims to discern what is happening over the longer-term (Patterns and Trends). The third level
is about understanding the underlying structures causing the issues or behaviours at stake
(Structures). Finally, the Mental Models level is about uncovering what kind of thinking or
paradigms can explain the observed behaviours and the ways that the system is structured.
0.0
1.0
2.0
3.0
4.0
5.0
Values Behaviors Climate Resources Processes Success
Scor
e
Block
Block Scores Based on Seniority
Less than 3 years
Between 3 and 10yearsOver 10 years
All

68
The ‘Levels of Perspectives’ iceberg model allows one to go beyond what can be seen - the
‘symptoms’ - to better understand the human aspects behind some actions, choices, and priorities.
This helps understand deeper reasons behind resistance to change and levers for change. Typically,
the deeper you go ‘under water’, the higher the leverage of the actions taken for change (Meadows,
1999).
Figure 4.14: Simplified Levels of Perspectives Iceberg Model
As explained in Chapter 3, our research findings are based on the triangulation of data coming from
multiple data collection methods. Only information coming from multiple observations and
corroborated by fellow researchers was considered and analyzed. One core category emerged
following the grounded theory coding and memoing tandem explained in section 3.2.1. This
category refers to the focus on the execution of deliverables as opposed to the achievement of
objectives and was named ‘Execution mindset’. Three related categories also emerged:
• Risk aversion: preference for what is certain and avoidance of ambiguity;
• Lack of internal alignment: lack of strategic/vertical alignment as well as synergistic/horizontal alignment among the employees of different hierarchical levels and departments;
• Lack of environmental alignment: lack of understanding and appropriate positioning within the systems the Company is a part of (customers, industry, business partners, etc.).

69
Data for these four categories was collected, analyzed and structured at different levels of the
iceberg as follows:
• Events: What can be seen directly, through discreet actions and behaviours.
o The observations regarding the ‘Event’ level of each of these categories is omitted in this thesis as these could allow one to identify the opinions of some participants thus violating confidentiality.
• Patterns and Trends: Can be deduced from repetition of events or observation of trends over time.
o The focus in this paper is mainly on patterns as, in general, more time is required for a reliable observation of trends.
• Structures: Can be formal or informal. Structures can be seen through observation of interactions among employees and processes, as well as through analysis of official and unofficial rules, norms and policies.
• Mental Models: Can be deduced by combining the Company’s history and values with the employees’ beliefs and assumptions (based on their answers and comments to the IQ Questionnaire as well as during the various interviews) – by understanding what drives their daily behaviours and actions.
4.2.1 Risk Aversion
Risk is a key ingredient in innovation and in intrapreneurial companies (Christensen, 1997; Covin
& Slevin, 1991; Kuratko et al., 1993; Miller, 1983; M. H. Morris et al., 2006; Pinchot III, 1985;
Rao & Weintraub, 2013; Tellis et al., 2009; Wiklund & Shepherd, 2005). Numerous observations
regarding the Company’s approach to risk and its management were collected and summarized in
Table 4.1 with sample quotes. The data collection sources for each observation are presented in
Table 4.2.
The family Company under study was founded by an inventor who, until very recently, was still
the key source of innovation. It was led by family owners for decades with family members freely
taking decisions without having to report on them. In this context, the employees, many of whom
have worked for the Company for most of their careers, got used to an environment where they
don’t have any real decision making power, no matter their hierarchical level. As discussed in
section 4.1.2.2, there is little difference between staff and first-level management.

70
Table 4.1: Levels of Perspectives Iceberg Regarding Risk-aversion with Sample Quotes
Level Observations Regarding Risk-aversion Sample Quotes
Patte
rns
P1. Low & slow adoption of new processes; “We have been trying to have them use this new tool for a year and they keep doing what they have always done.” – Engineering Manager
P2. Many initiatives don’t make it out of the company;
“There is a lot of fear to go forward with something new.” – Design Engineer
P3. Decision avoidance, low delegation and poor decision-making
P3.1. Priority to customer orders over development projects;
“We don't like to fail. When we take an order we're under the gun and so we can't afford to fail.” – Engineering Director
P3.2. Decisions are often taken higher in the hierarchy than they should according to the role definitions;
“Only a couple of people take all the decisions” – Design Engineer “There is too much in VPs’ hands” – Product Manager
P3.3. Bosses change their employees’ decisions without discussing it with them;
“If the boss does not like your decision, they will simply change it.” – Procurement Director
P3.4. Everyone wants someone else to take the decisions – decisions that do not fall under a specific team often bounce between the managers/directors/VPs for a long time;
“The people protect their egos. They are afraid to be responsible so they avoid taking decisions and giving opinions.” – Product Manager
P3.5. Historically, top family members take important decisions without necessarily considering the ideas and arguments that were brought to them. The rationale behind the final decisions is rarely shared.
“Unless you give your idea to a high-up nothing will change and no one will use your ideas.” – Design Engineer
Stru
ctur
e
S1. Few risk management processes; “The risk portfolio is nonexistent.” – Product Manager
S2. Little incentive to push innovation - Few reward structures, especially for innovation, while a lot of resistance which makes innovation work very exhausting;
“The one thing you do wrong will be pointed out forever.” – Design Engineer “There are a lot of walls to break to get somewhere.” – Design Engineer
S3. Low accountability regarding individual work – little use of employee evaluations;
“Many employees refuse to be evaluated!” – Engineering Director
S4. Few decision making processes; “We do the same things forever, it’s easier.” – Design Engineer
S5. Silo structures don’t offer any clear mechanisms for transdisciplinary work and decisions required for successful innovation.
“It is difficult to work in teams because of how the company was built: with separate data bases and closed functional teams.” – Engineering Manager
Men
tal M
odel
s M1. Little desire to change unless there’s a perception of no choice left – Very conservative mentality;
“It is a very conservative company. There is not a lot of desire to change even when we know that something has to change. We wait until there is no choice left.” – Design Engineer “We try to fix what we have instead of experimenting with something new.” - VP
M2. Little decision-making power provides an ‘I’m just a cog’ feeling to many employees who consequently don’t feel empowered to take initiative or be innovative.
“There are few procedures on how to change something.” – Design Engineer
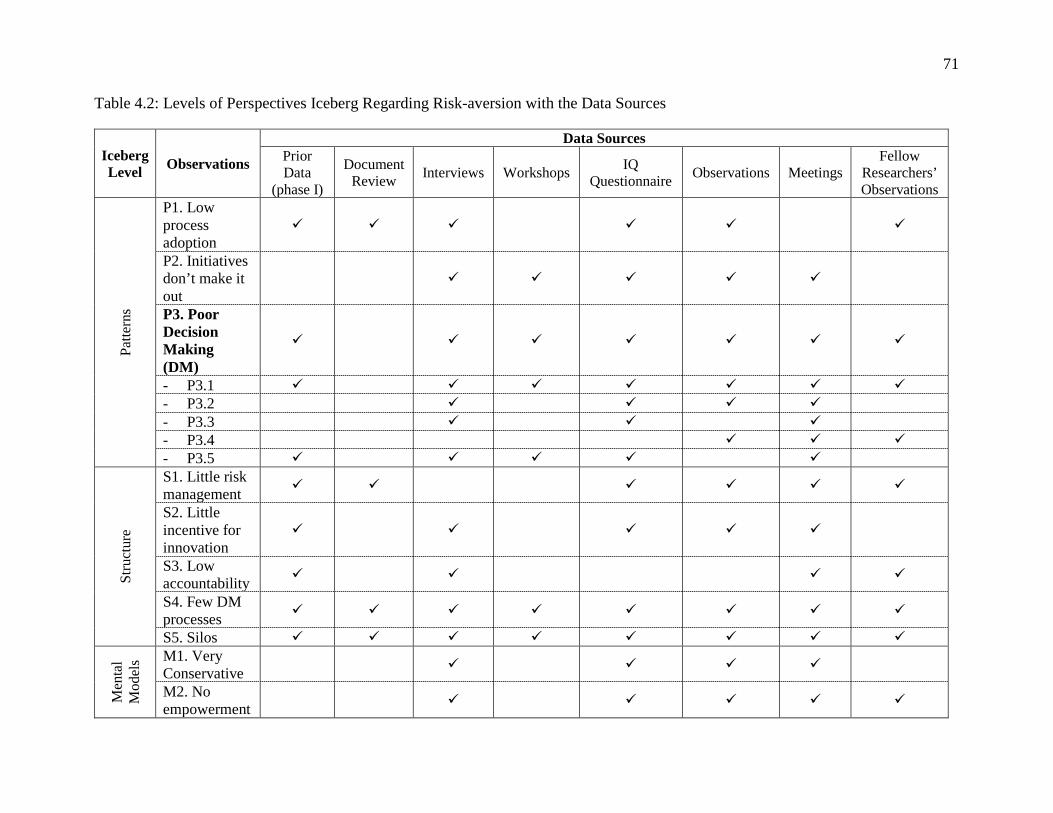
71
Table 4.2: Levels of Perspectives Iceberg Regarding Risk-aversion with the Data Sources
Iceberg Level Observations
Data Sources Prior Data
(phase I)
Document Review Interviews Workshops IQ
Questionnaire Observations Meetings Fellow
Researchers’ Observations
Patte
rns
P1. Low process adoption
P2. Initiatives don’t make it out
P3. Poor Decision Making (DM)
- P3.1 - P3.2 - P3.3 - P3.4 - P3.5
Stru
ctur
e
S1. Little risk management
S2. Little incentive for innovation
S3. Low accountability
S4. Few DM processes
S5. Silos
Men
tal
Mod
els M1. Very
Conservative
M2. No empowerment

72
Moreover, decision-making was one of the lowest IQ element scores as discussed in section 4.1.1.3.
Burgelman and Grove (1996) believe that the employees on the front lines of innovation are the
ones most likely to find their company’s best entrepreneurial opportunities as long as they have the
responsibility and the power to do so. Few formal decision-making mechanisms existed as it was
highly centralized within the family. Consequently, decision-making and accountability (also with
a low score, as presented in section 4.1.1.3) are not part of the Company’s culture, whereas they
are important elements of an innovative organizational culture (Burgelman & Grove, 1996;
Goodale et al., 2011; Rao & Weintraub, 2013).
During this study, several decision-making mechanisms to prioritize between innovation projects
and manage the associated risks were being developed and implemented. There was no clearly
articulated risk portfolio as it was highlighted with a low score for the ‘Prioritize’ element of the
IQ questionnaire discussed in section 4.1.1.5. However, as the employees at different hierarchy
levels were not used to taking responsibility, it led to a lot of decision avoidance because no one
was ready to take the blame for the ‘wrong’ decision. The employees are afraid of failing as
suggested by the IQ ‘Failure OK’ element discussed in section 4.1.1.1. Consequently, it seems
‘safer’ for many to prioritize work on existing orders as opposed to development projects. While
some orders demand innovation and development, as they are tied to a customer and have to comply
with high safety standards, the associated innovation possibilities are limited because the Company
can’t afford to fail (Christensen, 1997; Rao & Weintraub, 2013).
In addition, while processes are being implemented, the reward structures don’t adapt to encourage
new behaviours. Employee evaluations and reward systems play an important role in employee
behaviour (M. H. Morris et al., 2006) and in the creation of an environment favourable to
intrapreneurship (Kuratko, Hornsby, et al., 2014). The ‘Reward’ element of the IQ questionnaire
was one of the lowest scores as discussed in section 4.1.1.6. In such a context, there is little
incentive to go beyond day-to-day execution.
4.2.2 Execution Mindset
“We can do whatever we want as long as the day-to-day is taken care of” were the exact words
used by one of the employees during an in-person IQ questionnaire interview. The employees have
theoretical freedom to try whatever they want outside of their regular duties. However, there is no
time, resources or incentives to go beyond their work description as supported by the low scores

73
of the ‘Projects’ factor and the ‘Reward’ element of the IQ questionnaire discussed respectively in
sections 4.1.1.4 and 4.1.1.6. Moreover, the existing incentives encourage tangible outputs. The
human resources are managed mainly for efficiency and return on investment, which is one of the
traditional management practices harmful to Intrapreneuring according to Sykes and Block (1989).
The employees being promoted are usually the ‘good soldiers’ who work hard and do what they
are told. Thinking ideas through and developing something new often takes time before producing
tangible outputs. There are no ways to report on such intangible work. Consequently, investing
time in trying something new is a risky business, as one may be seen as doing nothing.
The beginning of the longitudinal study in 2015 coincided with the arrival of the first non-family
President and CEO. His top mandate and priority for the first few years was to improve the
Company’s operational efficiency. Significant resources were invested toward this goal, which is
the focus of most on-going organizational changes. Few resources are left for the development of
Innovation Capabilities. Consequently, innovation projects stretch out for too long, as evidenced
by the low score of the ‘Launch’ and ‘Scale’ elements discussed in section 4.1.1.5. Yet, time
availability is one of the five dimensions essential to an Intrapreneurial Corporate Culture
according to Kuratko, Hornsby, et al. (2014). The recent operational focus reinforces the
importance of operational incentives and KPIs in addition to new top management KPIs which
focus mostly on quarterly financial performance. The observations collected regarding the
employees’ execution mindset with sample quotes are summarized in Table 4.3. Their data sources
are presented in Table 4.4.
4.2.3 Lack of Internal Alignment
As presented in Table 4.5 and Table 4.6, there is little alignment amongst different processes and
across departments. The main innovation stakeholders – IRDT managers and director, VPs of
Engineering and Marketing, as well as the CEO – all have different definitions of innovation, as
well as differing ambitions regarding innovation and its role within the Company’s current and
future success. This was confirmed by the low ‘Community’ element score as discussed in section
4.1.1.3.

74
Table 4.3: Levels of Perspectives Iceberg Regarding the Execution Mindset with Sample Quotes
Iceberg Level
Observations Regarding the Execution Mindset Sample Quotes
Patterns
P1. Development projects’ timelines stretch out for too long;
“Engineering staff design and test products that never make it out of the Company.” – Design Engineer
P2. A lot of firefighting; “We are always pulled out of our development work to manage some emergency.” – Engineering Manager
P3. A lot of time spent in preparing presentations and reports.
“They always ask for nice power points for everything.” – Engineering Director
P4. Priorities P4.1. Development projects are never a priority until a customer asks for it;
“Product Development is stuck behind the day-to-day.” – Engineering Manager
P4.2. Priority to clear and simple tasks, to what’s “easier” to execute, often without figuring out if it’s actually useful and how it fits within the Company’s objectives and the bigger picture.
“A lot of fancy power points but not much gets done.” – Engineering Director
Structure
S1. Operations-oriented KPIs; “We are judged based on Average Days Late” – Engineering Manager
S2. Little dedicated time to think / develop new initiatives, technologies, products…;
“Did you ever try to run in a swimming pool filled with maple syrup? We are always focused on orders, stretched thin, we do not have the resources.” – VP
S3. Little incentive to prioritize the future; “Resistance is high and rewards are rare.” – Engineering Manager
S4. Little accountability in general, even less for anything that isn’t day-to-day work.
“We should be working more on product development but it does not fit in my workload and it is not my call to make.” – Engineering Manager
Mental Models
M1. ‘Delivering now is more important than delivering the right things.’ - Tangible work that allows one to produce specific deliverables, reports and power points is what is most valued. Consequently, employees work hard at delivering while not often taking the time to think through their work to make sure it creates real value.
“People ask a lot of questions, but often not the right ones.” – Product Manager “We do the same things forever, it is easier.” – Design Engineer
M2. ‘We are not masters of our choices, we must do what customers ask now.’
“We can do what we want, but the priority is always to work on sales orders.” – Design Engineer
M3. “We can do whatever we want as long as the day-to-day is taken care of.” – No one gets punished for trying new things and there is even some encouragement to experiment. However, this is only acceptable when the day-to-day firefighting is taken care of. Unfortunately it never ends.
“When we are not overloaded, we can do what we want.” – Project Specialist
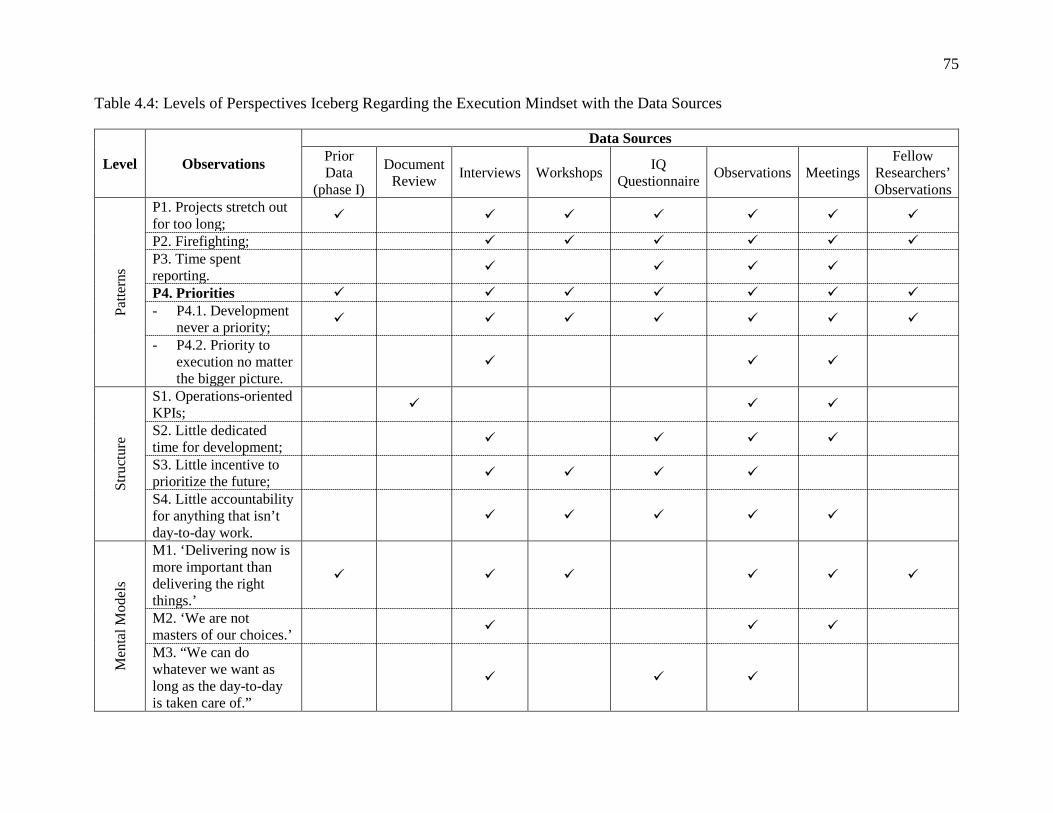
75
Table 4.4: Levels of Perspectives Iceberg Regarding the Execution Mindset with the Data Sources
Level Observations
Data Sources Prior Data
(phase I)
Document Review Interviews Workshops IQ
Questionnaire Observations Meetings Fellow
Researchers’ Observations
Patte
rns
P1. Projects stretch out for too long;
P2. Firefighting; P3. Time spent reporting.
P4. Priorities - P4.1. Development
never a priority;
- P4.2. Priority to execution no matter the bigger picture.
Stru
ctur
e
S1. Operations-oriented KPIs;
S2. Little dedicated time for development;
S3. Little incentive to prioritize the future;
S4. Little accountability for anything that isn’t day-to-day work.
Men
tal M
odel
s
M1. ‘Delivering now is more important than delivering the right things.’
M2. ‘We are not masters of our choices.’
M3. “We can do whatever we want as long as the day-to-day is taken care of.”

76
Table 4.5: Levels of Perspectives Iceberg Regarding the Lack of Internal Alignment with Sample Quotes
Level Observations Regarding the Lack of Internal Alignment Sample Quotes
Patte
rns
P1. Values P1.1. Values of the Company are not well known;
“The only value I can remember is something about family spirit.” – Engineering Manager
P1.2. Employees report not knowing how to connect values with actions;
“We have some values with the new CEO but we do not really know what to do with them.” – Engineering Manager
P1.3. Employees don’t prioritize what they say they value.
“Customer satisfaction is what really matters but we do not have resources to invest for the development of VoC methods this year.” – VP
P2. Gaps between words and actions
P2.1. A lot of complaints but little action; “We are very vocal with complaints but not with solutions.” – Project Specialist
P2.2. Little coherence between words/appearances and actions/investment;
“We do not do enough of what has value.” – Engineering Manager
P2.3. Significant gap between what leaders say and do to support innovation.
“They ask us to innovate but they do not give us any resources to do so.” – Engineering Director
P3. Communication
P3.1 Poor communication in general within the Company;
“We need more collaboration, coordination, knowledge sharing, better communication and more development outside of the customer demands.” – Design Engineer
P3.2. Communication on Company objectives gets lost when going down the hierarchy;
“Communication down the hierarchy is difficult.” – Product Manager
P3.3. People claim they’re making the effort to communicate and work with others while the others aren’t doing their part;
“We try to reach out to them all the time but they do not care and do their work on their own.” – Engineering Director
P3.4. Regular miscommunication and misunderstanding.
“They keep talking about it but it is as if they are speaking different languages.” – Product Manager
Stru
ctur
e
S1. No common innovation language; “We never agree on what we think innovation should look like here.” – Engineering Director
S2. No adequate cross-functional mechanisms allowing stakeholders to align work and processes among teams and departments;
“We have some tools but we are having a hard time using them.” – Product Specialist “We need to break silos and improve team work but it is difficult because of how the company was built: silo data bases and high age average. Some people absolutely do not want to work in teams.” – Design Engineer
S3. Reporting and work structures are typical silos where each individual, team and department focus on their specific jobs with no space nor resources for multidisciplinary work.
“A lot of functions are too stuck in the day-to-day work to be able to work efficiently with others.” – Product Manager “Teamwork is probably one of our biggest weaknesses.” – VP
Men
tal
Mod
els
M1. ‘I am doing my job, which is more important than the rest, and others just don’t get it.’
“Many keep information to themselves.” – Design Engineer
M2. Some employees think that Company values and related talk and actions are just fluff to make the Company look good, while they don’t mean anything in regards to the ‘real’ work to be done.
“The VPs make us waste our time with all this fluff, we have some real work to do.” – Engineering Director

77
Table 4.6: Levels of Perspectives Iceberg Regarding the Lack of Internal Alignment with the Data Sources
Level Observations
Data Sources
Prior Data
Document Review Interviews Workshops IQ
Questionnaire Observations Meetings Fellow
Researchers’ Observations
Patte
rns
P1. Values - P1.1 - P1.2 - P1.3 P2. Gaps between words and actions
- P2.1 - P2.2 - P2.3 P3. Communication - P3.1 - P3.2 - P3.3 - P3.4
Stru
ctur
e
S1. No common innovation language;
S2. No adequate cross-functional mechanisms;
S3. Reporting and work structures are siloed.
Men
tal M
odel
s M1. ‘I am doing my job, which is more important than the rest, and others just don’t get it.’
M2. Company values are just fluff.

78
Moreover, the IRDT group is under Engineering. The purpose of a typical Engineering group such
as it is in this Company is to ‘play it safe’, comply with standards and use the most proven
technologies available. In contrast, an innovation group should be experimenting with new
technologies and ideas, and taking risks. This creates a conflictual situation where IRDT is forced
to ‘play it safe,’ whereas in order to innovate they should be experimenting, failing sometimes and
learning in order to discover new ways of doing things.
High management support is a key characteristic of intrapreneurial companies (Burgelman, 1984;
Kuratko, Hornsby, et al., 2014; Ling et al., 2008; Rao & Weintraub, 2013; Tellis et al., 2009).
While everyone at the Company claims that innovation is important and that there must be more
time to develop new ideas, there are little top management actions and investment to make it
possible. This gap was visible through the ‘Behaviours’ block scores discussed in section 4.1.1.2
and the ‘Trust’ element in section 4.1.1.3. In addition, there are no innovation indicators among
the 10 executive scorecard KPIs, reflecting the absence of innovation in the Company’s strategy.
Many authors state that, to be successful, intrapreneurial activity must be integrated into the
company’s strategy (Burgelman, 1983a; Goodale et al., 2011; Kuratko, Hornsby, et al., 2014).
According to Rao and Weintraub (2013), “values of a company are less what leaders say or write
than what they do & invest in”. The real values drive the priorities and decisions; they are reflected
in how time and resources are spent. Such evidence of inconsistent messages contributes to a
general low performance context as it is difficult to have enough trust, focus and ambition (Gibson
& Birkinshaw, 2004). Besides showing a gap between words and actions, this also supports the
importance of the Execution Mindset discussed in the previous section.
In addition to the lack of strategic (vertical) alignment, synergistic work among peers (horizontal
alignment) is missing. The Company is managed functionally, which is one of the traditional
management practices harmful to Intrapreneuring according to Sykes and Block (1989). As one
employee mentioned while referring to the ‘Teamwork’ element statement during his IQ
questionnaire interview: “teamwork is one of our biggest weaknesses” (see section 4.1.1.3). Team
work is one of the key characteristics of an intrapreneurial culture (Kuratko et al., 1993).
According to Rao and Weintraub (2013), “most innovations happen within a community, and the
core of any community is a common language”. The lack of a common innovation language at the
Partner Company makes it difficult for employees from different departments, such as Engineering

79
and Marketing, to understand the value that other departments can bring. This lowers the chances
of having a productive conversation and work environment, as well as a good learning experience
together. As portrayed by the ‘Communication’ and ‘Space’ element scores (see section 4.1.1.4),
there is a lack of structures and spaces for cross-functional work resulting in little successful
multidisciplinary work which is highly desired for innovation (O'Reilly III & Tushman, 2004;
Saunila, 2016; Sykes & Block, 1989). Even functional teams prefer individual work.
4.2.4 Lack of Environmental Alignment
A more recent employee, with significant previous management experience, mentioned during an
interview that “when you enter this Company, you enter a bubble”. Besides little internal
communication and alignment, there seems to be even less understanding and synergy with the
systems within which the Company operates. In the IQ questionnaire there are a few questions on
how the customers perceive the Company (see section 4.1.1.6). Many employees were surprised to
realize that they had no idea. Moreover, the ‘Iterate’ element regarding the efficiency of feedback
loops with customers was the lowest score of the questionnaire (see section 4.1.1.5).
Moreover, a disproportionally high amount of development and R&D resources are being used for
projects that focus on bringing the products up to standards. As expressed by several employees on
numerous occasions, they are currently – and have been for several years – in “catch-up mode”.
The Company is not evolving quickly enough to meet future needs and is not sufficiently
leveraging its relationships with suppliers and vendors, as evidenced by the low ‘Ecosystem’
element score discussed in section 4.1.1.4. Observations on the lack of Environmental Alignment
along with sample quotes are presented in Table 4.7. The data sources for each observation are
presented in Table 4.8.
4.3 Analysis of the Innovation Process Maturity
The four observation categories presented in section 4.2 represent four of the five key challenges
met during the development of innovation KPIs for the Company. The fifth challenge is the low
process maturity of the innovation processes.
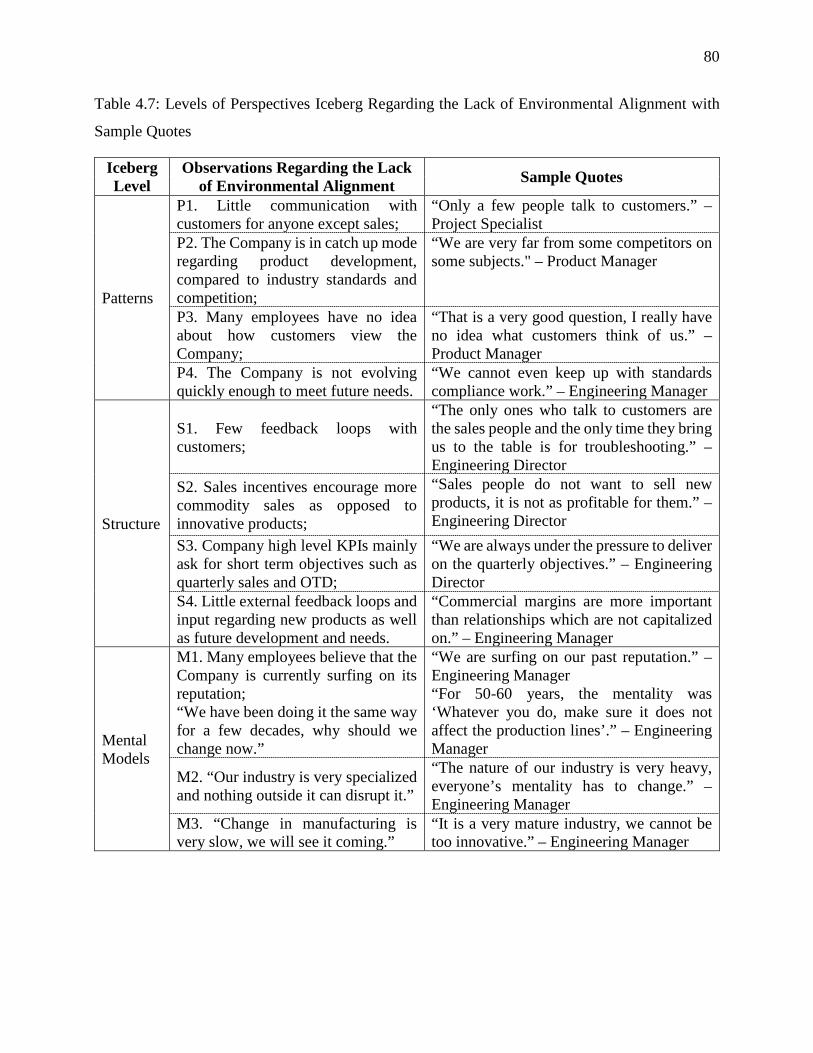
80
Table 4.7: Levels of Perspectives Iceberg Regarding the Lack of Environmental Alignment with
Sample Quotes
Iceberg Level
Observations Regarding the Lack of Environmental Alignment Sample Quotes
Patterns
P1. Little communication with customers for anyone except sales;
“Only a few people talk to customers.” – Project Specialist
P2. The Company is in catch up mode regarding product development, compared to industry standards and competition;
“We are very far from some competitors on some subjects." – Product Manager
P3. Many employees have no idea about how customers view the Company;
“That is a very good question, I really have no idea what customers think of us.” – Product Manager
P4. The Company is not evolving quickly enough to meet future needs.
“We cannot even keep up with standards compliance work.” – Engineering Manager
Structure
S1. Few feedback loops with customers;
“The only ones who talk to customers are the sales people and the only time they bring us to the table is for troubleshooting.” – Engineering Director
S2. Sales incentives encourage more commodity sales as opposed to innovative products;
“Sales people do not want to sell new products, it is not as profitable for them.” – Engineering Director
S3. Company high level KPIs mainly ask for short term objectives such as quarterly sales and OTD;
“We are always under the pressure to deliver on the quarterly objectives.” – Engineering Director
S4. Little external feedback loops and input regarding new products as well as future development and needs.
“Commercial margins are more important than relationships which are not capitalized on.” – Engineering Manager
Mental Models
M1. Many employees believe that the Company is currently surfing on its reputation; “We have been doing it the same way for a few decades, why should we change now.”
“We are surfing on our past reputation.” – Engineering Manager “For 50-60 years, the mentality was ‘Whatever you do, make sure it does not affect the production lines’.” – Engineering Manager
M2. “Our industry is very specialized and nothing outside it can disrupt it.”
“The nature of our industry is very heavy, everyone’s mentality has to change.” – Engineering Manager
M3. “Change in manufacturing is very slow, we will see it coming.”
“It is a very mature industry, we cannot be too innovative.” – Engineering Manager

81
Table 4.8: Levels of Perspectives Iceberg Regarding the Lack of Environmental Alignment with the Data Sources
Level Observations Data Sources
Prior Data
Document Review Interviews Workshops IQ
Questionnaire Observations Meetings Fellow
Researchers’ Observations
Patte
rns
P1. Little communication with customers;
P2. Catch up mode; P3. No idea about how customers view the Company;
P4. Not evolving quickly enough.
Stru
ctur
e
S1. Little feedback from customers;
S2. Sales incentives encourage commodity sales;
S3. High level KPIs focus on short term;
S4. Little external feedback loops.
Men
tal M
odel
s
M1. Surfing on past reputation;
M2. “Our industry is very specialized and nothing outside it can disrupt it.”
M3. “Change in manufacturing is very slow.”

82
Röglinger, Pöppelbuß, and Becker (2012) reviewed ten business process management (BPM)
maturity models. A fellow field researcher present at the Company during phase II reviewed the
ten models and found that, in general, the models exhibit 5 levels of process maturity which
describe the state of the process and its components and tools (Houllier, 2017). Based on the
examined models, he identified the typical characteristics of each level as presented in Figure 4.15.
Figure 4.15: Summary of Key Characteristics Common to 10 Selected BPMs
As part of his study, Houllier (2017) established that, in general at the time of this study, the
innovation processes in place at the Company were between maturity levels 1 and 2. The following
characteristics regarding the groups and processes involved with innovation explain this
classification:
• Lack of structure;
• Entire dependency on key resources;
• Little process visibility outside of IRDT or marketing;
• Tools are not well integrated with the processes or uniformly applied;
Only the key stakeholders are aware of the process, which is dependent on a few key resources.
The steps of the process are defined and known of. Rules and criteria are in place and followed. A conrol system is also in place.
The focus of the process development is on its formalisation, quality and management.PMS are being implemented and KPIs are defined.
The process is fully integrated within the company systems. Process continuous improvement methods are being developed.
The process is fully managed and mastered. Evaluation and improvement systems are in place. The process evolution is managed and mastered.
Level 1:
Initial
Level 2:
Reproducible
Level 3:
Defined
Level 4:
Managed
Level 5:
Optimized
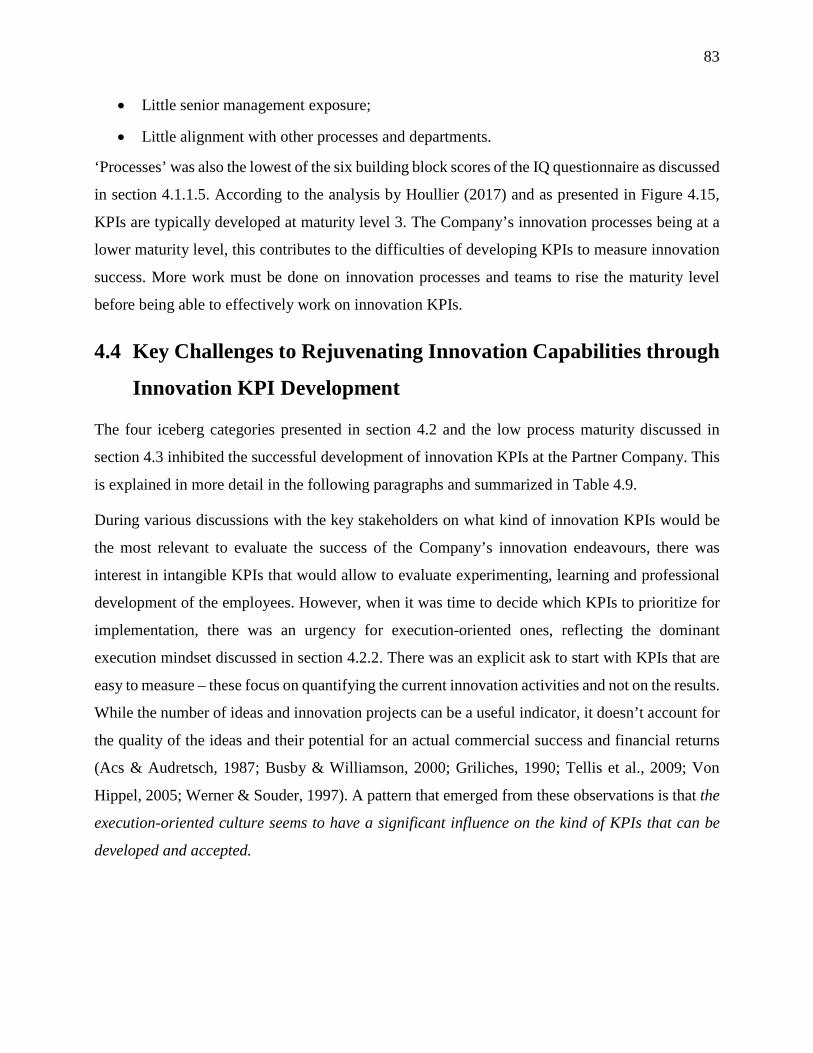
83
• Little senior management exposure;
• Little alignment with other processes and departments.
‘Processes’ was also the lowest of the six building block scores of the IQ questionnaire as discussed
in section 4.1.1.5. According to the analysis by Houllier (2017) and as presented in Figure 4.15,
KPIs are typically developed at maturity level 3. The Company’s innovation processes being at a
lower maturity level, this contributes to the difficulties of developing KPIs to measure innovation
success. More work must be done on innovation processes and teams to rise the maturity level
before being able to effectively work on innovation KPIs.
4.4 Key Challenges to Rejuvenating Innovation Capabilities through
Innovation KPI Development
The four iceberg categories presented in section 4.2 and the low process maturity discussed in
section 4.3 inhibited the successful development of innovation KPIs at the Partner Company. This
is explained in more detail in the following paragraphs and summarized in Table 4.9.
During various discussions with the key stakeholders on what kind of innovation KPIs would be
the most relevant to evaluate the success of the Company’s innovation endeavours, there was
interest in intangible KPIs that would allow to evaluate experimenting, learning and professional
development of the employees. However, when it was time to decide which KPIs to prioritize for
implementation, there was an urgency for execution-oriented ones, reflecting the dominant
execution mindset discussed in section 4.2.2. There was an explicit ask to start with KPIs that are
easy to measure – these focus on quantifying the current innovation activities and not on the results.
While the number of ideas and innovation projects can be a useful indicator, it doesn’t account for
the quality of the ideas and their potential for an actual commercial success and financial returns
(Acs & Audretsch, 1987; Busby & Williamson, 2000; Griliches, 1990; Tellis et al., 2009; Von
Hippel, 2005; Werner & Souder, 1997). A pattern that emerged from these observations is that the
execution-oriented culture seems to have a significant influence on the kind of KPIs that can be
developed and accepted.

84
Table 4.9: Overview of Key Challenges to Innovation KPI Development at the Partner Company
Key Challenge
Overview of the challenge at the Partner Company
How it inhibits development of innovation KPIs
Supporting References
Risk Aversion
Innovation requires testing, risk and some failure before breakthrough. The employees exhibit a risk averse behaviour prioritizing projects with a guarantee to sell today.
Resistance to output KPIs that could show ultimate innovation results a few years later as well as to soft KPIs that could be drivers of innovation. Priority to input and hard KPIs which do not allow one to measure the actual success of innovation endeavours.
Christensen (1997); Christensen and Raynor (2003); M. H. Morris et al. (2006); Rao and Weintraub (2013); Tellis et al. (2009)
Execution Mindset
Innovation requires stepping out of the day-to-day execution and making time and space to think and test some ideas out. There are few dedicated resources for innovation, which in any case mostly get pulled back to day-to-day emergencies.
The execution mindset asks for innovation KPIs that showcase execution of innovation, such as number of ideas and development projects. These do not encourage activities essential to the development of innovative capabilities.
Busby and Williamson (2000); Kuratko, Hornsby, et al. (2014); Pinchot III (1985); Rao and Weintraub (2013)
Lack of Internal Alignment
The lack of alignment does not allow for synergy with existing systems nor for efficient ways to develop cross functional metrics.
There is no vertical nor horizontal agreement on the kind of KPIs the key stakeholders want to have.
Kaplan and Norton (1992); Kuratko, Covin, et al. (2014)
Lack of Environmental Alignment
The Company is not set up to meet future needs as there is a lack of feedback loops with customers and most development efforts aim only to catch up to the standards and competition.
Disconnect with other stakeholders in the industry makes it difficult to have a good understanding of what success would mean, and what should be measured and how.
Atkinson et al. (1997); Christensen (1997); Dewangan and Godse (2014); Godener and Soderquist (2004); Neely, Adams, and Kennerley (2002), Ries (2011)
Low level of Process Maturity
Both groups mostly involved with innovation at the time of this study, the IRDT group and the marketing department, are new entities being structured with new processes being developed. The groups and innovation processes are not structured enough to be able to effectively develop KPIs.
The average maturity level of innovation processes at the time of study was between 1 and 2 while KPIs are normally developed at level 3. Other work needs to be done on the development of processes and teams before innovation KPIs can be effectively developed and implemented.
Rohloff (2009), Röglinger et al. (2012)

85
There is a clear preference for input KPIs, illustrating the Company’s short-term thinking. This
does not leave time and space for activities and development that account for aspects crucial for
innovation and take significant time to show results, such as learning (Kaplan & Norton, 1992;
Ries, 2011). Another pattern emerges: With little KPIs encouraging longer term endeavours and
development, learning and experimenting are not valued enough to gain sufficient importance
within the Company’s culture.
In addition to the urge for KPIs that are easy to measure immediately, different stakeholders have
different KPI preferences and have little interest in the indicators the others want to see. This lack
of internal alignment might be a consequence of the lack of environmental alignment, as all
Company internal stakeholders have different opinions on what customers really want and need.
This is reflected in the following pattern: Little synergy and alignment regarding innovation within
the Company often cause counterproductive work in respect to innovation.
No one agrees on which KPIs would help them better evaluate the success of their innovation
endeavours. In a Company where employees generally do not want to take responsibility, this
results in a lot of decisions bouncing back and forth between the main stakeholders. This often ends
up in asking for what is simpler. However, as established by Werner and Souder (1997), the simple
metrics are rarely the useful ones.
According to the ten BPM models reviewed in section 4.3, the level of maturity typically required
for effectively establishing KPIs is 3. Consequently, with the teams and structures not being well
established, nor well aligned among themselves or with the Company’s strategy, it is difficult to
develop effective ways to measure their work and accomplishments in respect to innovation.
The four categories presented in section 4.2 establish that the Company has an execution-oriented
culture with execution-oriented PMS. These characteristics, supported by the results of the IQ
questionnaire, contributed to the challenges of developing KPIs favorable to innovation.
86
4.5 Summary of Deductions with Regards to the Guiding Questions
Deductions regarding each of the research guiding questions were made based on the observations
and the memoing process explained in section 3.2.4. Through sorting of memos, integration with
existing literature, and conceptualization at a higher level, these deductions resulted in four
propositions. The deductions and propositions are presented in this section.
4.5.1 Deductions Regarding Guiding Questions 1 and 2
The first two guiding questions explore the interrelations between Corporate Culture, PMS and
Innovation Capabilities:
GQ 1: What are the dynamic relationships and mutual reinforcement mechanisms between
a company’s Culture and its PMS?
GQ 2: How do the specific contexts created by the combinations of Culture and PMS
influence, improve or deteriorate the company’s Innovation Capabilities?
One of the main barriers to the implementation of innovation KPIs at the Partner Company was the
lack of alignment of the innovation activities with the Company’s strategic priorities and among
the main innovation managers, as explained in section 4.2.3. Kuratko, Covin, et al. (2014) purport
that a lack of coherent coordination between managerial roles is one of the biggest reasons
innovation strategies fail in organizations. Moreover, absence of coherence between the culture
and the PMS hinders innovation strategies (Kuratko, Covin, et al., 2014).
Furthermore, for innovation success it is important that the individual evaluation and reward
systems are aligned with an innovation strategy (Hornsby et al., 2009). As employee performance
evaluations influence their daily choices, these actions eventually create the Company’s culture.
Appropriate evaluation and reward systems are lacking at the Company as assessed in section
4.1.1.6.
Hence, when the Company is not committed to innovation which is not even part of the executive
KPIs, there are few resources available for the development of Innovation Capabilities. Inversely,
if an execution-oriented company would commit to innovation, important barriers could be lifted
and resources deployed toward innovation needs. This leads to our first proposition.

87
Proposition 1: If an established execution-oriented company has innovation oriented
strategic objectives and implements PMS and reward systems aligned with such objectives,
this could stimulate innovation initiatives and support the future development and
deployment of Innovation Capabilities and of an Intrapreneurial Culture.
An organization’s culture is reflected in its employees’ actions and behaviours and is visible
through the investment of its leaders more than their words (Rao & Weintraub, 2013). While many
leaders verbally endorsed the importance of innovation, the results of the IQ questionnaire highlight
that there is a gap between leaders’ encouragement and actual coaching and support of innovation
work (see section 4.1.1.2). Employees sometimes spend time discussing and developing new
processes and tools but when it is time to implement a new method or change an existing practice,
they often resist and revert back to the old ways. At the Company, the execution mindset showed
even in the types of KPIs that the employees were ready to move forward with. This type of clash
was also witnessed with other innovation management implementation projects throughout the
phase I and phase II of the longitudinal research (Brodeur et al., 2017) and is rooted in a long
established execution mindset. The execution mindset is the core category that emerged from the
field observations and has an important influence on what can or cannot be done at the Company.
Consequently, it has an impact on the KPIs that can be developed, as mentioned in a pattern
discussed in section 4.4. This leads to our second proposition.
Proposition 2: Within a company with an execution-oriented culture, employees are likely
to resist implementation of innovation initiatives and measures, and prioritize execution-
oriented KPIs, even to measure innovation, further reinforcing the execution-oriented
culture and impeding the development of Innovation Capabilities.
4.5.2 Deductions Regarding Guiding Questions 3 and 4
The third and fourth guiding questions explore the Role of PMS in building Innovation
Capabilities:
GQ 3: What kind of PMS is more appropriate to stimulate Innovation Capabilities in an
established company?
GQ 4: How could PMS reinforce or kill the seeds of the Intrapreneurial Culture needed to
foster long-term Innovation Capabilities?

88
Since “what you measure is what you get” (Kaplan & Norton, 1992), if one wants innovation, one
must measure aspects that are aligned with and support innovation. The Partner Company’s
existing PMS as well as the KPIs that were favored for innovation are mainly made of indicators
that measure simple inputs and outputs. Focused on the “what”, such KPIs encourage short-term
goals and execution, consistent with the Company’s execution-oriented culture.
On the other hand, innovation requires time, investment and testing. However, its success is not a
function of these parameters. It depends more on a combination of luck, skillful and visionary
employees, and a good opportunity with good timing. These are intangible and hard to measure;
they have more to do with “how” things are done within the Company than with “what”.
The criteria that are used to evaluate the employees’ performance influence their everyday work
and decisions. Consequently, when their performance evaluation focusses more on the “what”, they
are not likely to prioritize work that requires them to take time to learn and experiment before
delivering tangible results, as discussed in one of the patterns presented in section 4.4. Thus, an
execution-oriented PMS can hinder the development of Innovation Capabilities as it discourages
the behaviours required to create a prosperous environment for innovation.
At the Partner Company, it was possible to observe a close relationship between the existing PMS
and the employees’ behaviours. While many expressed interest in different practices, few were
ready to invest their time on things that were not formally recognized through an existing Company
performance indicator. In the context of low innovation process maturity and without the possibility
to truly align the KPIs with the organization’s high level strategy, it was difficult to develop
meaningful and useful KPIs to measure the performance of constantly changing innovation
processes.
McAdam and Keogh (2004) highlight that “the measures are not an end point [… they] must be
continually reviewed and developed during the transitional period when creativity and innovation
is [sic] developed”. The KPI development project was part of a longitudinal research aiming to
help the Partner Company rejuvenate its Innovation Capabilities and develop its innovation
management. To achieve this goal, it was decided to focus on transitional KPIs that will encourage
the behaviours favorable to the development of Innovation Capabilities, rather than KPIs to
measure the innovation performance. It is hypothesized that better innovation processes will

89
eventually result in an improved innovation performance (Kaplan & Norton, 1992). This leads to
our third proposition.
Proposition 3: In an execution-oriented culture, it is more effective to develop KPIs to
stimulate behaviours that are hypothesized to develop Innovation Capabilities, rather than
KPIs to measure the success of innovation endeavours.
4.5.3 Deductions Regarding Guiding Question 5
The last guiding question explores the Role of Organizational Culture in building Innovation
Capabilities:
GQ 5: What dimensions of an Intrapreneurial Culture are most important to implement or
change in order to stimulate Innovation Capabilities?
An Intrapreneurial Corporate Culture allows for space and resources to explore new ideas (Clark
& Fujimoto, 1991; Kuratko, Hornsby, et al., 2014; Kuratko et al., 2012; Pinchot III, 1985) while
an execution-oriented one dictates short term tangible deliverables and priorities leaving little
opportunity for long-term development (Lakiza & Deschamps, 2018; Lakiza et al., 2017). In
addition, an intrapreneurial company provides support for innovation and new initiatives (Kuratko,
Hornsby, et al., 2014), often letting them temporarily bypass the formal management systems
(Pinchot III, 1985).
The role of the organizational culture in establishing or rejuvenating Innovation Capabilities is in
giving value to innovation so it becomes a priority that guides day-to-day thinking and the
development of supporting systems, processes and tools. Several cultural dimensions hindering the
Company’s Innovation Capabilities were observed at the partner Company:
• Risk-aversion;
• Lack of intrapreneurial support;
• Lack of dedicated innovation resources, space and time.
These dimensions have to be addressed in order to stimulate innovation within an execution-
oriented culture and contribute to the development of an Intrapreneurial Culture. This can be done
through behaviour change as further discussed in Chapter 5.
90
Innovation performance measurement is idiosyncratic to the organizational context and projects
(Bremser & Barsky, 2004; Brophey et al., 2013; Brophey & Brown, 2009; Godener & Soderquist,
2004; Griffin & Page, 1996; Jiménez-Zarco et al., 2006). While it was assessed that the Company
was not ready for KPIs to measure its innovation success at the time of the mandate, if the
organization goes through a cultural shift and strengthens its innovation processes, the context will
be different. Numerous authors believe that PMS can contribute to higher innovation effectiveness
(Cooper & Edgett, 1996; Griffin, 1997; Hart et al., 2003; Jiménez-Zarco et al., 2006; Marginson,
2002; Neely et al., 2000; Neely et al., 1997). In a new context, more favourable to and trusting of
innovation initiatives, the introduction of KPIs to measure innovation success might be the next
right step to increase innovation performance by providing guidance on where improvement is
possible (Jiménez-Zarco et al., 2006; Neely et al., 2000). Indeed, the name of level 3 (Defined) in
the process maturity model presented in Figure 4.15 suggests that the processes must be defined at
the time of KPI introduction. The model focuses on KPIs to measure performance of a Company’s
processes. This leads to our fourth proposition:
Proposition 4: When innovation and intrapreneurship are a strong part of the Company’s
culture and are accompanied by sufficiently mature (level 3 or more) innovation management
processes, the successful and effective implementation of KPIs to measure the performance of
innovation endeavours will be more likely.
4.6 Conceptual Framework
A conceptual framework is not a tested theory. It is a set of concepts and connections organized
coherently to help people understand how something takes place, and give direction to a study of
empirical problems (Saunila, 2016). A conceptual framework was developed by integrating high
level reflections from memoing, propositions 2, 3 and 4 presented in section 4.5, and knowledge
from literature. The framework is presented in Figure 4.16 and explained in detail in the following
paragraphs.
The Execution Zone of the framework (box 1 on Figure 4.16) results from the study’s core
category, the execution mindset, presented in section 4.2.2. This zone is characterized by the
combination of an execution-oriented culture with execution-oriented PMS. The execution-
oriented culture is defined as “a reactive, stagnant and risk averse culture where day-to-day

91
operations are prioritized over long term development” (Lakiza & Deschamps, 2018). The
execution-oriented PMS facilitate “effective outcomes, where these outcomes include risk
reduction, elimination of uncertainty, highly efficient operations, goal conformance, and specific
role definitions” (M. H. Morris et al., 2006).
Figure 4.16: Proposed Conceptual Framework
The Innovation Zone of the framework (box 4 in Figure 4.16) is characterized by the combination
of an Intrapreneurial Culture with innovation-oriented PMS. This zone is mainly defined through
knowledge from literature. The Intrapreneurial Culture is defined as an environment where each
employee can seize the opportunity to put to work their intrapreneurial potential (Kuratko,
Hornsby, et al., 2014). The innovation-oriented PMS encourage initiatives and continuous
learning, and focus on intangible aspects, objectives, strategy and forecasting of future processes.
A successful path from an Execution Zone (box 1 on Figure 4.16) to the Innovation Zone (box 4
on Figure 4.16) is a key concern of this study with the interest being to understand how to
rejuvenate the Innovation Capabilities of an established execution-oriented Company. In the
context where the rejuvenation path goes through the introduction of new KPIs into the existing
company’s PMS, KPIs with at least two different goals can be considered as shown in the
framework. The two paths are differentiated by what they are meant to do: govern employees’
behaviours (path A) or measure achievement and output (path B) (Cirka, 1997). While the path B
is what the Company initially asked for, Proposition 3 suggests that path A is more effective. These

92
paths are represented by the two choices at the left of the framework: Introduction of KPIs to
stimulate behaviours encouraging innovation (box 2 in Figure 4.16) vs Introduction of KPIs to
measure innovation success (box 3 in Figure 4.16). This choice is presented in Figure 4.17.
Path A: Introduction of KPIs to stimulate behaviours encouraging innovation
As “what you measure is what you get” (Kaplan & Norton, 1992), if KPIs that are meant to
stimulate behaviours conducive to innovation are introduced, this should contribute to the
development of Innovation Capabilities. Knowledge from literature suggests that the new
behaviours will contribute to transforming the company’s culture, opening it to opportunities and
more flexibility. This could imply the creation of heavy-weight teams and spin-offs. Ultimately,
this road will bring the company to the Innovation Zone. This portion of path A (added to Figure
4.17 as presented in Figure 4.18) is mainly inspired by knowledge from literature.
Figure 4.18: The Path toward the Innovation Zone
Figure 4.17: Two Possible Paths of Innovation KPI Introduction in Execution-oriented Culture

93
Once in the innovation zone (box 4), it will be easier to introduce KPIs to measure the success of
innovation work as suggested by Proposition 4. Introducing such KPIs in an Intrapreneurial Culture
with sufficiently mature innovation processes will help formalize the innovative practices to ensure
that they become part of the company’s long-term legacy, leading to a sustained innovation zone
(box 6). Path A is thus completed and presented in Figure 4.19.
Figure 4.19: Completion of Path A toward the Sustained Innovation Zone
Path B: Introduction of KPIs to measure innovation success
Direct introduction of KPIs to measure innovation performance in an execution-oriented culture
can be done in at least two ways. First, strongly imbedded in the execution mind-set, execution-
oriented KPIs (box 8) can be chosen even to measure innovation. This was experienced during
numerous discussions about innovation KPIs at the Partner Company as discussed in section 4.4.
Such KPIs will further reinforce the execution-oriented culture, failing to develop Innovation
Capabilities as suggested by Proposition 2. This is presented by the addition of a sub-path to path
B as presented in Figure 4.20.
On the other hand, risky intrapreneurs within the company could try to introduce innovation-
oriented KPIs (box 7). This effort is likely to clash with the company’s culture (box 9 on Figure
4.16) as it happened at the Partner Company and is discussed in section 4.5.1. This is likely to
discourage the intrapreneurs over time. When fighting for too long within a rigid environment,
many intrapreneurs give up and leave to become entrepreneurs, as has been documented in
numerous cases (Pinchot III, 1985). However, they could be persistent and eventually win the fight

94
toward the innovation zone (box 4). This is what we call ‘the hard road toward innovation’ as
presented in the framework. This completes the framework presented in Figure 4.16.
Figure 4.20: Introduction of Execution-oriented KPIs to Measure Innovation Success
Two versions of the complete framework showing how each of the three propositions fit within the
framework are presented in Appendix G.

95
CHAPTER 5 CONCLUSION
Given the Partner Company’s culture and structure, the fact that innovation efforts and innovation
management processes were challenging to carry out was not surprising. Indeed, the Company has
a ‘functional designs’ organizational design that implies the integration of project teams into the
existing organizational and management structure (O'Reilly III & Tushman, 2004). In their
investigation of 35 companies attempting to succeed in innovation, O'Reilly III and Tushman
(2004) found that only 25% of the 7 companies with the same design succeeded compared to 90%
of the 15 companies with an ambidextrous organization.
This chapter provides conclusions in section 5.1. A hypothesis and areas for future research are
proposed in section 5.2. Section 5.3 completes this thesis by discussing the limitations of this study,
and its contributions to academia and practice.
5.1 Discussion
Following the challenges met during the innovation KPIs implementation project at the Partner
Company, three prerequisites to such projects were identified and are discussed in section 5.1.1.
The challenges of culture change are discussed in section 5.1.2.
5.1.1 Prerequisites to a Successful Implementation of KPIs to Measure
Innovation Success
As explained in Chapter 4, the low BPM maturity level of the Company’s innovation processes
was a major challenge in the development of KPIs to measure the success of innovation
endeavours. This led to re-orient the project toward the development of KPIs with the goal to
encourage behaviours conducive to innovation instead of KPIs with the goal to measure innovation
success. Execution-oriented companies such as our Partner Company rarely prioritize innovation
management projects over everyday operations sufficiently for it to be worthwhile. Hence, when
the maturity level is too low, investment in the development of KPIs to measure innovation success
might not be the best use of time. This led to Proposition 3 presented in section 4.5.2. Thus, based
on the Case Study in the Partner Company, it is recommended to assess a company’s BPM maturity
level of innovation processes before deciding what type of innovation KPIs to implement and most
importantly with what goal in mind. This results in our first conclusion:

96
The innovation processes maturity is a prerequisite to a successful implementation of KPIs
to measure innovation success.
Moreover, as detailed in section 4.4, the lack of strategic alignment, internal as well as
environmental, also significantly hindered the effective development of innovation KPIs at the
Partner Company. The innovation KPI development project was not directly aligned with the
Company’s strategy and was not an executive priority. Moreover, in an execution-oriented culture,
a process development project is rarely a priority. In such circumstances, PMS implementation
projects often end up half completed, and the KPIs are used incorrectly or even dropped (Garengo
et al., 2005). Similar efforts become even more challenging in the future as stakeholders might
have lost faith in these types of projects. Combined with the lack of alignment between the main
innovation stakeholders (Engineering and Marketing departments), the decision-making regarding
this project lagged. This was exacerbated by the fact that, with little connection to the external
stakeholders, no one felt sufficiently confident about their innovation performance and needs. It is
difficult to achieve high performance when the different parts of the Company are not working
together in synergy (Kaplan & Norton, 1992). This results in our second conclusion:
Strategic alignment is a prerequisite to the successful development of innovation KPIs.
The remaining two challenges presented in section 4.4 were risk-aversion and an execution-
mindset that are deeply rooted in the Company’s culture. In this strong execution context there was
no sufficient commitment to innovation over the day-to-day firefighting. Indeed, innovation was
the priority of very few people and none of them had significant decision making power. Even the
people primarily assigned to innovation were constantly pulled out of their development projects
to respond to improvement requirements on customer orders. Important resources were provided
by upper management to improve operational excellence while IRDT was struggling to justify
dedicated resources for innovation. Without commitment, development projects are stretched and
delayed making them inefficient and sometimes obsolete by the time they are done. This results in
our third conclusion:
Commitment to innovation is a prerequisite to the successful development of innovation
KPIs in an execution-oriented company.
The interaction between these three conclusions results in our fourth conclusion:

97
The three prerequisites presented in this section influence one another. The resources
required to develop and solidify processes are more easily available when what they are
asked for is fully aligned with the company’s strategy. Innovation management efforts are
easier to align with the company’s strategy when the company is committed to innovation
which is itself part of its key objectives (Lakiza & Deschamps, 2018).
5.1.2 How is it Possible to Change an Organizational Culture?
“Culture is thought to be too big to ignore, too tough to conquer, and too soft to understand”
(Katzenbach & Harshak, 2011). Culture is uniquely human and it develops slowly (Katzenbach &
Harshak, 2011; Tellis et al., 2009). Moreover, “culture is difficult to observe, measure, and
develop” (Tellis et al., 2009). So how is it possible to change it?
Successful examples of culture change toward more innovative capabilities are all unique and
idiosyncratic to the context (Rao & Weintraub, 2013) so they cannot be easily transported across
firms (Tellis et al., 2009). Many people who do not know how to go about culture change without
clear guidelines and steps, try to ignore it. This was the case for some executives at the Partner
Company who did not believe that it was possible to change their culture. They were trying to
change the Company by introducing new processes and indicators. Katzenbach and Harshak (2011)
believe that no matter the directives such leaders try to issue, they will rarely achieve their
aspirations because of the cultural resistance.
According to Tellis et al. (2009), “attitudes are a more proximate driver of innovation than
practices”. Consequently, the mindset with which people approach a given situation has more
weight than how the controls in place measure their performance. According to Rao and Weintraub
(2013), “people change when they see their peers become more productive, engaged and
successful”. Indeed, “it is much easier to act your way into new thinking than to think your way
into new actions” (Katzenbach & Harshak, 2011). Katzenbach and Harshak (2011) explain that the
focus must be on changing the behaviour rather than changing the culture directly. The authors
believe that “direct experience trumps the old beliefs of an established culture” and it is easier to
change a culture when the experience is reinforced by other people (Katzenbach & Harshak, 2011).
Schein (2009) recommends to “always think first of the culture as your source of strength.” Indeed,
one way to approach culture change is to build on the positive elements of the existing culture by

98
focusing “on specific behaviours that solve real problems and deliver real results” (Katzenbach &
Harshak, 2011). Another approach could be to integrate two cultures within the same organization:
one oriented toward operational excellence and the other toward innovation. This is the case of
ambidextrous organizations (Gibson & Birkinshaw, 2004; O'Reilly III & Tushman, 2004).
Yes, culture is “unique, intangible, sticky, and difficult to change” (Tellis et al., 2009), but maybe
culture change is the only real lasting change possible. Hence, the fifth and last conclusion is as
follows:
The organizational culture has to be transformed to achieve real change and the way to do
it is through behaviour change.
This opens up multiple research possibilities on the appropriate behaviours to develop in order to
favour the development of Innovation Capabilities and how to encourage such behaviours.
5.2 Concluding Proposition and Future Research
Findings and propositions from this study support the idiosyncratic nature of innovation
performance measurement (Brophey et al., 2013). Based on this case study, it seems like the
maturity level of innovation processes has an impact on the types of KPIs that would be appropriate
to develop Innovation Capabilities. Indeed, the factors that influence Innovation Capabilities, such
as risk tolerance, strategic alignment and corporate culture, evolve during a company’s life. An
innovative start-up has very different KPI needs than an established innovative company such as
3M or Apple. Consequently, research must go further than comparing companies’ needs and
characteristics by size and industry. We must understand where they are at in their life story.
Moreover, while the typical BPM maturity models propose KPI development at level 3, research
has shown that there is value in performance measurement at different stages of a company’s life
(Busby & Williamson, 2000; Godener & Soderquist, 2004; Kuratko, Covin, et al., 2014). However,
KPIs with different goals are appropriate for different levels of maturity. A company’s innovation
management maturity level impacts the types of KPIs that will be appropriate to increase the
company’s Innovation Capabilities. Thus, to conclude this study we posit the following
hypothesis:
Different types of KPIs are appropriate for different levels of innovation management
maturity.

99
From this study, we propose that at maturity levels 1 and 2, KPIs with the goal to drive behaviours
conducive to innovation are most appropriate. Moreover, at level 3, the development of KPIs to
measure achievement will be appropriate. This study did not provide the opportunity for
propositions of appropriate KPIs at higher maturity levels.
The proposed hypothesis as well as the rest of this study findings provide possibilities for several
future research subjects of different research types. The proposed hypothesis could be tested with
a deductive approach by looking at correlations between the types of KPIs and the level of maturity
in multiple innovative companies. On the other hand, the proposed hypothesis can be explored
further through a longitudinal theory building research designed to follow the evolution of several
enterprises in order to better understand the relationships between their maturity, PMS, Culture and
Innovation Capabilities.
In addition, each of the four propositions as well as the conceptual framework presented in Chapter
4 can also be subjects for future inductive or deductive research. In fact, preliminary work has
already been done by Lacasse (2017) to develop methodology to test the validity of an earlier
version of the conceptual framework. Moreover, the Case Study was carried out in a specific
manufacturing company with an execution-oriented culture. There is interest in comparing its
challenges and outcomes with companies of a similar profile as well as different types of companies
in order to further the academic understanding on the key factors influencing the development of
Innovation Capabilities through PMS implementation and culture change.
Future research in the Partner Company would also be beneficial in order to see if the desired
behaviour changes occurred in the case if the proposed KPIs are implemented. If not, it would be
important to better understand the reasons behind the rejection of the KPIs proposed as part of this
study.
Finally, it is part of a typical company life cycle to go from innovative to bureaucratic. Therefore,
beyond understanding how to rejuvenate a company’s Innovation Capabilities, more work can be
done to comprehend how to preserve an innovative culture through time and growth as few
companies succeed in this.

100
5.3 Contributions and Limitations
This research contributes learning from an intervention-research case study in a manufacturing
company. Its first contribution is methodological with a unique field research design with the aim
to help bridge the gap between practice and literature. The author’s hope is that it can inspire more
field research in order to provide a better balance between the dominant deductive and the less
popular inductive research in innovation management (Hlady-Rispal, 2016).
Several theories and guidelines from literature where used to propose appropriate innovation KPIs
in the Partner Company with an execution-oriented culture. The challenges met allowed to
elaborate four propositions and a conceptual framework regarding the dynamic relationship
between Intrapreneurial Culture, PMS and Corporate Innovation Capabilities. While the results
from a Case Study cannot be generalized, they are meant to provide insights and ideas for future
work as suggested in section 5.2.
It is the author’s hope that learnings from this study can contribute to practitioners wishing to
rejuvenate their company’s Innovation Capabilities. Some practitioners might be tempted to take
what seems like the easy path through the implementation of new processes, tools and PMS. This
research shows that, at least in some circumstances, it is the difficult path. While culture change is
often frightening because of its uniqueness and ‘stickiness’, it might actually be the right path to
take by approaching it through behaviour change.
Indeed, the mandate carried out at the Partner Company changed from developing KPIs to measure
innovation success to developing KPIs that could drive the right behaviours to develop better
Innovation Capabilities. An important learning from this study supported by literature (Katzenbach
& Harshak, 2011; M. H. Morris et al., 2006; Tellis et al., 2009) is that organizational change goes
through behaviour change, even when implementing a PMS.
There is certainly no unique way to develop the appropriate KPIs and there are no universally
‘perfect’ KPIs to drive innovative behaviours. What is important is to clearly understand which
behaviours need to change, what behaviours have to be encouraged or restricted, and then choose
the KPIs accordingly. While behaviour and culture change take time, there are always other ways
for an established company to make space for innovation. Heavyweight teams or spin-offs can be
a temporary or even a long term solution to a company’s lack of Innovation Capabilities.

101
BIBLIOGRAPHY
Acs, Z. J., & Audretsch, D. B. (1987). Innovation, market structure, and firm size. The review of Economics and Statistics, 567-574.
Alegre, J., Lapiedra, R., & Chiva, R. (2006). A measurement scale for product innovation performance. European Journal of Innovation Management, 9(4), 333-346. doi:10.1108/14601060610707812
Andrew, J. P., Manget, J., Michael, D. C., Taylor, A., & Zablit, H. (2010). Innovation 2010: A return to prominence—and the emergence of a new world order. Boston, MA: Boston Consulting Group.
Atkinson, A. A., Waterhouse, J. H., & Wells, R. B. (1997). A stakeholder approach to strategic performance measurement. Sloan management review, 38(3), 25.
Ballé, M., Morgan, J., & Sobek II, D. K. (2016). Why Learning Is Central to Sustained Innovation. MIT Sloan Management Review, 57(3), 63-71.
Baruah, B., & Ward, A. (2014). Influential characteristics of the CEO that facilitate an intrapreneurial climate. Paper presented at the Proceedings of the 2nd International Conference on Innovation and Entrepreneurship: ICIE 2014.
Bititci, U. S., Turner, T. J., & Ball, P. D. (1999). The viable business structure for managing agility. International Journal of Agile Management Systems, 1(3), 190-199. doi:10.1108/14654659910296571
Bremser, W. G., & Barsky, N. P. (2004). Utilizing the balanced scorecard for R&D performance measurement. R&D Management, 34(3), 229-238.
Brodeur, J., Deschamps, I., & Lakiza, V. (2017). NPD implementation: Beyond Best Practices Paper presented at the Ispim Innovation Forum, Toronto, Canada.
Brophey, G., Baregheh, A., & Hemsworth, D. (2013). Innovation Process, Decision-Making, Perceived Risks and Metrics: A Dynamics Test. International Journal of Innovation Management, 17(03), 1340014. doi:10.1142/s1363919613400148
Brophey, G., & Brown, S. (2009). Innovation practices within small to medium-sized mechanically-based manufacturers. Innovation, 11(3), 327-340. doi:10.5172/impp.11.3.327
Brown, M. G., & Svenson, R. A. (1988). Measuring R&D productivity. Research Technology Management, 41(6), 30.
Brown, T. E., Davidsson, P., & Wiklund, J. (2001). An operationalization of Stevenson's conceptualization of entrepreneurship as opportunity-based firm behavior. Strategic Management Journal, 22(10), 953-968. doi:10.1002/smj.190
Bryman, A. (2016). Integrating quantitative and qualitative research: how is it done? Qualitative Research, 6(1), 97-113. doi:10.1177/1468794106058877
Burgelman, R. A. (1983a). Corporate Entrepreneurship and Strategic Management: Insights from a Process Study. Management Science, 29(12), 1349-1364.

102
Burgelman, R. A. (1983b). A Process Model of Internal Corporate Venturing in the Diversified Major Firm. Administrative Science Quarterly, 28, 223-244.
Burgelman, R. A. (1984). Designs for Corporate Entrepreneurship in Established Firms. California Management Review, 26(3), 154-166.
Burgelman, R. A., & Grove, A. S. (1996). Strategic Dissonance. California Management Review, 38(2), 8-28.
Busby, J. S., & Williamson, A. (2000). The appropriate use of performance measurement in non‐production activity. International Journal of Operations & Production Management, 20(3), 336-358. doi:10.1108/01443570010308103
Chan, V., Musso, C., & Shankar, V. (2008). McKinsey global survey results: Assessing innovation metrics. McKinsey Quarterly, 45(4), 1-11.
Chennell, A., Dransfield, S., Field, J., Fisher, N., Saunders, I., & Shaw, D. (2000). OPM: a system for organisational performance measurement. Paper presented at the Proceedings of the performance measurement–past, present and future conference, Cambridge.
Christensen, C. M. (1997). The innovator's dilemma: when new technologies cause great firms to fail. Boston, Massachusetts: Harvard Business School Press.
Christensen, C. M., & Raynor, M. (2003). The innovator's solution: Creating and sustaining successful growth: Harvard Business Review Press.
Cirka, C. (1997). A piece of the puzzle: Employee responses to control practices and effects on firm control strategy. Philadelphia, PA: Temple University Press.
Clark, K. B., & Fujimoto, T. (1991). Product development performance: Strategy, organization, and management in the world auto industry. Boston MA: Harvard Business School Press.
Clark, K. B., & Wheelwright, S. C. (1992). Organizing and Leading 'Heavyweight' Development Teams. California Management Review, Spring 1992(34), 20.
Collins, J. C. (2001). Good to great: Why some companies make the leap... and others don't. New York, NY: HarperCollins.
Cook, T. J., Vansant, J., Stewart, L., & Adrian, J. (1995). Performance measurement: Lessons learned for development management. World Development, 23(8), 1303-1315. doi:https://doi.org/10.1016/0305-750X(95)00050-M
Cooper, R. G. (2008). Perspective: The Stage-Gate® Idea-to-Launch Process—Update, What's New, and NexGen Systems*. Journal of Product Innovation Management, 25(3), 213-232. doi:10.1111/j.1540-5885.2008.00296.x
Cooper, R. G., & Edgett, S. J. (1996). Critical success factors for new financial services. Marketing Management, 5(3), 26.
Covin, J. G., & Miles, M. P. (1999). Corporate entrepreneurship and the pursuit of competitive advantage. Entrepreneurship: Theory and Practice, 23(3), 47-47.
Covin, J. G., & Slevin, D. P. (1989). Strategic Management of Small Firms in Hostile and Bening Environments. Strategic Management Journal.

103
Covin, J. G., & Slevin, D. P. (1991). A Conceptual Model of Entrepreneurship as Firm Behavior. ENTREPRENEURSHIP THEORY AND PRACTICE, 16(1), 7-25.
Covin, J. G., & Slevin, D. P. (2002). The entrepreneurial imperatives of strategic leadership,[w:] Strategic entrepreneurship. Creating a new mindset, eds. MA Hitt, RD Ireland, SM Camp, DL Sexton: Blackwell, Oxford.
Creswell, J. W. (2005). Qualitative research design: An interactive approach (2nd ed.). Thousand Oaks, CA: Sage.
Das, S. R., & Joshi, M. P. (2007). Process innovativeness in technology services organizations: Roles of differentiation strategy, operational autonomy and risk-taking propensity. Journal of Operations Management, 25(3), 643-660.
Davis, D., Morris, M. H., & Allen, J. (1991). Perceived Environmental Turbulence and Its Effect on Selected Entrepreneurship, Marketing, and Organizational Characteristics in Industrial Firms. Journal of the Academy of Marketing Science, 19(1), 43-51. doi:10.1007/bf02723423
Denzin, N. K., & Lincoln, Y. S. (2008). The landscape of qualitative research (Vol. 1): Sage. Deschamps, I., Lakiza, V., Beaulieu, A., Houllier, G., & Brodeur, J. (2016). Mitacs Accelerate
Proposal Application 2016-2017. Polytechnique Montreal. Deschamps, I., Mercier, A., Gabriel, O., Hadou, R., Lakiza, V., Beaulieu, A., & Houllier, G. (2017).
Mitacs Accelerate Proposal Application 2017-2018. Polytechnique Montreal. Dewangan, V., & Godse, M. (2014). Towards a holistic enterprise innovation performance
measurement system. Technovation, 34(9), 536-545. doi:10.1016/j.technovation.2014.04.002
Donnelly, G. (2000). A P&L for R&D. CFO, 16, 44-48. Duncan, W. J., Ginter, P. M., Rucks, A. C., & Jacobs, T. D. (1988). Intrapreneurship and the
reinvention of the corporation. Business Horizons, 31(3), 16-21. doi:http://dx.doi.org/10.1016/0007-6813(88)90004-3
Esterberg, K. G. (2002). Qualitative methods in social research. Boston: McGraw-Hill. Floyd, S. W., & Lane, P. J. (2000). Strategizing throughout the organization: managing role conflict
in strategic renewal. The Academy of Management Review, 25(1), 154-177. doi:10.5465/AMR.2000.2791608
Freel, M. S. (2000). Do Small Innovating Firms Outperform Non-Innovators? Small Business Economics, 14(3), 195-210. doi:10.1023/a:1008100206266
Galanakis, K. (2006). Innovation process. Make sense using systems thinking. Technovation, 26(11), 1222-1232. doi:10.1016/j.technovation.2005.07.002
Galbraith, J. R. (1975). Designing Complex Organizations. Reading, MA: Addison Wesley Publishing Company.
Gama, N., Silva, M. M. d., & Ataíde, J. (2007). Innovation Scorecard: A Balanced Scorecard for Measuring the Value Added by Innovation. In P. F. Cunha & P. G. Maropoulos (Eds.), Digital Enterprise Technology: Perspectives and Future Challenges (pp. 417-424). Boston, MA: Springer US.

104
Garengo, P., Biazzo, S., & Bititci, U. S. (2005). Performance measurement systems in SMEs: A review for a research agenda. International Journal of Management Reviews, 7(1), 25-47. doi:10.1111/j.1468-2370.2005.00105.x
Garvin, D. A., & Levesque, L. C. (2006). Meeting the Challenge of Corporate Entrepreneurship. Harvard Business Review(October 2006), 102-112.
Gibson, C., & Birkinshaw, J. (2004). Building Ambidexterity into an Organization. MIT Sloan Management Review(4), 47-55.
Godener, A., & Soderquist, K. E. (2004). Use and impact of performance measurement results in R&D and NPD: an exploratory study. R and D Management, 34(2), 191-219. doi:10.1111/j.1467-9310.2004.00333.x
Gómez‐Haro, S., Aragón‐Correa, J. A., & Cordón‐Pozo, E. (2011). Differentiating the effects of the institutional environment on corporate entrepreneurship. Management Decision, 49(10), 1677-1693. doi:10.1108/00251741111183825
Goodale, J. C., Kuratko, D. F., Hornsby, J. S., & Covin, J. G. (2011). Operations management and corporate entrepreneurship: The moderating effect of operations control on the antecedents of corporate entrepreneurial activity in relation to innovation performance. Journal of Operations Management, 29(1-2), 116-127. doi:10.1016/j.jom.2010.07.005
Gopal, S. S., & Clarke, T. (2016). Guide to Actor Mapping. Retrieved from https://www.fsg.org/tools-and-resources/guide-actor-mapping#download-area
Govindarajan, V. (1988). A Contingency Approach to Strategy Implementation at the Business-Unit Level: Integrating Administrative Mechanisms with Strategy. The Academy of Management Journal, 31(4), 828-853. doi:10.2307/256341
Greatbanks, R., & Boaden, R. (1998). Can SMEs afford to measure performance? Paper presented at the Conference Proceedings Performance Measurement–Theory and Practice.
Greiner, L. E. (1972). Evolution and revolution as organizations grow. Harvard Business Review, 50(4), 37-46.
Griffin, A. (1997). PDMA research on new product development practices: Updating trends and benchmarking best practices. Journal of Product Innovation Management, 14(6), 429-458.
Griffin, A., & Page, A. L. (1993). An Interim Report on Measuring Product Development Success and Failure. Journal of Product Innovation Management, 10, 291-308.
Griffin, A., & Page, A. L. (1996). PDMA success measurement project: recommended measures for product development success and failure. Journal of Product Innovation Management, 13(6), 478-496.
Griliches, Z. (1990). Patent statistics as economic indicators: a survey. Journal of Economic Literature, 28(4), 1661-1707.
Gunday, G., Ulusoy, G., Kilic, K., & Alpkan, L. (2011). Effects of innovation types on firm performance. International Journal of Production Economics, 133(2), 662-676. doi:10.1016/j.ijpe.2011.05.014

105
Hart, S., Hultink, E. J., Tzokas, N., & Commandeur, H. R. (2003). Industrial Companies' Evaluation Criteria in New Product Development Gates. Journal of Product Innovation Management, 20(1), 22-36. doi:10.1111/1540-5885.201003
Hiebl, M. R. W. (2015). Family involvement and organizational ambidexterity in later-generation family businesses. Management Decision, 53(5), 1061-1082. doi:10.1108/md-04-2014-0191
Hisrich, R., & Kearney, C. (2011). Corporate entrepreneurship: how to create a thriving entrepreneurial spirit throughout your company: McGraw Hill Professional.
Hitt, M. A., Hoskisson, R. E., Johnson, R. A., & Moesel, D. D. (1996). The Market for Corporate Control and Firm Innovation. The Academy of Management Journal, 39(5), 1084-1119. doi:10.2307/256993
Hlady-Rispal, M. (2016). Une stratégie de recherche en gestion. Revue française de gestion, 41(253), 251-266. doi:10.3166/rfg.253.251-266
Holton, J. A. (2010). The Coding Process and Its Challenges. The Grounded Theory Review, 9(1). Hornsby, J. S., Kuratko, D. F., Shepherd, D. A., & Bott, J. P. (2009). Managers' corporate
entrepreneurial actions: Examining perception and position. Journal of Business Venturing, 24(3), 236-247. doi:10.1016/j.jbusvent.2008.03.002
Hornsby, J. S., Kuratko, D. F., & Zahra, S. A. (2002). Middle managers' perception of the internal environment for corporate entrepreneurship: assessing a measurement scale. Journal of Business Venturing, 17(3), 253-273. doi:10.1016/S0883-9026(00)00059-8
Horowitz, M. (2014). The Dance of We: The Mindful Use of Love and Power in Human Systems: Synthesis Center Incorporated.
Houllier, G. (2017). Implantation d’un processus de gestion agile des opportunités d’innovation contractuelles dans une entreprise manufacturière. Retrieved from Polytechnique Montreal:
Ireland, R. D., Covin, J. G., & Kuratko, D. F. (2009). Conceptualizing Corporate Entrepreneurship Strategy. ENTREPRENEURSHIP THEORY AND PRACTICE, 33(1), 19-46. doi:10.1111/j.1540-6520.2008.00279.x
Ireland, R. D., Kuratko, D. F., & Morris, M. H. (2006). A health audit for corporate entrepreneurship: innovation at all levels: Part II. The Journal of Business Strategy, 21.
Ivanov, C.-I., & Avasilcăi, S. (2014). Performance Measurement Models: An Analysis for Measuring Innovation Processes Performance. Procedia - Social and Behavioral Sciences, 124, 397-404. doi:10.1016/j.sbspro.2014.02.501
Jiménez-Zarco, A. I., Martínez-Ruiz, M. P., & González-Benito, Ó. (2006). Performance Measurement Systems (PMS) Integration into New Product Innovation: A Literature Review and Conceptual Framework. Academy of Marketing Science Review, 2006(9).
Kallio, A., Kujansivu, P., & Parjanen, S. (2012). Locating the Weak Points of Innovation Capability before Launching a Development Project. Interdisciplinary Journal of Information, Knowledge & Management, 7.
106
Kanter, R. (1985). Supporting innovation and venture development in established companies. Journal of Business Venturing, 1(1), 47-60. doi:http://dx.doi.org/10.1016/0883-9026(85)90006-0
Kaplan, R. S., & Norton, D. P. (1992). The Balanced Scorecard: Measures that drive performance. Harvard Business Review, Jan-Feb, 75-85.
Kaplan, R. S., & Norton, D. P. (1996). Using the balanced scorecard as a strategic management system. Harvard Business Review, 70(1), 75-82.
Kaplan, R. S., & Norton, D. P. (2001). Transforming the balanced scorecard from performance measurement to strategic management: Part I. Accounting horizons, 15(1), 87-104.
Katzenbach, J., & Harshak, A. (2011). Stop Blaming your Culture. Strategy+Business(62). Kerssens-van Drongelen, I. C. (1999). Systematic design of R&D performance measurement
systems (J. Bilderbeek, J. M. L. van Engelen, O. A. M. Fisscher, & B. Financieel Management en Eds.). Enschede, Netherlands: Universiteit Twente.
Kerssens-van Drongelen, I. C., & Bilderbeek, J. (1999). R&D performance measurement: more than choosing a set of metrics. R&D Management, 29(1), 35-46. doi:10.1111/1467-9310.00115
Kerssens-van Drongelen, I. C., & Cooke, A. (1997). Design principles for the development of measurement systems for research and development processes. R&D Management, 27(4), 345-357. doi:10.1111/1467-9310.00070
Kerssens-van Drongelen, I. C., Nixon, B., & Pearson, A. (2000). Performance measurement in industrial R&D. International Journal of Management Reviews, 2(2), 111-143. doi:10.1111/1468-2370.00034
Khazanchi, S., Lewis, M. W., & Boyer, K. K. (2007). Innovation-supportive culture: The impact of organizational values on process innovation. Journal of Operations Management, 25(4), 871-884.
Kim, D. H. (2002). Organizing for Learning: Strategies for Knowledge Creation and Enduring Change: Cobee Publishing House.
Kirchhoff, B. A., Linton, J. D., & Walsh, S. T. (2013). Neo-Marshellian Equilibrium versus Schumpeterian Creative Destruction: Its Impact on Business Research and Economic Policy. Journal of Small Business Management, 51(2), 159-166. doi:10.1111/jsbm.12018
Koetzier, W., & Alon, A. (2013). Why "low risk" innovation is costly: Overcoming the perils of renovation and invention. Retrieved from New York:
Kuratko, D. F. (2009). The entrepreneurial imperative of the 21st century. Business Horizons, 52(5), 421-428. doi:10.1016/j.bushor.2009.04.006
Kuratko, D. F., & Audretsch, D. B. (2013). Clarifying the domains of corporate entrepreneurship. International Entrepreneurship and Management Journal, 9(3), 323-335. doi:10.1007/s11365-013-0257-4
Kuratko, D. F., Covin, J. G., & Hornsby, J. S. (2014). Why implementing corporate innovation is so difficult. Business Horizons, 57(5), 647-655. doi:10.1016/j.bushor.2014.05.007

107
Kuratko, D. F., Hornsby, J. S., & Bishop, J. W. (2005). Managers' Corporate Entrepreneurial Actions and Job Satisfaction. International Entrepreneurship and Management Journal, 1, 275-291.
Kuratko, D. F., Hornsby, J. S., & Covin, J. G. (2014). Diagnosing a firm's internal environment for corporate entrepreneurship. Business Horizons, 57(1), 37-47. doi:10.1016/j.bushor.2013.08.009
Kuratko, D. F., Hornsby, J. S., & Goldsby, M. G. (2012). Innovation acceleration: Transforming organizational thinking. Upper Saddle River, NJ: Pearson/Prentice Hall.
Kuratko, D. F., Hornsby, J. S., Naffziger, D. W., & Montagno, R. V. (1993). Implement Entrepreneurial Thinking in Established Organizations. Advanced Management Journal, Winter 1993(58), 7.
Kuratko, D. F., & Montagno, R. V. (1989). The Intrapreneurial Spirit. TRAINING AND DEVELOPMENT JOURNAL, 43(10), 83-85.
Kvale, S. (1996). InterViews: An Introduction to Qualitative Research Interviewing: Sage Publications.
Lacasse, D. (2017). Rapport Projet Intégrateur III. Retrieved from Polytechnique Montreal: Laitinen, E. K. (1996). Framework for small business performance measurement: towards
integrated PM system., University of Vaasa, Finland. Laitinen, E. K. (2002). A dynamic performance measurement system: evidence from small Finnish
technology companies. Scandinavian Journal of Management, 18(1), 65-99. doi:http://dx.doi.org/10.1016/S0956-5221(00)00021-X
Lakiza, V. (2016). Analyse de l'industrie de fabrication de robinetterie au Canada. Retrieved from Polytechnique Montreal:
Lakiza, V., & Deschamps, I. (2018). Case Study: Innovation KPIs development challenges within an execution-oriented culture. Paper presented at the Ispim Innovation Forum, Boston.
Lakiza, V., Deschamps, I., & Brodeur, J. (2017). Propelling Innovation: the Role of Intrapreneurial Culture and Performance Measurement Paper presented at the Ispim Innovation Forum, Toronto, Canada.
Lazzarotti, V., Manzini, R., & Mari, L. (2011). A model for R&D performance measurement. International Journal of Production Economics, 134(1), 212-223. doi:10.1016/j.ijpe.2011.06.018
Liao, S.-h., Fei, W.-C., & Chen, C.-C. (2007). Knowledge sharing, absorptive capacity, and innovation capability: an empirical study of Taiwan's knowledge-intensive industries. Journal of Information Science, 33(3), 340-359. doi:10.1177/0165551506070739
Ling, Y., Simsek, Z., Lubatkin, M. H., & Veiga, J. F. (2008). Transformational leadership's role in promoting corporate entrepreneurship: Examining the CEO-TMT interface. ACADEMY OF MANAGEMENT JOURNAL, 51(3), 557-576.
Loch, C., Stein, L., & Terwiesch, C. (1996). Measuring development performance in the electronics industry. Journal of Product Innovation Management, 13(1), 3-20. doi:https://doi.org/10.1016/0737-6782(95)00089-5

108
Marginson, D. E. W. (2002). Management Control Systems and Their Effects on Strategy Formation at Middle-Management Levels: Evidence from a U.K. Organization. Strategic Management Journal, 23(11), 1019-1031. doi:10.1002/smj.271
McAdam, R. (2000). Quality models in an SME context. International Journal of Quality & Reliability Management, 17(3), 305-323. doi:10.1108/02656710010306166
McAdam, R., & Keogh, W. (2004). Transitioning Towards Creativity and Innovation Measurement in SMEs. Creativity and Innovation Management, 13(2), 126-139. doi:10.1111/j.0963-1690.2004.00300.x
McAdam, R., Keogh, W., Reid, R. S., & Mitchell, N. (2007). Implementing innovation management in manufacturing SMEs: a longitudinal study. Journal of Small Business and Enterprise Development, 14(3), 385-403. doi:10.1108/14626000710773501
Meadows, D. (1999). Leverage points: Places to intervene in a system. The Sustainability Institute, 3, 19pp.
Merriam, S. B. (2002). Qualitative research in practice : examples for discussion and analysis. San Francisco: Jossey-Bass.
Miller, D. (1983). The correlates of entrepreneurship in three types of firms. Management Science, 29(7), 770-791.
Moisdon, J.-C. (2016). Recherche en gestion et intervention. Revue française de gestion, 41(253), 21-39. doi:10.3166/rfg.253.21-39
Morris, L. (2009). Business Model Innovation The Strategy of Business Breakthroughs. International Journal of Innovation Science, 1(4), 191-204.
Morris, M. H., Allen, J., Schindehutte, M., & Avila, R. (2006). Balanced management control systems as a mechanism for achieving corporate entrepreneurship. Journal of Managerial Issues, 468-493.
Morris, M. H., & Kuratko, D. F. (2002). Corporate entrepreneurship: Entrepreneurial development within organizations: South-Western Pub.
Morris, M. H., Kuratko, D. F., & Covin, J. G. (2010). Corporate entrepreneurship & innovation: Cengage Learning.
Morris, T., & Wood, S. (1991). Testing the Survey Method: Continuity and Change in British Industrial Relations. Work, employment and society, 5(2), 259-282. doi:10.1177/0950017091005002007
Morrow, J. L., Hansen, M. H., & Pearson, A. W. (2004). The Cognitive and Affective Antecedents of General Trust within Cooperative Organizations. Journal of Managerial Issues, 16(1), 48-64.
Morse, C. W. (1986). The delusion of intrapreneurship. Long Range Planning, 19(6), 92-95. doi:http://dx.doi.org/10.1016/0024-6301(86)90101-9
Naveh, E. (2007). Formality and discretion in successful R&D projects. Journal of Operations Management, 25(1), 110-125.
Neely, A. D. (1998). Measuring business performance. London: Profile books.
109
Neely, A. D., Adams, C., & Kennerley, M. (2002). The performance prism: The scorecard for measuring and managing business success: Financial Times/Prentice Hall London.
Neely, A. D., Mills, J., Gregory, M., Richards, H., Platts, K., & Bourne, M. (1996). Getting the measure of your business, University of Cambridge. Cambridge: Cambridge University Press.
Neely, A. D., Mills, J., Platts, K., Richards, H., Gregory, M., Bourne, M., & Kennerley, M. (2000). Performance measurement system design: developing and testing a process‐based approach. International Journal of Operations & Production Management, 20(10), 1119-1145. doi:10.1108/01443570010343708
Neely, A. D., Richards, H., Mills, J., Platts, K., & Bourne, M. (1997). Designing Performance Measures: A Structured Approach. International Journal of Operations & Production Management, 17(11), 1131-1152.
O'Reilly III, C. A., & Tushman, M. L. (2004). The ambidextrous organization. Harvard Business Review, 82(4), 74-81, 140.
Ojanen, V., & Vuola, O. (2005). Coping with the multiple dimensions of R&D performance analysis. International Journal of Technology Management, 33(2-3), 279-290.
Olsson, A., Wadell, C., Odenrick, P., & Bergendahl, M. N. (2010). An action learning method for increased innovation capability in organisations. Action Learning: Research and Practice, 7(2), 167-179. doi:10.1080/14767333.2010.488328
Oriot, F., & Misiaszek, E. (2012). Le Balanced Scorecard au filtre d’une PME française. Ou pourquoi les PME préfèrent le « sur-mesure ». Revue française de gestion, 38(225), 27-43. doi:10.3166/rfg.225.27-43
Patton, M. Q. (1987). How to use qualitative methods in evaluation: Sage. Perez-Freije, J., & Enkel, E. (2007). Creative Tension in the Innovation Process. European
Management Journal, 25(1), 11-24. doi:10.1016/j.emj.2006.11.005 Peters, T. J., & Waterman, J. (1982). RH (1982) In search of excellence. Lessons from Americas
best-nen. Companies. New, Row Publ. Pinchot III, G. (1985). Intrapreneuring: Why you don't have to leave the corporation to become an
entrepreneur. New York: Harper and Row. Pinchot III, G. (1993). The End of Bureaucracy and the Rise of the Intelligent Organization. San
Francisco, CA: Berrett-Koehler. Porter, M. E. (1990). The competitive advantage of nations. Harvard Business Review, 68(2), 73-
93. Rao, J., & Weintraub, J. (2013). How Innovative Is Your Company's Culture? MIT Sloan
Management Review, 54(3), 9. Ren, C. R., & Guo, C. (2011). Middle Managers' Strategic Role in the Corporate Entrepreneurial
Process: Attention-Based Effects. Journal of Management, 37(6), 1586-1610. doi:10.1177/0149206310397769
Ries, E. (2011). The lean startup: How today's entrepreneurs use continuous innovation to create radically successful businesses: Crown Books.

110
Roberts, E. B. (2007). Managing invention and innovation. RESEARCH-TECHNOLOGY MANAGEMENT, 50(1), 35-54.
Robson, C. (2002). Real world research (2nd ed.). Oxford: Blackwell Publishing. Röglinger, M., Pöppelbuß, J., & Becker, J. (2012). Maturity models in business process
management. Business Process Management Journal, 18(2), 328-346. doi:10.1108/14637151211225225
Rohloff, M. (2009). Process management maturity assessment. Paper presented at the AMCIS. Rousseau, D. M. (2006). Is there such a thing as “evidence-based management”? Academy of
management review, 31(2), 256-269. Saunders, M. N., Lewis, P., & Thornhill, A. (2011). Research methods for business students (5th
ed.): Pearson Education India. Saunila, M. (2016). Performance measurement approach for innovation capability in SMEs.
International Journal of Productivity and Performance Management, 65(2), 162-176. doi:10.1108/ijppm-08-2014-0123
Saunila, M., & Ukko, J. (2013). Facilitating innovation capability through performance measurement. Management Research Review, 36(10), 991-1010. doi:10.1108/mrr-11-2011-0252
Sawang, S. (2009). Key Performance Indicators for Innovation Implementation: Perception vs. Actual Usage. Asia Pacific Management Review, 16(1), 23-29.
Schein, E. H. (1999). Process consultation revisited: Building the helping relationship: Addison-Wesley Reading, MA.
Schein, E. H. (2009). The corporate culture survival guide (2nd ed.): John Wiley & Sons. Schmitt, C., Husson, J., Nobile, D., Morua, J., Marin, A., & Majdouline, I. (2015). Les situations
entrepreneuriales: Définition et intérêts pour la recherche en entrepreneuriat. Paper presented at the 9e Congrès de l'Académie de l'Entrepreneuriat et de l'Innovation, Nantes, France.
Schumpeter, J. A. (1934). The theory of economic development: An inquiry into profits, capital, credit, interest, and the business cycle (2nd ed.). Cambridge, MA: Harvard University Press.
Senge, P., Kleiner, A., Roberts, C., Ross, R., Roth, G., Smith, B., & Guman, E. C. (1999). The dance of change: The challenges to sustaining momentum in learning organizations: Wiley Online Library.
Shih, M. S. H., & Yong, L.-C. (2001). Relationship of Planning and Control Systems with Strategic Choices: A Closer Look. Asia Pacific Journal of Management, 18(4), 481-501. doi:10.1023/a:1012875326074
Simons, R. (1995). Control in an Age of Empowerment. Harvard Business Review, 63(2), 80-88. Smith, M., Busi, M., Ball, P., & Van Der Meer, R. (2008). Factors Influencing an Organisation's
Ability to Manage Innovation: A Structured Literature Review and Conceptual Model. International Journal of Innovation Management, 12(04), 655-676. doi:10.1142/s1363919608002138

111
Stake, R. E. (2000). The art of case study research: Perspectives on practice (2nd ed.). Thousand Oaks, CA: Sage.
Storey, C., & Kelly, D. (2001). Measuring the performance of new service development activities. Service Industries Journal, 21(2), 71-90.
Strauss, A., & Corbin, J. (1998). Basics of qualitative research: Techniques and procedures for developing grounded theory (2nd ed.). Thousand Oaks, CA: Sage.
Suddaby, R. (2006). From the editors: What grounded theory is not. ACADEMY OF MANAGEMENT JOURNAL, 49(4), 633-642.
Sundgren, M., Dimenäs, E., Gustafsson, J.-E., & Selart, M. (2005). Drivers of organizational creativity: a path model of creative climate in pharmaceutical R&D. R&D Management, 35(4), 359-374. doi:10.1111/j.1467-9310.2005.00395.x
Sykes, H. B., & Block, Z. (1989). Corporate Venturing Obstacles - Sources and Solutions. Journal of Business Venturing, 4(3), 159-167.
Tellis, G. J., Prabhu, J. C., & Chandy, R. K. (2009). Radical innovation across nations: The preeminence of corporate culture. Journal of marketing, 73(1), 3-23.
Tidd, J., Bessant, J., Pavitt, K., & Wiley, J. (1998). Managing innovation: integrating technological, market and organizational change. New York: Wiley.
Triandis, H. C. (1996). The psychological measurement of cultural syndromes. American psychologist, 51(4), 407-415. doi:10.1037/0003-066x.51.4.407
Tuominen, M., & Hyvönen, S. (2004). Organizational Innovation Capability: A Driver for Competitive Superiority in Marketing Channels. The International Review of Retail, Distribution and Consumer Research, 14(3), 277-293. doi:10.1080/09593960410001678417
Turró, A., Urbano, D., & Peris-Ortiz, M. (2014). Culture and innovation: The moderating effect of cultural values on corporate entrepreneurship. Technological Forecasting and Social Change, 88, 360-369. doi:10.1016/j.techfore.2013.10.004
Utterback, J. M. (1994). Mastering the dynamics of innovation: how companies can seize opportunities in the face of technological change Harvard Business School Press. Boston, MA.
Von Hippel, E. (2005). Democratizing innovation. Cambridge, Massachusetts: MIT press. Werner, B. M., & Souder, W. E. (1997). Measuring R&D Performance - State of the Art. Research
Technology Management, 40(Mar/Apr 1997). Wiklund, J., & Shepherd, D. (2005). Entrepreneurial orientation and small business performance:
a configurational approach. Journal of Business Venturing, 20(1), 71-91. Yin, R. K. (2013). Case study research: Design and methods (5th ed.). Thousand Oaks, CA: Sage. Yucel, I. (2015). Steady flow: Revenue growth will pick up, driven by more customization and
construction demand. Retrieved from Zahra, S. A. (1995). Corporate Entrepreneurship and Financial Performance: The Case of
Management Leveraged Buyouts. Journal of Business Venturing, 10, 225-247.

112
Zahra, S. A., Jennings, D. F., & Kuratko, D. F. (1999). The antecedents and consequences of firm-level entrepreneurship: The state of the field. Entrepreneurship: Theory and Practice, 24(2), 45-45.

113
APPENDIX A – INTERVIEW GUIDES
More information regarding the context and the interview questions for the three sets of interviews
presented in section 3.5.3.3 is provided in this Appendix.
Project Charter Discussions
The project charter interviews were held at the beginning of the mandate with the Partner Company
to share the author’s project charter regarding the Innovation KPI development project with the
relevant Company innovation stakeholders. It was a good way to introduce the researcher and get
to know the stakeholders. The project charter was sent beforehand for the interviewees to have time
to look at it before the interviews.
The author introduced herself, her background and her role at the Company at the beginning of
each interview. The interviews were semi-structured. The following questions were used to guide
and open the discussions. They were not always asked in the same order, it depended on how the
discussion was going.
1. Before we begin, do you have any first impressions, thoughts, or questions to share regarding the charter, the described project in general, or innovation at the Company?
2. Do you think the project with its scope and timeline is realistic? Please elaborate, why yes or why no.
3. Do you see any bottlenecks that I might meet?
4. Do you see any possible risks?
5. According to you, who are the most important people to interview regarding this project? Why? Did I miss any in my first listing?
6. Are there any stakeholders that could support me in any way with this project?
7. As I am new to this Company, are there any things concerning the Company, its employees and its ways of working that I should know?
8. Can you tell me what ‘being innovative’ means to you?
114
Previous KPI Data Collection
These interviews were held with stakeholders that had worked or were working on specific
innovation projects. The main goal was to collect as much indicators as possible regarding these
projects, specifically about the resources spent as well as related sales if any. The projects under
investigation were those that were identified with the IRDT Director, and the VPs of Engineering
and Marketing, as ‘New’ with sales over the last 5 years. The ‘New’ included new-to-the-world,
new-to-the-Company, major improvements, products that resulted in opening new markets or
increased market share.
As most of the stakeholders involved in these interviews were engineers passionate about their
projects, this resulted in much more than a hunt for numbers. Moreover, this exposed in detail the
problem of siloed data management systems. Most stakeholders had personalized spreadsheets to
manage information regarding their projects.
Each interview was concerning specific projects on which the interviewee had worked on, and was
semi-structured in the hope to receive more information than only performance indicators. The
following guiding questions were used in varying order and helped start the conversations:
1. Do you have any information on the resources spent on this project? This includes man-hours and test material?
2. Do you have any information on the sales related to this product development? To what client? What quantity? When? For how much?
3. Was this innovation directly related to a customer order?
4. What is an innovative product according to you?
5. How would you classify this product in terms of ‘innovativeness’ based on your previous answer?
6. Do you agree with the way this product was classified by the management? Please elaborate why yes or why not.

115
Mid-term Innovation KPI Proposal
After 5 months on the field, a first proposition of KPIs was developed for discussion purposes and
presented to 11 stakeholders for feedback. A short document presenting these KPIs was developed
and sent before each interview to the involved stakeholders. The following questions were used to
guide these semi-structured interviews:
1. Before we begin, do you have any first impressions, thoughts, or questions on the KPIs
presented in the document I sent you?
2. What do you think about the proposed KPIs?
3. Do you think the proposed KPIs cover all the important dimensions? Is there something
missing?
4. How difficult do you think these KPIs will be to implement? Why?

116
APPENDIX B – HIGH-LEVEL WORKSHOP OUTLINES
The high-level outlines of each of the workshops developed are presented in this Appendix.
Workshop 1: KPI Requirements Definition
The following structure was used to guide the workshop discussions and activities:
1. Why is it important for you to measure innovation performance? For what kind of use?
1.1. Each lists his top personal reasons;
1.2. Everyone shares the reasons which are noted on a flipchart.
2. What does successful innovation mean to each of you?
2.1. Think of a recent innovation outside your industry that really impressed you.
2.1.1. Write on separate post-its the 2-3 main reasons why this innovation is so impressively innovative to you.
2.1.2. Everyone shares with the group and the post-its are grouped in categories on a flipchart.
2.1.3. Follows a discussion on what stands out the most.
2.2. Think of an important innovation in your industry (your Company or other) that has been successful and that would have the aspects/characteristics that we just discussed in 2.1.2.
2.2.1. What made it successful?
2.2.2. Please share if you know what the innovation process looked like.
3. How do our discussions so far connect with the current Company vision and goals?
3.1. Is there anything important missing in our discussions compared to the Company’s high-level goals?
3.2. Take a few minutes to answer individually on separate post-its the following core BSC questions:
3.2.1. To achieve our vision, how should we appear to customers in regard to innovation?
3.2.2. To satisfy our customers, what business processes must we excel at in regard to innovation?
3.2.3. To achieve our vision, how can we sustain our ability to change and improve?
3.3. Please share, we will group similar post-its together in categories.

117
4. Of everything we have discussed, what is the one thing about innovation that you would like to see at the Company?
4.1. Everyone shares their post-its that are grouped when possible and presented on a flipchart;
4.2. Each participant has three dots in order to vote on what is the most important for the Company. The three votes can be split between one or two post-its or can be all used for one post-it.
Workshop 2: Innovation System Mapping
The following structure was used to guide the workshop discussions and activities:
1. List all internal and external stakeholders on separate post-its. 2. Draw links between stakeholders based on the following questions:
• What do we know about the customers’ needs?
Through what channels does the Company currently get information on customers’ needs?
• What kind of feedback does the Company get on their innovative products?
Through what channels/stakeholders does the Company get this feedback?
• How does the Company do market research?
• What kind of spaces (internal and external) does the Company have/use in order to learn about its unknown needs?
• How does the Company spread information about its innovation to customers?
Through what channels?
• What other knowledge sharing mechanisms exist to share information about the Company’s innovation?
• Through what channels is alignment with the Company’s mission ensured?

118
APPENDIX C – IQ QUESTIONNAIRE STATEMENTS
The questionnaire is composed of 54 statements that must be ranked on a scale of 1 to 5, where 1
means ‘not at all’ and 5 stands for ‘to a very great extent’. The 54 statements are presented in this
section and grouped by ‘Factor’ and ‘Building Block’.
Table C.1: Questionnaire Questions for the Values and Behaviours Building Blocks
Block Factor Element Statement
Val
ues
Entrepreneurial
Hungry We have a burning desire to explore opportunities and to create new things.
Ambiguity We have a healthy appetite and tolerance for ambiguity when pursuing new opportunities.
Action-oriented
We avoid analysis paralysis when we identify new opportunities by exhibiting a bias towards action.
Creativity
Imagination We encourage new ways of thinking and solutions from diverse perspectives.
Autonomy Our workplace provides us the freedom to pursue new opportunities.
Playful We take delight in being spontaneous and are not afraid to laugh at ourselves.
Learning
Curiosity We are good at asking questions in the pursuit of the unknown.
Experiment We are constantly experimenting in our innovation efforts.
Failure OK We are not afraid to fail, and we treat failure as a learning opportunity.
Beh
avio
rs
Energize
Inspire Our leaders inspire us with a vision for the future and articulation of opportunities for the organization.
Challenge Our leaders frequently challenge us to think and act entrepreneurially.
Model Our leaders model the right innovation behaviors for others to follow.
Engage
Coach Our leaders devote time to coach and provide feedback in our innovation efforts.
Initiative In our organization, people at all levels proactively take initiative to innovate.
Support Our leaders provide support to project team members during both successes and failures.
Enable
Influence Our leaders use appropriate influence strategies to help us navigate around organizational obstacles.
Adapt Our leaders are able to modify and change course of action when needed.
Grit Our leaders persist in following opportunities even in the face of adversity.

119
Table C.2: Questionnaire Questions for the Climate and Resources Building Blocks
Block Factor Element Statement
Clim
ate
Collaboration
Community We have a community that speaks a common language about innovation.
Diversity We appreciate, respect and leverage the differences that exist within our community.
Teamwork We work well together in teams to capture opportunities.
Safety
Trust We are consistent in actually doing the things that we say we value.
Integrity We question decisions and actions that are inconsistent with our values.
Openness We are able to freely voice our opinions, even about unconventional or controversial ideas.
Simplicity
No bureaucracy We minimize rules, policies, bureaucracy and rigidity to simplify our workplace.
Accountability People take responsibility for their own actions and avoid blaming others.
Decision-making
Our people know exactly how to get started and move initiatives through the organization.
Res
ourc
es
People
Champions We have committed leaders who are willing to be champions of innovation.
Experts We have access to innovation experts who can support our projects.
Talent We have the internal talent to succeed in our innovation projects.
Systems
Selection We have the right recruiting and hiring systems in place to support a culture of innovation.
Communication We have good collaboration tools to support our innovation efforts.
Ecosystem We are good at leveraging our relationships with suppliers and vendors to pursue innovation.
Projects
Time We give people dedicated time to pursue new opportunities.
Money We have dedicated finances to pursue new opportunities.
Space We have dedicated physical and/or virtual space to pursue new opportunities.

120
Table C.3: Questionnaire Questions for the Processes and Success Building Blocks
Block Factor Element Statement
Proc
esse
s
Ideate
Generate We systematically generate ideas from a vast and diverse set of sources.
Filter We methodically filter and refine ideas to identify the most promising opportunities.
Prioritize We select opportunities based on a clearly articulated risk portfolio.
Shape
Prototype We move promising opportunities quickly into prototyping.
Iterate We have effective feedback loops between our organization and the voice of the customer.
Fail smart We quickly stop projects based on predefined failure criteria.
Capture
Flexibility Our processes are tailored to be flexible and context-based rather than control- and bureaucracy-based.
Launch We quickly go to market with the most promising opportunities.
Scale We rapidly allocate resources to scale initiatives that show market promise.
Succ
ess
External
Customers Our customers think of us as an innovative organization.
Competitors Our innovation performance is much better than other firms in our industry.
Financial Our innovation efforts have led us to better financial performance than others in our industry.
Enterprise
Purpose We treat innovation as a long-term strategy rather than a short-term fix.
Discipline We have a deliberate, comprehensive and disciplined approach to innovation.
Capabilities Our innovation projects have helped our organization develop new capabilities that we did not have three years ago.
Individual
Satisfaction I am satisfied with my level of participation in our innovation initiatives.
Growth We deliberately stretch and build our people’s competencies by their participation in new initiatives.
Reward We reward people for participating in potentially risky opportunities, irrespective of the outcome.

121
APPENDIX D – COMPLETE IQ QUESTIONNAIRE RESULTS
All the detailed IQ questionnaire scores are presented in this Appendix. The overall score is 2.5
and it corresponds to the average of the six building block scores.
Table D.1: Questionnaire Scores for the Values, Behaviours and Climate Building Blocks
Element Element Score Factor Factor Score
Building Block
Building Block Score
Hungry 3.1 Entrepreneurial 2.8
Values 2.7
Ambiguity 2.7 Action-oriented 2.5 Imagination 2.7
Creativity 2.6 Autonomy 2.6 Playful 2.5 Curiosity 3.2
Learning 2.8 Experiment 3.0 Failure OK 2.3 Inspire 3.1
Energize 2.9
Behaviours 2.6
Challenge 3.0 Model 2.5 Coach 2.0
Engage 2.2 Initiative 1.9 Support 2.6 Influence 2.6
Enable 2.9 Adapt 3.0 Grit 3.0 Community 2.0
Collaboration 2.4
Climate 2.5
Diversity 2.9 Teamwork 2.4 Trust 2.5
Safety 2.9 Integrity 3.0 Openness 3.3 No bureaucracy 2.3
Simplicity 2.2 Accountability 2.3 Decision-making 1.9

122
Table D.2: Questionnaire Scores for the Resources, Processes and Success Building Blocks
Element Element Score Factor Factor Score
Building Block
Building Block Score
Champions 2.9 People 3.1
Resources 2.6
Experts 2.9 Talent 3.4 Selection 2.3
Systems 2.3 Communication 2.3 Ecosystem 2.4 Time 2.2
Projects 2.5 Money 2.7 Space 2.6 Generate 2.4
Ideate 2.3
Processes 2.1
Filter 2.3 Prioritize 2.3 Prototype 2.1
Shape 1.9 Iterate 1.7 Fail smart 2.0 Flexibility 2.2
Capture 2.0 Launch 2.0 Scale 2.0 Customers 2.7
External 2.6
Success 2.6
Competitors 2.6 Financial 2.5 Purpose 2.7
Enterprise 2.8 Discipline 2.7 Capabilities 3.0 Satisfaction 2.5
Individual 2.3 Growth 2.6 Reward 1.9

123
APPENDIX E – IQ SCORES DISTRIBUTION GRAPHS
The score distributions for each of the 54 IQ questionnaire elements, as well as the 18 factors are
presented in this Appendix. Each graph illustrates the distribution of a factor with its three
elements. The graphs are grouped by building block.
Score Distributions for the Values Building Block
Figure E.1: Score Distributions for the Entrepreneurial Factor
Figure E.2: Score Distributions for the Creativity Factor
0
2
4
6
8
10
12
14
16
1 2 3 4 5
# of
Occ
urre
nces
Score
Entrepreneurial
Hungry
Ambiguity
Action-oriented
Entrepreneurial
0
2
4
6
8
10
12
14
1 2 3 4 5
# of
Occ
urre
nces
Score
Creativity
Imagination
Autononmy
Playful
Creativity

124
Figure E.3: Score Distributions for the Learning Factor
Score Distributions for the Behaviours Building Block
Figure E.4: Score Distributions for the Energize Factor
0
2
4
6
8
10
12
14
16
1 2 3 4 5
# of
Occ
urre
nces
Score
Learning
Curiosity
Experiment
Failure OK
Learning
0
2
4
6
8
10
12
14
16
1 2 3 4 5
# of
Occ
urre
nces
Score
Energize
Inspire
Challenge
Model
Energize

125
Figure E.5: Score Distributions for the Engage Factor
Figure E.6: Score Distributions for the Enable Factor
0
2
4
6
8
10
12
14
16
18
1 2 3 4 5
# of
Occ
urre
nces
Score
Engage
Coach
Initiative
Support
Engage
0
2
4
6
8
10
12
14
1 2 3 4 5
# of
Occ
urre
nces
Score
Enable
Influence
Adapt
Grit
Enable
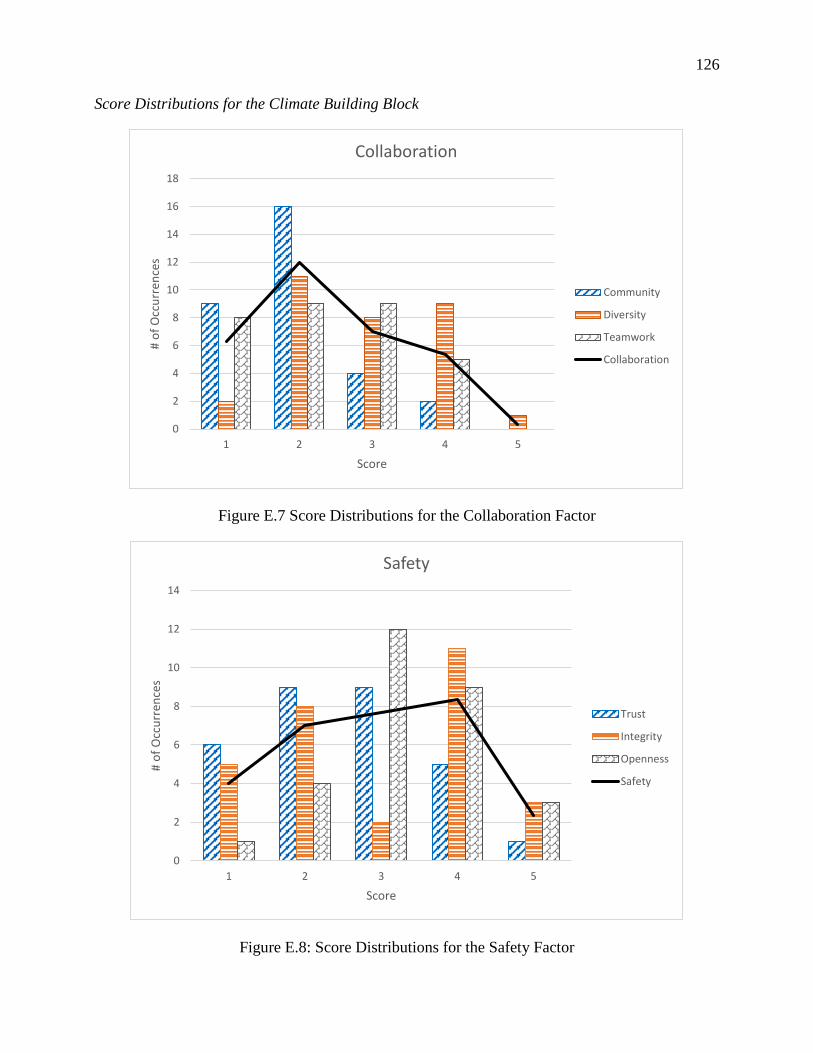
126
Score Distributions for the Climate Building Block
Figure E.7 Score Distributions for the Collaboration Factor
Figure E.8: Score Distributions for the Safety Factor
0
2
4
6
8
10
12
14
16
18
1 2 3 4 5
# of
Occ
urre
nces
Score
Collaboration
Community
Diversity
Teamwork
Collaboration
0
2
4
6
8
10
12
14
1 2 3 4 5
# of
Occ
urre
nces
Score
Safety
Trust
Integrity
Openness
Safety

127
Figure E.9: Score Distributions for the Simplicity Factor
Score Distributions for the Resources Building Block
Figure E.10: Score Distributions for the People Factor
0
2
4
6
8
10
12
14
1 2 3 4 5
# of
Occ
urre
nces
Score
Simplicity
No bureaucracy
Accountability
Decision-making
Simplicity
0
2
4
6
8
10
12
14
16
18
1 2 3 4 5
# of
Occ
urre
nces
Score
People
Champions
Experts
Talent
People
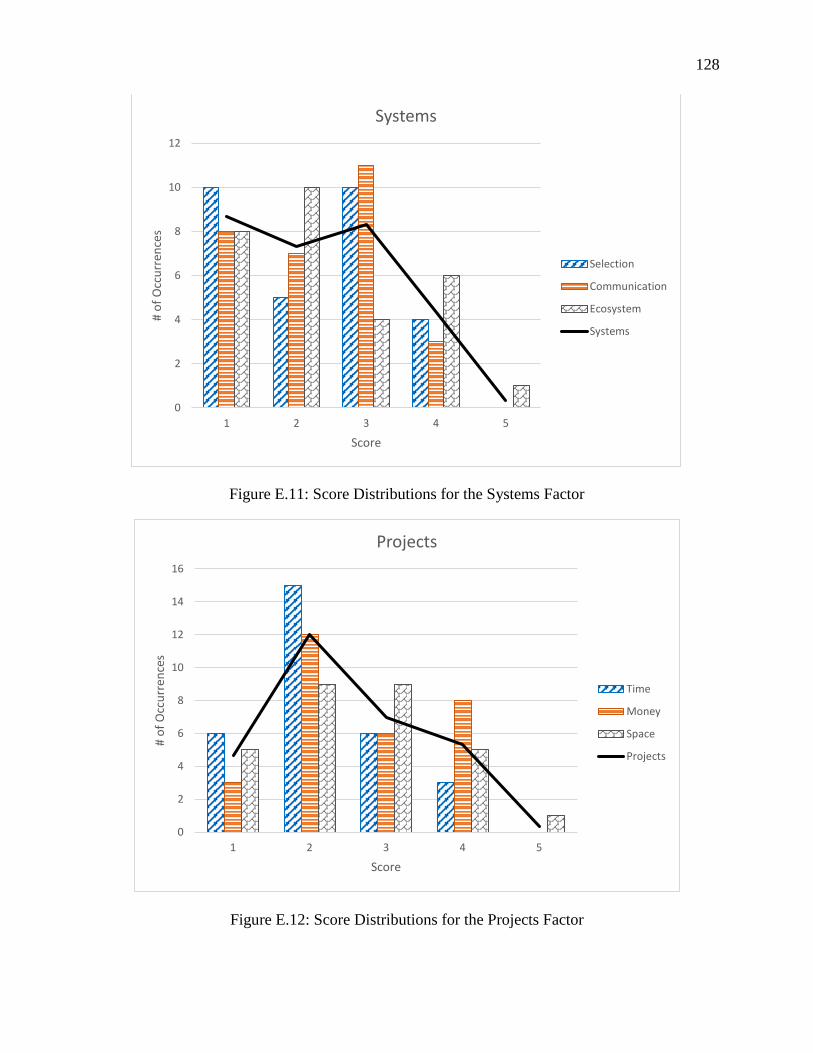
128
Figure E.11: Score Distributions for the Systems Factor
Figure E.12: Score Distributions for the Projects Factor
0
2
4
6
8
10
12
1 2 3 4 5
# of
Occ
urre
nces
Score
Systems
Selection
Communication
Ecosystem
Systems
0
2
4
6
8
10
12
14
16
1 2 3 4 5
# of
Occ
urre
nces
Score
Projects
Time
Money
Space
Projects

129
Score Distributions for the Processes Building Block
Figure E.13: Score Distributions for the Ideate Factor
Figure E.14: Score Distributions for the Shape Factor
0
2
4
6
8
10
12
14
1 2 3 4 5
# of
Occ
urre
nces
Score
Ideate
Generate
Filter
Prioritize
Ideate
0
2
4
6
8
10
12
14
16
18
1 2 3 4 5
# of
Occ
urre
nces
Score
Shape
Prototype
Iterate
Fail smart
Shape

130
Figure E.15: Score Distributions for the Capture Factor
Score Distributions for the Success Building Block
Figure E.16: Score Distributions for the External Factor
0
2
4
6
8
10
12
1 2 3 4 5
# of
Occ
urre
nces
Score
Capture
Flexibility
Launch
Scale
Capture
0
2
4
6
8
10
12
14
16
1 2 3 4 5
# of
Occ
urre
nces
Score
External
Customers
Competitors
Financial
External

131
Figure E.17: Score Distributions for the Enterprise Factor
Figure E.18: Score Distributions for the Individual Factor
0
2
4
6
8
10
12
14
1 2 3 4 5
# of
Occ
urre
nces
Score
Enterprise
Purpose
Discipline
Capabilities
Enterprise
0
2
4
6
8
10
12
14
1 2 3 4 5
# of
Occ
urre
nces
Score
Individual
Satisfaction
Growth
Reward
Individual

132
APPENDIX F – PERCENTAGE OF RESPONDENTS BY DEPARTMENT
The detailed breakdown of the respondents per department is presented in this Appendix.
Figure F.1: Percentage of Respondents by Department
45%
10%3%
10%
7%
7%
3%
3%
6%
6%
Engineering Marketing & Product StrategyVPM SalesIT Strategic PlanningContinuous Improvement OperationsCustomer Service & Distribution Manufacturing Operations

133
APPENDIX G – APPLICATION OF RESEARCH PROPOSITIONS IN
CONCEPTUAL FRAMEWORK
The application of Proposition 2 in the proposed conceptual framework is presented in Figure G.1.
The application of Propositions 3 and 4 in the conceptual framework is presented in Figure G.2.
Figure G.1: Application of Proposition 2 in Conceptual Framework
Figure G.2: Application of Propositions 3 and 4 in Conceptual Framework
Proposition 2
Proposition 3 Proposition 4