universiti putra malaysia predicting sulphur dioxide
TRANSCRIPT
UNIVERSITI PUTRA MALAYSIA
PREDICTING SULPHUR DIOXIDE DISPERSION ISOPLETHS FROM MULTIPLE INDUSTRIAL SOURCES IN SEBERANG PERAI USING
THE STEADY STATE GAUSSIAN PLUME MODEL
NURUL SULIANA BINTI AHMAD HAZMI
FPAS 2006 3
PREDICTING SULPHUR DIOXIDE DISPERSION ISOPLETHS FROM
MULTIPLE INDUSTRIAL SOURCES IN SEBERANG PERAI USING
THE STEADY STATE GAUSSIAN PLUME MODEL
By
NURUL SULIANA BINTI AHMAD HAZMI
Thesis Submitted to the School of Graduate Studies, Universiti Putra Malaysia,
in Fulfilment of the Requirement for the Degree of Master of Science
November 2006

ii
To Mom and Dad, thanks for hanging in there through everything. I will never get this far
without your support. To my brother and sister, thanks for always understanding and
never-ending love.
And especially to all my friends, your help and encouragement have been so valuable to
me. Hope the future holds something wonderful for all of you.
iii
Abstract of thesis presented to the Senate of Universiti Putra Malaysia in fulfilment
of the requirement for the degree of Master of Science
PREDICTING SULPHUR DIOXIDE DISPERSION ISOPLETHS FROM
MULTIPLE INDUSTRIAL SOURCES IN SEBERANG PERAI USING THE
STEADY STATE GAUSSIAN PLUME MODEL
By
NURUL SULIANA AHMAD HAZMI
November 2006
Chairman : Associate Professor Ahmad Makmom Hj. Abdullah, PhD
Faculty : Environmental Studies
Air quality modeling is an essential tool for most air pollution studies and the
introduction of SO2 standards creates a need for modeling the dispersion of SO2. This
work deals specifically with the use of the Steady State Gaussian Plume Model at
Seberang Perai Industrial Area, Penang. The study utilized air quality data which span
over a period of 5years (1999-2003). The first objective of this study was to simulate SO2
dispersion isopleths from multiple industrial sources at Seberang Perai Industrial Area
which contributed to at least 70-75% of the total air pollution load in Penang. The second
objective was to evaluate the Steady State Gaussian Plume Model by comparing the
calculated and measured concentrations. The results showed that both simulated and
measured concentrations are within a factor of 2, judged to be validated when the
calculated and measured values do not differ in the annual averages by more than
approximately 30% and the hourly concentration with 95% of the accumulative
frequency distribution. Hence, Steady State Gaussian Plume Model employed by ISCST
iv
(design by the U.S EPA) is verified and is suitable for simulating air pollutants dispersion
from industrial activities in this country. The dispersion isopleths obtained in this study
confer the first dispersion isopleths in Seberang Perai and formed a basis study for future
scenarios that include the impacts of increasing energy consumption per capita, of
changing populations and of new industrial development, including their optimal siting.
v
Abstrak tesis yang dikemukakan kepada Senat Universiti Putra Malaysia sebagai
keperluan untuk ijazah Master Sains
RAMALAN PENYEBARAN ISOPLET SULFUR DIOKSIDA DARI BERBILANG
SUMBER INDUSTRI DI SEBERANG PERAI MENGGUNAKAN MODEL
KEADAAN MANTAP PLUM GAUSSIAN
Oleh
NURUL SULIANA AHMAD HAZMI
November 2006
Pengerusi : Profesor Madya Ahmad Makmom Hj. Abdullah, PhD
Fakulti : Pengajian Alam Sekitar
Pemodelan kualiti udara adalah merupakan satu kaedah bagi kebanyakan kajian
pencemaran udara dan kewujudan standard SO2 menjadi faktor utama keperluan kepada
pemodelan SO2. Kajian ini di jalankan di Kawasan Perindustrian Seberang Perai, Pulau
Pinang dengan menggunakan Model Keadaan Mantap Plum Gaussian bagi tempoh 5
tahun (1999-2003). Objektif pertama kajian adalah bagi menghasilkan penyebaran isoplet
SO2 dari pelbagai sumber industri di Kawasan Perindustrian Seberang Perai; yang
menyumbang kepada 70-75% jumlah keseluruhan pencemaran udara di Pulau Pinang.
Objektif kedua adalah bagi menilai Model Keadaan Mantap Plum Gaussian dengan
membezakan kepekatan data simulasi dengan data kajian lapangan. Hasil kajian
menunjukan perbezaan kedua-dua bacaan adalah di bawah faktor gandaan 2, yang mana
disahkan benar apabila kepekatan data simulasi dengan data kajian lapangan tidak
berbeza purata tahunannya dengan anggaran 30% dan kepekatan bacaan setiap jam
vi
adalah 95% dari taburan frekuensi akumulatif. Oleh itu, Model Keadaan Mantap Plum
Gaussian yang digunapakai dalam ISCST (direkabentuk oleh USEPA) juga adalah sesuai
digunakan di negara ini bagi tujuan simulasi sebaran reruang bahan pencemar dari
kawasan industri disamping dapat menjimatkan masa, menjangkakan kejadian yang tidak
diingini serta dapat mengurangkan kos perlaksanaan operasi. Hasil kajian ini adalah yang
pertama seumpamanya dalam penghasilan simulasi sebaran reruang bahan pencemar di
Seberang Perai dan akan menjadi asas utama bagi kajian selanjutnya.
vii
ACKNOWLEDGEMENTS
Financial support for this research was provided by the Ministry of Science, Technology
and Innovation (grant 08-02-04-0613 EA001) and National Science Fellowship (NSF)
award.
The author is indebted to Assoc. Prof. Dr. Ahmad Makmom Hj. Abdullah, Dr. Marzuki
Hj. Ismail, Assoc. Prof. Dr. Azizi Muda and Assoc. Prof. Dr. Wan Nor Azmin Sulaiman
for their encouragement and valuable comments in carrying out this research. They
greatly contributed to the improvement of this work.
The author acknowledges assistance from the Malaysian Meteorological Department,
which provided the meteorological data and Municipal Council of Seberang Perai and
also Department of Agricultural for providing land use and land cover map. Special
thanks are also due to Ir. Dr. Shamsudin Ab. Latif from the Department of Environment
for providing the access on the source information and ambient air pollution data in the
area.
Sincere thanks also go to Mr. Marzuki Mokahtar and Mr. Zulfatah Yaacob, who helped
to prepare many data tables and figures. The author wishes to convey her thanks to her
adored family for their support and to the reviewers for suggesting improvements to this
research. Their valuable comments are greatly appreciated.
viii
I certify that an Examination Committee met on the 27th November 2006 to conduct the
final examination of Nurul Suliana Binti Ahmad Hazmi on her Master of Science thesis
entitled “Predicting Sulphur Dioxide Dispersion Isopleths From Multiple Industrial
Sources in Seberang Perai Using the Steady State Gaussian Plume Model” in accordance
with Universiti Pertanian Malaysia (Higher Degree) Act 1980 and Universiti Pertanian
Malaysia (Higher Degree) Act 1981. The Committee recommends that the candidate be
awarded the relevant degree. Members of the Examination Committee are as follows:
Puziah Abdul Latif, PhD
Lecturer
Faculty of Environmental Studies
Universiti Putra Malaysia
(Chairman)
Muhammad Firuz Ramli, PhD
Lecturer
Faculty of Environmental Studies
Universiti Putra Malaysia
(Internal Examiner)
Helmi Zulhaidi Mohd. Shafri, PhD
Lecturer
Faculty of Engineering
Universiti Putra Malaysia
(Internal Examiner)
Nik Meriam Nik Sulaiman, PhD
Professor
Faculty of Engineering
Universiti Malaya
(External Examiner)
____________________________________
HASANAH MOHD. GHAZALI, PhD
Professor/Deputy Dean
School of Graduate Studies
Universiti Putra Malaysia
Date: 22 MARCH 2007
ix
Saya mengesahkan bahawa Jawatankuasa Peperiksaan Tesis bagi Nurul Suliana Binti
Ahmad Hazmi telah mengadakan peperiksaan akhir pada 27 November 2006 untuk
menilai tesis Master beliau yang bertajuk “Ramalan Penyebaran Isoplet Sulfur Dioksida
Dari Berbilang Sumber Industri Di Seberang Perai Menggunakan Model Keadaan
Mantap Plum Gaussian” mengikut Akta Universiti Pertanian Malaysia (Ijazah Lanjutan)
1980 dan Peraturan-peraturan Universiti Pertanian Malaysia (Ijazah Lanjutan) 1981.
Jawatankuasa Peperiksaan Tesis memperakukan bahawa calon ini layak dianugerahi
ijazah tersebut. Ahli Jawatankuasa Peperiksaan Tesis adalah seperti berikut:
Puziah Abdul Latif, PhD
Pensyarah
Fakulti Pengajian Alam Sekitar
Universiti Putra Malaysia
(Pengerusi)
Muhammad Firuz Ramli, PhD
Pensyarah
Fakulti Pengajian Alam Sekitar
Universiti Putra Malaysia
(Pemeriksa Dalam)
Helmi Zulhaidi Mohd. Shafri, PhD
Pensyarah
Fakulti Kejuruteraan
Universiti Putra Malaysia
(Pemeriksa Dalam)
Nik Meriam Nik Sulaiman, PhD
Profesor
Fakulti Kejuruteraan
Universiti Malaya
(Pemeriksa Luar)
HASANAH MOHD. GHAZALI, PhD Profesor/Timbalan Dekan
Sekolah Pengajian Siswazah
Universiti Putra Malaysia
Tarikh: 22 MAC 2007
x
This thesis submitted to the Senate of Universiti Putra Malaysia and has been accepted as
fulfillment of the requirement for the degree of Master of Science. The members of the
Supervisory Committee are as follows:
Ahmad Makmom Abdullah, PhD
Associate Professor
Faculty of Environmental Studies
Universiti Putra Malaysia
(Chairman)
Azizi Muda, PhD
Associate Professor
Faculty of Environmental Studies
Universiti Putra Malaysia
(Member)
Wan Nor Azmin Sulaiman, PhD
Associate Professor
Faculty of Environmental Studies
Universiti Putra Malaysia
(Member)
________________________
AINI IDERIS, PhD
Professor/Dean
School of Graduate Studies
Universiti Putra Malaysia
Date:

xi
DECLARATION
I hereby declare that the thesis is based on my original work except for quotation and
citations which have been duly acknowledged. I also declare that it has not been
previously or concurrently submitted for any other degree at UPM or other institutions.
_________________________________
NURUL SULIANA AHMAD HAZMI
Date: 22 FEBRUARY 2007
xii
TABLE OF CONTENTS
Page
DEDICATION ii
ABSTRACT iii
ABSTRAK v
ACKNOWLEDGEMENTS vii
APPROVAL viii
DECLARATION xi
LIST OF TABLES xiv
LIST OF FIGURES xv
LIST OF ABBREVIATIONS xviii
CHAPTER
1 INTRODUCTION 1
1.1 The need for air pollution modeling 3
1.2 Problem statement 5
1.3 Scope and limitation of the study 8
1.4 Objectives of the study 8
1.5 Hypotheses 10
1.6 Assumptions 11
1.7 Significance of the study 11
1.8 Structure of the thesis 12
2 LITERATURE REVIEW 13
2.1 Air quality monitoring and management in Malaysia 13
2.2 Ambient air quality monitoring 14
2.3 Air emission sources 15
2.3.1 Mobile source emissions 16
2.3.2 Stationary source emissions 16
2.3.3 Open burning source emissions 17
2.4 Air Pollutant Index (API) in Malaysia 17
2.4.1 An overview of air quality status of Seberang 19
Perai, Penang (1996-2005)
2.5 Effects of air pollution on health 20
2.6 Sulfur dioxide 24
2.6.1 General description of sulfur dioxide 24
2.6.2 Sources of sulfur dioxide 25
2.6.3 Health and environmental effects of sulfur 26
dioxide
2.6.3.1 Route exposure to human health 26
2.6.3.2 Guideline of sulfur dioxide 27
2.6.3.4 Environmental impacts of sulfur 30
dioxide in Malaysia
xiii
2.7 Air pollution meteorology 31
2.7.1 Effect of wind regimes on dispersion 33
2.7.2 Turbulence 39
2.7.3 Temperature inversion 40
2.7.4 Lapse rate 41
2.7.5 Stability class 43
2.7.6 Plume type 45
2.7.7 Maximum mixing depth 48
2.8 Air dispersion modeling 51
2.8.1 Introduction 51
2.8.2 The Steady State Gaussian Plume Model 53
2.8.3 The Industrial Source Complex-Short Term 60
(ISCST)
3 MATERIALS AND METHOD 63
3.1 Site description 63
3.3.1 Population 63
3.2 Research parameterization 68
3.2.1 Meteorological data 68
3.2.2 Input runstream data 72
3.2.2.1 Source location and parameter data 72
3.2.2.2 Receptor location 73
3.2.2.3 Output option 73
3.2.3 Simulation of the model 74
3.3 Ground level concentration monitoring 74
3.4 Statistical analysis 82
4 RESULTS AND DISCUSSIONS 83
4.1 Climate conditions in Penang 83
4.1.1 Rainfall 83
4.1.2 Temperature 85
4.1.3 Wind 86
4.2 Model performance evaluation during the ground level 93
concentration (GLC)
4.3 Spatial distribution of SO2 concentrations 95
4.4 Sensitivity analysis 124
5 CONCLUSIONS AND RECOMMENDATIONS 126
REFERENCES 130
APPENDICES 142
BIODATA OF THE AUTHOR 154
LIST OF PUBLICATIONS 156
xiv
LIST OF TABLES
Table Page
1 The existing land use in Seberang Perai, Penang, 1995 and 2005 7
2 Sulfur dioxide emission load from stationary sources 15
3 Recommended Malaysian Air Quality Guidelines (Ambient Standards) 18
4 Air Pollutant Index 19
5 Information on Criteria Pollutants 21
6 Exposure level of sulfur dioxide and health effects 28
7 Beaufort scale of wind speed equivalents 36
8 Municipal council which covers 3 administrative districts and places of 65
Penang
9 Population size and composition for Penang Municipal Council, 2000 67
10 Observed concentration and the meteorological condition during the 75
Experiment
11 Specification of basic meteorological condition of TG-501 80
12 Monthly Rainfall for Bayan Lepas Station (1999-2003) 84
13 Average Wind Speed at Bayan Lepas Upper Air Station, 1999-2003 88
14 Frequency of calm for Bayan Lepas Upper Air Station, 1999-2003 89
15 The comparison of field measurement and predicted by Steady State 94
Gaussian Plume Model
16 The downwind distance concentration for SO2 under worst case scenario 123
xv
LIST OF FIGURES
Figure Page
1 SO2 concentration (ppm) at Seberang Perai Station from year 1996 5
until 2005
2 Land Use and Land Cover map of Seberang Perai, Penang 9
3 Air quality status at Seberang Perai from year 1996-2000 19
4 Wind speed and wind direction recorded at Bayan Lepas, 2003 34
5 Average vertical wind speed profiles over surfaces of varying roughness 37
6 Under condition of light regional winds and clear skies, the heating in the 38
city causes the air to rise. Descent take place in the surrounding
countryside
7 During light winds, hot gases in a plume can create a circulation which 39
can cause pollution to loop down to ground level some distance from
the source
8 Stability of an air parcel, determined by the environmental lapse rate 43
9 Six type of plume behavior under various condition of stability 47
10 Establishment of the maximum mixing depth (MMD) under various 49
atmospheric conditions
11 Determination of afternoon mixing height from morning upper-air 49
sounding and afternoon surface temperature
12 Gaussion plume from an elevated sources, effective stach height (H) is 58
equal to the geometric stack height (hs) plus the plume rise, hδ
13 Horizontal dispersion, σy vs. downwind distance from source for 57
Pasquill’s turbulence type
14 Vertical dispersion, σz vs. downwind distance from source for 57
Pasquill’s turbulence type
16 Location of the study area 64
17 Close up of the study area 66
xvi
18 Key Summary Statistic for Penang Municipal Council, 2000 67
19 Research approach used in the study 69
20 On site measurement of SO2 ground level concentration 78
21 Garmin eTrex Venture GPS System 79
22 Electrochemical gas sensor; TG-501 81
23 Annual total rainfall for Bayan Lepas from 1999-2003 85
24 Yearly mean temperature for Bayan Lepas from 1999-2003 83
25 Monthly mean temperature for Bayan Lepas from 1999-2003 86
26 Annual wind rose pattern for Bayan Lepas from 1999-2003 90
27 Northeast monsoon wind rose pattern for Bayan Lepas from 1999-2003 91
28 Southeast monsoon wind rose pattern for Bayan Lepas from 1999-2003 92
29 Comparison of mean, x measured concentration at GLC with those 94
predicted by Steady State Gaussian Plume Model
30 Isopleth of 1-hr simulation for SO2 from Seberang Perai Industrial Area 96
for different monsoons during 1999
31 Isopleth of 1-hr simulation for SO2 from Seberang Perai Industrial Area 98
for different monsoons during 2000
32 Isopleth of 1-hr simulation for SO2 from Seberang Perai Industrial Area 100
for different monsoons during 2001
33 Isopleth of 1-hr simulation for SO2 from Seberang Perai Industrial Area 102
for different monsoons during 2002
34 Isopleth of 1-hr simulation for SO2 from Seberang Perai Industrial Area 104
for different monsoons during 2003
35 Plot of fitted model Scenario 1 for 1-hr SO2 concentration versus year 107
36 Plot of fitted model Scenario 2 for 1-hr SO2 concentration versus year 107
37 Isopleth of 24-hr simulation for SO2 from Seberang Perai Industrial Area 109
for different monsoons during 1999
xvii
38 Isopleth of 24-hr simulation for SO2 from Seberang Perai Industrial Area 111
for different monsoons during 2000
39 Isopleth of 24-hr simulation for SO2 from Seberang Perai Industrial Area 113
for different monsoons during 2001
40 Isopleth of 24-hr simulation for SO2 from Seberang Perai Industrial Area 115
for different monsoons during 2002
41 Isopleth of 24-hr simulation for SO2 from Seberang Perai Industrial Area 117
for different monsoons during 2003
42 Plot of fitted model Scenario 1 for 24-hr SO2 concentration versus year 119
43 Plot of fitted model Scenario 2 for 24-hr SO2 concentration versus year 119
44 Near field receptor of SO2 ground level concentration 122
45 The surface plot of the concentration profile at 370m downwind 122
distance
46 The surface plot of the concentration profile on worst case scenario 123
47 Maximum variation in predicted concentration 125

xviii
LIST OF ABBREVIATIONS
Air Pollutant Index API
Air Quality Monitoring Stations AQMS
Alam Sekitar Malaysia ASMA
Analysis of Variance ANOVA
Business as Usual BAU
Carbon monoxide CO
Department of Environment DOE
Environmental Protection Agency EPA
Environmental Quality Act EQA
Geographical Information System GIS
Health Risk Assessment HRA
Industrial Source Complex Short Term ISCST
Institut Latihan Prai ILP
Jabatan Ukur dan Pemetaan Malaysia JUPEM
Kuala Lumpur International Airport KLIA
Lead Pb
Malaysia Air Quality Index MAQI
Malaysia Meteorological Station MMS
Nitrogen dioxide NO2
Non Government Organization NGO
Ozone O3
xix
Particulate matter PM
Pollutant Standard Index PSI
Recommended Malaysia Air Quality Guideline RMAQG
Sulfur dioxide SO2
Suspended Particulate Matter SPM
Total Suspended Particulate TSP
United States of America USA
United States Environmental Protection Agency USEPA
Volatile organic compound VOC
World Health Organization WHO
CHAPTER 1
INTRODUCTION
Increasing air pollution levels due to rapid urbanization and growth in industrial
emissions are now causes of major concern in many large cities of the world (Marsh and
Foster, 1967; Martin and Barber, 1980; Katarina, 1993; Yadav and Kaushik, 1995;
Jinliang et al., 2000; Ung et al., 2001; Desqueyroux et al., 2002; Manju et al., 2002;
Bingheng et al., 2004; Graham, 2004; Yue et al., 2005; Panday et al., 2002, 2004, 2005;
Filleul, 2005; Bhanarkar et al., 2005). When strategies to protect public health are under
consideration, establishing ambient air quality standards and regulations have been
introduced in order to set limits on the emissions of pollutants (United State
Environmental Protection Agency, 1999). To achieve these limits, consideration was
given to mathematical and computer modeling of air pollution. Therefore, air quality
models are indispensable tools for assessing the impact of air pollutants on human health
and the urban environment (Gokhale and Khare, 2004). The necessity for such models
has increased tremendously especially with the rising interest in the early warning
systems in order to have the opportunity to take emergent and preventive actions to
reduce pollutants when conditions that encourage high concentrations are predicted
(Perez, 2001). On the other hand, long-term forecasting and controlling of air pollution
are also needed in order to prevent the situation from becoming worse in the long run.
Such forecasting is especially important to sensitive group’s i.e. children, asthmatics,
pregnant women and elderly people (Tiitanen et al., 1999; Kolehmainen et al., 2001). The
trend in recent years has been to use more statistical models instead of traditional
2
deterministic models (Kolehmainen et al., 2001). The statistical models are based on
semi-empirical relations among available data and measurements (Gokhale and Khare,
2004). They depend on the statistical analysis of previous air quality data and do not
necessarily reveal any relation between cause and effect. They attempt to determine the
underlying relationship between sets of input data and targets. They have been used to
establish an empirical relationship between air pollutant concentrations and
meteorological parameters (Gokhale and Khare, 2004). They are quite useful in real time
short-term forecasting. Examples of statistical models are regression analysis (Abdul-
Wahab et al., 1996, 2003, 2005) time-series analysis (Hsu, 1992) and artificial neural
networks (Gardner and Dorling, 1998; Abdul-Wahab, 2001; Elkamel et al., 2001; Abdul-
Wahab and Al-Alawi, 2002; Nunnari et al., 2004). The generation of sulphur dioxide
(SO2) from a heavily industrialized area with several petrochemical complexes may
affect the surrounding environment. SO2 is formed primarily from the combustion of
sulphur-containing fuels and can affect the health of the people. The introduction of SO2
standards created a need for method of modeling the dispersion of SO2 to assist in
identifying areas at risk of exceeding the standards, identifying measures that could be
taken to meet the standards, and predicting the economic impact of control measures
(World Health Organization, 1999; 2000).
A model widely used for estimating atmospheric concentrations of a chemical, downwind
from a source, is the Steady State Gaussian Plume Model. There are numerous research
works that involve in estimating pollutant concentrations downwind from a multiple
source utilizing the Steady State Gaussian Plume Model at different study areas
3
(Zannetti, 1983; Al-Sudairawi et al., 1988; Ramesh and Naperkoski, 1984; Dhari and
Yehia, 1996; Abdul-Wahab, 2002; Morgan, 2003; Sivacoumar, 2001; Joshua et al.,
2005).
In this paper, SO2 dispersion isopleths were develop for predicting maximum SO2 levels
emitted from Seberang Perai Industrial Area, Penang. The aim was to determine the
accuracy of Steady State Gaussian Plume Model by verifying the predicted concentration
values with onsite measurements for SO2 within a factor of 2. The effects of variations
for meteorological parameters and physical parameters in the model that are expected to
affect the SO2 concentrations were investigated. They were wind speed, atmospheric
stability class, wind direction, mixing height, ambient temperature, stack exit velocity,
stack exit temperature and emission rate.
1.1 The need for air dispersion modeling
In establishing ambient air quality standards, regulations have been introduced in order to
set limits on the emissions of pollutants (United State Environmental Protection Agency,
1999). To achieve these limits, consideration was given to mathematical and computer
modeling of air pollution. Therefore, air quality models are indispensable tools for
assessing the impact of air pollutants on human health and the urban environment
(Gokhale and Khare, 2004). The necessity for such models has increased tremendously
especially with the rising interest in the early warning systems in order to have the
opportunity to take emergent and preventive actions to reduce pollutants when conditions
that encourage high concentrations are predicted (Perez, 2001).
4
Air dispersion model is used to estimate the pollution concentrations attributable to a
source or group of sources (World Health Organization, 2004; Minnesota Health State,
2004; United State Environmental Protection Agency, 2005). Air dispersion modeling
can simulate a point and multiple source; a two-dimensional source (fugitive dust from a
road that is wide and long); or a three-dimensional source (fugitive dust from a large coal
pile that is wide, long and tall).
It is a way to mathematically simulate atmospheric conditions and behavior. It is usually
performed using computer programs. Using inputs such as meteorological data and
source emissions, air models can calculate pollutant concentrations in the air or the
amount of pollutants deposited (deposition) on the ground. There are many kinds of air
dispersion models, and an appropriate model is selected based on the type of analysis that
is needed. Results of model simulation can predict the impacts of new sources before
they are introduced and also allow an examination of the effects of different types of
pollution controls before any actual changes are made to the sources of pollution. In
addition, air dispersion modeling is sometimes used to locate air quality monitors in areas
where high pollutant concentrations are most likely to occur. Besides, air pollution
modeling can be used for stack design studies, combustion source permit applications,
regulatory variance evaluation, monitoring network design and prevention of significant
deterioration through planners and decision makers to estimate, for example; the
increased risk of health problems in people who are exposed to different amounts of air
pollutant. Hence, air dispersion modeling is necessary to provide timely provision for
assessing downwind concentrations.
5
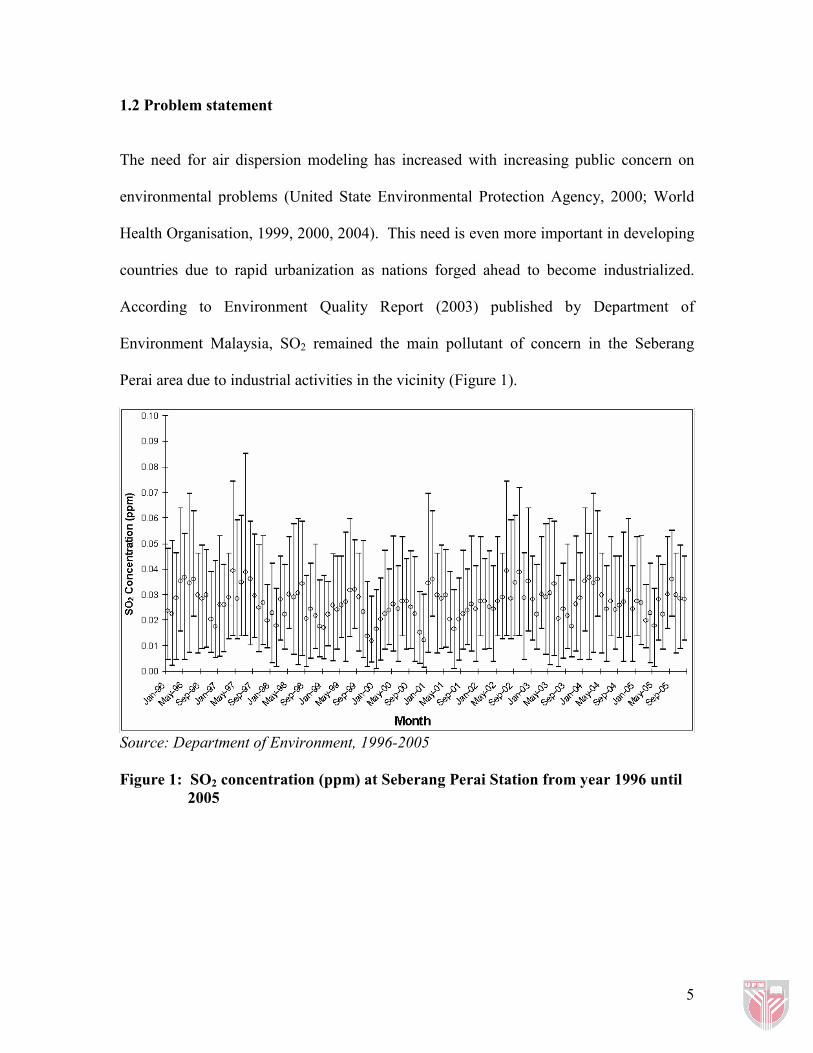
1.2 Problem statement
The need for air dispersion modeling has increased with increasing public concern on
environmental problems (United State Environmental Protection Agency, 2000; World
Health Organisation, 1999, 2000, 2004). This need is even more important in developing
countries due to rapid urbanization as nations forged ahead to become industrialized.
According to Environment Quality Report (2003) published by Department of
Environment Malaysia, SO2 remained the main pollutant of concern in the Seberang
Perai area due to industrial activities in the vicinity (Figure 1).
Source: Department of Environment, 1996-2005
Figure 1: SO2 concentration (ppm) at Seberang Perai Station from year 1996 until
2005