universiti putra malaysia productivity dynamics of ... · pengurusan bank dan pihak berkuasa...
TRANSCRIPT

UNIVERSITI PUTRA MALAYSIA
PRODUCTIVITY DYNAMICS OF MALAYSIAN BANKING INSTITUTIONS
KHONG WYE LEONG ROY
FEP 2006 9

PRODUCTIVITY DYNAMICS OF MALAYSIAN BANKING INSTITUTIONS
By
KHONG WYE LEONG ROY
Thesis Submitted to the School of Graduate Studies, Universiti Putra Malaysia, in Fulfilment of the Requirement for the Degree of Doctor of Philosophy
November 2006

To My Loving Family
11

Abstract of thesis presented to the Senate ofUniversiti Putra Malaysia in the fulfilment of the requirement for the degree of Doctor of Philosophy
PRODUCTIVITY DYNAMICS OF MALAYSIAN BANKING INSTITUTIONS
By
KHONG WYE LEONG ROY
November 2006
Chairman: Professor Muzafar Shah Habibullah, PhD
Faculty: Economics and Management
The productivity behaviors play important role in encouraging the profitability of
Malaysian banking institutions. Thus, it is important for bank management and
banking regulatory authorities to understand the factors that underlying the
productivity behaviors of the banking industry. Malmquist productivity index was
used to measure the productivity changes of Malaysian commercial banks, finance
companies and merchant banks over the period of 1991 to 2003 . The productivity
change was also decomposed into technological change and technical efficiency
change. In addition, the dynamic panel method based on Generalized Method of
Moments was also employed to identify the determinates of total factor productivity.
In general, commercial banks, finance companies and merchant banks experienced
average positive productivity growth of 2.33%, 1.75% and 3 .19% per annum
respectively. During the period under study, the growth in productivity for finance
companies and merchant banks were attributed to both technological progress and
111

technical efficiency increased. However, commercial banks productivity progress
was due solely to technological improvement. A fact worth noting is that all the
three types of banking institutions exhibited the dominance of technological
progress as the source of productivity growth.
In the second stage dynamic panel regression, the results for commercial banks and
finance companies were similar in most aspects. In particular, the age of the
institutions and the development of the capital market were positively related to the
commercial banks and finance companies productivity levels. On the other hand,
commercial banks and finance companies that have high specializations of outputs
tended to have lower productivity levels. Moreover, the productivity level will
increase at a decreasing rate, as the size of finance company increase.
Turning to the behaviors of merchant banks, 'the age of the merchant banks and the
two tier regulatory system were the only factors that have adverse effects on the
productivity level of merchant banks.
IV

Abstrak tesis yang dikemukakan kepada Senat Universiti Putra Malaysia sebagai memenuhi keperluan untuk ijazah Doktor Falsafah
KELAKUAN DINAMIK PRODUKTIVITI UNTUK INSTITUSI-INSTITUSI PERBANKAN DI MALAYSIA
Oleh
KHONG WYE LEONG ROY
November 2006
Pengerusi: Profesor Muzafar Shah Habibullah, PhD
Fakulti: Ekonomi dan Pengurusan
Kelakuan produktiviti memainkan peranan penting dalam menggalakkan
keuntungan intitusi-intitusi perbankan di Malaysia. Oleh itu, ia sangat penting untuk
pengurusan bank dan pihak berkuasa perbankan untuk memahami faktor-faktor di
sebalik kelakuan produktiviti industri perbankan. Indek produduktiviti Malmquist
telah digunakan untuk mengukur perubahan produktiviti bank-bank komersil,
syarikat-syarikat kewangan dan bank-bank saudagar yang meliputi tempoh 199 1
hingga 2003. Perubahan produtiviti juga dibahagikan kepada perubahan teknologi
dan perubahan teknikal efisien. Tambahan pula, kaedah dinamik panel berdasarkan
GMM juga digunakan untuk mengenalpasti penentuan faktor produtiviti
keseluruhan.
Secara umum, bank-bank komersil, syarikat-syarikat kewangan dan bank-bank
saudagar mengalami pertumbuhan produktiviti positif secara purata sebanyak
2.33%, 1 .75% dan 3 . 1 9% setahun masing-masing. Dalam tempoh kajian,
v
pertumbuhan produktiviti untuk syarikat-syarikat kewangan dan bank-bank saudagar
disebabkan oleh perkembangan teknologi dan peningkatan teknikal efisien. Namum,
perubahan produktiviti bank-bank komersil hanya disebabkan oleh perkembangan
teknologi. Satu fakta yang bemilai dicatatkan ialah ketiga-tiga j enis institusi-institusi
perbankan menunjukkan dominasi perkembangan teknologi sebagai sumber
pertumbuhan produktiviti .
Dalam dinamik panel regresi peringkat kedua, keputusan-keputusan untuk bank
bank komersil dan syarikat-syarikat kewangan adalah serupa dari banyak aspek.
Khasnya, umur institusi-institusi serta perkembagan dalam pasaran modal adalah
positif berhubung dengan tahap produktiviti bank-bank komersil dan syarikat
syarikat kewangan. Sebaliknya, bank-bank komersil dan syarikat-syarikat kewangan
yang mempunyai pengkususan output yang tinggi cenderung untuk mempunyai
tahap produktiviti yang rendah. Tambahan pula, tahap produktiviti akan meningkat
dengan kadar yang menurun sekiranya saiz syarikat-syarikat kewangan meningkat.
Beralih kepada kelakuan bank-bank saudagar, umur bank-bank saudagar dan system
pengawalan dua tingkat merupakan faktor-faktor yang mempunyai kesan buruk
keatas tahap produktiviti bank-bank saudagar.
Vl

ACKNOWLEDGEMENTS
Foremost, I would like to thank my family members for their moral and emotional
support during the course of my study. Deepest appreciation to my supervisors, in
particular, Professor Muzafar Shah Habibullah, Associate Professor Azali Mohamed
and Associate Professor Mariam Abdul Aziz for their guidance, assistance and
critical comments.
Many thanks to the viva chairperson and examiners held on 6th November 2006 for
their comments and suggestions. Appreciations are also extended to the
administrative staffs of Faculty of Economics and Management and Graduate
School Office. Lastly, my deepest gratitude to my friends and those who have help
me, directly or indirectly, in completing my study.
Vll
I certify that an Examination Committee has met on 6th November 2006 to conduct the final examination of Khong Wye Leong Roy on his Doctor of Philosophy thesis entitled "Productivity Dynamics of Malaysian Banking Institutions" in accordance with Universiti Pertanian Malaysia (Higher Degree) Act 1980 and Universiti Pertanian Malaysia (Higher Degree) Regulations 1981. The Committee recommends that the candidate be awarded the relevant degree. Members of the Examination Committee are as follows:
Tan Hui Boon, PhD Associate Professor Faculty of Economics and Management Universiti Putra Malaysia (Chairman)
Maisom Abdullah, PhD Professor Faculty of Economics and Management Universiti Putra Malaysia (Internal Examiner)
Law Siong Hook, PhD Senior Lecturer Faculty of Economics and Management Universiti Putra Malaysia (Internal Examiner)
Mohammed B. Yusoff, PhD Professor Kulliyyah Of Economics And Management Sciences International Islamic University Malaysia (External Examiner)
HAS D. GHAZALI, PhD orl Dean
Graduate Studies Universiti Putra Malaysia
Date: 15 FEBRUARY 2007
viii

This thesis submitted to the Senate of Universiti Putra Malaysia and has been accepted as fulfillment of the requirement for the degree of Doctor of Philosophy. The members of the Supervisory Committee are as follows:
Muzafar Shah Habibullah, PhD Professor Faculty of Economics and Management Universiti Putra Malaysia (Chairman)
Azali Mohamed, PhD Associate Professor Faculty of Economics and Management Universiti Putra Malaysia (Member)
Mariam Abdul Aziz, PhD Associate Professor Faculty of Economics and Management Universiti Putra Malaysia (Member)
IX
-e .p i-· # AINI IDERIS, PhD ProfessorlDean School of Graduate Studies Universiti Putra Malaysia
Date: 8 MARCH 2007

DECLARATION
I hereby declare that the thesis is based on my original work except for quotations and citations, which have been duly, acknowledged. I also declare that it has not been previously or concurrently submitted for any other degree at UPM or other institutions.
/¥. KHONG WYE LEONG ROY
Date: 8 JANUARY 2007
x

TABLE OF CONTENTS
DEDICATION ABSTRACT ABSTRAK ACKNOWLEDGEMENTS APPROVAL DECLARATION LIST OF TABLES LIST OF FIGURES
CHAPTER
1 INTRODUCTION 1 . 1 Introduction 1 .2 Statement of Problems 1 .3 Objectives of the Study 1 .4 Significance of this Study 1 .5 Organization of Thesis
2 MALAYSIA'S BANKING SYSTEM 2 . 1 Introduction 2.2 The Malaysian Financial System 2 .3 Background and Developments in Malaysian Banking
Institutions 2.3 . 1 Background and Developments in Malaysian
Commercial Banks 2 .3 .2 Background and Developments in Malaysian Finance
Companies 2 .3 . 3 Background and Developments in Malaysian
Merchant Banks 2.4 Performance of Malaysian Banking System
2 .4 . 1 Profitability o f Malaysian Banking System 2.4.2 Partial Productivity Level of Malaysian Banking
System
3 REVIEW OF LITERATURE 3 . 1 Introduction 3 .2 Banking Productivity
3 .2. 1 The Concept of Banking Productivity 3 .2 .2 Empirical Evidences of Banking Productivity 3 .2 .3 The Effects of Liberalization and Deregulation on
Bank's Productivity 3 .2 .4 The Effects of Bank Mergers on Bank's
Productivity 3 .2 .5 The Determinants of Bank's Productivity
Xl
Page
11 11l V VII Vlll X XIV XVlll
1 . 1 1 . 1 1 . 1 6 l .22 1 .22 l .24
2 . 1 2 . 1 2 . 1 2 .5
2 .5
2 . 1 3
2 . 1 7
2 .20 2 .20 2.26
3 . 1 3 . 1 3 .2 3 .2 3 .2 3 . 1 0
3 . 1 3
3 . 1 4

4
5
3 . 3 Bank Efficiency 3 . 1 6 3 . 3 . 1 The Concept of Bank Efficiency 3 . 1 6 3 . 3 .2 Empirical Evidences of Scale Efficiency and Scope 3 . 1 8
Efficiency in Banking Industry 3 . 3 . 3 Empirical Evidences of X-Inefficiency in Banking 3 .25
Industry 3 . 3 .4 Banking Efficiency and Bank Merger 3 .33
3 .4 Banking Profitability 3 .35 3 .4. 1 Evidences on Banking Profitability 3 .35
3 . 5 Conduding Remarks 3 . 37
METHODOLOGY 4. 1 Introduction 4.2 Banking Institution's Outputs and Inputs 4.3 Measurement of Productivity Change in Banking
4.3 . 1 Malmquist Productivity Index Based on Constant Return to Scale
4 .3 .2 Malmquist Productivity Index Based on Variable Return to Scale
4. l 4. 1 4. l 4.4 4.4
4 .8
4 .3 .3 Data Envelopment Analysis 4. 1 5 4 .3 .4 Estimation Techniques of Productivity Change 4. 1 6
4.4 Model Specification and Estimation Method to Explain 4. 1 8 Productivity Level 4.4 . 1 Dynamic Panel Analysis 4 .23
4.5 Sources of Data 4.26
RESUL TS AND DISCUSSIONS 5 . 1 Introduction 5 .2 Productivity of Commercial Banks
5 .2 . 1 Productivity Behaviors of Commercial Banks 5 .2 .2 Sources of Productivity Change in Commercial
Banking 5 .2.3 Explaining Productivity Level in Commercial
5.3 Productivity of Finance Companies 5 .3 . 1 Productivity Behaviors of Finance Companies 5 .3 .2 Sources of Productivity Change in Finance
Companies 5 . 3 . 3 Explaining Productivity Level in Finance
Companies 5 .4 Productivity of Merchant Banks
5 .4. 1 Productivity Behaviors of Merchant Banks 5 .4.2 Sources of Productivity Change in Merchant Bank 5 .4 .3 Explaining Productivity Level in Merchant Banks
5 .5 Conclusions
Xli
5 . 1 5 . 1 5 . 1 5 . 1 5 . 1 8
5 .24 5 .27 5 .28 5 .40
5 .47
5 . 5 1 5 .52 5 .6 1 5 .66 5 .7 1

6 CONCLUSIONS AND POLICY IMPLICATIONS 6. 1 Introduction 6.2 Summary and Conclusions 6 .3 Policy Implications and Recommendations 6.4 Limitations and Avenues for Future Research 6.5 Final Remarks
REFERENCES BIODATA OF THE AUTHOR
Xlll
6. l 6 . 1 6 . l 6. 1 3 6.2 1 6.22
R. l B. l

Table
1 . 1
1 .2
1 . 3
1 .4
l . 5
1 .6
LIST OF TABLES Page
Growth Rate of Real Gross Domestic Products for Selected 1 .2 Countries Versus Malaysia from 1 97 1 to 2002
Unemployment Rate for Selected Countries Versus Malaysia 1 .7 from 1 986 to 2002
Inflation Rate for Selected Countries Versus Malaysia from 1 .8 1 970 to 2002
Sectoral Contributions to Malaysian Economy from 1 975 to 1 . 1 0 2001
Growth Rate of Value Added in Different Sectors of Malaysian 1 . 1 1 Economy from 1 97 1 to 2001
Foreign Direct Investment to Malaysia from 1 980 to 2002 1 . 1 1
1 . 7 Contribution of the Services Sector to Gross Domestic Product 1 . 1 3 of Malaysia from 1 980 to 2002
1 . 8 Annual Growth of the Services Sector from 1 980 to 2002 1 . 14
1 . 9 The Ratio of Total Assets of Gross Domestic Product of 1 . 1 5 Malaysia from 1 975 to 2002
2. 1 Assets of the Malaysian Financial System from 1 990 to 2001 2 .3
2.2 Key Indicators of Banking Institutions as at the End of the Year 2.6 from 1 990 to 2001
2.3 Foreign Bank Branches Incorporated or Sold to Local in 1 994 2.9
2.4 Key Interest Rates of Banking Institutions from 1 990 to 200 1 2 . 1 0
2 .5 Loans Sold to Pengurusan Danaharta Nasional Berhad, 1 998- 2. 1 6 2001
2.6 Profitability of Malaysian Banking System for the Period of 2 .21 1 992 to 2001
2.7 Profitability of Malaysian Banking Institutions for the Period of 2.22 1 990 to 2001
2 .8 Partial Labor Productivity Indicators of Malaysian Banking 2 .30 Institutions for the Period of 1 990 to 200 1
XIV
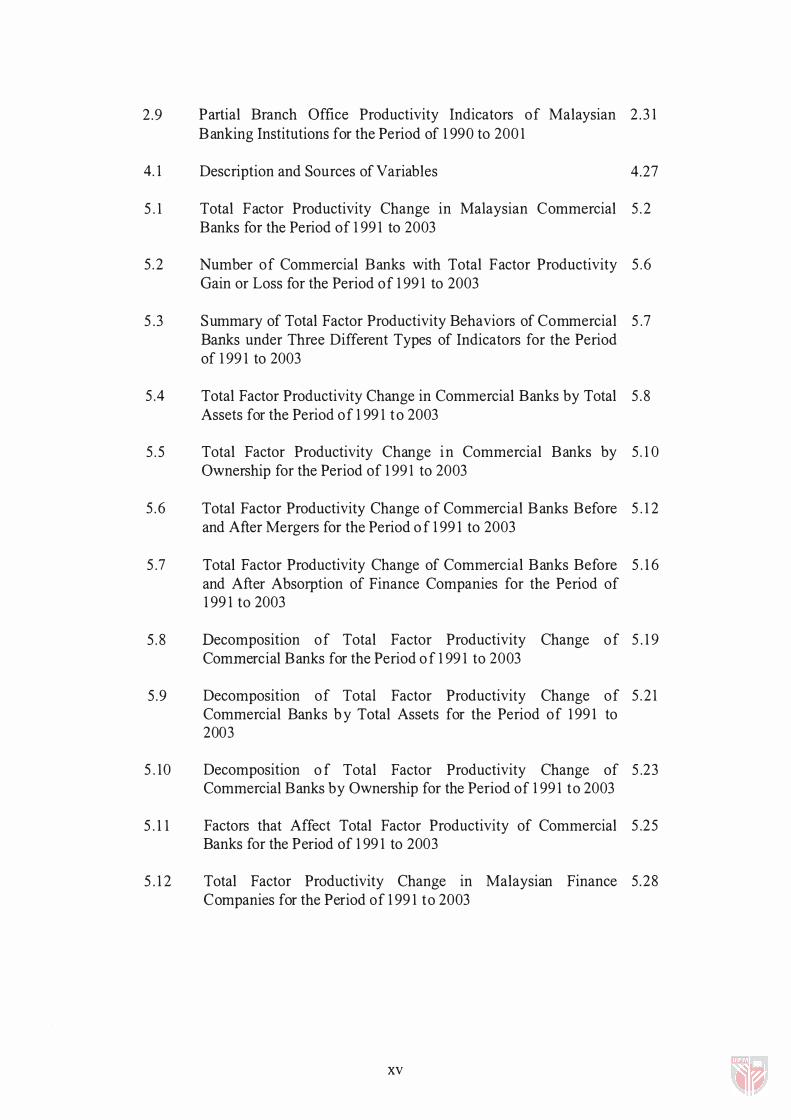
2.9 Partial Branch Office Productivity Indicators of Malaysian 2 .3 1 Banking Institutions for the Period of 1 99 0 to 2 0 0 1
4. 1 Description and Sources of Variables 4.27
5 . 1 Total Factor Productivity Change in Malaysian Commercial 5 . 2 Banks for the Period of 1 99 1 to 2 0 03
5 .2 Number of Commercial Banks with Total Factor Productivity 5 .6 Gain or Loss for the Period of 1 99 1 to 2003
5 .3 Summary of Total Factor Productivity Behaviors of Commercial 5 .7 Banks under Three Different Types of Indicators for the Period of 1 99 1 to 2003
5 .4 Total Factor Productivity Change in Commercial Banks by Total 5 . 8 Assets for the Period of 1 99 1 to 2003
5 . 5 Total Factor Productivity Change in Commercial Banks by 5 . 1 0 Ownership for the Period of 1 99 1 to 2 0 03
5 .6 Total Factor Productivity Change of Commercial Banks Before 5 . 1 2 and After Mergers for the Period o f 1 99 1 to 2 0 03
5 .7 Total Factor Productivity Change of Commercial Banks Before 5 . 1 6 and After Absorption of Finance Companies for the Period of 1 99 1 to 2003
5 .8 Decomposition of Total Factor Productivity Change of 5 . 1 9 Commercial Banks for the Period o f 1 99 1 to 2 0 03
5 .9 Decomposition of Total Factor Productivity Change of 5 .2 1 Commercial Banks by Total Assets for the Period of 1 99 1 to 2 003
5 . 1 0 Decomposition o f Total Factor Productivity Change of 5 .23 Commercial Banks by Ownership for the Period of 1 99 1 to 2003
5 . 1 1 Factors that Affect Total Factor Productivity of Commercial 5 .25 Banks for the Period of 1 99 1 to 2003
5 . 1 2 Total Factor Productivity Change in Malaysian Finance 5 .28 Companies for the Period of 1 99 1 to 2 0 03
xv

5 . 1 3 Number o f Finance Companies with Total Factor Productivity 5 . 32 Gain or Loss for the Period of 1 99 1 to 2003
5 . 1 4 Summary o f Total Factor Productivity Behaviors o f Finance 5 .33 Companies under Three Different Types of Indicators for the Period of 1 99 1 to 2003
5 . 1 5 Total Factor Productivity Change in Finance Companies by 5 .34 Total Assets for the Period of 1 99 1 to 2003
5 . 1 6 Total Factor Productivity Change in Finance Companies by 5 .36 Ownership for the Period of 1 99 1 to 2003
5 . 1 7 Total Factor Productivity Change o f Finance Companies Before 5 . 38 and After Mergers for the Period of 1 99 1 to 2003
5 . 1 8 Decomposition of Total Factor Productivity Change o f Finance 5 .41 Companies for the Period of 1 99 1 to 2003
5 . 1 9 Decomposition of Total Factor Productivity Change o f Finance 5 .43 Companies by Total Assets for the Period of 1 99 1 to 2003
5 .20 Decomposition of Total Factor Productivity Change of Finance 5 .46 Companies by Ownership for the Period of 1 99 1 to 1 997
5 .2 1 Factors that Affect Total Factor Productivity of Finance 5 .48 Companies for the Period of 1 99 1 to 2003
5 .22 Total Factor Productivity Change in Malaysian Merchant Banks 5 .53 for the Period of 1 99 1 to 2003
5 .23 Number of Merchant Banks with Total Factor Productivity Gain 5 .56 or Loss for the Period of 1 99 1 to 2003
5.24 Summary of Total Factor Productivity Behaviors of Merchant 5 .57 Banks under Three Different Types of Indicators for the Period of 1 99 1 to 2003
5.25 Total Factor Productivity Change in Merchant Banks by Total 5 . 58 Assets for the Period of 199 1 to 2003
5 .26 Total Factor Productivity Change of Merchant Banks Before and 5 .60 After Mergers for the Period of 1 99 1 to 2003
5 .27 Decomposition of Total Factor Productivity Change of Merchant 5 .62 Banks for the Period of 1 99 1 to 2003
XVl

5.28 Decomposition of Total Factor Productivity Change of Merchant 5.64 Banks by Total Assets for the Period of 1991 to 2003
5 .29 Factors that Affect Total Factor Productivity of Merchant Banks 5 .68 for the Period of 1 99 1 to 2003
5 .3 0 The Outputs of Merchant Banks for the Year of 2 003 5 .69
6 . 1 Summary of All the Results for Commerci al Banks, Finance 6.12 Companies and Merchant Banks
XVll
Figure
l . 1
l .2
2.1
4 . 1
5. 1
5.2
5.3
LIST OF FIGURES Page
Production, Imports, Exports and Net Exports of Crude 1.4 Petroleum for Malaysia from 1 97 1 to 1 998
Growth Rate of Real Gross Domestic Products for Malaysia 1 . 5 from 1 97 1 to 2002
The Malaysian Financial System 2.2
Malmquist Productivity Index and Its Decompositions 4.9
Changes in Total Factor Productivity of Commercial Banks for 5.4 the Period of 1 99 1 to 2003
Changes in Total Factor Productivity of Finance Companies for 5.30 the Period of 1 99 1 to 2003
Changes in Total Factor Productivity for Merchant Banks for 5.54 the Period of I99 1 to 2003
XVlIl
1 .1 Introduction
CHAPTERl
INTRODUCTION
The Malaysian economy has grown well above most of the economIes in the
ASEAN region. From Table 1.1, over the 1971 to 2002 period, Malaysian economy
grew at an average rate of 6.8% per annum, while the growth rate for other ASEAN
countries were between 3% and 8%. Moreover, the Malaysian economy grew faster
than most developed countries, which were expanding at the average annual rate of
1 % to 4% over the same period. However, the Newly Industrialized Economies
namely Singapore, South Korea and Taiwan were generally expanding at a faster
rate than the economy of Malaysia with an average rate of 7%.
Table 1.1 also disaggregates the growth performances of selected countries by
various sub-periods. As can be seen from the table, for the sub-period of 1971 to
1980, the Malaysian economy was able to grow at the average rate of 8.3% annually.
This rate can be considered as encouraging as the world was negatively affected by
two oil shocks namely the Arab Oil Embargo in 1973-1975 period and also the Iraq
Iran War in the 1978-1981 period. This was mainly due to the fact that Malaysia is a
crude petroleum-producing nation and is able to gain from the increased in the price
of crude oil.

Table 1 .1: Growth Rate of Real Gross Domestic Products for Selected Countries Versus Malaysia from 1971 to 2002
Average Growth Rate (% Per Annum) Economy 1971-1980 1981-1990 1991-2000 2001-2002 Developed Economies Germany NA NA 1.9 0.5 Japan 4.6 4.1 1.6 0.2 United 2.0 2.7 2.3 2.0 Kingdom United States 3.2 3.2 3.2 1.4
Newly Industrialized Economies Hong Kong NA NA 4.6 1.4 Singapore 9.1 7.2 7.8 0.1 South Korea 7.5 8.7 6.3 4.7 Taiwan 9.8 8.0 6.2 0.7
ASEAN-4 Indonesia 8.0 5.5 4.3 3.5 Malaysia 8.3 5.9 7.2 2.3 Philippines 5.9 1.8 2.9 4.0 Thailand 6.8 7.9 4.6 3.4 Sources:
Bank Negara Malaysia, Monthly Statistical Bulletin, Various Issues. Bank of Japan, Financial and Economic Statistics Monthly, 2003. Central Bank of China, Financial Statistics, Various Issues.
1971-2002
1.7#
3.2 2.3
3.1
4.1#
7.5 7.3 7.6
5.8 6.8 3.6 6.3
International Monetary Fund, International Financial Statistics Yearbook, Various Issues.
Notes: NA denotes as not available. # denotes as average for the period from 1991 to 2002.
1.2

From Figure 1.1, the production of crude petroleum in Malaysia increased from
4.339 million tonne in 1973 to 4.683 million tonne in 1975, while the exports of
crude petroleum increased by 12.3% to 3.24 million tonne for the same
corresponding period. During the second oil shock, crude petroleum production
grew by 17.1 % for the period of 1978 to 1981. On the other hand, exports of
petroleum also jumped upward to 10.143 million tonne in 1981 from the amount of
9 .153 million tonne. These have shown that Malaysia was in a better position to
absorb the negative effects of oil price shocks in the 1970s.
As noted in Table 1.1, there has been some slowing down in the economy of
Malaysia between the 19705 and 1980s from 8 .3% in the 1971 to 1980 period to
5.9% in the 1981 to 1990 period. This is primary caused by the global recession in
the early 1980s. In addition, the slump in the prices of commodities especially on the
prices of tin and petroleum has resulted in the 1985-1986 recession. For example,
the price of tin has dropped drastically from an average price of RM29680 per tonne
in 1985 to RM15390 per tonne in the following year, while the price of crude oil has
decreased from US$29.88 per tonne in 1985 to US$14.85 per tonne in the year 1987
(Bank Negara Malaysia, 1998b) .
However, Malaysia was able to successfully come out of recession with a real gross
domestic product growth of at least 7% from 1988 till prior to the onset of Asian
financial crisis in 1997. Moreover, the economy was able to growth at a record high
oft 0.0% in 1996 (See Figure 1.2) .
1.3
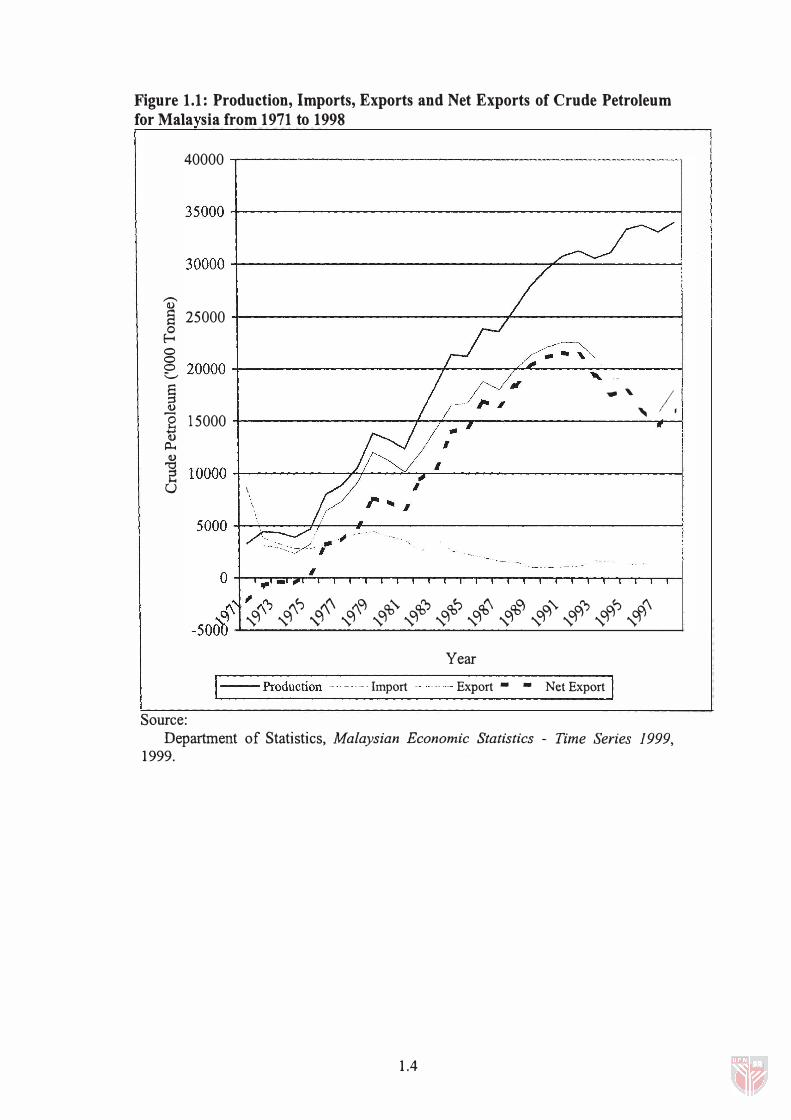
Figure 1.1: Production, Imports, Exports and Net Exports of Crude Petroleum for Mala sia from 1971 to 1998
,......., (l)
40000 .,..-------------------------·--�--1
35000 +-----------------------------------------�
30000 +---------------------------�----------�
§ 25000 4------------+----------\
� o o e 20000 +-------------------+-----�------�'------�1 � " ' , /,' 1 15000
p...
] 10000+----------?�--��1�--------------------� U \
Source:
\
5000 +-�---7r-��----------------------------�
O+-����._�,,_.-r._�,,_r-r,_� .. �_r,_� .. �
�IR � � � � � � � � � � � � � � � � � � � � � � � � � � -500u
Year
I----Production ---- Import -- ---- Export - - Net Export I
Department of Statistics, Malaysian Economic Statistics - Time Series 1999, 1999.
1.4

Figure 1.2: Growth Rate of Real Gross Domestic Products for Malaysia from 1971 to 2002
15�------------------------------------------,
10��+--++-------------�----���r-------4
5 ..-.... � '-" 0
� � ..r:::
� 0 �
0 0
M It") 0\ ..... M It") t'- .-t'- t'- 00 0\ 0\ 0\ 0\ 0 0\ 0\ 0\ 0\ 0\ 0\ 0\ 0\ 0 ..... ..... ..... ..... ..... ..... ..... ..... ..... .- .- ..... C'l
-5 +-----------------------------------------;r----�
-lO �--·----------------------------------------�
Year
Source: International Monetary Fund, International Financial Statistics Yearbook, Various Issues.
1.5
The spectacular growth of Malaysia's economy came to an end with the onslaught of
the Asian financial crisis that started in July 1997 in Thailand and spread rapidly to
other countries in the Asia Pacific region. By 1998, Malaysia's real gross domestic
product already contracted by 7% but rebounded back strongly in the following 2
years.
However, this recovery was short lived as the growth in most developed economies
started to slow down. From Table 1.1, the four major developed countries grew at
the average rate of between 0% and 2% for the year of 2001 to 2002. This has
affected the growth of most East Asian countries especially nations that are much
depended on exports to these developed markets. For the same corresponding
period, the New Industrialized Economies and ASEAN-4 economIes grow
moderately at an average rate of between 0% and 5%.
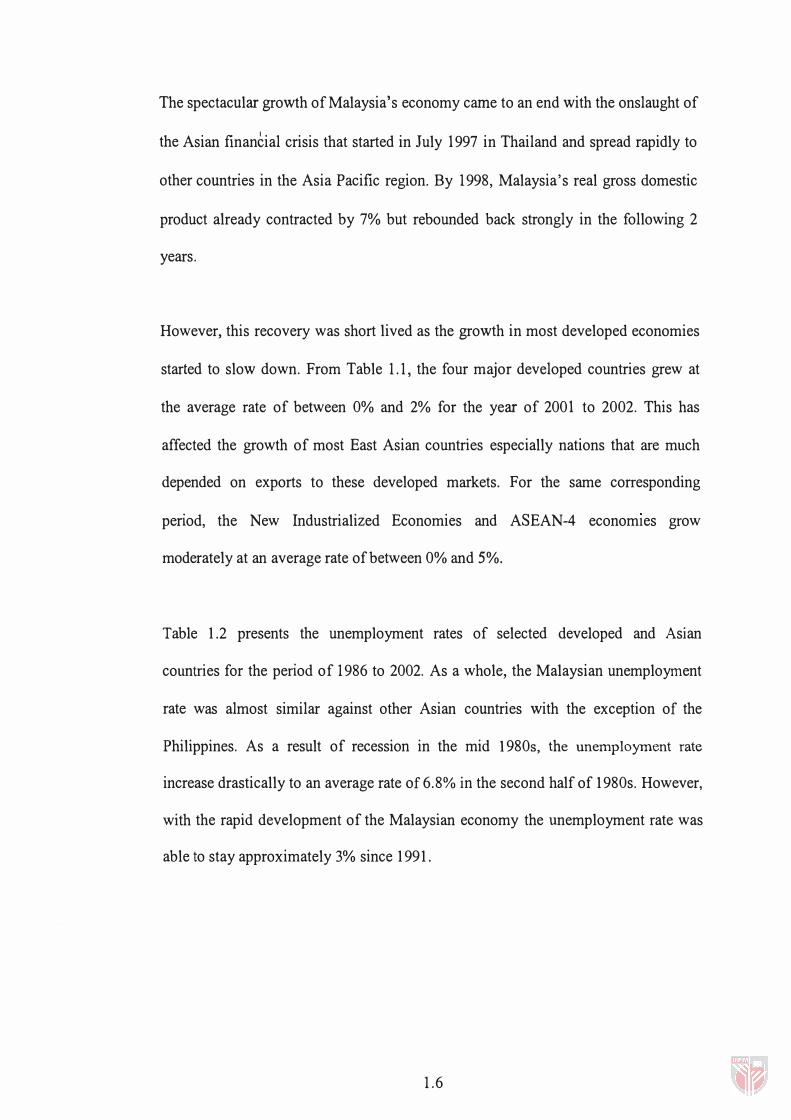
Table 1.2 presents the unemployment rates of selected developed and Asian
countries for the period of 1986 to 2002. As a whole, the Malaysian unemployment
rate was almost similar against other Asian countries with the exception of the
Philippines. As a result of recession in the mid 1980s, the unemployment rate
increase drastically to an average rate of 6.8% in the second half of 1980s. However,
with the rapid development of the Malaysian economy the unemployment rate was
able to stay approximately 3% since 1991.
1.6