universiti putra malaysia uav-based pm2.5 monitoring ...psasir.upm.edu.my/id/eprint/76073/1/fk 2018...
TRANSCRIPT

UNIVERSITI PUTRA MALAYSIA
UAV-BASED PM2.5 MONITORING SYSTEM FOR SMALL SCALE URBAN AREAS
HUDA JAMAL JUMAAH
FK 2018 152

© COP
UPM
1
UAV-BASED PM2.5 MONITORING SYSTEM FOR SMALL SCALE URBAN AREAS
By
HUDA JAMAL JUMAAH
Thesis Submitted to the School of Graduate Studies, Universiti Putra Malaysia, in Fulfillment of the Requirements for the Degree of Master of Science
July 2018
© COP
UPM
2
COPYRIGHT
All material contained within the thesis, including without limitation text, logos, icons,
photographs, and all other artwork, is copyright material of Universiti Putra Malaysia
unless otherwise stated. Use may be made of any material contained within the thesis
for non-commercial purposes from the copyright holder. Commercial use of material
may only be made with the express, prior, written permission of Universiti Putra
Malaysia.
Copyright © Universiti Putra Malaysia
© COP
UPM
i
DEDICATION
This thesis is dedicated to:
My precious father (may Allah have mercy on him), my mother, my uncle, my
brothers, my sisters, my colleagues and my friends.
© COP
UPM
i
Abstract of thesis presented to the Senate of Universiti Putra Malaysia in fulfilment
of the requirement for the degree of Master of Science
UAV-BASED PM2.5 MONITORING SYSTEM FOR SMALL SCALE URBAN AREAS
By
HUDA JAMAL JUMAAH
July 2018
Chairman : Professor Dato' Shattri Mansor, PhDFaculty : Engineering
In urban areas, air particle pollution is of precise interest because of its impact on
health. Air quality data collection near the ground surface is difficult, particularly in
small complex regions, and the usage of satellites image may not suffice and do not
achieve the required accuracy. A variety of Unmanned Aerial Vehicles (UAVs) based
on remote sensing technology enables data collection in these particular regions and
overcoming obstacles and the difficulties obtaining required data. Remote sensing can
be considered the best significant tool to assist in data monitoring for estimating and
predicting air quality parameters.
The recent monitoring stations are fixed stations and are not designed to denote
exposure on a small scale adequate. Most of the studies rely on satellite observations
from Aerosol Optical Depth (AOD) and have used lower resolution AOD to estimate
PM2.5 levels. In general, this used resolution of AOD products is often insufficient to
define exposure estimations in urban areas. In this manner evaluation at different
altitudes can offer extra information to assess air quality. The research aims to
introduce a PM2.5 prediction algorithm based on PM2.5 measurements from a
developed a system capable of measuring PM2.5 concentrations in small-scale areas
and validate the model at specified low altitudes. Observations based on UAV-based
PM2.5 monitoring sensors were applied around 1.6 km² area for collecting data at low
altitude. Meteorological parameters including temperature and humidity were
collected. This study uses an empirical method via applying amassed records of PM2.5
concentrations and meteorological par ameters to create a geographically weighted
regression (GWR) model to estimate PM2.5 concentrations in a small-scale area. For
the predicted model, an accuracy value is computed from the probability value given
by the regression analysis model of each parameter. To validate our method, we have
utilized two types of data, training, and testing. To evaluate and validate the suggested

© COP
UPM
ii
GWR model, we applied the model using testing measured points. Results showed a
relatively good fit of the model to the observed data. Where the maximum accuracy
obtained was set as 65% in July and 73% in August. Also, the obtained results showed
that there is a good statistical correlation between the measured in situ data and testing
data, the maximum accuracy was set as 93% in July and 94% in August. The
developed tool can be considered as an independent method for sample collection
demonstrated that the characteristics obtained by analysis are able to monitor and
predict the concentrations of PM2.5 in small-scale areas with high accuracy. This
suggested approach is useful to cover the area within a short amount of time, with low
cost and limitless flexibility.
© COP
UPM
iii
Abstrak tesis yang dikemukakan kepada Senat Universiti Putra Malaysia sebagai
memenuhi keperluan untuk ijazah Master Sains
SISTEM PEMANTAUAN PM2.5 BERASASKAN PESAWAT UDARA TANPA PEMANDU (UAV) BAGI KAWASAN BANDAR BERSKALA KECIL
Oleh
HUDA JAMAL JUMAAH
Julai 2018
Pengerusi : Profesor Dato’ Shattri Mansor, PhDFakulti : Kejuruteraan
Di kawasan bandar, pencemaran partikel udara merupakan perkara yang diperhatikan
dengan teliti kerana impaknya kepada kesihatan. Pengumpulan data kualiti udara
berhampiran permukaan bumi adalah sukar, terutamanya di rantau kecil yang
kompleks, serta penggunaan imej satelit tidak mencukupi dan tidak mencapai tahap
ketepatan yang diperlukan. Di kawasan bandar, pencemaran partikel udara merupakan
perkara yang diperhatikan dengan teliti kerana impaknya kepada kesihatan.
Pengumpulan data kualiti udara berhampiran permukaan bumi adalah sukar,
terutamanya di rantau kecil yang kompleks, serta penggunaan imej satelit tidak
mencukupi dan tidak mencapai tahap ketepatan yang diperlukan.
Stesen pemantauan pada masa kini adalah stesen tetap dan tidak direka untuk
menunjukkan pendedahan pada skala yang kecil. Kebanyakan kajian bergantung
kepada pemerhatian satelit dari Jarak Optik Aerosol (AOD) dan menggunakan
resolusi rendah AOD untuk menganggarkan tahap PM2.5. Secara amnya, resolusi
produk AOD ini adakalanya tidak mencukupi untuk menentukan anggaran
pendedahan di kawasan bandar. Dengan cara ini, penilaian di ketinggian yang berbeza
boleh memberi maklumat tambahan untuk menilai kualiti udara. Penyelidikan ini
bertujuan untuk memperkenalkan algoritma ramalan PM2.5 berdasarkan pengukuran
PM2.5 dari sistem yang dibangunkan yang mampu mengukur kepekatan PM2.5 di
kawasan berskala kecil dan mengesahkan model pada ketinggian rendah tertentu.
Pencerapan PM2.5 menggunakan sensor UAV dilakukan dalam kawasan seluas 1.6
km² bagi mengumpul data pada altitud rendah. Parameter meteorologi termasuk suhu
dan kelembapan turut direkodkan. Kajian ini menggunakan kaedah empirikal dengan
mengguna pakai rekod PM2.5 terkumpul dan parameter meteorologi bagi
membangunkan model regresi berwajaran geografi (GWR). Model ini digunakan
untuk menganggarkan kepekatan PM2.5 pada paras permukaan bumi di kawasan

© COP
UPM
iv
berskala kecil. Bagi model ramalan, satu nilai ketepatan dikira daripada nilai
kemungkinan yang diberikan oleh model analisa regresi bagi setiap parameter. Bagi
mengesahkan kaedah ini, kami menggunakan dua jenis data iaitu latihan dan ujian.
Untuk menilai dan mengesahkan model GWR yang dicadangkan, model tersebut
diaplikasikan menggunakan mata-mata ujian yang diukur. Keputusan menunjukkan
model yang agak baik bagi data yang diperhatikan, di mana ketepatan maksimum yang
diperolehi ditetapkan sebanyak 65% pada bulan Julai dan 73% pada bulan Ogos.
Selain itu, hasil yang diperoleh menunjukkan terdapat hubungan statistik yang baik
antara data sedia ada dan data ujian yang diukur, ketepatan maksimum ditetapkan
kepada 93% pada bulan Julai dan 94% pada bulan Ogos. Kaedah yang dibangunkan
ini juga boleh dianggap sebagai kaedah tak bersandar kerana daripada pengumpulan
sampel yang dilakukan menunjukkan bahawa ciri-ciri yang diperolehi daripada
analisis berupaya untuk memantau dan meramalkan kepekatan PM2.5 dalam kawasan
berskala kecil dengan ketepatan yang tinggi. Pendekatan yang dicadangkan ini
berguna untuk meliputi sesuatu kawasan dalam tempoh masa yang singkat, kos yang
rendah dan kebolehubahan yang tidak terhad.
© COP
UPM
v
ACKNOWLEDGEMENTS
In the name of Allah the Almighty, the most Gracious and most Merciful. Endless
thankful for the completion of this thesis.
With all my heart, I thank the chairman of the supervisory committee, Prof. Dato. Dr.
Shattri Bin Mansor for his patience, help, support, and guidance that endless during
my research work. I highly appreciate his continuous helpful and invaluable advises
in every aspect of my thesis.
Special thanks go to the member of the supervisory committee Assoc. Prof. Dr.
Biswajeet Pradhan for his excellent guidance and inspiration throughout my study
period.
I highly appreciated the University Putra Malaysia which gave me the opportunity to
complete my higher education. Many thanks to GISRC Lab for providing us the UAV
for data collection. I would like to thank Mr. Azman A. Ghany for his efforts for the
use of the UAV for data collection which used in some of the analyses applied in this
work.
I would also express my sincere appreciation to Prof. Dr. Luqman Chua bin Abdullah
for his generous help and advice that he taught to me during my thesis preparation till
the end. I would like to extend my thanks to all the academic and administrative staff
of University Putra Malaysia for their help.
At last, my deepest gratitude for my uncle, my mother, my brothers, my sisters, my
friends, and my colleagues who keep being my best accompany, and who were ready
to assist in carrying out this work, until the last word I put in this thesis. I owe you
this.
© COP
UPM
© COP
UPM
vii
This thesis was submitted to the Senate of the Universiti Putra Malaysia and has been
accepted as fulfilment of the requirement for the degree of Master of Science. The
members of the Supervisory Committee were as follows:
Shattri Bin Mansor, PhDProfessor, Dato’Faculty of Engineering
Universiti Putra Malaysia
(Chairman)
Biswajeet Pradhan, PhDAssociate Professor
Faculty of Engineering
Universiti Putra Malaysia
(Member)
ROBIAH BINTI YUNUS, PhD Professor and Dean
School of Graduate Studies
Universiti Putra Malaysia
Date:
© COP
UPM
viii
Declaration by graduate student
I hereby confirm that:
� this thesis is my original work;
� quotations, illustrations and citations have been duly referenced;
� this thesis has not been submitted previously or concurrently for any other degree
at any institutions;
� intellectual property from the thesis and copyright of thesis are fully-owned by
Universiti Putra Malaysia, as according to the Universiti Putra Malaysia
(Research) Rules 2012;
� written permission must be obtained from supervisor and the office of Deputy
Vice-Chancellor (Research and innovation) before thesis is published (in the form
of written, printed or in electronic form) including books, journals, modules,
proceedings, popular writings, seminar papers, manuscripts, posters, reports,
lecture notes, learning modules or any other materials as stated in the Universiti
Putra Malaysia (Research) Rules 2012;
� there is no plagiarism or data falsification/fabrication in the thesis, and scholarly
integrity is upheld as according to the Universiti Putra Malaysia (Graduate
Studies) Rules 2003 (Revision 2012-2013) and the Universiti Putra Malaysia
(Research) Rules 2012. The thesis has undergone plagiarism detection software
Signature: Date:
Name and Matric No: Huda Jamal Jumaah, GS46262
© COP
UPM
ix
Declaration by Members of Supervisory Committee
This is to confirm that:
� the research conducted and the writing of this thesis was under our supervision;
� supervision responsibilities as stated in the Universiti Putra Malaysia (Graduate
Studies) Rules 2003 (Revision 2012-2013) were adhered to.
Signature:
Name of Chairman
of Supervisory
Committee: Professor Dato’ Dr. Shattri Bin Mansor
Signature:
Name of Member
of Supervisory
Committee: Associate Professor Dr. Biswajeet Pradhan
© COP
UPM
x
TABLE OF CONTENTS
Page
ABSTRACT i
ABSTRAK iii
ACKNOWLEDGEMENTS v
APPROVAL vi
DECLARATION viii
LIST OF TABLES xii
LIST OF FIGURES xiii
LIST OF ABBREVIATIONS xvi
CHAPTER
1 INTRODUCTION 1 1.1 Background 1 1.2 Problem statement 3 1.3 Research objective 4 1.4 Research Scope 4 1.5 Research contribution 4 1.6 Thesis outline 5
2 LITERATURE REVIEW 6 2.1 Introduction 6 2.2 Environmental Remote Sensing 6
2.2.1 Environmental monitoring 8 2.2.2 Atmospheric monitoring aerosols 8
2.3 UAV based monitoring system overview 9 2.4 Applications of GIS for retrieving PM2.5 11
2.4.1 Regression analysis using ArcMap 12 2.4.2 Linear regression techniques 13 2.4.3 Geographically Weighted Regression (GWR) 18
2.5 Related Works 19 2.6 Summary 21
3 METHODOLOGY 22 3.1 Introduction 22 3.2 Research framework 22
3.2.1 Study area description 22 3.2.2 System Architecture 23 3.2.3 The flow chart 25
3.3 Project Environment 25 3.3.1 Design development and data collection 25
© COP
UPM
xi
3.3.1.1 Arduino Uno R3 board 28
3.3.1.2 Dust Sensor Model DSM501A 29 3.3.1.3 Temperature & Humidity sensor module DHT11 33 3.3.1.4 NEO-6M GPS module compatible with
Arduino UNO R3 35 3.3.1.5 Real-Time Module DS3231 36 3.3.1.6 Arduino DIY SD card logging shield 37 3.3.1.7 In situ data collection and UAV 38
3.3.2 Software analysis 43 3.3.2.1 Predicted Model 44 3.3.2.2 Validation of multivariate predictive algorithm
by comparison between experimented and
tested data of PM2.5 45 3.3.2.3 Validation of multivariate predictive algorithm
by fitting and confidence bound models 46 3.4 Summary 46
4 RESULTS 48 4.1 Introduction 48 4.2 UAV-Based PM2.5 Monitoring System Developing Evaluation
Results 48 4.2.1 Field Test I 51 4.2.2 Field Test II 54
4.3 Generation of the multivariate predictive algorithm 57 4.4 Validating of the predictive algorithm 64
4.4.1 Validation with the training regions 64 4.4.2 Validation of testing regions 66
4.5 Summary 69
5 CONCLUSION AND FUTURE WORKS 70 5.1 Conclusion 70 5.2 Future works 70
72 REFERENCES BIODATA OF STUDENT 80
© COP
UPM
xii
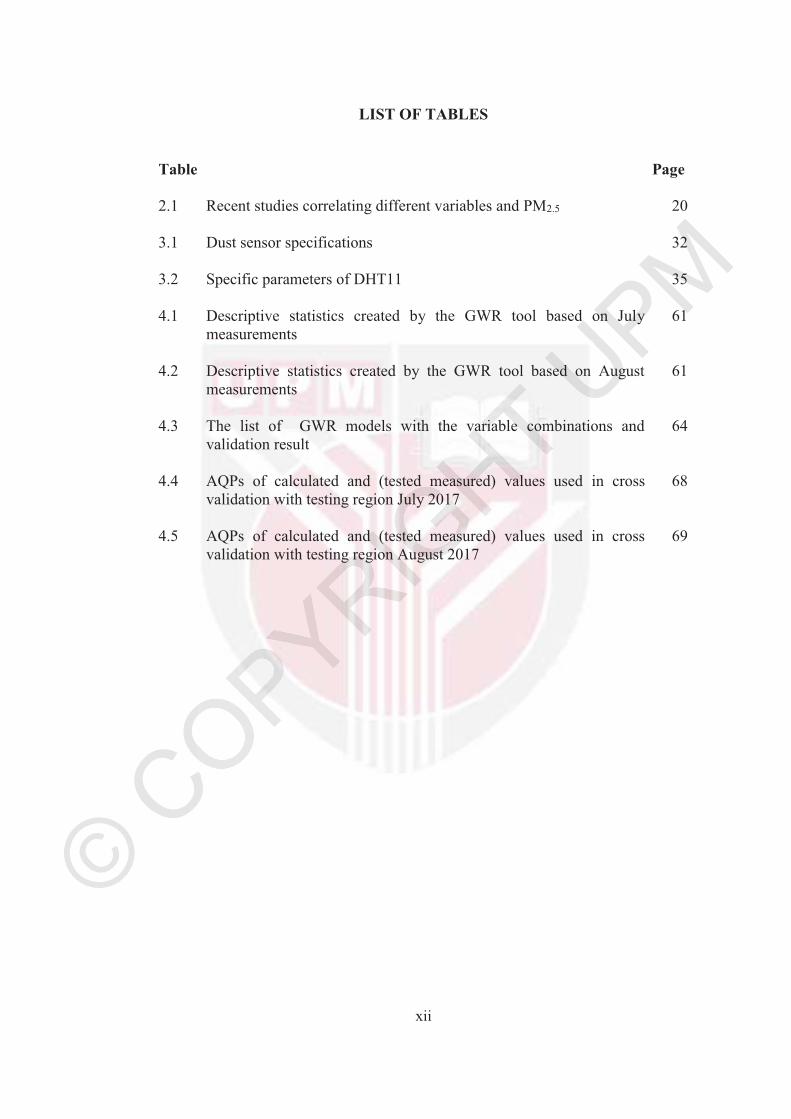
LIST OF TABLES
Table Page
2.1 Recent studies correlating different variables and PM2.5 20
3.1 Dust sensor specifications 32
3.2 Specific parameters of DHT11 35
4.1 Descriptive statistics created by the GWR tool based on July
measurements
61
4.2 Descriptive statistics created by the GWR tool based on August
measurements
61
4.3 The list of GWR models with the variable combinations and
validation result
64
4.4 AQPs of calculated and (tested measured) values used in cross
validation with testing region July 2017
68
4.5 AQPs of calculated and (tested measured) values used in cross
validation with testing region August 2017
69
© COP
UPM
xiii
LIST OF FIGURES
Figure Page
1.1 Three size fractions of PM 1
1.2 EPA AQI color coding 2
2.1 Global and spatial relationships 14
3.1 Location map of study area 23
3.2 PM2.5 Monitoring System components 24
3.3 Supplementary part of the system 24
3.4 The methodology adopted for PM2.5 estimation. 25
3.5 Project circuit 26
3.6 Air Quality Multimeter 27
3.7 Arduino UNO R3 28
3.8 External regulator (LM1084) 29
3.9 Dust sensor model DSM501A 30
3.10 Dimensions of dust sensor model DSM501A 31
3.11 Block diagram of dust sensor model DSM501A 32
3.12 Sensor characteristics vs low ratio 33
3.13 Temperature & Humidity sensor module DHT11 34
3.14 Temperature & Humidity sensor module DHT11 dimensions 34
3.15 NEO-6M GPS module 36
3.16 Real-Time Module DS3231 37
3.17 Arduino DIY SD card logging shield 38
3.18 Test area I 40
3.19 Test area II 41
© COP
UPM
xiv
3.20 Location of test area III 41
3.21 Subsequent measurements of test area III 42
3.22 Uploaded cod on arduino program version 1.6.6 43
3.23 Ground measurements (tested data) 45
4.1 Malaysia weather data of NASA 49
4.2 UAV based PM2.5 monitoring system 50
4.3 Output data of system 51
4.4 Field test area I 52
4.5 Measurements of field test area I 53
4.6 Measured PM2.5 values of field test area I 53
4.7 Measured temperature values of field test area I 54
4.8 Measured humidity values of field test area I 54
4.9 Field test area II 55
4.10 Measurements of field test area II 55
4.11 Measured PM2.5 values of field test area II 56
4.12 Measured temperature values of field test area II 56
4.13 Measured humidity values of field test area II 57
4.14 Location map for AQPs in the study area during July 2017 58
4.15 Location map for AQPs in the study area during August 2017 58
4.16 Measurement data of AQPs of 80 points in the study area during July
2017
59
4.17 Measurement data of AQPs of 20 points in the study area during
August 2017
60
4.18 Predicted PM2.5 concentrations of the GWR model based on WS July
2017
62
© COP
UPM
xv
4.19 Predicted PM2.5 concentrations of the GWR model based on H July
2017
62
4.20 Predicted PM2.5 concentrations of the GWR model based on H&WS
July 2017
63
4.21 Predicted PM2.5 concentrations of the GWR model based on H
August 2017
63
4.22 Scatterplots of GWR model validation with training region July 2017 65
4.23 Scatterplot of GWR model validation with training region August
2017
66
4.24 Scatterplot of GWR model cross validation with testing region July
2017
67
4.25 Scatterplot of GWR model cross validation with testing region
August 2017
68

© COP
UPM
xvi
LIST OF ABBREVIATIONS
PM Particulate Matter
USEPA United States Environmental Protection Agency
EPA Environmental Protection Agency
AQI Air Quality Index
RMAAQG Malaysia Ambient Air Quality Guidelines
API Air Pollutant Index
WHO World Health Organization
NOAA National Oceanic Atmosphere Administration
UAVs Unmanned Aerial Vehicles
AQPs Air Quality Parameters
GIS Geographic Information Systems
GWR Geographically Weighted Regression
MODIS Moderate Resolution Imaging Spectroradiometer
AOT Aerosol Optical Thickness
MISR Multi_angle Imaging Spectral-Radiometer
UAS Unmanned Aircraft Systems
RPA Remotely-Piloted Aircraft
UA Unmanned Aircraft
GCS Ground Control System
CS Control System
FOB Forward-Operating Base
HALE High Altitude-long Endurance
LASE Low Altitude-Short Endurance
NASA National Aeronautics and Space Administration
© COP
UPM
xvii
ESRI Environmental System Research Institute
R2 Coefficient correlation
OLR Ordinary or Least-Square Linear Regression
DR Deming’s-Linear Regression
PBR Passing Bablok Linear Regression
AOD Aerosol Optical Depth
GAM Generalized Additive Model
SARA SARA Simplified Aerosol Retrieval Algorithm
H Humidity
WS Wind speed
T Temperature
LED Light Emitting Diode Lamp
LPO Low Pulse Occupancy

© CO
UPM
1
CHAPTER 1
1 INTRODUCTION
1.1 Background
Air quality data in urban areas such as fine particulate matter PM2.5 is of high
importance to control contamination of air and to preserve human life. Urban air
quality changes by areas non-linearly and relies upon various factors, for example,
meteorology, transportation, urban structure, and land use [1]. PM is typically
described by its aerodynamic size, different Particles diameters have clear effects on
the health [2]. Figure 1.1 illustrates three size fractions of PM sizes: PM2.5, PM10, and
PMc (modified from the United States Environmental Protection Agency USEPA,
2013) [3].
Figure 1.1 : Three size fractions of PM [3��
Hence ground-level (PM2.5) is the main part of urban air contamination where as
planned by the Environmental Protection Agency EPA to come across federal
standards. Where the EPA along these lines revised the first standards in 1979 and the
alterations implemented in 1987, once the prime scale of particles was altered from
Total Suspended Particles TSP to PM10, completely depicting particles sufficiently
tiny to penetrate into the respiratory tract and so it be more prone and impact on health.
The new prime scale for PM10 not exceeded 150 μg/m3 more than once per year and
© COP
UPM
2
with mean annual of 50 μg/m3. Next alteration started in 1994 that reviewed fine
particle matter pm 2.5. This decision was according to studies that related to these
small particles with severe health effects.
Standards of annual mean for PM2.5 were set at 15 μg/m3, and for 24-hour average
were set at 65 μg/m3. The values for PM10 were kept up at the same level as standard
set in 1987. In 2006 PM2.5 standards reduced the 24-hour values from 65 μg/m3 to 35
μg/m3 then, in 2012 the annual mean level was reduced to 12 μg/m3 by EPA [4].
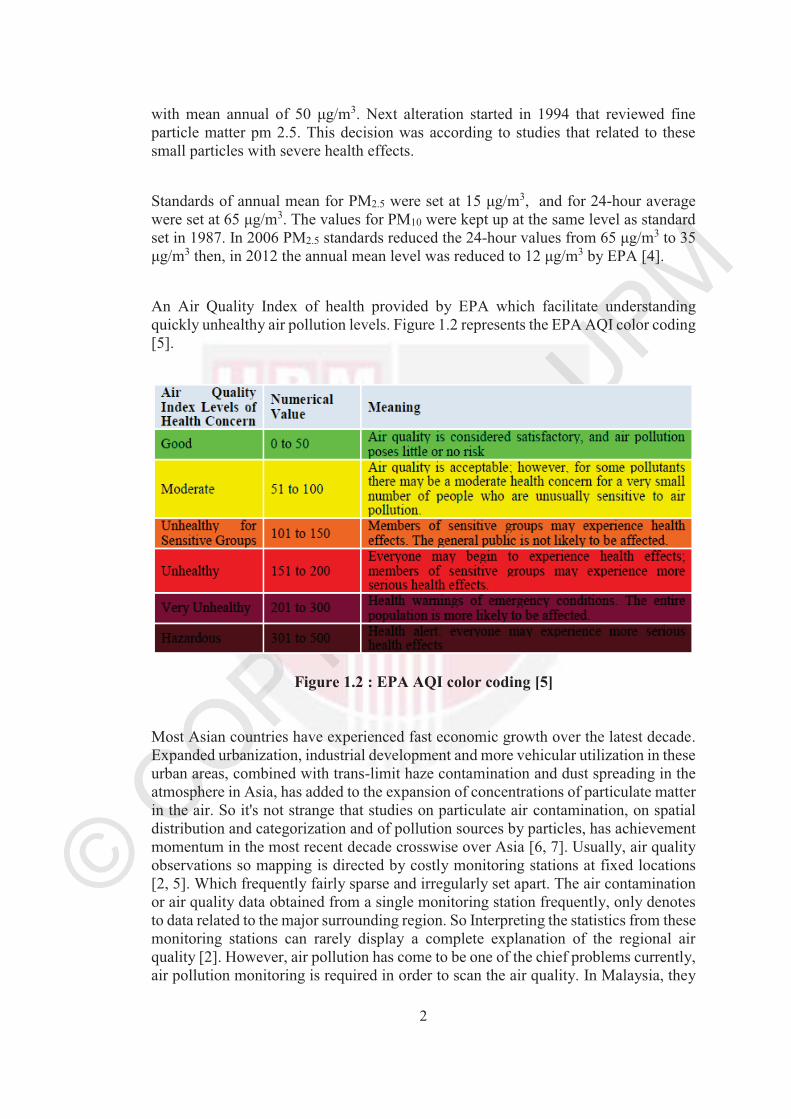
An Air Quality Index of health provided by EPA which facilitate understanding
quickly unhealthy air pollution levels. Figure 1.2 represents the EPA AQI color coding
[5].
Figure 1.2 : EPA AQI color coding [5]
Most Asian countries have experienced fast economic growth over the latest decade.
Expanded urbanization, industrial development and more vehicular utilization in these
urban areas, combined with trans-limit haze contamination and dust spreading in the
atmosphere in Asia, has added to the expansion of concentrations of particulate matter
in the air. So it's not strange that studies on particulate air contamination, on spatial
distribution and categorization and of pollution sources by particles, has achievement
momentum in the most recent decade crosswise over Asia [6, 7]. Usually, air quality
observations so mapping is directed by costly monitoring stations at fixed locations
[2, 5]. Which frequently fairly sparse and irregularly set apart. The air contamination
or air quality data obtained from a single monitoring station frequently, only denotes
to data related to the major surrounding region. So Interpreting the statistics from these
monitoring stations can rarely display a complete explanation of the regional air
quality [2]. However, air pollution has come to be one of the chief problems currently,
air pollution monitoring is required in order to scan the air quality. In Malaysia, they
© COP
UPM
3
have specific guidelines intended for monitoring air quality which depends on the
Recommended Malaysia Ambient Air Quality Guidelines (RMAAQG). The
RMAAQG consider as a basis for calculating the Air Pollutant Index (API). These
guidelines are derivative from existing approaches and human health records, and
signify a safe level, below which no opposing health effects have been detected. The
RMAAQG is commonly similar to the consistent air quality standards prescribed by
the World Health Organization (WHO) and other states [8]. Satellites also used to
predict air contamination concentrations along wide areas. However, they are
inconvenient for applications on a small scale ranges, like cities, for the reason of limit
spatial resolution [9]. Monitoring by the National-Oceanic Atmosphere-
Administration (NOAA) satellite for the period of burning season during February and
March 2002 which had displayed that Perak, Selangor, and Pahang have shown high
burning activities in comparison to other places, the uncontrolled and Incomplete
burning of vegetation can be a prospective polluter to the environment [7]. Most of
the results from different studies offer an indication of air quality in Malaysia, if not
completely, suffer from one weakness. Though the sampling was not directed
continuously. A continuous sampling is needed to get a more dependable and true data
about the air pollution in the atmosphere [8]. The meteorological effects on PM2.5
particle matter concentrations were used to study the estimation of PM2.5 concentration
[10]. Uses of the Unmanned-Airborne Vehicles UAVs are an evolving tool to obtain
different information. This information acquired with UAVs of a high resolution.
UAVs are practical in all manners of environments of various sizes on a moment
monitoring [11]. Providing Unmanned Aerial Vehicles (UAVs) with different
contamination sensors, permitting them to become independent stations for air
monitoring [12]. Air pollution monitoring over mobile sensors, which are low-power,
low-cost, for sampling air contaminants in addition to the environmental temperature
of the surface, humidity, and the air pressure using communication via Bluetooth with
a smartphone [5]. Use of multiple linear regression to model the relationship between
the dependent variable, the response variable air pollution with one or further
independent variables an explanatory variables. So, the predicted values are used to
describe air pollutant concentrations at sites without air pollution monitoring or
sampler, and the predictor variables clarify the spatial variety of pollutant
concentration properly well [9].
A regression analysis is presented in this study to predict PM2.5 concentrations in
small-scale area in UPM from data acquired by UAV based sensors.
1.2 Problem statement
i. However air contamination has come to be one of the main problems currently,
PM2.5 monitoring is required in order to scan air quality due to its tiny diameter
which has clear effects on the health. Using small Unmanned Aerial Vehicles
based sensors provides information at specified altitudes and overcoming
obstacles and the difficulties obtaining required data, where can limit these
data by sensor selection.
© COP
UPM
4
ii. The recent monitoring stations are fixed stations and are not designed to denote
exposure on a small scale adequate. So the consequence may not sufficiently
refer to small-scale conditions and consider a poor indicator for PM2.5
concentrations away from the sampling position. In addition to the absence of
PM2.5 monitoring sites in some cities require an alternative method for
information availability for PM2.5 estimation.
iii. In small-scale areas where there are tall buildings, PM2.5 monitoring at ground
levels (1-3) meters is not sufficient. Therefore evaluation at different
elevations can offer additional info to assess air quality
1.3 Research objective
The objective can be divided into the following sub-objectives:
i. To develop a UAV-based PM2.5 Monitoring System.
ii. To develop a PM2.5 estimation algorithm based on PM2.5 measurements
from the UAV-based sensor.
iii. To validate the model at low altitudes.
1.4 Research Scope
A UAV based sensors monitoring system will be developed in this study for purpose
of data collection to generate a model for predicting PM2.5 concentration. Three AQPs
to predict PM2.5 were selected, including; humidity, temperature, and wind speed.
Three type of predictive models would be generated using statistical techniques, for
instance, logistic regression a geographically weighted regression for modeling spatial
relationships. The proposed model was validated by using trained and tested data
which showed the probability and accuracy in the prediction. Each final output of each
model was compared and validated using further data which were not used within the
analysis.
1.5 Research contribution
This study applied a statistical approach to evaluate and validate the predicted model
at different altitudes. The hypothesis of the study can be proved by verified results
through generated models based on obtainability of data in the study area. The
methodologies of integration of GIS and remote sensing involving UAV provide a
fast, powerful tool and low-cost technique for analyzing and monitoring AQPs in
small-scale areas compared to the further and current practices of predictable methods
which most of them on large scale regardless of the type of regression used.
© COP
UPM
5
1.6 Thesis outline
CHAPTER 1: INTRODUCTION; This chapter described briefly the background of
the study, which included air contamination in metropolitan areas and some types of
information related to the subject with various studies in Malaysia, in addition to a
brief explanation of the problem statement of the study, goal, objectives, and scope of
the study.
CHAPTER 2: LITERATURE REVIEW; This chapter describes, environmental
monitoring of PM2.5, and environmental remote sensing. Next, an overview of the
UAV based monitoring system, the method of data collecting in this study. Then,
discussion describing the methodology used for modeling and predicting by regression
analysis using ArcMap and applications of GIS for retrieving PM2.5. Finally, a
summary of related works using GWR and other regressing techniques.
CHAPTER 3: METHODOLOGY; This chapter describes in detail about the study
area characteristics. Then followed by the design development and data collection,
software analysis, and model validation.
CHAPTER 4: RESULTS AND DISCUSSION; This chapter concentrates on the
outputs of the study including evaluation results of UAV-based PM2.5 Monitoring
System developing in different test areas and results of generation and validation of
multivariate predictive algorithm which supported by graphs, tables, equations, and
charts. Next, this chapter also discussed the regression analysis of GIS modeling
technique of air quality in the study area.
CHAPTER 5: CONCLUSIONS AND FUTURE WORKS; This chapter provides
the overall conclusion of this study and future works.
© COP
UPM
72
6 REFERENCES
[1] Zheng, Y., Liu, F., & Hsieh, H. P. (2013). U-Air: When urban air quality inference
meets big data. In Proceedings of the 19th ACM SIGKDD international
conference on Knowledge discovery and data mining (pp. 1436-1444). ACM.
[2] Tian, J. (2009). Integration of satellite remote sensing and ground-based
measurements for modelling the spatiotemporal distribution of fine particulate
matter at a regional scale.
[3] Ferguson, M. D. (2015). Investigating the influence of airborne particulate matter
source and size on health outcomes. University of Montana.
[4] Jennings, C. A. (2013). Estimating PM2. 5 concentrations using MODIS and
meteorological measurements for the San Francisco bay area (Doctoral
dissertation, San Francisco State University).
[5] Sevusu, P. (2015). Real-time air quality measurements using mobile platforms.
Rutgers The State University of New Jersey-New Brunswick.
[6] Tahir, N. M., Suratman, S., Fong, F. T., Hamzah, M. S., & Latif, M. T. (2013).
Temporal distribution and chemical characterization of atmospheric particulate
matter in the eastern coast of Peninsular Malaysia. Aerosol and Air Quality
Research, 13(2), 584-595.
[7] Mahmud, M. (2017). Active fire and hotspot emissions in Peninsular Malaysia
during the 2002 burning season. Geografia-Malaysian Journal of Society and
Space, 1(1).
[8] Amir, A. (2007). Air Pollution Trends In Petaling Jaya, Selangor,
Malaysia (Doctoral dissertation, Universiti Putra Malaysia).
[9] Ende, P. (2016). Modelling air pollution and personal exposure in Bangkok and
Mexico City using a land use regression model (Master's thesis). TU Delft,
University of Twente, Utrecht University & Wageningen University
[10] Shith, S., Yusof, N. F. F. M., Ramli, N. A., & Elbayoumi, M. (2017).
Characterization of Chemical Composition in Fine Particles (PM2. 5) from
Industrial Site in Malaysia. Sustainability in Environment, 2(2), 104.
[11] Hemmelder, S. D. (2016). The application and suitability of unmanned airborne
vehicle based imagery to determine river dynamics: A case study of the Buëch
in France (Master's thesis).
[12] Alvear, O., Calafate, C. T., Hernández, E., Cano, J. C., & Manzoni, P. (2015,
December). Mobile Pollution Data Sensing Using UAVs. In Proceedings of the
13th International Conference on Advances in Mobile Computing and
Multimedia (pp. 393-397). ACM.
[13] Guan, Z. (2010). Laser Remote Sensing for Environmental Monitoring. Division
of Atomic Physics, Department of Physics, Faculty of Engineering, LTH, Lund
University.
© COP
UPM
73
[14] Miller, R. B., & Small, C. (2003). Cities from space: potential applications of
remote sensing in urban environmental research and policy. Environmental
Science & Policy, 6(2), 129-137.
[15] Meng, Q. Y., Turpin, B. J., Korn, L., Weisel, C. P., Morandi, M., Colome, S.,
Zhang, J., Stock, T., Spektor, D., Winer, A., & Zhang, L. (2005). Influence of
ambient (outdoor) sources on residential indoor and personal PM 2.5
concentrations: analyses of RIOPA data. Journal of Exposure Science and
Environmental Epidemiology, 15(1), 17.
[16] Valavanidis, A., Fiotakis, K., & Vlachogianni, T. (2008). Airborne particulate
matter and human health: toxicological assessment and importance of size and
composition of particles for oxidative damage and carcinogenic
mechanisms. Journal of Environmental Science and Health, Part C, 26(4), 339-
362.
[17] Guo, H., Cheng, T., Gu, X., Chen, H., Wang, Y., Zheng, F., & Xiang, K. (2016).
Comparison of four ground-level PM2. 5 estimation models using parasol
aerosol optical depth data from China. International journal of environmental
research and public health, 13(2), 180.
[18] Pope III, C. A., Burnett, R. T., Thun, M. J., Calle, E. E., Krewski, D., Ito, K., &
Thurston, G. D. (2002). Lung cancer, cardiopulmonary mortality, and long-
term exposure to fine particulate air pollution. Jama, 287(9), 1132-1141.
[19] Hu, X., Waller, L. A., Al-Hamdan, M. Z., Crosson, W. L., Estes Jr, M. G., Estes,
S. M., Quattrochi, D. A., Sarnat, J. A., & Liu, Y. (2013). Estimating ground-
level PM2. 5 concentrations in the southeastern US using geographically
weighted regression. Environmental Research, 121, 1-10.
[20] Dockery, D. W., Pope, C. A., Xu, X., Spengler, J. D., Ware, J. H., Fay, M. E.,
Ferris, B. G., & Speizer, F. E. (1993). An association between air pollution and
mortality in six US cities. New England journal of medicine, 329(24), 1753-
1759.
[21] Paciorek, C. J., Liu, Y., Moreno-Macias, H., & Kondragunta, S. (2008).
Spatiotemporal associations between GOES aerosol optical depth retrievals and
ground-level PM2. 5. Environmental science & technology, 42(15), 5800-5806.
[22] Blaschke, T., Lang, S., Lorup, E., Strobl, J., & Zeil, P. (2000). Object-oriented
image processing in an integrated GIS/remote sensing environment and
perspectives for environmental applications. Environmental information for
planning, politics and the public, 2, 555-570
[23] Fedra, K. (1993). GIS and environmental modeling. Environmental modeling
with GIS, 35-50.
[24] Garland, R. M., Yang, H., Schmid, O., Rose, D., Nowak, A., Achtert, P.,
Wiedensohler, A., Takegawa, N., Kita, K., Miyazaki, Y., & Kondo, Y. (2008).
Aerosol optical properties in a rural environment near the mega-city
Guangzhou, China: implications for regional air pollution, radiative forcing and
remote sensing. Atmospheric Chemistry and Physics, 8(17), 5161-5186.
© COP
UPM
74
[25] Weng, Q. (Ed.). (2011). Advances in environmental remote sensing: sensors,
algorithms, and applications. CRC Press.
[26] Martin, R. V. (2008). Satellite remote sensing of surface air quality. Atmospheric
Environment, 42(34), 7823-7843.
[27] Liao, D., Peuquet, D. J., Duan, Y., Whitsel, E. A., Dou, J., Smith, R. L., Lin, H.,
Chen, J., & Heiss, G. (2006). GIS approaches for the estimation of residential-
level ambient PM concentrations. Environmental health perspectives, 114(9),
1374.
[28] Sohrabinia, M., & Khorshiddoust, A. M. (2007). Application of satellite data and
GIS in studying air pollutants in Tehran. Habitat International, 31(2), 268-275.
[29] Gupta, P., Christopher, S. A., Wang, J., Gehrig, R., Lee, Y. C., & Kumar, N.
(2006). Satellite remote sensing of particulate matter and air quality assessment
over global cities. Atmospheric Environment, 40(30), 5880-5892.
[30] Wang, J., & Christopher, S. A. (2003). Intercomparison between satellite derived
aerosol optical thickness and PM2. 5 mass: implications for air quality
studies. Geophysical research letters, 30(21).
[31] Shi, W., Wong, M. S., Wang, J., & Zhao, Y. (2012). Analysis of airborne
particulate matter (PM2. 5) over Hong Kong using remote sensing and
GIS. Sensors, 12(6), 6825-6836.
[32] Liu, Y., Park, R. J., Jacob, D. J., Li, Q., Kilaru, V., & Sarnat, J. A. (2004).
Mapping annual mean ground level PM2. 5 concentrations using Multiangle
Imaging Spectroradiometer aerosol optical thickness over the contiguous
United States. Journal of Geophysical Research: Atmospheres, 109(D22).
[33] Moore, A. (2012). An Empirical Study of Particulate Matter Exposure for Transit
Users at Bus Stop Shelters. Portland State University
[34] Watts, A. C., Ambrosia, V. G., & Hinkley, E. A. (2012). Unmanned aircraft
systems in remote sensing and scientific research: Classification and
considerations of use. Remote Sensing, 4(6), 1671-1692.
[35] Colomina, I., & de la Tecnologia, P. M. (2008). Towards A New Paradigm for
High-Resolution Low-Cost Photogrammetry and Remote Sensing. In ISPRS
XXI Congress. Beijing, China (pp. 1201-1206).
[36] Nex, F., & Remondino, F. (2014). UAV for 3D mapping applications: a
review. Applied Geomatics, 6(1), 1-15.
[37] Ahmed, A., Nagai, M., Tianen, C., & Shibasaki, R. (2008). UAV based
monitoring system and object detection technique development for a disaster
area. International Archives of Photogrammetry, Remote Sensing and Spatial
information Sciences, 37, 373-377.
[38] Lussier, D. A., Delisle, A. J., & Torrence, P. M. (2013). U.S. Patent No.
8,439,301. Washington, DC: U.S. Patent and Trademark Office.
© COP
UPM
75
[39] Hardin, P. J., & Jensen, R. R. (2011). Small-scale unmanned aerial vehicles in
environmental remote sensing: Challenges and opportunities. GIScience &
Remote Sensing, 48(1), 99-111.
[40] Casbeer, D. W., Kingston, D. B., Beard, R. W., & McLain, T. W. (2006).
Cooperative forest fire surveillance using a team of small unmanned air
vehicles. International Journal of Systems Science, 37(6), 351-360.
[41] Pajares, G. (2015). Overview and current status of remote sensing applications
based on unmanned aerial vehicles (UAVs). Photogrammetric Engineering &
Remote Sensing, 81(4), 281-329.
[42] Peng, Z. R., Wang, D., Wang, Z., Gao, Y., & Lu, S. (2015). A study of vertical
distribution patterns of PM 2.5 concentrations based on ambient monitoring
with unmanned aerial vehicles: a case in Hangzhou, China. Atmospheric
Environment, 123, 357-369.
[43] Khouban, L., Alesheikh, A. A., & Ghaiyoomi, A. A. (2007). Managing Air
Quality Information in Tehran Using GIS. Map Asia. Geospatial World,
http://geospatialmedia.net.
[44] Hoek, G., Beelen, R., De Hoogh, K., Vienneau, D., Gulliver, J., Fischer, P., &
Briggs, D. (2008). A review of land-use regression models to assess spatial
variation of outdoor air pollution. Atmospheric environment, 42(33), 7561-
7578
[45] Corwin, D. L., & Wagenet, R. J. (1996). Applications of GIS to the modeling of
nonpoint source pollutants in the vadose zone: A conference overview. Journal
of environmental quality, 25(3), 403-411.
[46] Goodchild, M. F. (1993). The state of GIS for environmental problem-
solving. Environmental modeling with GIS, 8-15.
[47] Kanakiya, R. S., Singh, S. K., & Shah, U. (2015). GIS Application for spatial
and temporal analysis of the air pollutants in urban area. International Journal
of Advanced Remote Sensing and GIS, 4(1), pp-1120.
[48] Maantay, J. A., Tu, J., & Maroko, A. R. (2009). Loose-coupling an air dispersion
model and a geographic information system (GIS) for studying air pollution
and asthma in the Bronx, New York City. International Journal of
Environmental Health Research, 19(1), 59-79.
[49] Chatterjee, S., & Hadi, A. S. (2015). Regression analysis by example. John Wiley
& Sons.
[50] Wankie, C. (2013). Local Spatial Modeling Using Geographically Weighted
Regression (GWR). California State University, Long Beach.
[51] Mao, L., Qiu, Y., Kusano, C., & Xu, X. (2012). Predicting regional space–time
variation of PM2. 5 with land-use regression model and MODIS
data. Environmental Science and Pollution Research, 19(1), 128-138.
© COP
UPM
76
[52] Paciorek, C. J., Liu, Y., Moreno-Macias, H., & Kondragunta, S. (2008).
Spatiotemporal associations between GOES aerosol optical depth retrievals and
ground-level PM2. 5. Environmental science & technology, 42(15), 5800-5806.
[53] Li, W., & Wu, J. (2015). Linking urban structure and air quality: a geographically
weighted regression model for PM2. 5 concentrations in Beijing.
In International Conference on Computers in Urban Planning and Urban
Management, CUPUM 2015.
[54] Brunsdon, C., Fotheringham, A. S., & Charlton, M. E. (1996). Geographically
weighted regression: a method for exploring spatial
nonstationarity. Geographical analysis, 28(4), 281-298.
[55] Fotheringham, A. S., Brunsdon, C., & Charlton, M. (2003). Geographically
weighted regression: the analysis of spatially varying relationships. John Wiley
& Sons.
[56] Twomey, P. J., & Kroll, M. H. (2008). How to use linear regression and
correlation in quantitative method comparison studies. International journal of
clinical practice, 62(4), 529-538.
[57] Shareef, M. A., Toumi, A., & Khenchaf, A. (2014). Prediction of water quality
parameters from SAR images by using multivariate and texture analysis
models. In SAR Image Analysis, Modeling, and Techniques XIV (Vol. 9243,
p. 924319). International Society for Optics and Photonics.
[58] Seber, G. A., & Lee, A. J. (2012). Linear regression analysis (Vol. 329). John
Wiley & Sons.
[59] Weisberg, S. (2005). Applied linear regression (Vol. 528). John Wiley & Sons.
[60] Kiranoudis, C. T., Maroulis, Z. B., Tsami, E., & Marinos-Kouris, D. (1993).
Equilibrium moisture content and heat of desorption of some
vegetables. Journal of Food engineering, 20(1), 55-74.
[61] Wang, H. F., & Tsaur, R. C. (2000). Insight of a fuzzy regression model. Fuzzy
sets and systems, 112(3), 355-369.
[62] Andersson, J. (2017). Using Geographically Weighted Regression (GWR) to
explore spatial variations in the relationship between public transport
accessibility and car use: a case study in Lund and Malmö, Sweden. Student
thesis series INES.
[63] Bolboaca, S. D., & Jäntschi, L. (2006). Pearson versus Spearman, Kendall’s tau correlation analysis on structure-activity relationships of biologic active
compounds. Leonardo Journal of Sciences, 5(9), 179-200.
[64] Calvo, E., & Escolar, M. (2003). The local voter: A geographically weighted
approach to ecological inference. American Journal of Political Science, 47(1),
189-204
© COP
UPM
77
[65] Charlton, M., & Fotheringham, A. (2009). Geographically weighted regression:
a tutorial on using GWR in ArcGIS 9.3. National Centre for Geocomputation.
National University of Ireland, 5–6.
[66] LeSage, J. P. (2004). A family of geographically weighted regression models.
In Advances in spatial econometrics (pp. 241-264). Springer, Berlin,
Heidelberg.
[67] McMillen, D. P. (2004). Geographically weighted regression: the analysis of
spatially varying relationships.
[68] Wheeler, D. C. (2014). Geographically weighted regression. In Handbook of
regional science (pp. 1435-1459). Springer Berlin Heidelberg.
[69] Paez, A. (2004). Anisotropic variance functions in geographically weighted
regression models. Geographical Analysis, 36(4), 299-314.
[70] Wheeler, D., & Tiefelsdorf, M. (2005). Multicollinearity and correlation among
local regression coefficients in geographically weighted regression. Journal of
Geographical Systems, 7(2), 161-187.
[71] Bivand, R. S., Pebesma, E. J., Gomez-Rubio, V., & Pebesma, E. J.
(2008). Applied spatial data analysis with R (Vol. 747248717). New York:
Springer.
[72] Fabian, Z. (2014). Method of the Geographically Weighted Regression and an
Example for its Application. Regional Statistics: journal of the Hungarian
Central Statistical Office, 4(1), 61-75.
[73] Gupta, P., & Christopher, S. A. (2008). Seven year particulate matter air quality
assessment from surface and satellite measurements. Atmospheric Chemistry
and Physics, 8(12), 3311-3324.
[74] Liu, Y., Paciorek, C. J., & Koutrakis, P. (2009). Estimating regional spatial and
temporal variability of PM2. 5 concentrations using satellite data, meteorology,
and land use information. Environmental health perspectives, 117(6), 886.
[75] Boyouk, N., Léon, J. F., Delbarre, H., Podvin, T., & Deroo, C. (2010). Impact
of the mixing boundary layer on the relationship between PM2. 5 and aerosol
optical thickness. Atmospheric Environment, 44(2), 271-277.
[76] Youssef, K. A. A. B., Abdullah, A. M., & Mohd, H. Z. (2016). Estimation of
Aerosols dispersion & Urban Air Quality evaluation over Malaysia using
MODIS Satellite. International Journal of Advanced Scientific and Technical
Research, 6(3), 2249-9954.
[77] You, W., Zang, Z., Zhang, L., Li, Y., Pan, X., & Wang, W. (2016). National-
scale estimates of ground-level PM2.5 concentration in China using
geographically weighted regression based on 3 km resolution MODIS
AOD. Remote Sensing, 8(3), 184.
© COP
UPM
78
[78] Guo, J., Xia, F., Zhang, Y., Liu, H., Li, J., Lou, M., He, J., Yan, Y., Wang, F.,
Min, M., & Zhai, P. (2017). Impact of diurnal variability and meteorological
factors on the PM 2.5-AOD relationship: Implications for PM 2.5 remote
sensing. Environmental Pollution, 221, 94-104.
[79] Bilal, M., Nichol, J. E., & Spak, S. N. (2017). A new approach for estimation of
fine particulate concentrations using satellite aerosol optical depth and binning
of meteorological variables. Aerosol and Air Quality Research, 17(2), 356-367.
[80] Jiang, M., Sun, W., Yang, G., & Zhang, D. (2017). Modelling Seasonal GWR of
Daily PM2. 5 with Proper Auxiliary Variables for the Yangtze River
Delta. Remote Sensing, 9(4), 346.
[81] Li, T., Shen, H., Zeng, C., Yuan, Q., & Zhang, L. (2017). Point-surface fusion
of station measurements and satellite observations for mapping PM2. 5
distribution in China: Methods and assessment. Atmospheric
Environment, 152, 477-489.
[82] Qiu, S., Chen, B., Wang, R., Zhu, Z., Wang, Y., & Qiu, X. (2017). Estimating
contaminant source in chemical industry park using UAV-based monitoring
platform, artificial neural network and atmospheric dispersion simulation. RSC
Advances, 7(63), 39726-39738.
[83] Yang, Y., Zheng, Z., Bian, K., Song, L., & Han, Z. (2018). Real-time profiling
of fine-grained air quality index distribution using uav sensing. IEEE Internet
of Things Journal, 5(1), 186-198.
[84] Xiong, X., Shah, S., & Pallis, J. M. (2018). Balloon/Drone-based Aerial
Platforms for Remote Particulate Matter Pollutant Monitoring. University of
Bridgeport, Bridgeport, CT 06604.
[85] Unit Golf Universiti Putra Malaysia Climate History(2017). Retrieved November
15, 2017, from http://www.myweather2.com/City-Town/Malaysia/Unit-Golf-
Universiti-Putra-Malaysia/climate-profile.aspx?month=7.
[86] Cheong, Y. L., Burkart, K., Leitão, P. J., & Lakes, T. (2013). Assessing weather
effects on dengue disease in Malaysia. International journal of environmental
research and public health, 10(12), 6319-6334
[87] Barnard, J. A. Unmanned Air Vehicle Features, Applications and Technologies.
http://www.barnardmicrosystems.com/media/presentations/UAV_Features_Ap
ps_and_Tech_V25.pdf
[88] Ferdoush, S., & Li, X. (2014). Wireless sensor network system design using
Raspberry Pi and Arduino for environmental monitoring applications. Procedia
Computer Science, 34, 103-110.
[89] LDO - LM1084IT-5.0 (2018). Retrieved February 10, 2018, from
https://www.itead.cc/ldo-lm1084it-5-0.html.
[90] Budde, M., Zhang, L., & Beigl, M. (2014, June). Distributed, low-cost particulate
matter sensing: scenarios, challenges, approaches. In Proc. 1st Int. Conf.
Atmospheric Dust.
© COP
UPM
79
[91] Particle / Dust Sensor Module DSM 501 Series(2012). Retrieved February 20,
2018, from https://www.elektronik.ropla.eu/pdf/stock/smy/dsm501.pdf.
[92] Offenhuber, D., & Schechtner, K. (Eds.). (2013). Accountability Technologies:
Tools for Asking Hard Questions. Springer.
[93] Zhou, Y., Zhou, Q., Kong, Q., & Cai, W. (2012). Wireless temperature &
humidity monitor and control system. In Consumer Electronics,
Communications and Networks (CECNet), 2012 2nd International Conference
on (pp. 2246-2250). IEEE.
[94] Tianlong, N. (2010). Application of Single Bus Sensor DHT11 in Temperature
Humidity Measure and Control System. Microcontrollers & Embedded
Systems, 6, 026.
[95] Han, Y. M., & Zhao, J. P. (2011). Design of temperature humidity wireless
sensor network node based on DHT11. Journal of Jinggangshan University
(Natural Science), 1, 018.
[96] Temperature and humidity module DHT11 Product Manual(2017). Retrieved
April 4, 2017, from
www.aosong.https://akizukidenshi.com/download/ds/aosong/DHT11.pdf
[97] Du, Y., Liu, C., Wu, D., & Jiang, S. (2014). Measurement of International
Roughness Index by Using-Axis Accelerometers and GPS. Mathematical
Problems in Engineering, 2014.
[98] Baumker, M., Przybilla, H. J., & Zurhorst, A. (2013). Enhancements in UAV
flight control and sensor orientation. Proceedings of the International Archives
of Photogrammetry, Remote Sensing and Spatial Information Science (UAV-g
2013), Rostock, Germany, 4-6.
[99] Ruslan, N. (2015). Air Polution Index (API) real time monitoring
system (Doctoral dissertation, Universiti Tun Hussein Onn Malaysia)