universiti teknikal malaysia melakaeprints.utem.edu.my/19154/1/electromyography (emg) analysis of...
TRANSCRIPT
UNIVERSITI TEKNIKAL MALAYSIA MELAKA
ELECTROMYOGRAPHY (EMG) ANALYSIS OF BACKPACK
WEIGHT ON MUSCLE ACTIVITIES OF THE LOWER AND
UPPER EXTREMITY
This report is submitted in accordance with the requirement of Universiti Teknikal
Malaysia Melaka (UTeM) for Bachelor’s Degree of Electrical Engineering
Technology (Industrial Automation & Robotics) with Honours
by
HII HIE KEE
B071310554
931115-13-5956
FACULTY OF ENGINEERING TECHNOLOGY
2016

DECLARATION
I hereby, declare that this report entitled “Electromyography (EMG) analysis of
backpack weight on muscle activities of the lower and upper extremity” is the result
of my own research except as cited in references.
Signature : ……………………………………………
Name : ……………………………………………
Date : ……………………………………………

APPROVAL
This report is submitted to the Faculty of Engineering Technology of UTeM as one of
the requirements for the award of Bachelor’s Degree of Electrical Engineering
Technology (Industrial Automation & Robotics) with Honours. The following are the
members of supervisory committee:
……………………………………………
(Supervisor)

i
DEDICATION
To my beloved parents, Hii Wie Ngii and Tiong Lee Kie for raising me become who
I am today. It is also dedicated to my supervisor who taught and guided me when I
faced the problem of doing this project.

ii
ABSTRACT
Nowadays, backpack become an important part of people’s everyday life.
Different people carry backpacks for different purposes. For students, they
normally fill backpacks with books and stationeries, while hikers fill them with
hiking tools, tents and supplies. Actually, there is some significant association
between backpacks weight and occurrence of back pain. When you put a heavy
weight on your shoulders more than 10% of your body weight [1], the weight’s
force can pull you backward. To compensate, you may bend forward at the hips or
arch your back. This can cause your spine to compress unnaturally. Over time this
can cause the shoulders to become rounded and the upper part of back become
curved. The purpose of the present study is to analyse the lower and upper
extremity muscle activities during the carriage of different backpacks. In this
project, the different size of backpack: (1) unloaded; (2) 10% body weight (BW)
load (in the form of backpack); (3) 15% BW load and (4) 20% BW load are
measured while fixing the gender as a constant. Subject is required to bear with 4
different size of load to walk 50m far of track. The electromyography (EMG)
signal from erector spinae (upper extremity) and biceps femoris (lower extremity)
were collected by using Visual Basic when the weight of backpack is vary. EMG
signal raw data will be analysed using MATLAB 2012 by frequency and time
domain algorithm. EMG signal analysis techniques which are EMG raw signal
view and Fast Fourier Transform (FFT) will be used for comparison. FFT is used
to identify the peak power spectrum of each different tasks. EMG signal
performance is present in terms of average voltage (�̅�) against period of time (s).
Through EMG signal, the performance of muscle contraction (PMC) able to be
identified based on the peak voltage from the identified phases. The graphical user
interface (GUI) is built to display the signal analyzed from lower and upper
extremity.
iii
ABSTRAK
Pada masa kini, beg galas menjadi bahagian penting dalam kehidupan seharian.
Setiap individu membawa beg galas untuk tujuan yang berbeza. Bagi pelajar, mereka
biasanya mengisi beg galas dengan buku-buku dan alat tulis, manakala pendaki bukit
atau gunung mengisi beg dengan alat mendaki, khemah dan bekalan. Sebenarnya,
terdapat beberapa hubungan yang signifikan antara beg galas dengan berat badan dan
berlakunya sakit belakang. Apabila anda meletakkan beban berat di atas bahu anda
lebih daripada 10% daripada berat badan anda [1], daya boleh menarik anda ke
belakang. Untuk mengimbangi, anda boleh bengkok ke hadapan pada bahagian
pinggang atau belakang. Hal ini boleh menyebabkan tulang belakang termampat
secara luar biasa. Jika berterusan, boleh menyebabkan bahu menjadi bulat dan
bahagian atas belakang menjadi melengkung. Tujuan kajian ini adalah untuk
menganalisis aktiviti-aktiviti otot hujung yang lebih rendah dan sederhana semasa
membawa beg galas yang berbeza. Dalam projek ini, saiz yang berbeza, beg: (1) tidak
beban; (2) 10% berat badan (BB) (dalam bentuk beg); (3) 15% beban lebih dari BB
dan (4) 20% beban lebih BB diukur manakala jantina ditetapkan malar. Subjek
dikehendaki menanggung 4 saiz beban dan berjalan sejauh 50m. Electromyography
isyarat (EMG) daripada pemasang spinae (hujung atas) dan bisep femoris (hujung
bawah) telah dikumpulkan dengan menggunakan Visual Basic apabila berat beg galas
adalah berbeza-beza. Isyarat data mentah EMG akan dianalisis menggunakan
MATLAB 2012 dengan kekerapan dan masa domain algoritma. EMG teknik analisis
isyarat yang melihat isyarat mentah EMG dan Jelmaan Furier pantas (FFT) akan
digunakan untuk perbandingan. FFT digunakan untuk membuat analisis isyarat
dengan mengenal pasti spectrum kuasa puncak dalam tugasan yang berbeza. EMG
prestasi isyarat hadir dari segi purata Voltan (�̅�) berbanding dengan tempoh masa (s).
Melalui isyarat EMG, prestasi penguncupan otot (PMC) dapat dikenal pasti
berdasarkan voltan puncak dari fasa yang dikenal pasti. GUI akan dibina untuk
memaparkan isyarat EMG dari hujung bawah dan atas badan subjek.

iv
ACKNOWLEDGEMENT
Firstly I would like to express my utmost gratitude and appreciation to my
supervisor, Madam Saleha Binti Mohamad Saleh, who has guided and encouraged me
along this semester. The supervision and supports from her is truly helping the
progression of my project.
The utmost appreciation also goes to my family. With their love and
encouragement, I am tough to go through the obstacles come to me. Last but not least
I would like to thanks all my friends especially who has helped me in every possible
way to complete this report.

v
TABLE OF CONTENTS
DEDICATION .............................................................................................................. i
ABSTRACT ................................................................................................................. ii
ABSTRAK .................................................................................................................... iii
ACKNOWLEDGEMENT .......................................................................................... iv
TABLE OF CONTENTS ............................................................................................. v
LIST OF TABLES .................................................................................................... viii
LIST OF FIGURES .................................................................................................... ix
LIST OF ABBREVATIONS, SYMBOLS AND NOMENCLATURES ................... xi
CHAPTER 1: INTRODUCTION ............................................................................. 1
1.1 Introduction ................................................................................................ 1
1.2 Problem Statement ..................................................................................... 1
1.3 Objectives .................................................................................................. 2
1.4 Scope .......................................................................................................... 2
1.5 Outline of the Project ................................................................................. 3
CHAPTER 2: LITERATURE REVIEW ................................................................. 4
2.1 Introduction ................................................................................................ 4
2.2 Backpack as a Daily Load for Schoolchildren........................................... 4
2.3 Low Back Pain (LBP) in Schoolchildren .................................................. 6
2.4 Lower and Upper Extremity ...................................................................... 9
2.4.1 How to Determine the Orientation of Erector Spinae ........................ 9
2.4.2 How to Determine the Orientation of Biceps Femoris ..................... 10
2.5 Electromyography (EMG) ....................................................................... 11
2.5.1 EMG Electrode Application ............................................................ 13
2.5.2 Detection and Processing of the EMG Signal .................................. 16

vi
2.6 Arduino Uno ............................................................................................ 17
2.7 Muscle Sensor V3 Kit .............................................................................. 19
2.8 Visual Basic (VB) .................................................................................... 20
2.9 MATLAB................................................................................................. 21
2.10 Fast Fourier Transform (FFT) ................................................................. 22
2.11 Short- time Fourier Transform (STFT) .................................................... 23
2.12 Wavelet Transform .................................................................................. 24
2.13 Spectrogram ............................................................................................. 25
2.13.1 RMS Value ....................................................................................... 26
2.14 Comparison between four different techniques uses to analyse EMG
Signal. ................................................................................................................. 27
2.15 Conclusion ............................................................................................... 28
CHAPTER 3: METHODOLOGY .......................................................................... 29
3.1 Introduction .............................................................................................. 29
3.2 Flowchart of the EMG Analysis .............................................................. 29
3.3 Block Diagram ......................................................................................... 31
3.4 Experiment Setup ..................................................................................... 32
3.5 Conclusion ............................................................................................... 33
CHAPTER 4: RESULTS AND DISCUSSION ..................................................... 34
4.1 Introduction .............................................................................................. 34
4.2 Methodology ............................................................................................ 34
4.3 Visual Basic 2010 .................................................................................... 37
4.3.1 Arduino Code ................................................................................... 37
4.3.2 Interface Arduino and Muscle sensor with PC ................................. 38
4.3.3 Save Serial Data ............................................................................... 39
4.3.4 Graph Plotted in GUI ....................................................................... 39
4.3.5 Coding for Calculation ..................................................................... 40
vii
4.3.6 iTextSharp ........................................................................................ 41
4.4 Matlab Used to Analyse the Graph .......................................................... 42
4.5 Mathematic Calculation and Formula...................................................... 43
4.6 Data Analysis ........................................................................................... 44
4.7 Comparison of graph ............................................................................... 54
4.8 Fast Fourier Transform (FFT) analysis .................................................... 56
4.9 Conclusion ............................................................................................... 60
CHAPTER 5: CONCLUSION AND RECOMMENDATION ............................ 61
5.1 Introduction .............................................................................................. 61
5.2 Summary of research ............................................................................... 61
5.3 Achievement of objective ........................................................................ 62
5.4 Project Limitation .................................................................................... 63
5.5 Recommendation ..................................................................................... 64
REFERENCES ......................................................................................................... 65
APPENDICES… ...................................................................................................... 69

viii
LIST OF TABLES
Table 2.1 The weekly average of daily backpack loads of Italian schoolchildren ..... 5
Table 2.2 School bag weight according to types of school ......................................... 6
Table 2.3 Perceived back pain and its association between the types of school .......... 8
Table 2.4 Specification of Arduino Microcontroller ATmega328 ............................. 17
Table 2.5 The features of Muscle Sensor V3 Kit ....................................................... 19
Table 2.6 Comparison of the method used to analyze EMG signals ........................ 27
Table 4.1 The procedure of data collection and graph analysis ................................. 35
Table 4.2 EMG raw signal subject 1 loading object 5kg to rack of 75cm ................ 46
Table 4.3 EMG raw signal subject 1 loading object 5kg to rack of 140cm .............. 47
Table 4.4 EMG raw signal subject 1 loading object 10kg to rack of 75cm .............. 48
Table 4.5 EMG raw signal subject 1 loading object 10kg to rack of 140cm ............ 49
Table 4.6 EMG raw signal subject 2 loading object 5kg to rack of 75cm ................ 50
Table 4.7 EMG raw signal subject 2 loading object 5kg to rack of 140cm .............. 51
Table 4.8 EMG raw signal subject 2 loading object 10kg to rack of 75cm .............. 52
Table 4.9 EMG raw signal subject 2 loading object 10kg to rack of 140cm ............ 53
Table 4.10 Comparison of graph in four different tasks ............................................ 55
Table 4.11 FFT graph analysis of four different cases of task (subject 1) ................. 58
Table 4.12 FFT graph analysis of four different cases of task (subject 2) ................. 59

ix
LIST OF FIGURES
Figure 2.1 The average backpack load and bodyweight ratio ...................................... 5
Figure 2.2 Defining of low back pain according to the shaded area ............................ 7
Figure 2.3 Period prevalence of low back pain by gender and age .............................. 8
Figure 2.4 The Position of erector Spinae .................................................................... 9
Figure 2.5 The Position of biceps femoris ................................................................. 10
Figure 2.6 Non- invasive (extrinsic) electrode ........................................................... 11
Figure 2.7 Invasive (intrinsic) electrode .................................................................... 12
Figure 2.8 The influence of the electrode location on the amplitude and frequency
spectrum of the signal ................................................................................................ 12
Figure 2.9 Signa Gel Electrode Gel, 250g ................................................................. 13
Figure 2.10 T816 electrode cloth, size 43 x 45 (mm) ................................................ 13
Figure 2.11 EMG Electrode Application Steps.......................................................... 15
Figure 2.12 T1 AD1298 bio amplifier chip ............................................................... 16
Figure 2.13 Arduino Uno ........................................................................................... 18
Figure 2.14 Muscle Sensor V3 Kit, Cytron Technologies ......................................... 19
Figure 2.15 GUI application in Visual Basic ............................................................. 20
Figure 2.16 Open Interactive digital signal processing tool ...................................... 21
Figure 2.17 Compute the Fourier Transform of the signal ........................................ 22
Figure 2.18 Example signal from STFT .................................................................... 23
Figure 2.19 Example signal from wavelet transform ................................................. 24
Figure 2.20 Sample graph of Spectrogram ................................................................ 25
Figure 2.21 Example Instantaneous RMS Voltage (Vrms) ....................................... 26
Figure 3.1 Flowchart of EMG signal analysis ........................................................... 30
Figure 3.2 Block diagram of EMG signal analysis .................................................... 31
Figure 3.3 Experiment setup ...................................................................................... 33
Figure 4.1 C++ coding in Arduino ............................................................................. 37
Figure 4.2 Function calling for serial port in vb.net .................................................. 38
Figure 4.3 aving data in “RTF” file ........................................................................... 39
Figure 4.4 Function calling for plotting real time graph ............................................ 39
Figure 4.5 The formula coding to calculated average value ...................................... 40
Figure 4.6 Record the data in PDF file ...................................................................... 41
x
Figure 4.7 Graph analysis in Matlab .......................................................................... 42
Figure 4.8 Coding of FFT graph function .................................................................. 56

xi
LIST OF ABBREVATIONS, SYMBOLS AND
NOMENCLATURES
EMG - Electromyography
BW - Body Weight
LBP - Low Back Pain
GUI - Graphical User Interface
FFT - Fast Fourier Transform
STFT - Short-Time Fourier Transform
RMS - Root Mean Square
N/A - Not Available
PMC - Performance of Muscle Contraction

1
CHAPTER 1 INTRODUCTION
1.1 Introduction
Nowadays, backpack become an important part of people’s everyday life.
Students often loaded their school bag with all the books and supplies for the whole
day. Observation based on the group amongst secondary school students, the repetitive
stress of carrying heavy school bags may contribute to the high prevalence of
musculoskeletal symptoms [2]. Pascoe et al. (1997) investigated the impact on posture
of youths aged 11-13 years while carrying a 17% BW load on their back [3]. A
backpack promoted significant forward lean of head, neck, shoulders and trunk. Other
studies are focused on the other backpackers like industrial, military or recreational.
The carry even higher loads and backpacks compared to students. There will be high
potential for back pain to occur among those backpackers.
1.2 Problem Statement
Studies over the last decade show 13-50 per cent of 11-17 year olds have
experienced back pain (Gardner& Kelly 2006, Vaughan et al 2007). For most parents,
it’s an achievement to get the children to school in time with everything they need.
The combined weight of everything they have to carry to and from school is causing
growing concern among back specialists. Overburdened can led to chronic back pain,
back stress fractures growth plate cartilage inflammation, back and shoulder nerve
damage. Most injuries in construction workers are sprains and strains of the muscles.
Construction work can also cause injuries to the joints, bones, and nerves. Workers
2
who do overhead work, tend to have many more shoulder and neck problems. The
more force user have to exert, the greater the stress on user body.
1.3 Objective
There are several objective that need to be achieved:
i. To identify the EMG signal from the upper extremity and lower extremity during the muscle contraction with the adding of different size of loads.
ii. To analyze the EMG signal using frequency and time domain algorithm.
iii. To build a Graphical user interface (GUI) to display the performance of the analysed method.
1.4 Scope
Some of important element must be consider in order to achieve the objective of the
study.
i. 10 Males university students of age 21- 24 years old, height: 170- 190cm, Weight: 60-80 kg. The subjects with this criteria are selected as the participants in this study. Those subjects with recent injury, postural deformities, spine surgery, and history of low back pain (LBP) are excluded.
ii. The backpacks was filled with sand weights to weigh 10%, 15% or 20% BW of each subject.
iii. Erector spinae (upper extremity), biceps femoris (lower extremity) muscle activities will be recorded using surface electromyography (SEMG).
iv. The data signal will be stored in Visual Basic. v. EMG signal raw data will be analysed using MATLAB 2012 by using
frequency and time domain algorithm. vi. EMG signal analysis techniques which are EMG raw signal view and Fast
Fourier Transform (FFT) will be used for comparison.
3
1.5 Outline of the project
This report consist of five chapter. First chapter is general introduction. In this
section, the reader will know about my project background, objective, problem
statement and scope in my research. The literature review in chapter 2 will indicate
which studies have already done on the same or related topics in my research.
Appropriate citations would include recent peer- reviewed articles published in
regionally, nationally, or internationally recognized professional journals and books.
Besides that, I will present about methodology in my chapter 3. In this chapter, I will
explain the method that will be used to collect the data, analyse the EMG signal and
display the performance of EMG signal. In chapter 4, I will present the result and
discussion which include the graph analysis in MATLAB, data collection and
information about the building of GUI in visual basic. Last but not the least, in chapter
5, I will cover about the summary of the research, achievement of objective, limitation
of project and future work as well.

4
CHAPTER 2 LITERATURE REVIEW
2.1 Introduction
This chapter is actually the reading of the work of others before commencing on
muscle activities of the lower and upper extremity of body and electromyography
signal analysis. Literature review can pave the way for better research. It help in
identifying the relevance of electromyography signal analysis on muscle activities.
The literature done based on the previous researches will help to recommend better
methods uses in this research. It might be aid to developing my study.
2.2 Backpack as a daily load for schoolchildren
According to the research done by Stefano, there has 34.8% of Italian
schoolchildren carry more than 30% of their bodyweight at least once a week,
exceeding limits proposed for adults [4]. The load that children most commonly carry
is their school bag or backpack. Stefano done the studied in the school catchment area
of Bresso, Milan. He ascertained the weight of the backpacks of all the year 6 children
at the school (n= 237, mean age 11-6 years [SD 0- 34], 119 girls). The data were
collected daily on 6 days at school (from Monday to Saturday) over a period of 3 weeks.
Refer to the table 2.1, the average load carried daily by Italian schoolchildren was
9.3kg (maximum 12.5kg), and the maximum load was 11.5kg (maximum 16.3kg).
5
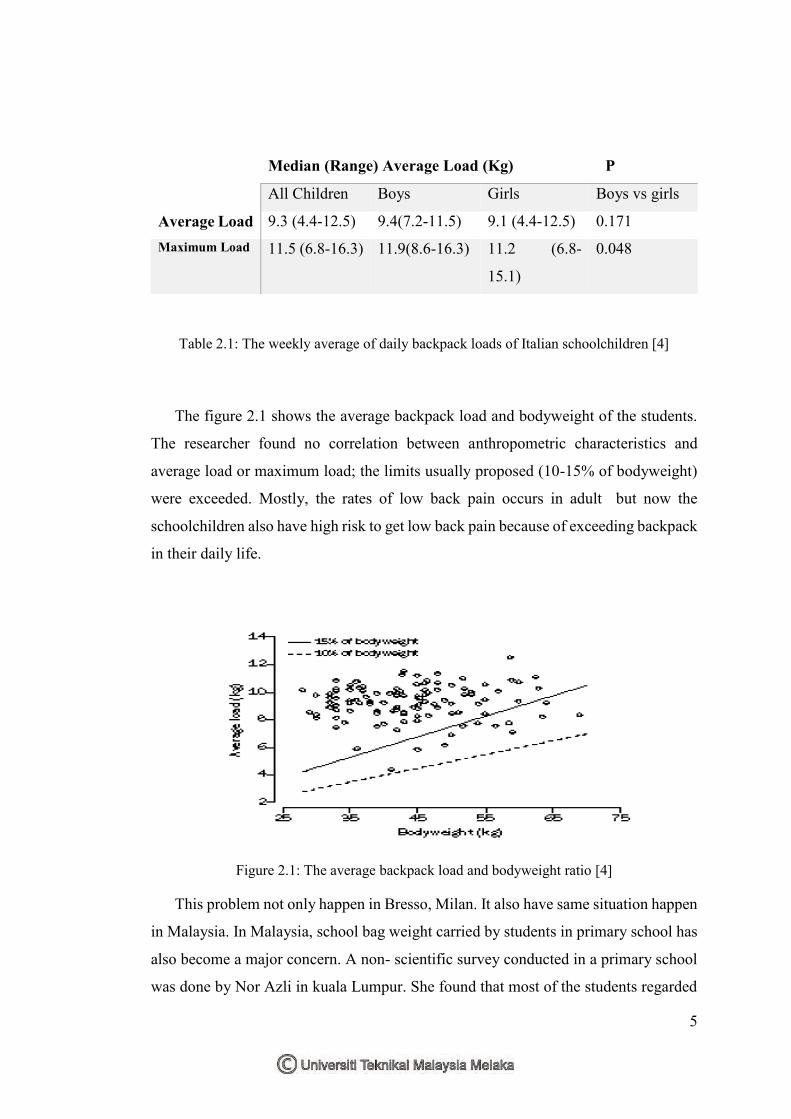
Table 2.1: The weekly average of daily backpack loads of Italian schoolchildren [4]
The figure 2.1 shows the average backpack load and bodyweight of the students.
The researcher found no correlation between anthropometric characteristics and
average load or maximum load; the limits usually proposed (10-15% of bodyweight)
were exceeded. Mostly, the rates of low back pain occurs in adult but now the
schoolchildren also have high risk to get low back pain because of exceeding backpack
in their daily life.
Figure 2.1: The average backpack load and bodyweight ratio [4]
This problem not only happen in Bresso, Milan. It also have same situation happen
in Malaysia. In Malaysia, school bag weight carried by students in primary school has
also become a major concern. A non- scientific survey conducted in a primary school
was done by Nor Azli in kuala Lumpur. She found that most of the students regarded
Median (Range) Average Load (Kg) P
All Children Boys Girls Boys vs girls
Average Load 9.3 (4.4-12.5) 9.4(7.2-11.5) 9.1 (4.4-12.5) 0.171 Maximum Load 11.5 (6.8-16.3) 11.9(8.6-16.3) 11.2 (6.8-
15.1)
0.048

6
carrying school bag as heavy job [20]. A recent study by Fazrolrozi and Rambely
(2008) reported that more than 90% of the first year students (mean age 6.5 years) and
more than 70% of the second year students (mean age 7.5 years) carried backpack
loads of greater than 15% of their body weight to school nearly every day[21]. Hence,
in this study three primary schools were randomly selected from a list Naional Sschool
(NS), Chinese Medium School (CMS) and Tamil Medium School (TMS) schools in
Kuala Lumpur in order to obtain a representative cross section of Kuala Lumpur
primary school. Refer to the statistical analysis done by Nur Azli, the mean weight
of school bags carried by the students was 6.40 (±2.51) kg. Based on the types of
school, the mean weight of school bags was 4.55(±1.62) kg, 8.53((±1.94) kg and 6.06
(±2.09)kg for NS, CMS and TMS, respectively. The students who carried school bag
which more than 10% of body weight is 80.1% [20]. Table 2.2 below show the school
bag weight carried by Malaysians according to three different types of school:
Table 2.2: School bag weight according to types of school [20]
NS CMS TMS Total Mean Schoolbag Weight (SD), Kg 4.55 (1.62) 8.54 (1.94) 6.06 (2.09) 6.40 (2.51) Mean Weight of necessary learning
materials (SD), Kg 3.91 (1.45) 8.54 (1.94 4.09 (1.81) 4.80 (1.97)
Mean weight of unnecessary
materials (SD), kg 0.64 (0.91) 2.18 (1.49) 1.96 (1.56) 1.60 (1.57)
Mean % of schoolbag weight of
body weight (SD) 11.72 (4.82) 22.02 (7.32) 16.04 (7.10) 16.64 (7.76)
Carried schoolbag>10% of body
weight, n (%) 72 (60.5) 120 (98.4) 97 (82.9) 289 (80.1)
2.3 Low back pain (LBP) in schoolchildren
Low backpack is common in young people and has a marked impact on daily life
although it is unlikely to lead them to seek doctor. In common with other studies of
low back pain in children, prevalence increase across the teen age years (Fairbank et
al., 1984; Nissinen et al.,1994; Grimmer and Williams, 2000) [6],[7],[8]. From the
research done by Kath D. Watson et al. [5], the target a group of schoolchildren aged
7
between 11 and 14 years to determine the one month period prevalence of low back
pain, symptom characteristics and related disability cause by low back pain. The
researcher conducted a cross- sectional survey in secondary schools in Cheshire and
North Derbyshire, North- West England. School children aged between 11 and 14
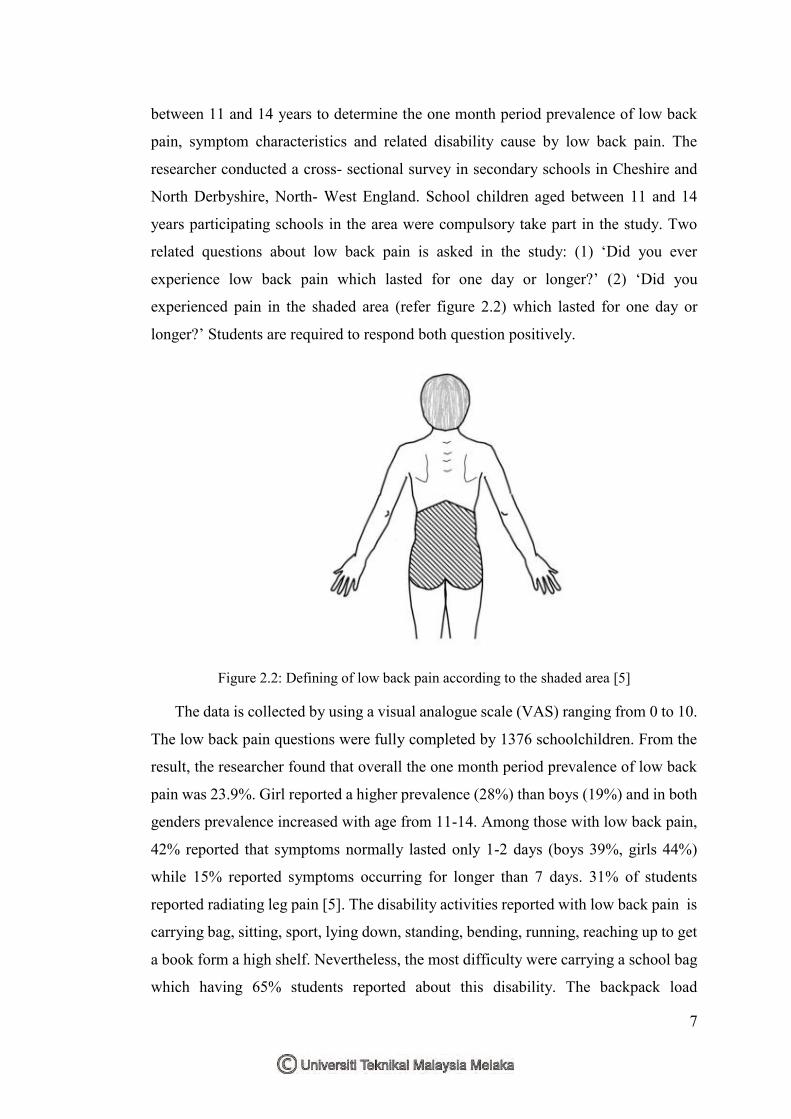
years participating schools in the area were compulsory take part in the study. Two
related questions about low back pain is asked in the study: (1) ‘Did you ever
experience low back pain which lasted for one day or longer?’ (2) ‘Did you
experienced pain in the shaded area (refer figure 2.2) which lasted for one day or
longer?’ Students are required to respond both question positively.
Figure 2.2: Defining of low back pain according to the shaded area [5]
The data is collected by using a visual analogue scale (VAS) ranging from 0 to 10.
The low back pain questions were fully completed by 1376 schoolchildren. From the
result, the researcher found that overall the one month period prevalence of low back
pain was 23.9%. Girl reported a higher prevalence (28%) than boys (19%) and in both
genders prevalence increased with age from 11-14. Among those with low back pain,
42% reported that symptoms normally lasted only 1-2 days (boys 39%, girls 44%)
while 15% reported symptoms occurring for longer than 7 days. 31% of students
reported radiating leg pain [5]. The disability activities reported with low back pain is
carrying bag, sitting, sport, lying down, standing, bending, running, reaching up to get
a book form a high shelf. Nevertheless, the most difficulty were carrying a school bag
which having 65% students reported about this disability. The backpack load

8
contributes to low back pain [9], [10] and also becoming a disability of carrying
backpack after their suffering the low back pain.
Figure 2.3: Period prevalence of low back pain by gender and age [5]
At the same research done by Nur Azli, the occurrence in three different types
show high percentage which is 66.7% to 87.4%. The occurrence is highest in NS in
which 104 of 119 students reported back pain (87.4%) [20].
Table 2.3: Perceived back pain and its association between the types of school [20]
Back pain NS n(%) CMS n(%) TMS n(%) Total n X2 p value
Yes 104 (87.4%) 83 (68.0%) 78 (67.0%) 265 16.64 0.00
No 15 (12.6%) 39 (32.0%) 39 (33.0%) 93
Total 119 122 117 358
9
2.4 Lower and Upper Extremity
In my study, I am going to analyse the performance of Electromyography (EMG)
signal at Erector spinae (upper extremity) and biceps femoris (lower extremity).
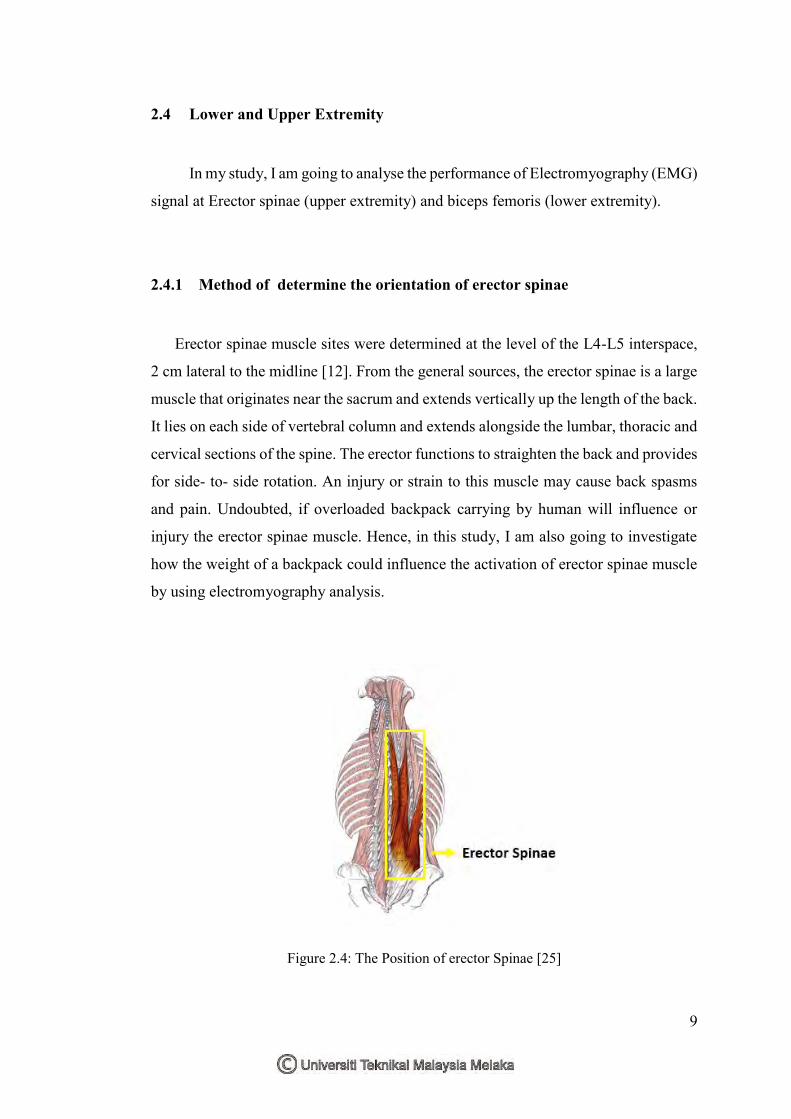
2.4.1 Method of determine the orientation of erector spinae
Erector spinae muscle sites were determined at the level of the L4-L5 interspace,
2 cm lateral to the midline [12]. From the general sources, the erector spinae is a large
muscle that originates near the sacrum and extends vertically up the length of the back.
It lies on each side of vertebral column and extends alongside the lumbar, thoracic and
cervical sections of the spine. The erector functions to straighten the back and provides
for side- to- side rotation. An injury or strain to this muscle may cause back spasms
and pain. Undoubted, if overloaded backpack carrying by human will influence or
injury the erector spinae muscle. Hence, in this study, I am also going to investigate
how the weight of a backpack could influence the activation of erector spinae muscle
by using electromyography analysis.
Figure 2.4: The Position of erector Spinae [25]
10
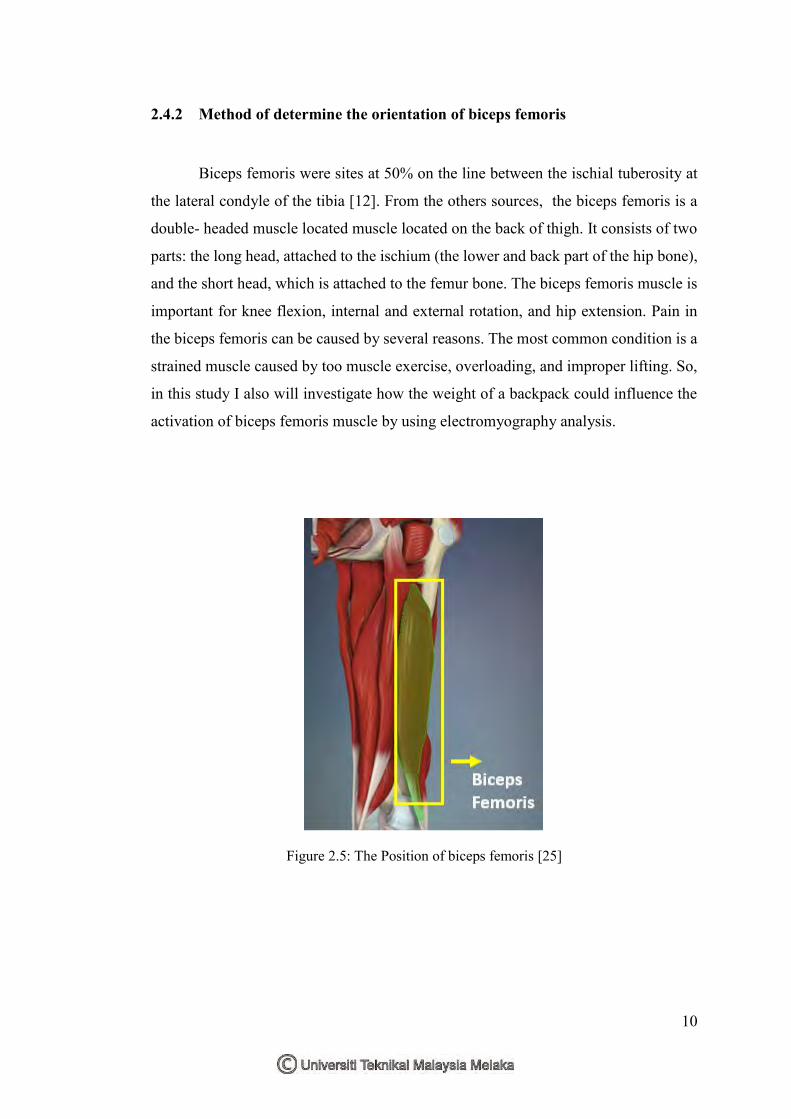
2.4.2 Method of determine the orientation of biceps femoris
Biceps femoris were sites at 50% on the line between the ischial tuberosity at
the lateral condyle of the tibia [12]. From the others sources, the biceps femoris is a
double- headed muscle located muscle located on the back of thigh. It consists of two
parts: the long head, attached to the ischium (the lower and back part of the hip bone),
and the short head, which is attached to the femur bone. The biceps femoris muscle is
important for knee flexion, internal and external rotation, and hip extension. Pain in
the biceps femoris can be caused by several reasons. The most common condition is a
strained muscle caused by too muscle exercise, overloading, and improper lifting. So,
in this study I also will investigate how the weight of a backpack could influence the
activation of biceps femoris muscle by using electromyography analysis.
Figure 2.5: The Position of biceps femoris [25]