university assessment committee annual institutional effectiveness · pdf filesnapshot of...
TRANSCRIPT

August 29, 2011
University Assessment CommitteeAnnual Institutional Effectiveness
Report
Purpose of Assessment
Assessment Process
Key Milestones
Assessing Our Assessment Process
Results and Changes• 2009-10 results• Implemented(2009-10) and planned (2010-11) changes• linkages between strategic planning and assessment
Success Stories
Next Steps
2University Assessment Committee Annual Report

Are current practices effective?
Are student learning outcomes being achieved?
Are we meeting national, regional, and state standards?
How can we continue to improve performance?
Purpose of Assessment
University Assessment Committee Annual Report 3
University Assessment Committee Annual Report 4
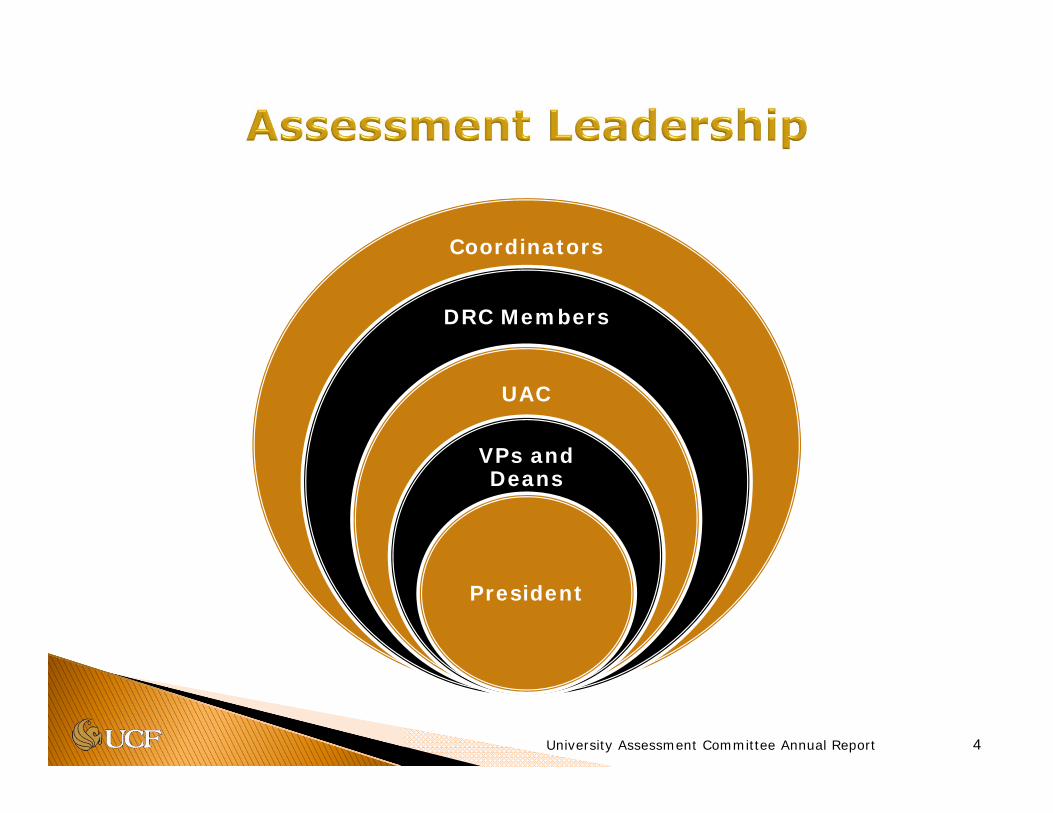
Coordinators
DRC Members
UAC
VPs and Deans
President

Change
University Assessment Committee Annual Report 5
Plan
Measure
Analyze
Continuous Improvement

354 programs and units report• Centralized online reporting system • Ongoing reviews and feedback by DRC
Year round process
September – Coordinators submit final results and plans
October – DRCs review results and plans
November to December – UAC final review
Assessment Scope and Schedule
University Assessment Committee Annual Report 6

7University Assessment Committee Annual Report

University Assessment Committee Annual Report 8
Key Milestones
2006 SACS Reaffirmation2002 Web Enabled Reports
2001 OEAS Established1996 UAC Established
2008 Enhanced Web Reports
2009 Implemented Assessment Rubrics
2010 Integrate Strategic Planning
2012 Complete SACS Five-Year Report
2011 Rubric Reports
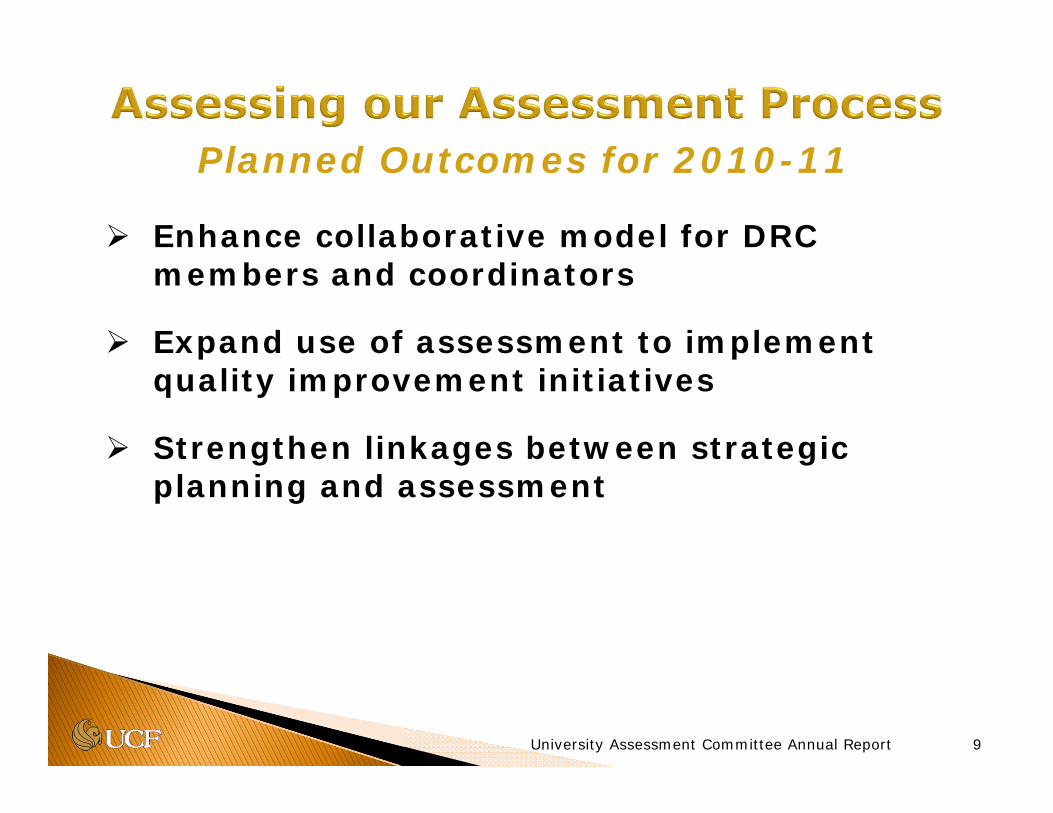
Enhance collaborative model for DRC members and coordinators
Expand use of assessment to implement quality improvement initiatives
Strengthen linkages between strategic planning and assessment
9University Assessment Committee Annual Report
Planned Outcomes for 2010-11
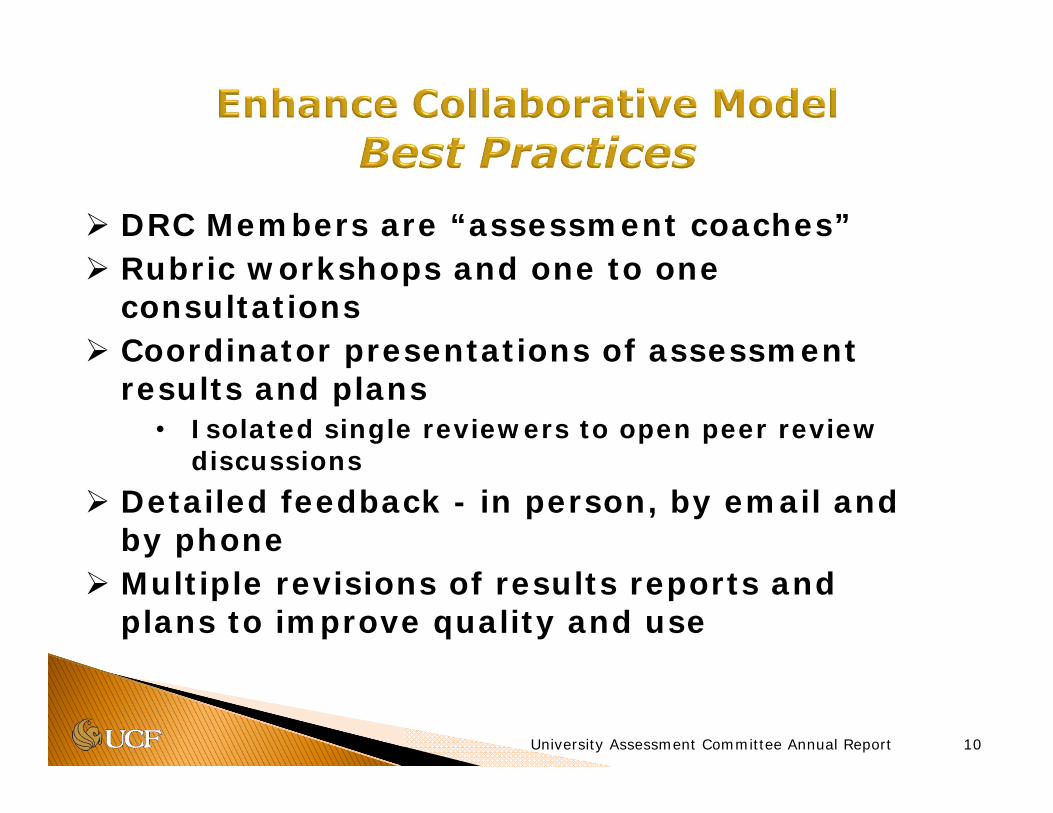
DRC Members are “assessment coaches” Rubric workshops and one to one
consultations Coordinator presentations of assessment
results and plans• Isolated single reviewers to open peer review
discussions
Detailed feedback - in person, by email and by phone
Multiple revisions of results reports and plans to improve quality and use
10University Assessment Committee Annual Report
11University Assessment Committee Annual Report
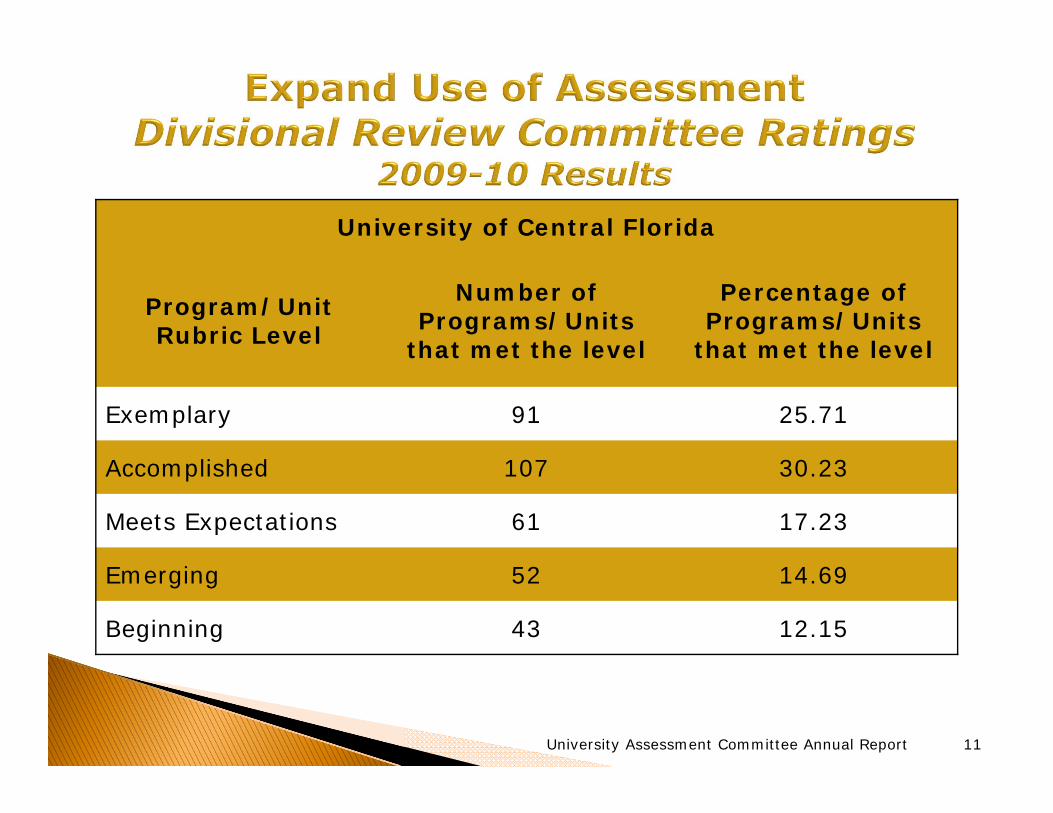
University of Central Florida
Program/Unit Rubric Level
Number of Programs/Units
that met the level
Percentage of Programs/Units
that met the level
Exemplary 91 25.71
Accomplished 107 30.23
Meets Expectations 61 17.23
Emerging 52 14.69
Beginning 43 12.15
12University Assessment Committee Annual Report
1
12
5
5
1
2
7
4
1
1
15
9
5
2
4
6
2
6
3
1
11
8
7
10
1
1
7
12
6
13
20
5
10
4
3
7
5
8
20
4
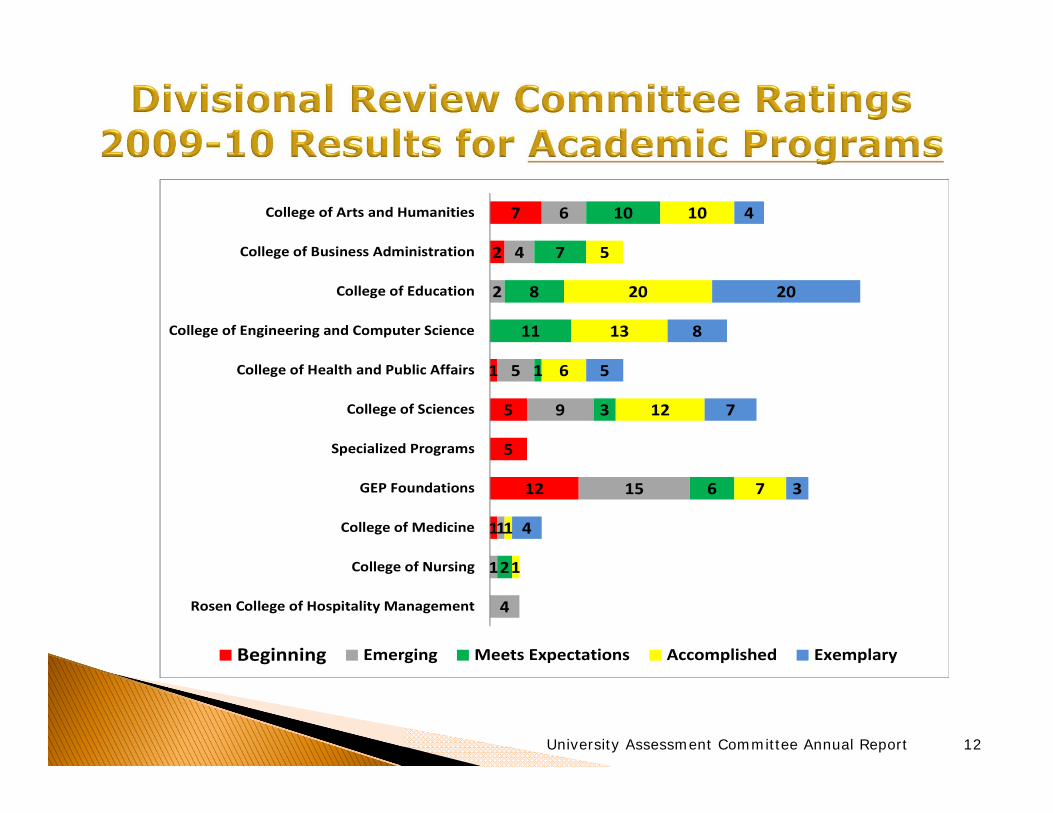
Rosen College of Hospitality Management
College of Nursing
College of Medicine
GEP Foundations
Specialized Programs
College of Sciences
College of Health and Public Affairs
College of Engineering and Computer Science
College of Education
College of Business Administration
College of Arts and Humanities
Beginning Emerging Meets Expectations Accomplished Exemplary
13University Assessment Committee Annual Report
4
1
5
2
1
1
1
2
3
2
4
1
1
15
1
4
4
3
2
3
11
7
5
6
7
2
2
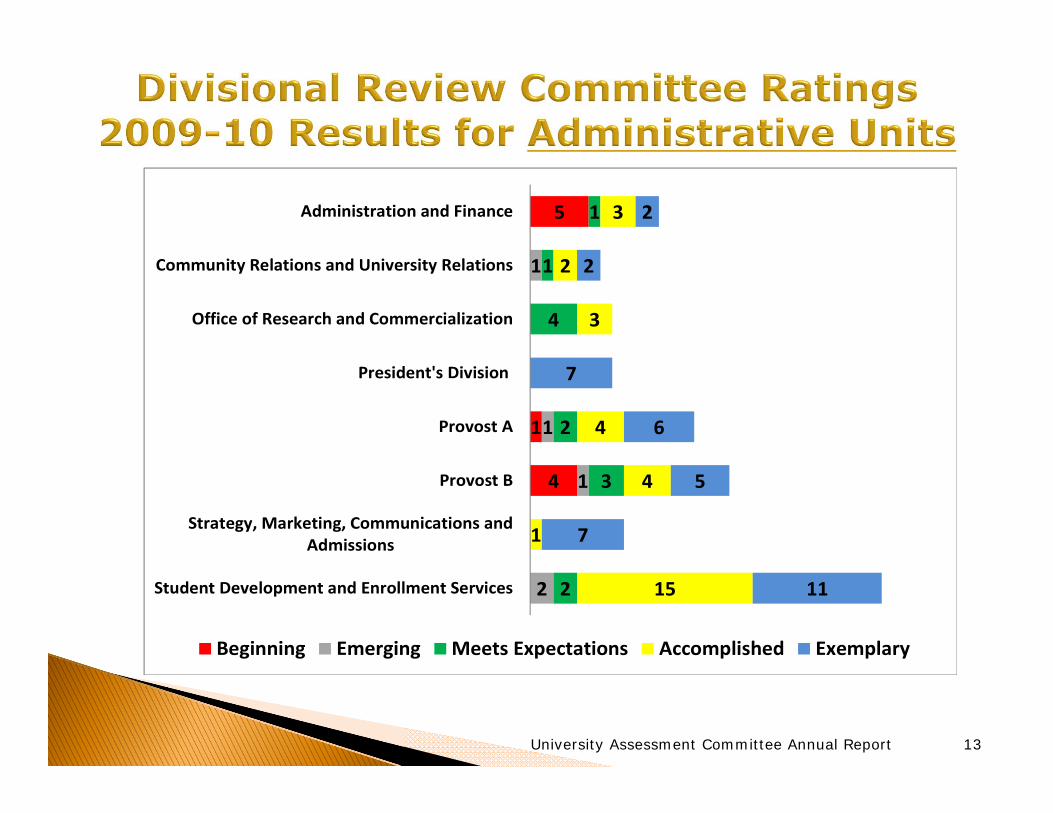
Student Development and Enrollment Services
Strategy, Marketing, Communications andAdmissions
Provost B
Provost A
President's Division
Office of Research and Commercialization
Community Relations and University Relations
Administration and Finance
Beginning Emerging Meets Expectations Accomplished Exemplary
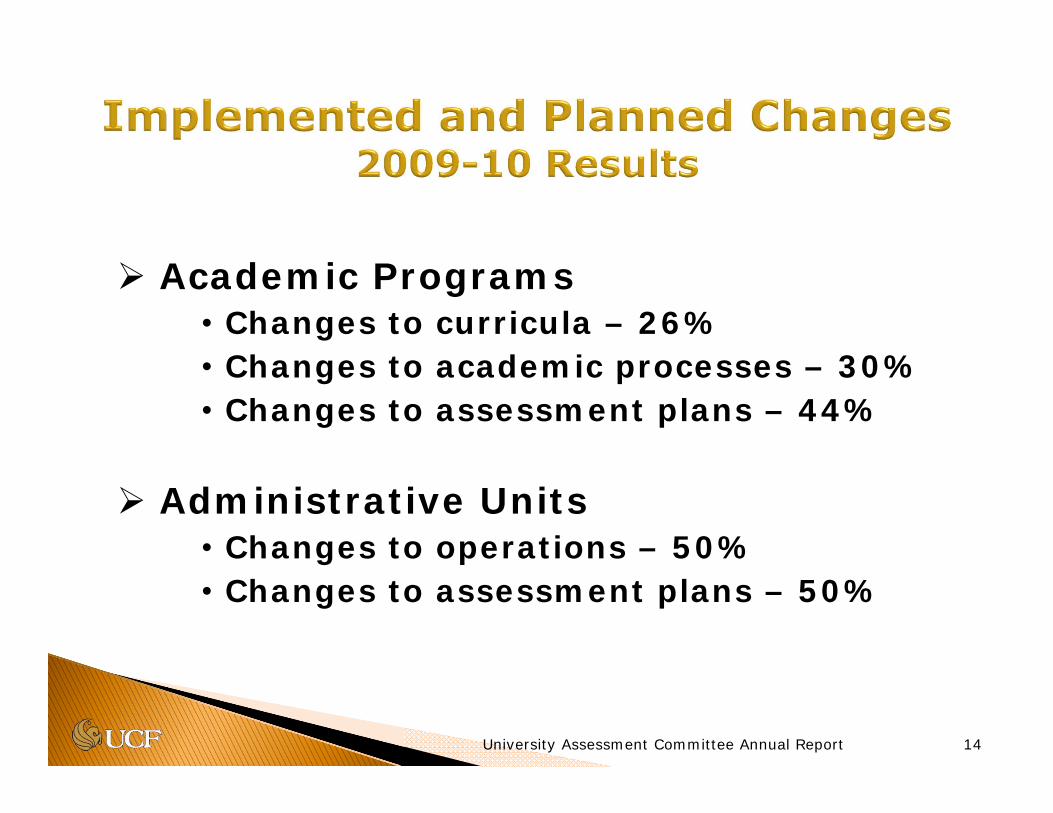
Academic Programs• Changes to curricula – 26%• Changes to academic processes – 30% • Changes to assessment plans – 44%
Administrative Units• Changes to operations – 50%• Changes to assessment plans – 50%
14University Assessment Committee Annual Report
Common leadership and support
University strategic plan linkages integrated into plan rubric
Common terminology in assessment and strategic planning efforts
15University Assessment Committee Annual Report
16University Assessment Committee Annual Report
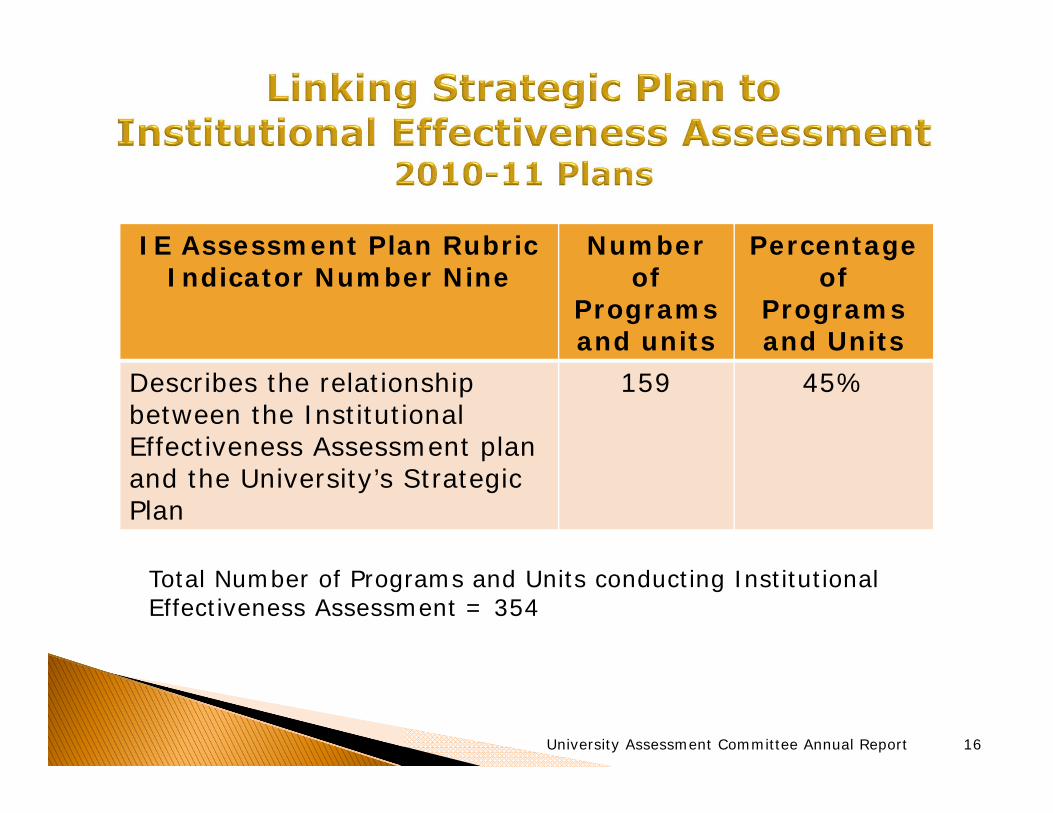
IE Assessment Plan Rubric Indicator Number Nine
Number of
Programs and units
Percentage of
Programs and Units
Describes the relationship between the Institutional Effectiveness Assessment plan and the University’s Strategic Plan
159 45%
Total Number of Programs and Units conducting Institutional Effectiveness Assessment = 354

Academic program• Doctor of Medicine - M.D. Assessment coordinators: Drs. Dan Gardner, Basma
Selim and Jonathan Kibble
Dean’s office • College of Health and Public Affairs,
Dean’s OfficeAssessment coordinators: Drs. Dawn Oetjen, Susan
Gosnell, Pam Kirby and Ronnie Korosec
Administrative unit• Office of Experiential LearningAssessment coordinator: Dr. Sheri Dressler
Success Stories
University Assessment Committee Annual Report 17

Student learning and progress
Student satisfaction and engagement
Program improvement
LCME accreditation (Preliminary 2008, Provisional 2010, Full 2013)
UCF assessment and SACS accreditation
Doctor of Medicine - M.D. Perspectives on Assessment
University Assessment Committee Annual Report 18
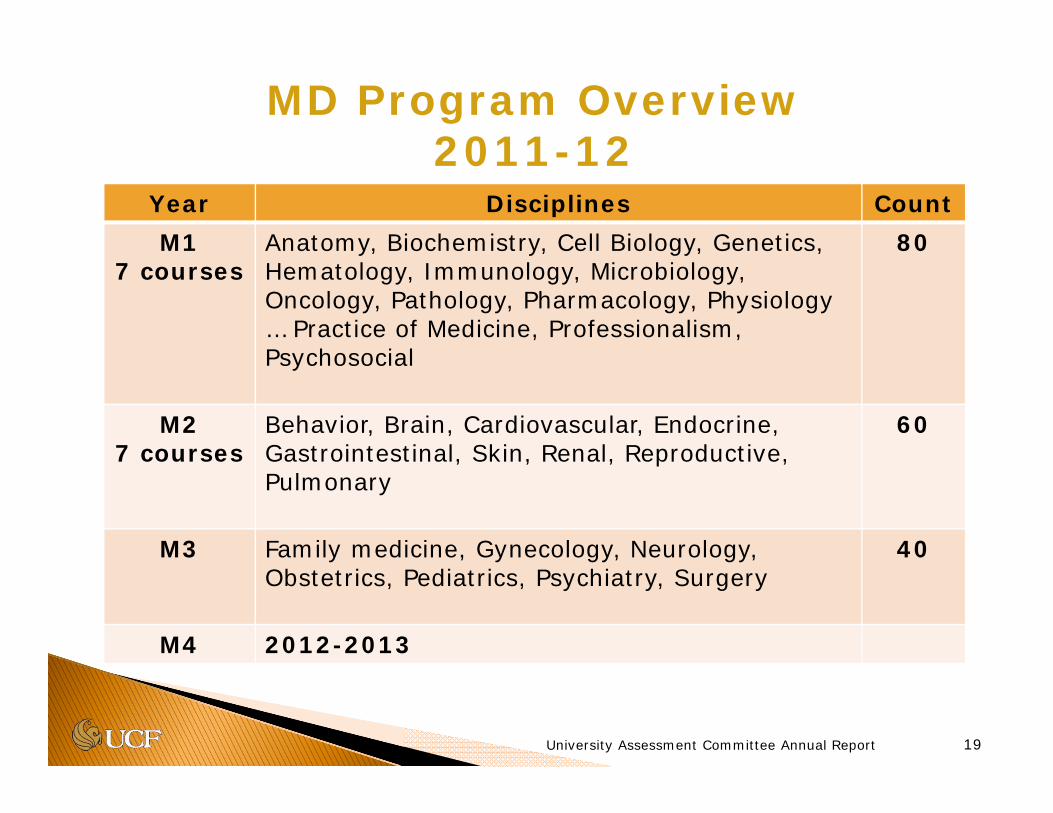
Year Disciplines Count
M17 courses
Anatomy, Biochemistry, Cell Biology, Genetics, Hematology, Immunology, Microbiology, Oncology, Pathology, Pharmacology, Physiology … Practice of Medicine, Professionalism, Psychosocial
80
M27 courses
Behavior, Brain, Cardiovascular, Endocrine, Gastrointestinal, Skin, Renal, Reproductive, Pulmonary
60
M3 Family medicine, Gynecology, Neurology, Obstetrics, Pediatrics, Psychiatry, Surgery
40
M4 2012-2013
MD Program Overview2011-12
University Assessment Committee Annual Report 19
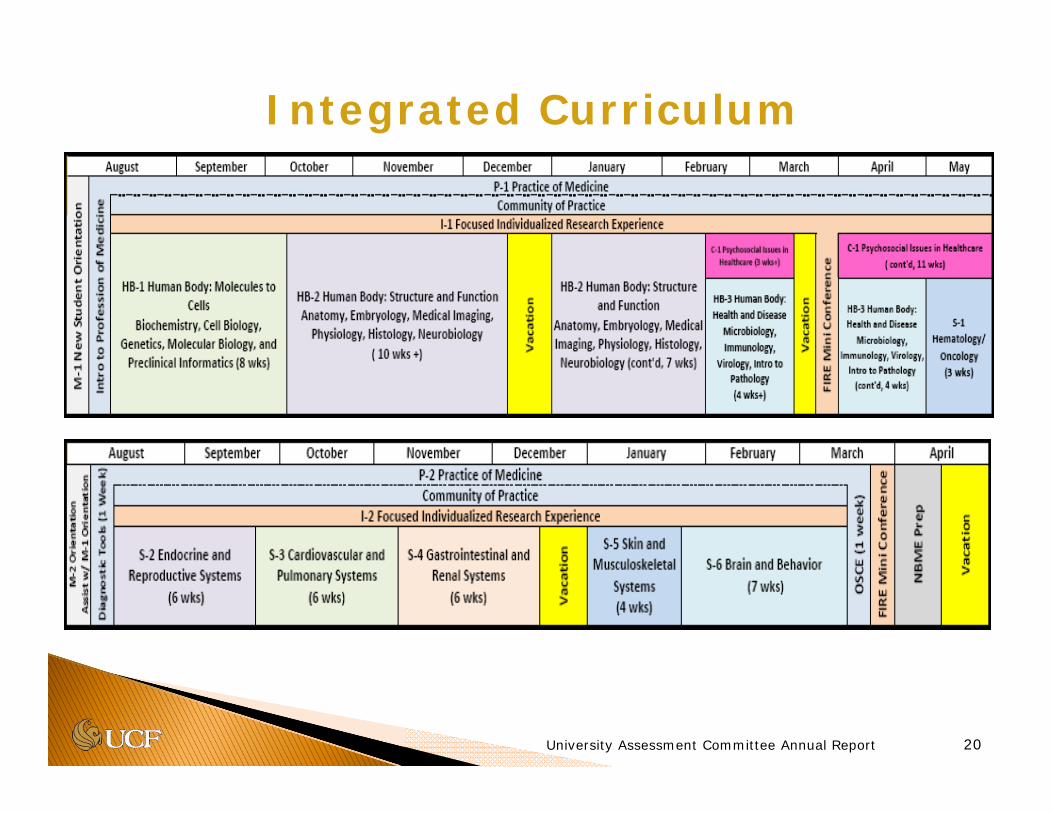
Integrated Curriculum
University Assessment Committee Annual Report 20

Student Perspectives - one course 2009-10
University Assessment Committee Annual Report 21
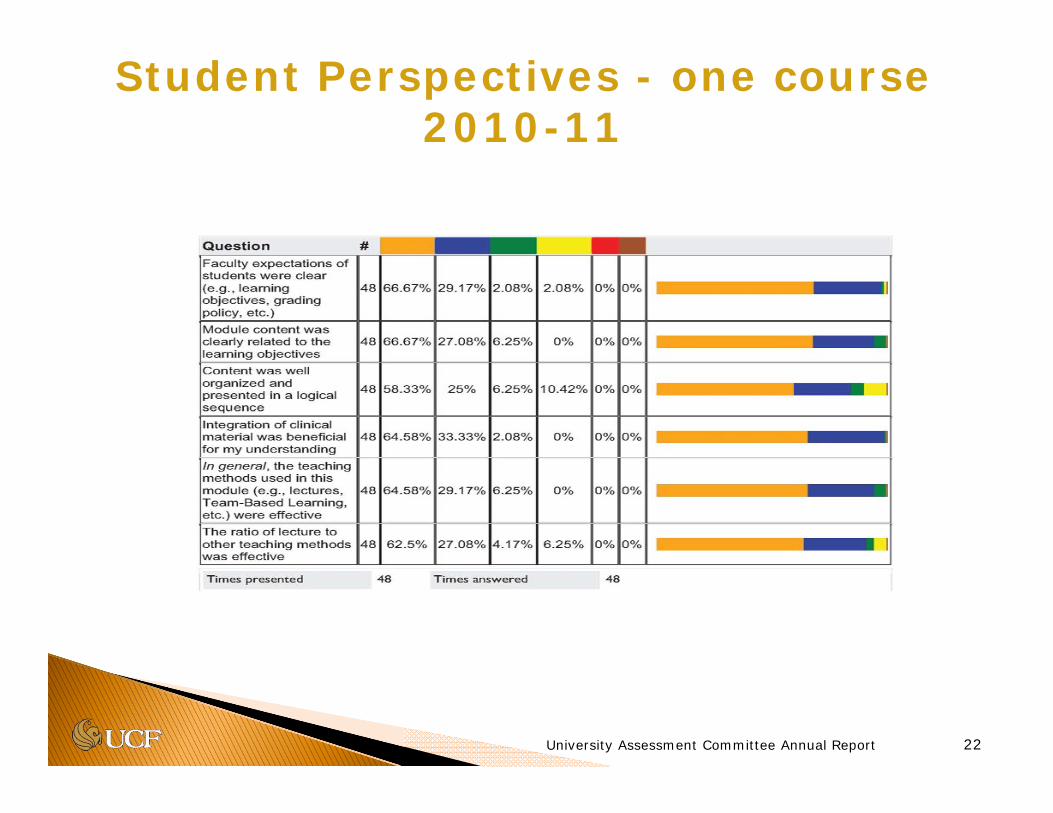
University Assessment Committee Annual Report 22
Student Perspectives - one course 2010-11
23

Snapshot of PerformanceNBME and CBSE
Date of Administration Mean* SD Min Max % Passing (n)
August 2009 39.7 3.0 36 50 0.0 (0)
December 2009 47.7 5.6 36 59 0.0 (0)
May 2010 54.8 5.8 39 66 2.6 (1)
December 2010 61.3 6.8 48 77 33.3 (13)
March 2011 68.2 8.3 54 88 66.7 (26)
*Based on complete data sets for 39 students; mean scores across administrations are significantly different, as measured by a one-way repeated measures ANOVA, F(4, 152) = 292.66, p < 0.001, η2
p = 0.89
39.7
47.7
54.8
61.3
68.2
0
10
20
30
40
50
60
70
80
August 2009 December2009
May 2010 December2010
March 2011
NB
ME M
ean
Sco
re
Date of Administration
24
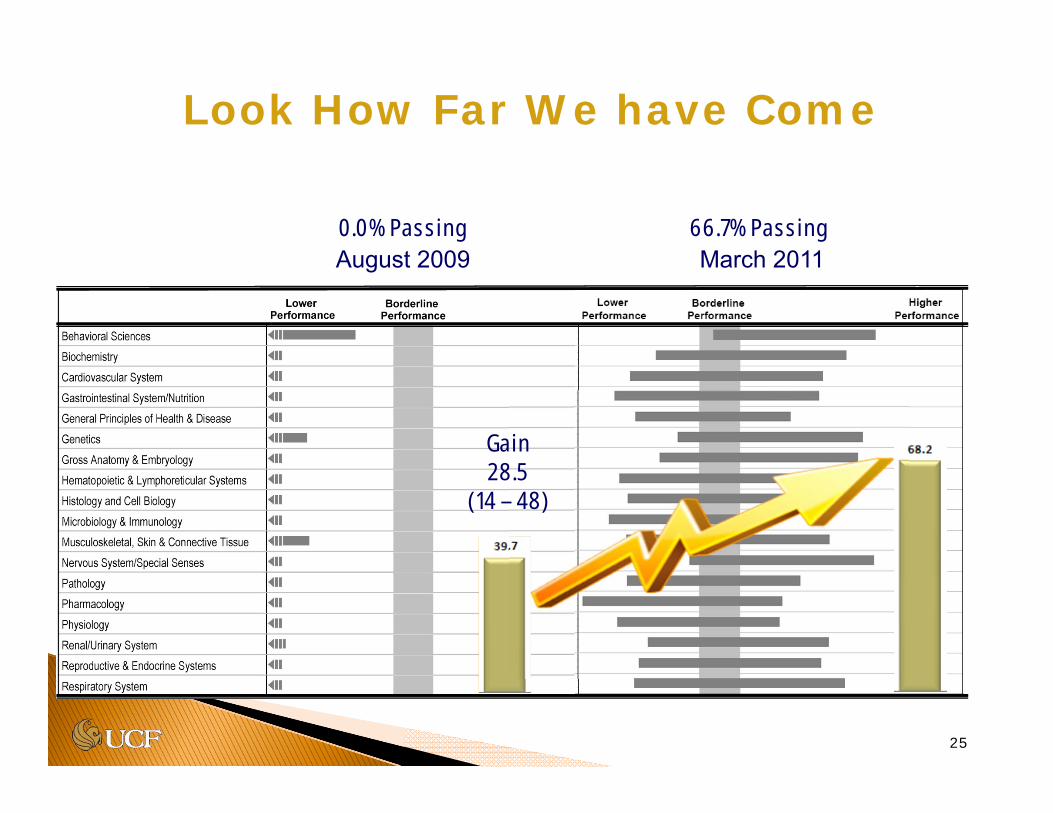
Look How Far We have Come
March 2011August 2009
Gain28.5
(14 – 48)
0.0% Passing 66.7% Passing
25

Towards Success on USMLE Step 1
University Assessment Committee Annual Report 26
Correlations with USMLE Step 1: NBME Progress Tests and Module Exams
0
0.1
0.2
0.3
0.4
0.5
0.6
0.7
0.8
0.9
0 10 20 30 40 50 60 70
UCFCOM Exams
NBME
Cor
rela
tion
coef
ficie
nt
Week of curriculum
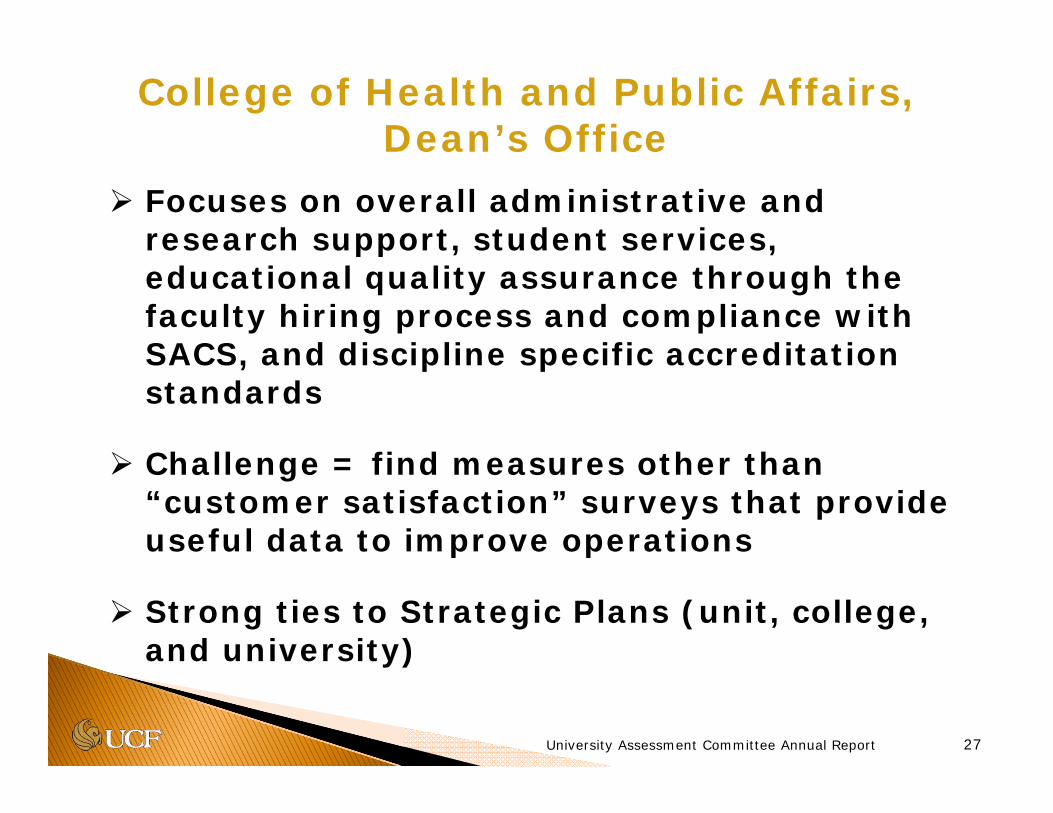
Focuses on overall administrative and research support, student services, educational quality assurance through the faculty hiring process and compliance with SACS, and discipline specific accreditation standards
Challenge = find measures other than “customer satisfaction” surveys that provide useful data to improve operations
Strong ties to Strategic Plans (unit, college, and university)
College of Health and Public Affairs, Dean’s Office
University Assessment Committee Annual Report 27
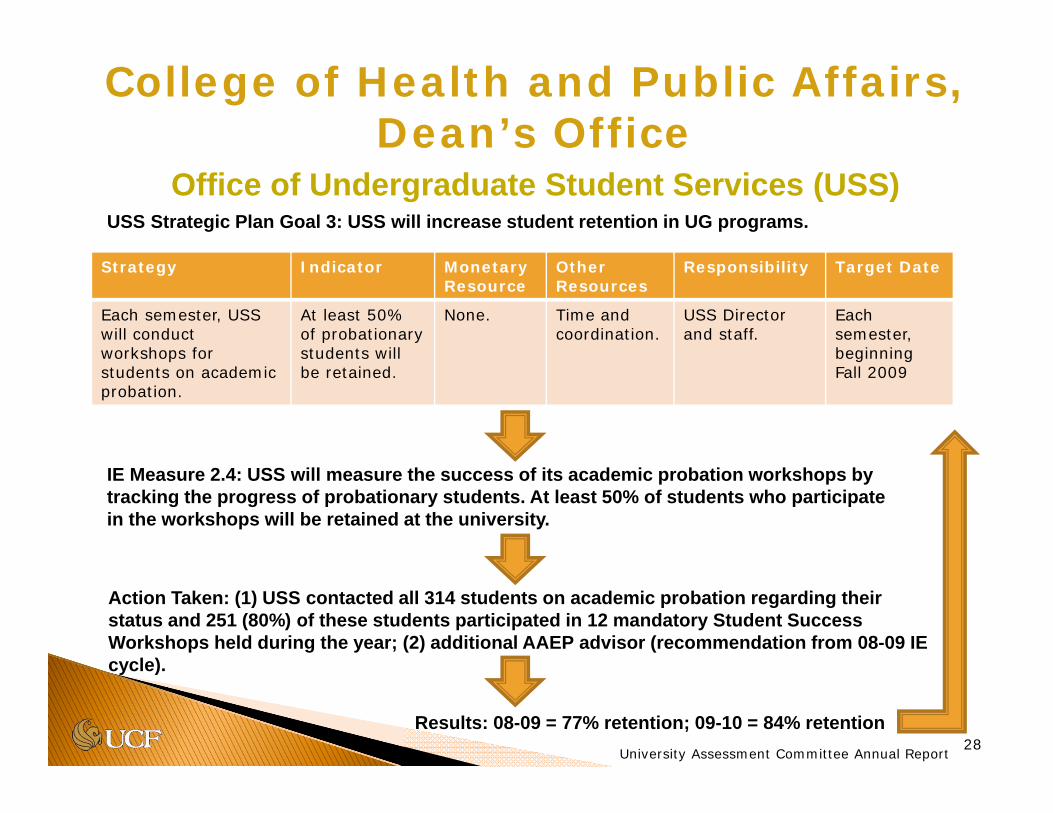
Strategy Indicator Monetary Resource
Other Resources
Responsibility Target Date
Each semester, USS will conduct workshops for students on academic probation.
At least 50% of probationary students will be retained.
None. Time and coordination.
USS Director and staff.
Each semester, beginning Fall 2009
College of Health and Public Affairs, Dean’s Office
University Assessment Committee Annual Report28
USS Strategic Plan Goal 3: USS will increase student retention in UG programs.
IE Measure 2.4: USS will measure the success of its academic probation workshops by tracking the progress of probationary students. At least 50% of students who participate in the workshops will be retained at the university.
Action Taken: (1) USS contacted all 314 students on academic probation regarding their status and 251 (80%) of these students participated in 12 mandatory Student Success Workshops held during the year; (2) additional AAEP advisor (recommendation from 08-09 IE cycle).
Results: 08-09 = 77% retention; 09-10 = 84% retention
Office of Undergraduate Student Services (USS)
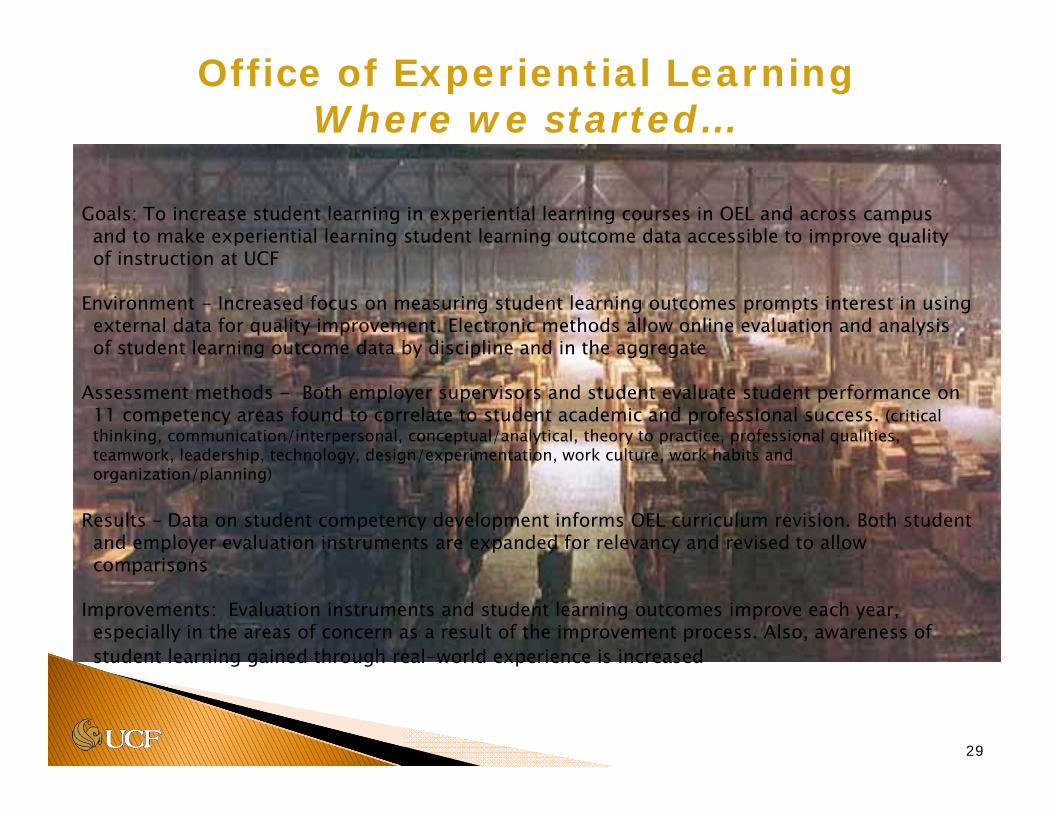
Office of Experiential Learning Where we started…
Goals: To increase student learning in experiential learning courses in OEL and across campus and to make experiential learning student learning outcome data accessible to improve quality of instruction at UCF
Environment - Increased focus on measuring student learning outcomes prompts interest in using external data for quality improvement. Electronic methods allow online evaluation and analysis of student learning outcome data by discipline and in the aggregate
Assessment methods - Both employer supervisors and student evaluate student performance on 11 competency areas found to correlate to student academic and professional success. (critical thinking, communication/interpersonal, conceptual/analytical, theory to practice, professional qualities, teamwork, leadership, technology, design/experimentation, work culture, work habits and organization/planning)
Results – Data on student competency development informs OEL curriculum revision. Both student and employer evaluation instruments are expanded for relevancy and revised to allow comparisons
Improvements: Evaluation instruments and student learning outcomes improve each year, especially in the areas of concern as a result of the improvement process. Also, awareness of student learning gained through real-world experience is increased
29
A1
A2
A3
A4
B1
B2
B4
C1
C2
C3
D1
D2
D4
D5
E3
E1
F1 F2F3
G2
H1
H2
G3
H3
I1
I2
J1
J2
J3
J4
K1
K2
K3
K4
K5I3
B3
E2
E4
G1
4.35
4.40
4.45
4.50
4.55
4.60
4.65
4.70
4.75
0.45 0.50 0.55 0.60 0.65 0.70 0.75 0.80STDEV
MEA
NExit Profile / Event Management
Respects Diversity
Ab. Work with Others
Prof.Attitude
Work Quality
Accountability
Pos. AtitudeSelfConfidence
Attendance
Punctuality
Gives Direction
Motivates Others
Conflict Management
A1
A3
A4
B1
B2B3
B4
C2
D1
D2
D3
D4
D5
E1
E2
E3
F1
F2F3
G2
H2
G3
H3I1
I2J1
J2
J3
J4 K1K2
K3
K4
I3
A2C1
C3
E4
G1
H1
K5-0.10
-0.05
0.00
0.05
0.10
0.15
0.20
0.25
-0.15 -0.10 -0.05 0.00 0.05 0.10 0.15 0.20
STDEV
MEA
N
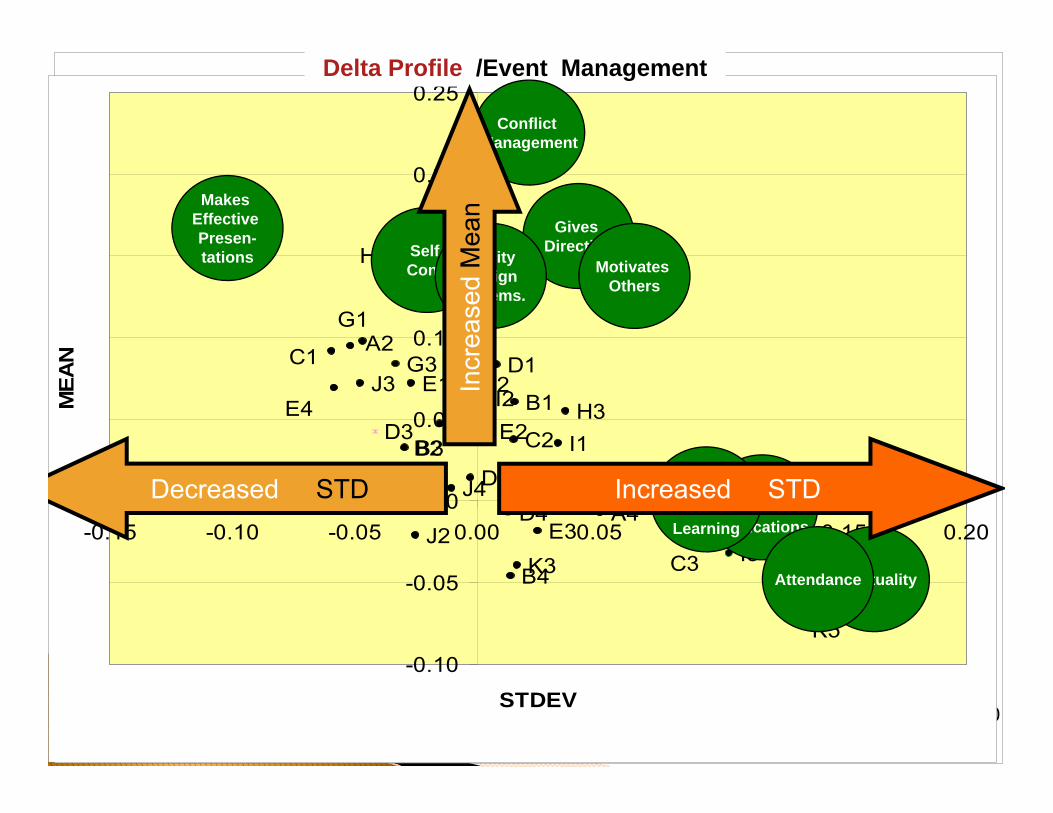
Gives Direction
RecPolitical
Implications
Makes Effective Presen-tations
PunctualityAttendance
Applies Class Room
Learning
Motivates Others
Self Conf.
AbilityDesign
Systems.
Decreased STD Increased STD
Delta Profile /Event Management
Conflict Management
Incr
ease
d M
ean
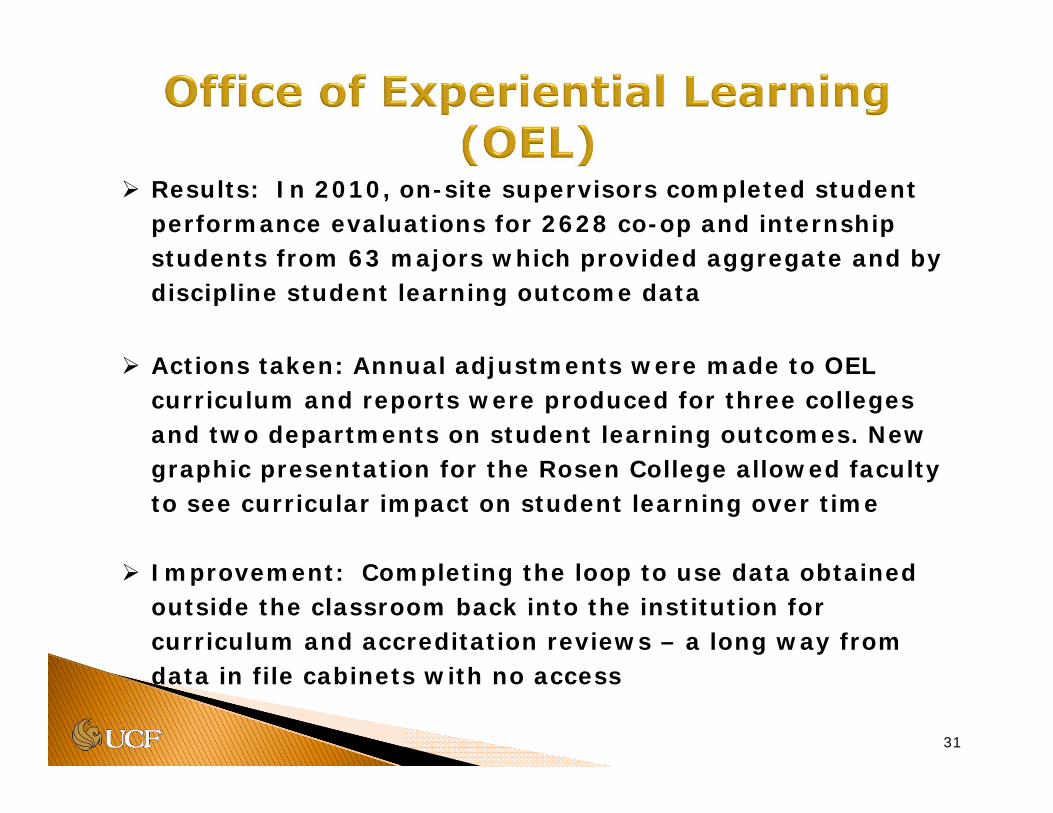
Results: In 2010, on-site supervisors completed student performance evaluations for 2628 co-op and internship students from 63 majors which provided aggregate and by discipline student learning outcome data
Actions taken: Annual adjustments were made to OEL curriculum and reports were produced for three colleges and two departments on student learning outcomes. New graphic presentation for the Rosen College allowed faculty to see curricular impact on student learning over time
Improvement: Completing the loop to use data obtained outside the classroom back into the institution for curriculum and accreditation reviews – a long way from data in file cabinets with no access
31

Advance use of IE assessment results for quality improvement initiatives
Increase evidence of the impact of implemented changes
Raise inter-rater reliability across DRCs
Broaden linkages between strategic planning and assessment
Next Steps
32University Assessment Committee Annual Report

University Assessment Committee Annual Report 33