university district redevelopment implementation strategy · university district redevelopment...
TRANSCRIPT
University District RedevelopmentImplementation Strategy
June 22, 2015
UNIVERSITY DISTRICT REDEVELOPMENT IMPLEMENTATION STRATEGY PAGE i
CONTENTS PREFACE V
EXECUTIVE SUMMARY VI
1 INTRODUCTION 1
1.1 VISION FOR REDEVELOPMENT 2
1.2 STUDY AREA AND PROTOTYPE PROPERTY 3
2 MARKET ASSESSMENT 5
2.1 STUDY AREA LAND USE PROFILE 5
2.2 REAL ESTATE FUNDAMENTALS 9
2.3 STUDY AREA REDEVELOPMENT SCENARIOS 12
2.4 SUMMARY 21
3 ENVIRONMENTAL CONCERNS 23
3.1 TYPICAL IMPACTS 23
3.2 GEOLOGIC SETTING 24
3.3 ENVIRONMENTAL STRATEGY 24
4 DISTRICT REDEVELOPMENT STRATEGIES 31
4.1 DEVELOPMENT PHASING 31
4.2 ENGAGING INTERESTED PARTIES & LEVERAGING ASSETS 33
4.3 SOLICITING PRIVATE INVESTMENT—MARKET ENGAGEMENT 35
Appendix A: Strategies For Redevelopment Of Individual Properties
UNIVERSITY DISTRICT REDEVELOPMENT IMPLEMENTATION STRATEGY PAGE ii
TABLES AND FIGURES TABLES
TABLE 1: MILESTONES IN UNIVERSITY DISTRICT PLANNING AND REDEVELOPMENT 2 TABLE 2: STUDY AREA PROPERTY STATISTICS 7 TABLE 3: OFFICE MARKET SUMMARY STATISTICS 10 TABLE 4: RETAIL MARKET SUMMARY STATISTICS 10 TABLE 5: CITY-WIDE MULTIFAMILY SUMMARY STATISTICS 12 TABLE 6: ADAPTIVE REUSE SENSITIVITY TABLE 15 TABLE 7: MULTI-FAMILY SENSITIVITY TABLE 17 TABLE 8: OFFICE SENSITIVITY TABLE 20 TABLE 9: EXAMPLE PETROLEUM IMPACTED SITE REMEDIATION COSTS 26
FIGURES
FIGURE EX 1: DISTRICT OFFERING STRATEGY VIII FIGURE 1: STUDY AREA AND PROTOTYPE PROPERTY 3 FIGURE 2: GATEWAY BRIDGE CONCEPTUAL PLAN 4 FIGURE 3: STUDY AREA LAND USE PATTERN 6 FIGURE 4: STUDY AREA PROPERTY SIZE DISTRIBUTION 7 FIGURE 5: STUDY AREA DEVELOPMENT PATTERNS BY DECADE 8 FIGURE 6: MULTIFAMILY DEVELOPMENT PATTERN 11 FIGURE 7: PRO FORMA 13 FIGURE 8: ADAPTIVE REUSE CONCEPT 14 FIGURE 9: ADAPTIVE REUSE RETURN 15 FIGURE 10: MULTI-FAMILY CONCEPTS 16 FIGURE 11: MULTI-FAMILY RETURN 18 FIGURE 12: OFFICE CONCEPT IMAGES 19 FIGURE 13: OFFICE RETURN 21 FIGURE 14: STEPS IN CLEANUP PROCESS 25 FIGURE 15: BRIDGE LANDING REDEVELOPMENT CONCEPT 32 FIGURE 16: DISTRICT OFFERING STRATEGY 34
UNIVERSITY DISTRICT REDEVELOPMENT IMPLEMENTATION STRATEGY PAGE iii
ACKNOWLEDGEMENTS City of Spokane
Mayor, David A. Condon
City Council Members
Ben Stuckart, Council President
Amber Waldref, District 1
Mike Fagan, District 1
Jon Snyder, District 2
Mike Allen, District 2
Candace Mumm, District 3
Karen Stratton, District 3
Interim Planning Director, Louis Mueller
Associate Planner, Andrew Worlock
University District Public Development Authority
Board Chair | Kim Pearman-Gillman, McKinstry
Vice Chair | Karl Otterstrom, Spokane Transit Authority
Past Chair | Tom Johnson, STCU
Secretary | Steve Trabun, Avista
Treasurer | Mike Livingston, Kiemle & Hagood
Legal | Taudd Hume, Parsons/Burnett/Bjordal/Hume
Dr. Mary Cullinan, Eastern Washington University
Barry Baker, Baker Construction
Dr. Lisa Brown, Washington State University Spokane
Jason Clary, 2nd Harvest
Mayor David Condon, City of Spokane
UNIVERSITY DISTRICT REDEVELOPMENT IMPLEMENTATION STRATEGY PAGE iv
ACKNOWLEDGEMENTS CONT’D
Robin Toth, Greater Spokane Incorporated
Dr. Christine Johnson, Community Colleges Spokane
Dr. Thayne McCulloh, Gonzaga University
Council President Ben Stuckart, Spokane City Council
Dr. Beck Taylor, Whitworth University
Kim Zentz, Innovate Washington
Mark Richard, Downtown Spokane Partnership
Washington State Department of Ecology
Jim Pendowski, Toxics Cleanup Program Manager
Mike Hibbler, Eastern Region Manager, Toxics Cleanup Program
Alan Bogner, Brownfield Program Manager
Sandra Treccani, Site Manager
UNIVERSITY DISTRICT REDEVELOPMENT IMPLEMENTATION STRATEGY PAGE v
PREFACE
This report summarizes planning and technical analyses conducted for the City of Spokane (the City) and the University District Development Association (UDDA) in support of their efforts to promote redevelopment in the University District. This planning effort has been conducted within the context of the City’s Comprehensive Plan and previous neighborhood scale plans including the University District Strategic Master Plan and the Sprague Corridor Investment Strategy.
The Implementation Strategy focuses on the southern portion of the University District bordered by the Burlington Northern-Santa Fe (BNSF) railway on the north, Interstate 90 on the south, Division Street on the west, and North Hamilton Street (Highway 290) on the east.
The planning study integrated economic and environmental technical analyses with public involvement to formulate a redevelopment strategy that addresses physical, regulatory, and economic realities and drives toward the long-term future use vision established in previous plans. The planning process involved the following major steps:
• Environmental Due Diligence—assessment of the historical sources of potential impacts and nature and extent of contamination and evaluation of cleanup options
• Market Assessment—analysis of real estate trends and opportunities
• Public Involvement—stakeholder interviews and community meetings to listen to the concerns and ideas of the public and provide opportunities to review study findings
• Conceptual Planning—incorporating the information developed in the study to illustrate a conceptual site plan for redevelopment at a catalyst site
• Implementation Strategy—work program for successfully accomplishing the redevelopment
This planning effort was funded by a grant from the Washington State Department of Ecology (Ecology), Toxics Cleanup Program, Integrated Planning Grant Program (Grant number G1400031). Integrated Planning Grants provide funding for local governments to conduct the necessary studies and plan for acquiring and redeveloping underperforming, contaminated property. The grants support planning for adaptive reuse of a property, integrating economic development, environmental cleanup and restoration, and community benefit. The Integrated Planning Grant Program is funded through the Model Toxics Control Account (MTCA), which uses revenues from a fee on the first possession of imported hazardous substances in the state to support environmental cleanup, pollution prevention, and waste management efforts. MTCA was approved by a voter referendum in 1988.
UNIVERSITY DISTRICT REDEVELOPMENT IMPLEMENTATION STRATEGY PAGE vi
EXECUTIVE SUMMARY
The City of Spokane and UDDA are working with partners at the federal, state, and local levels to make major investments to revitalize the University District into a vibrant, sustainably designed regional center for research and innovation. The purpose of the Integrated Planning Study is to develop strategies to catalyze development in the South University District. The planning study integrated economic and environmental technical analyses with public involvement
Market Assessment
• Real estate in the South University District is generally underutilized compared to its capacity under current zoning. The area does have locational advantages due to proximity to the Washington State University (WSU) Spokane Campus, Downtown, and the Medical District.
• The financial viability of redevelopment in the South University District is challenging. The financial gap is driven by rental rate projections that are not yet high enough to provide a sufficient return on the cost of new construction. However, adaptive reuse of existing structures is less costly and therefore represents a feasible near term opportunity, which can catalyze and precede larger scale new construction. New construction is most likely to be viable in the near-term for an owner/user of a building where the location has benefits for their business rather than an outside developer whose profitability is focused solely on the costs and value of the development project.
• The City may improve the real estate fundamentals through investments in public infrastructure and financial and regulatory incentives. Transportation and streetscape improvements can improve the functionality and the aesthetics of the area. For example, the connectivity that a completed University District Gateway Bridge would provide to the WSU Spokane Campus would make development in the South University District more attractive as students and workers will have an easier time moving between these two areas. This would likely have a positive impact on rents. Another key influence on bridging the financial gap is encouraging the application of New Market Tax Credits, EB-5 financing, and Multi-family Tax Exemptions.
Environmental Considerations
• Historical operations in the South University District have the potential to have left legacy contamination in soil and groundwater. The WSU Spokane Campus is located on the site of a former rail yard. Sprague Avenue and the surrounding area have been characterized by automotive oriented commercial and light industrial businesses since the 1950’s These businesses included automotive sales, fueling stations, and service and repair shops, along with machine shops, paint shops, and warehouse and storage operations. While environmental conditions vary on any property, these types of industries are often associated with releases of hazardous substances.
UNIVERSITY DISTRICT REDEVELOPMENT IMPLEMENTATION STRATEGY PAGE vii
• Redevelopment of contaminated properties is becoming increasingly common. There is a well-defined regulatory process to clean up impacted properties, and there are a suite of legal and financial tools to manage risk on these sites. Fox example, individual property owners may have the potential to make claims against historical insurance policies to fund cleanup, since the legal framework creates a retroactive liability. The City can promote cleanup and redevelopment of brownfield properties through assisting with insurance research and by establishing a Redevelopment Opportunity Zone that would allow potential state funding and new administrative tools for innocent purchasers of contaminated properties.
Implementation Strategy
To be successful, the early stages of district scale redevelopment require action by a wide variety of stakeholders, each of whom needs their own motivation(s) to participate. The University District is well endowed with key stakeholders that can each contribute to and gain from incremental redevelopment of the district. A “District Offering” strategy is recommended, that follows the same basic approach that a landowner would take to sell a development property but is expanded to address the more complex nature of the assets and stakeholders within the District (Figure EX-1). The target area of a District Offering could be the area around the southern landing of the proposed Gateway Bridge. The end goal of this process is to facilitate a critical mass of private investment that leverages the planned public investments. Implementation of this strategy includes the following steps:
1. Development of the Memorandum of Understanding (MOU) that sets the stage for the creation of a market based offering by detailing the roles, commitments and assets associated with multiple public and private stakeholders
2. Preparing an Offering Memorandum that presents the University District redevelopment opportunities and outlines the process whereby various private sector entities may participate
3. Market engagement to work proactively with developers and users to prepare proposals in response to the Offering Memorandum
4. Analysis, negotiation and documentation to evaluate responses, select the best-fit proposal(s), and work through the process of documenting the transaction(s).

UNIVERSITY DISTRICT REDEVELOPMENT IMPLEMENTATION STRATEGY PAGE viii
Figure EX-1: District Offering Strategy
UNIVERSITY DISTRICT REDEVELOPMENT IMPLEMENTATION STRATEGY PAGE 1
1 INTRODUCTION
The City of Spokane and the University District Development Association (UDDA) are working with partners at the federal, state, and local levels to make major investments to revitalize the University District into a vibrant, sustainably designed regional center for research and innovation. The establishment of the Riverpoint Campus (now known and referred to as the “WSU Spokane Campus”) has created a significant opportunity for redevelopment of this area. The area immediately south of WSU Spokane Campus has the potential to benefit with increased development associated with academic institutions, but uncertainty about legacy contamination from historical uses poses a barrier to new investment. The purpose of this Redevelopment Implementation Strategy is to create a model for how contaminated, or potentially contaminated, underutilized properties (commonly referred to as brownfields) can be positioned for redevelopment in the University District.
This report is organized into four sections:
1. Introduction, which summarizes the context for land use and economic development planning in the University District 2. Market Assessment, which provides a snapshot of current market conditions and financial evaluation of prototype
redevelopment options 3. Environmental Concerns, describes typical environmental impacts found in the South University District and lays out a
pathway to resolving those issues 4. Redevelopment Strategies, outlines key steps to attracting investment and realizing the redevelopment potential of this area
Historically an industrial and commercial center, the area east of Downtown Spokane has emerged into a distinct University District that is rapidly changing. While Gonzaga University was founded in 1887, the Eastern Washington University and Washington State University (WSU) presence in the area began in 1995. Community Colleges of Spokane relocated their administration offices to the WSU Spokane Campus in 2000. The growth and success of Spokane’s University District institutions, including Washington State University, Eastern Washington University, Whitworth University, the Community Colleges of Spokane, Innovate Washington (formerly the Spokane Intercollegiate Research and Technology Institute), and increased prominence of Gonzaga University, are transforming this area into an intellectual and creative center for Spokane and the region.
With its location between downtown and the South Hill Medical District, its mix of old and new buildings as well as vacant and underutilized parcels, and as home to four universities and the community colleges, the University District has many of the physical and institutional assets to be a destination for entrepreneurial young professionals and support revitalization of Spokane. Redevelopment will provide economic benefit to the City by creating jobs, increasing its tax base, and using existing infrastructure more efficiently.
UNIVERSITY DISTRICT REDEVELOPMENT IMPLEMENTATION STRATEGY PAGE 2
1.1 VISION FOR REDEVELOPMENT In 2005, the City of Spokane completed the University District Strategic Master Plan. The Master Plan creates a bold vision to leverage the resources of the higher education, research, and health care industry to create a vibrant place that is attractive to creative individuals and spurs growth of the knowledge-based economy. The Master Plan envisions the University District as a center for intellectual and research excellence and an economic engine for the new economy. The District is imagined as a vibrant, 24/7, pedestrian-first place with an eclectic mix of uses, including housing, offices shops, university uses, manufacturing, and warehouses.
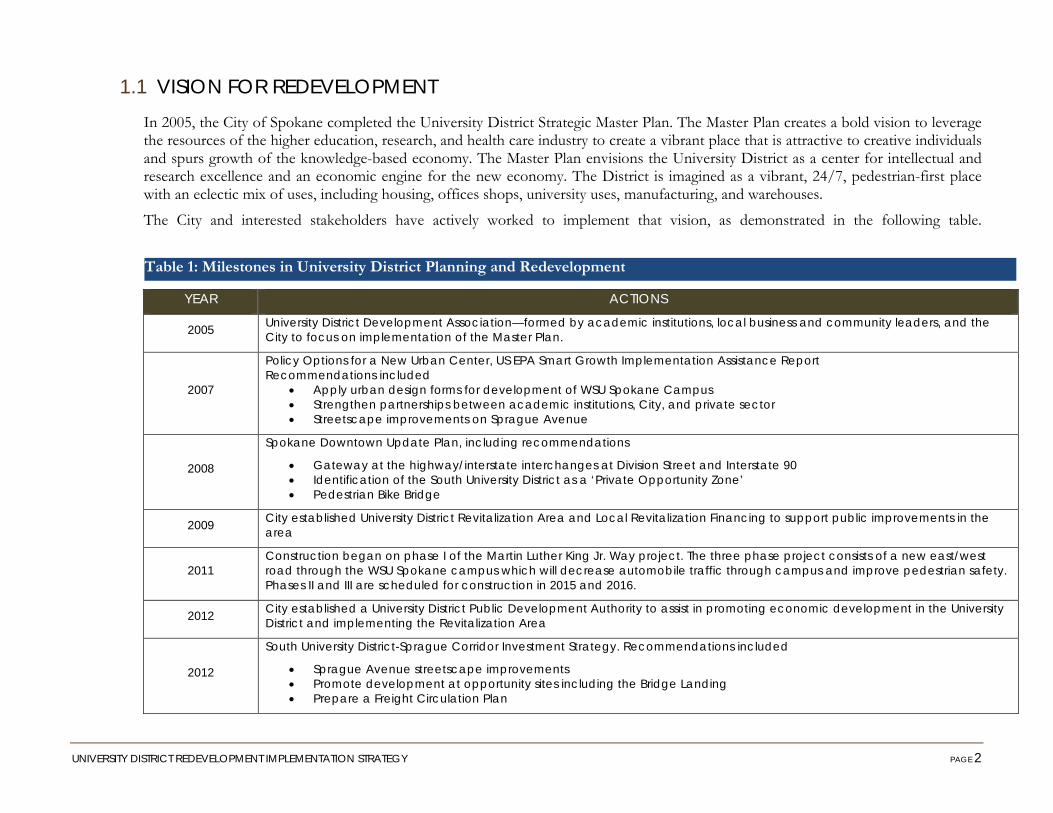
The City and interested stakeholders have actively worked to implement that vision, as demonstrated in the following table.
YEAR ACTIONS
2005 University District Development Association—formed by academic institutions, local business and community leaders, and the City to focus on implementation of the Master Plan.
2007
Policy Options for a New Urban Center, US EPA Smart Growth Implementation Assistance Report Recommendations included
• Apply urban design forms for development of WSU Spokane Campus • Strengthen partnerships between academic institutions, City, and private sector • Streetscape improvements on Sprague Avenue
2008
Spokane Downtown Update Plan, including recommendations
• Gateway at the highway/interstate interchanges at Division Street and Interstate 90 • Identification of the South University District as a ‘Private Opportunity Zone’ • Pedestrian Bike Bridge
2009 City established University District Revitalization Area and Local Revitalization Financing to support public improvements in the area
2011 Construction began on phase I of the Martin Luther King Jr. Way project. The three phase project consists of a new east/west road through the WSU Spokane campus which will decrease automobile traffic through campus and improve pedestrian safety. Phases II and III are scheduled for construction in 2015 and 2016.
2012 City established a University District Public Development Authority to assist in promoting economic development in the University District and implementing the Revitalization Area
2012
South University District-Sprague Corridor Investment Strategy. Recommendations included
• Sprague Avenue streetscape improvements • Promote development at opportunity sites including the Bridge Landing • Prepare a Freight Circulation Plan
Table 1: Milestones in University District Planning and Redevelopment
UNIVERSITY DISTRICT REDEVELOPMENT IMPLEMENTATION STRATEGY PAGE 3
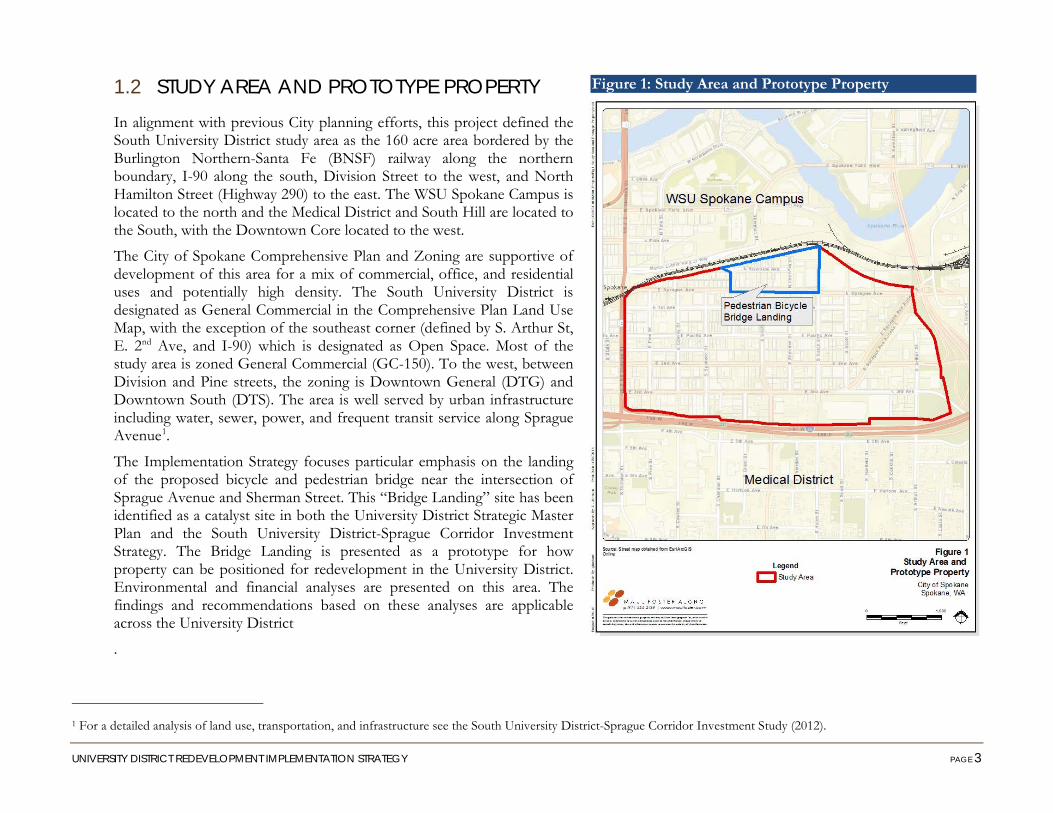
1.2 STUDY AREA AND PROTOTYPE PROPERTY In alignment with previous City planning efforts, this project defined the South University District study area as the 160 acre area bordered by the Burlington Northern-Santa Fe (BNSF) railway along the northern boundary, I-90 along the south, Division Street to the west, and North Hamilton Street (Highway 290) to the east. The WSU Spokane Campus is located to the north and the Medical District and South Hill are located to the South, with the Downtown Core located to the west.
The City of Spokane Comprehensive Plan and Zoning are supportive of development of this area for a mix of commercial, office, and residential uses and potentially high density. The South University District is designated as General Commercial in the Comprehensive Plan Land Use Map, with the exception of the southeast corner (defined by S. Arthur St, E. 2nd Ave, and I-90) which is designated as Open Space. Most of the study area is zoned General Commercial (GC-150). To the west, between Division and Pine streets, the zoning is Downtown General (DTG) and Downtown South (DTS). The area is well served by urban infrastructure including water, sewer, power, and frequent transit service along Sprague Avenue1.
The Implementation Strategy focuses particular emphasis on the landing of the proposed bicycle and pedestrian bridge near the intersection of Sprague Avenue and Sherman Street. This “Bridge Landing” site has been identified as a catalyst site in both the University District Strategic Master Plan and the South University District-Sprague Corridor Investment Strategy. The Bridge Landing is presented as a prototype for how property can be positioned for redevelopment in the University District. Environmental and financial analyses are presented on this area. The findings and recommendations based on these analyses are applicable across the University District
.
1 For a detailed analysis of land use, transportation, and infrastructure see the South University District-Sprague Corridor Investment Study (2012).
Figure 1: Study Area and Prototype Property
UNIVERSITY DISTRICT REDEVELOPMENT IMPLEMENTATION STRATEGY PAGE 4
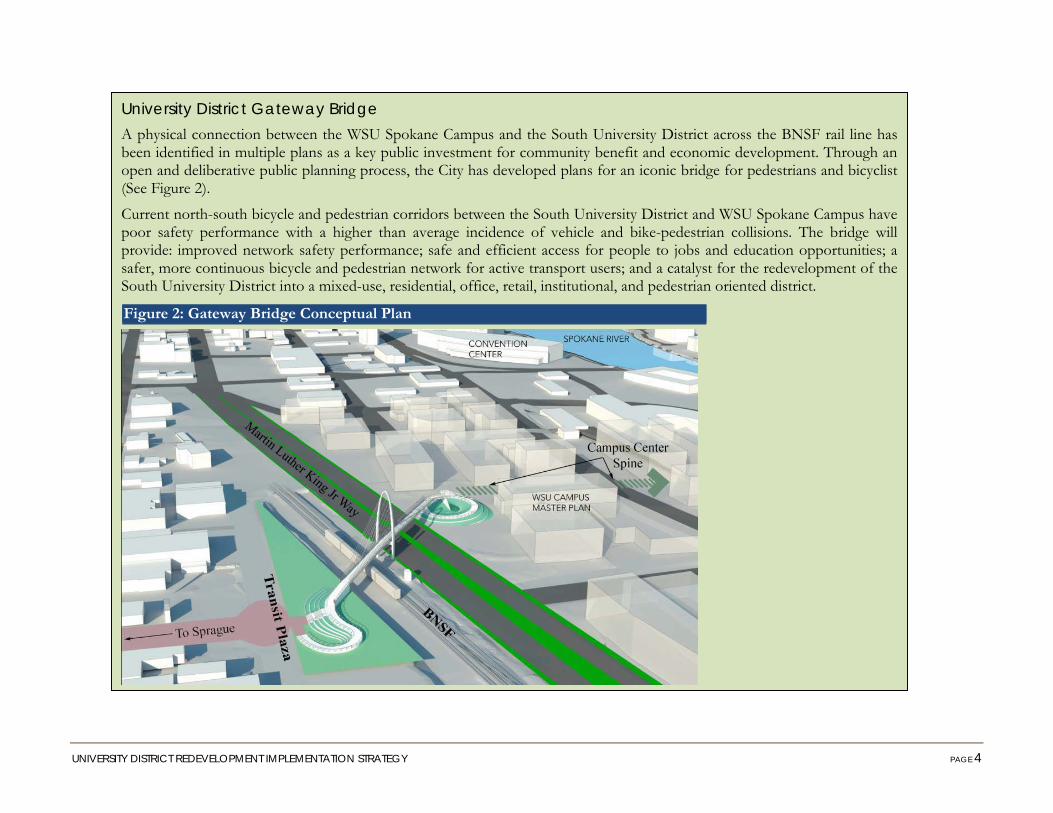
University District Gateway Bridge A physical connection between the WSU Spokane Campus and the South University District across the BNSF rail line has been identified in multiple plans as a key public investment for community benefit and economic development. Through an open and deliberative public planning process, the City has developed plans for an iconic bridge for pedestrians and bicyclist (See Figure 2).
Current north-south bicycle and pedestrian corridors between the South University District and WSU Spokane Campus have poor safety performance with a higher than average incidence of vehicle and bike-pedestrian collisions. The bridge will provide: improved network safety performance; safe and efficient access for people to jobs and education opportunities; a safer, more continuous bicycle and pedestrian network for active transport users; and a catalyst for the redevelopment of the South University District into a mixed-use, residential, office, retail, institutional, and pedestrian oriented district.
Figure 2: Gateway Bridge Conceptual Plan
UNIVERSITY DISTRICT REDEVELOPMENT IMPLEMENTATION STRATEGY PAGE 5
2 MARKET ASSESSMENT
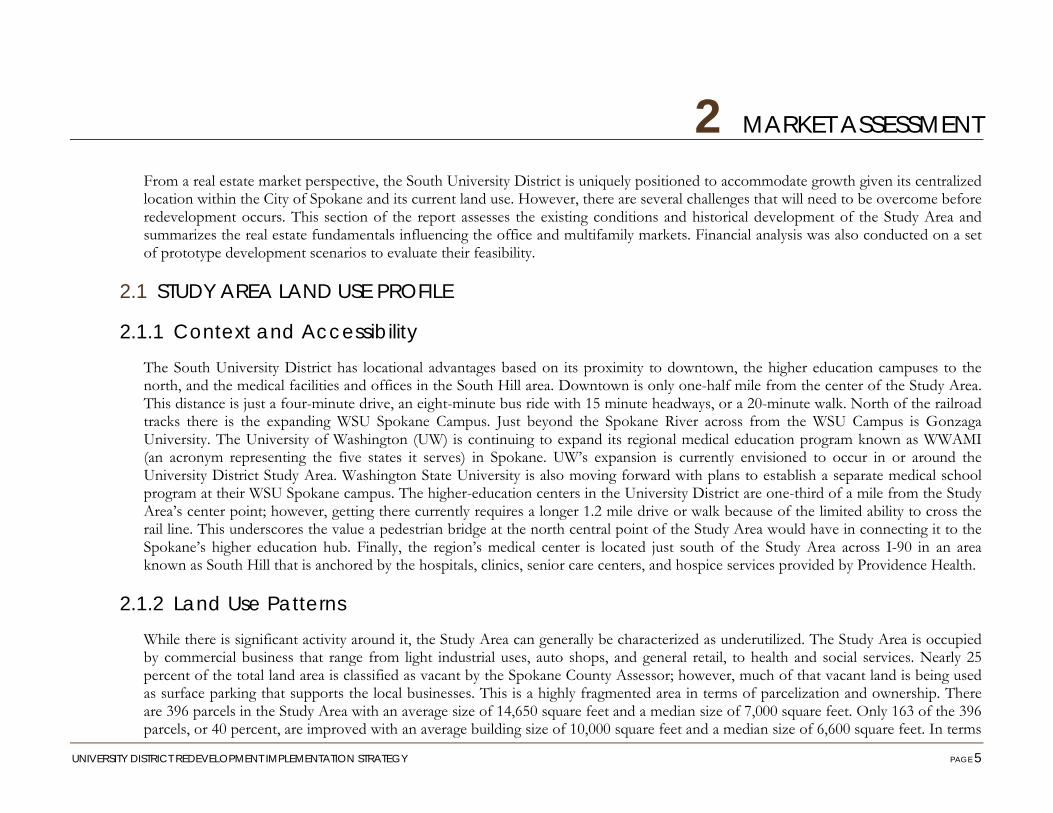
From a real estate market perspective, the South University District is uniquely positioned to accommodate growth given its centralized location within the City of Spokane and its current land use. However, there are several challenges that will need to be overcome before redevelopment occurs. This section of the report assesses the existing conditions and historical development of the Study Area and summarizes the real estate fundamentals influencing the office and multifamily markets. Financial analysis was also conducted on a set of prototype development scenarios to evaluate their feasibility.
2.1 STUDY AREA LAND USE PROFILE
2.1.1 Context and Accessibility The South University District has locational advantages based on its proximity to downtown, the higher education campuses to the north, and the medical facilities and offices in the South Hill area. Downtown is only one-half mile from the center of the Study Area. This distance is just a four-minute drive, an eight-minute bus ride with 15 minute headways, or a 20-minute walk. North of the railroad tracks there is the expanding WSU Spokane Campus. Just beyond the Spokane River across from the WSU Campus is Gonzaga University. The University of Washington (UW) is continuing to expand its regional medical education program known as WWAMI (an acronym representing the five states it serves) in Spokane. UW’s expansion is currently envisioned to occur in or around the University District Study Area. Washington State University is also moving forward with plans to establish a separate medical school program at their WSU Spokane campus. The higher-education centers in the University District are one-third of a mile from the Study Area’s center point; however, getting there currently requires a longer 1.2 mile drive or walk because of the limited ability to cross the rail line. This underscores the value a pedestrian bridge at the north central point of the Study Area would have in connecting it to the Spokane’s higher education hub. Finally, the region’s medical center is located just south of the Study Area across I-90 in an area known as South Hill that is anchored by the hospitals, clinics, senior care centers, and hospice services provided by Providence Health.
2.1.2 Land Use Patterns While there is significant activity around it, the Study Area can generally be characterized as underutilized. The Study Area is occupied by commercial business that range from light industrial uses, auto shops, and general retail, to health and social services. Nearly 25 percent of the total land area is classified as vacant by the Spokane County Assessor; however, much of that vacant land is being used as surface parking that supports the local businesses. This is a highly fragmented area in terms of parcelization and ownership. There are 396 parcels in the Study Area with an average size of 14,650 square feet and a median size of 7,000 square feet. Only 163 of the 396 parcels, or 40 percent, are improved with an average building size of 10,000 square feet and a median size of 6,600 square feet. In terms

UNIVERSITY DISTRICT REDEVELOPMENT IMPLEMENTATION STRATEGY PAGE 6
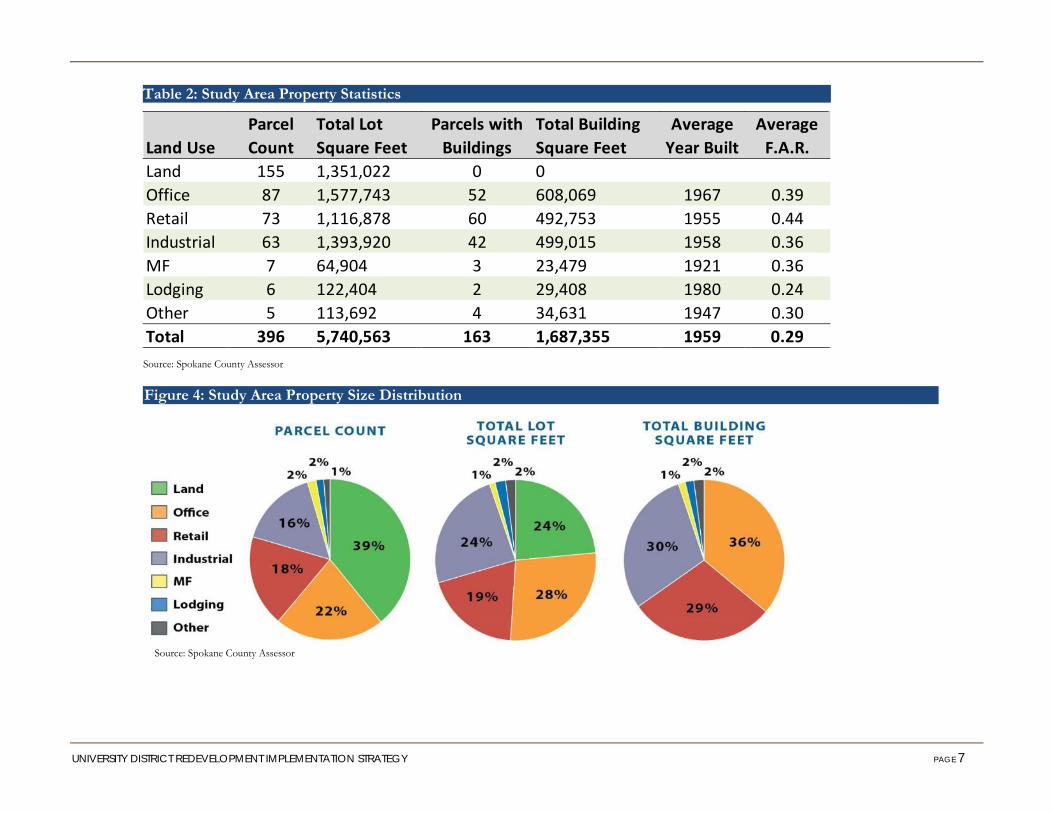
of ownership, there are 199 unique property owners in the Study Area. Figures 3, 4 and Table 2 further detail the Study Area’s land use patterns.
Figure 3: Study Area Land Use Pattern
Source: Spokane County Assessor
UNIVERSITY DISTRICT REDEVELOPMENT IMPLEMENTATION STRATEGY PAGE 7
Land UseParcel Count
Total Lot Square Feet
Parcels with Buildings
Total Building Square Feet
Average Year Built
Average F.A.R.
Land 155 1,351,022 0 0Office 87 1,577,743 52 608,069 1967 0.39Retail 73 1,116,878 60 492,753 1955 0.44Industrial 63 1,393,920 42 499,015 1958 0.36MF 7 64,904 3 23,479 1921 0.36Lodging 6 122,404 2 29,408 1980 0.24Other 5 113,692 4 34,631 1947 0.30Total 396 5,740,563 163 1,687,355 1959 0.29
Source: Spokane County Assessor
Source: Spokane County Assessor
Table 2: Study Area Property Statistics
Figure 4: Study Area Property Size Distribution
UNIVERSITY DISTRICT REDEVELOPMENT IMPLEMENTATION STRATEGY PAGE 8
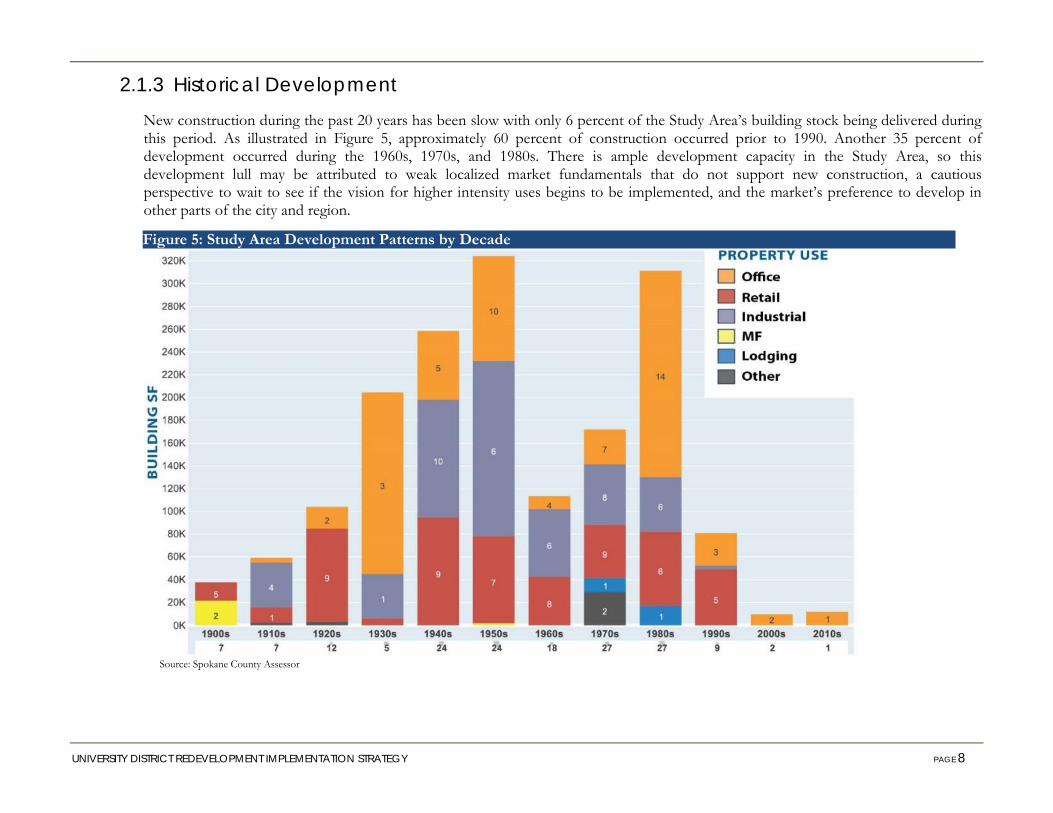
2.1.3 Historical Development New construction during the past 20 years has been slow with only 6 percent of the Study Area’s building stock being delivered during this period. As illustrated in Figure 5, approximately 60 percent of construction occurred prior to 1990. Another 35 percent of development occurred during the 1960s, 1970s, and 1980s. There is ample development capacity in the Study Area, so this development lull may be attributed to weak localized market fundamentals that do not support new construction, a cautious perspective to wait to see if the vision for higher intensity uses begins to be implemented, and the market’s preference to develop in other parts of the city and region.
Source: Spokane County Assessor
Figure 5: Study Area Development Patterns by Decade
UNIVERSITY DISTRICT REDEVELOPMENT IMPLEMENTATION STRATEGY PAGE 9
2.1.4 Development Capacity There is significant capacity for higher intensity development in the Study Area, based on a common metric of density, the floor area ratio (FAR). The FAR is calculated as the total building square footage divided by total land area. The current General Commercial zoning that dictates land use and development capacity in the majority of the Study Area permits a maximum FAR of 2.5 and building heights up to 70 feet or 150 feet. The average FAR across the entire Study Area is 0.29. This FAR calculation includes land that is vacant and not associated with a building. If only improved land and its supporting parcels (used typically for parking) are included the FAR increases to 0.37, which represents only 15 percent of the allowable density. The highest existing FAR for any single parcel in the Study Area is 1.0. Historically the low intensity, auto-oriented uses that dominate the district have been the highest-and-best-use though as market conditions change over time there is significant development capacity.
2.2 REAL ESTATE FUNDAMENTALS Relative to the City of Spokane, the Study Area’s market fundamentals are challenging. This finding suggests that alternative locations and/or the quality of the space are keeping renters in other parts of the City in order to meet their space needs. This is in spite of the Study Area’s strong location and low rental rates. Commercial real estate is driven in large part by a growing economy and the City of Spokane’s employment has been declining at a slow rate since 2008. Since the peak, Spokane has lost 5,000 jobs at an average annual rate of one percent per year. Considering how other regional economies were affected by the Great Recession, Spokane’s response has been less severe; however, there has not yet been a rebound in employment numbers since the decline began in 2008. This is a key indicator as to why the City’s overall commercial market can generally be described as flat, but it has been declining at a relatively slow rate. The following analysis summarizes the real estate fundamentals in the Study Area in 2014.
2.2.1 Commercial
OFFICE Since 2008, the City has seen a 6.5 percent increase in the office supply, or an additional 973,000 square feet. While this new supply is not an insignificant amount, this construction, coupled with a reduction in overall jobs City-wide has created a market with limited upward pressure on rental rates while vacancies have remained relatively flat. The Study Area comprises approximately 656,000 square feet of office space. This represents only 4.1 percent of the City’s total supply.
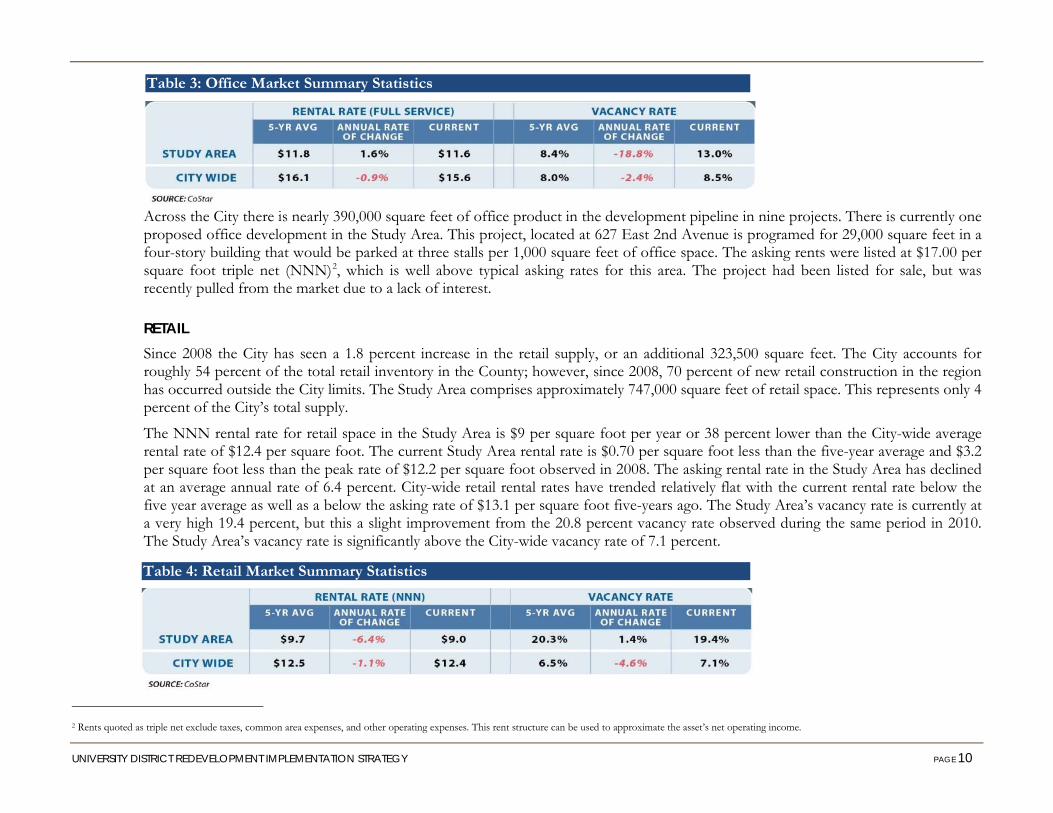
The Study Area’s current full service rental rate is $11.6 per square foot per year or 33% lower than the City-wide average rental rate of $15.6 per square foot (See Table 3). The current rate in the Study Area is slightly lower than the five-year average, however there has been growth in the rental rate since five years ago when rental rates were $10.8 per square foot. City-wide office rental rates followed a similar, relatively flat trajectory with the current rental rate below the five-year average as well as below the asking rate of $16.3 per square foot five-years ago. The Study Area’s vacancy rate is currently at 13 percent, well over the 5.5 percent rate observed during the same period in 2010. This is well above the City-wide vacancy rate of 8.5 percent.
UNIVERSITY DISTRICT REDEVELOPMENT IMPLEMENTATION STRATEGY PAGE 10
Table 4: Retail Market Summary Statistics
Table 3: Office Market Summary Statistics
Across the City there is nearly 390,000 square feet of office product in the development pipeline in nine projects. There is currently one proposed office development in the Study Area. This project, located at 627 East 2nd Avenue is programed for 29,000 square feet in a four-story building that would be parked at three stalls per 1,000 square feet of office space. The asking rents were listed at $17.00 per square foot triple net (NNN)2, which is well above typical asking rates for this area. The project had been listed for sale, but was recently pulled from the market due to a lack of interest.
RETAIL Since 2008 the City has seen a 1.8 percent increase in the retail supply, or an additional 323,500 square feet. The City accounts for roughly 54 percent of the total retail inventory in the County; however, since 2008, 70 percent of new retail construction in the region has occurred outside the City limits. The Study Area comprises approximately 747,000 square feet of retail space. This represents only 4 percent of the City’s total supply.
The NNN rental rate for retail space in the Study Area is $9 per square foot per year or 38 percent lower than the City-wide average rental rate of $12.4 per square foot. The current Study Area rental rate is $0.70 per square foot less than the five-year average and $3.2 per square foot less than the peak rate of $12.2 per square foot observed in 2008. The asking rental rate in the Study Area has declined at an average annual rate of 6.4 percent. City-wide retail rental rates have trended relatively flat with the current rental rate below the five year average as well as a below the asking rate of $13.1 per square foot five-years ago. The Study Area’s vacancy rate is currently at a very high 19.4 percent, but this a slight improvement from the 20.8 percent vacancy rate observed during the same period in 2010. The Study Area’s vacancy rate is significantly above the City-wide vacancy rate of 7.1 percent.
2 Rents quoted as triple net exclude taxes, common area expenses, and other operating expenses. This rent structure can be used to approximate the asset’s net operating income.
UNIVERSITY DISTRICT REDEVELOPMENT IMPLEMENTATION STRATEGY PAGE 11
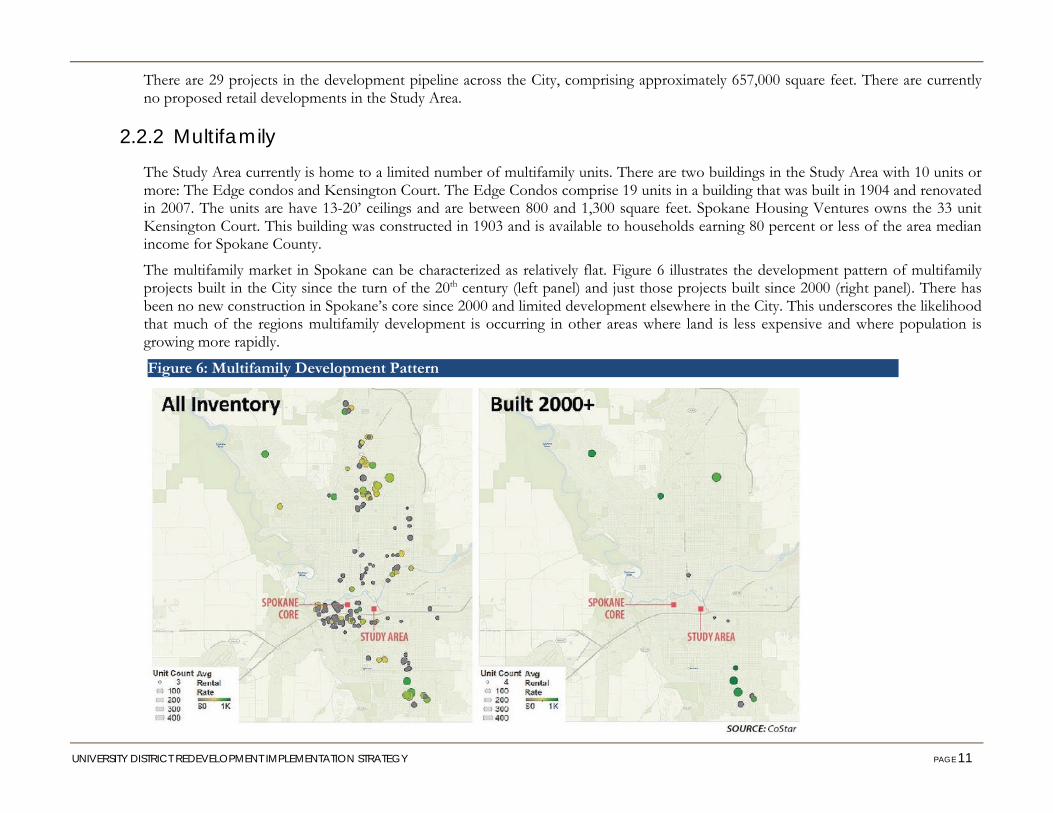
Figure 6: Multifamily Development Pattern
There are 29 projects in the development pipeline across the City, comprising approximately 657,000 square feet. There are currently no proposed retail developments in the Study Area.
2.2.2 Multifamily The Study Area currently is home to a limited number of multifamily units. There are two buildings in the Study Area with 10 units or more: The Edge condos and Kensington Court. The Edge Condos comprise 19 units in a building that was built in 1904 and renovated in 2007. The units are have 13-20’ ceilings and are between 800 and 1,300 square feet. Spokane Housing Ventures owns the 33 unit Kensington Court. This building was constructed in 1903 and is available to households earning 80 percent or less of the area median income for Spokane County.
The multifamily market in Spokane can be characterized as relatively flat. Figure 6 illustrates the development pattern of multifamily projects built in the City since the turn of the 20th century (left panel) and just those projects built since 2000 (right panel). There has been no new construction in Spokane’s core since 2000 and limited development elsewhere in the City. This underscores the likelihood that much of the regions multifamily development is occurring in other areas where land is less expensive and where population is growing more rapidly.

UNIVERSITY DISTRICT REDEVELOPMENT IMPLEMENTATION STRATEGY PAGE 12
Table 5: City-Wide Multifamily Summary Statistics
Across the City, vacancy rates for multifamily developments are low and the average rental rates are similar across product types. The vacancy rate for multifamily is currently 4.3 percent (See Table 5). The newer product, described as “Garden” has the highest vacancy rate of 4.9 percent. These complexes typically have larger unit counts than complexes described as low-rise or mid-rise and are generally located outside of the Spokane core area. The low-rise and mid-rise multifamily developments are typically older buildings and have vacancy rates below 3 percent. The rental rates are typically less than the garden style apartments, but the average unit sizes are also smaller. The trade-off between these product types are urban walkability, on site amenities (garden have more to offer), and age of construction.
Asking rents for the Spokane multifamily market is relatively even across product types. There are two projects of note that stand out. The Highlands at Kendall Yards project has the highest asking rent per square foot per month. This project is situated along the Spokane River within the Kendall Yards master planned development. This project has asking rates around $1,100 per month and with the typical unit size around 900 square feet the average asking rate per square foot is approximately $1.22 per month. The other top of the market project in the City is the 98-unit Riverfalls Tower apartment located at the western edge of the commercial core with park and river views. This project was completed in 1973 and is
11-stories. This project has asking rates around $1,250 per month and with the typical unit size around 1,085 square feet the average asking rate per square foot is approximately $1.15 per month.
Given the low City-wide vacancy rate it could be presumed that there should be pent up demand for apartment units and this should drive new construction. There is some development activity in the pipeline with four low-rise projects under construction comprising 258 units. There are three other proposed projects that if completed will introduce another 308 units into the City. Two of the projects are in the Kendall Yards development with all the other projects in the periphery of the City. Two key factors tempering development at this moment are slow job growth in the City and rental rates that make new construction financially challenging.
There may be a unique opportunity for multifamily development in the Study Area associated with job growth and the student population at the WSU Spokane Campus and Gonzaga University. There is currently no student housing planned to be developed in WSU Spokane and limited supply of off-campus housing near these campuses.
2.3 STUDY AREA REDEVELOPMENT SCENARIOS Financial feasibility analysis was conducted on a set of potential redevelopment scenarios for properties located in the Bridge Landing area. This analysis provides a preliminary evaluation of the potential for a redevelopment project to be successful based on the market
UNIVERSITY DISTRICT REDEVELOPMENT IMPLEMENTATION STRATEGY PAGE 13
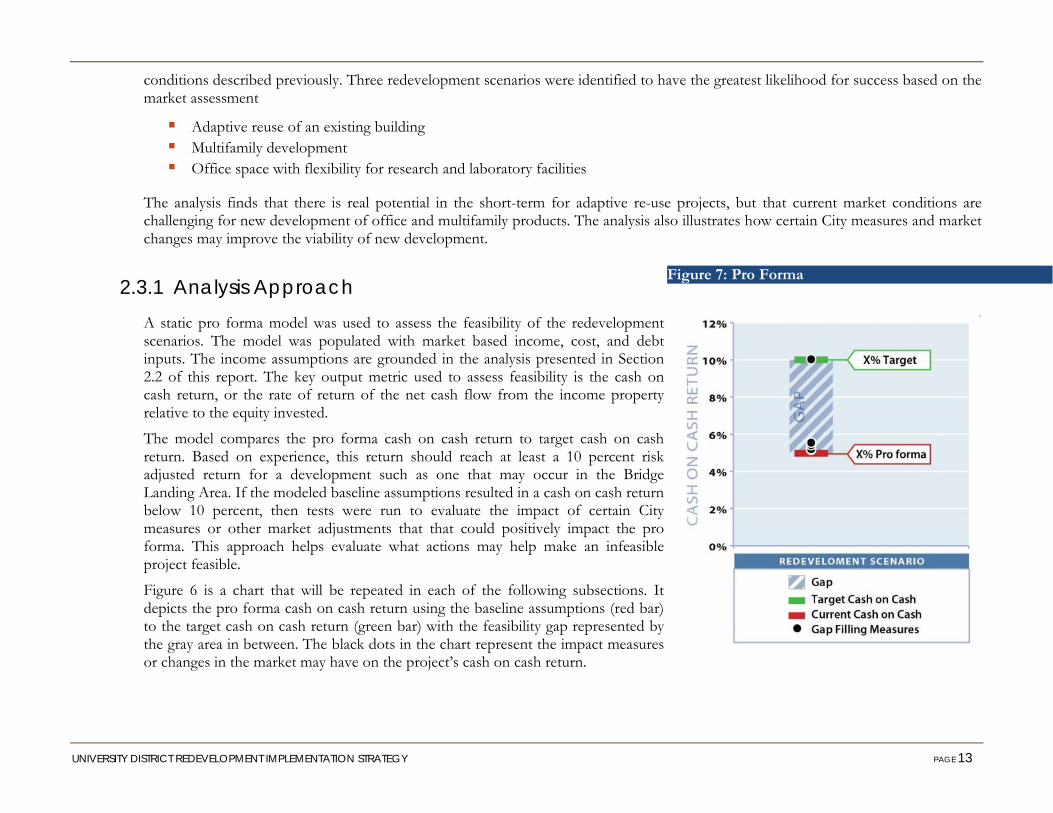
Figure 7: Pro Forma
conditions described previously. Three redevelopment scenarios were identified to have the greatest likelihood for success based on the market assessment
Adaptive reuse of an existing building Multifamily development Office space with flexibility for research and laboratory facilities
The analysis finds that there is real potential in the short-term for adaptive re-use projects, but that current market conditions are challenging for new development of office and multifamily products. The analysis also illustrates how certain City measures and market changes may improve the viability of new development.
2.3.1 Analysis Approach A static pro forma model was used to assess the feasibility of the redevelopment scenarios. The model was populated with market based income, cost, and debt inputs. The income assumptions are grounded in the analysis presented in Section 2.2 of this report. The key output metric used to assess feasibility is the cash on cash return, or the rate of return of the net cash flow from the income property relative to the equity invested.
The model compares the pro forma cash on cash return to target cash on cash return. Based on experience, this return should reach at least a 10 percent risk adjusted return for a development such as one that may occur in the Bridge Landing Area. If the modeled baseline assumptions resulted in a cash on cash return below 10 percent, then tests were run to evaluate the impact of certain City measures or other market adjustments that that could positively impact the pro forma. This approach helps evaluate what actions may help make an infeasible project feasible.
Figure 6 is a chart that will be repeated in each of the following subsections. It depicts the pro forma cash on cash return using the baseline assumptions (red bar) to the target cash on cash return (green bar) with the feasibility gap represented by the gray area in between. The black dots in the chart represent the impact measures or changes in the market may have on the project’s cash on cash return.
UNIVERSITY DISTRICT REDEVELOPMENT IMPLEMENTATION STRATEGY PAGE 14
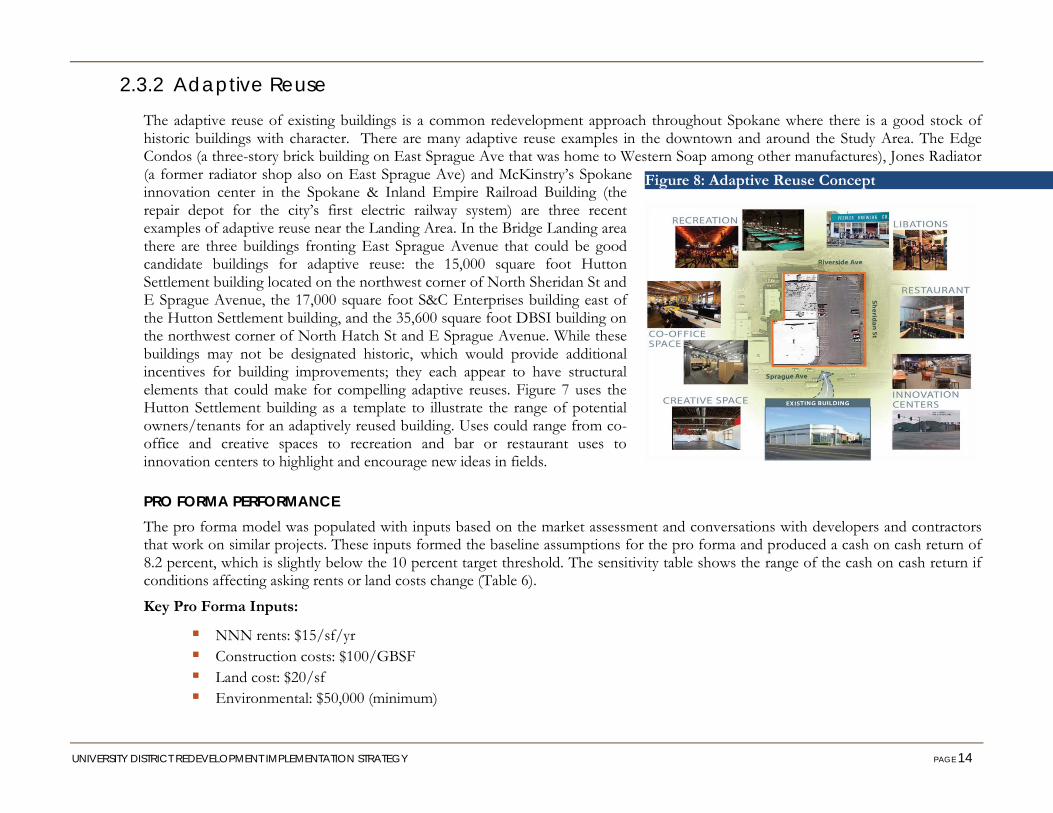
Figure 8: Adaptive Reuse Concept
2.3.2 Adaptive Reuse The adaptive reuse of existing buildings is a common redevelopment approach throughout Spokane where there is a good stock of historic buildings with character. There are many adaptive reuse examples in the downtown and around the Study Area. The Edge Condos (a three-story brick building on East Sprague Ave that was home to Western Soap among other manufactures), Jones Radiator (a former radiator shop also on East Sprague Ave) and McKinstry’s Spokane innovation center in the Spokane & Inland Empire Railroad Building (the repair depot for the city’s first electric railway system) are three recent examples of adaptive reuse near the Landing Area. In the Bridge Landing area there are three buildings fronting East Sprague Avenue that could be good candidate buildings for adaptive reuse: the 15,000 square foot Hutton Settlement building located on the northwest corner of North Sheridan St and E Sprague Avenue, the 17,000 square foot S&C Enterprises building east of the Hutton Settlement building, and the 35,600 square foot DBSI building on the northwest corner of North Hatch St and E Sprague Avenue. While these buildings may not be designated historic, which would provide additional incentives for building improvements; they each appear to have structural elements that could make for compelling adaptive reuses. Figure 7 uses the Hutton Settlement building as a template to illustrate the range of potential owners/tenants for an adaptively reused building. Uses could range from co-office and creative spaces to recreation and bar or restaurant uses to innovation centers to highlight and encourage new ideas in fields.
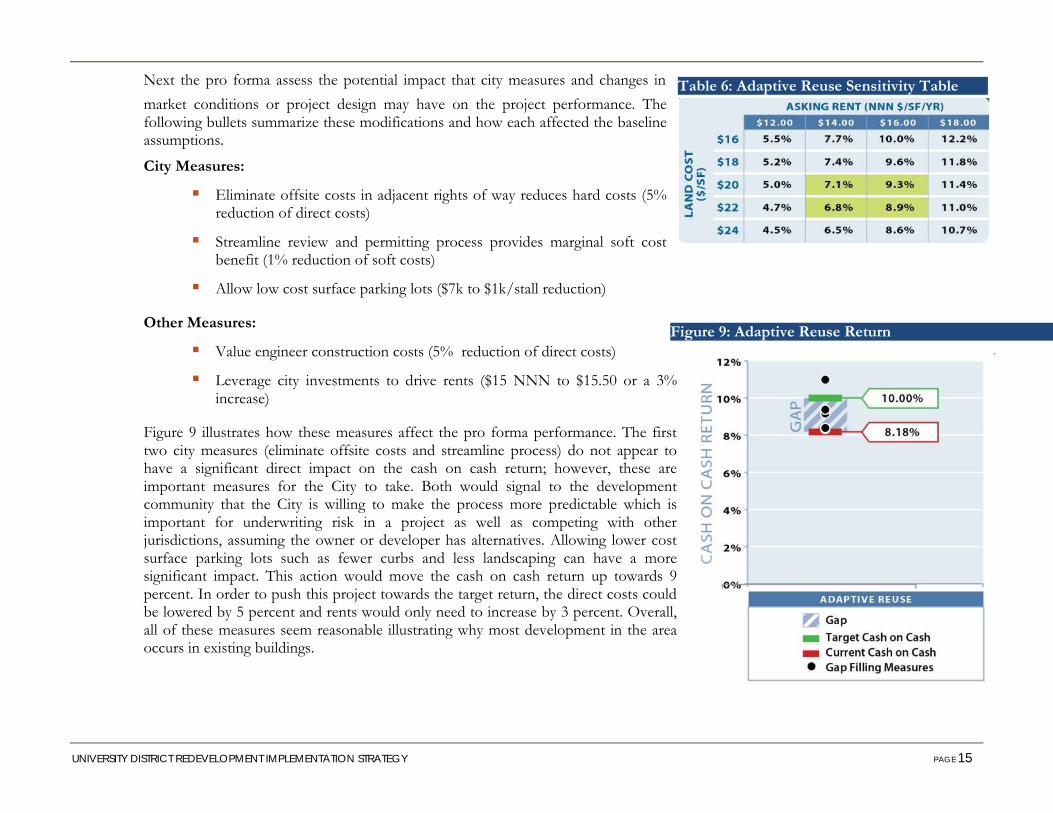
PRO FORMA PERFORMANCE The pro forma model was populated with inputs based on the market assessment and conversations with developers and contractors that work on similar projects. These inputs formed the baseline assumptions for the pro forma and produced a cash on cash return of 8.2 percent, which is slightly below the 10 percent target threshold. The sensitivity table shows the range of the cash on cash return if conditions affecting asking rents or land costs change (Table 6).
Key Pro Forma Inputs:
NNN rents: $15/sf/yr Construction costs: $100/GBSF Land cost: $20/sf Environmental: $50,000 (minimum)
UNIVERSITY DISTRICT REDEVELOPMENT IMPLEMENTATION STRATEGY PAGE 15
Table 6: Adaptive Reuse Sensitivity Table
Figure 9: Adaptive Reuse Return
Next the pro forma assess the potential impact that city measures and changes in market conditions or project design may have on the project performance. The following bullets summarize these modifications and how each affected the baseline assumptions.
City Measures:
Eliminate offsite costs in adjacent rights of way reduces hard costs (5% reduction of direct costs)
Streamline review and permitting process provides marginal soft cost benefit (1% reduction of soft costs)
Allow low cost surface parking lots ($7k to $1k/stall reduction)
Other Measures:
Value engineer construction costs (5% reduction of direct costs)
Leverage city investments to drive rents ($15 NNN to $15.50 or a 3% increase)
Figure 9 illustrates how these measures affect the pro forma performance. The first two city measures (eliminate offsite costs and streamline process) do not appear to have a significant direct impact on the cash on cash return; however, these are important measures for the City to take. Both would signal to the development community that the City is willing to make the process more predictable which is important for underwriting risk in a project as well as competing with other jurisdictions, assuming the owner or developer has alternatives. Allowing lower cost surface parking lots such as fewer curbs and less landscaping can have a more significant impact. This action would move the cash on cash return up towards 9 percent. In order to push this project towards the target return, the direct costs could be lowered by 5 percent and rents would only need to increase by 3 percent. Overall, all of these measures seem reasonable illustrating why most development in the area occurs in existing buildings.
UNIVERSITY DISTRICT REDEVELOPMENT IMPLEMENTATION STRATEGY PAGE 16
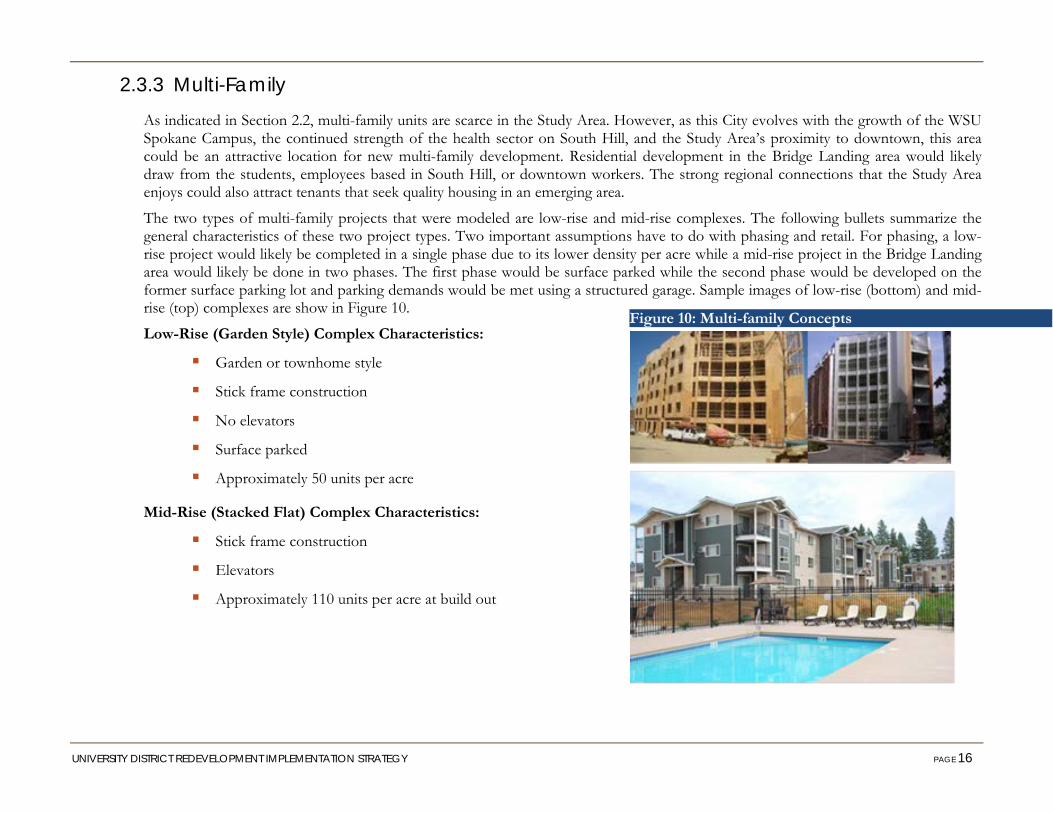
Figure 10: Multi-family Concepts
2.3.3 Multi-Family As indicated in Section 2.2, multi-family units are scarce in the Study Area. However, as this City evolves with the growth of the WSU Spokane Campus, the continued strength of the health sector on South Hill, and the Study Area’s proximity to downtown, this area could be an attractive location for new multi-family development. Residential development in the Bridge Landing area would likely draw from the students, employees based in South Hill, or downtown workers. The strong regional connections that the Study Area enjoys could also attract tenants that seek quality housing in an emerging area.
The two types of multi-family projects that were modeled are low-rise and mid-rise complexes. The following bullets summarize the general characteristics of these two project types. Two important assumptions have to do with phasing and retail. For phasing, a low-rise project would likely be completed in a single phase due to its lower density per acre while a mid-rise project in the Bridge Landing area would likely be done in two phases. The first phase would be surface parked while the second phase would be developed on the former surface parking lot and parking demands would be met using a structured garage. Sample images of low-rise (bottom) and mid-rise (top) complexes are show in Figure 10.
Low-Rise (Garden Style) Complex Characteristics:
Garden or townhome style
Stick frame construction
No elevators
Surface parked
Approximately 50 units per acre
Mid-Rise (Stacked Flat) Complex Characteristics:
Stick frame construction
Elevators
Approximately 110 units per acre at build out
UNIVERSITY DISTRICT REDEVELOPMENT IMPLEMENTATION STRATEGY PAGE 17
Table 7: Multi-family Sensitivity Table
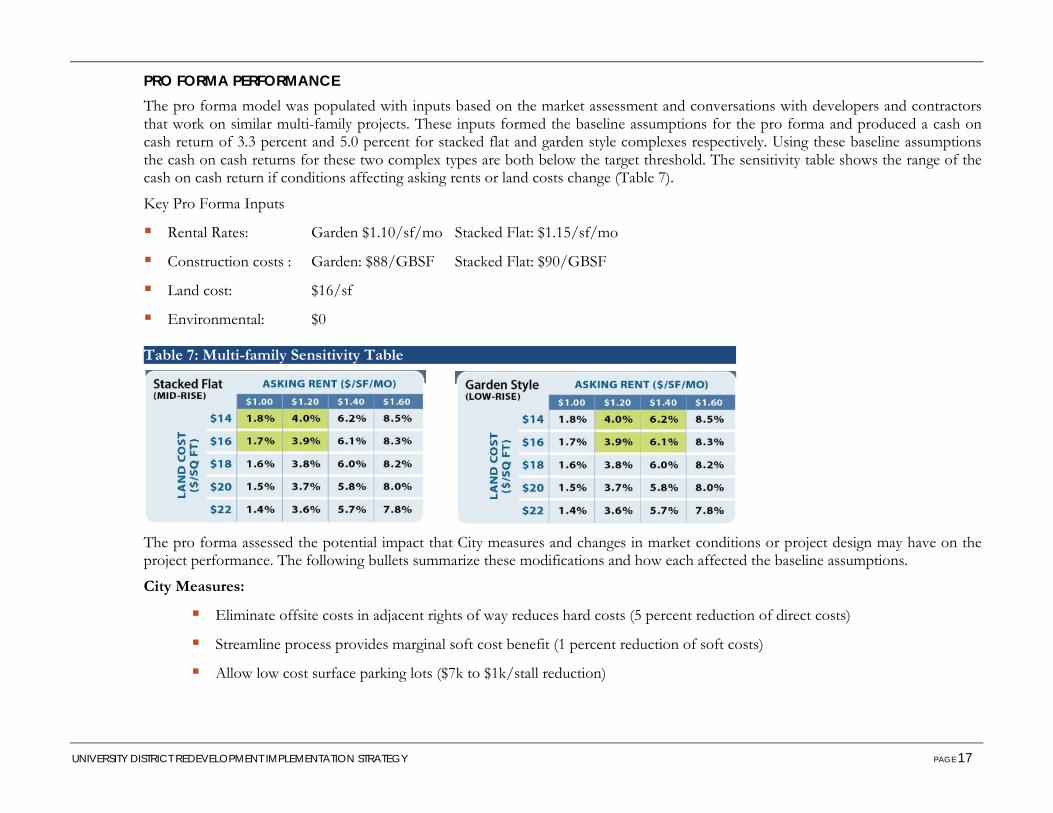
PRO FORMA PERFORMANCE The pro forma model was populated with inputs based on the market assessment and conversations with developers and contractors that work on similar multi-family projects. These inputs formed the baseline assumptions for the pro forma and produced a cash on cash return of 3.3 percent and 5.0 percent for stacked flat and garden style complexes respectively. Using these baseline assumptions the cash on cash returns for these two complex types are both below the target threshold. The sensitivity table shows the range of the cash on cash return if conditions affecting asking rents or land costs change (Table 7).
Key Pro Forma Inputs
Rental Rates: Garden $1.10/sf/mo Stacked Flat: $1.15/sf/mo
Construction costs : Garden: $88/GBSF Stacked Flat: $90/GBSF
Land cost: $16/sf
Environmental: $0
The pro forma assessed the potential impact that City measures and changes in market conditions or project design may have on the project performance. The following bullets summarize these modifications and how each affected the baseline assumptions.
City Measures:
Eliminate offsite costs in adjacent rights of way reduces hard costs (5 percent reduction of direct costs)
Streamline process provides marginal soft cost benefit (1 percent reduction of soft costs)
Allow low cost surface parking lots ($7k to $1k/stall reduction)

UNIVERSITY DISTRICT REDEVELOPMENT IMPLEMENTATION STRATEGY PAGE 18
Figure 11: Multi-family Return
Other Measures:
Value engineer construction costs (5 percent reduction of direct costs)
Employ a Multi-family Tax Exemption (MFTE) program. Requires a portion of a project to provide affordable housing for either eight or 12-years and in return real property taxes are exempt during that period lowering operating costs and improving the project’s value.
Leverage City investments to drive rents
o Garden Style: $1.15/sf/mo to $1.30 or an 18.0 percent increase
o Stacked Flat: $1.10/sf/mo to $1.45 or a 26.0 percent increase
The cumulative impact of multiple measures is needed for a new multi-family development to achieve the target financial return (Figure 11). As with the adaptive reuse scenario the first two City measures, eliminate offsite costs and streamline process, do not appear to have a significant direct impact on the cash on cash return. For reasons stated in the previous section these are important measures for the City to take. Allowing lower cost surface parking lots such as fewer curbs and less landscaping can have a more significant impact; however, due to the relative scale of the overall cost of multi-family projects compared to adaptive reuse projects this action would not have as great an effect. In order to push this project towards the target return the direct costs could be lowered by 5 percent and more importantly the MFTE program would need to be implemented for the Study Area AND rents would need to increase by 18 percent for Garden Style or 26 percent for Stacked Flat development. These would be significant rent increases. There is no comparable in the area for the $1.45/sf/mo rent for a stacked flat project. The garden style rental rate of $1.30/sf/mo is reasonable compared to rents at Kendall Yards.
UNIVERSITY DISTRICT REDEVELOPMENT IMPLEMENTATION STRATEGY PAGE 19
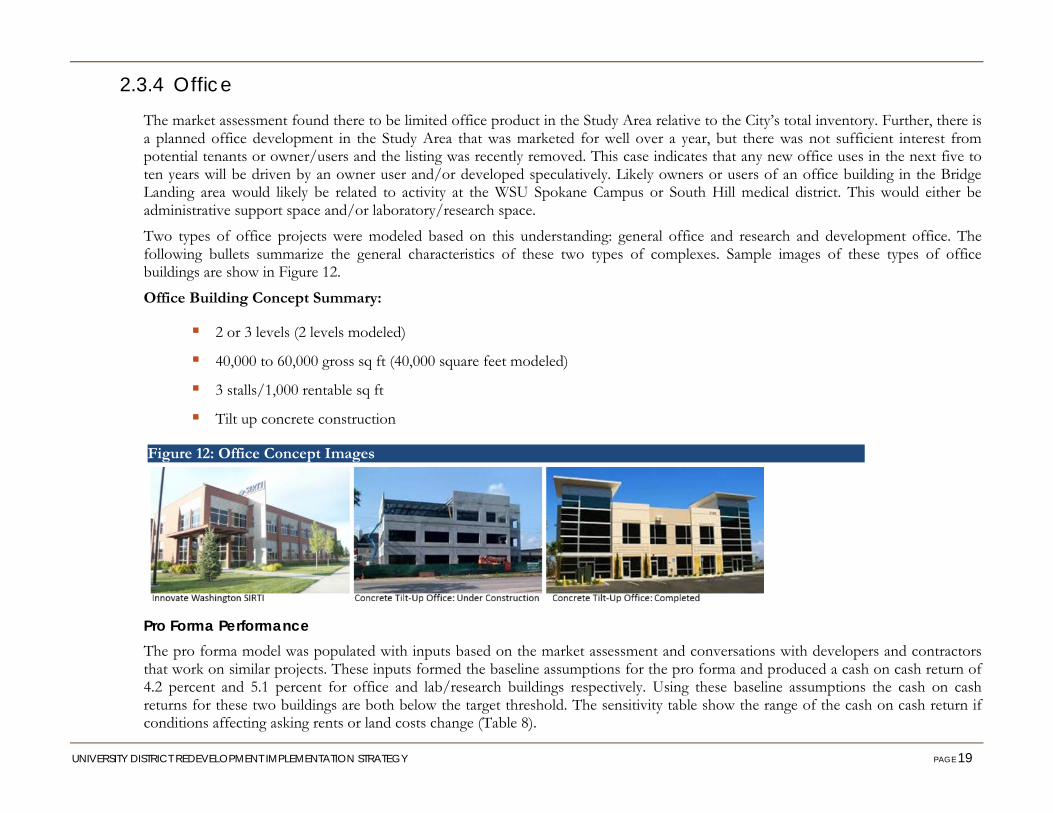
Figure 12: Office Concept Images
2.3.4 Office The market assessment found there to be limited office product in the Study Area relative to the City’s total inventory. Further, there is a planned office development in the Study Area that was marketed for well over a year, but there was not sufficient interest from potential tenants or owner/users and the listing was recently removed. This case indicates that any new office uses in the next five to ten years will be driven by an owner user and/or developed speculatively. Likely owners or users of an office building in the Bridge Landing area would likely be related to activity at the WSU Spokane Campus or South Hill medical district. This would either be administrative support space and/or laboratory/research space.
Two types of office projects were modeled based on this understanding: general office and research and development office. The following bullets summarize the general characteristics of these two types of complexes. Sample images of these types of office buildings are show in Figure 12.
Office Building Concept Summary:
2 or 3 levels (2 levels modeled)
40,000 to 60,000 gross sq ft (40,000 square feet modeled)
3 stalls/1,000 rentable sq ft
Tilt up concrete construction
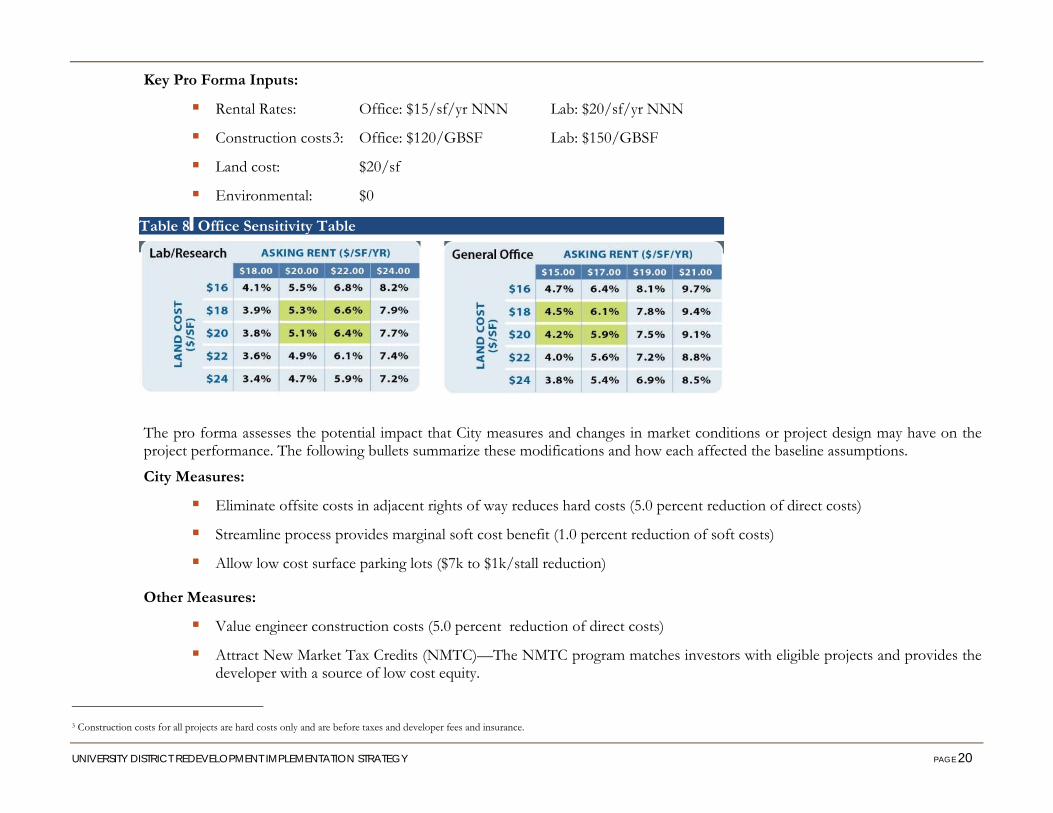
Pro Forma Performance The pro forma model was populated with inputs based on the market assessment and conversations with developers and contractors that work on similar projects. These inputs formed the baseline assumptions for the pro forma and produced a cash on cash return of 4.2 percent and 5.1 percent for office and lab/research buildings respectively. Using these baseline assumptions the cash on cash returns for these two buildings are both below the target threshold. The sensitivity table show the range of the cash on cash return if conditions affecting asking rents or land costs change (Table 8).
UNIVERSITY DISTRICT REDEVELOPMENT IMPLEMENTATION STRATEGY PAGE 20
Table 8: Office Sensitivity Table
Key Pro Forma Inputs:
Rental Rates: Office: $15/sf/yr NNN Lab: $20/sf/yr NNN
Construction costs3: Office: $120/GBSF Lab: $150/GBSF
Land cost: $20/sf
Environmental: $0
The pro forma assesses the potential impact that City measures and changes in market conditions or project design may have on the project performance. The following bullets summarize these modifications and how each affected the baseline assumptions.
City Measures:
Eliminate offsite costs in adjacent rights of way reduces hard costs (5.0 percent reduction of direct costs)
Streamline process provides marginal soft cost benefit (1.0 percent reduction of soft costs)
Allow low cost surface parking lots ($7k to $1k/stall reduction)
Other Measures:
Value engineer construction costs (5.0 percent reduction of direct costs)
Attract New Market Tax Credits (NMTC)—The NMTC program matches investors with eligible projects and provides the developer with a source of low cost equity.
3 Construction costs for all projects are hard costs only and are before taxes and developer fees and insurance.
UNIVERSITY DISTRICT REDEVELOPMENT IMPLEMENTATION STRATEGY PAGE 21
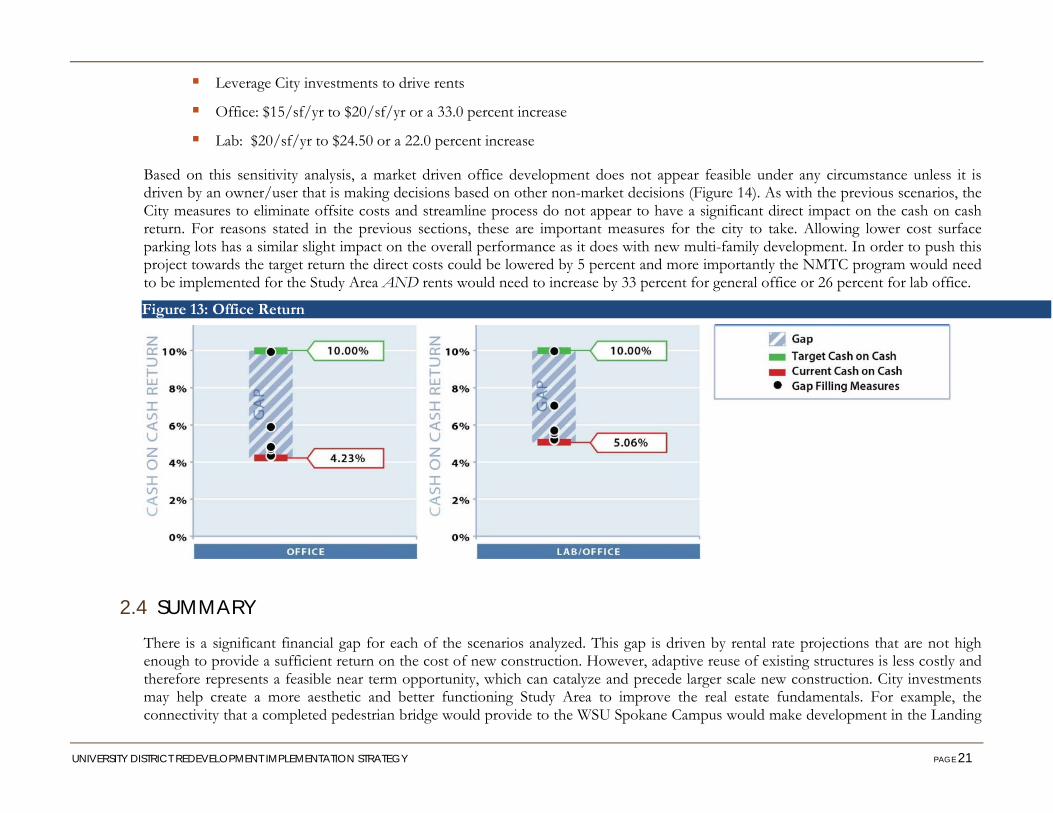
Figure 13: Office Return
Leverage City investments to drive rents
Office: $15/sf/yr to $20/sf/yr or a 33.0 percent increase
Lab: $20/sf/yr to $24.50 or a 22.0 percent increase
Based on this sensitivity analysis, a market driven office development does not appear feasible under any circumstance unless it is driven by an owner/user that is making decisions based on other non-market decisions (Figure 14). As with the previous scenarios, the City measures to eliminate offsite costs and streamline process do not appear to have a significant direct impact on the cash on cash return. For reasons stated in the previous sections, these are important measures for the city to take. Allowing lower cost surface parking lots has a similar slight impact on the overall performance as it does with new multi-family development. In order to push this project towards the target return the direct costs could be lowered by 5 percent and more importantly the NMTC program would need to be implemented for the Study Area AND rents would need to increase by 33 percent for general office or 26 percent for lab office.
2.4 SUMMARY There is a significant financial gap for each of the scenarios analyzed. This gap is driven by rental rate projections that are not high enough to provide a sufficient return on the cost of new construction. However, adaptive reuse of existing structures is less costly and therefore represents a feasible near term opportunity, which can catalyze and precede larger scale new construction. City investments may help create a more aesthetic and better functioning Study Area to improve the real estate fundamentals. For example, the connectivity that a completed pedestrian bridge would provide to the WSU Spokane Campus would make development in the Landing
UNIVERSITY DISTRICT REDEVELOPMENT IMPLEMENTATION STRATEGY PAGE 22
Area more attractive as students will have an easier time moving between these two areas. This would likely have a positive impact on rents. Another key influence on bridging the financial gap is encouraging the application of NMTCs and/or the MFTE.
UNIVERSITY DISTRICT REDEVELOPMENT IMPLEMENTATION STRATEGY PAGE 23
3 ENVIRONMENTAL CONCERNS
Historical operations in the South University District have the potential to have left legacy contamination in soil and groundwater. The WSU Spokane Campus is located on the site of a former rail yard that has required cleanup in certain locations work to allow development of academic and commercial buildings. Sprague Avenue was historically a major east-west road through Spokane. Automotive oriented businesses have lined Sprague Avenue since the 1950’s and were developed through much of the Study Area. These businesses included automotive sales, fueling stations, and service and repair shops, along with machine shops, paint shops, and warehouse and storage operations. While environmental conditions vary on any property, these types of industries are often associated with releases of hazardous substances.
3.1 TYPICAL IMPACTS There is potential of encountering legacy contamination from past commercial and industrial uses on a number of properties within the University District. A total of 26 sites within the University District are listed in the Department of Ecology Confirmed and Suspected Contaminated Sites List and Leaking Underground Storage Tank databases. The potential for environmental contamination also exists at other properties that have not been reported on these databases. A recent Eastern Washington University study found that approximately 328 acres, representing approximately 40% of the land in the University District is vacant or underutilized4. It is likely that many of these properties are constrained by environmental contamination concerns.
As part of this study an environmental site assessment was conducted on one prototype property in the Bridge Landing Area. Publicly available environmental records were also reviewed on surrounding properties. Based on this research, contamination concerns were found to be limited to releases of petroleum products from underground storage tanks. Because of the geologic setting with shallow bedrock and seasonal groundwater, impacts have typically been limited to shallow soil. Development projects in the adjacent WSU Spokane Campus have encountered more significant impacts including petroleum and heavy metals that are likely associated with the former rail yard operations.
4 Eastern Washington University Urban and Regional Planning Program. 2011. Spokane University District Assessment: A Search for Patterns.
http://www.spokaneuniversitydistrict.com/documents/UD_Assessment_2011_web.pdf
UNIVERSITY DISTRICT REDEVELOPMENT IMPLEMENTATION STRATEGY PAGE 24
3.2 GEOLOGIC SETTING In general, the Study Area is relatively level with a slight slope toward the Spokane River to the northeast. Soil structure is typically stony silt loam with moderate infiltration rates. Based on analysis of boring logs from environmental assessments conducted in the Study Area, the soils typically are underlain by basalts of the Columbia River Basalt Group at depths of approximately 2 to 11 feet.
Depth to groundwater in the Study Area is typically between 25 and 95 feet; however, a few instances of transient, shallow, perched groundwater above the basalt unit have been documented. This may be transient, shallow groundwater is likely associated with seasonal precipitation. The flow direction of shallow groundwater in the area is presumed to be to the north, based on topography.
Based on these geologic characteristics, releases of hazardous substances that may have occurred are not likely to impact groundwater. When impacts are confined to soil, the complexity and cost of cleanup are typically much less than when groundwater is contaminated.
3.3 ENVIRONMENTAL STRATEGY The remediation of a contaminated property can be a complicated and potentially expensive and time-consuming effort. It is important for a property owner or developer to maintain focus on the end goals of the project and adhere to a well thought-out strategy to minimize risks and costs. For properties with legacy impacts from historical operations, an environmental risk management strategy should be developed that is based on three components: selected cleanup approach, administrative pathway, and funding.
3.3.1 Cleanup Approach Cleanup of contaminated sites in Washington State is regulated under the Model Toxics Control Act (MTCA) through the Department of Ecology’s (Ecology) Toxics Cleanup Program. The administrative rules for implementing MTCA (WAC 173-240) establish the procedural and technical requirements for remediation. Before a contaminated property can be redeveloped, it is necessary to understand the character and extent of contamination and the potential impacts of that contamination and to establish agreement with Ecology as to how the impacts will be addressed (see Figure 14). MTCA establishes numeric cleanup standards for many contaminants, but regulatory closure can also be reached by a risk-based approach that breaks pathways of potential for human, fish, and wildlife exposure to the contamination. It is important to note that MTCA defines a contaminated “site” as the full extent of contamination, which may cross property boundaries, so achieving state approval of a cleanup may require actions on adjacent parcels.

UNIVERSITY DISTRICT REDEVELOPMENT IMPLEMENTATION STRATEGY PAGE 25
Figure 14: Steps in Cleanup Process
The cleanup standard for a property depends on a number of factors, including future use of the property, type of contaminants, and risk of exposure to human and ecological receptors. Cleanup standards are composed of a numeric cleanup level and a point of compliance, the location where the standard is to be met. The point of compliance may be at the property boundary or throughout the site.
The engineered remedy for any contamination should be designed to align with current operations or redevelopment plans for a property. It should also be informed by the available financial resources and risk tolerance of the property owner, developer, occupants, and lenders.
Properties impacted by petroleum releases are one of the most common types of contaminated sites, and a range of well understand and proven remedial actions have been developed over time. Common remedies for underground storage tank releases include:
Targeted Excavation and Disposal—Removal of the underground storage tank along with sampling excavation of surrounding soils, if they are impacted. Impacted materials would need to be characterized to assess whether they can be disposed of at a standard landfill or a specialized landfill for hazardous materials. The driver for designation as special waste is often lead, which was historically added to gasoline.
Closure in Place and Capping—Underground storage tanks can be cleaned out, filled, and closed in the ground. If no contaminants are migrating or causing immediate threats to human health or the environment, they can potentially be contained in place with an engineered cap. Options for capping material include clean soil, landscaped area, pavement, or building foundation. If contamination is left in place, the Department of Ecology will require that a restrictive covenant be placed on the property to ensure the capping system is maintained and protected and potentially limit future uses on the property.
In Situ Treatment—This involves injection of biological and chemical reagents into the soil and groundwater that break down the contaminants of concern into benign compounds. In situ treatment technology has been proven highly effective, but must be carefully designed for the specific geologic setting and contaminants of concern. In situ treatment would need to be followed by monitoring to assess effectiveness.
The decision of which remedial option to choose is largely driven by risk tolerance and financial capacity. If a property owner or developer has sufficient financial resources and a low tolerance for risk, then targeted excavation may be the best option since it physically removes all impacted soil from the property. However, if cleanup is self-funded and costs need to be minimized to make
UNIVERSITY DISTRICT REDEVELOPMENT IMPLEMENTATION STRATEGY PAGE 26
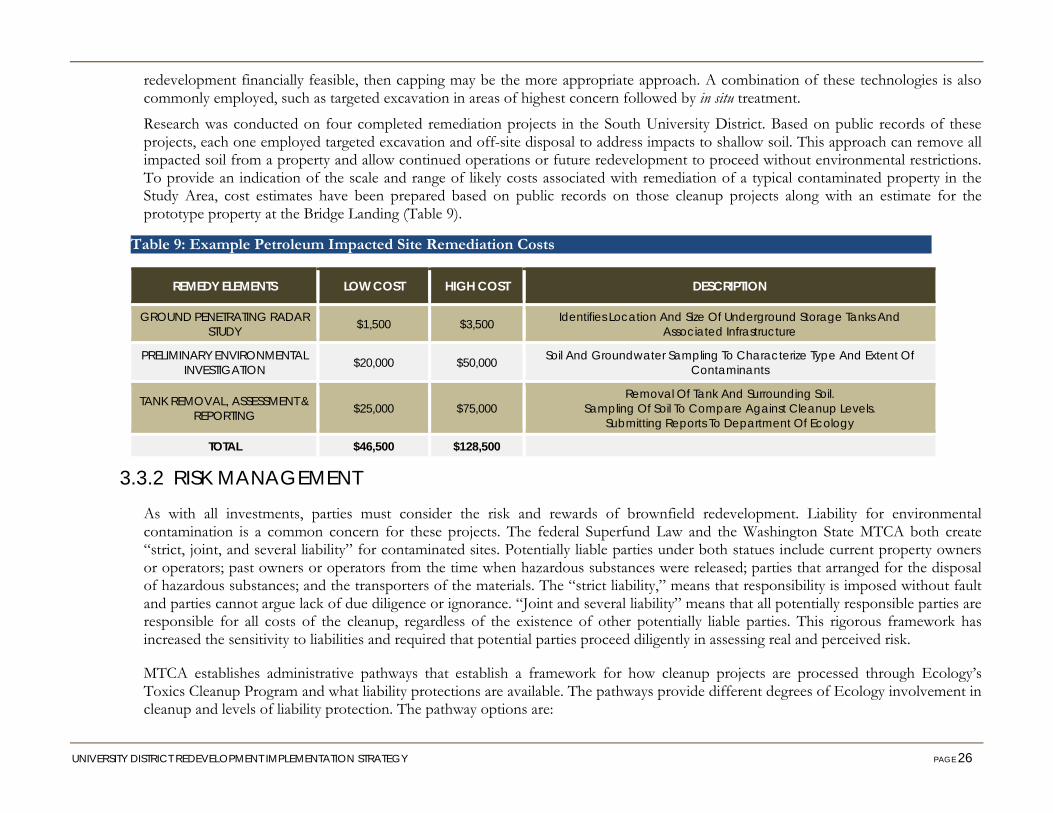
Table 9: Example Petroleum Impacted Site Remediation Costs
redevelopment financially feasible, then capping may be the more appropriate approach. A combination of these technologies is also commonly employed, such as targeted excavation in areas of highest concern followed by in situ treatment.
Research was conducted on four completed remediation projects in the South University District. Based on public records of these projects, each one employed targeted excavation and off-site disposal to address impacts to shallow soil. This approach can remove all impacted soil from a property and allow continued operations or future redevelopment to proceed without environmental restrictions. To provide an indication of the scale and range of likely costs associated with remediation of a typical contaminated property in the Study Area, cost estimates have been prepared based on public records on those cleanup projects along with an estimate for the prototype property at the Bridge Landing (Table 9).
3.3.2 RISK MANAGEMENT As with all investments, parties must consider the risk and rewards of brownfield redevelopment. Liability for environmental contamination is a common concern for these projects. The federal Superfund Law and the Washington State MTCA both create “strict, joint, and several liability” for contaminated sites. Potentially liable parties under both statues include current property owners or operators; past owners or operators from the time when hazardous substances were released; parties that arranged for the disposal of hazardous substances; and the transporters of the materials. The “strict liability,” means that responsibility is imposed without fault and parties cannot argue lack of due diligence or ignorance. “Joint and several liability” means that all potentially responsible parties are responsible for all costs of the cleanup, regardless of the existence of other potentially liable parties. This rigorous framework has increased the sensitivity to liabilities and required that potential parties proceed diligently in assessing real and perceived risk.
MTCA establishes administrative pathways that establish a framework for how cleanup projects are processed through Ecology’s Toxics Cleanup Program and what liability protections are available. The pathways provide different degrees of Ecology involvement in cleanup and levels of liability protection. The pathway options are:
REMEDY ELEMENTS LOW COST HIGH COST DESCRIPTION
GROUND PENETRATING RADAR STUDY $1,500 $3,500 Identifies Location And Size Of Underground Storage Tanks And
Associated Infrastructure
PRELIMINARY ENVIRONMENTAL INVESTIGATION $20,000 $50,000 Soil And Groundwater Sampling To Characterize Type And Extent Of
Contaminants
TANK REMOVAL, ASSESSMENT & REPORTING $25,000 $75,000
Removal Of Tank And Surrounding Soil. Sampling Of Soil To Compare Against Cleanup Levels.
Submitting Reports To Department Of Ecology
TOTAL $46,500 $128,500
UNIVERSITY DISTRICT REDEVELOPMENT IMPLEMENTATION STRATEGY PAGE 27
Voluntary Cleanup Program (VCP)—Provides limited Ecology review at the work party’s request and potential for a No Further Action (NFA) letter from the state upon completion of a satisfactory cleanup. The VCP is the most commonly used pathway for brownfield properties with relatively low levels of contamination. The NFA letter is typically acceptable assurance for financing institutions to lend money for development. However, Ecology opinions issued under the VCP are not binding and there is no formal settlement of liability.
Agreed Order—Negotiated agreement between the lead work party and Ecology on the scope and schedule of the cleanup. As long as the work is being done in compliance with the order, Ecology cannot pursue additional enforcement actions against the work party. Agreed Orders are not settlements of liability and do not provide the party with either a “covenant not to sue” (meaning that Ecology will not pursue further legal action) or contribution protection (meaning that other potentially liable parties are prevented from seeking compensation from the liable party). An Agreed Order does provide some formal assurance that the cleanup actions meet state standards, and it can be the basis for a Consent Decree.
Consent Decree—Legal settlement of liability with the state. Judicial approval of the consent decree provides the work party with both a covenant not to sue from the state and contribution protection, which precludes claims by other parties. Consent decrees do include reopener clauses that allow Ecology to require additional or different remedial action if the party does not complete the cleanup, if the remedial action did not achieve cleanup standards, or if new information reveals a previously unknown threat to human health or the environment at the site. To date, Ecology has not reopened any consent decrees.
The greatest liability protection is provided through the Consent Decree, but this also requires the greatest level of state oversight and highest transaction costs. The VCP is the most commonly utilized administrative pathway because of its relative expediency. The choice of administrative pathway also has implications for funding.
UNIVERSITY DISTRICT REDEVELOPMENT IMPLEMENTATION STRATEGY PAGE 28
3.3.3 FUNDING ENVIRONMENTAL CLEANUP There are three primary sources for funding environmental cleanup projects: grants, historic insurance recovery, and contribution from liable parties.
State Grants—MTCA establishes a fee on imported hazardous materials, including petroleum, that funds a grant program to support local governments in cleanup of contaminated properties. This fund for local government grants is robust and has been budgeted around $65 million in recent biennia. These Remedial Action Grants typically cover 50 percent of cleanup costs and require local matching funds. There are two types of Remedial Action Grants: Oversight Grants and Independent Grants. Oversight Grants are provided to local governments conducting cleanup under an Agreed Order or Consent Decree. The match ratio for these grants can be adjusted to as high as 90 percent funding on a case-by-case basis. Independent Grants are available to local governments that conduct
Liability Protections for Innocent Purchasers
Federal Liability under the Superfund Law—A Phase I Environmental Site Assessment (ESA) is a core requirement for limiting the liability of a prospective purchaser and for obtaining financing for a project. Under the federal Superfund Law “innocent landowner defense,” a landowner can be eligible for liability relief if it made “all appropriate inquiry” into the property’s previous ownership and history at the time of purchase, and it has not contributed to contamination of the site (§ 101(35)(A)(i)). Another reason why these site characterizations are important is that financial institutions typically require Phase I ESAs for securitized loans. A bank may require a loan applicant to provide a Phase I ESA and/or may commission a study on its own to quantify the potential risk and liability the property poses. It is important to note that federal law provides a liability exemption for lenders if they are not the owners or operators of a facility.
Note, under the federal regulations, a Phase I ESA is valid for six months. If the property transaction occurs more than six months after Phase I ESA is conducted, then the report will require updating to provide the innocent landowner defense.
Protection under Washington State’s MTCA—MTCA provides a similar defense for innocent purchasers if they conducted “all appropriate inquiry” prior to acquiring a property (RCW 70.105D.040(3)(b). This defense extends to impacts that were unknown or not discovered during the due diligence process. There is also a Prospective Purchaser Consent Decree that allows an innocent purchaser to enter into a Consent Decree and obtain the protections it provides prior to taking title to a property. The prospective purchaser must demonstrate a substantial public benefit, such as economic development, public recreation, or cleanup of an abandoned, vacant property to merit use of this special tool. Updates to MTCA in 2013 now allow for a Prospective Purchaser Agreed Order, which can be a vehicle to reach agreement with Ecology on the preferred cleanup option prior to purchase, but is not a settlement of liability.
UNIVERSITY DISTRICT REDEVELOPMENT IMPLEMENTATION STRATEGY PAGE 29
cleanups under the VCP. Independent Grants are limited to $600,000 in total eligible project costs. Like the Oversight grants, they typically require 50 percent match, but that can be adjusted to 90 percent.
Historical Insurance Recovery—Property owners have the opportunity to pursue funds to support environmental investigation and cleanup through claims on liability insurance carriers that provided coverage to either the current property owner or previous property owners and site operators. Before the mid-1980s, commercial general liability policies did not contain exclusions for liabilities caused by environmental damage. Therefore, cost recovery may be pursued from historical insurance policies that were in place when pollution occurred and that covered the property owner, operators, or other potentially liable parties. Historical insurance recovery requires a commitment of time and resources, but is becoming a standard industry practice. It should be noted that actions seeking liability insurance claims for environmental damage to a property are not actions against the site owner or operator, nor do they impact current or future insurance premiums. These are claims for damages in the past and are covered by liability policies for which coverage premiums were paid.
Contribution from Potentially Liable Parties—MTCA is based on the principle that liable parties should pay for environmental cleanup. One source of funds to assist in the cleanup is a contribution by historical liable parties that either owned or operated the site. This venue is available to any party acquiring a property with an outstanding environmental liability.
3.3.4 RECOMMENDED ROLE FOR CITY OF SPOKANE The capacity of public agencies to promote brownfield revitalization could be bolstered through a set of policy tools that strengthen or create new institutions focused on cleanup and redevelopment. These tools include historical insurance recovery support and a Redevelopment Opportunity Zone (ROZ).
Historical Insurance Recovery Support
Before the mid-1980s, commercial general liability policies did not contain exclusions for liabilities caused by environmental damage. Since federal and state law has made liability for environmental contamination retroactive, cost recovery may be pursued from historical insurance policies that were in place when pollution occurred and that covered the property owner, operators, or other potentially liable parties. It takes technical expertise and resources to make a claim on a historical insurance policy, but case law makes Washington one of the most favorable states in the country for these actions, and they are becoming standard practice. The City could provide technical support to property owners submitting a claim on historical insurance policies for environmental impacts. The City could contract with insurance archaeology firms or train their own staff to assist property owners in locating historic insurance policies and reviewing whether there is potential to submit a claim. Processing a claim requires support from an attorney, but the initial research can be conducted by staff or consultants. This relatively minor investment in staff or contractor resources could potentially generate millions of dollars to support assessment and cleanup of contamination.
UNIVERSITY DISTRICT REDEVELOPMENT IMPLEMENTATION STRATEGY PAGE 30
Redevelopment Opportunity Zones
Senate Bill 5296, passed in the 2013 legislative session, amends MTCA and authorizes cities to designate as ROZs areas where most of the properties are brownfields. This designation gives explicit priority for future state Remedial Action Grant funding and allows use of innovative tools, including:
Mixed-funding settlement agreements where public funding can be used to leverage private investment commensurate with a public benefit other than cleanup.
Establishing a “brownfield redevelopment trust fund account,” created within the state’s budget, that sets aside funds for cleanups that extend beyond a biennial budget cycle.
This combination of tools could have substantial advantages for attracting investment and promoting the long-term success of the University District redevelopment effort.
UNIVERSITY DISTRICT REDEVELOPMENT IMPLEMENTATION STRATEGY PAGE 31
4 DISTRICT REDEVELOPMENT STRATEGIES
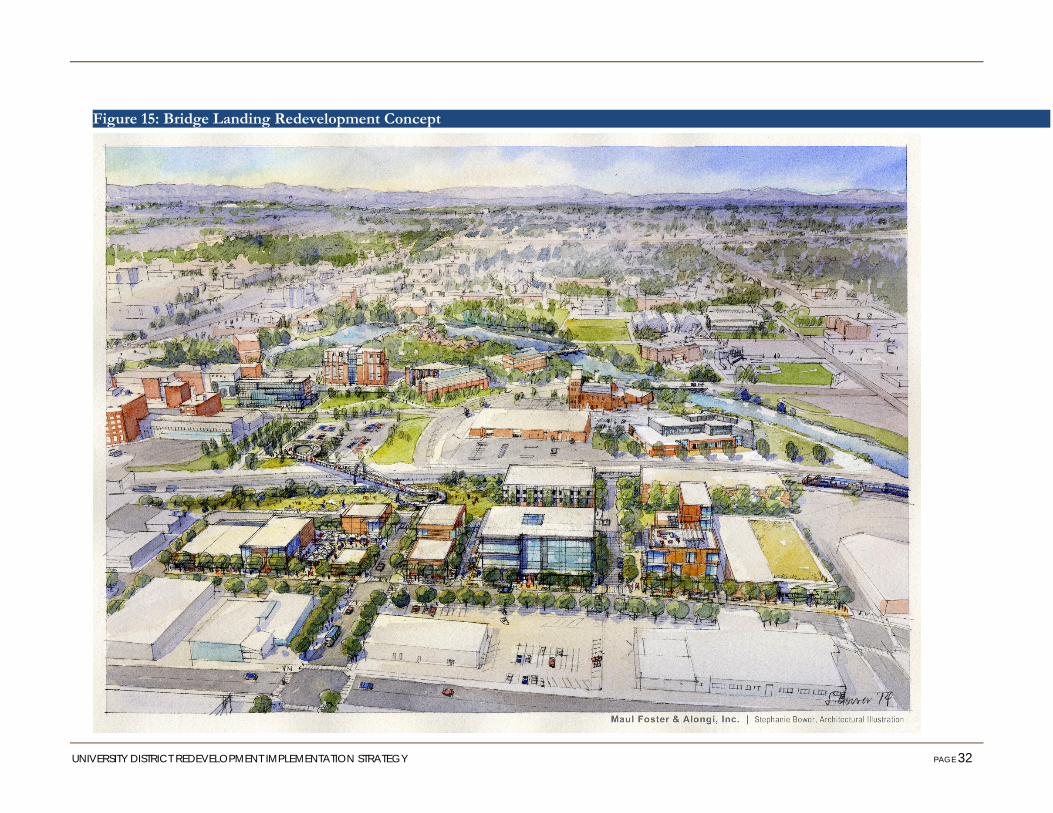
The vision for the future of the Bridge Landing is for a vibrant, creative, live-work-learn-play development. The Bridge Landing presents a unique opportunity to leverage the research and education assets of the academic institutions at WSU Spokane Campus and Gonzaga University with the biotechnical resources of the South Hill Medical District and proximity to the business energy of Downtown Spokane. Based on market opportunities and community aspirations, uses that appear to have the greatest viability in this location include multi-family residential housing, office and flex space targeted for the biotechnology sector, restaurants, and libations. These types of uses area all allowed under current zoning in the Study Area.
The design of these developments should align with the vision of previous planning efforts for an urban, mixed use community that is active 24 hours a day and seven days a week. This should include streetscape improvements to create a more pedestrian and bike friendly environment that also incorporates green infrastructure to manage stormwater runoff. An illustration of how full build-out of this area within current allowed density could look in the future is provided in Figure 16. Elements of this development scenario include office space designed to support technology and biotechnology research and development, multi-family residential units focused on supporting higher education students and researchers, ground floor retail, restaurants, and libations. This scenario includes structured parking near the southern landing of the pedestrian bridge to support achieving high density development in the long-term.
This report focuses on the strategies that can be employed by the City of Spokane and its partners in the academic community, private sector, and the neighborhoods to make the vision of redevelopment a reality. Guidance for individuals seeking to position their individual properties for redevelopment is provided in Appendix A.
4.1 DEVELOPMENT PHASING Based on current market conditions, it is likely that the first financially viable redevelopment projects in the Study Area will involve adaptive reuse of existing buildings. With adaptive re-use there is a lower cost of investment needed to generate an increase in rental rates than with new construction, as shown in the pro forma analysis in section 2.3. If adaptive re-use projects can be successful, rents in the Study Area are likely to increase and the financial feasibility of new construction projects will improve. Public realm improvements such as streetscape design improvements can provide additional lift in rental rates and a signal to the private market that this is an area poised for redevelopment.
UNIVERSITY DISTRICT REDEVELOPMENT IMPLEMENTATION STRATEGY PAGE 32
Figure 15: Bridge Landing Redevelopment Concept
UNIVERSITY DISTRICT REDEVELOPMENT IMPLEMENTATION STRATEGY PAGE 33
4.2 ENGAGING INTERESTED PARTIES & LEVERAGING ASSETS To be successful, the early stages of district scale redevelopment require action by a wide variety of stakeholders, each of whom needs their own motivation(s) to participate. The University District is well endowed with key stakeholders that can each contribute to and gain from incremental redevelopment of the district. The following outlines a strategy for engaging with key stakeholders, leveraging assets and catalyzing new private investment.
4.2.1 The District Offering The “District Offering” strategy follows the same basic approach that a landowner would take to sell a development property but is expanded to address the more complex nature of the assets and stakeholders within the District. The end goal of this process is to facilitate a critical mass of private investment that leverages the planned public investments. Implementation of this strategy includes the following steps:
1. Development of the Memorandum of Understanding (MOU):
The MOU sets the stage for the creation of a market based offering by detailing the roles, commitments and assets associated with the University District stakeholders which include but are not limited to: The City of Spokane, Washington State University, the University District PDA, Eastern Washington University, Gonzaga University, Avista Corporation and private property owners. Private developers, investors and users constitute the ultimate target of the offering.
Roles: The stakeholders will play a variety of roles in the effort to redevelop the University District including:
o Property owner—Parties that own properties that may be included as development opportunities in the offering.
o Facilitator/Manager—The entity charged with managing the offering process that ultimately leads to binding agreements that support investment and development.
o Demand Drivers/Users—Organizations whose continuing growth directly or indirectly drives the need for new space and facilities within the district.
Assets: The catalyst redevelopment opportunities that are targeted for inclusion in the offering and that will therefore be addressed in the MOU include:

UNIVERSITY DISTRICT REDEVELOPMENT IMPLEMENTATION STRATEGY PAGE 34
Figure 16: District Offering Strategy
Commitments: The commitments made by the stakeholders in the MOU serve as the foundation upon which the offering will be based. The more detailed the commitments in the MOU, the more certainty can be offered to the private markets the more attractive and effective the investment opportunity will be. The type of commitments will vary by stakeholder but will generally demonstrate a willingness to act providing that certain preconditions are met. For example, willingness by a party to transfer real estate to another party under specific terms and conditions which may include financial consideration, lease terms, environmental indemnification, a development agreement with a qualified party and/or a range of other terms.
UNIVERSITY DISTRICT REDEVELOPMENT IMPLEMENTATION STRATEGY PAGE 35
Process: The following tasks will guide the creation of the MOU.
o Road Map: Working closely with City Staff, the consultant team will create a comprehensive outline of how the MOU components fit together and what is needed from the stakeholders.
o Stakeholder Outreach: The consultant team will engage each stakeholder to discuss the intent of the District Offering strategy and the MOU’s role in the process.
o MOU Drafting: Based on the stakeholder feedback, the consultant team will create a draft MOU for the City’s review.
o MOU Presentation, Revision & Execution: The consultant team will work with the stakeholders individually and/or as a group to review and refine the draft MOU until it can be executed.
2. Formation of the Offering:
With an executed MOU, the consultant team will create an Offering Memorandum that presents the University District redevelopment opportunities and outlines the process whereby various private sector entities may participate.
4.3 SOLICITING PRIVATE INVESTMENT—MARKET ENGAGEMENT As discussed above, district wide redevelopment requires proactive advocacy. The process of engaging with the market and securing private investment would be accomplished in two phases. A lead entity, such as the UDDA, will need to be designated to coordinate this process.
PHASE 1-MARKET ENGAGEMENT Marketing development sites is essentially a managed conversation. The lead entity, on behalf of the stakeholders, will initiate the conversation through the Offering Memorandum and then proactively engage with the market to discuss how the opportunity can help a developer/user achieve their goals. As with any conversation, effective listening to feedback from the market improves the transaction team’s ability to correctly position the asset. Working closely with stakeholders, the lead entity will launch the marketing campaign through the following steps:
Dissemination of the Offering Memorandum to a target list of developers and users
Creation of a due diligence repository that allows interested parties to initiate underwriting and due diligence
Directly engage with international, national, regional and local developers and users through phone conferences, meetings/site tours and email.
Work proactively with developers and users to develop responsive proposals.

UNIVERSITY DISTRICT REDEVELOPMENT IMPLEMENTATION STRATEGY PAGE 36
This hands-on approach to the marketing and deal development process is intended to get market participants to prioritize the University District above other development opportunities and prepare proposals that are competitive and achieve the triggers and thresholds outlined in the MOU. The market engagement phase of the process concludes at the deadline for proposal submittals that are the most informed, competitive and responsive proposals that the market can produce.
PHASE 2-ANALYSIS, NEGOTIATION & DOCUMENTATION This phase of the process includes evaluating responses, then developing a negotiation strategy, selecting the best-fit proposal(s), and working through the process of documenting the transaction(s). In collaboration with stakeholders, the lead entity will:
Analyze Offering Memorandum responses with a summary evaluation, financial comparison and recommendation.
Work with staff to formulate a negotiation strategy
Facilitate multi party proposal refinement/clarification/negotiation
Select the best proposal for exclusive negotiation and documentation.
This phase of the process concludes with final transaction agreements and supporting analyses for consideration and approval by the stakeholders.

APPENDIX A STRATEGIES FOR REDEVELOPMENT OF
INDIVIDUAL PROPERTIES

Appendix A University District Redevelopment Implementation Strategy
Figure: Approach for Redevelopment of Individual Properties
APPENDIX A
A MANUAL FOR OWNERS & INVESTORS STRATEGIES FOR REDEVELOPMENT OF INDIVIDUAL PROPERTIES
The City of Spokane (City) and the University District Development Association (UDDA) are working with their partners to revitalize the University District into a vibrant, sustainably designed regional center for research and innovation. The Study Area of interest is 160 acre area bordered by the Burlington Northern-Santa Fe railway to the north, I-90 to the south, Division Street to the west, and North Hamilton Street (Highway 290) to the east.
Environmental Conditions. Historical property uses in the South University District have the potential to have left contamination in soil and groundwater. The area has been characterized by automotive-oriented commercial and light industrial businesses since the 1950s. While environmental conditions vary on any property, these types of industries are often associated with releases of hazardous substances.
Vision for the District. The City and interested stakeholders have actively worked to implement the University District Strategic Master Plan. The Master Plan envisions the University District as a vibrant, 24/7, pedestrian-first place with an eclectic mix of uses, including housing, offices shops, university uses, manufacturing, and warehouses.
Opportunities for Redevelopment. Individual property owners have the opportunity to use these efforts to leverage redevelopment on their own property. However, properties in the South University District must be redeveloped in context with existing environmental conditions in order to mitigate potential liability and financial constraints. There are several steps a prospective purchaser or developer can take to protect themselves from unnecessary liability and leverage their property’s redevelopment. When possible, prospective property owners should take actions prior to site acquisition, such as undergo an environmental assessment; however, there are several actions that current land owners can take to facilitate transacting or redeveloping a property. These steps are outlined below.
Conduct Preliminary
Environmental Assessment
Assess and Manage RiskIf Contamination
Found
Determine Funding Strategy
Proceed to Cleanup
Step 1 Step 2 Step 3 Step 4
Purpose of the Manual
Redevelopment of contaminated properties is increasingly common. There is a well-defined regulatory process to clean up impacted properties, and there are a suite of legal and financial tools to manage risk on these sites. This manual dispels the misunderstandings and provides an introduction to important concepts in brownfield redevelopment.
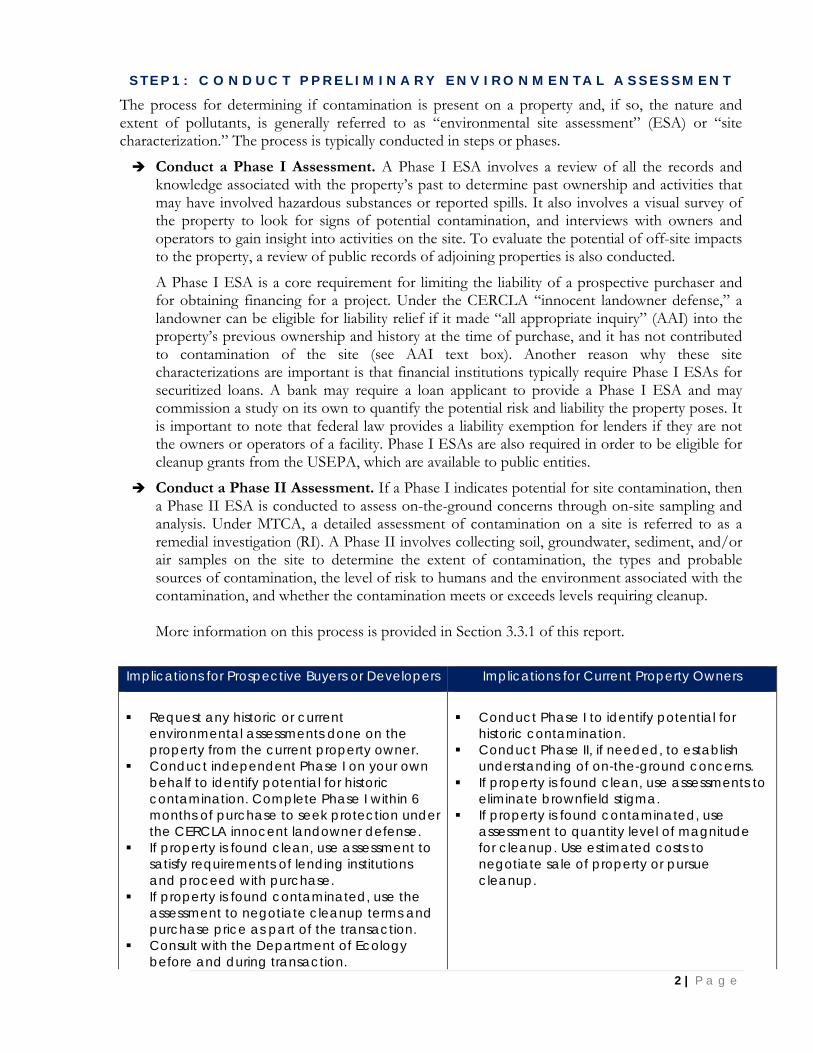
2 | P a g e
S T E P 1 : C O N D U C T P P R E L I M I N A R Y E N V I R O N M E N T A L A S S E S S M E N T
The process for determining if contamination is present on a property and, if so, the nature and extent of pollutants, is generally referred to as “environmental site assessment” (ESA) or “site characterization.” The process is typically conducted in steps or phases.
Conduct a Phase I Assessment. A Phase I ESA involves a review of all the records and knowledge associated with the property’s past to determine past ownership and activities that may have involved hazardous substances or reported spills. It also involves a visual survey of the property to look for signs of potential contamination, and interviews with owners and operators to gain insight into activities on the site. To evaluate the potential of off-site impacts to the property, a review of public records of adjoining properties is also conducted.
A Phase I ESA is a core requirement for limiting the liability of a prospective purchaser and for obtaining financing for a project. Under the CERCLA “innocent landowner defense,” a landowner can be eligible for liability relief if it made “all appropriate inquiry” (AAI) into the property’s previous ownership and history at the time of purchase, and it has not contributed to contamination of the site (see AAI text box). Another reason why these site characterizations are important is that financial institutions typically require Phase I ESAs for securitized loans. A bank may require a loan applicant to provide a Phase I ESA and may commission a study on its own to quantify the potential risk and liability the property poses. It is important to note that federal law provides a liability exemption for lenders if they are not the owners or operators of a facility. Phase I ESAs are also required in order to be eligible for cleanup grants from the USEPA, which are available to public entities.
Conduct a Phase II Assessment. If a Phase I indicates potential for site contamination, then a Phase II ESA is conducted to assess on-the-ground concerns through on-site sampling and analysis. Under MTCA, a detailed assessment of contamination on a site is referred to as a remedial investigation (RI). A Phase II involves collecting soil, groundwater, sediment, and/or air samples on the site to determine the extent of contamination, the types and probable sources of contamination, the level of risk to humans and the environment associated with the contamination, and whether the contamination meets or exceeds levels requiring cleanup. More information on this process is provided in Section 3.3.1 of this report.
Implications for Prospective Buyers or Developers Implications for Current Property Owners
Request any historic or current
environmental assessments done on the property from the current property owner.
Conduct independent Phase I on your own behalf to identify potential for historic contamination. Complete Phase I within 6 months of purchase to seek protection under the CERCLA innocent landowner defense.
If property is found clean, use assessment to satisfy requirements of lending institutions and proceed with purchase.
If property is found contaminated, use the assessment to negotiate cleanup terms and purchase price as part of the transaction.
Consult with the Department of Ecology before and during transaction.
Conduct Phase I to identify potential for
historic contamination. Conduct Phase II, if needed, to establish
understanding of on-the-ground concerns. If property is found clean, use assessments to
eliminate brownfield stigma. If property is found contaminated, use
assessment to quantity level of magnitude for cleanup. Use estimated costs to negotiate sale of property or pursue cleanup.
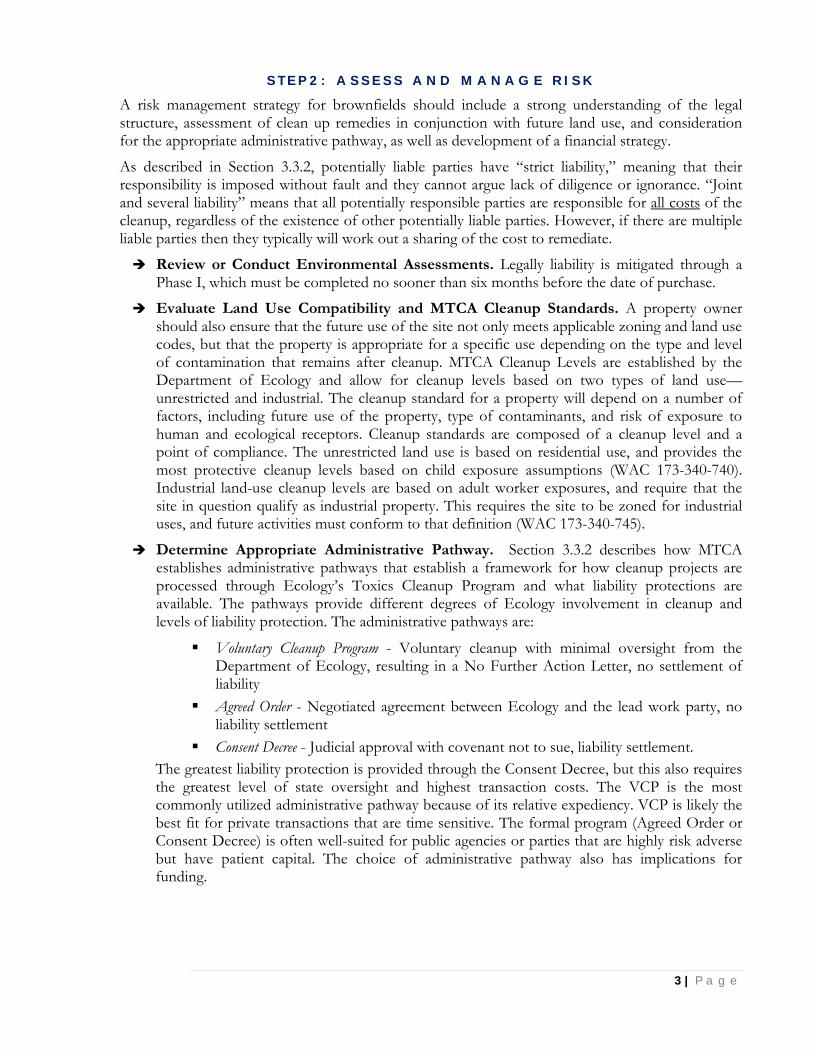
3 | P a g e
S T E P 2 : A S S E S S A N D M A N A G E R I S K
A risk management strategy for brownfields should include a strong understanding of the legal structure, assessment of clean up remedies in conjunction with future land use, and consideration for the appropriate administrative pathway, as well as development of a financial strategy.
As described in Section 3.3.2, potentially liable parties have “strict liability,” meaning that their responsibility is imposed without fault and they cannot argue lack of diligence or ignorance. “Joint and several liability” means that all potentially responsible parties are responsible for all costs of the cleanup, regardless of the existence of other potentially liable parties. However, if there are multiple liable parties then they typically will work out a sharing of the cost to remediate.
Review or Conduct Environmental Assessments. Legally liability is mitigated through a Phase I, which must be completed no sooner than six months before the date of purchase.
Evaluate Land Use Compatibility and MTCA Cleanup Standards. A property owner should also ensure that the future use of the site not only meets applicable zoning and land use codes, but that the property is appropriate for a specific use depending on the type and level of contamination that remains after cleanup. MTCA Cleanup Levels are established by the Department of Ecology and allow for cleanup levels based on two types of land use—unrestricted and industrial. The cleanup standard for a property will depend on a number of factors, including future use of the property, type of contaminants, and risk of exposure to human and ecological receptors. Cleanup standards are composed of a cleanup level and a point of compliance. The unrestricted land use is based on residential use, and provides the most protective cleanup levels based on child exposure assumptions (WAC 173-340-740). Industrial land-use cleanup levels are based on adult worker exposures, and require that the site in question qualify as industrial property. This requires the site to be zoned for industrial uses, and future activities must conform to that definition (WAC 173-340-745).
Determine Appropriate Administrative Pathway. Section 3.3.2 describes how MTCA establishes administrative pathways that establish a framework for how cleanup projects are processed through Ecology’s Toxics Cleanup Program and what liability protections are available. The pathways provide different degrees of Ecology involvement in cleanup and levels of liability protection. The administrative pathways are:
Voluntary Cleanup Program - Voluntary cleanup with minimal oversight from the Department of Ecology, resulting in a No Further Action Letter, no settlement of liability
Agreed Order - Negotiated agreement between Ecology and the lead work party, no liability settlement
Consent Decree - Judicial approval with covenant not to sue, liability settlement. The greatest liability protection is provided through the Consent Decree, but this also requires the greatest level of state oversight and highest transaction costs. The VCP is the most commonly utilized administrative pathway because of its relative expediency. VCP is likely the best fit for private transactions that are time sensitive. The formal program (Agreed Order or Consent Decree) is often well-suited for public agencies or parties that are highly risk adverse but have patient capital. The choice of administrative pathway also has implications for funding.

4 | P a g e
Negotiate Terms of Transaction. Once these factors are understood, contamination can be addressed through the transaction process by:
a. Reducing the purchase price and agreeing that future buyer conducts cleanup b. Negotiating full market value, with clause that seller addresses contamination c. Executing an indemnification and release clause, either on behalf of the buyer or seller
Integrate Cleanup and Development. Future site plans for brownfield properties should be developed alongside the environmental investigation and cleanup plan. This requires good communication and teamwork between the environmental consultants and planning and design consultants, but ensures cost and time savings that can be found by aligning cleanup and redevelopment plans. For example, capping areas of low concentrations of soil contaminants may both serve as a cleanup action and create a desirable grade elevation for redevelopment.
Implications for Prospective Buyers or Developers Implications for Current Property Owners
Complete a Phase I on buyer’s behalf and
ensure that it was completed within 6 months of date of purchase.
Ensure that the property’s intended use is compatible with land use regulations and MTCA Cleanup Standards.
If cleanup is necessary, work with the Department of Ecology to establish the most appropriate administrative pathway, based on the buyer’s risk tolerance.
Negotiate purchase price and cleanup responsibilities through property transaction process.
Work with consultants and design team to integrate site design to accommodate potential cleanup remedies.
Develop a strong understanding of existing
environmental site conditions to clarify misconceptions, attract investors, and understand your responsibility for cleanup.
Adjust purchase price and conditions to reach agreement on cleanup and sale.
If involved in cleanup, work with the Department of Ecology to establish the most appropriate administrative pathway, based on the buyer’s risk tolerance.
Work with consultants and design team to integrate site design to accommodate potential cleanup remedies.
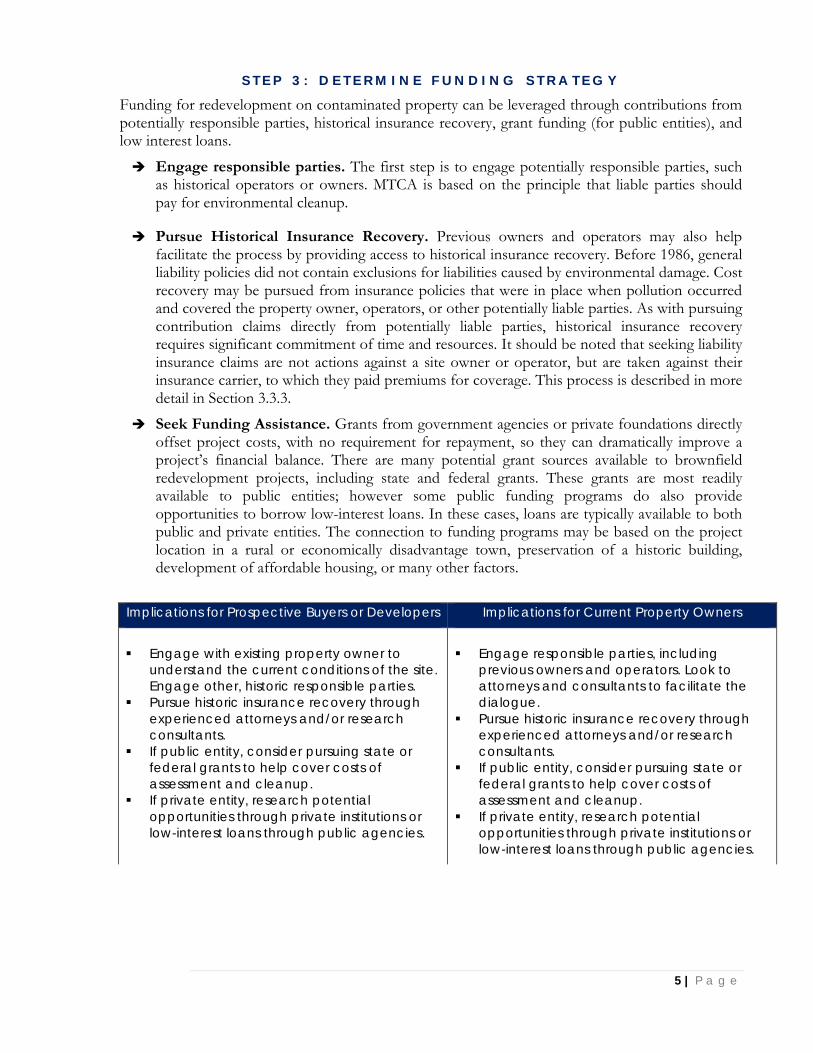
5 | P a g e
S T E P 3 : D E T E R M I N E F U N D I N G S T R A T E G Y
Funding for redevelopment on contaminated property can be leveraged through contributions from potentially responsible parties, historical insurance recovery, grant funding (for public entities), and low interest loans.
Engage responsible parties. The first step is to engage potentially responsible parties, such as historical operators or owners. MTCA is based on the principle that liable parties should pay for environmental cleanup.
Pursue Historical Insurance Recovery. Previous owners and operators may also help facilitate the process by providing access to historical insurance recovery. Before 1986, general liability policies did not contain exclusions for liabilities caused by environmental damage. Cost recovery may be pursued from insurance policies that were in place when pollution occurred and covered the property owner, operators, or other potentially liable parties. As with pursuing contribution claims directly from potentially liable parties, historical insurance recovery requires significant commitment of time and resources. It should be noted that seeking liability insurance claims are not actions against a site owner or operator, but are taken against their insurance carrier, to which they paid premiums for coverage. This process is described in more detail in Section 3.3.3.
Seek Funding Assistance. Grants from government agencies or private foundations directly offset project costs, with no requirement for repayment, so they can dramatically improve a project’s financial balance. There are many potential grant sources available to brownfield redevelopment projects, including state and federal grants. These grants are most readily available to public entities; however some public funding programs do also provide opportunities to borrow low-interest loans. In these cases, loans are typically available to both public and private entities. The connection to funding programs may be based on the project location in a rural or economically disadvantage town, preservation of a historic building, development of affordable housing, or many other factors.
Implications for Prospective Buyers or Developers Implications for Current Property Owners
Engage with existing property owner to
understand the current conditions of the site. Engage other, historic responsible parties.
Pursue historic insurance recovery through experienced attorneys and/or research consultants.
If public entity, consider pursuing state or federal grants to help cover costs of assessment and cleanup.
If private entity, research potential opportunities through private institutions or low-interest loans through public agencies.
Engage responsible parties, including
previous owners and operators. Look to attorneys and consultants to facilitate the dialogue.
Pursue historic insurance recovery through experienced attorneys and/or research consultants.
If public entity, consider pursuing state or federal grants to help cover costs of assessment and cleanup.
If private entity, research potential opportunities through private institutions or low-interest loans through public agencies.