university investments in the library an international study ingrid van de stadt regional customer...
Post on 19-Dec-2015
214 views
TRANSCRIPT

University Investmentsin the Library
An International Study
Ingrid van de StadtRegional Customer Development
Manager, Elsevier
Moscow, 18 december 2009

The perceived value of the library is falling
Online catalogs
CD-ROMs
Web browsers
Amount spent on library resources
Perceived value of library as an information gateway
Value Gap
Chart courtesy of Dr Carol Tenopir, 2009
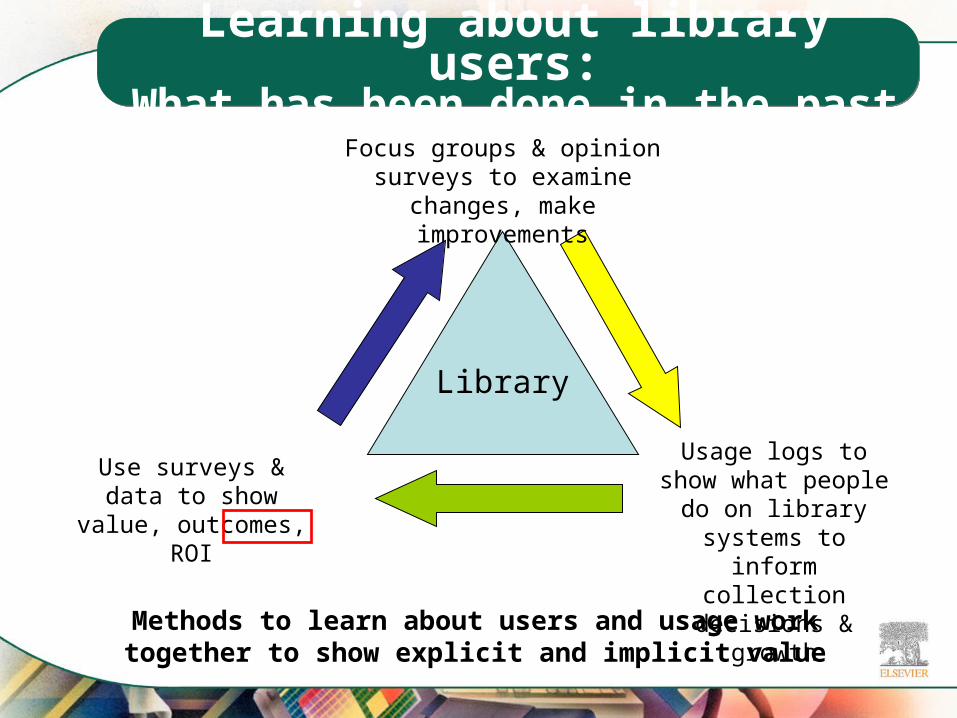
Learning about library users:What has been done in the past
Library
Focus groups & opinion surveys to examine changes, make
improvements
Use surveys & data to show value,
outcomes, ROI
Usage logs to show what people do on library systems to inform collection
decisions & growth
Methods to learn about users and usage work together to show explicit and implicit value
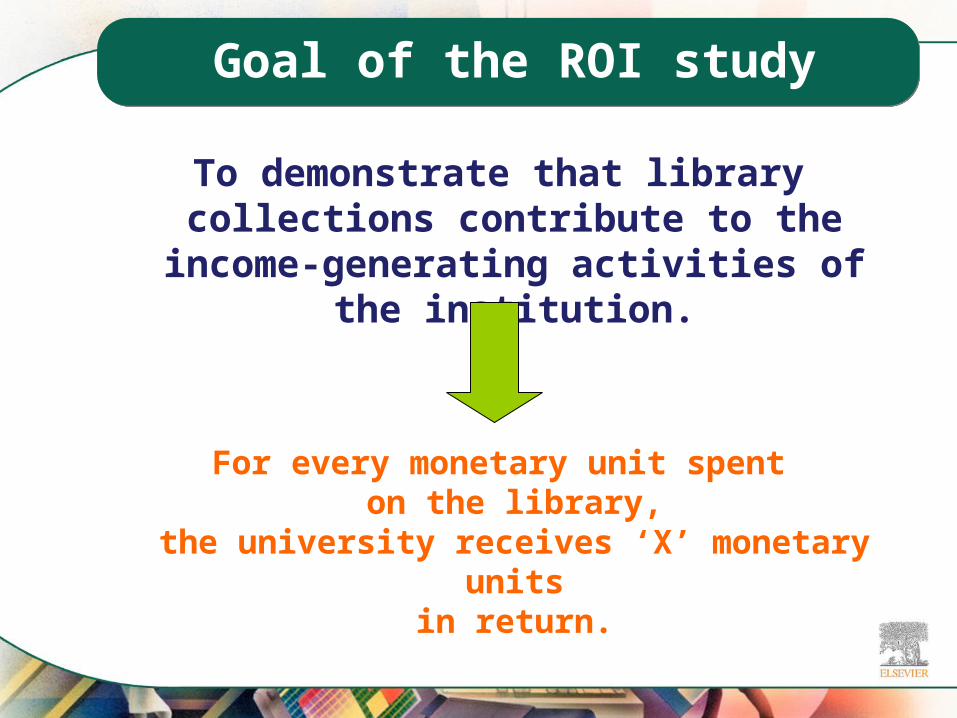
Goal of the ROI study
To demonstrate that library collections contribute to the income-generating
activities of the institution.
For every monetary unit spenton the library,
the university receives ‘X’ monetary unitsin return.

Quantifying for the university

Types of data:Reliable, accessible, clearly defined
Data types Methods
Research Faculty Survey: quantitative and qualitative
Grant Proposals University-supplied data; survey
Grant Income University-supplied data
Library Total budget (including collection, facilities, personnel, etc.)
Administrators’ Priorities Personal interviews (with library leadership, university executives, and research managers)
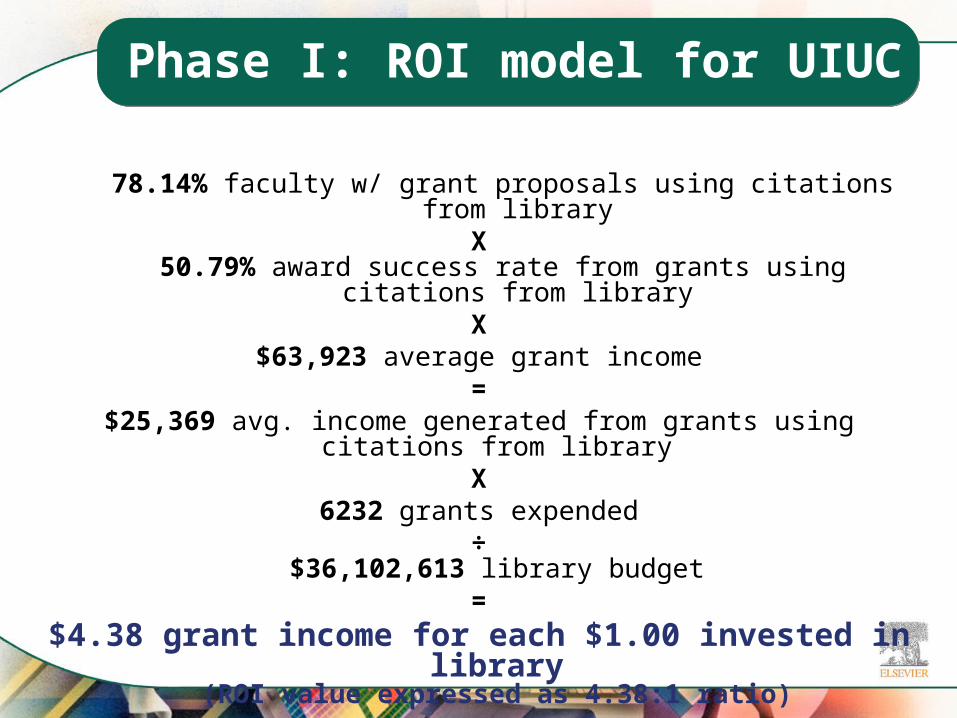
Phase I: ROI model for UIUC
78.14% faculty w/ grant proposals using citations from libraryX
50.79% award success rate from grants using citations from libraryX
$63,923 average grant income=
$25,369 avg. income generated from grants using citations from libraryX
6232 grants expended÷
$36,102,613 library budget=
$4.38 grant income for each $1.00 invested in library(ROI value expressed as 4.38:1 ratio)

Phase II Principal Investigator
Dr Carol Tenopir University of Tennessee, Knoxville Chancellor’s Professor, School of
Information Sciences Director of Research, College of
Communication and Information Director, Center for Information and
Communication Studies
Phase II: ROI in grants, expanded to 8 institutions in 8 countries (completed 2009)
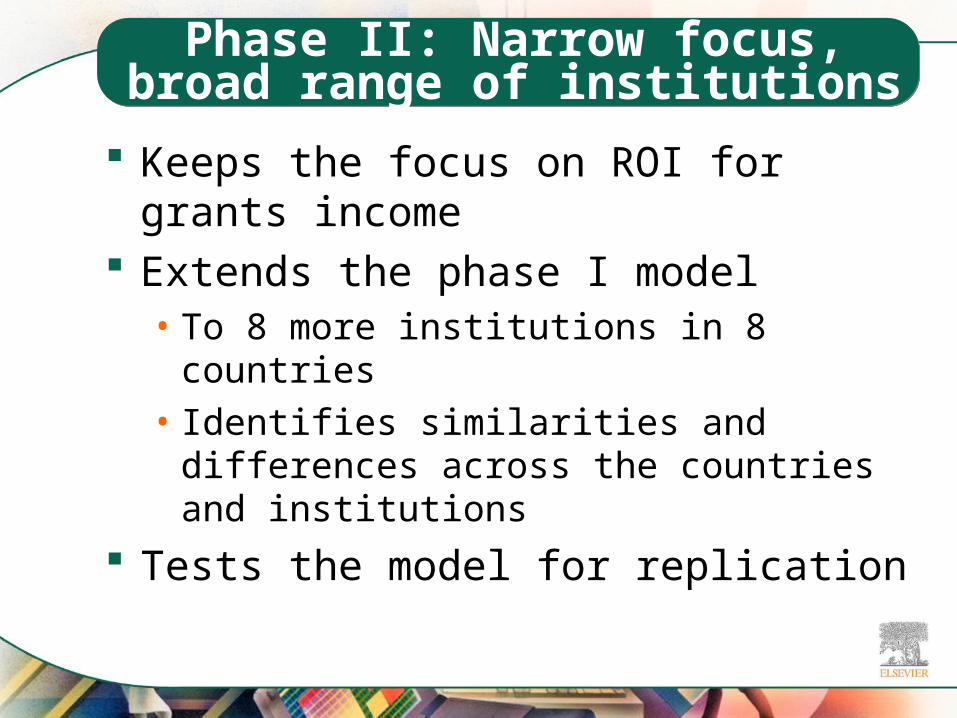
Phase II: Narrow focus, broad range of institutions
Keeps the focus on ROI for grants income
Extends the phase I model• To 8 more institutions in 8 countries• Identifies similarities and differences across
the countries and institutions
Tests the model for replication
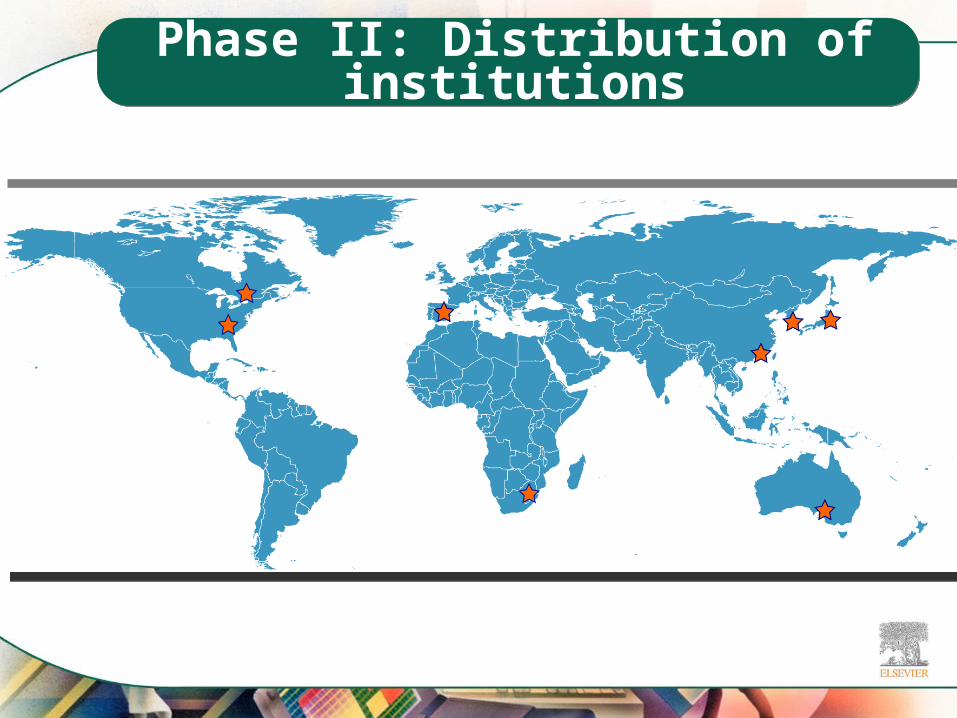
Phase II: Distribution of institutions

Analytical approach
Interviews with key administrators to capture the institutional goals and values
Library budget figures over time Grants income over time Faculty survey to measure:
• Total number of grant proposals• Number of grant proposals that included citations• Number of grant awards from proposals that included
citations• Importance of citations in grant proposals
Testimonials (in survey or through faculty interviews) that focus on outcomes of library use
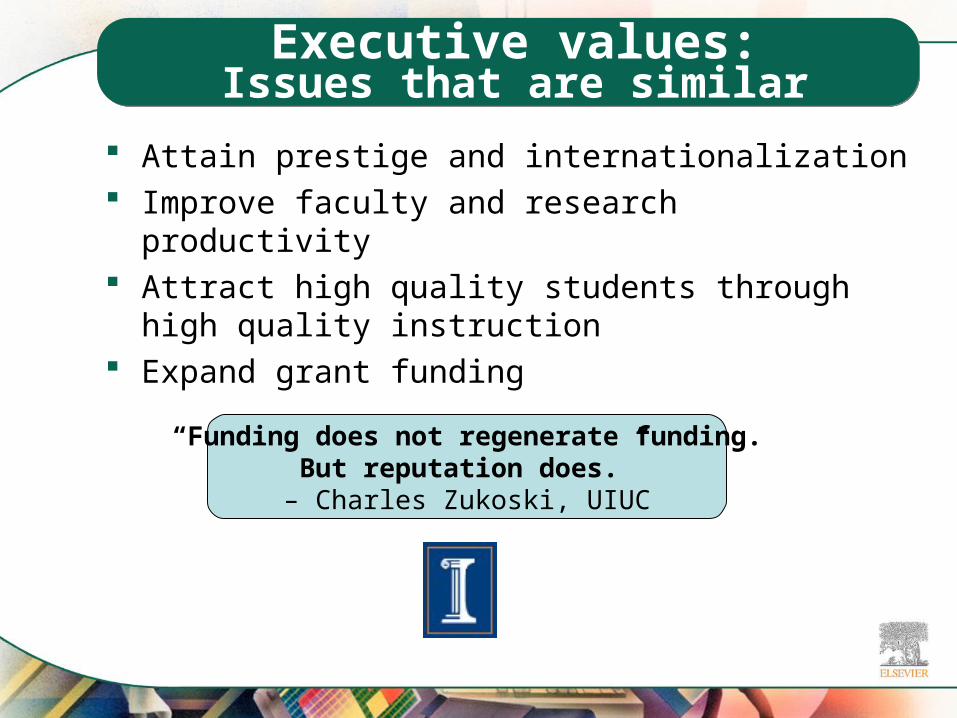
Executive values:Issues that are similar
Attain prestige and internationalization Improve faculty and research productivity Attract high quality students through high quality
instruction Expand grant funding
“Funding does not regenerate funding.But reputation does.”
– Charles Zukoski, UIUC
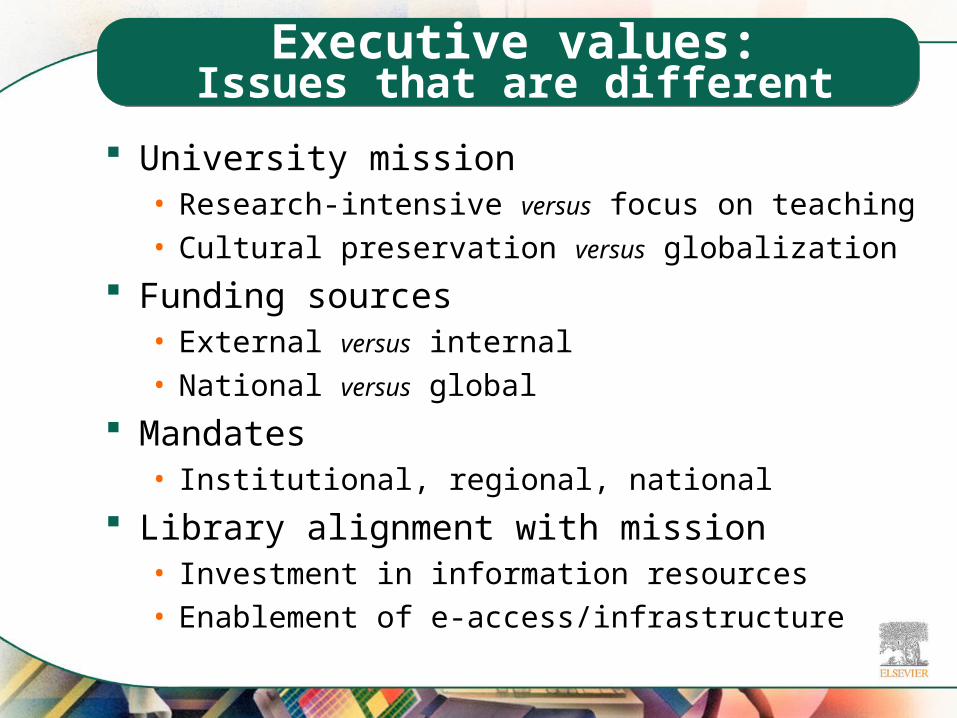
Executive values:Issues that are different
University mission• Research-intensive versus focus on teaching• Cultural preservation versus globalization
Funding sources• External versus internal• National versus global
Mandates• Institutional, regional, national
Library alignment with mission• Investment in information resources• Enablement of e-access/infrastructure
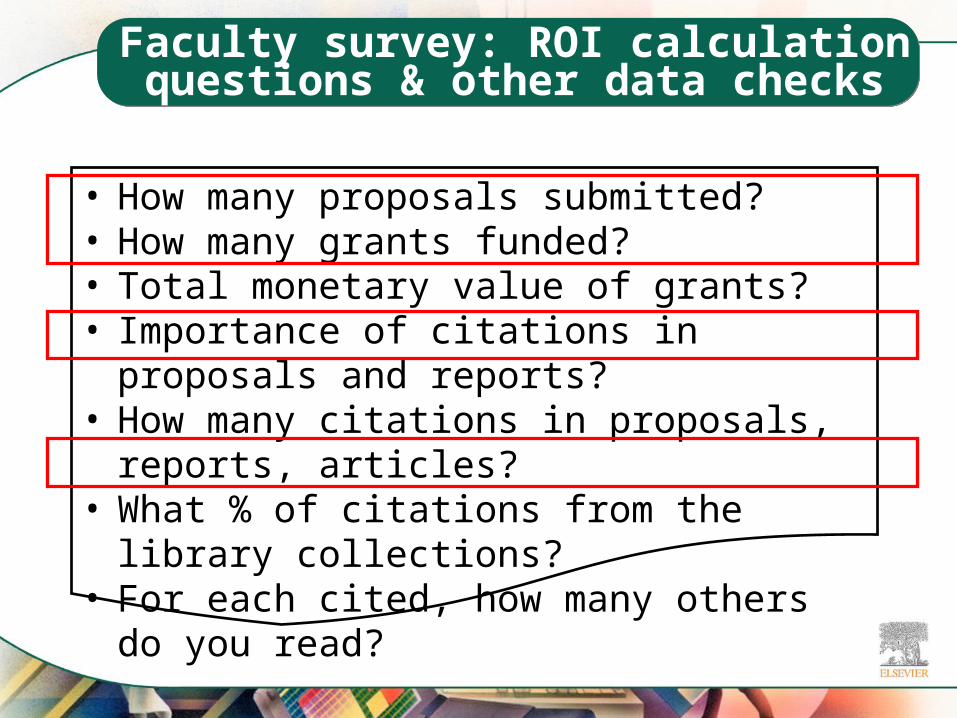
Faculty survey: ROI calculation questions & other data checks
• How many proposals submitted?• How many grants funded?• Total monetary value of grants?• Importance of citations in proposals and reports?• How many citations in proposals, reports,
articles?• What % of citations from the library collections?• For each cited, how many others do you read?

Faculty survey: Other types of analysis
• How many hours in a typical week do you spend on:• Finding or accessing articles or books?• Reading articles or books?
• How has access to e-resources through the university network changed the way you work?

Faculty survey comments:Value of e-resources
“With the current workload, I could not continue with
research without the convenience of access from
my own computer.” –Africa
“You have access to many more articles and … you
are more aware of what is going on in the field.”
–Western Europe
“Access has made collecting research
resources infinitely more efficient; and facilitated
interdisciplinary research.” –North America
“A sure way to kill a proposal is not to give proper credit or
to not update new developments.” –North
America
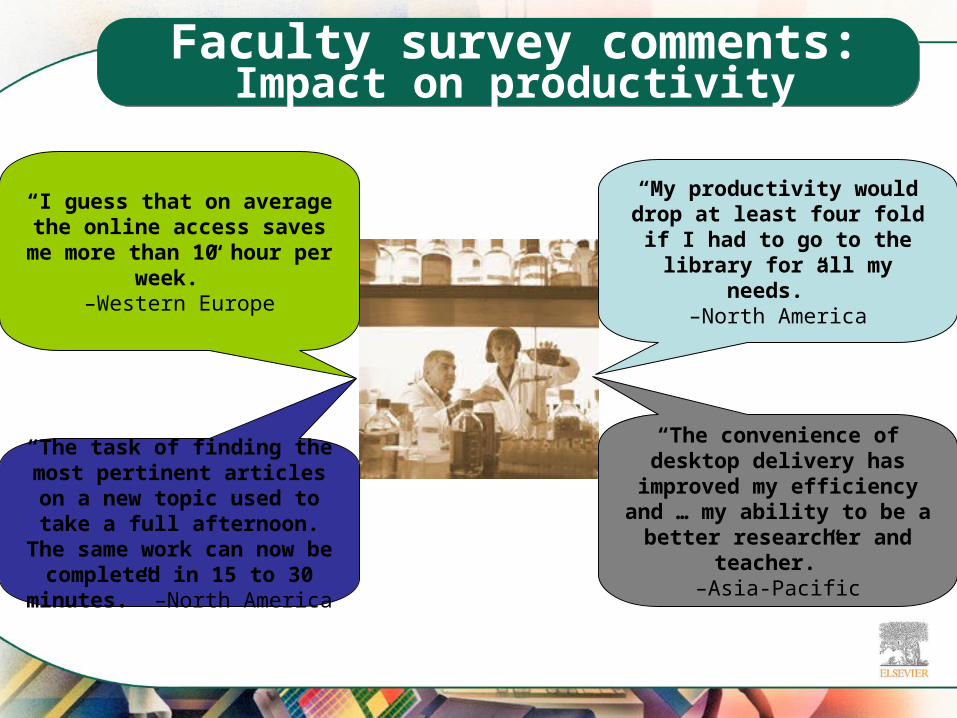
Faculty survey comments:Impact on productivity
“I guess that on average the online access saves me more
than 10 hour per week.” –Western Europe
“The task of finding the most pertinent articles on a new
topic used to take a full afternoon. The same work can now be completed in 15 to 30
minutes.” –North America
“My productivity would drop at least four fold if I had to go to the library for all my needs.”
–North America
“The convenience of desktop delivery has improved my
efficiency and … my ability to be a better researcher and
teacher.” –Asia-Pacific

Faculty survey comments:Library value to research
“Such access has become an essential research tool.”
–Asia-Pacific
“It would be impossible to be competitive
internationally without electronic access to publications.” –North
America
“I would leave this university in a microsecond
if the library deteriorated ...” –North
America
“It has helped me open or discard lines of research at
the very beginning by knowing what other
researchers have published or are soon going to
publish.” –Western Europe

Grants ROI phase II model
Numbers/percentages input into model
Juxtapose with interviews and survey responses
Put the ROI result into context for institutional faculty and executive administration
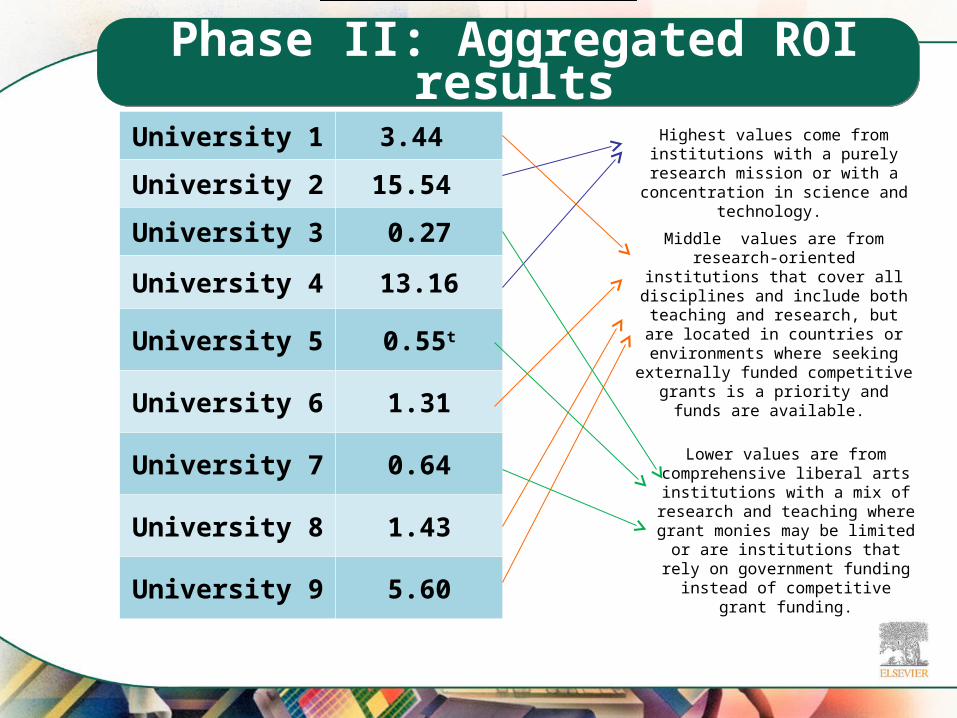
Phase II: Aggregated ROI results
University 1 3.44
University 2 15.54
University 3 0.27
University 4 13.16
University 5 0.55t
University 6 1.31
University 7 0.64
University 8 1.43
University 9 5.60
Highest values come from institutions with a purely research mission or with a
concentration in science and technology.
Middle values are from research-oriented institutions that cover all
disciplines and include both teaching and research, but are located in countries or environments where
seeking externally funded competitive grants is a priority and funds are
available.
Lower values are from comprehensive liberal arts
institutions with a mix of research and teaching where grant monies may be limited or are institutions that rely on government funding
instead of competitive grant funding.

Phase II: Grants ROI varies
From 15.54:1 to under 1:1 ROI depends on institutional mission
• Research focus is higher; teaching focus is lower
Be cautious when comparing ROI among institutions with differing missions
ROI is one of other measures of the library’s value• Usage = implied value• Stakeholder testimonials = explicit value• Time & cost savings = contingent valuation

Phase III: Broaden focus
How the library’s functional areas measure within the university mission

What we can show so far:Phases I & II
Faculty use library resources to support scholarship, research, and teaching
Library collections help faculty be productive and efficient, and increase interdisciplinary and international perspectives
University executives rely on the library to help recruit, evaluate, and retain faculty and students, and increase international reputation
Majority of faculty consider library resources an important part of their research and integral to the grants process
For every monetary unit invested in the library, the university receives grants income that ranges from 15:1 to less than 1:1
What Phase III hopes to show
The library’s products and services … Help faculty be successful Help students be successful Generate both immediate and future income Provide a good return for the investment to
the institution

Some final thoughtson measuring value
Tie what you measure to your university’s mission
Measure value and outcomes• Quantitative data shows ROI and trends• Qualitative information tells the story
No one method stands alone Enhanced access to information increases
your library’s value to your university
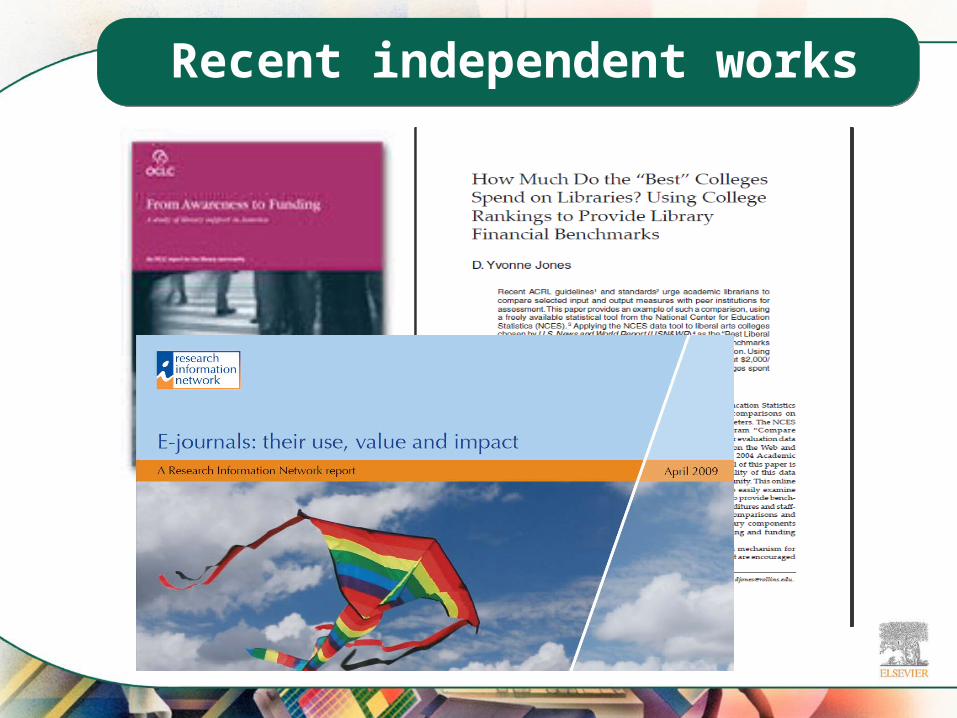
Recent independent works

27
This computer model quantifies the association between downloads and research outcomes.A doubling (100 per cent increase) in downloads, from 1 to 2 million, is statistically associated with dramatic increases in research productivity. The gearing becomes even stronger as the volume of downloads increases further. (Source: “E-journals: their use, value and impact”)
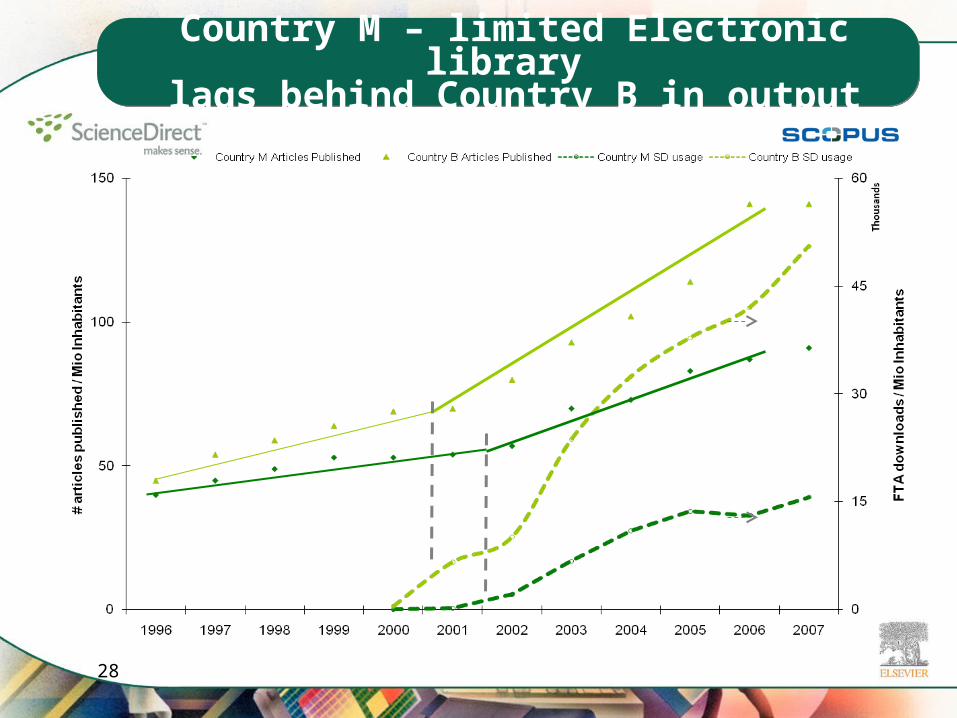
28
Country M – limited Electronic library lags behind Country B in output
Thank you very much!
www.elsevier.com/wps/find/librarianshome.librarians
twitter.com/library_connect
www.facebook.com/libraryconnect