university of exetermedicine.exeter.ac.uk/media/universityofexeter/... · 0.0000001 0.000001...
TRANSCRIPT
What is climate change?Tim Lenton
University of Exeter

Outline
A (geo)physiological view of the Earth
The diagnosis: Dangerous tipping points ahead
What to do about it? Medicate or tackle the underlying causes?
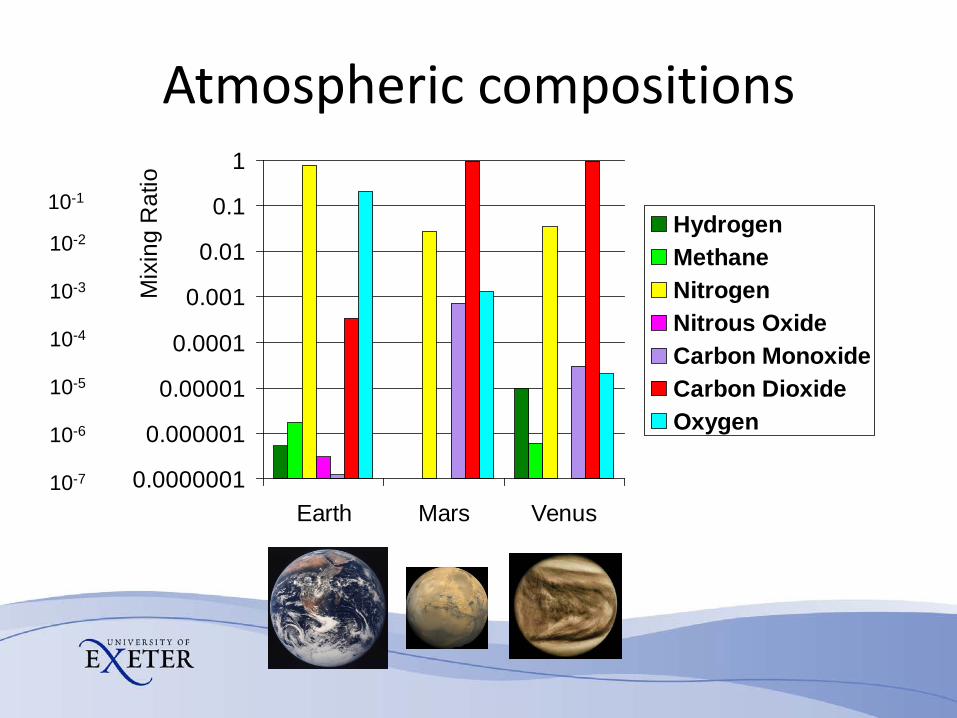
Atmospheric compositions
10-1
10-2
10-3
10-4
10-5
10-6
10-7 0.0000001
0.000001
0.00001
0.0001
0.001
0.01
0.1
1
Earth Mars Venus
Mix
ing
Rat
io
HydrogenMethaneNitrogenNitrous OxideCarbon MonoxideCarbon DioxideOxygen
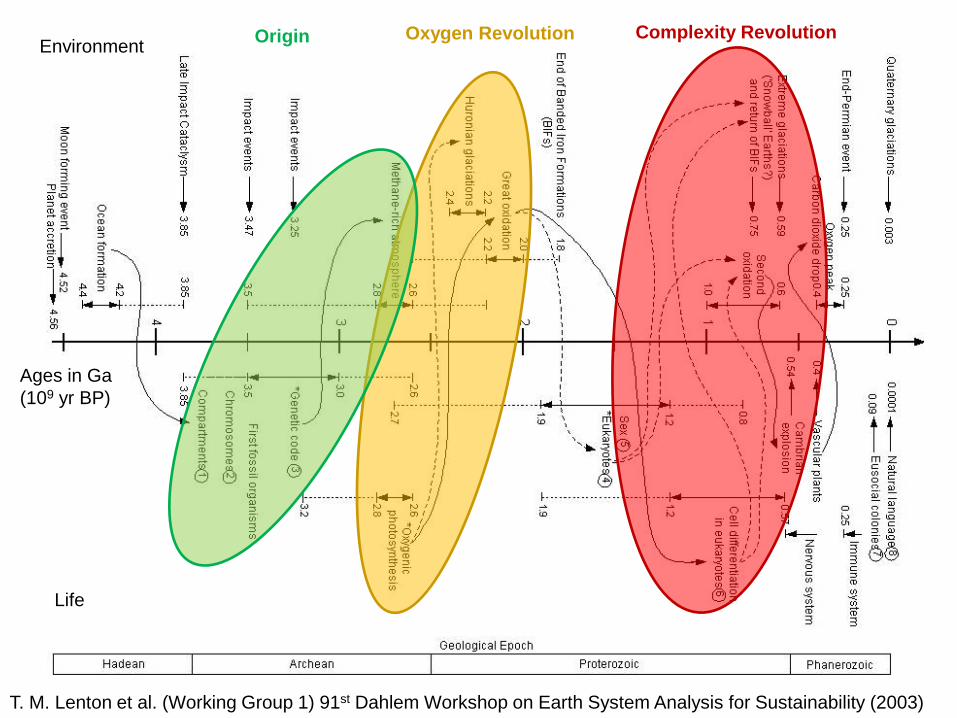
T. M. Lenton et al. (Working Group 1) 91st Dahlem Workshop on Earth System Analysis for Sustainability (2003)
Ages in Ga (109 yr BP)
Environment
Life
Complexity RevolutionOxygen RevolutionOrigin

Generic example of a tipping point
(System state)
(Sys
tem
sta
te)
Thanks to Chris Boulton for the animation

Tipping points in Earth history
PAL = Present Atmospheric Level
Lenton (2016) Earth System Science: A Very Short Introduction (OUP)

0100,000200,000300,000400,000500,000600,000Age (yr BP)
300
500
400
600
180200220240260280
Today’s CO2 Concentration
Projected Concentration After 50 More Years of Unrestricted Fossil Fuel Burning
CO
2[p
pmv]
Temperature proxy
Recent ice age cycles

0100,000200,000300,000400,000500,000600,000Age (yr BP)
300
500
400
600
180200220240260280
Temperature proxy
After 40 More Years of current energy use patternsC
O2
[ppm
v]
Today’s CO2 Concentration

Ice age abrupt climate changes
Deplazes et al. (2013) Nature Geoscience 6: 213-217
Age (thousands of years ago = ka)
Time
Temperature
in Greenland
Monsoon in
IndiaM
onso
on in
Am
azon
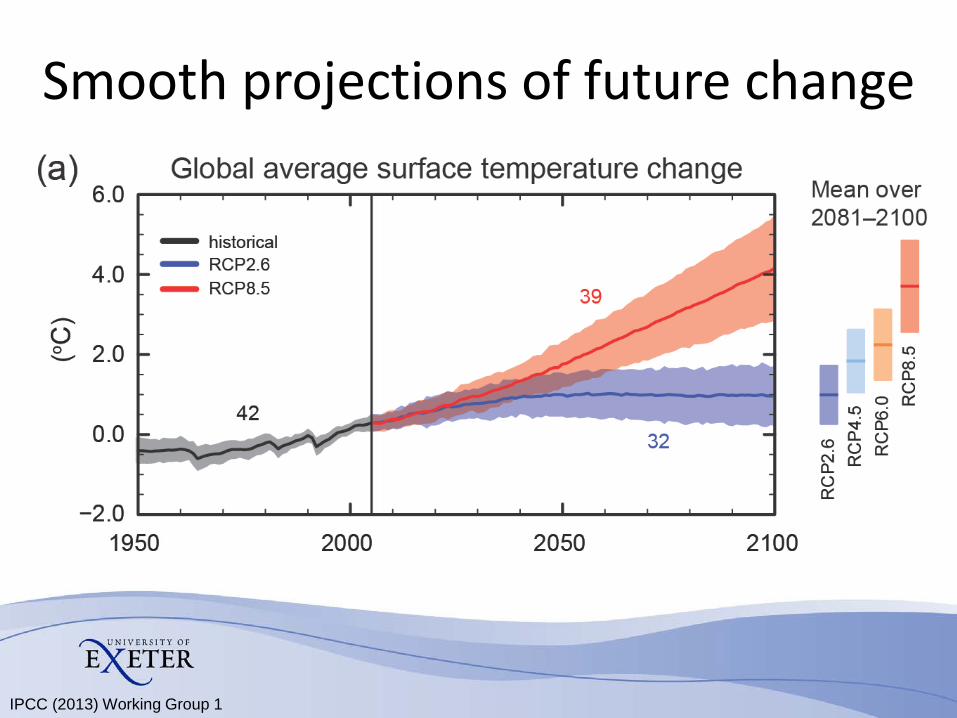
Smooth projections of future change
IPCC (2013) Working Group 1

IPCC AR5, WG1 SPM, 2013

Future worlds
Knutti et al. (2016) Nature Geoscience 9: 13-18

Climate tipping elements
Lenton et al. (2008) PNAS 105(6): 1786-1793

How close are tipping points?
Lenton & Schellnhuber (2007) Nature Reports Climate Change

Atlantic overturning circulation
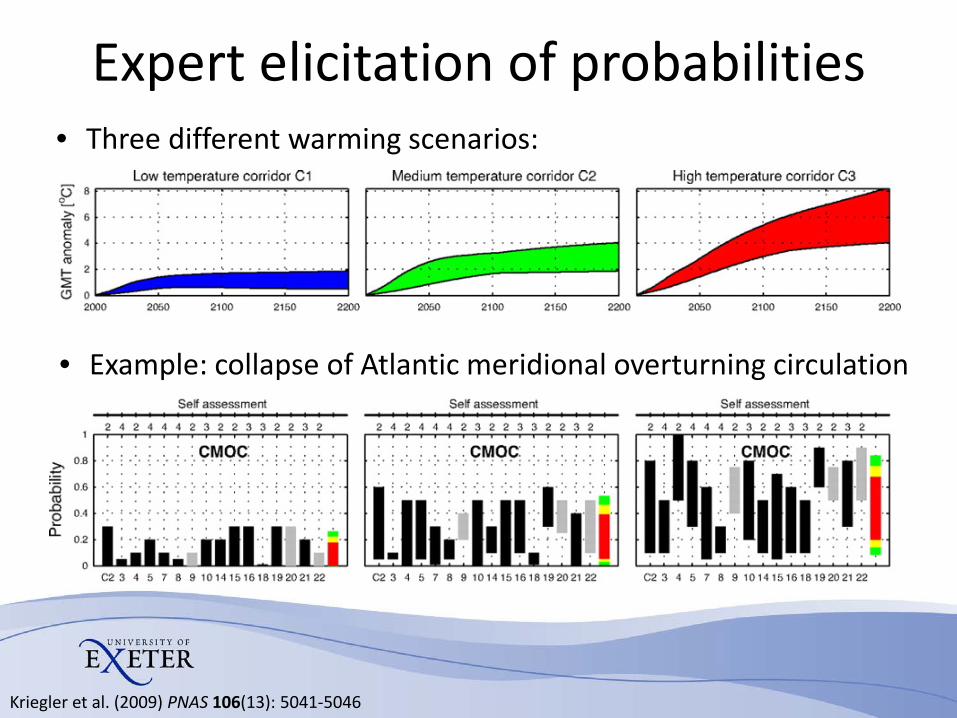
Expert elicitation of probabilities• Three different warming scenarios:
• Example: collapse of Atlantic meridional overturning circulation
Kriegler et al. (2009) PNAS 106(13): 5041-5046

Greenland
Atlantic
Antarctica
Amazon
El Niño
Kriegler et al. (2009) PNAS 106(13): 5041-5046
Likelihood of tipping points
• 2-4 °C warming: >16% probability of passing at least one tipping point
• >4 °C warming: >56% probability of passing at least one tipping point

Abrupt changes in climate models
Drijfhout et al. (2015) PNAS 112(43): E5777-E5786

Tipping points of tropical tree cover
Hirota et al. (2011) Science 334: 232-5; Staver et al. (2011) Science 334: 230-2

Interactions between tipping events
Diebackof Amazonrainforest
Shift to a (more) persistent
El Ninoregime
Disintegration of West Antarctic Ice Sheet
Collapse ofAtlantic
thermohalinecirculation
Melt ofGreenland Ice Sheet
+
+
++
+
-
+ +
+/-
+/-
+/-
Reduced warming of Greenland
Cooling of NE tropical Pacific, thermocline shoaling, weakening of annual cycle in EEP
Enhanced water vapour export from
Atlantic
-
Heat accumulation in Southern Ocean
Southward shift of Inter-tropical Convergence
Zone
Drying over Amazonia
Tropical moisture
supply changes
Increase in meridional salinity gradient
Fast advection of salinity anomaly to North
Atlantic
Sea level rise causing grounding line retreat
Freshwater input
Warming of Ross and Amundsen seas
Increase in probability
Decrease in probability
Uncertain direction of change
+
-
+/-Tipping events are connected A→B if at least 5 experts judged that triggering A had a direct effect on the probability of triggering B thereafter
From expert elicitation: Kriegler et al. (2009) PNAS 106(13): 5041-5046
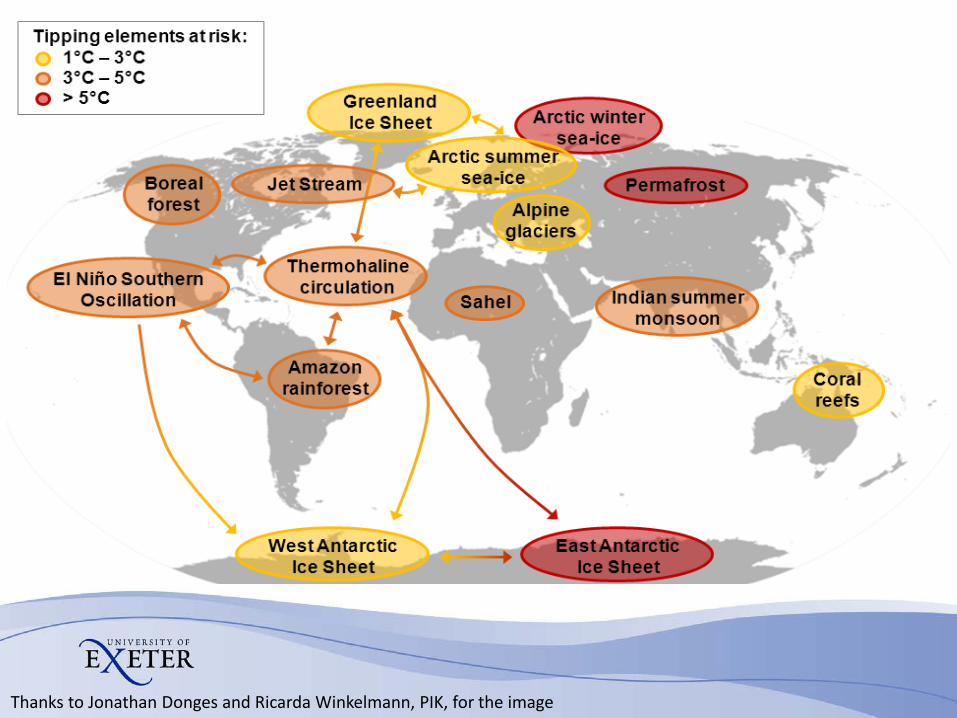
Thanks to Jonathan Donges and Ricarda Winkelmann, PIK, for the image

Early warning prospects
System beingforced past atipping point
Held & Kleinen (2004) GRL 31: L23207; Lenton et al. (2008) PNAS 105(6): 1786-1793
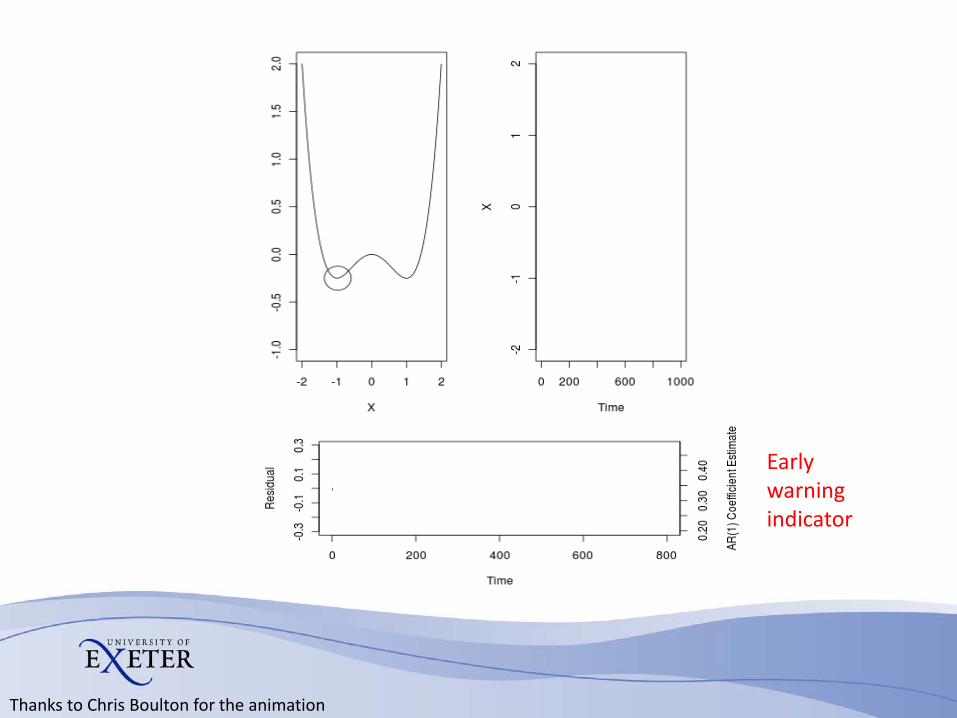
Thanks to Chris Boulton for the animation
Early warning indicator

Abrupt climate change early warningIce-coretemperatureproxy
Lenton, Livina, Dakos, Scheffer (2012) Climate of the Past 8: 1127-1139
Detrendeddata
Early warning indicator

Boulton, Allison, Lenton (2014) Nature Comms. 5: 5752
Early warning of a modelled tipping point
• Atlantic Meridional overturning circulation (AMOC) is currently monitored at 26oN
• In the ‘FAMOUS’ model we can collapse the AMOC and see early warning signals at 26oN
Early warning indicator

Where are the best early warning signals? How early are they?
Boulton, Allison, Lenton (2014) Nature Comms. 5: 5752
Red areas indicate early warning signals that are significant at p<0.05
Autocorrelation AR(1) Variance
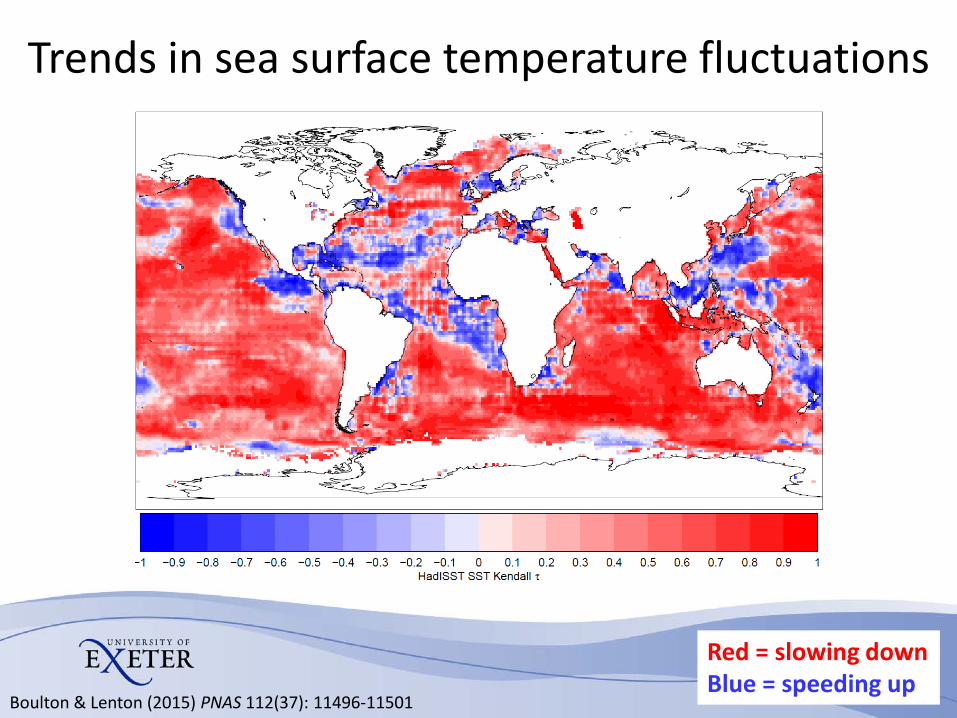
Trends in sea surface temperature fluctuations
Red = slowing downBlue = speeding up
Boulton & Lenton (2015) PNAS 112(37): 11496-11501

Pacific decadal oscillation (PDO)
Autocorrelation
Variance
Boulton & Lenton (2015) PNAS 112(37): 11496-11501
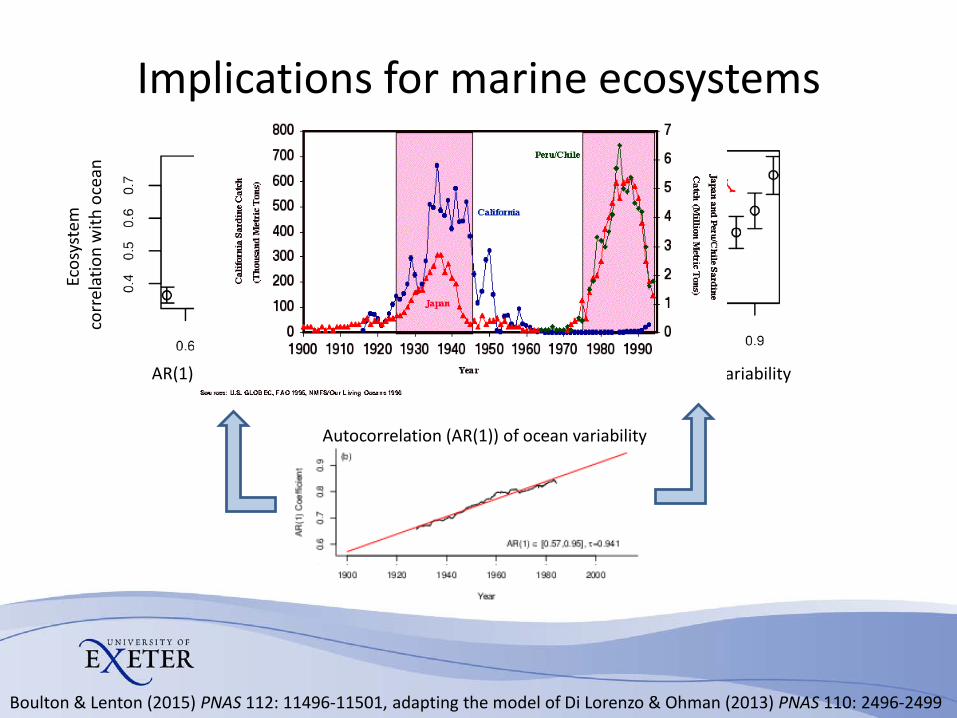
Implications for marine ecosystems
Boulton & Lenton (2015) PNAS 112: 11496-11501, adapting the model of Di Lorenzo & Ohman (2013) PNAS 110: 2496-2499
Autocorrelation (AR(1)) of ocean variability
AR(1) of ocean variability
Ecos
yste
mst
anda
rd d
evia
tion
Ecos
yste
m
corr
elat
ion
with
oce
an
AR(1) of ocean variability

Rela
tive
impa
ct
Loss of Arctic summer sea-ice
Disintegration of West Antarctic ice
sheetIrreversible
meltdown of Greenland ice
sheet
Increase in El Nino amplitude
Collapse ofWest African
Monsoon
Collapse of Atlantic thermohaline
circulation
Dieback of Amazon rainforest
Dieback of boreal forest
Lowest risk
Highest risk
Lenton (2011) Nature Climate Change 1: 201-209
What should we do about tipping point risks?
Relative likelihood
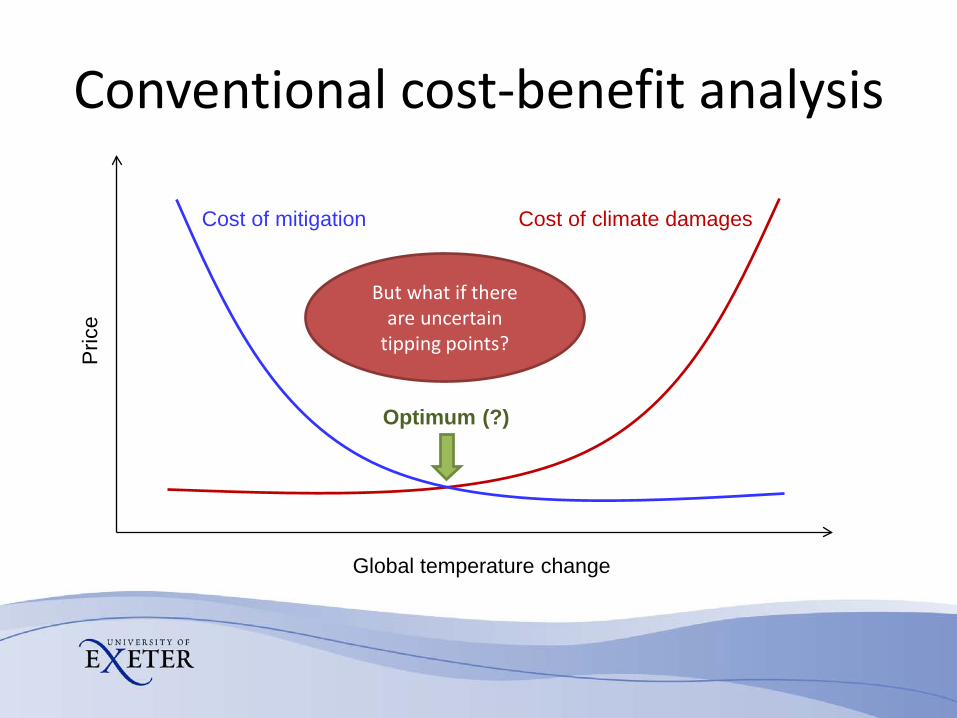
Conventional cost-benefit analysis
Global temperature change
Pric
e
Cost of mitigation Cost of climate damages
But what if there are uncertain
tipping points?
Optimum (?)

Adding uncertain tipping points to a widely-used integrated assessment model
Lontzek, Cai, Judd, Lenton (2015) Nature Climate Change 5(4): 441–444

Representation of tipping points
Lontzek, Cai, Judd, Lenton (2015) Nature Climate Change 5: 441–444; Cai, Lenton, Lontzek (2016) Nature Climate Change
Tipping element Hazard rate (%/yr/K)
Transition time (years)
Final damages (% world GDP)
Atlantic overturning (AMOC) 0.063 10-50-250 10-15-20Greenland ice sheet (GIS) 0.188 300-1500-7500 5-10-15
West Antarctic ice sheet (WAIS) 0.104 100-500-2500 2.5-5-7.5Amazon rainforest (AMAZ) 0.163 10-50-250 2.5-5-7.5
El Nino (ENSO) 0.053 10-50-250 5-10-15
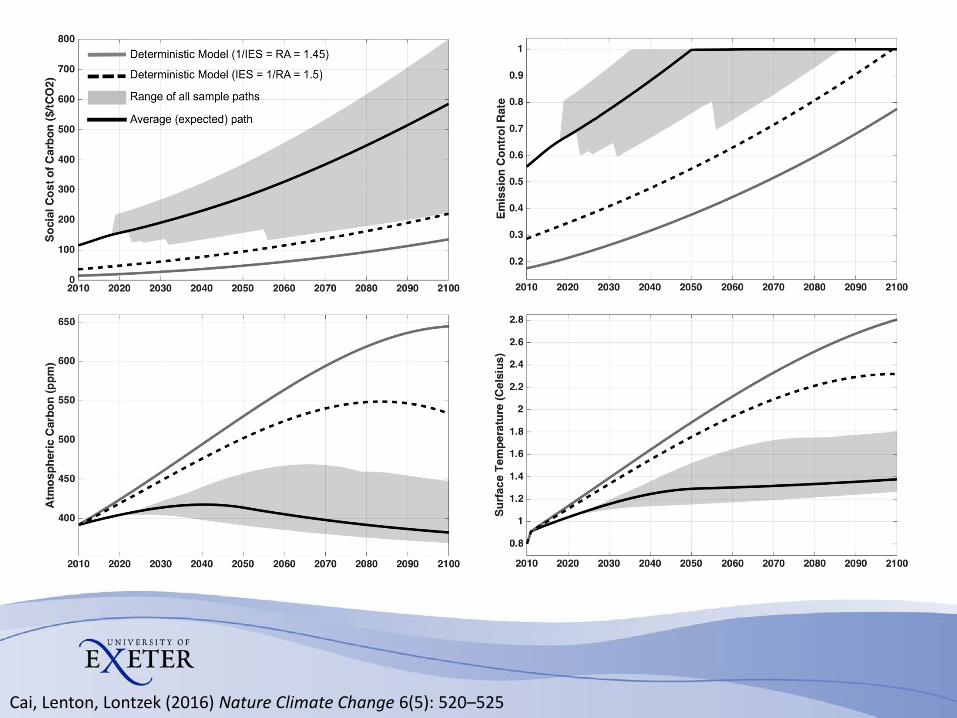
Cai, Lenton, Lontzek (2016) Nature Climate Change 6(5): 520–525

Tipping collective action• Uncertainty about the
location of a tipping point can lead to failure to coordinate to avoid it
• If uncertainty can be reduced below a critical level, social dynamics are tipped from free riding to coordinating to avoid catastrophe
Barrett & Dannenberg (2014) Nature Climate Change 4: 36-39

Tipping the energy system
Source: Michael Liebreich, Bloomberg New Energy Finance

Conclusions
• If business-as-usual continues then climate tipping points are expected to become high impact high probability events
• Tipping point early warning systems have been successfully tested and could be developed as an aid to adaptation to forewarn societies and trigger pre-emptive action
• The threat of multiple, interacting, uncertain climate tipping points should be triggering much stronger action to tackle climate change now, with a carbon price today of >$100/tCO2
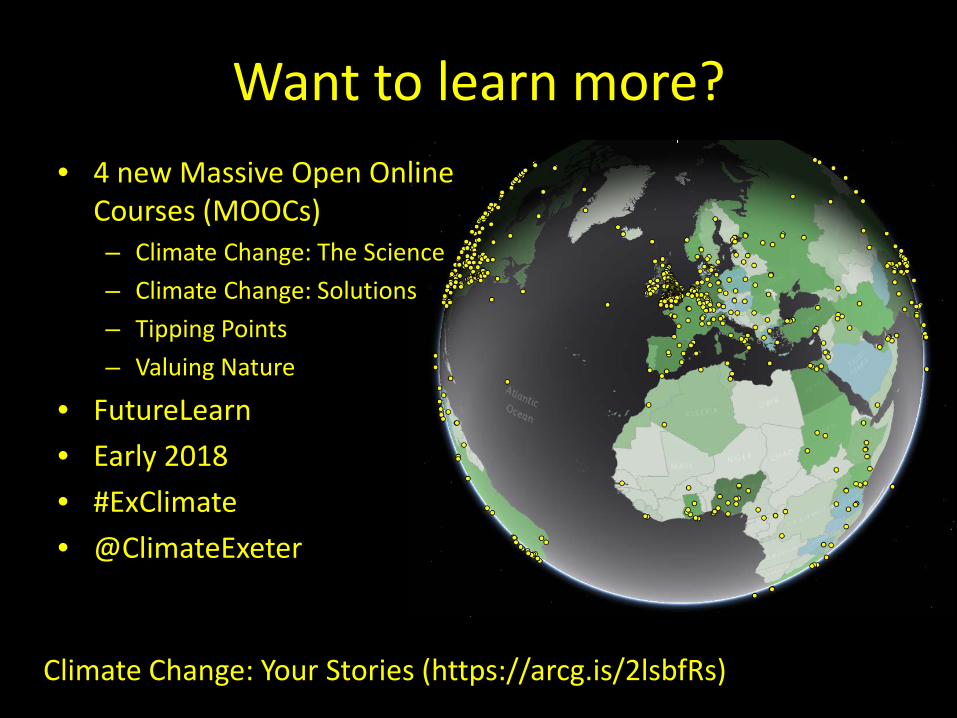
Want to learn more?• 4 new Massive Open Online
Courses (MOOCs)– Climate Change: The Science– Climate Change: Solutions– Tipping Points– Valuing Nature
• FutureLearn• Early 2018• #ExClimate• @ClimateExeter
Climate Change: Your Stories (https://arcg.is/2lsbfRs)