university of alabama - potential human health...
TRANSCRIPT

1
Excerpted from: Stormwater Quality Management, draft, in preparation Robert Pitt
Department of Civil and Environmental Engineering University of Alabama
Tuscaloosa, Alabama, 35487 USA
Potential Human Health Effects Associated with Stormwater Discharges
Contents Contents.........................................................................................................................................................................1 Introduction ...................................................................................................................................................................2 Human Health Effects of Stormwater............................................................................................................................2
Evidence of Sewage Contamination of Urban Streams .............................................................................................3 Fort Worth, TX......................................................................................................................................................4 Inner Grays Harbor, WA .......................................................................................................................................4 Sacramento, CA.....................................................................................................................................................4 Bellevue, WA ........................................................................................................................................................4 Boston, MA ...........................................................................................................................................................5 Minneapolis/St. Paul, MN .....................................................................................................................................5 Toronto, Ontario ....................................................................................................................................................5 Ottawa, Ontario .....................................................................................................................................................6 Birmingham, AL....................................................................................................................................................6 Summary of Inappropriate Sanitary Sewage Discharges into Urban Streams.......................................................6
Epidemiological Studies and Human Exposures to Stormwater (after Craun, et al. 1996) .......................................7 Water Contact Recreation and Urban Stormwater.....................................................................................................9
Development of Bathing Beach Bacteriological Criteria and Associated Epidemiological Studies......................9 1986 EPA Guidance for Recreational Waters, Water Supplies, and Fish Consumption .........................................18 Exposure to Pathogens in Stormwater .....................................................................................................................21
The Presence and Effects of Salmonella in Urban Runoff ..................................................................................22 The Presence and Effects of Staphylococci in Urban Runoff..............................................................................23 The Presence and Effects of Shigella in Urban Runoff .......................................................................................23 The Presence and Effects of Streptococcus in Urban Runoff ..............................................................................23 The Presence and Effects of Pseudomonas Aeruginosa in Urban Runoff ...........................................................23 The Presence and Effects of other Pathogens in Urban Runoff...........................................................................23 Protozoa in Urban Watersheds ............................................................................................................................24 Santa Monica Bay Project ...................................................................................................................................25 Proposed New California Recreational Area Bacteria Standards ........................................................................27
Drinking Water Risks and Urban Stormwater .........................................................................................................28 Other Human Health Risks Associated with Protozoa and other Microorganisms .................................................32
Microorganisms Observed In Urban Runoff ...............................................................................................................33 The Contamination of Groundwater by Stormwater Pathogenic Microorganisms......................................................42 Sources of Bacteria and Pathogens found in Urban Runoff ........................................................................................45
Bacteria Survival in Stormwater..............................................................................................................................47 Survival of Bacteria in Soil..................................................................................................................................48 Fecal Coliform to Fecal Strep. Bacteria Ratios ...................................................................................................49
Water Body Sediment Bacteria ...............................................................................................................................50 Soil Bacteria Sources...............................................................................................................................................51 Wildlife Sources of Bacteria....................................................................................................................................51
Effects of Birds on Water Bacteria Concentrations .............................................................................................51 Other Wildlife Bacteria Contributions.................................................................................................................52 Feces Discharges from Wildlife ..........................................................................................................................53
Case Study: Investigation of Urban Runoff Pathogen Sources in Ottawa, Ontario.....................................................62 Estimated Unit Area Bacteria Yields.......................................................................................................................62

2
Mammal and Bird Populations and Bacteria Discharges in the Ottawa Urban Area...............................................64 Summary of Ottawa Case Study..............................................................................................................................67
References ...................................................................................................................................................................69 Introduction The main purpose of treating stormwater is to reduce its adverse impacts on receiving water beneficial uses. Therefore, it is important in any urban stormwater runoff study to assess the detrimental effects that runoff is actually having on a receiving water. Urban receiving waters may have many beneficial use goals, including: • stormwater conveyance (flood prevention) • biological uses (warm water fishery, biological integrity, etc.) • non-contact recreation (linear parks, aesthetics, boating, etc.) • contact recreation (swimming) • water supply With full development in an urban watershed and with no stormwater controls, it is unlikely that any of these uses can be obtained. With less development and with the application of stormwater controls, some uses may be possible. It is important that unreasonable expectations not be placed on urban waters, as the cost to obtain these uses may be prohibitive. With full-scale development and lack of adequate stormwater controls, severely degraded streams will be common. However, stormwater conveyance and aesthetics should be the basic beneficial use goals for all urban waters. Biological integrity should also be a goal, but with the realization that the natural stream ecosystem will be severely modified with urbanization. Certain basic controls, installed at the time of development, plus protection of stream habitat, may enable partial use of some of these basic goals in urbanized watersheds. Careful planning and optimal utilization of stormwater controls are necessary to obtain these basic goals in most watersheds. Water contact recreation, consumptive fisheries, and water supplies are not appropriate goals for most urbanized watersheds. However, these higher uses may be possible in urban areas where the receiving waters are large and drain mostly undeveloped areas. Water Environment & Technology (1996a) reported that the latest National Water Quality Inventory released by the EPA only showed a slight improvement in the attainment of beneficial uses in the nations waters. Urban runoff was cited as the leading source of problems in estuaries, with nutrients and bacteria as the leading problems. Problems in rivers and lakes were mostly caused by agricultural runoff, with urban runoff the third ranked source for lakes, and the fourth ranked source for rivers. Bacteria, siltation, and nutrients were the leading problems in the nations rivers and lakes. Borchardt and Sperling (1996) stressed that many conditions may affect receiving waters from stormwater, specifically physical factors (such as shear stress) and chemical factors (such as oxygen depletion and/or non-ionized ammonia). Pathogens in stormwater are also a significant concern potentially affecting human health. The use of indicator bacteria is controversial for stormwater, as well as the assumed time of typical exposure of swimmers to contaminated receiving waters. However, recent epidemiological studies has shown significant health effects associated with stormwater contaminated marine swimming areas. Protozoan pathogens, especially associated with likely sewage-contaminated stormwater, is also of public health concern. The following discussion summarizes these epidemiological concerns, and presents information concerning the pathogenic characteristics of urban stormwater flows. Human Health Effects of Stormwater There are several mechanisms where stormwater exposure can cause potential human health problems. These include exposure to stormwater contaminants at swimming areas affected by stormwater discharges, drinking water supplies contaminated by stormwater discharges, and the consumption of fish and shellfish that have been contaminated by stormwater pollutants. Understanding the risks associated with these exposure mechanisms is difficult and not very clear. Receiving waters where human uses are evident are usually very large and the receiving waters are affected by many sanitary sewage and industrial point discharges, along with upstream agricultural nonpoint discharges, in addition to the local stormwater discharges. In receiving waters only having stormwater

3
discharges, it is well known that inappropriate sanitary and other wastewaters are also discharging through the storm drainage system. These “interferences” make it especially difficult to identify specific cause and effect relationships associated with stormwater discharges alone, in contrast to the many receiving water studies that have investigated ecological problems that can more easily study streams affected by stormwater alone. Therefore, much of the human risk assessment associated with stormwater exposure must use theoretical evaluations relying on stormwater characteristics and laboratory studies in lieu of actual population studies. However, some site investigations, especially related to swimming beach problems associated with nearby stormwater discharges, have been conducted. This section presents a summary of the human health effects of stormwater discharges, stressing these swimming beach studies. There are several impediments associated with the reuse of stormwater in residential areas. The most serious problems appear to be associated with the presence of potential pathogens in problematic numbers. Contact recreation in pathogen contaminated waters has been studied at many locations. The sources of the pathogens is typically assumed to be sanitary sewage effluent, or periodic industrial discharges from certain food preparation industries (especially meat packing and fish and shellfish processing). However, several studies have investigated pathogen problems associated with stormwater discharges. It has generally been assumed that the source of the pathogens in the stormwater are from inappropriate sanitary connections. However, as will be shown later, stormwater unaffected by these inappropriate sources still contains high counts of pathogens that are also found in surface runoff samples from many urban surfaces. Needless-to-say, sewage contamination of urban streams is an important issue that needs attention during an urban water resource investigation. Therefore, the following paragraphs present a brief overview of this contamination. Evidence of Sewage Contamination of Urban Streams The following case studies present summaries of various studies conducted throughout the U.S. that investigated contamination of urban streams that were only supposed to be receiving stormwater discharges. Many of the problematic discharges were from sanitary sewage. Obviously, inappropriate discharges must be identified and corrected as part of any effort to clean up urban streams. If these sources are assumed to be non-existent in an area and are therefore not considered in the stormwater management activities, incorrect and inefficient management decisions are likely, with disappointing improvements in the receiving waters. Lalor (1993), Pitt, et al. (1993), and Pitt and Lalor (1997) present a strategy to support the outfall screening activities required by the NPDES Stormwater Permit Program to identify and correct these inappropriate discharges to storm drainage systems. Nationwide A number of issues emerged from the individual projects of the U.S. EPA’s Nationwide Urban Runoff Program (NURP) (EPA 1983). One of these issues involved illicit connections to storm drainage systems and was summarized as follows in the Final Report of the NURP executive summary: “A number of the NURP projects identified what appeared to be illicit connections of sanitary discharges to stormwater sewer systems, resulting in high bacterial counts and dangers to public health. The costs and complications of locating and eliminating such connections may pose a substantial problem in urban areas, but the opportunities for dramatic improvement in the quality of urban stormwater discharges certainly exist where this can be accomplished. Although not emphasized in the NURP effort, other than to assure that the selected monitoring sites were free from sanitary sewage contamination, this BMP (Best Management Practice) is clearly a desirable one to pursue.” The illicit discharges noted during NURP were especially surprising, because the monitored watersheds were carefully selected to minimize factors other than stormwater. Presumably, illicit discharge problems in typical watersheds would be much worse. Illicit entries into urban storm sewerage were identified by flow from storm sewer outfalls following substantial dry periods. Such flow could be the result of direct “illicit connections” as mentioned in the NURP final report, or could result from indirect connections (such as contributions from leaky sanitary sewerage through infiltration to the separate storm drainage). Many of these dry-weather flows are continuous and would therefore also occur during rain induced runoff periods. Pollutant contributions from the dry-weather flows in some storm drains have been shown to be high enough to significantly degrade water quality because of their substantial contributions to the annual mass pollutant loadings to receiving waters. Washtenaw County (Ann Arbor), MI

4
From 1984 to 1986, Washtenaw County, Michigan, dye-tested 160 businesses in an effort to locate direct illicit connections to the county stormwater sewerage (Murray 1985; Schmidt and Spencer 1986; Washtenaw County 1988). Of the businesses tested, 61 (38%) were found to have improper storm drain connections. The Huron River Pollution Abatement Program was the most thorough investigation of such improper connections. Beginning in 1987, 1067 businesses, homes and other buildings located in the Huron River watershed were dye tested. The following results were reported. Illicit connections were detected at 60% of the automobile related businesses inspected, including service stations, automobile dealerships, car washes, and auto body and repair shops. All plating shops inspected were found to have improper storm drain connections. Additionally, 67% of the manufacturers tested, 20% of the private service agencies, and 88% of the wholesale/retail establishments tested were found to have improper storm sewer connections. Of 319 homes dye tested, 19 were found to have direct sanitary connections to storm drains. The direct discharge of rug cleaning wastes into storm drains by carpet cleaners was also noted as a common problem. Several surveys, beginning as early as 1963, identified bacterial and chemical contamination of the Allen Creek storm drainage system. Studies in 1963, 1978 and 1979 found that discharges from the Allen Creek storm drain contained significant quantities of fecal coliform and fecal streptococci. The 1979 study also documented high pollutant loads of solids, nitrates and metals. A large number of inappropriate storm drain connections originating from businesses were found, especially within automobile related facilities. Chemical pollutants, such as detergents, oil, grease, radiator wastes and solvents were causing potential problems. The elimination of these storm drain connections prevented thousands of gallons of contaminated water from entering the Huron River from the Allen Creek storm drainage system annually. Eight sampling locations along the main stem and major lateral branches of the storm drainage system were established and monitored for 37 chemicals during rain events. From 1984 to 1986, 32 (86%) of these chemicals showed a decrease in concentrations while only 2 (5%) showed an increase. In spite of this improvement, chemical concentrations in the stormwater discharges at the Allen Creek outfall were still greater than those from the control station much of the time. Fort Worth, TX This program has been underway since June of 1985 (Falkenbury 1987). Investigations to date indicate few direct connections from industries to storm drains. Storm runoff, in addition to illegal dumping, accidental spills and direct discharges into the street or adjacent creeks seem to account for the majority of the contaminants entering the storm drainage system. Major problems stemmed from septic tanks, self-management of liquid wastes by industry and construction of municipal overflow bypasses from the sanitary sewer to the storm drains. The success of this program was judged by a decline in the number of undesirable features at the target outfalls. An average of 44 undesirable observations per month were made in 1986 (522 total), compared to an average of 21 undesirable observations per month in 1988. Inner Grays Harbor, WA In 1987, an inspection of the 90 urban stormwater outfalls draining into Inner Grays Harbor in Washington revealed 29 (32%) flowing during dry weather (Beyer, et al. 1979; Pelletier and Determan 1988). A total of 19 outfalls (21%) were described as suspect, based on visual observation and/or anomalous pollutant levels, as compared to those expected in typical urban stormwater runoff characterized by NURP. At least one storm drain system was later found to receive a residential sanitary sewage connection which has since been corrected. This drain exhibited no unusual visual characteristics, but was found to have atypical pH and total suspended solids levels. Notably, fecal coliform levels were within the typical range expected for stormwater. Sacramento, CA A Sacramento, California, investigation of urban discharges identified commercial as well as domestic discharges of oil and other automobile related fluids as a common problem based on visual observations (Montoya 1987). Montoya found that slightly less than half the water discharged from Sacramento's stormwater drainage system was not directly attributable to precipitation. Most of this water comes from unpermitted sources, including illicit and/or inappropriate entries to the storm drainage system. Bellevue, WA During the Bellevue, Washington Urban Runoff Project baseflows as well as stormwater from two residential urban basins were monitored (Pitt 1985; Pitt and Bissonnette 1983). The areas included in this study, Surrey Downs and

5
Lake Hills, are about 5 km apart and each covered an area of about 40 ha. Both were fully developed, with predominantly single family residences. No septic tanks were present in either area and the storm drainage systems were thoroughly mapped and investigated to ensure no non-stormwater discharges to storm drainage systems or obvious illegal discharges. The Bellevue, Washington, NURP project also summarized the reported incidents of intermittent discharges and dumpings of pollutants into the local storm drainage system. During a three year period of time, about 50 citizen contacts were made to the Bellevue Storm and Surface Water Utility District concerning water quality problems. About 25 percent of the complaints concerned oil being discharged into storm drain inlets. Another important category of complaints was for aesthetic problems, such as turbid or colored water in the creeks. Various industrial and commercial discharges into the storm drainage system were detected. Concrete wastes flushed from concrete trucks at urban job sites were a frequently occurring problem. Cleaning establishment discharges into creeks were also a common problem. Vehicle accidents also resulted in discharges of gasoline, diesel fuel, hydraulic fluids, and lawn care chemicals into the storm drain inlets. Boston, MA A field screening program was conducted to determine the relative levels of contamination at various locations in the Stony Brook drainage system (Metcalf and Eddy 1994). During eight days of dry-weather sampling, numerous inappropriate discharges of sanitary sewage into the drainage system were identified using the investigative procedures developed by Pitt, et al. (1993) and a modified flow chart approach. Minneapolis/St. Paul, MN Water Environment & Technology (1996a) reported that the fecal coliform counts decreased from about 500 counts/100 mL to about 150 counts/100 mL in the Mississippi River after the sewer separation program in the Minneapolis and St. Paul area of Minnesota. Combined sewers in 8,500 ha were separated during this 10-year, $332 million program. Toronto, Ontario The Toronto Area Watershed Management Strategy (TAWMS) study monitored and characterized both stormwater and baseflows (Pitt and McLean 1986 and GLA 1983). The project involved intensive monitoring in two test areas. The Emery catchment area, located near the City of North York, covered approximately 154 ha with predominantly “medium” industrial land uses (processing goods for final consumption). The Thistledown catchment, located in the City of Etobicoke, covered approximately 39 ha with residential and commercial land uses. During cold weather, the increases in dissolved solids were quite apparent in baseflows and snowmelt for both study catchments. This increase was probably caused by high chlorides from road salt applications. In contrast, bacteria populations were noticeably lower in all outfall discharges during cold weather. Nutrient and heavy metal concentrations at the outfalls remained fairly constant during cold and warm weather. Either warm- or cold-weather baseflows were responsible for most of the yields for many constituents from the industrial catchment. These constituents included runoff volume, phosphorus, total Kjeldahl nitrogen, chemical oxygen demand and chromium. Important constituents that had high yields in the baseflow from the residential/commercial catchment included total solids, dissolved solids, chlorides, and fecal coliform and Pseudomonas aeruginosa bacteria. Gartner Lee and Associates, Ltd. conducted an extensive survey of dry-weather flows in storm drainage systems in the Humber River watershed (Toronto) in an attempt to identify the most significant urban runoff pollutant sources. About 625 outfalls were sampled two times during dry-weather, with analyses conducted for many pollutants, including organics, solids, nutrients, metals, phenols, and bacteria. About 59% had dry-weather flows, and about 33% of the outfalls were discharging at rates greater than 1 L/sec. The dry-weather flows were found to contribute significant loadings of nutrients, phenols, and metals, compared to upstream conditions. About 10 to 14 percent of the outfalls were considered significant pollutant sources. Further investigations identified many industrial and sanitary sewage non-stormwater discharges into the storm drainage. An apartment building with the sanitary drains from eight units illegally connected to the storm drainage system was typical of the problems found. Other problem areas were found in industrial areas, including yard storage of animal hides and yard runoff from meat packing plants.

6
Ottawa, Ontario Visual inspection of stormwater pipes discharging to the Rideau River (Ontario) found leakage from sanitary sewer joints or broken pipes to be a major source of storm drain contamination (OME 1983). A study of the lower Rideau River in the Regional Municipality of Ottawa-Carleton was conducted to establish the causes of bacteriological water quality degradation in the urbanized reach of the river and to analyze the impacts of future urbanization. Earlier programs had identified and corrected many cross-connections between sanitary sewers and stormwater sewers. Bacteriological water quality improved, but swimming standards at beaches were still not obtained. Birmingham, AL During the development of the methods to investigate inappropriate discharges, a three-mile section of Village Creek in Birmingham, AL, was selected for field verification of the test methods (Pitt, et al. 1993, Pitt and Lalor 1997). The drainage area for this section of the creek contains about 4500 acres. Residential land use comprises approximately 88% of the total area, commercial land use approximately 8%, and industrial land use less than 1%. The majority of the drainage area is serviced by sanitary sewers, but some septic tanks are also used. A total of 65 stormwater outfalls were located. Outfall diameters ranged from 2 inches to 12 feet, excluding open ditches. All sites were visited at least 8 times during the field investigation period. Of these 65 outfalls, 48 (74%) were always dry, 6 (9%) had flow intermittently, and 11 (17%) were always flowing. Eighteen direct unpermitted discharges to the creek from nearby industries and commercial areas were also located; 10 (56%) were always dry, 6 (33%) had intermittent flow, and 2 (11%) were always flowing. The dry weather flows from two of the 65 outfalls were found to be mostly sanitary sewage, while the flows from another nine were predominately washwaters. The remaining outfalls with dry weather flows were mostly affected by natural waters (most likely groundwater infiltration) or leaking domestic water. Periodic stream surveys of tributaries of the Cahaba River in the Birmingham area (mostly the Little Cahaba River, upstream of Lake Purdy) during summer months have found that the small river contained about 1/3 treated sewage from upstream poorly operated municipal treatment facilities (since corrected), septage from failing septic tanks, and SSO discharges. During a current EPA sponsored project investigating SSO discharges being conducted by Lalor at UAB, sewage, through SSOs and poorly operating septic tanks, were found to make up about 25% of the dry weather flows in the small, completely urbanized stream in Homewood, AL, being studied. However, sewage contributions in the much larger, and much less urbanized 5-mile Creek are very small (on a percentage standpoint), although SSOs exist in the urbanized area. These streams are still being evaluated, including future human health risk assessments associated with these discharges. Summary of Inappropriate Sanitary Sewage Discharges into Urban Streams Urban stormwater runoff includes waters from many other sources which find their way into storm drainage systems, besides from precipitation. There are cases where pollutant levels in storm drainage are much higher than they would otherwise be because of excessive amounts of contaminants that are introduced into the storm drainage system by various non-stormwater discharges. Additionally, baseflows (during dry weather) are also common in storm drainage systems. Dry-weather flows and wet-weather flows have been monitored during numerous urban runoff studies. These studies have found that discharges observed at outfalls during dry weather were significantly different from wet-weather discharges and may account for the majority of the annual discharges for some pollutants of concern from the storm drainage system. In many cases, sanitary sewage was an important component (although not necessarily the only component) of the dry weather discharges from the storm drainage systems. From a human health perspective (associated with pathogens), it may not require much raw or poorly treated sewage to cause a receiving water problem. However, at low discharge rates, the DO receiving water levels may be minimally affected. The effects these discharges have on the receiving waters is therefore highly dependent on many site specific factors, including frequency and quantity of sewage discharges and the creek flows. In many urban areas, the receiving waters are small creeks in completely developed watersheds. These creeks are the most at risk from these discharges as dry base flows may be predominately dry weather flows from the drainage systems. In Tokyo (Fujita 1998), for example, numerous instances were found where correcting inappropriate sanitary sewage discharges resulted in the urban streams losing

7
all of their flow. In cities that are adjacent to large receiving waters, these discharges likely have little impact (such as DO impacts from Nashville CSO discharges on the Cumberland River, Cardozo, et al. 1994). The presence of pathogens from raw, or poorly treated sewage, in urban streams, however, obviously presents a potentially serious public health threat. Even if the receiving waters are not designated as water contact recreation, children are often seen playing in small streams in urban areas. Epidemiological Studies and Human Exposures to Stormwater (after Craun, et al. 1996) Epidemiology can be defined as the study of the occurrence and causes of disease in human populations and the application of this knowledge to the prevention and control of health problems. The general population often views epidemiology and associated risk assessments with skepticism when risks associated with seemingly everyday activities are quantified, especially when associated with periodic “food scares” that are typically exaggerated or misinterpreted in the press. Technical experts also may feel uncomfortable with the results of epidemiological studies because of the typically very low numbers of affected people in a study population. However, much of the information that is used in developing environmental regulations protecting human health originates with epidemiological studies and a more through understanding of the science of epidemiology would dispel much of the confusion associated with these studies. Epidemiology has routinely been used to assess risks associated with contaminants in drinking waters. Epidemiology has also recently been used to investigate human health risks associated with swimming in waters contaminated by stormwater. However, Craun, et al. (1996) state that the results of environmental epidemiology studies (the assessment of human health effects associated with environmental contaminants, where indicators of disease are mostly studied instead of the disease itself) have provoked controversy. Their excellent review article on epidemiology applied to water and public health discusses many of these problems and offers suggestions to enable better interpretation of existing studies and better design of future studies. The following paragraphs are summarized from their article. The definition of terms is important. For example, epidemiologists use several measures to describe disease frequency. Incidence is the rate at which new cases of disease occur, whereas prevalence measures both new and existing cases in the total population. Therefore, prevalence is “the proportion of people who have a specific condition at any specific time” and is typically measured as a percentage of the total population. Incidence considers the duration of exposure, and the incidence rate may be expressed as the number of cases observed per person-years of exposure, for example. The attack rate is a measure of the cumulative incidence during an outbreak of the disease, and is usually expressed in terms of numbers of cases of disease per population unit (such as per 10,000 people in the population). Secondary outbreaks can also occur for communicable disease and the secondary attack rate refers to the cases of disease attributed to exposure to people having the disease during the primary attack. The secondary rate is usually expressed in terms of susceptible contacts. Geographic-specific (such as part of town receiving water from a specific source) and vehicle-specific (such as waterborne specific disease) attack rates help to determine the source of the disease. Attack rates can also be examined in terms of water consumption by separating the attack rate into different categories associated with different amounts of water consumed, for example. Mortality rate and case fatality rate are also measures of disease frequency. The mortality rate indicates the number of deaths from a certain disease, and or time period, per the total population. The case fatality rate is the proportion of diagnosed individuals having the disease who die of the disease. The crude rates should be standardized to account for differences in demographic characteristics of the population, especially age. Association is a measure of the dependence between exposure to a contaminant and the onset of disease, but does not necessarily indicate a cause and effect relationship between the variables. Both experimental (clinical or population) and observational (descriptive or analytical) epidemiologic studies are used to determine associations. In clinical experimental studies, active intervention may be used to expose the subjects to specific doses of an infective agent to determine the infective dose of a pathogen, for example. In population experimental studies, the population may be randomly grouped according to different levels of drinking water treatment, and the households would then be extensively examined to determine any differences in disease outbreaks. In descriptive observational studies, information is available about the occurrence of disease and about exposure to specific compounds, exposure periods, and different demographic information. Analytical observational studies test specific hypotheses to evaluate associations between exposure and disease and to confirm the mode of transmission. Ecological studies (or

8
correlation or aggregate studies) examine associations between routinely gathered health and demographic statistics and available environmental measures (such as drinking water constituent concentrations). These studies are typically controversial because the statistical demographic information pertains to groups (lumped information which makes it difficult to identify confounding factors or to normalize) and not to individuals within the groups. Difficulties also relate to incomplete information concerning potential causative agents. Therefore, analytical observational studies (where individuals are studied and more detailed information concerning the potential causative agents can be obtained) should be used to follow up hypotheses developed in ecological studies. The experimental design of epidemiological studies is very critical. The study must be of sufficient size and have adequate statistical power to detect the hypothesized association. Randomness is also very critical in epidemiological studies to control systematic errors. In most cases, epidemiological studies compare disease rates between a test and a control population. Positive associations (where there is a statistically significant difference between the rates of the two groups) can be caused by random errors. This likelihood can be estimated by calculating the confidence interval of the statistical significance of the association. However, statistical significance (even at a very high level) does not imply a cause and effect relationship between the hypothesized factor and disease. Statistical power can be used to identify the minimum risk that a study is capable of detecting. An environmental epidemiological study should not be conducted “unless the exposure assessment is expected to be reasonably appropriate and accurate.” Adequate and complete data to make the exposure assessment must be assured before the study is conducted. Interpreting associations is based on examining the rate differences (RD), which is the absolute differences in the two rates (incidence rate of disease for the test, or exposed, group minus the incidence rate of disease for the control, or unexposed, group), or the rate ratio (RR), which is the ratio of the rates from the two groups. The odds ratio (OR) is the ratio of the odds of disease of the test group to the odds of disease of the control group, and is interpreted similarly to the rate ratio. If the RR or OR is close to 1.0, there is no association or increased risk between the two groups. If the ratio is 1.8, there is an 80 percent increased risk of disease for the exposed individuals, compared to the unexposed group. The confidence interval of the ratio is used to identify significance of the association. A 95 percent confidence interval of 1.6 to 2.0 signifies a statistically significant estimate because the range does not include 1.0. The relatively narrow range also implies a precise estimate of the association. In contrast, a 95 percent confidence interval of 0.8 to 14.5 does not signify a significant difference because the range includes the value of 1.0. In addition, the wide range also implies an imprecise estimate of the association. Craun, et al. (1996) presents Table 1 (from Monson 1980) indicating different rate ratios and strengths of associations. Weak associations (ratios of <1.5) are difficult to interpret. Very large range ratios are unlikely to be completely explained by unidentified or uncontrolled confounding characteristics. However, the magnitude of the rate ratio has no bearing on the likelihood that the association is attributed to bias, but causal association cannot be ruled out simply because of a weak association. In many environmental epidemiological studies, the rate ratio is frequently smaller than 1.5, causing speculation that the association may actually be caused by bias. “High quality exposure and study design are important for interpreting risks of this magnitude.”
Table 1. Rate Ratios and Strengths of Associations for Epidemiological Studies (Monson 1980)
Rate Ratio, or Odd Ratio
Strength of Association
1.0 None >1.0 to <1.5 Weak 1.5 to 3.0 Moderate 3.1 to 10.0 Strong >10.0 Infinite
With the low rate ratios frequently encountered in environmental epidemiological studies, cautious interpretations are necessary. Craun, et al. (1996) present the following criteria that are used to assess associations and causality:

9
• Exposure must occur before the onset of disease (temporal association) • A sufficient number of participants are needed to prevent random error, and the study is well conducted (study precision and validity) • The range ratio (or odds ratio) should be large enough to minimize spurious associations (strength of association) • Repeated observations are needed under different conditions to support causality (consistency) • The absence of specificity does not rule out causality, but a commonly accepted effect associated with a specific exposure certainly reinforces causality (specificity) • An association supported by scientific evidence supports causality (biological plausibility) • Higher risks should be associated with higher exposures (dose-response relationship) • The removal of a potential causative agent should reduce the risk of disease (reversibility)
Therefore, an effective and convincing interpretation can be supported if many of these above factors are successfully addressed by an environmental epidemiological study. Water Contact Recreation and Urban Stormwater There have been a few epidemiology studies recently published describing the increased health risks associated with contaminated dry weather flows affecting public swimming beaches. The following discussion presents an overview of the development of water quality criteria for water contact recreation, plus the results of several epidemiological studies that have specifically examined human health problems associated with swimming in contaminated water, including water affected by stormwater. In most cases, the levels of indicator organisms and pathogens causing increased illness were well within the range found in urban streams. Development of Bathing Beach Bacteriological Criteria and Associated Epidemiological Studies Human health standards for body contact recreation (and for fish and water consumption) are based on indicator organism monitoring. Monitoring for the actual pathogens, with few exceptions, requires an extended laboratory effort, is very costly and not very accurate. Therefore, the use of indicator organisms has become established. Dufour (1984a) presents an excellent overview of the history of indicator bacterial standards and water contact recreation, summarized here. Total coliforms were initially used as indicators for monitoring outdoor bathing waters, based on a classification scheme presented by W.J. Scott in 1934. Total coliform bacteria refers to a number of bacteria including Escherichia, Klebsiella, Citrobacter, and Enterobacter (DHS 1997). They are able to grow at 35oC and ferment lactose. They are all gram negative asporogenous rods and have been associated with feces of warm blooded animals. They are also present in soil. Scott had proposed four classes of water, with total coliform upper limits of 50, 500, 1,000, and >1,000 MPN/100 mL for each class. He had developed this classification based on an extensive survey of the Connecticut shoreline where he found that about 93% of the samples contained less than 1,000 total coliforms per 100 mL. A sanitary survey classification also showed that only about 7% of the shoreline was designated as poor. He therefore concluded that total coliform counts of <1,000 MPN/100 mL probably indicated acceptable waters for swimming. This standard was based on the principle of attainment, where very little control or intervention would be required to meet this standard. In 1943, the state of California independently adopted an arbitrary total coliform standard of 10 MPN/1 mL (which is the same as 1,000 MPN/100 mL) for swimming areas. This California standard was not based on any evidence, but it was assumed to relate well with the drinking water standard at the time. Dufour points out that a third method used to develop a standard for bathing water quality used an analytical approach adopted by H.W. Streeter in 1951. He used a ratio between Salmonella and total coliforms, the number of bathers exposed, the approximate volume of water ingested by bathers daily, and the average total coliform density. Streeter concluded that water containing <1,000 MPN total coliforms/100 mL would pose no great Salmonella typhosa health hazard. Dufour points out that it is interesting that all three approaches in developing a swimming water criterion resulted in the same numeric limit. One of the earliest bathing beach studies to measure actual human health risks associated with swimming in contaminated water was directed by Stevenson (1953), of the U.S. Public Health Service’s Environmental Health Center, in Cincinnati, Ohio, and was conducted in the late 1940s. They studied swimming at Lake Michigan at

10
Chicago (91 and 190 MPN/100 mL median total coliform densities), the Ohio River at Dayton, KY (2,700 MPN/100 mL), at Long Island Sound at New Rochelle and at Mamaroneck, NY (610 and 253 MPN/100 mL). They also studied a swimming pool in Dayton, KY. Two bathing areas were studied in each area, one with historically poorer water quality than the other. Individual home visits were made to participating families in each area to explain the research program and to review the calendar record form. Follow up visits were made to each participating household to insure completion of the forms. Total coliform densities were monitored at each bathing area during the study. More than 20,000 persons participate in the study in the three areas. Almost a million person-days of useable records were obtained. The percentage of the total person-days when swimming occurred ranged from about 5 to 10 percent. The number of illnesses of all types recorded per 1,000 person-days varied from 5.3 to 8.8. They found an appreciably higher illness incidence rate for the swimming group, compared to the nonswimming group, regardless of the bathing water quality (based on total coliform densities). A significant increase in gastrointestinal illness was observed among the swimmers who used one of the Chicago beaches on three days when the average coliform count was 2,300 MPN/100 mL. The second instance of positive correlation was observed in the Ohio River study where swimmers exposed to the median total coliform density of 2,700 MPN/100 mL had a significant increase in gastrointestinal illness, although the illness rate was relatively low. They suggested that the strictest bacterial quality requirements that existed then (as indicated above, based on Scott’s 1934 work) might be relaxed without significant detrimental effect on the health of bathers. It is interesting to note that in 1959, the Committee on Bathing Beach Contamination of the Public Health Laboratory Service of the UK concluded that “bathing in sewage-polluted seawater carries only a negligible risk to health, even on beaches that are aesthetically very unsatisfactory” (Cheung, et al. 1990 and Alexander, et al. 1992). Dufour (1984a) pointed out that total coliforms were an integral element in establishing fecal coliform limits as an indicator for protecting swimming uses. Fecal coliform bacteria are a subgroup of the total coliform group. They grow at 44.5oC and also ferment lactose. They are restricted to the feces of warm blooded animals and can be used to separate bacteria of soil and animal origin (DHS 1997). They do survive for variable periods of time in fecal contaminated soil and water, however. As a result of the Stevenson (1953) study, reported above, a geometric mean fecal coliform level of 200 MPN per 100 mL was recommended by the National Technical Advisory Committee (NTAC) of the Federal Water Pollution Control Administration in 1968 and was adopted by the U.S. Environmental Protection Agency in 1976 as a criterion for direct water contact recreation (Cabelli, et al. 1979). This criterion was adopted by almost all states by 1984. It was felt that fecal coliforms was more specific to sewage contamination and had less seasonal variation that total coliforms. Since fecal coliform exposures at swimming beaches had never been linked to disease, the NTAC reviewed the USPHS studies, as published by Stevenson (1953). The 2,300 MPN/100 mL total coliform count association with gastrointestinal disease was used in conjunction with a measured ratio of fecal coliform to total coliform counts (18%) obtained at the Ohio River site studied earlier. It was therefore assumed that a health effect could be detected when the fecal coliform count was 400 MPN/100 mL (18% of 2,300 = 414). Dufour (1984a) pointed out that a detectable health effect was undesirable and that the NTAC therefore recommended a limit of 200 MPN/100 mL for fecal coliforms. Dufour (1984a) points out that, although likely coincidental, the 1968 proposed limit for fecal coliforms (200 MPN/100 mL) was very close to being theoretically equivalent to the total coliform limit of 1,000 MPN/100 mL that was being replaced (200/0.18 = 1100). Dufour (1984a) lists the ideal characteristics of bacterial indicators of fecal contamination, as presented by various authors. The authors were in agreement concerning many of the criteria (correlation to pathogens, unable to grow in aquatic environments, more resistant to disinfection than pathogens, and easy to isolate and enumerate), but two important aspects were seldom mentioned, namely that the indicator should have a direct relationship to fecal contamination, and that the indicator density should correlate with health hazards. Many of the follow-up studies conducted since the mid 1970s examined these additional criteria. E. coli, a member of the fecal coliform group, has been used as a better indicator of fresh fecal contamination. Table 2 indicates the species and subspecies of the Streptococcus and Enterococcus groups of bacteria that are used as indicators of fecal contamination (DHS 1997). Fecal streptococci bacteria are indicators of fecal contamination. The enterococcus group is a subgroup that is considered a better indication of human fecal contamination. S. bovis and S. equinus are considered related to feces

11
from non-human warm blooded animals (such as from meat processing facilities, dairy wastes, and feedlot and other agricultural runoff), indicating that enterococcus may be a better indication of human feces contamination. However, S. facealis subsp. liquifaciens is also associated with vegetation, insects, and some soils (DHS 1997).
Table 2. Streptococcus Species used as Indicators of Fecal Contamination
Indicator organism Enterococcus group
Streptococcus group
Group D antigen Streptococcus faecalis X X S. facealis subsp. liquifaciens X X S. faecalis subsp. zymogenes X X S. faecium X X S. bovis X S. equinus X Group Q antigen S. avium X
Source: DHS (1997) The Cabelli, et al. (1979) study was undertaken to address many remaining questions pertaining to bathing in contaminated waters. Their study examined conditions in New York (at a Coney Island beach, designated as barely acceptable, and at a Rockaway beach, designated as relatively unpolluted). About 8,000 people participated in the study, approximately evenly divided between swimmers and nonswimmers at the two beaches. Total and fecal coliforms, Escherichia, Klebsiella, Citrobacter-Enterobacter, Enterococci, Pseudomonas aeruginosa, and Clostridium perfringens were evaluated in water samples obtained from the beaches during the epidemiological study. The most striking findings were the increases in the rates of vomiting, diarrhea, and stomachache among swimmers relative to nonswimmers at the barely acceptable beach, but not at the relatively unpolluted beach. Ear, eye, nose, and skin symptoms, as well as fever, were higher among swimmers compared to nonswimmers at both beaches. They concluded that measurable health effects do occur at swimming beaches that meet the existing health standards. Children, Hispanic Americans, and low-middle socioeconomic groups were identified as the most susceptible portions of the population. Cabelli, et al. (1982) presented data from the complete EPA sponsored swimming beach study, conducted in New York, New Orleans, and Boston. The study was conducted to address issues from prior studies conducted in the 1950s (including Stevenson’s 1953 study noted above) that were apparently contradictory. They observed a direct, linear relationship between highly credible gastrointestinal illness and enterococci. The frequency of gastrointestinal symptoms also had a high degree of association with distance from known sources of municipal wastewater. Table 3 shows correlation coefficients for total gastrointestinal (GI) and highly credible gastrointestinal (HCGI) symptoms and mean indicator densities found at the New York beaches from 1970 to 1976. The best correlation coefficients were found for enterococci. In contrast, the correlation coefficients for fecal coliforms (the basis for most federal and state guidelines) were poor. Very low levels of enterococcus and Escherichia coli in the water (about 10 MPN/100 mL) were associated with appreciable attack rates (about 10/10,000 persons).
Table 3. Correlation Coefficients between Gastrointestinal Symptoms and Bacterial Densities at New York City Beaches (Cabelli, et al. 1982)
Indicator HCGI correlation
coefficient GI correlation coefficient
Number of observations
Enterococci 0.96 0.81 9 Escherichia coli 0.58 0.51 9 Klebsiella 0.61 0.47 11 Enterobacter-Citrobacter 0.64 0.54 13 Total coliforms 0.65 0.46 11

12
Clostridium perfringens 0.01 -0.36 8 Pseudomonas aeruginosa 0.59 0.35 11 Fecal coliforms 0.51 0.36 12 Aeromonas hydriphila 0.60 0.27 11 Vibrio parahemoylticus 0.42 0.05 7
Figure 1 shows regressions of swimming associated gastrointestinal symptom rates (swimmer rates minus nonswimmer rates) against the mean enterococcus and E. coli densities of the water samples. The results clearly show that the risk of gastrointestinal symptoms associated with swimming in marine waters contaminated with municipal wastewater is related to the quality of the water, as indicated by the enterococcus density of the water. They also felt there was a strong case for causality between enterococci and gastrointestinal symptoms, based on the good association, the consistency at the different locations over different years, the reasonable nature of the relationship between enteric disease and fecal contamination, and the coherent association based on observations of waterborne disease transmission during prior outbreaks. They concluded that swimming in even marginally polluted marine bathing water is a significant route of transmission for observed gastrointestinal illness. They felt that the gastrointestinal illness was likely associated with the Norwalk-like virus that had been confirmed in 2,000 cases at a shellfish associated outbreak in Australia and at several outbreaks associated with contaminated drinking water. Fleisher (1991) reevaluated this marine swimming beach data and concluded that the limitation for enterococci promulgated by the EPA in 1986, based on the Cabelli, et al. (1982) study, (35 per 100 mL, geometric mean for 5 equally spaced samples over a 30-day period, for both fresh and saline water) was too severe, due to minor adjustments of the observed data. He was also especially concerned with the use of a single criterion based on pooled data, while the data from the individual sites indicated very different probabilities of gastroenteritis among swimmers at Boston compared to New York and Lake Pontchartrain (which were similar). He also reported that previous studies found bacteria indicator, and possibly pathogen, survival to be inversely correlated with salinity. He therefore concluded that any relation between enterococci and disease causing pathogens may be site specific, possibly related to water salinity. This EPA enterococci criterion for swimming waters was based on an “acceptable” rate of gastroenteritis of 19 cases per 1,000 swimmers, the same rate upon which the fecal coliform criterion (200 MPN/100 mL) was based. It is interesting to note that Fleisher later participated in additional epidemiological studies in the UK and concluded that 33 fecal streptococci (essentially enterococci)/100 mL was the threshold of increased risk for gastrointestinal illness for swimmers (Kay, et al. 1994). Dufour (1984a) also reviewed a series of studies conducted at freshwater swimming beaches from 1979 to 1982, at Tulsa, OK, and at Erie, PA. Only enterococci, E. coli, and fecal coliforms were monitored, based on the results of the earlier studies. Table 4 shows the correlation coefficients for these three bacterial parameters and gastrointestinal disease.
Table 4. Correlation Coefficients for Bacterial Parameters and Gastrointestinal Disease (Fresh Water Swimming Beaches)
Highly Credible
Gastrointestinal Illness
Total Gastrointestinal Illness
Number of Study Units
Enterococci 0.774 0.673 9 E. coli 0.804 0.528 9 Fecal coliforms -0.081 0.249 7
These results are quite different than the results from the marine studies, in that both enterococci and E. coli had high correlation coefficients between the bacterial levels and the incidence of gastrointestinal illness. However, the result was the same for fecal coliforms, in that there was no association between fecal coliform levels and gastrointestinal illness. Dufour (1984b) concluded that enterococci would be the indicator of choice for gastrointestinal illness, based on scientific dependability. E. coli could also be used, if only fresh waters were being evaluated. Fecal coliforms would be a poor choice for monitoring the safety of bathing waters. However, he

13
concluded that numeric standards should be different for fresh and saline waters because of different dieoff rates for the bacteria and viruses for differing salinity conditions.

14
XXXX remove Figure 1. Regressions of Gastrointestinal Symptom Rates (per 1,000 swimmers) against Enterococcus and E. coli. Densities at Marine Swimming Beaches (Cabelli, et al. 1982).

15
Other studies examined additional illness symptoms associated with swimming in contaminated water, besides gastrointestinal illness, and identified other potentially useful bacterial indicators. Seyfried, et al. (1985), for example, examined swimming beaches in Toronto for respiratory illness, skin rashes, plus eye and ear problems, in addition to gastrointestinal illness. They found that total staphylococci correlated best with swimming associated total illness, plus ear, eye and skin illness. However, fecal streptococci and fecal coliforms also correlated (but not as well) with swimming associated total illness. Ferley, et al. (1989) examined illnesses among swimmers during the summer of 1986 in the French Ardèche river basin, during a time when untreated domestic sewage was entering the river. They examined total coliforms, fecal coliforms, fecal streptococci and Pseudomonas aeruginosa and Aeromonas Spp, but only two samples per week were available for each swimming area. The total morbidity rate ratio for swimmers compared to nonswimmers was 2.1 (with a 95% confidence interval of 1.8 to 2.4), with gastrointestinal illness the major illness observed. They found that fecal streptococci (FS) was the best indicator of gastrointestinal illness. A critical FS value of 20 MPN/100 mL indicated significant differences between the swimmers and nonswimmers. Skin ailments were also more common for swimmers than for nonswimmers and were well correlated with the concentrations of fecal coliforms, Aeromonas Spp and Pseudomonas aeruginosa. They noted that a large fraction (about 60%) of the fecal coliforms corresponded to E. coli, and that their definition of fecal streptococci essentially was what North American researchers termed enterococci. Koenraad, et al. (1997) investigated the contamination of surface waters by Campylobacter and its associated human health risks. They reported that campylobacteriosis is one the most frequently occurring acute gastroenteritis diseases in humans. Typical investigations have focused on the consumption of poultry, raw milk, and untreated water as the major sources of this bacterial illness. Koenraad, et al. (1997) found that human exposures to Campylobacter contaminated surface waters is likely a more important risk factor than previously considered. In fact, they felt that Campylobacter infections may be more common than Salmonella infections. The incidence of campylobacteriosis due to exposure to contaminated recreational waters has been estimated to be between 1.2 to 170 per 100,000 individuals. The natural habitat of Campylobacter is the intestinal tract of warm-blooded animals (including poultry, pigs, cattle, gulls, geese, pigeons, magpies, rodents, shellfish, and even flies). It does not seem to multiply outside of its host, but it can survive fairly well in aquatic environments. It can remain culturable and infective for more than 2 months under ideal environmental conditions. Besides runoff, treated wastewater effluent is also a major likely source of Campylobacter in surface waters. Sanitary wastewater may contain up to 50,000 MPN of Campylobacter per 100 mL, with 90 to 99% reductions occurring during typical wastewater treatment. Many of the available epidemiological studies have been confined to healthy adult swimmers, in relatively uncontaminated waters. However, it is assumed that those most at risk would be children, the elderly, and those chronically ill, especially in waters known to be degraded. Obviously, children are the most likely of this most-at-risk group to play in, or by, water. Alexander, et al. (1992) therefore specifically examined the risk of illness associated with swimming in contaminated sea water for children, aged 6 to 11 years old. This study was based on parental interviews for 703 child participants during the summer of 1990 at Blackpool beach, UK. Overall, 80% of the samples at the Blackpool Tower site and 93% of the samples at the South Pier site failed to meet the European Community Standards for recreational waters. All of the 11 designated beaches in Lancashire (including Blackpool beach), in the northwest region of England, continually fail the European directive imperative standards for recreational waters. During this study, statistically significant increases in disease were found for children who had water contact, compared to those who did not. Table 5 shows the prevalence and rate ratios for these symptoms. Diarrhea and loss of appetite had strong associations with the water contact group, while vomiting and itchy skin had moderate associations. No other variables examined (household income, sex of the child, sex of the respondent, general health, chronic or recurring illness in the child, age of the child, foods eaten, including ice cream, other dairy products, chicken, hamburgers, shellfish, or ice cubes, acute symptoms in other household members, presence of children under 5 in the household, and other swimming activities) could account for the significant increases in the reported symptoms for the children who had water contact. Other risk factors, in addition to exposure to sewage contaminated swimming waters, was investigated by Fleisher, et al. (1993). People visiting beaches for recreation are frequently exposed to additional risks for gastroenteritis disease, especially related to foods that are eaten. Picnic lunches and food purchased at swimming beaches may contain improperly prepared or inadequately stored foods, including food that may be especially risky including sandwiches having mayonnaise, chicken, eggs, hamburgers, and hot dogs. They found that non-water related risk

16
factors confounded the relationships between gastroenteritis and fecal streptococci densities. They also found that fecal coliform and fecal streptococci densities changed rapidly in time and location at swimming beaches, requiring many more water sample evaluations than are typically obtained during most epidemiological studies.
Table 5. Illness Symptoms for Children Exposed to Sewage Contaminated Sea Water (Alexander, et al. 1992)
Prevalence for
water contact group, n=455 (%)
Prevalence for non-water contact group, n=248 (%)
Rate Ratio Strength of Association
Vomiting 4.2 1.6 2.6 Moderate Diarrhea 7.9 2.4 3.3 Strong Itchy skin 5.1 2.8 1.8 Moderate Loss of appetite 4.0 1.2 3.3 Strong
Hong Kong Swimming Beach Study Swimming beach studies were conducted in Hong Kong during the summers of 1986 and 1987 (Cheung, et al. 1990). This was a significant study in that it was one of the first major epidemiological investigations that has been conducted in subtropical waters. The Hong Kong swimming beach criteria, adopted in 1981, set the following objective: “The level of E. coli should not exceed 1,000 per 100 mL, calculated as the running median of the most recent five consecutive samples.” Beaches that did not meet this objective for 60% of the time in any year were closed to swimming. The results of this study can be compared to the more common temperate area studies as an indication of the usability of recreation water quality criteria for a broader range of conditions. More than 18,700 responses were obtained from beachgoers on nine beaches. Water samples were collected every two hours at the nine beaches under study. The samples were analyzed for E. coli, Klebsiella spp., fecal streptococci, fecal coliforms, staphylococci, Pseudomonas aeruginosa, Candida albicans, and total fungi. E. coli only represented 57% of the fecal coliforms (much lower than reported elsewhere). Beachgoers were recruited on selected weekends and given initial interviews. Follow-up telephone interviews were obtained 7 to 10 days afterwards. The beachgoers spent an average of 3.5 hours at the beach, and swimmers spent an average of 1.3 hours in the water (much longer than reported in colder climates). The beaches studied were affected to varying degrees by nearby submarine sewage outfalls, agricultural runoff (pig farming) or by storm drains discharging across the beaches. The overall symptom rates for gastrointestinal, ear, eye, skin, respiratory, fever, and total illness were significantly higher for swimmers than for non-swimmers. Many of the rates were also higher at “barely acceptable” beaches than at “relatively unpolluted” beaches. The increased risk of swimmers developing highly credible gastrointestinal illness (HCGI) was 5 times greater than for non-swimmers. The increased risk for swimmers in developing gastrointestinal (GI), eye, skin, and total illness was 2 to 4 times greater than for non-swimmers. The incubation period for the gastrointestinal symptoms in Hong Kong were similar to those reported for the U.S., indicating a possible similar causative agent (Norwalk virus and rotavirus virus originating from human sewage being suspected). Children under 10 years of age were also found to have significantly higher symptom rates for GI, HCGI, skin, respiratory, fever, and total illness than older swimmers. Escherichia coli was found to be the best indicator of swimmer illness (especially gastroenteritis and skin symptoms). Staphylococci measurements were recommended as a supplement to E. coli, especially for ear, respiratory and total illness. They contrasted this finding with typically better correlations between enterococci and health risks at U.S. beaches. They concluded that it may not be appropriate to adopt another country’s water contact recreation water quality criteria, especially if they are vastly separated geographically. Differences may be due to differences in the immune state of the populations and the indicator-illness relationships. Geometric mean densities of 180 E. coli per 100 mL and 1,000 staphylococci per 100 mL were found to be the thresholds for differentiating “barely acceptable” and “relatively unpolluted” beaches. These observations were used to develop new swimming beach standards for Hong Kong, as shown in Table 6. This new classification scheme was in place in 1988.

17
Table 6. Classification of Hong Kong Beaches Based on Swimming Associated Health Risk Levels
Rank Swimming associated gastroenteritis and skin symptom rate (per 1,000 swimmers)
Seasonal geometric mean E. coli density (per 100 mL)
Number of swimming beaches in category during 1988
Good 0 24 9 Acceptable 10 180 19 Barely acceptable 15 610 7 Unacceptable >15 >610 7 Cheung, et al. 1990.
Sydney Beach Users Study This study examined problems associated with sewage contaminated swimming beaches (from CSO discharges and ocean outfalls of treated sewage) (Corbett, et al. 1993). They interviewed almost 3,000 beach goers at 12 beaches during 3 months in late 1989 and early 1990. Follow-up telephone interviews were conducted about a week later concerning incidence of illness. During the 41 days of sampling, 461 samples were analyzed for fecal coliforms and fecal streptococci. Of these samples, 67% failed to meet New South Wales Department of Health water quality criteria. Swimmers were almost twice as likely as nonswimmers to report symptoms, but the prevalence of respiratory symptoms in people aged 15 to 25 was high, irrespective of swimming status or pollution level. The incidence of respiratory, fever, eye, ear, and other problems increased with increasing bacterial counts. Fecal streptococci counts were worse predictors of the swimming risk than the fecal coliform counts. Gastrointestinal symptoms were not related to either the fecal coliforms or fecal streptococci counts monitored. Those who swam for longer than 30 minutes were more than 4 times as likely to develop gastrointestinal symptoms compared to nonswimmers or those who swam for shorter periods. Luckily, children playing near and in urban streams are not likely to have such prolonged submerged exposures, and gastrointestinal problems may not be as serious as other water contact problems. The risk of respiratory, ear, and eye symptoms accounted wholly for the increases in illness observed. They reported that enteroviruses can cause respiratory symptoms and can persist in marine sediments and waters for many months. Table 7 shows the percentages of swimmers who reported various illness symptoms after swimming in waters having varying bacterial contamination levels. Increasing levels of contamination increased the health risks for all symptoms, except for gastrointestinal symptoms. Table 8 shows the odds ratios (and associated 95% confidence intervals) for illness at different levels of fecal coliform contamination. Above 1,000 cfu/100 mL fecal coliforms, the associations for these illnesses are all strong, while they are at least moderate for all levels shown, compared to the nonswimmers. However, most of the confidence intervals were quite large, indicating large variability in the observations, as expected. UK Swimmer/Sewage Exposure Study Another recent swimmer/sewage exposure study was conducted in the UK, reported by Kay, et al. (1994) and by Fleisher, et al. (1996). This study was unique in design and was able to develop dose-response relationships and critical exposure levels for a few illnesses associated with swimmer exposures to sewage contaminated waters. Adult volunteers (1528 study participants) were studied over four seasons from 1989 through 1992. After arriving at the beach, healthy volunteers were randomized into bather and nonbather groups with the duration and place of individual exposure being rigorously controlled. All of the study locations met European Community mandatory bacteriological marine bathing water quality criteria and were therefore not excessively contaminated.
18
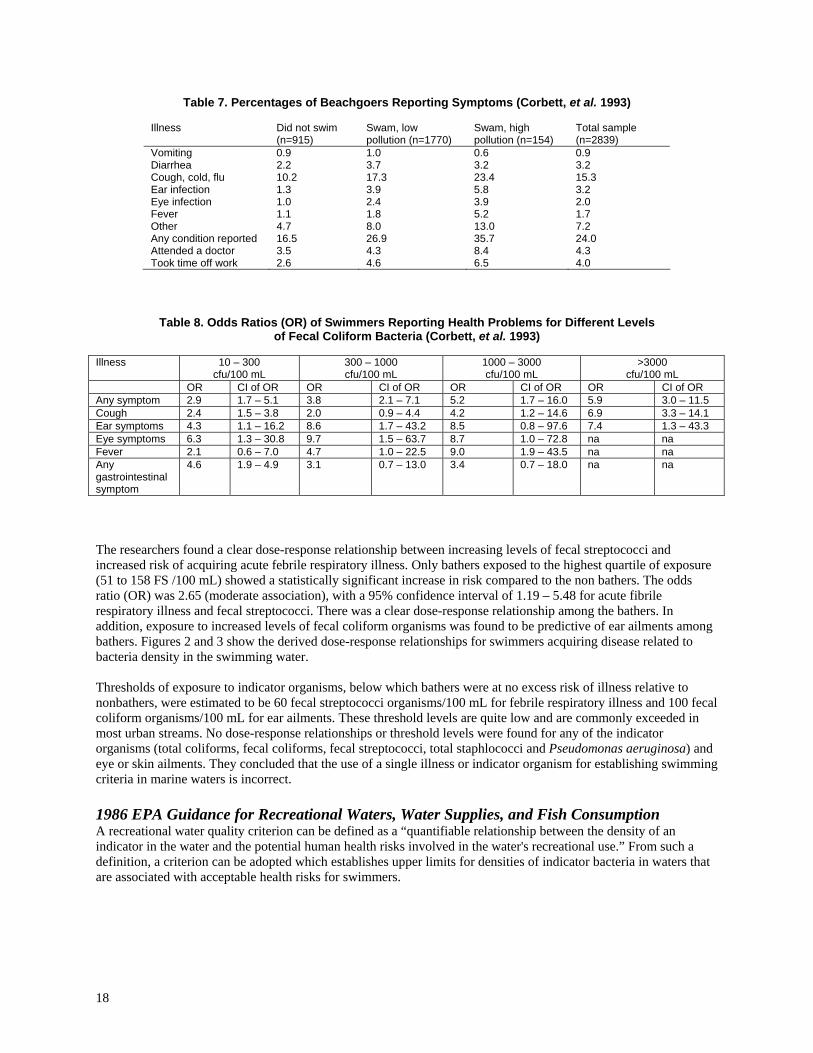
Table 7. Percentages of Beachgoers Reporting Symptoms (Corbett, et al. 1993)
Illness Did not swim (n=915)
Swam, low pollution (n=1770)
Swam, high pollution (n=154)
Total sample (n=2839)
Vomiting 0.9 1.0 0.6 0.9 Diarrhea 2.2 3.7 3.2 3.2 Cough, cold, flu 10.2 17.3 23.4 15.3 Ear infection 1.3 3.9 5.8 3.2 Eye infection 1.0 2.4 3.9 2.0 Fever 1.1 1.8 5.2 1.7 Other 4.7 8.0 13.0 7.2 Any condition reported 16.5 26.9 35.7 24.0 Attended a doctor 3.5 4.3 8.4 4.3 Took time off work 2.6 4.6 6.5 4.0
Table 8. Odds Ratios (OR) of Swimmers Reporting Health Problems for Different Levels of Fecal Coliform Bacteria (Corbett, et al. 1993)
Illness 10 – 300
cfu/100 mL 300 – 1000 cfu/100 mL
1000 – 3000 cfu/100 mL
>3000 cfu/100 mL
OR CI of OR OR CI of OR OR CI of OR OR CI of OR Any symptom 2.9 1.7 – 5.1 3.8 2.1 – 7.1 5.2 1.7 – 16.0 5.9 3.0 – 11.5 Cough 2.4 1.5 – 3.8 2.0 0.9 – 4.4 4.2 1.2 – 14.6 6.9 3.3 – 14.1 Ear symptoms 4.3 1.1 – 16.2 8.6 1.7 – 43.2 8.5 0.8 – 97.6 7.4 1.3 – 43.3 Eye symptoms 6.3 1.3 – 30.8 9.7 1.5 – 63.7 8.7 1.0 – 72.8 na na Fever 2.1 0.6 – 7.0 4.7 1.0 – 22.5 9.0 1.9 – 43.5 na na Any gastrointestinal symptom
4.6 1.9 – 4.9 3.1 0.7 – 13.0 3.4 0.7 – 18.0 na na
The researchers found a clear dose-response relationship between increasing levels of fecal streptococci and increased risk of acquiring acute febrile respiratory illness. Only bathers exposed to the highest quartile of exposure (51 to 158 FS /100 mL) showed a statistically significant increase in risk compared to the non bathers. The odds ratio (OR) was 2.65 (moderate association), with a 95% confidence interval of 1.19 – 5.48 for acute fibrile respiratory illness and fecal streptococci. There was a clear dose-response relationship among the bathers. In addition, exposure to increased levels of fecal coliform organisms was found to be predictive of ear ailments among bathers. Figures 2 and 3 show the derived dose-response relationships for swimmers acquiring disease related to bacteria density in the swimming water. Thresholds of exposure to indicator organisms, below which bathers were at no excess risk of illness relative to nonbathers, were estimated to be 60 fecal streptococci organisms/100 mL for febrile respiratory illness and 100 fecal coliform organisms/100 mL for ear ailments. These threshold levels are quite low and are commonly exceeded in most urban streams. No dose-response relationships or threshold levels were found for any of the indicator organisms (total coliforms, fecal coliforms, fecal streptococci, total staphlococci and Pseudomonas aeruginosa) and eye or skin ailments. They concluded that the use of a single illness or indicator organism for establishing swimming criteria in marine waters is incorrect. 1986 EPA Guidance for Recreational Waters, Water Supplies, and Fish Consumption A recreational water quality criterion can be defined as a “quantifiable relationship between the density of an indicator in the water and the potential human health risks involved in the water's recreational use.” From such a definition, a criterion can be adopted which establishes upper limits for densities of indicator bacteria in waters that are associated with acceptable health risks for swimmers.

19
Figure 2. Bathers’ probability of acquiring acute febrile respiratory illness through exposure to increasing levels of fecal streptococci (Fleisher, et al. 1996). Figure 3. Bathers’ probability of acquiring ear infections through exposure to increasing levels of fecal coliforms (Fleisher, et al. 1996).

20
The Environmental Protection Agency, in 1972, initiated a series of studies at marine and fresh water bathing beaches which were designed to determine if swimming in sewage-contaminated marine and fresh water carries a health risk for bathers; and, if so, to what type of illness. Additionally, the EPA wanted to determine which bacterial indicator is best correlated to swimming-associated health effects and if the relationship is strong enough to provide a criterion (EPA 1986: Ambient Water Quality Criteria for Bacteria - 1986, EPA 440/5-84-002, U.S. Environmental Protection Agency, Office of Water Regulations and Standards, Washington, DC., NTIS access #: PB 86-158-045). Many of the above described U.S. studies were conducted as part of these EPA sponsored research activities. The quantitative relationships between the rates of swimming-associated health effects and bacterial indicator densities were determined using standard statistical procedures. The data for each summer season were analyzed by comparing the bacteria indicator density for a summer bathing season at each beach with the corresponding swimming-associated gastrointestinal illness rate for the same summer. The swimming-associated illness rate was determined by subtracting the gastrointestinal illness rate in nonswimmers from that for swimmers. The EPA’s evaluation of the bacteriological data indicated that using the fecal coliform indicator group at the maximum geometric mean of 200 organisms per 100 mL, as recommended in Quality Criteria for Water would cause an estimated 8 illness per 1,000 swimmers at freshwater beaches. Additional criteria, using E. coli and enterococci bacteria analyses, were developed using these currently accepted illness rates. These bacteria are assumed to be more specifically related to poorly treated human sewage than the fecal coliform bacteria indicator. The freshwater equations developed by Dufour (1984b) were used to calculate new indicator densities corresponding to the accepted gastrointestinal illness rates. It should be noted that these indicators only relate to gastrointestinal illness, and not other problems associated with waters contaminated with other bacterial or viral pathogens. Common swimming beach problems associated with contamination by stormwater include skin and ear infections caused by Psuedomonas aeruginosa and Shigella. National bacteria criteria have been established for contact with bacteria and are shown in Table 9. State standards usually also exist for fecal coliform bacteria. Typical public water supply standards (Alabama’s are shown) are as follows: (i) Bacteria of the fecal coliform group shall not exceed a geometric mean of 2,000/100 mL; nor exceed a maximum of 4,000/100 mL in any sample. The geometric mean shall be calculated from no less than five samples collected at a given station over a 30-day period at intervals not less than 24 hours. The membrane filter counting procedure will be preferred, but the multiple tube technique (five-tube) is acceptable. (ii) For incidental water contact and recreation during June through September, the bacterial quality of water is acceptable when a sanitary survey by the controlling health authorities reveals no source of dangerous pollution and when the geometric mean fecal coliform organism density does not exceed 100/100 mL in coastal waters and 200/100 mL in other waters. When the geometric mean fecal coliform organism density exceeds these levels, the bacterial water quality shall be considered acceptable only if a second detailed sanitary survey and evaluation discloses no significant public health risk in the use of such waters. Waters in the immediate vicinity of discharges of sewage or other wastes likely to contain bacteria harmful to humans, regardless of the degree of treatment afforded these wastes, are not acceptable for swimming or other whole body water-contact sports. Standards for fish and wildlife waters are similar to the above standard for a public water supply, except part (i) has different limits: “Bacteria of the fecal coliform group shall not exceed a geometric mean of 1,000/100 mL on a monthly average value; nor exceed a maximum of 2,000/100 mL in any sample.” Part (ii) is the same for both water beneficial uses. The EPA full body contact recreation water quality criteria are as follows: Marine waters: “Based on a statistically sufficient number of samples (generally not less than 5 samples equally spaced over a 30-day period), the geometric mean of the enterococci densities should not exceed 35 per 100 mL.” (EPA 1986)

21
Fresh waters: “Based on a statistically sufficient number of samples (generally not less than 5 samples equally spaced over a 30-day period), the geometric mean of the bacterial densities should not exceed one or the other of the following (Note that only one indicator should be used. The regulatory agency should select the appropriate indicator for its conditions.):
E. coli, at a concentration of 126 per 100 mL, or Enterococci, at a concentration of 33 per 100 mL.” (EPA 1986)
Table 9. U.S. EPA Water Quality Criteria for Swimming Waters
Marine Waters Fresh Waters Main EPA research reference
Cabelli 1983 Dufour 1984b
Acceptable swimming associated gastroenteritis rate (per 1,000 swimmers)
Increase of 19 illnesses per 1,000 swimmers
Increase of 8 illnesses per 1,000 swimmers
Comparable fecal coliform exposure
200 fecal coliforms/100 mL 200 fecal coliforms/100 mL
Steady state geometric mean indicator density 35 enterococci/100 mL 33 enterococci/100 mL, or 126 E. coli/100 mL
Single sample limits: Designated bathing beach area 104 enterococci/100 mL 61 enterococci/100 mL, or
235 E. coli/100 mL
Moderate full body contact recreation 124 enterococci/100 mL 89 enterococci/100 mL, or 298 E. coli/100 mL
Lightly used full body contact recreation 276 enterococci/100 mL 108 enterococci/100 mL, or 406 E. coli/100 mL
Infrequently used full body contact recreation 500 enterococci/100 mL 151 enterococci/100 mL , or 576 E. coli/100 mL
EPA 1986 Water Environment & Technology (1997) reported the new EPA BEACH (Beaches Environmental Assessment, Closure, and Health) program to help states strengthen recreational water quality monitoring programs. During the summer of 1995, state and local governments reported closing or issuing warnings for 4,000 beaches because of suspected dangerous conditions associated from wastewater and stormwater contamination of swimming areas. A new testing method for Escherichia coli and enterococci bacteria was introduced that gives results in 1 day instead of the typical 2 days testing period. They also reported that these bacteria better correlate with human health risks. The EPA will survey state and local health and environmental directors about the quality of freshwater and marine recreational areas and post the results on a new Beach Watch Web site (http://epa.gov/OST/beaches) by the summer of 1998. Exposure to Pathogens in Stormwater Most of the comprehensive urban runoff studies that examined bacteria, and especially pathogens, were conducted in the late 1960s to the early 1980s. These early references are summarized in the following paragraphs to supplement the newer, more general references, listed elsewhere. As noted previously, the fecal coliform test is not specific for any one coliform type, or groups of types, but instead has an excellent positive correlation for coliform bacteria derived from the intestinal tract of warm blooded animals (Geldreich, et al. 1968). The fecal coliform test measures Escherichia coli as well as all other coliforms that can ferment lactose at 44.5oC and are found in warm blooded fecal discharges. Geldreich (1976) found that the fecal coliform test represents over 96 percent of the coliforms derived from human feces and from 93 to 98 percent of those discharged in feces from other warm blooded animals, including livestock, poultry, cats, dogs, and rodents. The variations in the specific fecal coliform bacteria biotypes are related to both fecal moisture content and diet.

22
Moisture and diet may also affect the variety of bacteria biotypes found in the fecal coliform populations from different animal groups. In many urban runoff studies, all of the fecal coliforms were E. coli (Quresh and Dutka 1979). Fecal strep. bacteria are all of the intestinal Streptococci bacteria from warm blooded animal feces (Geldreich and Kenner 1969). The types and concentrations of different bacteria biotypes varies for different animal sources. Qureshi and Dutka (1979) found that pathogenic bacteria biotypes are present in southern Ontario urban runoff and are probably from several different sources. Van Donzel, et al. (1967) reviewed water-borne disease outbreak information for 1946 to 1960. Almost 26,000 cases were listed for almost 230 known outbreaks in the United States and Puerto Rico. At least 29 of these outbreaks, involving more than 9,000 cases, were associated with stormwater runoff caused by either runoff washing human and animal feces or sewage into wells, springs, streams, small reservoirs, and open water mains, or by widespread flooding of individual and public water systems. Several authors, however, did not think that urban runoff may present a significant health problem. Olivieri, et al. (1977a) did not believe that urban runoff constitutes a major health problem because of the large numbers of viable bacteria cells that must be consumed to establish an infection. For urban runoff, it may be impossible to consume enough bacteria cells to establish the infective dose. The Presence and Effects of Salmonella in Urban Runoff Salmonella has been reported in some but not all urban stormwaters. Qureshi and Dutka (1979) frequently detected Salmonella in southern Ontario stormwaters. They did not find any predictable patterns of Salmonella isolations as they were found throughout the various sampling periods. Olivieri, et al. (1977a) found Salmonella frequently in Baltimore runoff, but at relatively low concentrations and required sample concentration. Typical concentrations were from five to 300 Salmonella organisms/ten liters. The concentrations of Salmonella were about ten times higher in the stormwater samples than in the urban stream receiving the runoff. They also did not find any marked seasonal variations in Salmonella concentrations. Field, et al. (1976) also stated that Salmonella were frequently found in most Baltimore urban runoff samples. Almost all of the stormwater samples that had fecal coliform concentrations greater that 2000 organisms/100 mL had detectable Salmonella concentrations. About 27 percent of the samples having fecal coliform concentrations less than 200 organisms/100 mL had detectable Salmonella. However, quite a few urban runoff studies did not detect Salmonella. Schillinger and Stuart (1978) found that Salmonella isolations were not common in a Montana subdivision study and that the isolations did not correlate well with fecal coliform concentrations. Environment Canada (1980) stated that Salmonella were virtually absent from Ottawa storm drainage samples in 1979. They concluded that Salmonella are seldom present in significant numbers in Ottawa urban runoff. The types of Salmonella found in southern Ontario were S. thompson and S. typhimurium var copenhagen (Qureshi and Dutka, 1979). Olivieri, et al. (1977b) stated that the primary human enteric disease producing Salmonella biotypes associated with the ingestion of water include S. typhi (typhoid fever), S. paratyphi (paratyphoid fever), and Salmonella species (salmonellosis). These biotypes are all rare except for Salmonella. The dose of Salmonella required to produce an infection is quite large (approximately 105 organisms). The salmonellosis health hazard associated with water contact in urban streams is believed to be small because of this relatively large infective dose. If two liters of stormwater having typical Salmonella concentrations (ten Salmonella organisms per/ten liters) is ingested, less than 0.001 of the required infective dose would be ingested. If a worse case Salmonella stormwater concentration of 10,000 organisms/ten liters occurred, the ingestion of 20 liters of stormwater would be necessary for an infective dose. They stated that the low concentrations of Salmonella, coupled with the unlikely event of consuming enough stormwater, make the Salmonella health hazard associated with urban runoff small. Geldreich (1965) recommended a fecal coliform standard of 200 organisms/100 mL because the frequency of Salmonella detection increased sharply at fecal coliform concentrations greater than this value. Setmire and Bradford (1980) stated that the National Academy of Sciences recommends a fecal coliform standard of 70/100 mL in waters with shellfish harvesting to restrict Salmonella concentrations in edible tissues. Field, et al. (1976) concluded that the use of indicator bacteria to protect Salmonella ingestion is less meaningful in stormwater runoff than in other waters.

23
Marron and Senn (1974) pointed out the possibility of dogs transmitting salmonellosis. They did not feel that this constitutes a serious public health threat but people should be aware of the possibility of infection and direct contact with dog feces should be minimized. The Presence and Effects of Staphylococci in Urban Runoff Staphylococcus aureus is an important human pathogen as it can cause boils, carbuncles, abscesses, and impetigo on skin on contact. Olivieri, et al. (1977b) stated that the typical concentrations of Staphylococci are not very high in urban streams. They also stated that there was little information available relating the degree of risk of staph. infections with water concentrations. They concluded that Staph. aureus appears to be the most potentially hazardous pathogen associated with urban runoff, but there is no evidence available that skin, eye, or ear infections can be caused by the presence of this organism in recreational waters. They concluded that there is little reason for extensive public health concern over recreational waters receiving urban storm runoff containing staph. organisms. The Presence and Effects of Shigella in Urban Runoff Olivieri, et al. (1977b) stated that there is circumstantial evidence that Shigella is present in urban runoff and receiving waters and that it could present a significant health hazard. Shigella species causing bacillary dysentery are one of the primary human enteric disease producing bacteria agents present in water. The infective dose of Shigella necessary to cause dysentery is quite low (10 to 100 organisms). Because of this low required infective dose and the assumed presence of Shigella in urban waters, it may be a significant health hazard associated with urban runoff. The Presence and Effects of Streptococcus in Urban Runoff Streptococcus faecalis and atypical S. faecalis are of limited sanitary significance (Geldreich 1976). Streptococcus determinations in urban runoff are most useful for identifying the presence of S. bovis and S. equinus that are specific indicators of non-human, warm blooded animal pollution. However, it is difficult to interpret fecal strep. data when their concentrations are lower than 100 organisms/100 mL because of the ubiquitious occurrence of S. faecalis var. liquifaciens. This biotype is generally the predominant strep. biotype occurring at low fecal strep. concentrations. The Presence and Effects of Pseudomonas Aeruginosa in Urban Runoff Pseudomonas aeruginosa is reported to be the most abundant pathogenic bacteria organism in urban runoff and streams (Olivieri, et al. 1977b). This pathogen is associated with eye and ear infections and is resistant to antibiotics. P. aeruginosa concentrations in urban runoff are at significantly greater concentrations (about 100 items) than the values associated with most bathing beach studies. Cabelli, et al. (1976) stated that P. aeruginosa is indigenous in about 15 percent of the human population. Swimmer’s ear or other P. aeruginosa infections may, therefore, be caused by trauma to the ear canals associated with swimming and diving, and not exposure to P. aeruginosa in the bathing water. Environment Canada (1980) stated that there is preliminary evidence of the direct relationship between very low levels of P. aeruginosa and an increase in incidents of ear infections in swimmers. They stated that a control level for this Pseudomonas biotype of between 23 and 30 organisms/100 mL was considered. Cabelli, et al. (1976) stated that P. aeruginosa densities greater than 10 organisms/100 mL were frequently associated with fecal coliform levels considerably less than 200 organisms/100 mL. P. aeruginosa densities were sometimes very low when the fecal coliform levels were greater than 200 organisms/100 mL. An average estimated P. aeruginosa density associated with a fecal coliform concentration of 200 organisms/100 mL is about 12/100 mL. They further stated that P. aeruginosa by itself cannot be used as a basis for water standards for the prevention of enteric diseases during recreational uses of surface waters. The determinations of this biotype should be used in conjunction with fecal coliform or other indicator organism concentrations for a specific location. They recommended that bathing beaches that are subject to urban runoff pollution be temporarily closed until the P. aeruginosa concentrations return to a baseline concentration. The Presence and Effects of other Pathogens in Urban Runoff Candida albicans is a yeast found in Ottawa area urban runoff and receiving waters (Environment Canada 1980). This yeast can cause oral, cutaneous, and vaginal mycosis. Other potential health problems associated with urban

24
runoff might be from histoplasmosis and cryptococcosis that are associated with accumulations of guano at various bird roosts in or near areas of human habitation (Locke 1974). E. coli and Vibro cholerae are disease producing pathogens associated with the ingestion of water. The cholera pathogen is quite rare, but E. coli is more common in urban runoff. The required infective dose of both of these pathogens is about 108 organisms (Olivieri, et al. 1977b). Dog feces are capable of transmitting many diseases, including leptospirosis, brucellosis, toxoplasmosis, tuberculosis and other diseases. However, these problems are quite rare and do not indicate a serious public health threat. Visceral larval migrans (VLM) is the most serious disease associated with dog feces. This mostly affects children under four years of age who ingest the bacteria through ingestion of feces or contaminated soil. Symptoms include blindness. Viruses may also be important pathogens in urban runoff. Very small amounts of a virus are capable of producing infections or diseases, especially when compared to the large numbers of bacteria organisms required for infection (Berg 1965). The quantity of enterroviruses which must be ingested to produce infections is usually not known (Olivieri, et al. 1977b). Viruses are usually detected at low levels in urban receiving waters and storm runoff. They stated that even though the minimum infective doses may be small, the information available indicates that stormwater virus threats to human health is small. Because of the low levels of virus necessary for infection, dilution of viruses does not significantly reduce their hazard. Protozoa in Urban Watersheds States, et al. (1997) examined Cryptosporidium and Giardia in river water serving as Pittsburgh’s water supply. They collected monthly samples from the Allegheny and Youghiogheny Rivers for two years. They also sampled a small stream flowing through a diary farm, treated sanitary sewage effluent, and CSOs. Table 10 summarizes their observations. The CSO samples had much greater numbers of the protozoa than any of the other samples collected. No raw sewage samples were obtained, but they were assumed to be very high because of the high CSO sample values. The effluent from the sewage treatment plant was the next highest, at less than half of the CSO values. The diary farm stream was not significantly different from either of the two large rivers. The water treatment process appeared to effectively remove Giardia, but some Cryptosporidium was found in the filtered water. Settling the river water seemed to remove some of the protozoa, but the removal would be not adequate by itself. Table 10. Observed Giardia and Cryptosporidium in the Pittsburgh, PA, area (States, et al. 1997) Samples Giardia cysts Cryptosporidium oocysts Number of
samples Occurrence (%) Geometric mean of
detectable samples (#/100 L)
Number of samples
Occurrence (%) Geometric mean of detectable samples (#/100 L)
CSOs 5 100 28,700 5 80 2,010 Sewage treatment plant effluent
24 83 664 24 33 924
Dairy farm stream 24 55 82 24 82 42 Allegheny River 24 63 34 24 63 31 Settled Allegheny River water
24 8 29 24 29 12
Filtered Allegheny River water
24 0 0 24 21 0.5
Filter backwash water
24 8 59 24 38 328
Youghiogheny River 24 54 118 24 63 58 States, et al. (1997) also reviewed prior Giardia and Cryptosporidium monitoring data, as summarized in Table 11. Raw drinking water supplies were shown to have highly variable levels of these protozoa, typically up to several hundred Giardia cysts and Cryptosporidium oocysts per 100 L and were found in 5 to 50% of the samples evaluated. Conventional water treatment appeared remove about 90% of the protozoa.

25
Table 11. Observed Giardia and Cryptosporidium In Raw Water Supplies and in Treated Water (States, et al. 1997) Samples Giardia cysts Cryptosporidium oocysts Number
of samples
Occurrence (%)
Geometric mean of detectable samples (#/100 L)
Number of samples
Occurrence (%)
Geometric mean of detectable samples (#/100 L)
Rivers, streams, and lakes in 17 states (Rose, et al. 1991)
257 16 3 (average) 257 55 43 (average)
Drinking water samples (Rose, et al. 1991)
36 0 0 36 17 0.5 to 1.7 (range)
Raw surface water supply samples at 72 water treatment plants (LeChevallier and Norton 1995)
262 45 200 262 52 240
Finished drinking water from above plants (LeChevallier and Norton 1995)
262 4.6 2.6 262 13.4 3.3
Raw surface water supply samples at 66 water treatment plants (LeChevallier, et al. 1991a)
85 81 277 85 87 270
Filtered drinking water from above plants (LeChevallier, et al. 1991b)
83 17 4.5 83 27 1.5
Finished water samples from 33 conventional water treatment plants (Hancock, et al. 1996)
55 5 presumptive 2 confirmed
2 to 5 presumptive (range) 2 confirmed
55 7 presumptive
1 to 26 presumptive (range)
Existing data on finished water from 130 U.S. water treatment plants (Rosen, et al. 1996)
1237 4.9 na 1237 7.1 na
Santa Monica Bay Project This study was the first large-scale epidemiological study in the U.S. to investigate possible adverse health effects associated with swimming in ocean waters affected by discharges from separate storm drains (SMBRP 1996). This was a follow-up study after previous investigations found that human fecal waste was present in the stormwater collection systems (Water Environment & Technology 1996b, Environmental Science & Technology 1996b, and Haile, et al. 1996). During a four month period in the summer of 1995, about 15,000 ocean swimmers were interviewed on the beach and during telephone interviews one to two weeks later. They were queried concerning illnesses since their beach outing. The incidence of illness (such as fever, chills, ear discharge, vomiting, coughing with phlegm, and credible gastrointestinal illness) was significantly greater (from 44 to 127% increased incidence) for ocean goers who swam directly off the outfalls, compared to those who swam 400 yards away, as shown on Table 12. As an example, the rate ratio (RR) for fever was 1.6, while it was 2.3 for ear discharges, and 2.2 for highly credible gastrointestinal illness comprised of vomiting and fever (HCGI). The approximated associations were weak for any of the symptoms, and moderate for the others listed. Disease incidence dropped significantly with distance from the storm drain. At 400 yards, and beyond, upcoast or downcoast, elevated disease risks were not found. The results did not change when adjusted for age, beach, gender, race, socioeconomic status, or worry about health risks associated with swimming at the beach. These interviews were supplemented with indicator and pathogen bacteria and virus analyses in the waters. The greatest health problems were associated with times of highest concentrations (E. coli >320 cfu/100 mL, enterococcus > 106 cfu/100 mL, total coliforms >10,000 cfu/100 mL, and fecal coliforms > 400 cfu/100 mL). Bacteria populations greater than these are common in urban runoff and in urban receiving waters. Symptoms were found to be associated with swimming in areas where bacterial indicator levels were greater than these critical counts. Table 13 shows the heath outcomes associated with swimming in areas having bacterial counts greater that

26
these critical values. The association for enterococcus with bloody diarrhea was strong, and the association of total coliforms with skin rash was moderate, but nearly strong. Table 12. Comparative Health Outcomes for Swimming in Front of Storm Drain Outfalls, Compared to Swimming at least 400 Yards Away (from SMBRP 1996) Health Outcome Relative
Risk Rate Ratio Estimated
Association Estimated No. of Excess Cases per 10,000 Swimmers (rate difference)
Fever 57% 1.57 Moderate 259 Chills 58% 1.58 Moderate 138 Ear discharge 127% 2.27 Moderate 88 Vomiting 61% 1.61 Moderate 115 Coughing with phlegm 59% 1.59 Moderate 175 Any of the above symptoms 44% 1.44 Weak 373 HCGI-2 111% 2.11 Moderate 95 SRD (significant respiratory disease) 66% 1.66 Moderate 303 HCGI-2 or SRD 53% 1.53 Moderate 314
Table 13. Heath Outcomes Associated with Swimming in Areas having High Bacterial Counts (from SMBRP 1996)
Indicator (and critical cutoff count)
Health Outcome Increased Risk
Risk Ratio Estimated Association
Excess Cases per 10,000 Swimmers
E. coli (>320 cfu/100mL)
Earache and nasal congestion
46% 24%
1.46 1.24
Weak Weak
149 211
Enterococcus (>106 cfu/100 mL)
Diarrhea w/blood and HCGI-1
323% 44%
4.23 1.44
Strong Weak
27 130
Total coliform bacteria (>10,000 cfu/100 mL)
Skin rash 200% 3.00 Moderate 165
Fecal coliform bacteria (>400 cfu/100 mL)
Shin rash 88% 1.88 Moderate 74
The ratio of total coliform to fecal coliform was found to be one of the better indicators for predicting health risks when swimming close to the storm drain. When the total coliforms were greater than 1,000 cfu/100 mL, the strongest effects were generally observed when the total to fecal coliform ratio was 2. The risks decreased as the ratio increased. In addition, illnesses were more common on days when enteric viruses were found in the water. The percentage of survey days exceeding the critical bacterial counts were high, especially when closest to the storm drainage, as shown on Table 14. High densities of E. coli, fecal coliforms and enterococcus were observed on more than 25% of the days, however, there was a significant amount of variability in observed counts in the water samples obtained directly in front of the drains. The variability and the frequency of high counts dropped considerable with distance from the storm drains. Upcoast bacteria densities were less than downcoast densities probably because of prevailing near-shore currents.
Table 14. Percentages of Days when Samples Exceeded Critical Levels (from SMBRP 1996)
Bacterial Indicator 0 yards 1 to 100 yards upcoast
1 to 100 yards downcoast
400+ yards upcoast
E. coli (>320cfu/100 mL) 25.0% 3.5% 6.7% 0.6% Total coliforms (>10,000 cfu/100 mL) 8.6 0.4 0.9 0.0 Fecal coliforms (>400 cfu/100 mL) 29.7 3.0 8.6 0.9 Enterococcus (>106 cfu/100 mL) 28.7 6.0 9.6 1.3 Total/Fecal coliform ratio ≤5 (and total coliforms >1,000 cfu/100 mL)
12.0 0.5 3.9 0.4

27
The SMBRP (1996) concluded that less than 2 miles of Santa Monica Bay’s 50 mile coastline had problematic health concerns due to the storm drains flowing into the Bay. They also concluded that the bacterial indicators currently being monitored do help predict risk. In addition, the total to fecal coliform ratio was found to be a useful additional indicator of illness. As an outcome of this study, the Los Angeles County Department of Health Services will post new warning signs advising against swimming near the outfalls (“Warning! Storm drain water may cause illness. No swimming”). These signs will be posted on both sides of all flowing storm drains in Los Angeles County. In addition, county lifeguards will attempt to warn and advise swimmers to stay away from areas directly in front of storm drain outlets, especially in ponded areas. The county is also accelerating their studies on sources of pathogens in stormwater. Proposed New California Recreational Area Bacteria Standards In November of 1997, the State of California proposed new bacterial criteria for fresh and saltwater recreational areas (DHS 1997). These criteria are heavily based on the Santa Monica Bay study described above and recognize the danger that urban runoff presents. They recommend that recreational use of waters within stormwater drains (including manmade conveyances and also natural drains such as creeks and streams), in ponds or pools that form because of stormwater drainage, and in the immediate surf zone into which stormwater drains, should be prohibited at all times. The criteria documents state that:
“a protocol should be developed that sets forth procedures for closing recreational waters and beach areas whenever significant amounts of rainfall results in urban runoff that enters recreational waters and beach areas. Ocean beaches that are subject to urban runoff should be closed for a minimum of 72 hours following significant rain to allow wave action to dissipate microbiological contamination, unless sampling and analysis indicates that earlier reopening is appropriate, or local health agencies have ample data and experience with the location to determine appropriate actions. Other beaches that are subject to significant urban runoff (e.g., via storm drains) should be closed until sampling by and/or experience of local health agencies indicate reopening is appropriate. Bays or other ocean water areas with poor water circulation may require a longer time to recover.” (DHS 1997)
Similar wording was also provided relating to swimming in freshwaters contaminated by urban runoff. Indicator organisms should include total and fecal coliform bacteria, at a minimum. Enterococci can also be added as an indicator. They felt that monitoring for specific pathogens (such as Giardia or Cryptosporidium) is costly and doesn’t appear to be reliable. They could be monitored if done in conjunction with the other required monitoring efforts, especially in response to specific needs. Levels indicating a need for additional attention (they suggested conducting sanitary surveys to identify and correct the sources of contamination) in both salt waters and freshwaters are:
Total coliforms: 1,000 per 100 mL (single sample), or 1,000 per 100 mL, in more than 20 percent of the samples at any sampling station, in any
30-day period [Title 17 California Code of Regulations, Section 7958]
Fecal coliforms: 200 per 100 mL, or 200 per 100 mL, based on the log mean of at least 5 equally spaced samples in a 30-day
period (EPA 1986) In addition, when the local health officer considers enterococcus monitoring for supplemental information, the following levels are also recommended:

28
Enterococcus (salt water): 35 per 100 mL (single sample), or 35 per 100 mL, based on the log mean of at least 5 equally spaced
samples in a 30-day period.
Enterococcus (freshwater): 33 per 100 mL (single sample), or 33 per 100 mL, based on the log mean of at least 5 equally spaced
samples in a 30-day period. Freshwater swimming areas could also be monitored for E. coli to provide additional supplemental information. In that case, the following level indicating a need for more attention is also provided: E. coli: 126 per 100 mL (single sample), or 126 per 100 mL (log mean of samples over a 30-day period (EPA 1986) Salt water beach closure is recommended when sampling indicates any of the following conditions, when confirmed within 24 to 48 hours: Total coliforms: 10,000 per 100 mL (17 California Code of Regulations, Section 7958) Total coliforms: 5,000 per 100 mL, if the coliform index (the ratio of fecal to total coliform counts, times
100) is 20, or more Fecal coliforms: 1,000 per 100 mL When enterococcus monitoring is also used, the following closure level is recommended: Enterococcus: 104 per 100 mL (EPA 1986) Freshwater recreational areas should be closed whenever any of the following conditions are exceeded, when confirmed within 24 to 48 hours: Total coliforms: 10,000 per 100 mL Fecal coliforms: 400 per 100 mL (EPA 1986) When enterococcus or E. coli monitoring is also used, the following closure level is recommended: Enterococcus: 61 per 100 mL (EPA 1986) E. coli: 235 per 100 mL (EPA 1986) Reopening of a closed recreational area is appropriate when two successive samples taken at least 24 hours apart are below the closure levels. If a swimming area is closed due to contamination by urban stormwater runoff, the following wording for warning signs is suggested: “Warning! Closed to swimming. Beach/swimming area is contaminated by stormwater runoff/sewage and may cause illness.” In areas that are chronically contaminated by stormwater, the following wording for permanent signs is suggested: “Warning! Storm drain water may cause illness. No swimming in storm drain water.” Drinking Water Risks and Urban Stormwater The National Research Council conducted an intensive review of the use of waters of impaired quality for groundwater recharge (Andelman, et al. 1994). Included in this book was a review of the use of stormwater to recharge groundwater for eventual use as a drinking water supply. Other potential source waters investigated for recharge included treated municipal wastewater and irrigation return flows. The following is a summary from that book, describing these potential human health risks associated with stormwater.

29
Various chemical and bacteriological health risks associated with stormwater were examined. The major risks were identified as originating from pathogenic organisms, disinfection byproducts for water that have undergone disinfection to reduce the threat from the pathogens, synthetic organic chemicals, and inorganic chemicals. Assessments are therefore needed to identify the potential risks associated with this reuse. These assessments contain four major components: hazard identification, dose-response assessment, exposure assessment, and risk characterization. The NRC committee reviewed available epidemiological studies that had investigated the use of degraded waters for recharge and as eventual drinking water supplies. Table 15, summarized from the NRC report, lists the health effects of known chemicals found in urban stormwater. The health effects shown are not meant to be comprehensive, but are the problems that the drinking water standards are intended to protect against. The EPA carcinogen classifications are as follows: A = sufficient evidence for humans B1 = limited evidence for humans and sufficient evidence in experimental animals B2 = inadequate/limited evidence for humans, sufficient evidence in experimental animals C = limited evidence in experimental animals with no human data D = inadequate or no data E = sufficient evidence for noncarcinogenicity The concentrations presented are summarized from the EPA’s Nationwide Urban Runoff Program (NURP) (EPA 1983) and show the percentage of samples where the toxicant was detected and the range of the detected values. The maximum contaminant level (MCL) is the drinking water standard established by the EPA. Also shown (in parentheses) is the concentration associated with a cancer risk of 1 in a million, the generally recognized negligible risk level. The present background cancer occurrence rate in the U.S. is 25%. This 10-6 risk level, associated with a lifetime exposure to a chemical, will increase the risk of getting cancer from 250,000 in 1 million to 250,001 in 1 million (Andelman, et al. 1994). The reference dose is the estimated daily dose that is likely to be without an appreciable risk of deleterious effects during a lifetime (expressed as mg of ingested chemical per day per kg of body weight). Most of the listed toxicants exceed the MCL limits and the negligible risk levels (highlighted in bold). However, most of the toxicants are associated with particulates and the MCL values are not directly applicable. In addition, drinking of undiluted, untreated stormwater is not likely. Microorganisms of concern in drinking waters may include many different types of pathogens, including bacteria, viruses, and parasites. These are excreted from infected hosts and enter sanitary sewage. Stormwater and urban receiving waters can become contaminated with these pathogens, as noted earlier. Andelman, et al. (1994) reviewed waterborne disease outbreaks in the U.S. from 1971 through 1990. The most common identified causative agents were Giardia, chemical poisoning, and Shigella species. During this period, the causative agents in more than 50% of the outbreaks were not able to be identified. However, reviews of past outbreaks found that the Norwalk virus (causing acute nonbacterial gastroenteritis) was the likely cause of about 40% of the outbreaks from 1976 through 1980 that had no prior identified cause. The difficulty or inability to identify many of the viruses and parasites (such as Cryptosporidium) is the likely reason why they are not listed as a more common cause of illness from drinking contaminated water. Dose-response information is usually determined by exposing volunteers to different doses of the microorganisms of interest. Normally, this data does not include special problems for special at-risk individuals. Table 16 (as reported in the NRC committee report) shows infective dose information for several pathogens. Table 17 shows the probability of infection of ingestion of 100 mL of water for various levels of contamination. The levels of these microorganisms in stormwater can be much greater than the values shown on this table (enterviruses of 100 to 3000 pfu/100 L, for example was reported by Olivieri, et al. 1977). Of course, ingestion of untreated or undiluted stormwater is rare.

30
Table 15 Health Effects of Toxicants Found in Stormwater (Andelman, et al. 1994 and EPA 1983) Chemical Health Effects: Human Health Effects: Animal/In Vitro EPA
Carcinogen classification
Reported frequency of detection (%) and observed concentrations (µg/L) (EPA 1983, NURP)
Max. contaminant level (MCL) µg/L (10-6
cancer risk)
Reference dose (mg/kg/day)
Pesticides: Lindane Morphological changes of
kidney and liver cells C 15 0.007 – 0.1 0.2 0.0003
Chlordane Liver hypertrophy (regional) B2 17 0.01 – 10 0.2 (0.03) 0.00006 Polyaromatic hydrocarbons:
Fluoranthene Nephrapathy; increased liver weight; hematologic alterations; clinical effects (increased SGPT levels)
16 0.3 – 21 - 0.04
Other organics: Pentachlorphenol Liver and kidney pathology,
feto-maternal toxicity B2 19 1 – 115 1 (0.3) 0.03
Inorganics: Antimony Gastrointestinal effects Liver and kidney effects D 13 2.6 – 23 6 0.0004 Arsenic Skin (hyperpigmentation,
keratosis); vascular complications; neurotoxicity; liver injury
Reproductive/developmental effects; chromosomal effects
A 52 1 – 51 50 (0.000002)
0.0003
Beryllium Contact dermatitis; pulmonary effects
Skeletal effects; genotoxicity B2 12 1 – 49 4 (0.008) 0.005
Cadmium Pulmonary and renal tubular effects; skeletal changes associated with effects on calcium metabolism
Reproductive/teratogenic effects; effects on myocardium
D 48 0.1 – 14 5 0.0005
Chromium Renal tubular necrosis Genotoxicity D 58 1 – 190 100 0.005 Cyanide Nausea, confusion, convulsion,
paralysis, coma, cardiac arrhythmia, respiratory stimulation followed by respiratory failure
D 23 2 – 300 200 0.022
Mercury Nervous system effects; kidney effects
Genotoxicity D 10 0.6 – 1.2 2 0.0003
Nickel Contact dermatitis Reproductive effects; genotoxicity
D 43 1 – 182 100 0.005
Selenium Nail changes; hair loss; skin lesions; nervous system effects
Reproductive effects, genotoxicity
11 2 – 77 50 0.005
Zinc Gastrointestinal distress; diarrhea
Poor growth D 94 10 - 2400 - 0.3

31
Table 16. Values Used to Calculate Risks of Infection, Illness, and Mortality from Selected Enteric Microorganisms (Andelman, et al. 1994).
Probability of infection from
exposure to one organism
(per one million)
Ratio of clinical illness to
infection (%)
Mortality rate (%)
Secondary spread (%)
Campylobacter 7,000 Salmonella typhi 380 Shigella 1,000 Vibrio cholerae 7 Coxsackieviruses 5 – 96 0.12 – 0.94 76 Echoviruses 17,000 50 0.27 – 0.29 40 Hepatitis A virus 75 0.6 78 Norwalk virus 0.0001 30 Poliovirus 1 14,900 0.1 – 1 0.9 90 Poliovirus 3 31,000 Rotavirus 310,000 28 – 60 0.01 – 0.12 Giardia lamblia 19,800
Table 17. Probability of Infection from Ingestion of 100 mL of Water Contaminated with Viruses or Protozoa
Levels in ingested water (per 100 L)
Exposure per 100 mL Estimated risk of infection in exposed population
Rotavirus 0.01 pfu 1.0 x 10⁻⁵ 6.2 x 10⁻⁶ 0.13 pfu 1.3 x 10⁻⁴ 6.0 x 10⁻⁵ Echovirus 0.01 pfu 1.0 x 10⁻⁵ 2.0 x 10⁻⁸ 0.13 pfu 1.3 x 10⁻⁴ 2.7 x 10⁻⁷ Giardia 0.49 cysts 4.9 x 10⁻⁴ 9.8 x 10⁻⁶ 0.89 cysts 8.9 x 10⁻⁴ 1.88 x 10⁻⁵ 1.67 cysts 1.77 x 10⁻³ 3.3 x 10⁻⁵ 3.3 cysts 3.3 x 10⁻³ 6.6 x 10⁻⁵ Cryptosporidium 0.75 oocysts 7.5 x 10⁻⁴ 1.5 x 10⁻⁵ 5.35 oocysts 5.35 x 10⁻³ 1.1 x 10⁻⁴
Craun, et al. (1997) conducted evaluations of waterborne disease outbreaks from public water supplies and found that coliform bacteria monitoring is likely adequate to protect against bacterial and viral illness, but not for protozoa associated illness. Coliform bacteria monitoring has been used for many years to assess the microbiological quality of drinking waters. Except for a few strains, coliforms are not considered pathogenic. They are not very specific to fecal contamination, as most species of coliforms are free-living in the environment. Tap water having no coliforms has generally been thought to be free of agents likely to cause waterborne disease. However, Craun, et al. (1997) found that disease outbreaks (especially associated with Giardia or Cryptosporidium) have occurred in water systems that have not violated the maximum contaminant levels for total coliforms. The 1989 Coliform Rule for drinking waters states that systems collecting fewer than 40 samples per month may have no more than one total coliform positive sample (per 100 mL of water) per month, systems collecting more samples must have fewer than 5% of their samples positive for total coliforms. When Craun, et al. (1997) reviewed information from reported waterborne disease outbreaks from 1983 to 1992, they found that coliforms were detected during most of the outbreaks that were caused by bacteria, viruses, and unidentified agents, but they were found only during few of the outbreaks caused by protozoa. As an example, the 1993 Milwaukee Cryptosporidium outbreak (the largest documented waterborne disease outbreak in the U.S., with 400,000 cases of illness reported) occurred even though the MCL for coliforms was not violated. It is known that total coliforms are more susceptible to disinfection during water treatment than some protozoa. They concluded that “microbiological monitoring alone (for total coliforms and other indicator organisms for pathogens) cannot safeguard the public against waterborne disease. Emphasis must

32
also be given to source water protection (watershed control programs, better control of wastewater discharges, and wellhead protection programs) and adequate water treatment and operation. The 1989 coliform rule with its more stringent requirements (periodic sanitary surveys, procedures for E. coli testing, and extra samples to evaluate water quality after positive total coliform results) and other USEPA regulations (e.g. the Surface Water Treatment Rule, and the pending Enhanced Surface Water Treatment Rule) are all important for reducing the risks of waterborne disease.” Other Human Health Risks Associated with Protozoa and other Microorganisms Protozoa became an important public issue with the 1993 Cryptosporidium-caused disease outbreak in Milwaukee when about 400,000 people become ill from drinking contaminated water. Mac Kenzie, et al. (1994) prepared an overview of the outbreak, describing the investigation on the causes of the illness and the number of people affected. They point out that Cryptosporidium-caused disease in humans was first documented in 1976, but had received little attention and no routine monitoring. Cryptosporidium now is being monitored routinely at many areas and is the subject of much research concerning its sources and pathways. At the time of the Milwaukee outbreak, both of the city’s water treatment plants (using water from Lake Michigan) were operating within acceptable limits, based on required monitoring. However, at one of the plants (which delivered water to most of the infected people), the treated water experienced a large increase in turbidity (from about 0.3 NTU to about 1.5 NTU) at the time of the outbreak that was not being well monitored (the continuous monitoring equipment was not functioning, and values were only obtained every 8 hours). More than half of the residents receiving water from this plant became ill. The plant had recently changed its coagulant from polyaluminum chloride to alum and equipment to assist in determining the correct chemical dosages was not being used. The finished water had apparently relatively high levels of cryptosporidium because some individuals became ill after only drinking less than 1 L of water. Cryptosporidium oocysts have often been found in untreated surface waters, and it was thought that Cryptosporidium oocysts entered the water treatment supply before the increase in turbidity was apparent. Mac Kenzie, et al. (1994) point out that monitoring in the United Kingdom has uncovered sudden, irregular, community-wide increases in cryptosporidiosis that were likely caused by waterborne transmission. They also stated that the source of the Cryptosporidium oocysts was speculative, but could have included cattle feces contamination in the Milwaukee and Menomonee Rivers, slaughterhouse wastes, and human sewage. The rivers were also swelled by high spring rains and snowmelt runoff that may have aided the transport of upstream Cryptosporidium oocysts into the lake near the water intakes. The Journal of the American Water Works Association has published numerous articles on protozoa contamination of drinking water supplies. Crockett and Haas (1997) describe a watershed investigation to identify sources of Giardia and Cryptosporidium in the Philadelphia watershed. They describe the difficulties associated with monitoring Cryptosporidium and Giardia in surface waters because of low analytical recoveries and the cost of analyses. Large variations in observed protozoa concentrations made it difficult to identify major sources during the preliminary stages of their investigations. They do expect that wastewater treatment plant discharges are a major local source, although animals (especially calves and lambs) are likely significant contributors. Combined sewer overflows had Giardia levels similar to raw sewage, but the CSOs were much less than the raw sewage for Cryptosporidium. LeChevallier, et al. (1997) investigated Giardia and Cryptosporidium in open reservoirs storing finished drinking water. This gave them an opportunity to observe small increases in oocyst concentrations associated from nonpoint sources of contamination from the highly controlled surrounding area. They observed significantly larger oocyst concentrations at the effluent (median values of 6.0 Giardia/100 L and 14 Cryptosporidium/100 L) in the reservoirs than in the influents (median values of 1.6 Giardia/100 L and 1.0 Cryptosporidium/100 L). No human wastes could influence any of the tested reservoirs and the increases were therefore likely caused by wastes from indigenous animals or birds, either directly contaminating the water, or through runoff from the adjacent wooded areas. A Management Training Audioconference Seminar on Cryptosporidium and Water (MTA 1997) was broadcast in May of 1997 to familiarize state and local agencies about possible Cryptosporidium problems that may be evident after the EPA’s Information Collection Rule begins in July of 1997. This regulation will require all communities serving more than 100,000 people to monitor their source water for Cryptosporidium oocysts. If the source water has more than 10 Cryptosporidium oocysts per liter, then the finished water must also be monitored. It is likely that many source waters will be found to be affected by cryptosporidium. The reviewed one study that found the
33
percentage of positive samples of Cryptosporidium in lakes, rivers, and springs was about 50 to 60% and about 5% in wells. In contrast, the percentage of samples testing positive for Giardia was about 10 to 20% in lakes and rivers, and very low in springs and wells. Special human health concerns have also been recently expressed about Pfiesteria piscicida, a marine dinoflagellate that apparently is associated with coastal eutrophication caused by runoff nutrients (Maguire and Walker 1997). This organism has gathered much attention in the popular press, usually called the “cell from hell” (Zimmerman 1998). It has been implicated as causing symptoms of nausea, fatigue, memory loss, and skin infections in south Atlantic coastal bay watermen. Pfiesteria and Pfiesteria-like organisms have also been implicated as the primary cause of many major fish kills and fish disease events in Virginia, Maryland, North Carolina, and Delaware. In August of 1997, hundreds of dead and dying fish were found in the Pocomoke River, near Shelltown, Maryland, in the Chesapeake Bay, prompting the closure of a portion of the river. Subsequent fish kills and confirmed occurrences of Pfiesteria led to further closures of the Manokin and Chicamacomico Rivers. The Maryland Department of Health and Mental Hygiene also presented preliminary evidence that adverse public health effects could results from exposure to the toxins released by Pfiesteria and Pfiesteria-like organisms. The increasing numbers of fish kills of Atlantic menhaden (an oily, non-game fish) motivated Maryland’s governor to appoint a Citizens Pfiesteria Action Commission. The Commission conveyed a forum of noted scientists to examine the existing information on Pfiesteria. The results of the forum were adopted by the Commission and included in its final report (available on the Maryland Department of Natural Resources’ website: http://quantum.gacc.com/dnr/Hot/contents.html). Pfiesteria has a complex life cycle, including at lease 24 flagellated, amoeboid, and encysted stages. Only a few of these stages appears to be toxic, but their complex nature makes them difficult to identify by nonexperts (Maguire and Walker 1997). Pfiesteria spends much of its life span in a nontoxic predatory form, feeding on bacteria and algae, or as encysted dormant cells in muddy sediment. Large schools of oily fish (such as the Atlantic menhaden) trigger the encysted cells to emerge and excrete toxins. These toxins make the fish lethargic, so they remain in the area where the toxins attack the fish skin, causing open sores to develop. The Pfiesteria then feed on the sloughing fish tissue. Unfortunately, people working in the water during these toxin releases may also be affected (Zimmerman 1998). Researchers suggest that excessive nutrients (causing eutrophication) increase the algae and other organic matter that the Pfiesteria and Atlantic menhaden use for food. The increased concentrations of Pfiesteria above natural background levels increase the likelihood of toxic problems. Maguire and Walker (1997) state that other factors apparently involved include stream hydraulics, water temperature, and salinity. They feel that Pfiesteria is only one example of the increasing threats affecting coastal ecosystems that are experiencing increased nutrient levels. Most of the resulting algal blooms only present nuisance conditions, but a small number can result in human health problems (mostly as shellfish poisonings). The increased nutrient discharges are mostly associated with agricultural operations, especially animal wastes from large poultry and swine operations. In the Pocomoke River watershed, the Maryland Department of Natural Resources estimates that about 80% of the phosphorus and 75% of the nitrogen load is from agricultural sources. Urban runoff may also be a causative factor of eutrophication in coastal communities, especially those having small enclosed coastal lagoons or embayments, or in rapidly growing urban areas. Zimmerman (1998) points out that the Chesapeake Bay area is one of the country’s most rapidly growing areas, with the population expected to increase by 12 percent by the year 2010. Microorganisms Observed In Urban Runoff There have been many studies in the United States and Canada that have examined the bacteria quality of urban runoff. Many of these studies also examined significant factors affecting the bacteria concentrations. Lager, et al. (1977) summarized the results of a study conducted in Tulsa, Oklahoma, which looked at the precipitation and land use factors that affected pollutant concentrations in urban stormwater. The only two factors that had a significant effect on fecal coliform concentrations were the interevent period and the intensity of the rain event. The amount of rain and the street density also affected the total coliform concentrations. Seidler (1979) in a semi-rural watershed in Oregon also found that bacteria concentrations during storm events were more related to the length of the dry period before the storm than the season of the year or the actual amount of precipitation. However, Qureshi and Dutka (1979) found little relationship between intensity and the amount of rain versus the presence of

34
indicator and pathogenic microorganisms in southern Ontario stormwater runoff. Olivieri, et al. (1977a) found that the density of fecal coliforms in Baltimore, Maryland, urban runoff appeared to be independent of the instantaneous flows and the length of time since the last rainfall. Gupta, et al. (1981) also found that flow did not have a significant effect on the instantaneous bacteria concentrations. In contrast to these studies, another series of studies found some relationships between bacteria densities and the urban runoff flows. The concentrations of bacteria were normally high during periods of high flows and lower during other times in these studies (Evans and Owens 1972; Casserly and Davis 1979; Pontius 1977; Davis 1979; and Siedler 1979). The concentrations of bacteria in urban stormwater have been found to vary during storms, sometimes as a function of various observed factors and sometimes independent of observed factors. The important factors varied from site to site. Most of these studies consisted of relatively few completely monitored storms but many samples were usually included within the few storms monitored. The variable nature of bacteria deposition, accumulation, transport, and die-off makes it very difficult to identify consistent influencing factors. The most reasonable approach in characterizing urban runoff bacteria conditions appears to be to study as many storms as possible in the watersheds of concern. Statistical analyses can then be used to help identify probable concentrations and yields. The Nationwide Urban Runoff Program (NURP) projects (EPA 1983) conducted at many locations throughout the United States obtained urban runoff bacteria conditions for a variety of test sites. Seventy test catchments in the NURP program monitored urban runoff bacteria quality. These test catchments ranged in size from less than one acre to more than 10,000 acres. Most of these catchments were of residential land use, but almost all land uses in urban areas were included (commercial, industrial, open space, etc.). Table 18 summarizes the total coliform, fecal coliform, and fecal strep. bacteria concentrations available for these catchments. More than 1,600 fecal coliform urban runoff observations are available from the NURP program, with an overall observed range of ten to 270,000 organisms/100 mL. The average of the site means was about 20,000 fecal coliform organisms/100 mL. These data were for samples collected from 1978 to 1981, with most of the data from samples collected in 1980. Almost 220 NURP monitoring stations had reported information to the STORET computer files by October, 1981, and almost one-half million analyses had been made. Table 19 summarizes the results from about 25 other reported studies that monitored coliform bacteria in urban runoff. These represent many stations throughout the United States with some locations in Canada and Europe. The overall NURP reported average fecal coliform concentration was about 2.2 x 10⁴ organisms/100 mL, while the average from the other studies was about 3 x 10⁴ fecal coliform organism/100 mL. These average concentration values are all surprisingly close. However, the overall observed range is quite high, ranging from not detecting any fecal coliforms to as high as 10 x 107 organisms/100 mL. As a comparison, Table 20 presents some typical combined sewer overflow bacteria concentrations, as reported in the literature. The fecal coliform concentrations in combined sewer overflows are seen to range from about 2 x 10⁴ to a high of about 2 x 10⁷ fecal coliform organisms/100 mL. The separate stormwater fecal coliform bacteria observations are at the low end of this reported range for CSOs. Typical combined sewers can therefore have 100 to 1,000 times the fecal coliform concentrations as separate stormwater. A study by Burm and Vaughan (1966) in Detroit and Ann Arbor, Michigan, found that the total coliform densities in the combined sewers were always about three to 15 times greater than those found in urban runoff. The fecal coliform densities in the combined sewers were about 90 times the stormwater values. They concluded that the bacteria densities for the combined sewer overflows were at least ten times greater than those reported for the stormwaters alone. Table 21 summarizes the pathogenic bacteria biotypes that have been observed in the Rideau River near Ottawa, Ontario (Pitt 1983). The occurrence of Salmonella biotypes is low and their reported density is less than one organism/100mL. Pseudomonas aeruginosa are frequently encountered at densities greater than ten organisms/100mL, but only after rains. As a comparison, Tables 22 and 23 show typical pathogenic bacteria biotype concentrations found in raw sanitary wastewaters than in urban runoff. Table 24 summarizes the occurrence of various pathogenic types found in urban stormwaters at various sites. The observed ranges of concentrations and percent isolations of these biotypes vary significantly from site to site and at the same location for different times.

35
Table 18

36
Table 18 (cont)

37
Table 18 (cont)

38
Table 18 (cont)

39
Table 19

40
Table 19 (cont)

41
Table 19 (cont)

42
Table 20. Selected Combined Sewer Overflow Bacteria Data from the Literature (organisms/100 mL)
City (reference) Total Coliforms Fecal Coliforms Fecal Strep. Ottawa (Rideau R. Stormwater Management Study 1981)
na 5x10⁵ to 9x10⁶ na
Toronto (Ontario Ministry of the Environment 1983)
107 106 na
Detroit (Geldreich 1976) na 106 to 107 105 Selected data (Field and Struzeski 1972)
2x10⁴ to 9x10⁷ 2x10⁴ to 2x10⁷ 2x10⁴ to 2x10⁶
Table 21. Pathogenic Organisms Observed in the Rideau River (Environment Canada 1980)
Organism Occurrence Density Salmonella biotypes S. typhimurium S. infantis S. agona S. haardt S. saint paul S. nienstedten
Low1 <0.2 to 0.8/100 mL
Pseudomonas aeruginosa frequent >10/100 mL only after rains Edwardsiella tarda Rare -- Candida albicans (a yeast) 1 to 7% positive 1 to 2 cfu/100 mL
1 very seldom found in Ottawa urban runoff Table 22. Pathogenic Bacteria Types found in Raw Sanitary Wastewater in Baltimore, MD (Olivieri, et al. 1977b)
Staphyloccus aureus 42 to 4,600/100 mL, mean of 820/100 mL Pseudomonas aeruginosa Average of 220,000/100 mL
Table 23. Streptococci Biotypes found in Sanitary Wastewater (% Occurrence) (Geldreich and Kenner 1969)
City Entercocci S. bovis S. equinus
Aytpical S. faecalis
S. faecalis liquifaciens
Preston, ID 80 0 0 21 Fargo, ND 100 0 0 0 Moorehead, MN 90 10 0 0 Cincinnati, OH 72 3 2 24 Lawrence, MA 84 4 0 12 Monroe, MI 79 1 4 16 Denver, CO 86 11 3 0
However, it is seen that many of the potentially pathogenic bacteria biotypes can be present in urban stormwater runoff. Table 25 lists the pathogenic bacteria biotypes that affect mammals and birds and that can be transmitted by contaminated water. Many of these biotypes, of course, are rare but this table does demonstrate the wide range of possible diseases that can be transmitted by polluted waters, including urban runoff. The Contamination of Groundwater by Stormwater Pathogenic Microorganisms Pitt, et al. (1996) conducted an extensive review of the potential contamination of groundwater by stormwater infiltration. Viruses have been detected in groundwater where stormwater recharge basins were located short distances above the aquifer. Enteric viruses are more resistant to environmental factors than enteric bacteria and they exhibit longer survival times in natural waters. They can occur in potable and marine waters in the absence of fecal coliforms. Enteroviruses are also more resistant to commonly used disinfectants than are indicator bacteria, and can occur in groundwater in the absence of indicator bacteria.

43
Table 24

44
Table 25

45
The factors that affect the survival of enteric bacteria and viruses in the soil include pH, antagonism from soil microflora, moisture content, temperature, sunlight, and organic matter. The two most important attributes of viruses that permit their long-term survival in the environment are their structure and very small size. These characteristics permit virus occlusion and protection within colloid-size particles. Viral adsorption is promoted by increasing cation concentration, decreasing pH and decreasing soluble organics. Since the movement of viruses through soil to groundwater occurs in the liquid phase and involves water movement and associated suspended virus particles, the distribution of viruses between the adsorbed and liquid phases determines the viral mass available for movement. Once the virus reaches the groundwater, it can travel laterally through the aquifer until it is either adsorbed or inactivated.
The major bacterial removal mechanisms in soil are straining at the soil surface and at intergrain contacts, sedimentation, sorption by soil particles, and inactivation. Because of their larger size than for viruses, most bacteria are therefore retained near the soil surface due to this straining effect. In general, enteric bacteria survive in soil between two and three months, although survival times up to five years have been documented.
Enteroviruses likely have a high groundwater contamination potential for all stormwater percolation practices and subsurface infiltration/injection practices, depending on their presence in the stormwater (likely if contaminated with sanitary sewage). Other pathogens, including Shigella, Pseudomonas aeruginosa, and various protozoa, would also have high groundwater contamination potentials if subsurface infiltration/injection practices are used without disinfection. If disinfection (especially by chlorine or ozone) is used, then disinfection byproducts (such as trihalomethanes or ozonated bromides) would have high groundwater contamination potentials. Pathogens are most likely associated with sanitary sewage contamination of storm drainage systems, but several bacterial pathogens are commonly found in surface runoff in residential areas.
Sources of Bacteria and Pathogens found in Urban Runoff Several investigations have studied potential sources of bacteria and selected pathogens that are found in urban runoff. Some of these studies have examined surface sheet flows during rain induced and snowmelt induced runoff that would not likely be contaminated by human fecal matter. More commonly, many studies have examined runoff sampled at outfalls where the runoff may have been contaminated by inappropriate discharges to the storm drainage. The following section summarizes some of the observations from these studies. Tests in Toronto examined sources of urban stormwater bacteria (Pitt and McLean 1986), as shown in Table 26. High bacteria populations were found in sidewalk, road, and some bare ground sheetflow samples (collected from locations where dogs would most likely be “walked”). Some of the Toronto sheetflow contributions were not sufficient to explain the concentrations of some constituents observed in runoff at the outfall. Most of the fecal coliform populations observed in sheetflows were significantly lower than those observed at the outfall, especially during snowmelt. It is expected that some sanitary sewage was entering the storm drainage system. Runoff from paved parking areas, streets, and landscaped areas generally had the highest observed bacteria densities, while runoff from roofs and freeways had low densities.
The Regional Municipality of Ottawa-Carleton (1972) studies the importance of rooftop, street surface, and field runoff in contributing bacteria contaminants to surface waters in the Ottawa area. Gore and Storrie/Proctor and Redfern (1981c) also investigated various urban bacteria sources affecting the Rideau River in Ottawa. They examined dry weather continuous coliform sources, the resuspension of contaminated river bottom sediments, exfiltration from sanitary sewers, and bird feces. These sources were all considered in an attempt to explain the relatively high dry weather coliform bacteria concentrations found in the river. They concluded, however, that stormwater runoff is the most probable source for the wet weather and continuing dry weather bacteria Rideau River concentrations. However, the slow travel time of the river water usually does not allow the river to recover completely from one rainstorm before another begins.

46
Table 26. Source Area Bacteria Sheetflow Quality Summary (means)
Pollutant and
Land Use
Roofs
Paved
Parking
Paved
Storage
Unpaved Parking/ Storage
Paved
Driveways
Unpaved
Driveways
Dirt
Walks
Paved
Sidewalks
Streets
Land-
scaped
Un-
developed
Freeway Paved
Lane and Shoulders
Fecal Coliforms (#/100 mL) Residential: Commercial Industrial:
85 (3) <2 (4)
1400 (5)
9 (4)
1600 (5)
250,000 (5)
2900 (3) 350 (4) 210 (1) 480 (7)
23,000 (8)
8660 (8)
100 (5)
9200 (5)
18,000 (5)
600 (5)
66,000 (5)
300,000 (5)
11,000 (5)
55,000 (5)
920 (4) 6,900 (5)
100,000 (5)
3300 (5)
5400 (3) 49 (4)
1500 (9)
Fecal Strep (#/100 mL) Residential: Commercial: Industrial:
170 (3) 920 (4)
2200 (5)
17 (3)
690 (5)
190,000 (5)
11,900 (3) >2400 (4)
770 (1) 1120 (7)
62,000 (8)
7300 (5)
<100 (5)
2070 (5)
8100 (5)
1900 (5)
36,000 (5)
21,000 (5)
1800 (5)
3600 (5)
>2400 (4) 7300 (5)
45,000 (5)
43,000 (5)
16,500 (3) 920 (4)
2200 (9)
Pseudo, Aerug (#/100 mL) Residential: Industrial:
30,000 (5) 50 (5)
1900 (5)
5800 (5)
100 (5)
5850 (5)
14,000 (5)
600 (5)
14,300 (5)
100 (5)
600 (5)
3600 (5)
570 (5)
6200 (5)
2100 (5)
References: (1) Bannerman, et al. 1983 (Milwaukee, WI) (NURP) (3) Pitt 1983 (Ottawa) (4) Pitt and Bozeman 1982 (San Jose) (5) Pitt and McLean 1986 (Toronto) (7) STORET Site #590866-2954309 (Shop-Save-Durham, NH) (NURP) (8) STORET Site #596296-2954843 (Huntington-Long Island, NY) (NURP) (9) Kobriger, et al. 1981 and Gupta, et al. 1977

47
The Regional Municipality of Ottawa-Carleton (1972) summarized the early Ottawa activities in correcting stormwater and sanitary sewage cross-connections. Since that time, many combined sewer overflows have also been eliminated from the Rideau River. Loijens (1981) stated that as a result of sewer separation activities, only one overflow currently remained active (Clegg Street). During river surveys in 1978 and 1979 in the vicinity of this outfall, increased bacteria levels were not found. Gore and Storrie/Proctor and Redfern (1981c) stated that there was no evidence that combined sewer overflows were causing the elevated fecal coliform bacteria levels in the river. Environment Canada, (1980) however, stated that high, dry weather bacteria density levels, especially when considering the fecal coliform to fecal strep. ratio, constitutes presumptive evidence of low volume sporadic inputs of sanitary sewage from diverse sources into the downstream Rideau River sectors. The case study presented later examines some of these issues.
Street surfaces have been identified as potential major sources of urban runoff bacteria in many locations. Pitt and Bozeman (1982) found that parking lots, street surfaces, and sidewalks were the major contributors of indicator bacteria in the Coyote Creek watershed in California. Gupta, et al. (1981) found high concentrations of fecal coliforms at a highway runoff site in Milwaukee. This site was entirely impervious and located on an elevated bridge deck. The only likely sources of fecal coliforms at this site were bird droppings and possibly feces debris falling from livestock trucks or other vehicles.
Several studies have found that the bacteria in stormwater runoff in residential and light commercial areas were from predominantly nonhuman origins (Qureshi and Dutka 1979). They found that there may be an initial flush of animal feces when runoff first develops. However, the most important bacteria source for runoff is the feces bacteria that have been distributed generally in the soils and on the surfaces of the drainage area. Geldreich and Kenner (1969) stated that the fecal coliforms in stormwater are from dogs, cats, and rodents in city areas, and from farm animals and wildlife in rural areas. The most important source, however, may be feces bacteria that are distributed in the soil and not the fresh feces washing off the impervious surfaces.
Some studies have investigated vegetation sources of coliform bacteria. For example, Geldreich (1965) found that the washoff of bacteria from vegetation does not contribute significant bacteria to the runoff. They also found that most of the bacteria on vegetation is of insect origin.
Geldreich, et al (1980) found that recreation activities in water bodies also increase the fecal coliform and fecal strep. concentrations. These organisms of intestinal origin will concentrate in areas near the shore or in areas of stratification.
Fennell, et al. (1974) found that open dumps containing domestic refuse can be a reservoir of Salmonella bacteria that can be spread to nearby water bodies by foraging animals and birds.
When a drainage basin has much of its surface paved, the urban runoff bacteria concentrations can be expected to peak near the beginning of the rainfall event and then decrease as the event continues. Initial high levels of bacteria may be associated with direct flushing of feces and small feces particles from paved surfaces. These feces are from dogs defecating on parking lots and street areas and from birds roosting on rooftops. When a drainage area has a lot of landscaped areas or open land, relatively high bacteria concentrations in the urban runoff may occur throughout the rain event. Bacteria Survival in Stormwater The survival of urban runoff bacteria in receiving waters is an important issue. Very little direct consumption or contact of urban runoff usually occurs. However, when the runoff is discharged into a larger receiving water, consumption or contact may occur shortly after the rain event has ended. The Rideau River Stormwater Management Study (Ottawa, Ontario) examined the die-off of fecal coliform bacteria in the Rideau River (Droste and Gupgupoglu 1982; Environment Canada 1980; Gore and Storrie/Proctor and Redfern 1981b and 1981c). They found that the 90 percent die-off for Rideau River fecal coliforms was about two days. Because of the long travel time on the Rideau River and short interevent times of rains in the area, the effects of bacteria discharges from stormwater from one storm can affect the river concentrations during the next storm. The persistence of fecal

48
coliforms and the slow river velocities cause downstream beach bacteria concentrations to seldom, if ever, regain true low background bacteria concentration levels. Environment Canada (1980) reported significant increase in coliform concentrations in recently excreted moist feces. Seidler (1979) stated that the sources of Salmonella bacteria can determine their survival. This is probably true for most types of bacteria because the different bacteria sources usually determine the specific bacteria biotypes found in the feces. Different bacteria types can have quite different die-off rates. Factors affecting urban runoff bacteria survival in stormwater have been found to be quite variable and site specific. Geldreich, et al. (1968) found that no significant differences in survival of urban runoff bacteria could be related to the chemical constituents present. Water temperature, however, did have a strong influence on urban runoff bacteria survival. Geldreich, et al. (1980) found in a Kentucky study that when copper sulfate was applied as an algicide in a reservoir, sharp declines in fecal coliform densities occurred. The standard plate count densities, however, sharply increased. They found that the survival of urban runoff bacteria was longer near the bottom of the reservoir than in shallower waters. They also found that reduced dissolved oxygen concentrations near the sediments was not detrimental to bacteria survival. Faust and Goff (1978) found that high clay concentrations in the Rhode River in the Chesapeake Bay area extended the survival of fecal coliform bacteria. Many studies reported the effects of temperature on urban runoff bacteria die-off. Geldreich, et al. (1968), in a series of lab tests, found that stormwater bacteria persisted at higher concentrations under winter water temperature conditions (10oC) than they did for summer water temperature conditions (20oC). There were some differences in survival for the various specific types of stormwater bacteria, but this trend seemed typical. Van Donzel, et al. (1967) found that fecal strep. did not survive as long as fecal coliform bacteria during the summer months, while in the autumn there was little difference in their survival times. In the winter and spring, the fecal strep. survived much longer than the fecal coliforms. Seidler (1979) found that Salmonella survived for longer periods of time in colder water temperatures. McSwain (1977) reported that coliform bacteria were able to multiply in bottom sediments at a rate regulated by stream temperature. They reported another study that found significant enteric bacteria concentration increases at temperatures above 16oC, but that little or no growth occurred below 10oC. The conditions affecting bacteria survival in water appear to be site and bacteria specific. Many of the differences are probably associated with the specific bacteria biotype present and with the water temperature. Chemical constituent concentrations do not appear to be a factor, except when they are present at very low concentrations. Table 27 summarizes reported 90 day die-off rates for different stormwater bacteria types. Fecal coliform die-off values varied from less than one day to about 13 days, but can be considered quite fast. Fecal strep. die-off values, however, were longer than the fecal coliform die-off rates. Some of the Streptococcus bacteria types had long survival rates, while others had short survival rates. The forms likely to be associated with agricultural activities (S. bovis and S. equinus) all are shown to have much shorter survival times than more common urban Streptococcus types (S. faecalis). Survival of Bacteria in Soil Because of the importance of soil bacteria as a source of urban runoff bacteria, their survival in the soil after deposition is important. If an area has long intervent times between rain events, soil bacteria survival would have to be quite long in order for the soil to be a significant urban runoff bacteria source. However, in areas having frequent rains, soil bacteria survival is less important (assuming that it is greater than the interevent period). Many site conditions have been reported to influence soil bacteria survival. Van Donsel, et al. (1967) found that sunlight, temperatures, rainfall, soil moisture, pH, organic matter, and the presence of other microorganisms all affect the survival of total coliforms, fecal coliforms, and fecal strep. soil bacteria. They also reported that feces bacteria deposited on dry soils are relatively immobilized and subject to the specific site conditions. After-growth of soil bacteria (increasing populations without new deposition) may account for some of the seasonal variations in runoff bacteria counts. If the soil has not been recently contaminated, the runoff would have an immediate supply of microorganisms from the soil. Contamination of the receiving waters would be out of proportion to the true sanitary history of the area. They also stated that non-fecal coliforms reappeared after fecal organisms declined. They were also present in much higher concentrations after fecal bacteria die-off than before the soil was contaminated.

49
Table 27. Survival of Stormwater Bacteria
Bacteria type Location and conditions Days survival before 90%
dieoff
Reference
Fecal Coliforms Rideau River – summer 2 Droste and Gupgupogula 1982 Cincinnati – stormwater at 10oC 10 Geldreich, et al. 1968 Cincinnati – stormwater at 20oC 2 Geldreich, et al. 1968 Oakland, CA – bird feces into urban lake Rapid Pitt and Bozeman 1979 Stormwater – summer 3 Van Donsel, et al. 1967 Stormwater – autumn 13 Van Donsel, et al. 1967 Fecal Strep. Oakland, CA – bird feces into urban lake >30 Pitt and Bozeman 1979 Stormwater – summer 3 Van Donsel, et al. 1967 Stormwater – autumn 20 Van Donsel, et al. 1967 Streptococcus faecalis Cincinnati – stormwater >14 Geldreich, et al. 1968 S. faecalis var. liquifaciens Cincinnati – stormwater at 10oC >14 Geldreich, et al. 1968 Cincinnati – stormwater at 20oC 6 Geldreich, et al. 1968 S. bovis Cincinnati – stormwater at 10oC <1 Geldreich, et al. 1968 Cincinnati – stormwater at 20oC 1 Geldreich, et al. 1968 S. equinus Cincinnati – stormwater <1 Geldreich and Kenner 1969 Salmonella Rural Oregon Creek >6 Seidler 1979 S. typhirmrium Cincinnati – stormwater at 10oC 7 Geldreich, et al. 1968 Cincinnati – stormwater at 20oC 2 Geldreich, et al. 1968 Shigella flexneri Baltimore – stormwater >8 Field, et al. 1976 Enterbactor aerogenes Cincinnati – stormwater at 10oC 5 Geldreich, et al. 1968 Cincinnati – stormwater at 20oC 4 Geldreich, et al. 1968
Both after-growth and decline of bacteria in soils have been reported. Soil coliforms exhibit after-growth following rainstorms and exhibit rapid declines during freezing weather. If very warm weather follows a rain, a very large increase in soil coliform bacteria was noted, while the increase was much less if cool weather followed a rain. They also found declining bacteria soil populations if the soil was dry. Alternate freezing and thawing at exposed winter sites caused significant morality of soil coliform bacteria. Evans and Owens (1972) reported that E.Coli and Enterococci showed 90 percent reductions after about two or three months in soils. Van Donzel, et al. (1967) reported prolonged persistence of other bacteria types. Various strains of Salmonella were found to exist for long periods of time (nine months for S typhimurium). It is not uncommon for soil bacteria to survive for up to 200 days after inoculation. Fecal Coliform to Fecal Strep. Bacteria Ratios Geldreich (1965) found that the ratio of fecal coliform to fecal strep. bacteria concentrations may be indicative of the probable fecal source. In fresh human fecal material and domestic wastes, he found that the fecal coliform densities were more than four times the fecal strep. densities. However, this ratio for livestock, poultry, dogs, cats, and rodents was found to be less than 0.6. These ratios must be applied carefully, because of the effects of travel time and various chemical changes (especially pH) on the die-off rates of the component bacteria. As a generality, he stated that fecal coliform to fecal strep. ratios greater than four indicate that the bacteria pollution is from domestic wastes, which are composed mostly of human fecal material, laundry wastes, and food refuse. If the ratio is less than 0.6, the bacteria is probably from livestock or poultry in agricultural areas or from stormwater runoff in urban areas. He found that agricultural and stormwater runoff can be differentiated by studying the types of fecal strep. bacteria found in the water samples. Geldreich and Kenner (1969) further stressed the importance of carefully using this ratio. They stressed that samples must be taken at the wastewater outfalls. At these locations, domestic waste, meat packing wastes, stormwater discharges, and feedlot drainage contain large numbers of fecal organisms recently discharged from warm blooded animals. Once these organisms are diffused into the receiving stream, however, water temperature, organic nutrients, toxic metals, and adverse pH values may alter the relationship between the indicator organisms. This ratio should only be applied within 24 hours following the discharge of the bacteria.
Feachem (1975) examined how these ratios could be used with bacteria observations taken over a period of time. Because the fecal coliform and fecal strep. bacteria die-off rates are not the same, the ratio gradually changes with

50
time. He found that bacteria is predominantly from human sources if the FC/FS ratios are initially high (greater than four) and then decrease with time. Non-human bacteria sources would result in initially low fecal coliform to fecal strep. ratios (less than 0.7) which then rise with time.
Table 28 summarizes the observed fecal coliform to fecal strep. bacteria population ratios in the Rideau River study area. These ratios are separated into source area sheetflow samples, Rideau River water samples and water samples collected at the swimming beaches. The source area sheetflow samples contain the most recent pollution, while the river segment and beach samples contain “older” bacteria. The initial source area samples all have ratios of less than 0.7. However, the river averages range from 0.5 to 1.2 and the beach samples (which may be “older” than the river samples) range from 1.7 to 2.8. These ratios are seen to start with values less than 0.7 and increase with time. Based on Feachem’s (1975) work, this would indicate that the major bacteria sources in the Rideau River are from non-human sources. This substantiates the previous conclusions as presented in the Phase 1 Rideau River Stormwater Management Report. Periodic high bacteria ratios in the river and at the beaches could be caused by the greater die-off ratio of fecal strep. as compared to fecal coliform. The observed periodic high Rideau River FC/FS ratios (which can be greater than four) may therefore be from old, non-human fecal discharges and not from fresh human fecal discharges. Table 28. Fecal Coliform to Fecal Strep. Bacteria Population Ratios in Study Area (Pitt 1983)
Source Areas FC/FS ratio Rooftop runoff 0.5 Vacant land sheetflow 0.3 Parking lot sheetflow 0.2 Gutter flows 0.2 Average of source area values 0.3 Rideau River Segment A 1.2 B 0.6 C 0.5 D 0.5 E 1.0 Average of river segment values 0.7 River Swimming Beaches Strathcona 2.8 Brantwood 2.3 Brighton 2.1 Mooney’s Bay 1.7 Average of swimming beach values 2.2
Water Body Sediment Bacteria Matson, et al. (1978) studied the effects of river and lake sediments as a source of bacteria to the water column in Connecticut. They found that resuspended sediments in shallow waters can elevate the water column bacteria concentrations significantly. They stated that the physical resuspension of shallow water sediments is increased by elevated river discharges, wind induced turbulence, dredging, motorboats, swimming, walking, and wading and normal activities of aquatic microorganisms. The magnitude of sediment resuspension varies with the intensity of the mechanisms involved, and the water depth to the sediment. They stated that during stable river flows, the water bacteria populations are relatively constant, but during periods of high flows, sediment organisms can be scoured from the benthic surfaces and mixed into the water column. After peak discharges, water borne microorganisms resettle downstream, which increases those sediment bacteria populations. Geldreich, et al. (1980) also studied bacteria interactions between sediment and water. They found that the sediment-water interface of a water body is an attractive habitat for a variety of different bacteria involved in different biochemical processes. Shallow bottom sediments attract a variable bacteria population because of the physical and chemical requirements that can be satisfied there, in contrast to the more limited conditions available in the water or buried in the sediments.
51
Davis (1979) stated that bacteria contamination of waterways during and following storm events is a function of the stream sediment bacteria concentrations, the concentrations of bacteria in soils adjacent to the stream (and source areas in an urban watershed), and the stream velocities. Davis further stated that stream sediments can contain greater densities of coliform bacteria on a number per unit weight or volume basis than the water body itself; the concentrations of bacteria in the top two inches of mud can be 100 to 1,000 times greater than the concentrations of the bacteria in the water. He reported fecal coliform sediment concentrations up to 100 organisms per gram of sediment and that the suspended sediments can be a major source of bacteria contamination. Geldreich, et al. (1980) stated that sediment bacteria concentrations can be as high as 3,000 to 15,000 organisms per square meter of particulate surface. Pitt and Bozeman (1979), in a study of an urban lake in Oakland, California, found fecal coliform sediment concentrations that ranged from one to 35,000 organisms per gram and averaged about 1,000. McSwain (1977) found that in a rural study in North Carolina, total and fecal coliform concentration increases were more related to bottom sediment disturbances than to stream bank flushing. Soil Bacteria Sources Van Donsel, et al. (1967) stated that soil bacteria pollution may occur from direct defecation by livestock, pets, and wild animals, by malfunctioning or overflowing septic tank systems or by flooding of sewerage systems. Much of the total coliform indicator bacteria organisms in urban areas, however, are not from these sources. Geldreich, et al. (1968) found that in a Cincinnati urban runoff study, direct fecal contamination accounted for less than 10 percent of the total coliform bacteria present in the stormwater. The remaining coliforms (which were non-fecal in origin) were assumed to be contributed from soil erosion. Therefore, soil can contain large numbers of both non-fecal and fecal coliform bacteria. Because rain water contains very small bacteria concentrations, urban runoff becomes contaminated with bacteria when the rain water contacts contaminated surfaces. In wilderness areas, runoff has very little fecal coliform bacteria, while runoff from agricultural areas or urban areas can have varying amounts of fecal coliform bacteria. Seidler (1979) found that the movement of fecal coliform bacteria in saturated soils were extremely rapid. Soil can add appreciable fecal and non-fecal coliform bacteria to rain runoff. Casserly and Davis (1979) found that coliform types in urban soils were the same as they found in urban runoff, indicating a strong interaction between polluted soils and contaminated urban runoff. Davis (1979) found that irrigated soils, with high humic content, can yield greater amounts of bacteria. Evans and Owens (1972) found that the concentrations of E. Coli and Enterococci in stormwater runoff were affected by the soil bacteria concentrations.
Evans and Owens (1973) reported that bacteria was more likely to erode than the particulate matter in the soil. Davis (1979) found that the leaching action of rain on soil bacteria was quite erratic. The most important factors affecting bacteria concentrations in runoff were found to be the concentrations of the bacteria in soils. They reported total coliform concentrations in soils ranging from 200 to more than 500,000 total coliform organisms per gram. Fecal coliform soil concentrations ranged from less than 20 to about 300 organisms per gram and fecal strep. soil concentrations ranged from less than 20 to about 1,000 organisms per gram. Wildlife Sources of Bacteria Effects of Birds on Water Bacteria Concentrations Several studies have been conducted which examined the effects of large migratory or permanent waterfowl populations on the bacteria quality of water bodies. A study at the Montezuma Bird Refuge in New York (Have 1973) found inconsistent relationships between the bird populations and the total coliform, fecal coliform, and fecal strep. counts. Peak populations of 70,000 geese and 100,000 ducks frequent this 1,000 acre refuge. In fact, they found that the concentrations of the non-pathogenic bacteria in the two major streams flowing into the refuge were greater than in the water flowing out of the refuge. The specific conductance of the inflowing water was also greater than the outflowing water. The effluent did have higher concentrations of phosphorous and nitrogen. They concluded that the settling effect of the quite waters in the refuge may help explain the improvement in the quality of water leaving the refuge.
Brierley, et al. (1975) studied the Rio Grande Refuge in New Mexico. This refuge supports bird populations of more than 10,000 Sandhill cranes, 2,000 Canada geese, more than 8,000 snow geese, and more than 25,000 ducks from October to early March along ten miles of river channel. The water flowing into this bird refuge area along the Rio Grande River has high concentrations of suspended sediments and bacteria. The bacteria concentrations seem to

52
correlate directly with the high sediment concentrations. The presence of the large number of birds apparently does not affect the concentrations of the bacteria that were investigated (total heterotrophic bacteria, fecal and total coliforms, and Enterococci). Most of the birds use a single large pond at the end of their winter habitat. The draining of this pond at the end of their season did not seem to significantly change the bacteria population of the receiving channel water. The bird habitat pond, in fact, had decreased concentrations or bacteria during and following the period of maximum use. They concluded that the bacteria originated in upstream areas before it reached the refuge.
In a study at Lake Wingra in Wisconsin (Geldreich 1980), intermittent high fecal coliform counts during the late summer and early fall were found to be due to a combination of wastes from mallard ducks and the local weather. They reported that fecal coliforms in the sand due to duck defecation multiplied during the first week after deposition and then die-off occurred. Bacteria in these near-lake sands were transported into the water primarily by stormwater runoff erosion and by the foot traffic of bathers when going into the water.
Oplinger (1977) studied the effects of waterfowl populations on the water quality of a small creek park in Pennsylvania. They felt that increasing waterfowl populations and the declining water quality were related and threatened the health and welfare of both the waterfowl and the human watershed users.
Figley and Vandraff (1974), in a study of suburban parks in New York state, noted that mallard ducks are especially attracted to suburban lagoon developments. They felt that urban concentrations of semi-wild ducks may be detrimental, by serving as the focal points for outbreaks of infectious avian diseases and as a reservoir of diseases that could be transmitted to migrating wildfowl.
A study by Fennell, et al. (1974) examined the effects of about 500 roosting gulls on a one million cubic meter storage reservoir. Salmonella were usually found in the reservoir waters but never in the incoming water. They also found close correlations between the number of gulls and the degree of bacteria contamination. The sources of Salmonella appeared to be household and other refuse from dumps where the gulls were foraging. When the gulls left, after bird scaring fireworks were used, the Salmonella and other bacteria concentrations almost immediately decreased. The bacteria concentrations remained at low levels for a period of five weeks until the fireworks were stopped; the birds were allowed to return, and the bacteria concentrations in the reservoir immediately increased.
It is evident that birds can have varying effects on the bacteria concentrations in waterbodies. Large refuges do not seem to be severely affected by the wildlife populations. In fact, the ponding of waters in refuges appears to improve the water quality through sedimentation. Waterfowl frequenting smaller bodies of water, especially creeks and small lagoons, appear to have the potential for substantially increasing the water bacteria concentrations.
Gore and Storrie/Proctor and Redfern, (1981a) summarized the results of studies made to determine the effects of birds roosting on bridges over the Rideau River on river bacteria concentrations. They found that the birds on the bridges could have a statistically significant impact on fecal coliform concentrations, especially during the low summer flows. Measured concentration increases of fecal coliform bacteria downstream from the Queensway Bridge was found to be about 300 fecal coliform organisma/100 mL. Other Wildlife Bacteria Contributions Table 29 lists samples (mostly from mammals and birds with some soil, sediment, and river samples) where specific bacteria types were not generally found. The presence or absence of certain bacteria types in environmental samples can be a very important factor in identifying the bacteria sources (feces from which animals). As an example, Streptococcus bovis and S. equinus have not been found in human feces by several projects. (These types, however, are the predominant fecal strep. type found in livestock feces.) Their absence in a sample indicates the probable absence of livestock feces contamination, however, their absence may only indicate die-off and not absence of fecal contamination.
Table 30 lists the wildlife feces samples in which different bacteria types were found, along with their relative concentrations. Geldreich and Kenner (1969) stated that the absence of fecal strep. bacteria indicates the absence of warm blooded animal fecal pollution. The presence of Streptococcus faecalis indicates human fecal contamination. S. faecalis far outnumbers S. inulinaceus in sewage and in sewage polluted waters, even though S. inulinaceus is in

53
great abundance in fresh feces (Bartley and Slanetz 1960). S. faecalis var. liquefaciens is ubiquitous as it is present in almost all samples tested (Geldreich and Kenner 1969; Bartley and Slanetz 1960). S. mitis and S. salivarious are considered sensitive indicators of human pollution when they are found (Seidler 1979). S. bovis and S. equinus are nearly ideal non-human mammal fecal indicators (Seidler 1979). They have rapid die-off rates (much faster than fecal coliform die-offs) and are the most sensitive bacteria in the fecal strep. category. Their presence indicates recent livestock pollution (Feacham 1975; Geldreich 1976; Bartley and Slanetz 1960; Geldreich and Kenner 1969).
Table 31 summarizes the bacteria concentrations observed in feces samples from different mammals and birds. Drake, et al. (1961) found a wide variation in the coliform content of some wild and domestic animal feces. Coliform bacteria were present in small numbers or were absent for some feces, such as from rabbits, shrews, deer, elk, some squirrels, and many birds. They also found that coliform bacteria were not found in some carnivores (shrews) but were present in large number in the carnivores (coyotes and bears). They also found no significant differences in the fecal coliform content of different animals of the same species that were collected in different areas. However, feces from different species of animals collected in the same area could have large differences in their fecal coliform concentrations. They also noted that some mammals (coyote, bear, some gophers, and some squirrels) had coliform concentrations in the feces that were similar to human coliform concentrations. Animals with soft or moist feces (man and many domestic animals such as cows, dogs, and pigs) had very high numbers of coliform bacteria (many thousands to millions of coliform bacteria per gram). The feces of other animals, especially those with hard or dry feces, may contain few or no coliform bacteria.
Geldreich (1976) summarized a study that showed the variations in fecal strep. bacteria concentrations in human feces from different locations. Feces collected from humans living in Cincinnati had concentrations more than five times greater than samples collected from healthy people in Nagpur, India (13 million and 2 million fecal strep. organisms per gram, respectively). He also reported that fecal strep. densities in farm animal, cat, dog, mice, and chipmunk feces samples were in the order of millions of organisms per gram. Rabbit feces fecal strep. concentrations, however, may be several orders of magnitude lower than those found in other animals. The Ottawa waterbird feces samples were reported to have the largest total coliform, fecal coliform, and fecal strep. concentrations when compared to all other samples reported (except for the fecal strep. dog feces concentrations). Gull feces generally have the highest fecal coliform concentrations in their feces, followed by Ottawa pigeons, ducks, dogs, sheep, and humans. Other urban bird feces (pigeons, sparrows, robins, starlings, and blackbirds) were all reported to have much lower fecal coliform concentrations that were unusually high. Feces Discharges from Wildlife Table 32 summarizes reported discharges of feces from different mammals and birds. These discharges are expressed in grams per animal per day and vary quite widely, depending on the study. Animals can deposit substantial quantities of feces in an urban area, depending upon the animal’s population. Geldreich (1976) stated that major contributions of bacteria in urban communities are from fecal discharges from cats, dogs, and rodents. These feces are deposited on soil, asphalt, and cement. He stated that the one-half million dogs in New York City deposit about 150,000 pounds of feces on the streets, sidewalks, and park areas per day. Significant populations of rodents may also contribute large amounts of fecal material in urban areas. Fortunately, very little of this fecal bacteria enters receiving waters. Faust (1976), in an agricultural watershed in the Rhode River near Chesapeake Bay, found that only about one percent of the fecal coliform bacteria deposited by cattle in the watershed was washed into the receiving waters. Sometimes the yields (application rates) were higher, with high values around 5 percent and on one occasion reaching 25 percent. They concluded that fecal coliform discharges can be substantial from a watershed that has the equivalent of about one cow per two hectares. Evans and Owens (1973), from a study in Scotland, stated that most of the bacteria in the runoff water came from the soil. They found that the soil bacteria washoff yield was only about one-tenth of one percent of the estimated total soil bacteria population. They felt that the maximum annual discharge of bacteria from the contaminated soil would only be about 0.15 percent of the total soil bacteria population.

54
Table 29

55
Table 30

56
Table 30 (cont)

57
Table 30 (cont)

58
Table 30 (cont)

59
Table 30 (cont)

60
Table 31

61
Table 31 (cont)

62
Case Study: Investigation of Urban Runoff Pathogen Sources in Ottawa, Ontario The City of Ottawa, Ontario, sponsored several studies in the early 1980s investigating the sources of the high bacteria concentrations found in the Rideau River, and possible control procedures. The following discussion (from Pitt 1983) summarizes their findings, especially relating to the relative magnitude of urban bacteria sources.
Table 33 summarizes the bacteria concentrations observed for the different samples collected in the Ottawa urban area. Except for rooftop runoff, the catchment subarea sheetflow concentrations all approach the concentrations of the urban runoff. The urban runoff bacteria concentrations are slightly greater than the river concentrations below Mooney's Bay. The catchment area sheetflow fecal strep. concentrations, again except for rooftop runoff, are all substantially greater than the river concentrations. Estimated Unit Area Bacteria Yields Five to eleven storms were completely monitored for fecal coliform concentrations at four of the test catchments from 1978 to 1981. Table 34 summarizes these observations for the 34 monitored storms. The resultant calculated catchment bacteria runoff yields expressed in millions of organisms per hectare per day are shown in Table 35. Approximately 1.5 x 10⁸ fecal coliforms per hectare per year and about 3.7 x 10⁸ fecal strep. organisms per hectare per year are the estimated bacteria yields for the Ottawa six month runoff season.
In order to determine the importance of each of the catchment subareas in contributing urban runoff pollutants, a small sampling effort was conducted to collect sheetflow samples during two rain events. Table 36 summarizes the results of these analyses. The rooftop bacteria samples had substantially lower fecal coliform and fecal strep. bacteria concentrations than samples collected from vacant land and park sheetflows, parking lot sheetflows and street gutter flows. The rooftop samples, however, did have important bacteria concentrations, especially when compared to Rideau River bacteria concentrations above Mooney’s Bay.
Table 32. Estimated Feces Discharges
Animal Discharge1 (grams/animal/day)
Reference
Mammals Humans 150 Geldreich 1976 Farm animals pig 680 Howe 1969 sheep 1,100 Howe 1969 cow 7,000 Howe 1969 horse 7,000 Howe 1969 Domestic pets cat 70 Howe 1969 dog 140 Howe 1969 23 to 100 Marron and Senn 1974 Possible urban wildlife rabbit 550 Howe 1969 rat 35 Howe 1969 mouse 10 Howe 1969 Birds Farm birds chicken 55 Howe 1969 180 Geldreich 1976 turkey 160 Howe 1969 450 Geldreich 1976 Possible urban birds pigeon 25 to 50 Gore & Storrie/Proctor & Redfern 1981a gulls 10 to 25 Gould and Fletcher 1978 duck 70 Howe 1969 340 Geldreich 1976 goose 160 Howe 1969
1 estimated application factors (fraction reaching urban receiving waters): 0.01 for land animals and 0.5 for waterfowl

63
Table 33. Typical Bacterial Population Densities in the Ottawa Area (Pitt 1983) Total
Coliforms Fecal Coliforms
Fecal Strep.
Water Samples (organisms/100 mL) Rideau River Below Mooney’s Bay 7,000 1,000 500 Above Mooney’s Bay 500 50 50 Urban runoff na 10,000 na Snowmelt 3,000 <2 2 Catchbasin sump water na 50 300 Gutter flows na 4,000 20,000 Parking area sheetflow na 3,000 10,000 Vacant land and park sheetflow na 6,000 20,000 Rooftop runoff na 100 200 Sediment Samples (organisms/gram solids) Rideau river sediments (urban area) na 20,000 na Sewerage sediments na 8,000 20,000 Catchbasin sump water 400 20 100 Street dirt na 400 2,000 Table 34. Catchment Runoff Fecal Coliform Bacteria Observations in Ottawa area (Pitt 1983) Alta Vista Chesterton Leonard St. Lauraent Overall Geometric mean* (#/100 mL)
14,100 12,300 21,700 4,580 10,200
Min. (#/100 mL) 5,900 720 11,500 540 540 Max. (#/100 mL) 38,000 96,600 64,100 31,400 96,600 Number of storms monitored
11 7 5 11 34
Study period 1980 and 1981 1978, 1979, and 1981
1980 and 1981 1980 and 1981 1978 through 1981
* geometric mean of flow-weighted averaged concentrations for monitored storms
Table 35. Estimated Ottawa Catchment Bacteria Runoff Yields (106 organisms/ha/day) (Pitt 1983)
Catchment Fecal Coliforms
Mean (range) Fecal Strep. Mean (range)
Alta Vista 0.5 (0.3 to 1.1) 1.3 (0.8 to 3) Chestron 0.6 (0.4 to 1.5) 1.5 (1 to 4) Leonard 1.4 (0.7 to 3) 3.5 (2 to 8) St. Laurent 0.6 (0.3 to 1.4) 1.5 (0.8 to 4) Average 0.8x10⁶ FC org/ha/day 2x10⁶ FS org/ha/day
The urban runoff fecal coliform unit area yield is more than a factor of ten greater than the snowmelt yield, and about a factor of ten greater than the sewerage and catchbasin sump yields. Therefore, snowmelt and sewerage accumulations probably do not appreciably affect the total annual yields, but they may significantly affect individual snowmelt and storm event concentrations and yields. The street surface particulate fecal coliform and fecal strep. accumulations are as much as one to two orders of magnitude greater than the total urban runoff bacteria discharges. Bacteria urban runoff yields do not appear to be source-limited in that substantial quantities of bacteria reside on the street surfaces that are not washed off by rain. A large quantity of bacteria is associated with particulates that are trapped in the street textures and may be subject to significant die-off during periods of dry weather. The many other sources of bacteria in the urban area would further increase this overabundance of bacteria sources for urban runoff.

64
These observed subarea bacteria concentrations were much greater than those observed in a similar sampling program in San Jose, California, (Pitt and Bozeman 1982). In San Jose, the observed fecal coliform gutter and parking lot sheetflow sample concentrations were much greater than elsewhere in the San Jose study areas, and were from several hundred to about 1000 organisms/100mL. Rooftop runoff and landscaped area runoff fecal coliform concentrations were less than ten and less than 50 organisms/100 mL., respectively. The San Jose sheetflow fecal strep. concentrations were closer to the observed Ottawa concentrations. An earlier Ottawa study reported by the Regional Munciipality of Ottawa - Careleton (1972) measured rooftop runoff bacteria concentrations. The runoff from a roof at an experimental farm that was frequented by many birds had coliform concentrations greater than 10,000 organisms/100 mL. Street surface and parking lot runoff showed total coliform concentrations in the hundreds of thousand of organisms/100 mL.
Tables 37 and 38 show the resultant percentage contributions for bacteria from each of the catchment subareas. These values are calculated from the observed sheetflow pollutant concentrations and from the calculated urban runoff flow contributions from each subarea. It is interesting to note the differences in the subarea contributions for fecal coliforms and fecal strep. The differences in bacteria yields from street surfaces when comparing large rains with small rains very large. The bacteria yields from the street surfaces decrease much more for the larger rains because of the high bacteria concentrations observed in non-street surface sheetflows. Even if all of the street surface bacteria was removed from the streets, a maximum reduction of about 60 to 70 percent in outfall bacteria yields would be achieved, and only for the runoff from residential areas and for the smallest rains. For the largest rains, and if all of the fecal coliform bacteria was removed from the streets, only about 10 to 25 percent bacteria reductions would be observed at the outfall. If sidewalks and driveways were cleaned, a greater fraction of the bacteria could be controlled. If the shopping center parking lots, along with the streets, were cleaned, then much of the bacteria in these areas could also be controlled and for almost all storms. Table 36. Catchment Subarea Sheetflow Bacteria in Ottawa (August and September, 1981, observations) (Pitt 1983) Rooftop
runoff Vacant land
and park sheetflow
Parking lot sheetflow
Gutter flow
Fecal coliforms Geometric mean (#/100 mL) 85 5,600 2,900 3,500 Min (#/100 mL) 10 360 200 500 Max (#/100 mL) 400 79,000 19,000 10,000 Number of observations 4 7 6 7 Fecal Strep. Geometric mean (#/100 mL) 170 16,500 11,900 22,600 Min (#/100 mL) 20 12,000 1,600 1,800 Max (#/100 mL) 3,600 57,000 40,000 1,200,000 Number of observations 4 7 6 7 Mammal and Bird Populations and Bacteria Discharges in the Ottawa Urban Area Table 39 summarizes the expected populations of mammals and birds in the lower Rideau River watershed. There are other domestic and wild animals in this watershed (such as other birds and rodents) but their population estimates are not available. It is estimated that about 16,000 dogs and the same number of cats live in this watershed, corresponding to approximately one dog or cat for every other house. The waterbird estimates are based upon actual population counts made along the river.
Table 40 is an estimate of the total annual bacteria discharges from these mammals and birds based upon these population estimates, the fecal discharges, the application factors, and the bacteria concentrations in the feces. The total estimated discharges (2 X 10¹¹ fecal coliforms per ha per year) are two to three orders of magnitude greater than what is expected in the annual urban runoff bacteria yield. This large difference may be associated with bacteria die-off or analytical problems.

65
Table 37

66
Table 38

67
Table 39. Estimated Bird and Pet Populations in the Lower Rideau River Watershed (below Hogs Back) (Pitt 1983)
Animal Population Density
(animals/ha) Total estimated animal
population in the Lower Rideau River Watershed (4000 ha)
Dogs1 4 16,000 Cats1 4 16,000 Robins2 7 28,000 Pigeons (land)1 1 4,000 Pigeons (on bridges)3 600 Ducks (on river)3 100 Gulls (on river)3 150 Swans (on river)3 15 Other birds on river (sparrows and blackbirds)3
10
1 estimated from Colt, et al. 1977 2 estimated from Howard 1974 3 Regional Municipality of Ottawa-Carleton 1980
As a rough estimate, the values in Table 40 may all be considered to be affected by the same die-off rates and analytical measurement errors. The percentage contributions associated with each animal may, therefore, be considered approximate. The major source of fecal coliforms in the Rideau River is expected to be pigeons (when using the high Ottawa pigeon fecal coliform values), followed by dogs and ducks. The other sources shown would all contribute less than a total of five percent. Dogs are expected to contribute almost half of the river total coliform organisms, while pigeons on the bridges and ducks on the river make up most of the remainder. Dogs are expected to contribute almost all of the river fecal strep. bacteria, with ducks on the river contributing to less than five percent. Pitt and Bozeman (1979) found that lake birds can contribute a significant amount of fecal strep. bacteria to a lake refuge in the middle of an urban area in Oakland, CA. However, urban runoff components contribute much more bacteria during wet weather conditions. It is interesting to compare these calculated estimates of fecal coliform contributions with those reported elsewhere. Faust and Goff (1977) reported 109 to 1010 fecal coliforms discharged per hectare per year in the Chesapeake Bay area from cultivated lands, forests, and pastures. These values are about ten to 100 times the estimated urban area yields for the lower Rideau River watershed. Summary of Ottawa Case Study The limited assimilative capacity of the river and how the bacteria quality decreases as the river flows through Ottawa was previously described. The substantial bacteria density increases during wet weather indicate an urban runoff problem and the probable lengthy duration of adverse river conditions. The number of observations showing bacteria densities greater than the standards indicates that Strathcona, Brantwood, and Brighton Beaches exceed the fecal coliform criteria of 100 organisma/100 mL most of the time. Mooney’s Bay Beach exceeds this criteria about ten percent of the time. A limited field program was conducted during this study that found the Rideau River bottom sediments to have substantial bacteria population densities. An important phase in designing an urban runoff control program is to determine the sources of the problem pollutants in the watershed. An understanding of where they accumulate in the catchment is needed before appropriate controls may be selected. As an example, bacteria may accumulate almost everywhere in an urban area (on rooftops from birds, and on streets, parking lots, landscaped areas, and vacant land from dogs and other urban animals). Original sources therefore affect a variety of potential control areas. The Rideau River Stormwater Management Plan report identified urban runoff as the major source of the problem bacteria discharges. This special study summarized here included a limited field program which roughly identified the specific locations in the urban area where the bacteria originated. Feces from warm blooded animals are the only sources of fecal bacteria, while soils can contain some non-fecal bacteria. The ratio of fecal coliforms to fecal strep. bacteria population densities can be used to differentiate between human and non-human sources if the samples are obtained very close to the

68
Table 40

69
time of discharge. Otherwise, the different survival times of the fecal strep. biotypes can radically change this ratio with time. The periodic high ratios of these two bacteria indicator groups in the Rideau River may be explained by relatively old non-human discharges. If water bodies were small (creeks and small reservoirs), a relatively small number of birds (less than 100) were found to significantly increase various fecal bacteria biotypes in the water. However, if the water bodies were large (large bird refuges and large rivers), then large numbers of birds (as many as 100,000) did not significantly increase the bacteria population densities in the water. The water flowing from the bird refuges typically had better water quality than the inflowing water, possibly due to sedimentation in the refuge marshes. Dog feces are expected to contribute much of the fecal coliforms in urban runoff, while pigeons (on bridges) and ducks on the Rideau River may contribute most of the bacteria to the River. Polluted river sediments may also play an important role in contaminating river water.
Based on monitoring from the Rideau River Stormwater Management Study and other runoff bacteria studies, it is concluded that many potentially pathogenic bacteria biotypes can be present in the local urban runoff. Most of these pathogenic biotypes can cause health problems when ingested. Because of the low probability of ingestion of urban runoff, many of the potential human diseases associated with these biotypes are not likely to occur. The required infective doses of many of these biotypes and their relatively low concentrations in stormwater would require very large amounts of urban runoff to be ingested. As an example, Salmonella, when observed in Ottawa urban runoff and receiving waters, has been found in very low concentrations requiring the consumption of more than 20 liters of urban runoff for infections. Shigella, however, may be present in urban runoff and receiving waters and when ingested in low numbers can cause dysentery.
The pathogenic organisms of most importance in urban runoff are usually associated with skin infections and body contact. Body contact with urban runoff is not likely. However, the Rideau River retains many of the pathogenic biotypes originating from urban runoff for a long period of time after rains. The most important biotype causing skin infections is Pseudomonas aeruginosa. This biotype has been frequently detected in urban runoff at many locations in concentrations that may cause potential infections. However, there is little information relating increased infection hazards with increased Pseudomonas concentrations. Staphylococci aureus may also cause skin problems with body contact, but there is little information concerning the concentrations of this biotype in urban runoff. Various pathogenic yeasts and viruses may also be found in urban runoff, but their concentrations and infective pathways are not well enough known to establish criteria for urban runoff pollution. Therefore, the local bacteria concentration objectives based on fecal coliform concentrations may be unreasonable when actual potential health effects are considered.
Further studies also need to be made concerning populations of pathogenic bacteria (specifically Pseudomonas aeruginosa, Staphylococci aureus and Shigella) in the Rideau River. Population densities of these pathogens may be related to River location, storm type, and possibly indicator (fecal coliform) bacteria densities. If adverse levels of these pathogens can be predicted, or easily and quickly measured, then they should be used as the basis for beach closures in the River. References Akerlinch, G. “The quality of stormwater flow.” Nord. Hyg. Tidskr. (Denmark), 31,1. 1950. Alexander, L.M., A. Heaven, A. Tennant, and R. Morris. “Symptomatology of children in contact with sea water
contaminated with sewage.” Journal of Epidemiology and Community Health. Vol. 46, pp. 340-344. 1992. Altman, P.L., and D.S. Dittmer, editors. Biology Data Book. 2nd ed., V.II. Fed. of Amer. Soc. for Exp. Biology.
1973. Andelman, J., H. Bauwer, R. Charbeneau, R. Christman, J. Crook, A. Fan, D. Fort, W. Gardner, W. Jury, D. Miller,
R. Pitt, G. Robeck, H. Vaux, Jr., J. Vecchioli, and M. Yates. Ground Water Recharge Using Waters of Impaired Quality. Committee on Ground Water Recharge. Water Science and Technology Board. National Research Council. National Academy Press. Washington, D.C. 1994.
AVCO Economic Systems Corp. Storm Water Pollution From Urban Land Activity. US EPA Report No. 11034FKL07/70. NTIS No. PB 195 281. July 1970.
Bannerman, R., K. Baun, M. Bohn, P.E. Hughes, and D.A. Graczyk. Evaluation of Urban Nonpoint Source Pollution Management in Milwaukee County, Wisconsin, Vol. I. Grant No. P005432-01-5, PB 84-114164. US Environmental Protection Agency, Water Planning Division, November 1983.

70
Bartley, C. H., and L. W. Slanetz. “Types and sanitary significance of fecal streptococci isolated from feces, sewage, and water.” Am. J. Pub. Health 50:1545-1552. Oct. 1960.
Berg, G., editor. Transmission of Viruses by the Water Route. Interscience Publishers, NY. 1965. Berg, R. W., and A. W. Anderson. “Salmonellae and Edwardsiella tarda in gull feces: a source of contamination in
fish procession plants.” Applied Microbiology. 24, 3:501-503. Sept. 1972. Betson, R. Urban Hydrology: A Systems Study in Knoxville, Tennessee. TVA. June 1976. Black, Crow & Edisness, Inc., and Jordan, Jones & Goulding, Inc. Non-Point Pollution Evaluation Atlanta Urban
Area. US EPA Contract No. DACW 21-74-C-0107. May 1975. Borchardt, D. and F. Sperling. “Urban stormwater discharges: Ecological effects on receiving waters and
consequences for technical measures.” 7th International Conference on Urban Storm Drainage. Hannover, Germany. Sept. 9-13, 1996. Edited by F. Sieker and H-R. Verworn. IAHR/IAWQ. SuG-Verlagsgesellschaft. Hannover, Germany. pp. 359-364. 1996.
Brierley, J.A., D.K. Brandvold, and C.J. Popp. “Waterfowl refuge effect on water quality: I. Bacterial populations.” Journal WPCF, 47,7:1892:1900. July 1975.
Bryan, E.H. “Quality of stormwater drainage from urban land.” Water Resources Bulletin. 8, 6:578 .June 1972. Burm, R.J. and R.D. Vaughan. “Bacteriological comparison between combined and separate sewer discharges in
southeastern Michigan.” Journal WPCF, 38, 3:400-409. March 1966. Cabelli, V.J., H. Kennedy, and M.A. Levin. “Pseudomonas aeruginosa-fecal coliform relationships in estuarine and
fresh recreational waters.” Journal WPCF 48, 2:367-376. Feb. 1976. Cabelli, V.J., A.P. Dufour, M.A. Levin, L.J. McCabe, and P.W. Haberman. “Relationship of microbial indicators to
health effects at marine bathing beaches.” American Journal of Public Health. Vol. 69, no. 7, pp. 690-696. July 1979.
Cabelli, V.J., A.P. Dufour, L.J. McCabe, and M.A. Levin. “Swimming-associated gastroenteritis and water quality.” American Journal of Epidemiology. Vol. 115, no. 4, pp. 606-616. 1982.
Cardozo, R.J., W.R. Adams, and E.L. Thackston. “CSO’s real impact on water quality: the Nashville experience.” A Global Perspective for Reducing CSOs: Balancing Technologies, Costs, and Water Quality. July 10-13, 1994. Louisville, KY. Water Environment Federation. Alexandria, VA. 1994.
Casserly, D.M. and E.M. Davis. “Indicator and pathogenic bacteria relationship in stormwater runoff.” Texas J. Sci. 31, 3:285-292. Sept. 1979.
Cheung, W.H.S., K.C.K. Chang, R.P.S. Hung, and J.W.L. Kleevens. “Health effects of beach water pollution in Hong Kong.” Epidemiol. Infect. Vol. 105, pp. 139-162. 1990.
Colston,N.V., Jr. Characterization and Treatment of Urban Land Runoff. US EPA Report No. EPA-670/2-74-040. NTIS No. PB 240 687. Dec. 1974.
Colt, J., K. Tanji, and G. Tchobanoglous. Impact of Dog, Cat, and Pigeon Wastes on the Nitrogen Budget of San Francisco Storm Runoff. Dept. of Water Science and Engineering, U. of Calif., Davis. Aug. 1977.
Corbett, S.J., G.L. Rubin, G.K. Curry, D.G. Kleinbaum, and the Sydney Beach Users Study Advisory Group. “The health effects of swimming at Sydney beaches.” American Journal of Public Health. Vol. 83, no. 12, pp. 1701 – 1706. December 1993.
Craun, G.F., R.L. Calderon, and F.J. Frost. “An introduction to epidemiology.” Journal of the AWWA. Vol. 88, no. 9. pp. 54-65. September 1996.
Craun, G.F., P.S. Berger, and R.L. Calderon. “Coliform bacteria and waterborne disease outbreaks.” Journal of the AWWA. Vol. 89, no. 3. pp. 96-104. March 1997.
Crockett, C.S. and C.N. Haas. “Understanding protozoa in your watershed.” Journal of the American Water Works Association. Vol. 89, No. 9, pp. 62 – 73. September 1997.
Davis, E. H. Maximum Utilization of Water Resources in a Planned Community. Bacterial Characteristics of Stormwaters in Developing Rural Areas. USEPA Rept. No. EPA/600/2-79-050F. NTIS No. PB 80-129091. 1979.
DHS (Department of Health Services). Guidance for Freshwater Recreational Areas: Assessing Microbiological Contamination and taking Corrective Action (Draft). State of California Health and Welfare Agency. Sacramento, CA. November 1997a.
DHS (Department of Health Services). Guidance for Saltwater Recreational Areas (Oceans, Bays, Estuaries, and the Salton Sea): Assessing Microbiological Contamination and taking Corrective Action (Draft). State of California Health and Welfare Agency. Sacramento, CA. November 1997b.

71
Drake, C.H., F.W. Woods, and R.A. Hammerstrom. “Incidence of coliform bacteria in the feces of common wild animals.” Sanitarian. 23:248-254. 1961.
Droste and Gupgupoglu. Indicator Bacteria Die-Off in the Rideau River. Rideau River Stormwater Management Study, Ottawa, and the Ontario Ministry of the Environment, Kingston, Ontario. Feb. 1982.
Dufour, A.P. “Bacterial indicators of recreational water quality.” Canadian Journal of Public Health. Vol. 75, pp. 49-56. January/February 1984a.
Dufour, A.P. Health Effects Criteria for Fresh Recreational Waters. U.S. Environmental Protection Agency. Health Effects Research Laboratory. Office of Research and Development. EPA 600/1-84-004. August 1984b.
Dutka, B.J. “Microbiological indicators, problems and potential of new microbial indicators of water quality.” In: Biological Indicators of Water Quality. John Wiley and Sons. New York. 1979.
Envirogenics Company. Urban Storm Runoff and Combined Sewer Overflow Pollution--Sacramento, California. US EPA 11024 FKM 12/71. Dec. 1971.
Environment Canada. Storm Water Monitoring Study, Rideau River, National Capital Area, 1978. MS Report No. OR-24. Dec. 1978.
Environment Canada. Rideau River Water Quality and Stormwater Monitor Study, 1979. MS Rept. No. OR-29. Feb. 1980.
Environmental Science & Technology . “News Briefs.” Vol. 30, no. 7, pg. 290a. July 1996b. EPA (U.S. Environmental Protection Agency). Results of the Nationwide Urban Runoff Program. Water Planning
Division, PB 84-185552, Washington, D.C., December 1983. EPA (U. S. Environmental Protection Agency). Ambient Water Quality Criteria for Bacteria. Office of Water
Regulations and Standards, Criteria and Standards Division. EPA 440/5-84-002. January 1986. Evans, M.R. and J.D. Owens. “Factors affecting the concentration of faecal bacteria in land-drainage water.” J. Gen.
Microbiol. 71:477-485. 1972. Evans, M.R. and J.D. Owens. “Soil bacteria in land-drainage water.” Water Research. 7:1295-1300. 1973. Faust, M.A. “Coliform bacteria from diffuse sources as a factor in estuarine pollution.” Water Research. 10:619-
627. 1976. Faust, M.A. and N.M. Goff. “Basin size, water flow and land-use effects on fecal coliform pollution from a rural
watershed.” In: Watershed Research in Eastern North America, Vol ll, D.L. Correll. NTIS No. PB-279 920/3SL. 1977.
Faust, M.A. and N.M. Goff. “Sources of bacterial pollution in an estuary.” In: Coastal Zone '78, Proc., Symp. on Technical, Environmental, Socioeconomic and Regulatory Aspects of Coastal Zone Management. ASCE/ San Francisco. March 1978.
Feachem, R. “An improved role for faecal coliform to faecal stretococci ratios in the differentiation between human and non-human pollution sources.” Water Research. 9:689-690. 1975.
Fee, A.E. “River pollution and storm water management in the Ottawa area.” In: Proceedings, Pollution Control Assoc. of Ontario 1976 Annual Conference. 1976.
Fennell, H., D.B. James, and J. Morris. “Pollution of a storage reservoir by roosting gulls.” Journal Soc. for Water Treatment and Examination. 23(1):5-24. 1974.
Ferley, J.P., D. Zmirou, F. Balducci, B. Baleux, P. Fera, G. Larbaigt, E. Jacq, B. Moissonnier, A. Blineau, and J. Boudot. “Epidemiological significance of microbiological pollution criteria for river recreational waters.” International Journal of Epidemiology. Vol. 18, no. 1, pp. 198-205. January 1989.
Field, R. and E.J. Struzeski, Jr. “Management and control of combined sewer overflows.” Journal WPCF 44(7):1393-1415. July 1972.
Field, R. and A.N. Tafuri. “Section l: Stormflow pollution control in the U.S.” In: Combined Sewer Overflow Seminar Papers. USEPA Report No. EPA-670/2-73-077. Nov. 1973.
Field, R., V.P. Olivieri, E.M. Davis, J.E. Smith, and E.C. Tifft, Jr. Proceedings of Workshop on Microorganisms in Urban Stormwater. USEPA Rept. No. EPA-600/2-76-244. Nov. 1976.
Field, R., and C. Cibik. “Urban runoff and combined sewer overflows.” Journal of Water Pollution Control Federation. Vol. 52. No. 6. pp.1290-1307. June 1980.
Field, R. and M.L. O'Shea. “The detection of pathogens in storm-generated flows.” Water Environment Federation 65th Annual Conference and Exposition. New Orleans. September. 1992.
Field, R., M. O’Shae and M. Brown. “The detection and disinfection of pathogens in storm-generated flows.” Water Science & Technology. Vol. 28, no. 3-5, pp. 311-315. 1993.

72
Figley, W.K. and L.W. Vandruff. “The ecology of nesting and brood rearing by suburban mallards.” In: Symposium on Wildlife in an Urbanizing Environment. Planning and Research Development Series No. 28, U. of Mass. June 1974.
Fleisher, J.M. “A reanalysis of data supporting U.S. federal bacteriological water quality criteria governing marine recreational waters.” Research Journal of the Water Pollution Control Federation. Vol. 63, no. 3, pp. 259-265. May/June 1991.
Fleisher, J.M., F. Jones, D. Kay, R. Stanwell-Smith, M. Wyer, and R. Morano. “Water and non-water related risk factors for gastroenteritis among bathers exposed to sewage contaminated marine waters.” International Journal of Epidemiology. Vol. 22, No. 4, pp. 698-708. 1993.
Fleisher, J.M., D. Kay, R.L. Salmon, F. Jones,. M.D. Wyer, and A.F. Godfree. “Marine waters contaminated with domestic sewage: nonenteric illnesses associated with bather exposure in the United Kingdom. American Journal of Public Health. Vol. 86, no. 9, pp. 1228 – 1234. September 1996.
Fujita, S. “Restoration of polluted urban watercourses in Tokyo for community use.” Sustaining Urban Water Resources in the 21st Century. Proceedings of an Engineering Foundation Conference. September 7 – 12, 1997. Malmo, Sweden. ASCE/Engineering Foundation. New York. 1998.
Gambrell, R.P. and W.H. Patrick Jr. “Chemical and microbiological properties of anaerobic sorts and sediments.” In: Plant Life in Anaerobic Environments. R.M.M. Crawford (ed.). Ann Arbor Science Publishers, Ann Arbor, Michigan, 1977.
Geldreich, E.E. “Orgins of microbial pollution in streams.” In: Transmission of Viruses by the Water Route, edited by G. Berg, Interscience Publishers, NY. 1965.
Geldreich, E.E. “Fecal coliform and fecal streptococcus density relationships in waste discharges and receiving waters.” Critical Reviews in Environmental Control. 6(4):349. Oct. 1976.
Geldreich, E.E. “Microbiology of water.” Journal WPCF. 52(6):1774. June 1980. Geldreich, E.E., L.C. Best, B.A. Kenner, and D.J. Van Donsel. “The bacteriological aspects of stormwater
pollution.” Journal WPCF 40(11):1861-1872. Nov. 1968. Geldreich, E.E. and B.A. Kenner. “Concepts of fecal streptococci in stream pollution.” Journal WPCF 41(8):R336-
R352. Aug. 1969. Geldreich, E.E., H.D. Nash, D.F. Spino, and D.J. Reasoner. “Bacterial dynamics in a water supply reservoir: A case
study.” Journal AWWA. Jan. 1980. GLA (Gartner Lee and Assoc.) Toronto Area Watershed Management Strategy Study - Humber River and Tributary
Dry Weather Outfall Study. Technical Report #1. Ontario Ministry of the Environment. Toronto, Ontario. 1983. Glover, G.E. “Section VIII: High-rate disinfection of combined sewer overflow.” In: Combined Sewer Overflow
Seminar Papers. USEPA Report No. EPA-670/2-73-077. Nov. 1973. Gore & Storrie Ltd./Proctor & Redfern Ltd. 1981a Gore & Storrie Ltd./Proctor & Redfern Ltd. Executive Summary Report on Rideau River Stormwater Management
Study, Phase I. Rideau River Stormwater Management Study, Ottawa, and the Ontario Ministry of the Environment, Kingston, Ontario. 1981b.
Gore & Storrie Ltd./Proctor & Redfern Ltd. Report on Rideau River Stormwater Management Study, Phase I. Rideau River Stormwater Management Study, Ottawa, and the Ontario Ministry of the Environment, Kingston, Ontario. 1981c.
Gore & Storrie Ltd./Proctor & Redfern Ltd. Hourly Rainfall Statistics for Canada Dept. of Agriculture Station, Ottawa, 1960-1980, April - November. Rideau River Stormwater Management Study, Ottawa, and the Ontario Ministry of the Environment, Kingston, Ontario. 1981d.
Gore & Storrie Ltd./Proctor & Redfern Ltd. The Fecal Coliform Loadings from Resident Bird Populations on Bridges during Dry Weather Conditions. Rideau River Stormwater Management Study, Ottawa, and the Ontario Ministry of the Environment, Kingston, Ontario. 1982a.
Gore & Storrie Ltd./Proctor & Redfern Ltd. Report on Rideau River Stormwater Management Study, Phase II, Stage I. Rideau River Stormwater Management Study, Ottawa, and the Ontario Ministry of the Environment, Kingston, Ontario. 1982b.
Gupta, M.K., R.W. Agnew, D. Gruber, and W. Kreutzberger. Constituents of Highway Runoff. Vol. IV, Characteristics of Highway Runoff from Operating Highways. FHWA Rept. No. FHWA/RD-81/045. Feb. 1981.
Haile and the Santa Monica Bay Restoration Project. An Epidemiological Study of Possible Adverse Health Effects of Swimming in Santa Monica Bay. Santa Monica Bay Restoration Project. Monterey Park, CA. October 1996.

73
Hancock, C.M., et al. “Assessing plant performance using MPA.” Journal of the American Water Works Association. Vol. 88, No. 12. Pp. 24 - . December 1996.
Hauck, A.R. Progress Report on the Sawmill Creek Pilot Study 1974-1975. The Regional Municipality of Ottawa-Carleton, Ottawa, Ontario. 1976.
Have, M.R. “Effects of migratory waterfowl on water quality at the Montezuma National Wildlife Refuge, Seneca County, New York.” Journal Research USGS. 1 (6):725-734. Nov.-Dec. 1973.
Howard, D.V. “Urbanizing robins: A population study.” In: Symposium on Wildlife in an Urbanizing Environment. Planning and Resource Development Series No. 28, U. of Mass. June 1974.
Howe, R.H.L. “Research and practice in animal wastes treatment.” Water and Wastes Engineering/Industrial. Jan. 1969.
Kay, D., J.M. Fleisher, R.L. Salmon, F. Jones, M.D. Wyer, A.F. Godfree, Z. Zelenauch-Jacquotte, and R. Store. “Predicting likelihood of gastroenteritis from sea bathing: results from randomised exposure.” The Lancet. Vol. 344. Pp. 905-909. October 1, 1994.
Koenraad, P.M.F.J., F.M. Rombouts, and S.H.W. Notermans. “Epidemiological aspects of thermophilic Campylobacter in water-related environments: A review.” Water Environment Research. Vol. 69, No. 1, pp. 52-63. January/February 1997.
Lager, J.A. and W.G. Smith. Urban Stormwater Management and Technology, an Assessment. USEPA Report No. EPA-670/2-74-040. NTIS No. PB 240 687. Dec. 1974.
Lager, J.A., W.G. Smith, W.G. Lynard, R.M. Finn, and E.J. Finnnemore. Urban Stormwater Management and Technology: Update and Users’ Guide. USEPA Rept. No. EPA-600/8-77-014. Sept. 1977.
Lalor, M. Assessment of Non-Stormwater Discharges to Storm Drainage Systems in Residential and Commercial Land Use Areas. Ph.D. thesis. Department of Environmental and Water Resources Engineering. Vanderbilt University. Nashville, TN. 1993.
LeChevallier, M.W., W.D. Norton, and R.G. Lee. “Occurrence of Giardia and Cryptosporidium spp. in surface water supplies.” Applied and Environmental Microbiology. Vol. 57, No. 9, pp. 2610 - 2616. 1991a.
LeChevallier, M.W., W.D. Norton, and R.G. Lee. “Giardia and Cryptosporidium in filtered drinking water supplies.” Applied and Environmental Microbiology. Vol. 57, No. 9, pp. 2617 - . 1991b.
LeChevallier, M.W. and W.D. Norton. “Giardia and Cryptosporidium in raw and finished water.” Journal of the American Water Works Association. Vol. 87, No. 9, pp. 54 - . September 1995.
LeChevallier, M.W., W.D. Norton, and T.B. Atherhold. “Protozoa in open reservoirs.” Journal of the American Water Works Association. Vol. 89, No. 9, pp. 84 – 96. September 1997.
Locke, L.N. “Diseases and parasites in urban wildlife.” In: Symposium on Wildlife in an Urbanizing Environment. Planning and Resource Development Series No. 28, U. of Mass. June 1974.
Loijens, H.S. Status Report on the Rideau River Stormwater Management Study. Rideau River Stormwater Management Study, Ottawa, and the Ontario Ministry of the Environment, Kingston, Ontario. June 1981.
Mac Kenzie, W.R., N.J. Hoxie, M.E. Proctor. M.S. Gradus, K.A. Blair, D.E. Peterson, J.J. Kazmierczak, D.G. Addiss, K.R. Fox, J.B. Rose, and J.P. Davis. “A massive outbreak in Milwaukee of cryptosporidium infection transmitted through the public water supply.” The New England Journal of Medicine. Vol. 331, No. 3. Pp. 161-167. July 21, 1994.
Maguire, S. and D. Walker. “Pfiesteria piscicida implicated in fish kills in Chesapeake Bay tributaries and other mid-Atlantic estuaries.” WSTB. A Newsletter from the Water Science and Technology Board. National Research Council. Washington, D.C. Vol. 14, No. 4, pp. 1 – 3. October/November 1997.
Marron, J.A. and C.L. Senn. “Dog feces: A public health and environment problem.” J. of Environmental Health. 37 (3):239. Nov/Dec. 1974.
Matson, E.A., S.G. Hornor, and J.D. Buck. “Pollution indicators and other microorganisms in the river sediment.” Journal WPCF. Jan. 1978.
McElroy, F.T.R. and J.M. Bell. Stormwater Runoff Quality for Urban and Semi-Urban/ Rural Watersheds. Purdue University Water Resources Research Center. Feb. 1974.
McSwain, M.R. “Baseline levels and seasonal variations of enteric bacteria in oligotrophic streams.” In: Watershed Research in Eastern North America, Vol.II, D.L. Correll. NTIS No. PB-279 920/3SL. 1977.
Metcalf & Eddy. Draft 1993 Flow and Quality Monitoring Program and Results. Prepared for the Massachusetts Water Resources Authority. Boston, Massachusetts. March 1994.
Monson, R.R. Occupational Epidemiology. CRC Press. Boca Raton, FL. 1980.

74
MTA (Management Training Audioconferences). Participant Program Guide: Cryptosporidium and Water. 1997 Management Training Audioconference Seminars. Public Health Foundation. National Center for Infectious Diseases, CDC. Atlanta, GA. 1997.
Mundt, J.O. “Occurrence of enterococci in animals in a wild environment.” Applied Microbiology. 11:136-140. 1963.
Olivieri, V.P., C.W. Kruse and K. Kawata. “Selected pathogenic microorganisms contributed from urban watersheds.” In: Watershed Research in Eastern North America, Vol.II, D.L. Correll. NTIS No. PB-279 920/3SL. 1977a.
Olivieri, V.P., C.W. Kruse, K. Kawata, and J.E. Smith. Microorganisms in Urban Stormwater. U.S. Environmental Protection Agency. EPA-600/2-77-087. PB-272245. Cincinnati, Ohio. 1977b.
Ontario Ministry of the Environment. Physical-Chemical Treatment and Disinfection of Stormwater. Project No. 72-1-22. 1982.
Ontario Ministry of the Environment (OME). Rideau River Stormwater Management Study. Toronto, Ontario. 1983. Oplinger, C.S. Waterfowl Populations and Water Quality Relationships in the Allentown Park System. City of
Allentown, Pa. Oct. 1977. O’Shae, M. and R. Field. “Detection and disinfection of pathogens in storm-generated flows.” Canadian Journal of
Microbiology. Vol. 48, no. 4, pp. 267-276. April 1992. O’Shae, M. and R. Field. “An evaluation of bacterial standards and disinfection practices used for the assessment
and treatment of stormwater. Advances in Applied Microbiology. Acad. Press, Inc. Vol. 37, no. 21-36. 1992. Pitt, R. and M. Bozeman. Lake Merritt Management Plan. City of Oakland, Ca. May 1979. Pitt, R. and M. Bozeman. Sources of Urban Runoff Pollution and Its Effects on an Urban Creek, EPA-600/S2-82-
090, PB 83-111-021. U.S. Environmental Protection Agency, Cincinnati, Ohio. 142 pgs. 1982. Pitt, R. Urban Bacteria Sources and Control in the Lower Rideau River Watershed, Ottawa, Ontario, Ontario
Ministry of the Environment, ISBN 0-7743-8487-5. 165 pgs. 1983. Pitt, R.E., and P. Bissonnette. Bellevue Urban Runoff Program, Summary Report. PB84 237213. Water Planning
Division, U.S. Environmental Protection Agency, Washington, D.C., December 1983. Pitt, R. Characterizing and Controlling Urban Runoff through Street and Sewerage Cleaning. U.S. Environmental
Protection Agency, Storm and Combined Sewer Program, Risk Reduction Engineering Laboratory. EPA/600/S2-85/038. PB 85-186500. Cincinnati, Ohio. 467 pgs. June 1985.
Pitt, R. and J. McLean. Humber River Pilot Watershed Project, Ontario Ministry of the Environment, Toronto, Canada. 483 pgs. June 1986.
Pitt, R., M. Lalor, R. Field, D.D. Adrian, and D. Barbe’. A User's Guide for the Assessment of Non-Stormwater Discharges into Separate Storm Drainage Systems. U.S. Environmental Protection Agency, Storm and Combined Sewer Program, Risk Reduction Engineering Laboratory. EPA/600/R-92/238. PB93-131472. Cincinnati, Ohio. 87 pgs. January 1993.
Pitt, R., S. Clark, K. Parmer, and R. Field. Groundwater Contamination from Stormwater Infiltration. Ann Arbor Press. Chelsea, Michigan. 218 pages. 1996.
Pitt, R. and M. Lalor. Identification and Control of Non-Stormwater Discharges into Separate Storm Drainage Systems. Development of Methodology for a Manual of Practice. U.S. Environmental Protection Agency, Water Supply and Water Resources Division, National Risk Management Research Laboratory, Cincinnati, Ohio and The Urban Waste Management and Research Center, Univ. of New Orleans. 451 pgs. To be published in 1997.
Pontius, F.W. Characterization and Treatment of Stormwater Runoff. NTIS No. PB-287 576/3SL. 1977. Qureshi, A.A. and B.J. Dutka. “Microbiological studies on the quality of urban stormwater runoff in southern
Ontario, Canada.” Water Research 13:977-985. 1979. Resnick, S. and K.J. Decook. Hydrological and Environmental Controls on Water Management in Semiarid Urban
Areas. NTIS No. PB 81-109704. 1980. Rideau River Stormwater Management Study. Bacteriological Data at Beaches, 1976-1980. Rideau River
Stormwater Management Study, Ottawa, and the Ontario Ministry of the Environment, Kingston, Ontario. 1981.
Regional Municipality of Ottawa-Carleton. Report on Pollution Investigation and Abatement. Ottawa, Ontario. Sept. 1972.
Rose, J.B., C.P. Gerba, and W. Jakubowski. “Survey of potable water supplies for Cryptosporidium and Giardia.” Environmental Science & Technology. Vol. 25, No. 8. Pp. 1393 - . 1991.

75
Rosen, J.S., et al. “Development and analysis of a national protozoa database.” Proceedings of the 1996 American Water Works Association Water Quality Technical Conference. Boston, MA. 1996.
Schillinger, J.E. and D.G. Stuart. Quantification of Non-Point Water Pollutants from Logging, Cattle Grazing, Mining, and Subdivision Activities. NTIS No. PB 80-174063. 1978.
Seidler, R.J. Point and Non-Point Pollution Influencing Water Quality in a Rural Housing Community. US Dept of Interior, Office of Water Res. and Tech. Projects. A-045. Nov. 1979.
Setmire, J.G. and W.L. Bradford. Quality of Urban Runoff, Tecolote Creek Drainage Area, San Diego County, Ca. NTIS No. PB 81-159451. 1980.
Seyfried, P.L., R.S. Tobin, N.E. Brown, and P.F. Ness. “A prospective study of swimming-related illness, II Morbidity and the microbiological quality of water.” American Journal of Public Health. Vol. 75, no. 9, pp. 1071-1075. September 1985.
SMBRP (Santa Monica Bay Restoration Project). An Epidemiological Study of Possible Adverse Health Effects of Swimming in Santa Monica Bay. Santa Monica Bay Restoration Project. Monterey Park, CA. October 1996.
Snoeynbos, G.H., E.W. Morin, and D.K. Wetherbee. “Naturally occurring salmonella in ‘blackbirds’ and gulls.” Avian Diseases. 11:642-646. 1967.
Sparrow, E.B., C.V. Davenport, and R.C. Gordon. “Identification of fecal indicator bacteria persisting in an ice-covered river.” In: Abstracts of the Annual Meeting of the Amer. Soc. for Microbiology. 1978.
States, S., K. Stadterman, L. Ammon, P. Vogel, J. Baldizar, D. Wright, L. Conley, and J. Sykora. “Protozoa in river water: Sources, occurrence, and treatment.” Journal of the American Water Works Association. Vol. 89, No. 9, pp. 74 – 83. September 1997.
Stevenson, A.H. “Studies of bathing water quality and health.” American Journal of Public Health. Vol. 43, pp. 529-538. May 1953.
Sylvester, R.O. An Engineering and Ecological Study for the Rehabilitation of Green Lake. University of Washington. 1960.
Van Donsel, D.J., E.E. Geldreich, and N.A. Clarke. “Seasonal variations in survival of indicator bacteria in soil and their contribution to storm-water pollution.” Applied Microbiology. 15,6:1362-1370. Nov. 1967.
Waller, D.H. and Z. Novak. Municipal Pollutant Loads to the Great Lakes from Ontario Communities. Canada/Ontario Agreement Research Report, Ottawa, Ontario (undated).
Waller, D.H. and Z. Novak. “Pollution loading to the Great Lakes from municipal sources in Ontario.” Journal WPCF. March 1981.
Water Environment & Technology. “News Watch: U.S. water quality shows little improvement over 1992 inventory.” Vol. 8, no. 2, pp. 15 - 16. Feb. 1996a.
Water Environment & Technology. “News Watch: Sewer separation lowers fecal coliform levels in the Mississippi River.” Vol. 8, no. 11, pp. 21 - 22. Nov. 1996b.
Water Environment & Technology. “Research Notes: Beachgoers at Risk from urban runoff.” Vol. 8, no. 11, pg. 65. Nov. 1996c.
Water Environment & Technology. “EPA program aims to make visiting the beach safer.” Vol. 9, No. 8, pg. 11. August 1997. Weibel, S.R., R.J. Anderson, and R.L. Woodward. “Urban land runoff as a factor in stream pollution.” Journal WPCF. 36:914-924. July 1964.
Zimmerman, T. “How to revive the Chesapeake Bay: Filter it with billions and billions of oysters.” U.S. News & World Report. Pg. 63. December 29, 1997/January 5, 1998.