university of alaska fairbanks pollock conservation ... · university of alaska fairbanks pollock...
TRANSCRIPT

1
University of Alaska Fairbanks Pollock Conservation Cooperative Research Center
Project Title: Annual progress report on: Evaluation of diet composition and plane of nutrition of free-ranging harbor seals (Phoca vitulina) from Tugidak Island, Alaska in warm and cool climatic periods.
PI: Shannon Atkinson, Ph.D. Professor Juneau Center UAF/SFOS Fisheries Division 17101 Pt. Lena Loop Road Juneau, Alaska 99801 (907)796-5453 [email protected]
Master’s Candidate: Gretchen L. Geiger1*,
Co-PI’s: Gail M. Blundell2, James R. Carpenter3, Jason Waite1, Kate Wynne1, 4 1School of Fisheries and Ocean Sciences, University of Alaska Fairbanks 17101 Point Lena Loop Rd, Juneau AK 99801 2Alaska Department of Fish & Game, Juneau, AK 99801 3Department of Human Nutrition Food and Animal Science, University of Hawaii at Manoa, Honolulu, HI 96822 4Alaska Sea Grant Marine Advisory Program, Kodiak, AK 99615
Abstract
Oscillating cool and warm climatic periods have the ability to alter the basic structure and components of an ecosystem which can impact the dietary base of a predator. Changes to diet can have significant impacts on predator populations.
A time series of harbor seal scat samples were collected from Tugidak Island, Alaska, during the summer from 2001 to 2009. Hard-part remains from scats were identified to the lowest possible taxon and approximate prey composition of the diet was determined from frequency of occurrence (FO) and biomass (BM) calculations. The nutritional profile of estimated diets was determined using a prey nutritional database developed from proximate analyses of various prey found in Alaskan waters.
Diet profiles constructed by BM estimations appear to provide a more realistic representation of actual diets due to biases associated with FO data. BM prey contribution of salmon species correlated with sea surface temperature (SST; 0.703, p < 0.10) and cephalopod (-0.663, p < 0.10), gunnel (-0.722, p < 0.05), and Gymnocanthus spp. (-0.753, p < 0.05) correlated negatively with SST. The plane of nutrition was calculated by BM estimations; protein (13.47-17.49% of diet), lipid (1.57-4.90% of diet), and gross energy (0.65-1.37kcal/g of diet) of the average diet

2
varied across collection years. Lipid content and gross energy of diets fluctuated within a collection year relating to pupping and molting periods.
Combining the prey database and plane of nutrition across years provides insight regarding the role of nutrition in evaluating changes in pinniped populations. Identification of the components of harbor seal diets allows for detection of potential competition for fish resources.
Introduction
Harbor seals (Phoca vitulina) are members of the Phocidae family in the suborder Pinnipedia. The pinnipeds include three monophyletic families: Phocidae, the true, earless seals which include harbor seals; Otaraiidae, eared or furred seals including sea lions and fur seals; and Odobenidae, the walruses. Harbor seals are a medium sized member of the pinniped order with male harbor seals weighing up to 170kg and 1.9m in length and females usually slightly smaller at 1.7m and 130k (Reeves et al. 2002, Perrin et al. 2008). There are five recognized subspecies of harbor seal that range throughout much of the northern hemisphere. P.v. richardii are found from the eastern Aleutian Islands through the southern coast of Alaska, and along the Pacific coast of North America down to Baja, California (Reeves et al. 2002, Perrin et al. 2008). Harbor seals forage and mate in the water but come ashore at various haul-out sites to pup and molt in two distinct periods during the summer months.
Prior to the 1970s the harbor seal population at Tugidak Island (56°27’04”N, 154°01’05”W) in the western Gulf of Alaska (Figure 1) was the location of haul-out sites that were potentially among the largest concentrations of harbor seals in the world (Pitcher 1990). Nearly 17,000 seals were counted in the area in the mid-1950s and because these counts represent minimum numbers, the total population was likely larger (Mathisen & Lopp 1963). Based on biological rates of the population and harvest records, it is estimated that up to 20,500 animals may have utilized these beaches as haul-out sites for pupping and molting during the mid-1960s (Pitcher 1990).
However, between 1976 and the early 1980s the harbor seal population at Tugidak Island declined significantly (Pitcher 1990, Jemison et al. 2006). It is estimated that the population declined by as much as 85% between 1976 and 1988, with a yearly population reduction of up to 19% from 1976 to 1982 (Pitcher 1990). As of the mid-1990s, the population had stabilized and the population began to exhibit a moderate recovery (Jemison & Pendleton 2001, Small et al. 2003, Jemison et al. 2006). The Tugidak Island population increased at approximately 8.3% year-
1 and 3.4% year-1 between 1994 and 2000 for the pupping and molting periods respectively (Jemison et al. 2006) and 6.6% year-1 from 1993 to 2001 for the entire population surrounding Kodiak Island, including Tugidak Island (Small et al. 2003). Though this trend continues, the harbor seal population at Tugidak Island is still far reduced from its historic numbers (Jemison et al. 2006).
The reasons behind this dramatic population decline have yet to be fully elucidated. There are several prevailing theories as to the causes of the initial decline, and in many cases, to the continued decline or slow recovery of pinniped populations. The concept that a change in the basic components of pinniped diets led to either a reduction in prey availability or prey quality contributed to the decline is commonly known as the ‘nutritional stress hypothesis’ (Alverson 1991, Rosen & Trites 2000, Trites & Donnelly 2003). Nutritional stress is defined as an adverse

3
physiological or behavioral state that results from sub-optimal foraging opportunities (Trites & Donnelly 2003). Nutritional stress may manifest itself in the form of reduced body size and birth rates, increased pup and juvenile mortality, and modifications to behavior (Rosen & Trites 2000, Trites & Donnelly 2003, Atkinson et al. 2008), all of which have the capability of contributing to population declines.
Simple reductions in prey availability may not be the only factor driving this hypothesis. Even if prey species are abundant, shifts in the nutritional value of available prey species may also impact pinniped populations. A sub-hypothesis to the nutritional stress hypothesis, the ‘junk food hypothesis,’ proposes that a regime shift of high-quality prey species to nutritionally inferior prey can contribute to reductions in pinniped population size (Alverson 1991, Rosen & Trites 2000, Trites & Donnelly 2003). Therefore, it is important to understand what the components of pinniped diets are, because even though prey species may be present in abundance, if the available prey species are not of sufficient nutritional quality, the pinnipeds may become subject to nutritional stress.
There are multiple avenues by which a change in diet quantity or quality might be brought about. Two of the most prominent theories for driving massive changes to the prey base are competition with fisheries that may lead to overfishing, and climatic oscillations that may lead to changes in prey distribution. Competition with fisheries for prey resources can have significant direct impacts on harbor seals in several ways. Should harbor seals and commercial fisheries be primarily targeting similar species then there is increased potential for the target species to be overfished and go into decline (Jemison & Kelly 2001) and the seals would then have to turn to other, less profitable prey. A change in diet is not the only danger that the harbor seals face when they compete with fisheries. Prior to the start of the harbor seal decline harbor seals were commercially harvested and approximately 18,000 seals (90% of which were pups) were harvested between the early 1960s and 1972 (Pitcher 1990, Jemison & Kelly 2001). While many of these seals were harvested for their pelts, bounties were also put out on harbor seals in an attempt to curb competition with fisheries (Alverson 1991). Furthermore, various pinnipeds, including harbor seals and Steller sea lions (Eumetopias jubatus), were often shot to prevent them from pillaging fishing gear (Alverson 1991, Perrin et al. 2008). As the populations of both harbor seals and humans increases, these fisheries interactions and competition for resources may increase and intensify.
Climatic regime shifts can also cause dramatic alterations to ecosystem structure which can significantly alter the prey base of harbor seals. In the late 1970s a dramatic change in species composition of the North Pacific was noted (Anderson & Piatt 1999, Mantua & Hare 2002). The species structure of the North Pacific went from one that was dominated by shrimp to one that is dominated by large, piscivorous fishes like walleye pollock, Theragra chalcogramma; (Anderson & Piatt 1999). Large scale regime and climatic shifts, like the Pacific Decadal Oscillation (PDO), are certainly able to drastically alter the distribution of prey in the North Pacific, but small scale climatic oscillations also have the ability to affect both the distribution and recruitment of prey (McGowan et al. 1998, Mantua & Hare 2002). Multi-year warm and cool periods, as determined by sea surface temperature (SST) anomalies operate on a smaller temporal scale. Studying these smaller shifts that happen on a more frequent basis allows scientists to speculate how more dramatic climatic oscillations may impact predator-prey relationships in the future.

4
Average diet composition may also change within a sampled year based on what time of year it was collected. Harbor seals haul-out on land during two specific time periods in the early and late summer in order to pup and to molt. During these times, the seals are hauled-out more frequently and for longer periods of time than during other times of year and may employ central-place foraging to maintain their tie to their haul-out site (Perrin et al. 2008). As a consequence they may not be able to make extended foraging trips and may not have access to pelagic prey. Furthermore, differential dietary needs by the harbor seals during either of these periods, in addition to seasonal availability of prey species may play a role in the dietary composition of the harbor seals.
In order to ascertain the potential for change in diet, composition hard-parts analysis of scats is often employed. Hard-parts analysis of scats is a common, cost-effective, non-invasive method employed to evaluate the diet composition of captive and free-ranging pinnipeds (Pitcher 1980, Cottrell et al. 1996, Merrick et al. 1997, Berg et al. 2002, Andersen et al. 2004, Casper et al. 2006, Tollit et al. 2006). The frequency of prey species identified in scats is expected to portray the relative frequencies that these prey items will have in a normal diet (Berg et al. 2002, Andersen et al. 2004). However, as a result of the differential fragility of prey hard parts and therefore, susceptibility to digestion, some prey species may be under-represented or absent in the diet analysis (da Silva & Neilson 1985, Tollit et al. 1997, Berg et al. 2002, Tollit et al. 2003, Andersen et al. 2004). Size estimations of prey species may also be underestimated due to the dissolution of bones during digestion. Thus, all diet estimations should be viewed as minimum estimations. Multiple studies have been conducted in an attempt to quantify the biases associated with the complete or partial digestion of hard-parts (da Silva & Neilson 1985, Jobling & Breiby 1986, Harvey 1989, Tollit et al. 1997, Bowen 2000, Arim & Naya 2003, Tollit et al. 2003, Trites et al. 2005, Tollit et al. 2006).
Scat analysis is also limited in its ability to depict the diet over temporal and spatial scales (Tollit et al. 2003, Andersen et al. 2004). Harbor seals only utilize haul-out sites in high volumes during their summer pupping and molting periods so the only opportunity to collect scats coincides with these two events, both of which occur during the summer months from May to September (Jemison & Kelly 2001, Daniel et al. 2003). Because harbor seals may be required to central-place forage during these time periods, they may not partake in extended foraging trips to access more pelagic prey that they would have access to during other times of year. In fact, tagging studies of pups from Tugidak Island may demonstrate that pups may travel farther offshore due to relatively less prey availability nearshore in the waters immediately surrounding Tugidak Island (Small et al. 2005). As a consequence of these longer foraging trips and relatively pelagic lifestyle for much of the year, during which seals may defecate in the water preventing collection of the scats, scat analysis is not an effective technique for examining diet during these periods.
Due to rate of passage of prey species through the digestive tracts of harbor seals, prey items that are consumed during one foraging trip may not be expelled at the same rate (Prime 1979, Harvey 1989, Bowen 2000, Tollit et al. 2006). These prey items that have a longer retention time in the digestive systems of the harbor seals may be subjected to more intense dissolution which may render these bones unidentifiable (Harvey 1989, Cottrell et al. 1996, Bowen 2000), perhaps leading to underestimation of these prey species. Therefore, scat analysis is not expected to show a complete diet profile of an individual, but is rather intended to provide a snapshot of an individual’s diet at one point in time, which, when compared to other scat samples collected over

5
the course of a time series, may provide a more complete portrait of the average dietary profile. For this study, it was assumed that each scat was the equivalent of one meal or foraging bout for an individual harbor seal and that each prey item that was identified was completely consumed by the seal.
The method employed to reconstruct diets from hard-parts analysis from scats also has the potential to impact the estimated diet. Two diet calculation methods commonly employed are frequency of occurrence and biomass reconstruction. Both are utilized to estimate the relative importance of prey items found in diets and each have biases and assumptions associated with them. Split-sample frequency of occurrence (ssFO) calculations utilize only presence or absence data for a prey species to calculate it’s relative importance to the diet using the number of times it appears in a collection of scats (Olesiuk et al. 1990, Merrick et al. 1997). ssFO operates on two primary assumptions; 1) that all of the prey species identified in the scats represent all prey items consumed in the latest meal of the harbor seal and 2) that all of the prey species in this meal were consumed in equal quantities (Olesiuk et al. 1990).
Biomass reconstruction estimates (BioM) can be calculated for prey species that occurred in greater than 10% of scats as determined by frequency of occurrence calculations. Biomass reconstruction methods utilized estimated lengths of consumed prey items data, minimum number of individuals consumed data, and length-weight regression equations for individual species from published literature to obtain the approximate mass of the consumed prey items. Due to dissolution of prey hard-parts, estimated fish lengths may have been underestimated, skewing biomass estimations down (Harvey 1989, Tollit et al. 2006). Therefore, biomass estimations should be viewed as minimum estimations. It was assumed that the harbor seal consumed the entire calculated biomass.
As stated in the nutritional stress hypothesis, quantity of diet is not the only factor that must be considered. Even if prey items are available in abundance, the quality of these prey items in terms of nutrient composition also can have significant implications for pinnipeds. When switched from a high energy density diet of herring (6.40-7.58 kJ g-1) to a low energy density diet of pollock (4.54-4.72 kJ g-1), Steller sea lions lost significant body mass because they were unable to increase their intake of pollock by the average 56% necessary in order to compensate for the decreased energy density of their prey (Rosen & Trites 2000). Similar results were found in juvenile harp seals (Phoca groenlandica), whose body fat declined by an average of 32% over the course of the 30 day diet switch to low energy density pollock (Kirsch et al. 2000). A loss in body fat can have substantial effects on the ability of pinnipeds to survive because many species need to rely on sufficient stores of body fat during times of fast (Reeves et al. 2002, Perrin et al. 2008). Therefore, even though a seal may have access to an abundance of prey species, if these prey are nutritionally inferior, then the seals may still be subject to nutritional stress.
Quality of harbor seal diets was assessed using the MIXIT-WIN computer software program (Agricultural Software Consultants Inc., San Diego, CA). This program is designed to construct diets for agricultural uses by allowing the user to construct proposed diets for feeds within a budget, while still maintaining the nutritional requirements of the animals. The MIXIT program has previously been adapted to successfully evaluate the nutritional profiles of diets of captive pinnipeds using an imported prey database consisting of proximate analysis data for whole prey items. This study describes the MIXIT program’s first application for use with diets of free-ranging pinnipeds using a prey database constructed from whole fish proximate composition data

6
from published literature for species found in Alaskan waters. Using the MIXIT programs the quality of the diets of harbor seals, in terms of protein content, lipid content, ash content, and gross energy (GE) value, may be evaluated.
The objectives for this study are to 1) describe the diet of harbor seals from Tugidak Island from 2001 to 2009, 2) assess differences in diets of harbor seals during the breeding or molting periods, 3) compare the relative importance of prey species in diets calculated using two different calculation methodologies (ssFO and BioM), 4) calculate the nutritional profile of harbor seal diets utilizing the MIXIT-WIN program, and 5) determine if dietary changes to prey contribution or nutritional profile correlate with oscillations in SST anomalies recorded in the waters surrounding Tugidak Island and throughout the Gulf of Alaska during this time series.
Methods
Sample Collection and Processing Harbor seal scats were collected by the Alaska Department of Fish and Game (ADF&G) from the middle and southwestern beaches of Tugidak Island, Alaska (Fig. 1) during the summer months (May to September) from 2001 to 2009. Samples that were collected between May1 and July 14 were considered to have been collected during the breeding season and scats collected from July 15 to September 30 represent the diets of harbor seals during the molting period. These date assignments were based off of historic dates of peak pupping and molting periods on Tugidak Island (Jemison & Kelly 2001, Daniel et al. 2003) and when collections occurred during these periods. These groups of samples will hereafter be referred to as the breeding and molting period samples. Breeding period samples were only collected during the even numbered years, but molting period scats were collected for every year throughout the time series. To standardize yearly calculations across all years, breeding period samples were excluded from analysis so that all years represented collections that occurred in the same time frame and that diet differences between years were not functions of comparing years for which breeding samples were available to those years that did not have any breeding period samples. Scats were scooped into ziplock bags and frozen until further processing could take place. Frozen scats were thawed and thawed scats were washed through a set of nested sieves (1000µm, 710µm, 500µm) with the aid of a dissolution agent (dish-soap) to aid in breaking up the scat without damaging the hard-part remains. Suspected prey hard-part remains were picked out of the sieve mesh using forceps and placed in an individual ziplock bag.
These isolated hard-parts were then sent to Pacific IDentifications Inc. (British Columbia, Canada) to be identified to the lowest possible taxon using an extensive reference collection. An excel spreadsheet was provided by Pacific IDentifications Inc. (PacID) which contains species identifications for all of the samples, provides a confidence code for the positive identification, lists the specific structures that were used to make the identification and their condition, gives the minimum number of individuals of each species per scat, and estimates the approximate length of each individual identified. Scats without identifiable prey items (confidence code < 20) were removed and were not considered in further analysis.
Unidentified octopus beaks were individually examined and were all positively identified as giant Pacific octopus (Enteroctopus dofleini). Hereafter, use of the cephalopods category will refer to primarily giant Pacific octopus (GPO). Samples that contained salmon species (Oncorhynchus sp.) were also re-examined in an attempt to determine species consumed using

7
vertebrae morphometrics (Huber et al. 2011). Chinook salmon (Oncorhynchus tshawytscha) was ascribed its own category, while pink (Oncorhynchus gorbuscha) and coho (Oncorhynchus kisutch) were paired in a category, as were chum (Oncorhynchus keta) and sockeye (Oncorhynchus nerka) salmon. Since approximate salmon length was estimated based on unknown species, all salmon biomass was also estimated as unidentified salmon and species specific data were applied at the nutritional level in the MIXIT program by taking the estimated total salmon contribution and calculating the approximate proportion of each species’ contribution to the average diet.
Diet Calculations The data returned from PacID were used to calculate the Shannon diversity index for each collection period within a year.
Split-sample frequency of occurrence (ssFO) was calculated from the species identification data returned by PacID for each collection period (Olesiuk et al. 1990). The ssFO for each prey species within a collection period was calculated as follows:
!!"#!" = (!!"/ !!"
!
!!!
)/! ! = 1,… ,! (! = # different prey species)!
!!!
where Oki is a binary variable to indicate whether the kth species is present or absent (0 = absent, 1 = present) in the ith sample (Olesiuk et al. 1990). Therefore, if a single species occurred in a sample it was assigned a ssFO value of 1, whereas if two prey species were observed in a sample, each was scored 0.5 and so on. The sum of the scores for all species in all samples is represented by N (Olesiuk et al. 1990).
A species average ssFO was then taken for all samples in a collection period to represent the average relative importance that that prey species contributed to the average diet during that collection period. These values were interpreted as a species percent contribution to the average diet as the values summed to 1.
Estimates of biomass (BioM) consumed were calculated using length-weight regression equations for each species pulled from published literature and the approximate length estimations provided by PacID. BioM estimations were only calculated for those prey species that were identified in greater than 10% of scats for any given collection month as determined from frequency of occurrence calculations.
In an attempt to increase the accuracy of BioM calculations, individual bones or hard-parts from Irish lord spp. (Hemilepidotus spp.; various bones), GPO (beak morphometrics), and Pacific halibut (Hippoglossus stenolepis; otoliths) were measured using electronic calipers and appropriate published equations were used to approximate the size of the organism consumed. Length-weight regression equations could not be located for buffalo type sculpin (Enophrys spp.) so this species category was dropped from further consideration.
Nutritional Analysis The average diet was calculated to represent a percent contribution for the total average diet for each collection period using both ssFO and BioM methods of calculating estimated diets of only species that occurred in the top 10% of scats as determined by frequency of occurrence

8
calculations. This was done so that the nutritional composition of the average diet as calculated by both ssFO and BioM methods could be compared using the same species and units of measure. These values were entered into the MIXIT program to analyze the nutritional profile of the average diet for each collection period.
The MIXIT-WIN program (Agricultural Software Consultants Inc., San Diego, CA) was used to evaluate the nutritional composition of the estimated diets. The nutritional database that was imported into the MIXIT program for this study consisted of proximate composition data taken from published literature for prey species found in Alaskan waters. Where multiple sources of proximate composition values for an individual prey species were available, the source used in this study was selected based on the sample size in the study that the values were derived from and then based on location where the samples were collected if multiple sources had comparable sample sizes. Where available, seasonal variation in prey nutrient composition data was taken into account (e.g. sand lance, Ammodytes hexapterus, proximate analysis in June compared to September).
Individual diet formuli were created in the MIXIT program to represent the average diet from each collection period for both ssFO and BioM methods of diet estimation. The nutritional values acquired from the program included percent protein content, percent lipid content, percent ash content, and gross energy density in kcal g-1. All values were given on an as fed or wet weight basis.
Climatic Data Climatic oscillations were evaluated primarily through the use of sea surface temperature (SST) anomalies recorded in the Gulf of Alaska (GOA) from 1997 to 2010 (Applied Physics Lab, University of Washington). Wide scale SST anomaly oscillations were calculated for the entire GOA from 1997 to 2010 in an attempt to account for large scale ecosystem processes throughout the GOA that might impact harbor seal prey survival and abundance elsewhere from Tugidak Island. Smaller scale SST anomalies were calculated for the waters surrounding Tugidak Island that we expect the harbor seals to be utilizing based on prior tracking studies on harbor seals from Tugidak Island (Small et al. 2005). This should account for climatic oscillations that occurred in the waters that the harbor seals primarily reside and forage in.
Correlations were run between each prey species percent contribution to diet, for both ssFO and BioM calculations, and SST anomaly around Tugidak Island to determine if variation in prey species prevalence in harbor seal diets could be explained by changes in SST. A correlation of greater than ±0.4 was deemed to be potentially biologically significant, while a p-value less than 0.10 was considered to be statistically significant. Due to the small sample size of scats from 2001, these values were dropped when running correlations.
Correlations were also run between SST anomaly and the nutritional parameters that were calculated by the MIXIT program for each of the calculated diets. Samples from 2001 were dropped from the correlation analysis due to the small sample collection size during this year.
Results and Conclusions

9
Harbor seals were found to consume a wide variety of prey species (Table 1) and did not appear to specialize or selectively target any particular prey species.
Diets calculated by ssFO and BioM calculations varied (Figure 2). For certain species, such as Gymnocanthus spp. (Figure 2a) ssFO calculations estimated a higher prey contribution to diet than BioM calculations did while other species such as salmon spp. (Figure 2b) consistently had BioM calculations provide higher estimations of that species’ dietary component. For a few species such as halibut (Figure 2c), both ssFO and BioM calculations provided fairly equivalent estimations of prey importance in total average diet.
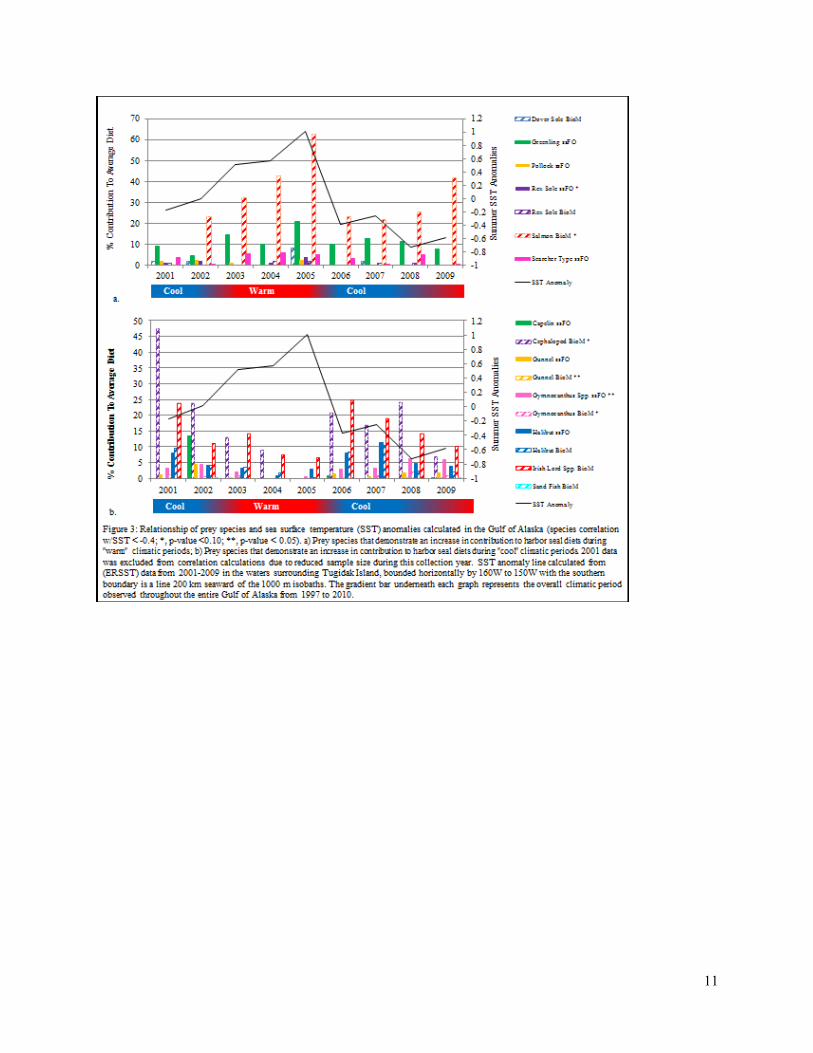
Prey species that exhibit a positive correlation greater than ±0.4 between relative importance to average diet and SST were considered to be biologically significant. Species that expressed a correlation with SST are shown in Figure 3. Species and calculation method that exhibited a positive correlation with SST anomalies (Figure 3a) include dover sole (Microstomus pacificus; BioM: 0.5965, p-value: 0.1185), greenling spp. (Hexagrammos spp.; ssFO: 0.6034, p-value: 0.1133), walleye pollock (Theragra chalcogramma; ssFO: 0.5818, p-value: 0.1303), rex sole (Glyptocephalus zachirus; ssFO: 0.6789, p-value: 0.0641; BioM: 0.5926, p-value: 0.1216), salmon spp. (BioM: 0.6802, p-value: 0.0634), and searcher type sp. (Bathymaster spp.; ssFO: 0.5003, p-value: 0.2067). Out of the species that exhibited a positive correlation with SST anomalies, salmon and rex sole were both statistically significant at p < 0.10.
Prey species and calculation method that exhibited a negative correlation with SST anomalies (Figure 3b) include capelin (Mallotus villosus; BioM: -0.4380, p-value: 0.2778), cephalopods (BioM: -0.6461, p-value: 0.0835), gunnel spp. (ssFO: -0.4644, p-value: 0.2464; BioM: -0.7328, p-value: 0.0386), Gymnocanthus spp. (ssFO: -0.8864, p-value: 0.0034; BioM: -0.6470, p-value: 0.0829), halibut (ssFO: -0.5058, p-value: 0.2010; BioM: -0.4029, p-value: 0.3223), Irish lord spp. (BioM: -0.5444, p-value: 0.1630), and sand fish (Trichodon trichodon; BioM: -0.4192, p-value: 0.3012). The correlation between cephalopod and Gymnocanthus spp. BioM calculations and SST was statistically significant at p < 0.10 and gunnel BioM and Gymnocanthus spp. ssFO were both statistically significant at p < 0.05.
Species Diversity As calculated by the Shannon Diversity index (Figure 4) diversity did not appear to vary from 2001 to 2009 (molting period range 1.34 – 1.95; breeding period range 1.22 – 1.62). The Shannon Diversity index for breeding season sample collection periods was always lower than that year’s corresponding molting period and, with the exception of 2001, the breeding season indices were always lower than all of the molting period indices. Small sample sizes from 2001 may have impacted the Shannon Diversity index in that the full range of prey species consumed may not have been accurately represented, thereby lowering the estimated diet diversity.
Nutritional Composition of Diets The nutritional composition of the average diet for a single year varied depending on the collection year, the nutritional parameter being examined, and the method used to estimate the average diet (Figure 5). When calculated by ssFO methods protein content of the average diet ranged from 14.27 to 16.08 percent, lipid content from 2.64 to 3.85 percent, ash content from 2.57 to 2.96 percent, and gross energy (GE) density from 1.01 to 1.23 kcal g-1. When BioM estimations were used to calculate the average diet, protein content ranged between 13.47 and

10
17.49 percent, lipid between 1.567 and 4.90 percent, ash between 2.00 and 2.54, and GE density from 0.66 and 1.37 kcal g-1.
When correlations were run for the nutritional data and SST anomalies only ash content as calculated by ssFO methods was found to have a correlation greater than ±0.4 (correlation: 0.5185, p-value: 0.1880). However, even though the correlations were not greater than ±0.4, the correlation values for protein differ widely depending on the method of diet calculation with the correlations being almost completely inverse of each other (ssFO: correlation: -0.3676, p-value: 0.3703; BioM: correlation: 0.3552, p-value: 0.3880). GE correlations also showed disparity between diet calculation methods, although this appeared to be less dramatic (ssFO: correlation: -0.1754, p-value: 0.6778; BioM: correlation: 0.0313, p-value: 0.9413).
When nutritional composition of diets within a collection year was examined for differences in the nutritional parameters between the breeding and molting seasons, no discernible trend was observed (Figure 6). The only parameter that seemed to show some pattern between seasons was the ash content of the average diet with ash being higher during the breeding season for both calculation methods, for all years except for the ssFO diet in 2004 (Figure 6c).
Figures/Tables
11

12

13
14
Species Category Sub-Category Common Name Scientific NameSST Anomaly Correlation ssFO Range BioM Range
Bathymaster Ronquil spp. Northern Ronquil Ronquilus jordani - 0.0000 - 1.9737 0.0000 - 0.0792Searcher Type spp. Searcher Bathymaster signatus + 0.2415 - 5.9524 0.0692 - 5.0648
Capelin Mallotus villosus 0 0.0000 - 13.5695 0.0000 - 0.1005Cephalopods Giant Pacific Octopus Enteroctopus dofleini - 0.0000 - 13.7815 0.0000 - 47.3725*
Squid Sp.Eelpout sp. Zoarchidae sp. Eulachon Thaleichthys pacificus 0 0.0000 - 9.3261 0.0000 - 0.3159Flatfish spp. Arrowtooth Flounder Atheresthes stomias - 0.0000 - 15.6287 0.0000 - 9.5449
Dover Sole Microstomus pacificus + 0.2252 - 10.1663 0.0475 - 8.1784Flathead Sole Hippoglossoides elassodonPacific Halibut Hippoglossus stenolepis - 0.7937 - 11.2802 0.6692 - 10.8714Petrale Sole Eopsetta jordaniRex Sole Glyptocephalus zachirus + 0.0000 - 4.1667 0.0000 - 1.7591Rock Sole Lepidopsetta sp. 0 1.9284 - 16.4189 0.8494 - 7.1989Sand Sole Psettichthys melanostictusSlender Sole Lyopsetta exilisStarry Flounder Platichthys stellatus
Gadid Pacific Cod Gadus macrocephalus 0 2.6471 - 12.9944 1.6887 - 28.1700Tomcod Microgadus proximusWalleye Pollock Theragra chalcogramma + 0.0000 - 2.7778 0.0000 - 2.3165
Gunnel Banded Gunnel Pholis fasciata - 0.0000 - 4.4353 0.0000 - 0.5124*Penpoint Gunnel Apodichthys flavidus
Herring Clupea pallasiHexagrammids Atka Mackerel Pleurogrammus monopterygius
Greenling spp. Kelp Greenling Hexagrammos decagrammus + 4.8209 - 21.1574 3.0305 - 17.1320Lingcod Ophiodon elongatus
Poacher spp. Agonidae sp. 0 0.0000 - 2.9900 0.0000 - 0.5074Prowfish Zaprora silensusRockfish Sp. Sebastes sp. Sablefish Anoplopoma fimbriaSalmon spp. Oncorhynchus sp. + 0.0000 - 16.9492 0.0000 - 62.4038*Sand Fish Trichodon trichodon 0 0.0000 - 2.6570 0.0000 - 0.6640Sand Lance Ammodytes hexapterus 0 0.0000 - 5.8454 0.0000 - 2.5320Scuplin spp. Enophrys spp. Antlered Sculpin Enophrys diceraus
Buffalo Sculpin Enophrys bisonLeister Sculpin Enophrys lucasi
Gymnocanthus spp. Armorhead Sculpin Gymnocanthus galeatus - 0.0000 - 6.2719** 0.0000 - 2.3214**Irish Lord spp. Brown Irish Lord Hemilepidotus spinosus
Red Irish Lord Hemilepidotus hemilepidotus - 4.0427 - 34.6062 6.6913 - 25.0272Yellow Irish Lord Hemilepidotus jordani
Triglops spp. Ribbed Sculpin Triglops pingelii 0 0.2755 - 9.9206 0.0214 - 1.6505Roughspine Sculpin Triglops macellus
Misc. Bigmouth Sculpin Hemitripterus boliniButterfly Sculpin Hemilepidotus papilioGreat-Type Sculpin Myoxocephalus sp. Padded Sculpin Artedius fenestralisPlain Sculpin Myoxocephalus jaokSpinyhead Sculpin Dasycottus setigerStaghorn Sculpin Leptocottus armatusWarty Sculpin Myoxocephalus verrucosus
Snailfish Liparidinae sp. Stichaeidae Arctic Shanny Stichaeus punctatus
Warbonnet sp. Decorated Warbonnet Chirolophis decoratusHigh Cockscomb Anoplarchus purpurescens
Prickleback Nutcracker Prickleback Bryozoichthys lysimusSnake Prickleback Lumpenus sagitta
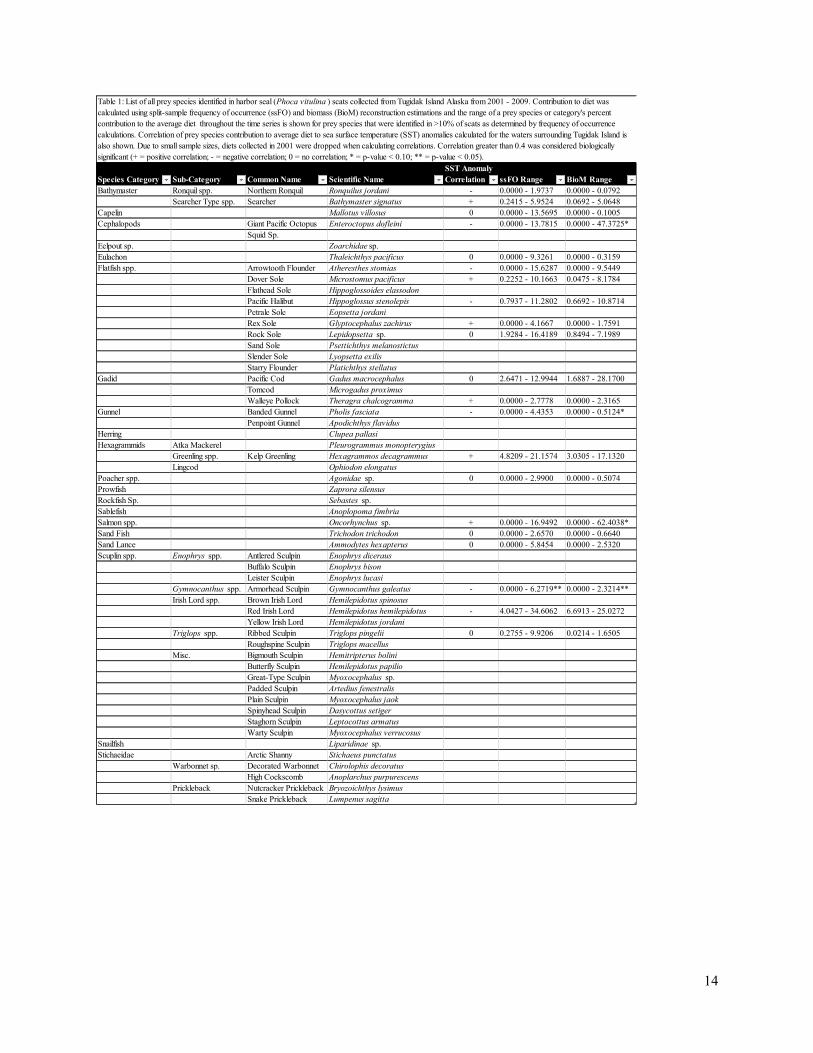
Table 1: List of all prey species identified in harbor seal (Phoca vitulina ) scats collected from Tugidak Island Alaska from 2001 - 2009. Contribution to diet was calculated using split-sample frequency of occurrence (ssFO) and biomass (BioM) reconstruction estimations and the range of a prey species or category's percent contribution to the average diet throughout the time series is shown for prey species that were identified in >10% of scats as determined by frequency of occurrence calculations. Correlation of prey species contribution to average diet to sea surface temperature (SST) anomalies calculated for the waters surrounding Tugidak Island is also shown. Due to small sample sizes, diets collected in 2001 were dropped when calculating correlations. Correlation greater than 0.4 was considered biologically significant (+ = positive correlation; - = negative correlation; 0 = no correlation; * = p-value < 0.10; ** = p-value < 0.05).

15
References
Alverson DL (1991) Commercial Fisheries and the Steller Sea Lion (Eumetropias jubatus): The Conflict Arena, Vol. Fisheries Research Institute, School of Fisheries, University of Washington
Andersen SM, Lydersen C, Grahl-Nielsen O, Kovacs KM (2004) Autumn diet of harbour seals (Phoca vitulina) at Prins Karls Forland, Svalbard, assessed via scat and fatty-acid analyses. Canadian Journal of Zoology 82:1230-1245
Anderson P, Piatt J (1999) Community reorganization in the Gulf of Alaska following ocean climate regime shift. Marine Ecology Progress Series 189:117-123
Arim M, Naya DE (2003) Pinniped diets inferred from scats: analysis of biases in prey occrrence. Canadian Journal of Zoology 81:67 Atkinson S, Calkins D, Burkanov V, Castellini M, Hennen D, Inglis S (2008) Impact of changing diet regimes on Steller sea lion body condition.
Marine Mammal Science 24:276-289 Berg I, Haug T, Nilssen KT (2002) Harbour Seal (Phoca vitulina) Diet in Vester»len, North Norway. Sarsia -- North Atlantic Marine Science
87:451-461 Bowen W (2000) Reconstruction of pinniped diets: accounting for complete digestion of otoliths and cephalopod beaks. Canadian Journal of
Fisheries and Aquatic Sciences 57:898-905 Casper R, Gales N, Hindell M, Robinson S (2006) Diet estimation based on an integrated mixed prey feeding experiment using Arctocephalus
seals. Journal of Experimental Marine Biology and Ecology 328:228-239 Cottrell P, Trites A, Miller E (1996) Assessing the use of hard parts in faeces to identify harbour seal prey: results of captive-feeding trials.
Canadian Journal of Zoology 74:875-880 da Silva J, Neilson JD (1985) Limitations of using otoliths recovered in scats to estimate prey consumption in seals. Canadian Journal of Fisheries
and Aquatic Sciences 42:1439-1442 Daniel RG, Jemison LA, Pendleton GW, Crowley SM (2003) Molting phenology of harbor seals on Tugidak Island, Alaska. Marine Mammal
Science 19:128-140 Harvey J (1989) Assessment of errors associated with harbour seal (Phoca vitulina) faecal sampling. Journal of Zoology 219:101-111 Huber HR, Jorgensen JC, Butler VL, Baker G, Stevens R (2011) Can salmonids (Oncorhynchus spp.) be identified to species using vertebral
morphometrics? Journal of Archaeological Science 38:136-146 Jemison L, Pendleton G, Wilson C, Small R (2006) Long-term trends in harbor seal numbers at Tugidak Island and Nanvak Bay, Alaska. Marine
Mammal Science 22:339 Jemison LA, Kelly BP (2001) Pupping phenology and demography of harbor seals (Phoca vitulina richardii) on Tugidak Island, Alaska. Marine
Mammal Science 17:585-600 Jemison LA, Pendleton GW (2001) Harbor seal population trends and factors influencing counts on Tugidak Island, Alaska. Harbor Seal
Investigations in Alaska Annual Report for NOAA Award NA87FX0300 Alaska Department of Fish and Game, Division of Wildlife Conservation, Anchorage, AK:31-52
Jobling M, Breiby A (1986) The use and abuse of fish otoliths in studies of feeding habits of marine piscivores. Sarsia 71:265-274 Kirsch PE, Iverson SJ, Bowen WD (2000) Effect of a low-fat diet on body composition and blubber fatty acids of captive juvenile harp seals
(Phoca groenlandica). Physiological & Biochemical Zoology 73:45 Mantua NJ, Hare SR (2002) The Pacific decadal oscillation. Journal of Oceanography 58:35-44 Mathisen OA, Lopp RJ (1963) Photographic census of the Steller sea lion herds in Alaska, 1956-1958, Vol McGowan JA, Cayan DR, Dorman LRM (1998) Climate-ocean variability and ecosystem response in the Northeast Pacific. Science 281:210 Merrick RL, Chumbley MK, Byrd GV (1997) Diet diversity of Steller sea lions (Eumetopias jubatus) and their population decline in Alaska: a
potential relationship. Canadian Journal of Fisheries and Aquatic Sciences 54:1342-1348 Olesiuk PF, Bigg MA, Ellis GM, Crockford SJ, Wigen RJ (1990) An assessment of the feeding habits of harbour seals (Phoca vitulina) in the
Strait of Georgia, British Columbia, based on scat analysis. Canadian Technical Report of Fisheries and Aquatic Science 1730:135 Perrin WF, Wursig B, Thewissen J (2008) Encyclopedia of marine mammals, Vol. Academic Press Pitcher K (1980) Stomach contents and feces as indicators of harbor seal, Phoca vitulina, foods in the Gulf of Alaska. Fishery Bulletin 78:797-
798 Pitcher KW (1990) Major decline in number of harbor seals, Phoca vitulina richardsi, on Tugidak Island, Gulf of Alaska. Marine Mammal
Science 6:121-134 Prime J (1979) Observations on the digestion of some gadoid fish otoliths by a young common seal. ICES CM:1-3 Reeves RR, Stewart BS, Clapham PJ, Powell JA (2002) Guide to marine mammals of the world, Vol. AA Knopf Inc., New York Rosen D, Trites A (2000) Pollock and the decline of Steller sea lions: testing the junk-food hypothesis. Canadian Journal of Zoology 78:1243-
1250 Small R, Pendleton G, Pitcher K (2003) Trends in abundance of Alaska harbor seals, 1983-2001. Marine Mammal Science 19:344-362 Small RJ, Lowry LF, Hoef JM, Frost KJ, Delong RA, Rehberg MJ (2005) Differential movements by harbor seal pups in contrasting Alaska
environments. Marine Mammal Science 21:671-694 Tollit D, Heaslip S, Deagle B, Iverson S, Joy R, Rosen D, Trites A (2006) Estimating diet composition in sea lions: which technique to choose.
Sea lions of the world Edited by AW Trites, S Atkinson, DP, DeMaster, LW Fritz, TS, Gelatt, LD Rea, and K Wynne Alaska Sea Grant College Program, University of Alaska, Fairbanks:293–307
Tollit D, Steward M, Thompson P, Pierce G, Santos M, Hughes S (1997) Species and size differences in the digestion of otoliths and beaks: implications for estimates of pinniped diet composition. Canadian Journal of Fisheries and Aquatic Sciences 54:105-119
Tollit D, Wong M, Winship A, Rosen D, Trites A (2003) Quantifying errors associated with using prey skeletal structures from fecal samples to determine the diet of Steller's sea lion (Eumetopias jubatus). Marine Mammal Science 19:724-744
Trites AW, Donnelly CP (2003) The decline of Steller sea lions Eumetopias jubatus in Alaska: a review of the nutritional stress hypothesis. Mammal Review 33:3-28
Trites AW, Joy R, Weckerly FW (2005) Dietary analysis from fecal samples: How many scats are enough? Journal of Mammalogy 86:704-712