university of alberta's economic impact
DESCRIPTION
The University of Alberta has released a study that shows the economic impact of the university.TRANSCRIPT

The Economic Impact of the University of Alberta:
A Comparative Approach
Dr. Anthony BriggsDr. Jennifer Jennings
September 2012

2
Table of Contents
Executive Summary ....................................................................................................................................... 3
1.0 Introduction ............................................................................................................................................ 4
2.0 Research Method .................................................................................................................................... 5
3.0 Results ..................................................................................................................................................... 6
3.1 Institutional Spending ............................................................................................................................. 7
3.2 Student Spending .................................................................................................................................... 8
3.3 Visitor Spending ...................................................................................................................................... 9
3.4 Educational Premium ............................................................................................................................ 10
3.5 Research Impact .................................................................................................................................... 11
4.0 Economic Impact in Context ................................................................................................................. 12
4.1 In Canada - Differences between Universities ...................................................................................... 12
4.2 In Alberta – Spending vs. Impact .......................................................................................................... 14
4.3 In Edmonton – Impact Relative to Hockey............................................................................................ 15
5.0 Discussion and Limitations .................................................................................................................... 16
6.0 Conclusions ........................................................................................................................................... 18
References .................................................................................................................................................. 19
Appendix 1: Education Premium Calculations ............................................................................................ 21

3
Executive Summary
In 1908, Henry Marshall Tory, the University of Alberta’s first president, believed that
universities must uphold a promise to the people:
“The modern state university has sprung from a demand on the part of the people themselves…
The people demand that knowledge shall not be the concern of scholars alone. The uplifting of
the whole people shall be its final goal. This should never be forgotten.”
Over one hundred years has passed since the University of Alberta began with that goal in
mind. Today, it is important to understand how the University is achieving its promise and what
more it can do to positively impact future generations.
This report on the economic impact of the University of Alberta is part of a larger research
project conducted by Dr. Anthony Briggs and Dr. Jennifer Jennings, in the Department of
Strategic Management and Organization at the Alberta School of Business. This report is the
first of a series of studies that aim to better understand the University’s impact on the broader
society.
This component of the study is designed specifically to estimate the direct and induced
economic impact of the University of Alberta in the province of Alberta. The study replicates the
methods of other Canadian regional impact studies, beginning with the University of British
Columbia economic impact study (Sudmant, 2009) and later adopted by Simon Fraser
University (Sun and Lee, 2011) and the University of Ottawa (Diaz, Mercier and Duarte, 2012).
There are three general findings from the study:
The University of Alberta is one of the largest drivers of the provincial economy;
The University of Alberta induces a much higher level of regional economic activity than
other studied peer institutions, both proportionally and as a total measure;
At the individual level, the high education premiums that accrue to alumni suggest that
university education means more in Alberta than in the other major provinces.
The results summarized in Table 1 reveal an economic impact of $12.3 billion by the University
of Alberta on the provincial economy in the fiscal year 2009/10 alone. This represents
approximately 5.0% of Alberta’s GDP in that same period.
There are many other impacts of the University of Alberta that are not captured in this kind of
study. For example, institutions such as the Massachusetts Institution of Technology, Tsinghua
University and Stanford University have used survey methods to measure the impacts of
innovation and entrepreneurship, often leading to dynamic impact estimates that are much
larger. Similarly, there are social, cultural and environmental impacts, as well as impacts on
individual well-being and the perpetuation of family enterprise, that have not been measured by
these studies. In additional work that is currently underway, we hope to illuminate and measure
these impacts so as to better understand how the University of Alberta “uplifts the whole
people.”

4
1.0 Introduction
Since its founding in 1908, the University of Alberta has expanded in parallel with Edmonton’s remarkable growth. The University now offers approximately 400 undergraduate, graduate and professional programs across 18 faculties and 5 campuses. It employs over 14,500 faculty and staff, serves over 38,000 students annually, and boasts an alumni base of over 240,000. Just as the dramatic impact of the University of Alberta over the past 100 years is difficult to deny, so too are indicators of its national and international stature. Consider, for example, these illustrative markers of the university’s ascendency in this regard1:
1st in Canada for number of Excellence Research Chairs
1st in Canada for number of National 3M Teaching Fellowships
3rd in Canada for total annual research funding The above figures and accomplishments alone suggest that the University of Alberta contributes positively and significantly to the community in which it is embedded. But is it possible to quantify the university’s impact on the local and regional economy more precisely? And if so, how does its economic impact compare to other publicly-funded Canadian universities? This report is designed to answer these questions. It does so by replicating the methods adopted within other economic impact studies conducted by the University of British Columbia (Sudmant, 2009), Simon Fraser University (Sun and Lee, 2011) and the University of Ottawa (Diaz, Mercier and Duarte, 2012), and then comparing the findings against those obtained for these institutions. As such, it offers not only a dollar value (in billions) for the university’s annual impact on the Alberta economy—but also a sense of whether a dollar invested in the University of Alberta (at either the individual or institutional level) generates a relatively higher rate of regional economic return than a dollar invested at these other Canadian universities. It should be noted that this report represents just one component of a much larger research project designed to capture the myriad ways in which the University of Alberta has delivered on its founding promise to uplift the whole people. This report replicates the methods of similar Canadian Institutions and thus provides only one approach to estimate impact. This approach is not without limitations, however these are discussed in Sections 4 and 5. Subsequent reports will summarize what the findings of our in-process alumni survey reveal with respect to the university’s broader impact on individual well-being, innovation and entrepreneurship, the perpetuation of family enterprise, and the stimulation of social, cultural and environmental initiatives. To the best of our knowledge, this subsequent “Made in Alberta” approach will be the first to measure a university’s socioeconomic impact in such a holistic manner.
1 http://www.why.ualberta.ca (accessed June 6, 2012)

5
2.0 Research Method
Studies of university impact come in a number of types that rely on different research methods.
Historically, studies fall into three different general forms.
The simplest form of economic impact is that which is produced by direct and induced spending.
Direct impact is typically measured by university spending, which includes such items as
faculty, staff and student salaries and benefits, materials, supply and services, and student aid.
Induced impact includes other economic activity that is directly related to university activities,
such as student and visitor spending and follow-on economic impact from the direct spending.
Examples of methods that primarily measure direct and induced spending include the Boston
Universities study (Appleseed, 2003) and the University of California San Diego study (Herman,
Pash and Bain, 2008).
Other studies consider the dynamic economic impacts that flow from university education and
research. In the case of education, for instance, it is recognized that university graduates tend
to earn significantly more than those without degrees. This creates a measurable “education
premium,” a dynamic impact that can be attributed to the university and its alumni. This
approach was adopted by impact studies completed at University of British Columbia, “UBC
report” (Sudmant, 2009), Simon Fraser University, or “SFU report” (Sun and Lee, 2011) and the
University of Ottawa, “uOttawa report” (Diaz, Mercier and Duarte, 2012).
The other form of dynamic impact is driven by university research. In this case, universities
impact the development of new technologies, innovations and organizations by faculty, students
and alumni. These effects are captured in different ways. Many studies capture some of these
dynamic impacts through vignettes or measures of licensing activity. Others, such as the three
Canadian studies above-noted, use estimates of the link between R&D spending and regional
total factor productivity. A few studies have gone further using survey data. These include the
entrepreneurial impact studies at the Massachusetts Institute of Technology (Roberts and
Eesley, 2009), Iowa State University (Jolly, Yu and Orazem, 2009), Tsinghua University
(Eesley, Roberts and Yang, 2010) and Stanford University (Eesley and Miller, 2012).
In this report we have limited our methods to replicate the UBC report (Sudmant, 2009), which
has been replicated by SFU and uOttawa. There are limitations to this approach, many
discussed in Sections 4 and 5. However, there are also significant advantages as these studies
are: (1) regional, (2) based on publically available data and (3) reasonably comparable. Our
intention in this report is not to improve prior methods, but instead to demonstrate and support
the calculations and comparisons. As such, for each table we will present the specific method
and data from which it is constructed. All of the data for this report are publically available. While
every effort has been made to ensure the accuracy of these estimates, the calculations have not
been externally validated. Any errors in this report are the responsibility of the authors.
Last, we recognize that there are many other important measures of university impact that are
not included in this study or in others. These may include social, cultural and environmental
impacts, as well as impacts on individual well-being and family enterprise. Our broader research
project examines these more holistic aspects—an approach that we have not yet seen adopted
within any existing large-scale, university-level studies.
6
3.0 Results
In this section we will present the summary totals of the economic impact of four Canadian
universities, the regional contribution of this impact in terms of impact multipliers, and then the
detailed calculations and assumptions that build into the overall University of Alberta “U of A”
impact model.
These results are intended for comparative purposes. We do not intend to introduce new
methods in this study but rather to match our results against peer institutions, replicating the
methods used in prior studies. This section will primarily focus on the data and data sources
rather than analysis, limitations and discussion. Also, because this section uses data from three
other recent impact studies, the details provided on these studies are matched in both nature
and time.
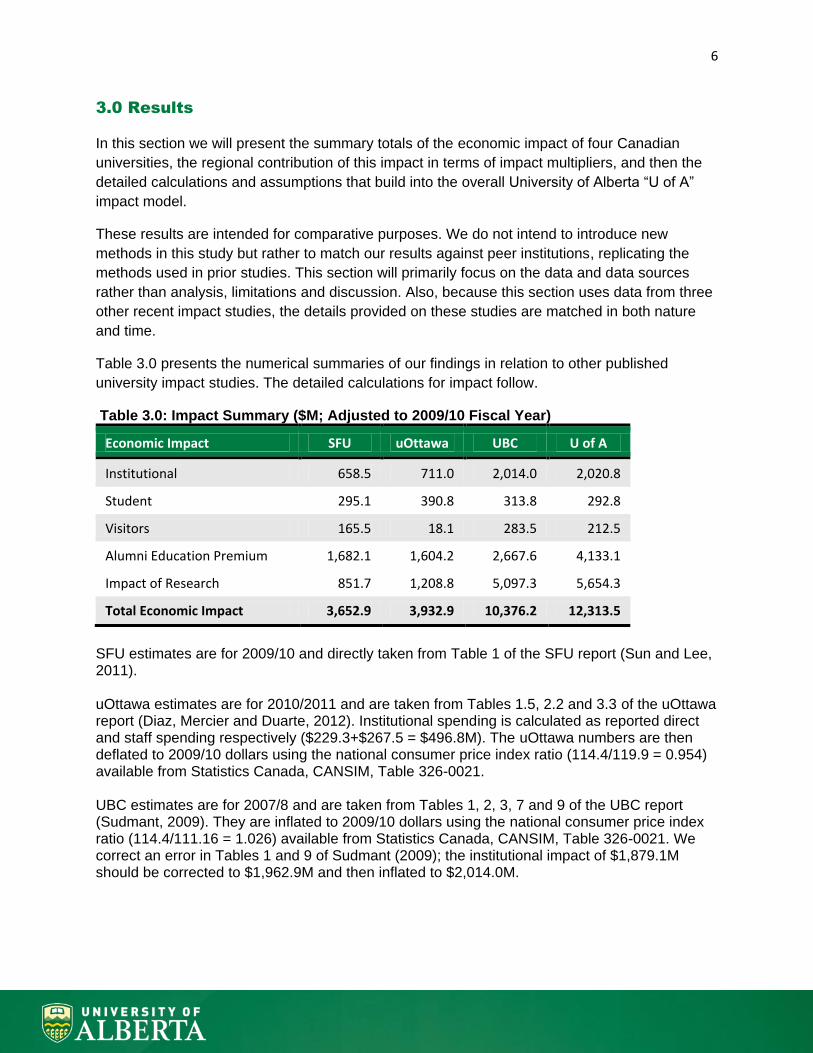
Table 3.0 presents the numerical summaries of our findings in relation to other published
university impact studies. The detailed calculations for impact follow.
Table 3.0: Impact Summary ($M; Adjusted to 2009/10 Fiscal Year)
Economic Impact SFU uOttawa UBC U of A
Institutional 658.5 711.0 2,014.0 2,020.8
Student 295.1 390.8 313.8 292.8
Visitors 165.5 18.1 283.5 212.5
Alumni Education Premium 1,682.1 1,604.2 2,667.6 4,133.1
Impact of Research 851.7 1,208.8 5,097.3 5,654.3
Total Economic Impact 3,652.9 3,932.9 10,376.2 12,313.5
SFU estimates are for 2009/10 and directly taken from Table 1 of the SFU report (Sun and Lee, 2011). uOttawa estimates are for 2010/2011 and are taken from Tables 1.5, 2.2 and 3.3 of the uOttawa report (Diaz, Mercier and Duarte, 2012). Institutional spending is calculated as reported direct and staff spending respectively ($229.3+$267.5 = $496.8M). The uOttawa numbers are then deflated to 2009/10 dollars using the national consumer price index ratio (114.4/119.9 = 0.954) available from Statistics Canada, CANSIM, Table 326-0021. UBC estimates are for 2007/8 and are taken from Tables 1, 2, 3, 7 and 9 of the UBC report (Sudmant, 2009). They are inflated to 2009/10 dollars using the national consumer price index ratio (114.4/111.16 = 1.026) available from Statistics Canada, CANSIM, Table 326-0021. We correct an error in Tables 1 and 9 of Sudmant (2009); the institutional impact of $1,879.1M should be corrected to $1,962.9M and then inflated to $2,014.0M.

7
3.1 Institutional Spending
Table 3.1: Institutional Spending (Adjusted to 2009/10 fiscal year)
Type of Expenditure Percent Local SFU ($ M) UBC ($ M) U of A ($ M)
Salaries & Benefits 98% 326.7 962.4 943.6
Materials, Supply and Services 78% 42.0 97.2 226.4
Student Aid 100% 27.2 59.5 89.5
All Other Expenses 35% 43.1 223.5 87.7
Total Direct 439.0 1,342.7 1,347.2
Total Direct + Induced (x1.5) 658.5 2,014.0 2,020.8
SFU estimates are for 2009/10 and directly taken from Table 2 of the SFU report (Sun and Lee, 2011). UBC estimates are for 2007/8 and are taken from Table 1 of the UBC report (Sudmant, 2009). There are calculation errors in Table 1 under “Building Construction” and “All Other Expenses” which are corrected to $94.8M and $217.8M local income respectively. The values are then inflated to 2009/10 dollars using the national consumer price index ratio (114.4/111.16 = 1.026) available from Statistics Canada, CANSIM, Table 326-0021. U of A estimates are calculated from figures presented in the Statement of Operations (p.25) of the 2009/10 University of Alberta Annual Report (2010) adjusted for local spending, as was done in both the UBC and SFU reports. This includes salaries and benefits of $962.8M; materials, supply, and services of $290.2M; student aid of $89.5M, and other expenses of $250.6M. For simplicity we will not present the detailed calculations of the uOttawa report sub-tables here or to follow. Finally, all reports use a conservative multiplier of 1.5 to estimate induced economic activity. For justification of this method see Sudmant (2009).
8
3.2 Student Spending
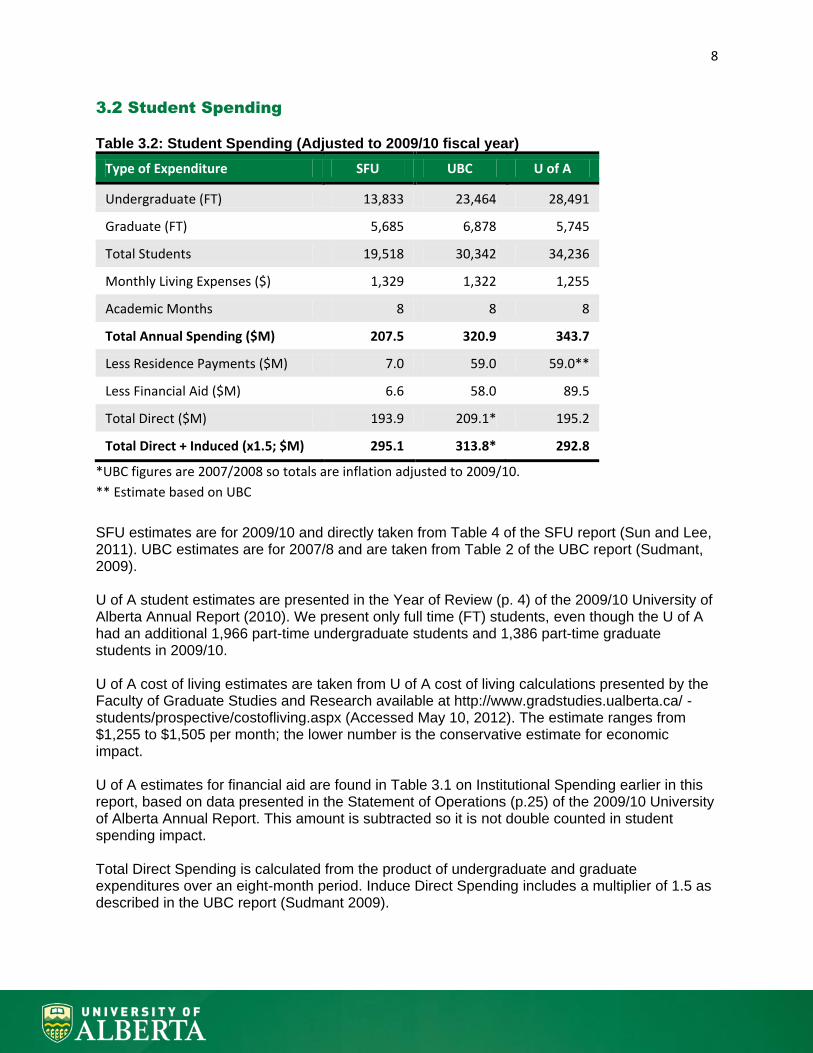
Table 3.2: Student Spending (Adjusted to 2009/10 fiscal year)
Type of Expenditure SFU UBC U of A
Undergraduate (FT) 13,833 23,464 28,491
Graduate (FT) 5,685 6,878 5,745
Total Students 19,518 30,342 34,236
Monthly Living Expenses ($) 1,329 1,322 1,255
Academic Months 8 8 8
Total Annual Spending ($M) 207.5 320.9 343.7
Less Residence Payments ($M) 7.0 59.0 59.0**
Less Financial Aid ($M) 6.6 58.0 89.5
Total Direct ($M) 193.9 209.1* 195.2
Total Direct + Induced (x1.5; $M) 295.1 313.8* 292.8
*UBC figures are 2007/2008 so totals are inflation adjusted to 2009/10.
** Estimate based on UBC
SFU estimates are for 2009/10 and directly taken from Table 4 of the SFU report (Sun and Lee, 2011). UBC estimates are for 2007/8 and are taken from Table 2 of the UBC report (Sudmant, 2009). U of A student estimates are presented in the Year of Review (p. 4) of the 2009/10 University of Alberta Annual Report (2010). We present only full time (FT) students, even though the U of A had an additional 1,966 part-time undergraduate students and 1,386 part-time graduate students in 2009/10. U of A cost of living estimates are taken from U of A cost of living calculations presented by the Faculty of Graduate Studies and Research available at http://www.gradstudies.ualberta.ca/ -students/prospective/costofliving.aspx (Accessed May 10, 2012). The estimate ranges from $1,255 to $1,505 per month; the lower number is the conservative estimate for economic impact. U of A estimates for financial aid are found in Table 3.1 on Institutional Spending earlier in this report, based on data presented in the Statement of Operations (p.25) of the 2009/10 University of Alberta Annual Report. This amount is subtracted so it is not double counted in student spending impact. Total Direct Spending is calculated from the product of undergraduate and graduate expenditures over an eight-month period. Induce Direct Spending includes a multiplier of 1.5 as described in the UBC report (Sudmant 2009).

9
3.3 Visitor Spending
Table 3.3: Visitor Spending
Type of Expenditure SFU UBC U of A
Number of Visitors 110,000 200,000 227,900
Average Length of Stay (Days) 3 3 2.1
Spending per Day ($) 315 315 296
Total Direct ($M) 104.0 189.0 141.7
Total Direct and Induced (x1.5; $M) 165.5 283.5 212.5
SFU estimates are for 2009/10 and directly taken from Table 7 of the SFU report (Sun and Lee, 2011). UBC estimates on number of visitors and length of stay are taken from Table 3 of the UBC report (Sudmant, 2009). The spending per day figure is updated from $300 per day to $315 per day for 2009/10 as per the SFU estimate (Sun and Lee, 2011). U of A estimates for the number of visitors is based on the ratio of undergraduate students to the number of visitors of 1:8 respectively. This number is a conservative estimate as other University estimates have calculated as high as 1:14 (Sudmant, 2009). U of A student estimates are presented in the Year of Review (p. 4) of the 2009/10 University of Alberta Annual Report (2010) as 28,291 full-time undergraduate students. The average length of stay of 2.1 days is presented in the Government of Alberta Tourism in Edmonton and Area Report (2011). The average spending per day was provided by personal communication with a source at Edmonton Economic Development Corporation, October 3, 2011. As with prior tables, the product of the visitors and daily expenditures are calculated and then a multiplier of 1.5 is used to estimate the direct and induced impact. Both the UBC report (Sudmant, 2009) and SFU report (Sun and Lee, 2011) justify visitor spending estimates using a variety of examples of academic and non-academic events. We were not able to acquire similar data for the U of A but they were not required for the calculations. As a robustness check, it was calculated that the UBC’s share of BC tourism is less than 1% (Sudmant, 2009). The Government of Alberta Tourism Report (2011) estimates that there were 4.99 million visitors to Edmonton and area in 2009. This suggests that the U of A induces some 4.6% of Edmonton and Area tourism spending. Relative to other institutions this estimate is high. We do note that the same report estimates that 74% of trips are from within Alberta and 44% of overnight trips from are to visit friends and relatives.

10
3.4 Educational Premium
Table 3.4: Educational Premium ($M)
Credential SFU UBC U of A*
Doctoral/PhD 33.9 n/a 277.1
Master 188.5 n/a 442.6
Graduate Diploma 22.8 n/a 1.4
Post Bachelor Diploma 36.5 n/a 60.2
Bachelor 783.0 n/a 1,974.2
Professional Development Programs 56.6 n/a not incl.
Total Direct 1,121.4 1,744.2 2,755.4
Total Direct and Induced (x1.5) 1,682.1 2,667.6 4,133.1
*See Appendix 1. Totals are calculated using exact, not rounded amounts.
SFU estimates are for 2009/10 and directly taken from Table 10 of the SFU report (Sun and Lee, 2011). The SFU calculations are derived by matching SFU alumni by age, sex and degree type to salary information provided by Statistics Canada, 2006 Census of the Population, No. 97-563-XCB2006054. The SFU estimates cover some 73% of SFU alumni in the greater Vancouver area. UBC estimates for education premium are taken from Table 9 of the UBC report (Sudmant, 2009). The values are then inflated to 2009/10 dollars using the national consumer price index ratio (114.4/111.16 = 1.026) available from Statistics Canada, CANSIM, Table 326-0021. UBC does not match alumni groups to specific census data but rather estimates the average education premium and calculates the product of that across an estimated 178,000 alumni (68% of UBC Alumni) in British Columbia. It is assumed that salary differentials are calculated for the British Columbia region, but this information is not provided. U of A estimates for education premium are estimated using the approach outlined in the SFU report (Sun and Lee, 2011) and detailed in Appendix 1 of this report. The U of A calculations are derived by matching unique U of A alumni, between the ages of 25 to 64, by age, sex and degree type to average salary information in Alberta, provided by Statistics Canada, 2006 Census of the Population, catalog no. 97-563-XCB2006054. It does not include professional development programs because of potential double counting. Work participation numbers for Alberta are calculated from Labor Force Survey Estimates, Statistics Canada CANSIM Table 282-0002, weighting participation rate in a given age category by the proportion of employed persons. The U of A estimates cover some 76% of U of A alumni in the Province of Alberta. Of immediate note is that the U of A figures are substantially higher than might be expected a priori. We will discuss this at length later, but it is driven by a multitude of regional factors including a greater weighted average gross education premium for this population (67% vs. 57% used in Sudmant, 2009), a higher labor participation rate (approximately 11% higher in Alberta than would be the case in Metro Vancouver), a higher level of alumni within the economic region (76% in Alberta, vs. 73% for SFU and 68% for UBC) and a large overall base of alumni.

11
3.5 Research Impact
Table 3.5: Research Impact
SFU UBC U of A
Provincial GDP Growth ($M; 1971-2010) 139,000* 139,000* 166,760**
Total Factor Productivity ($M; x 20%) 27,800 27,800 33,352
Domestic R&D ($M; x 69%) 19,182 19,182 23,013
Share by Provincial Higher Ed 37% 37% 39%
Share by Institution 12% 70% 63%
Attributed GDP Growth ($M) 851.7 5,097.3** 5,654.3
* British Columbia’s GDP declined in constant 2002 dollars from 164,386 in 2007 to 162,215 in 2009, or
within 1.5%. As we do not know the details of this original estimate, we leave these figures unchanged.
** This is in current 2009 dollars to match with the SFU report (Sun and Lee, 2011).
SFU estimates are directly taken from Table 15 of the SFU report (Sun and Lee, 2011). The
SFU calculations are derived using the figures the estimation method described in Martin
(1998), using methods and estimates provided in the UBC report (Sudmant, 2009).
UBC estimates are directly taken from Table 7 of the UBC report (Sudmant, 2009) using the
estimation method described in Martin (1998). The method of estimating provincial GDP growth
between 1971 and 2007 was not provided and may be calculated a number of ways. This is
complicated since Statistic Canada modified GDP calculations to 2002 dollars as recently as
November 7, 2011. CANSIM Table 384-0002, reports that British Columbia’s GDP in 2009 is
$191,863M current and $162,215M in constant 2002 dollars, but only provides revised data to
1981. Given this, the total estimate of GDP growth is somewhere in the range of 72% to 86% of
2009 current and constant 2002 GDP respectively. UBC final estimates are inflated to 2009/10.
U of A estimates for provincial GDP growth can similarly be calculated a number of ways.
Statistics Canada provides historical GDP between 1981 and 2010, CANSIM Table 384-0002,
reporting that Alberta’s GDP in 2009 is $240,697M current and $184,017M in constant 2002
dollars. We estimated Alberta’s 1971 GDP in 2002 dollars by using historical Alberta GDP in
1971 of $34,920M in 1998 dollars (Table 1, Anielski, 2002) and inflating that to 2002 dollars
using the national consumer price index ratio (100/91.3 = 1.0953) available from Statistics
Canada, CANSIM, Table 326-0021. GDP growth is calculated as $145,769M or 79% of constant
2002 GDP. In current 2010 dollars GDP growth is calculated as $166,760M or 69% of current
GDP.
Total factor productivity and domestic R&D are discounted using methods described in Martin
(1998). Share of provincial higher education is 39% for 2008 (Table 4-1, Statistics Canada, No.
88-221-X). Share by institution is 63% for 2009/10 (Table 1, Government of Alberta 2011).

12
4.0 Economic Impact in Context
The rationale behind this study is to better understand the University of Alberta’s impact in the context of other Canadian Institutions, the Alberta region and the City of Edmonton. In this section we highlight three important implications of the University of Alberta and its regional economic impact.
4.1 In Canada - Differences between Universities
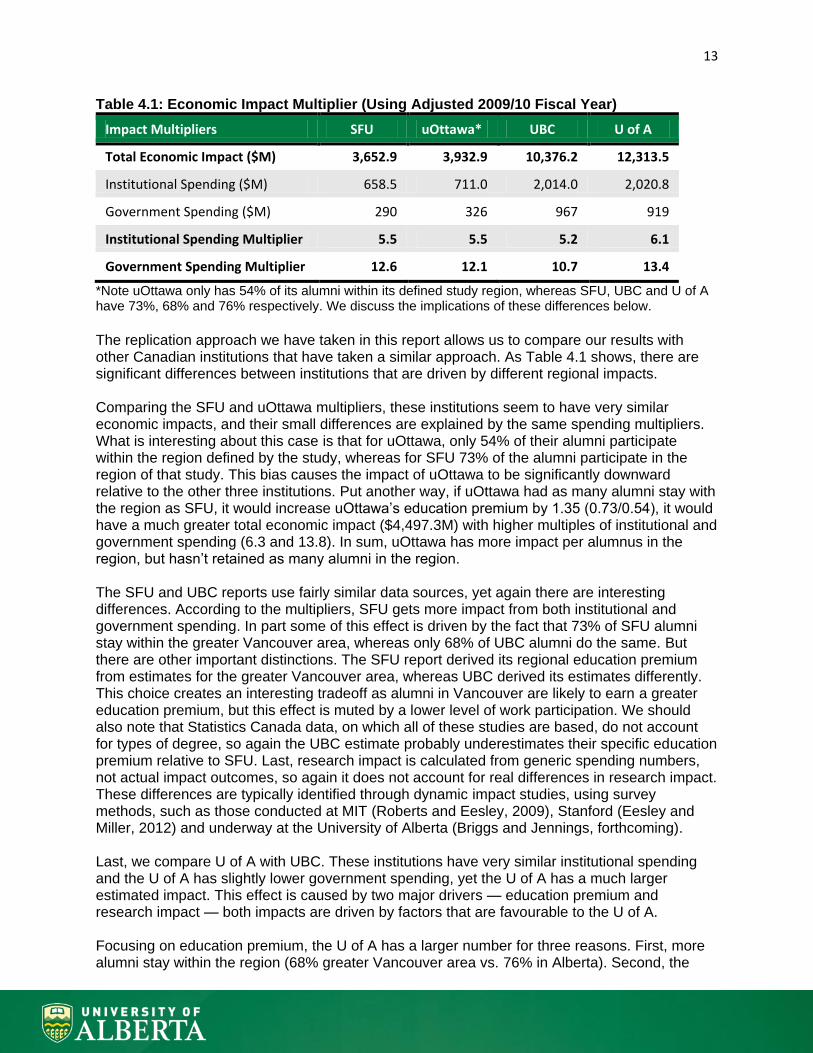
Academics and economics have long been concerned with understanding the sources of sustained prosperity in an economy. Many studies have examined macroeconomic factors as critical in distinguishing the success of regions and role of differences in industries (Porter 1990). These studies have been used by decision makers to balance the investment mix in different sectors and industries in attempts to make a given region or area of business more competitive and prosperous (Porter, 1980). More recently, scholars have argued that attention to the industry, or sector, on longer-term performance is a flawed approach (Barney, 1991). Instead, a view has emerged that industry or sector performance is less about the dynamics of a given industry, and is instead driven by aggregations of performance differences across poor, average and exceptional organizations (Ghemawat and Rivkin, 2006). In this view, organizations—and not industries—are where important economic differences are derived. This view has now held up to scrutiny across a number of large-scale studies of public companies. These studies consistently show that industry effects account for only about 8% of performance whereas organizational effects account for about 44% (Misangyi, Elms, Greckhamer and Lepine, 2006). It is well known that universities differ in their contributions to a regional economy, yet our understanding of the economic impact of these institutions is still discussed at the sector level. The conversation is around cost and not the returns to education. Yet we certainly know that universities have different resources and endowments and have different mixes and qualities of students, staff and faculty. We also know that universities have different educational and research goals and that they perform differently on these goals. And we also know that the alumni at different universities graduate to do different things in different places. Yet, there is still fairly little information about how to understand the differences of a given university’s impact within a given region and to gauge its overall performance. The replication approach we take in this report allows us to compare our results with other Canadian institutions that have completed similar studies. Our goal is not to arrive at a singular multiple for the post-secondary sector but, as we describe above, we aim to take our analysis further and identify differences between institutions. Table 4.1 presents the multipliers of $1 of institutional spending on estimates of regional economic impact as summarized earlier in Table 3.0. The second multiplier is based on $1 of government spending by institution in 2009/10. Government spending data is unadjusted from each institutions 2009/2010 annual report and/or financial statements.
13
Table 4.1: Economic Impact Multiplier (Using Adjusted 2009/10 Fiscal Year)
Impact Multipliers SFU uOttawa* UBC U of A
Total Economic Impact ($M) 3,652.9 3,932.9 10,376.2 12,313.5
Institutional Spending ($M) 658.5 711.0 2,014.0 2,020.8
Government Spending ($M) 290 326 967 919
Institutional Spending Multiplier 5.5 5.5 5.2 6.1
Government Spending Multiplier 12.6 12.1 10.7 13.4
*Note uOttawa only has 54% of its alumni within its defined study region, whereas SFU, UBC and U of A have 73%, 68% and 76% respectively. We discuss the implications of these differences below.
The replication approach we have taken in this report allows us to compare our results with other Canadian institutions that have taken a similar approach. As Table 4.1 shows, there are significant differences between institutions that are driven by different regional impacts. Comparing the SFU and uOttawa multipliers, these institutions seem to have very similar economic impacts, and their small differences are explained by the same spending multipliers. What is interesting about this case is that for uOttawa, only 54% of their alumni participate within the region defined by the study, whereas for SFU 73% of the alumni participate in the region of that study. This bias causes the impact of uOttawa to be significantly downward relative to the other three institutions. Put another way, if uOttawa had as many alumni stay with the region as SFU, it would increase uOttawa’s education premium by 1.35 (0.73/0.54), it would have a much greater total economic impact ($4,497.3M) with higher multiples of institutional and government spending (6.3 and 13.8). In sum, uOttawa has more impact per alumnus in the region, but hasn’t retained as many alumni in the region. The SFU and UBC reports use fairly similar data sources, yet again there are interesting differences. According to the multipliers, SFU gets more impact from both institutional and government spending. In part some of this effect is driven by the fact that 73% of SFU alumni stay within the greater Vancouver area, whereas only 68% of UBC alumni do the same. But there are other important distinctions. The SFU report derived its regional education premium from estimates for the greater Vancouver area, whereas UBC derived its estimates differently. This choice creates an interesting tradeoff as alumni in Vancouver are likely to earn a greater education premium, but this effect is muted by a lower level of work participation. We should also note that Statistics Canada data, on which all of these studies are based, do not account for types of degree, so again the UBC estimate probably underestimates their specific education premium relative to SFU. Last, research impact is calculated from generic spending numbers, not actual impact outcomes, so again it does not account for real differences in research impact. These differences are typically identified through dynamic impact studies, using survey methods, such as those conducted at MIT (Roberts and Eesley, 2009), Stanford (Eesley and Miller, 2012) and underway at the University of Alberta (Briggs and Jennings, forthcoming). Last, we compare U of A with UBC. These institutions have very similar institutional spending and the U of A has slightly lower government spending, yet the U of A has a much larger estimated impact. This effect is caused by two major drivers — education premium and research impact — both impacts are driven by factors that are favourable to the U of A. Focusing on education premium, the U of A has a larger number for three reasons. First, more alumni stay within the region (68% greater Vancouver area vs. 76% in Alberta). Second, the

14
salary premiums for education are higher in Alberta than they are in the other regions. And third, the work participation in Alberta is higher than is calculated in other regions (see Appendix 1 for more details). These factors together create a significantly larger estimate of education premium for the U of A. The other difference is in the impact of research. The U of A estimate is higher for two reasons. First, Alberta’s GDP has grown more than British Columbia’s, which is an important consideration in the method used by all the studies (limitations of this approach are discussed in Section 5). Second, educational institutions in Alberta do a larger share of R&D relative to other organizations than is the case in British Columbia. These effects are slightly muted by the fact that UBC accounts for 70% of the BC higher education R&D, whereas U of A only accounts for 64% of Alberta higher education R&D. Overall this results in the U of A estimate for research impact being approximately 10% larger than UBC.
4.2 In Alberta – Spending vs. Impact
Alberta’s gross domestic product (GDP) is a measure of the economic activity of final goods and
services produced by the province within a given year. The estimated GDP for Alberta in 2009
varies by source but it is within the range of $240.7B to $247.2B. A report by the Government of
Alberta in September 2011 estimates that in 2009 approximately 3.7% of the Province of
Alberta’s GDP is attributed to economic activity generated by education. Our study, however,
estimates that the total economic impact of the U of A alone is $12.3B. This impact, which
equates to about 5.0% of Alberta’s GDP, is about 35% larger than estimates for the entire
education sector.
The rationale behind a study like this is that education does indeed help to “uplift the whole
people.” The U of A contributes not just in direct and indirect spending numbers (Figure 4.2 left-
side graph), where it accounts for up to 0.8% of the total, but also in dynamic impact. The U of A
enhances the incomes of its graduates in all sectors through the education premium and by
providing new value-added opportunities through the impact of research (Figure 4.2 right-side
graph). Notably, while the cost of the U of A is a portion of the “education” portion of GDP, the
added value of the U of A’s impact is translated and shared across industries.
Figure 4.2: Total Education Spending vs. U of A Economic Impact (%GDP; Alberta 2009)

15
4.3 In Edmonton – Impact Relative to Hockey
Calculations of large economic impacts on the region can be difficult to put into perspective. In
the case of the U of A, much of the impact is measured in terms of the education premium that
accrues to approximately 135,000 alumni between the ages of 25-64 that are participating in the
Alberta work force. Another major contributor to regional impact is on the productivity growth
across industries, an estimate which is attributed to the U of A’s regional share of research and
development. Yet it is difficult to connect these large numbers with more tangible measures.
We thought it would be useful to compare the U of A’s impact with that of the city’s most notable
sports team, the Edmonton Oilers. Within Edmonton there are many hockey fans and much
recent public debate about the economic impact of a new sports development. Although it has
been shown that the net economic impact of a sports team can vary considerably, and can even
be negative (Noll and Zimbalist, 1997), we consider the extreme positive scenario in which the
entire total annual revenues of the Edmonton Oilers in 2009 ($91 million CDN) benefits the local
Edmonton region.
Table 4.3: U of A Impact in Edmonton Oilers’ Revenue
Type of Impact U of A (2009)
Edmonton Oilers No. of Teams*
Institutional 2,020.8 22
Student 292.8 3
Visitors 212.5 2
Alumni Education Premium 4,133.1 46
Impact of Research 5,654.3 62
Total ($M) 12,313.5 135
* In 2009/10 Edmonton Oilers revenue was $87M USD, and total NHL league revenues in was $2,929M USD, Forbes, December 2010. The Business of Hockey: NHL Team Values 2010. Revenue figures were adjusted using the monthly average USD/CDN exchange rate for the season between September 2009 and May 2010 of 1.0462, to $91M CDN and $3,064M CDN for the Edmonton Oilers and NHL respectively.
In this comparison, the annual impact of the U of A is approximately equivalent to at least 135 Oiler’s teams. Of this, the direct spending of the University is equivalent to 22 teams, with the impact of U of A education as approximately 46 teams and the impact of research as 62 teams. Put another way, the impact of the U of A on annual alumni income is approximately equal to the revenue from all the teams of one and a half NHL hockey leagues, with the total impact of the U of A approaching the total equivalent revenues of four NHL hockey leagues.

16
5.0 Discussion and Limitations
In developing a comparative study it was necessary to follow the methods of prior studies even if better methods were available (though in many cases they were not). There are also some differences between the studies that require some discussion. First, the direct spending numbers are relatively robust. These generally come from audited annual reports, and the estimates of visitor and student spending are conservative. While the multiplier of 1.5 for induced economic spending is also conservative (Sudmant, 2009), it is of some concern since the specifics of this spending aren’t directly measured or well-defined. The education premium is also relatively robust in the sense that it is reproducible from Statistics Canada regional data, is derived from large samples and represents real differences between the incomes of university and non-university educated workforce. However, it is a large figure and differences in calculation methodologies can change the number significantly. For example, differences in the definition of regional boundaries, such as city or province, can shift individual education premiums, work participation rates, and the number of alumni that are included in the impact calculation. Similarly, accounting for part-time work, work prior to age 25 and retirement income would also shift this number, likely higher for all institutions. But most importantly, university educations are not identical in impact (as they are treated in Statistics Canada data) and some universities will include a greater proportion of graduates in high-income professions. This skewing of incomes suggests that universities with large professional programs, like UBC and the U of A, are likely under-estimating the education premium of their graduates. The measure of research impact is more challenging. The logic behind the measure arises from an understanding that economies grow less from increases in labor and capital, and more from technological change (Solow, 1957). This view is supported both from direct studies of how certain types of basic research expenditures lead to follow-on commercial R&D (Berman, 1989), to broader measures of university dynamic impact through changes in rates of entrepreneurship and firm growth (Roberts and Eesley, 2009) and overall increases in GDP (Martin, 1998). For comparative purposes we followed other reports that rely on a method derived from Martin (1998). There are a number of simple improvements that could be made on this approach such as: (1) using chained GDP vs. current or constant dollars; (2) smoothing GDP so that individual year effects are not as prevalent; or (3) using the 1980s as a base growth estimate vs. the 1970s where there are large provincial GDP swings from the energy crisis. However, the most important issue with these calculations is that they rely on a sector-based approach so that every dollar spent on R&D has the same impact. In reality this is unlikely as performance will vary differently between universities, much as it does in other organizations. A second important issue is that while the estimate is mathematically demonstrable (Martin, 1998) it is often difficult to relate to a simple narrative or specific vignettes for many regions. For example, the U of A might claim large impacts from early oil sands research initiated at the U of A, or Stanford might claim large impacts from the Cohen-Boyer patents that were foundational to the field of biotechnology, but for many institutions the R&D impacts may be less concentrated or visible. Finally, with any economic impact study there is the concern of double counting. Some concerns of double counting are already accounted for in our calculations. For example, we use the highest degree achieved so each education premium estimate is unique to a single alumni. Moreover, we do not count professional programs which are included in other surveys. We have also adjusted for occasions where the U of A is financing students. However, in all studies,
17
education premium is potentially double counted in both direct spending as some university staff and faculty are U of A alumni and receive an education premium. Accounting for this, the U of A estimates might be reduced as much as 30.0% of direct salaries, or $283M, if all of its staff were also alumni. A second concern for double counting is the overlap between research impact and alumni education premium. This is conceptually a very challenging issue as the U of A both benefits its alumni, as they get paid for higher value work, but there also is higher value work because of research and the resulting technological gains. As we mentioned earlier, the 1.5 multiplier also contributes to the question around double counting. Perhaps to account for double counting, existing studies have made adjustments to their calculations. Yet, these adjustments are not always appropriate. For example, the UBC report (Sudmant, 2009) adjusted their education premium to account for the cost of education. While this approach is common when calculating individual returns to education, it is not a double counting of regional economic impact. Notably, the presence of the university in a region both induces economic spending through tuition and fees (the nature of our calculations assumes the average student is 24 and under) and induces increased income through the education premium (in our calculations we assume that the average education premium is 25-64). While it is true that because of tuition and fees a given person will not see the full value of the education premium, the Alberta region does. In any given year, the Alberta region both appropriates from the fees and tuition of some, while also benefiting from the education premium of others.
The SFU report (Sun and Lee, 2011) and the uOttawa report (Diaz, Mercier and Duarte, 2012) calculate education premium differently from the UBC report (Sudmant, 2009). While these reports appropriately do not subtract the cost of education from their premium calculations, they do net out federal and provincial taxes. For consistency, we have followed the method in the SFU and UOttawa reports, but also do not agree with it. First, tax adjustments are inconsistently applied in these reports. For example, impacts such as university salaries, visitor spending, and research impact are not reduced by taxes. Nor do these reports net out provincial sales taxes. We find that the removal of taxes from this education premium is enormous – in the case of the U of A this adjustment undercounts the education premium by approximately $2.157 billion, or approximately 1% of Alberta’s GDP. The matter of adjusting for taxes begs the question of how much of the impact stays in the region. In some cases, where cities are defined as the region, taxes may not be retained. However, in the case of the U of A, we believe it is reasonable to include all of Alberta taxes as being retained by the Alberta region, as well as a large portion of federal taxes. However, the inclusion of taxes makes any impact not only dependent on the amount of taxes retained by a province or other region, or the tax policies of the different regions, but is also sensitive to income levels. If tax rates are progressive, that is taxes increase with income, the inclusion of tax adjustments will under-represent the true impact of regions that generate higher incomes. As a result, higher-performing regions, with higher incomes, will be smoothed down in education premium (as they will pay proportionally more taxes), whereas lesser performing regions will appear stronger (as lower proportional tax adjustments). Again, we think the inclusion of this adjustment is inappropriate; it focuses on measuring sector performance rather than emphasizing the significant differences in performance across institutions. As a final note, given the tight coupling between higher education and provincial funding, we believe that all economic impact studies should consistently match to provincial data rather than including a mix of city and provincial data. In particular, as we have noted, the use of city data can cause upward biases such as over-represented incomes, but can also cause downward biases such as lowered alumni retention. We urge that studies going forward take consistent provincial approach to better understand the impacts and to aid in study comparisons.

18
6.0 Conclusions
The major conclusion we draw from this report is that there is a need to change the conversation about the economic role of universities within a region. The current conversation is primarily focused on the cost of any university education and efficiencies in direct spending (Tables 3.1 and 4.2). But the more important conversation is about understanding the value of universities, and how differences in the qualities of universities alter their regional economic impact. This report, the first component of a larger study of the U of A’s impact, demonstrates that the U of A is of vital importance to the Alberta region, likely more so than other studied Canadian institutions in their regions. More specifically:
The University of Alberta is one of the largest drivers of the provincial economy;
The University of Alberta induces a much higher level of regional economic activity than
other studied peer institutions, both proportionally and as a total measure;
At the individual level, the high education premiums that accrue to alumni suggest that
university education means more in Alberta than in the other major provinces.
Acknowledgements
The authors would like to give special thanks to the following people for providing access to
alumni data and for their input and assistance for this analysis: O’Neil Outar, Vice President of
Advancement; Cynthia Strawson, Director, Marketing, Communications and Affinity
Relationships, Office of Alumni Affairs; Sean Price, Associate Vice-President, Alumni Affairs;
Stephanie Cornforth and Dr. Raja Mita, Research Associates within the Alberta School of
Business; the staff of the Office of Advancement; the Board University Relations Committee; the
President’s Executive Council and Dr. Indira V. Samarasekara, President and Vice Chancellor.
19
References
(2003). Engines of Economic Growth: The Economic Impact of Boston’s Eight Research Universities on the Metropolitan Boston Area. Appleseed. New York, NY. Barney, J. (1991). Firm Resources and Sustained Competitive Advantage. Journal of Management. 17(1): 99-120. Berman, E. M. (1990). The Economic Impact of Industry-Funded University R&D. Research Policy. 19(4): 349-355. Diaz, V., Mercier, P. and Duarte, S. (2012). University of Ottawa: 2012 Economic Impact Study. Ottawa, Ontario: The University of Ottawa. Eesley, C.E. and Miller, W. (2012). Impact: Stanford University Alumni and Faculty Economic Impact via Innovation and Entrepreneurship. Unpublished manuscript. Eesley, C.E., Roberts, R.B. and Yang, D. (2010). Entrepreneurial Ventures from Technology-Based Universities: A Cross-National Comparison. Unpublished manuscript. Ghemawat, P. and Rivkin, J.W. (2006). Creating Competitive Advantage. Harvard Business School Case No. 9-798-062. Government of Alberta. (2011). Alberta Economic Quick Facts. Government of Alberta. (2011). Tourism in Edmonton and Area Tourism Destination Region: A Summary of 2009 Visitor Numbers and Characteristics. Herman, A., Pash, C. and Bain, J. (2008). A Study of the Economic Impact and Benefits of UC San Diego. CBRE Consulting Inc. San Francisco, CA. Jolly, R., Yu, L. and Orazem, P. (2009). After They Graduate: An Overview of the Iowa State University Alumni Survey. Iowa State University, Department of Economics Working Papers Series No. 09002. Ames, IO. Martin, F. (1998). The Economic Impact of Canadian University R&D. Research Policy. 27(7): 677-687. Misangyi, V.F., Elms, H. Greckhamer, T. and Lepine, J.A. (2006). A New Perspective of a Fundamental Debate: A Multilevel Approach to Industry, Corporate and Business Unit Effects. Strategic Management Journal. 27(6): 571-590. Noll, R.G. and Zimbalist, A.Z. (1997). Sports, Jobs and Taxes: The Economic Impact of Sports Teams and Stadiums. R. R. Donnelley and Sons Co. Harrisonburg, VA. Porter, M.E. (1980). Competitive Strategy: Techniques for Analyzing Industries and Competitors. Free Press. New York, NY. Porter, M.E. (1990). The Competitive Advantage of Nations. Free Press. New York, NY.

20
Roberts, E.B. and Eesley, C.E. (2009). Entrepreneurial Impact: The Role of MIT. SSRN Working Paper No. 1352633. Simon Fraser University. (2010). Simon Fraser University Annual Financial Report. Solow, R.M. (1957). Technical Change and the Aggregate Production Function. Review of Economic Statistics. 39(3): 312-320. Statistics Canada. (2006). Census of the Population, Statistics Canada Catalog No. 97-563-XCB2006054. Last modified: April 7, 2011. Statistics Canada, (2012). Consumer Price Index, Historical Summary (1992 to 2011). CANSIM Table 326-0021 and Catalogue Nos. 62-001-X, 62-010-X and 62-557-X. Last modified: January 20, 2012. Statistics Canada, (2012). Gross Domestic Product (GDP), Expenditure Based, Provincial Economic Accounts. CANSIM Table 384-0002. Last modified: November 7, 2011. Statistics Canada, (2012). Labour Force Survey Estimates by Sex and Detailed Age Group. CANSIM Table 282-0002. Last modified: January 4, 2012. Statistics Canada, (2012). Gross Domestic Expenditures on Research and Development in Canada (GERD) and the Provinces. Table 4-1 and Statistics Canada Catalog No. 88-221-X. Last modified: January 13, 2012. Sudmant, W. (2009). The Economic Impact of the University of British Columbia. Vancouver, British Columbia: The University of British Columbia. Sun, W. and Lee, J. (2011). The Economic Impact of Simon Fraser University. Burnaby, British Columbia: Simon Fraser University. University of Alberta. (2010). University of Alberta 2009-2010 Annual Report. University of British Columbia. (2010). Place and Promise: The UBC Plan: Annual Report 2009/2010. University of Ottawa. (2010). Consolidated Financial Statements of University of Ottawa.
21
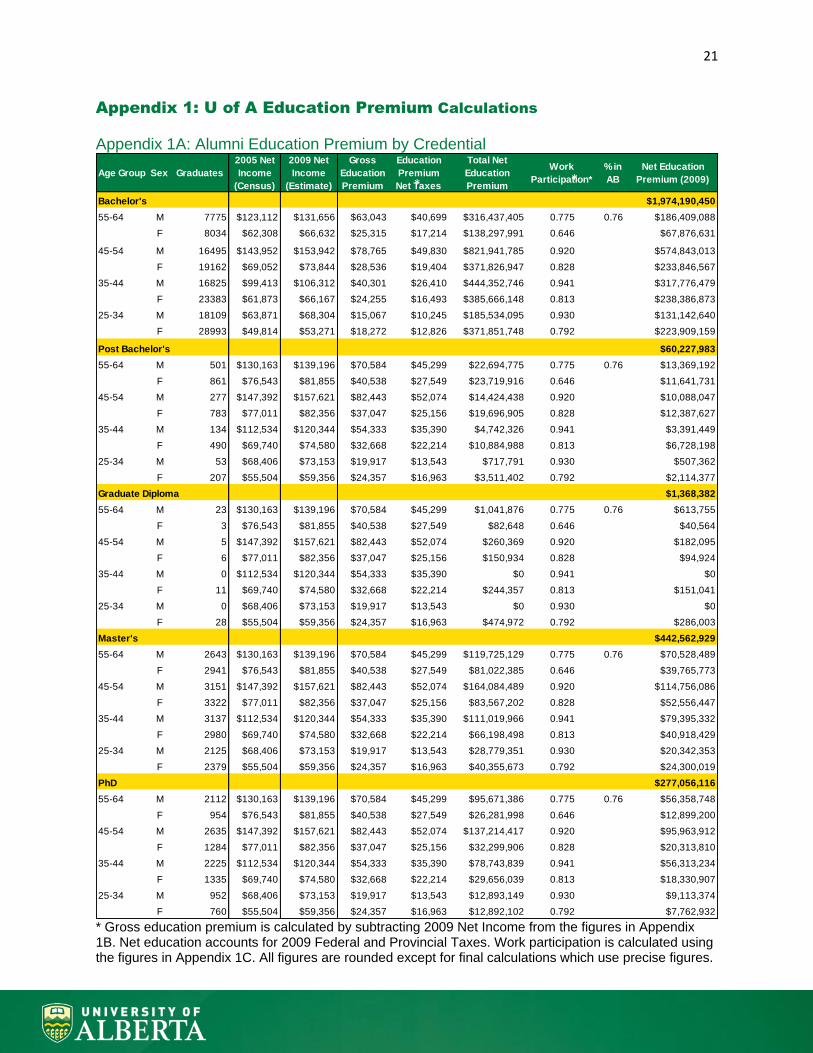
Appendix 1: U of A Education Premium Calculations
Appendix 1A: Alumni Education Premium by Credential
* Gross education premium is calculated by subtracting 2009 Net Income from the figures in Appendix 1B. Net education accounts for 2009 Federal and Provincial Taxes. Work participation is calculated using the figures in Appendix 1C. All figures are rounded except for final calculations which use precise figures.
Age Group Sex Graduates
2005 Net
Income
(Census)
2009 Net
Income
(Estimate)
Gross
Education
Premium
Education
Premium
Net Taxes
Total Net
Education
Premium
Work
Participation*
% in
AB
Net Education
Premium (2009)
Bachelor's $1,974,190,450
55-64 M 7775 $123,112 $131,656 $63,043 $40,699 $316,437,405 0.775 0.76 $186,409,088
F 8034 $62,308 $66,632 $25,315 $17,214 $138,297,991 0.646 $67,876,631
45-54 M 16495 $143,952 $153,942 $78,765 $49,830 $821,941,785 0.920 $574,843,013
F 19162 $69,052 $73,844 $28,536 $19,404 $371,826,947 0.828 $233,846,567
35-44 M 16825 $99,413 $106,312 $40,301 $26,410 $444,352,746 0.941 $317,776,479
F 23383 $61,873 $66,167 $24,255 $16,493 $385,666,148 0.813 $238,386,873
25-34 M 18109 $63,871 $68,304 $15,067 $10,245 $185,534,095 0.930 $131,142,640
F 28993 $49,814 $53,271 $18,272 $12,826 $371,851,748 0.792 $223,909,159
Post Bachelor's $60,227,983
55-64 M 501 $130,163 $139,196 $70,584 $45,299 $22,694,775 0.775 0.76 $13,369,192
F 861 $76,543 $81,855 $40,538 $27,549 $23,719,916 0.646 $11,641,731
45-54 M 277 $147,392 $157,621 $82,443 $52,074 $14,424,438 0.920 $10,088,047
F 783 $77,011 $82,356 $37,047 $25,156 $19,696,905 0.828 $12,387,627
35-44 M 134 $112,534 $120,344 $54,333 $35,390 $4,742,326 0.941 $3,391,449
F 490 $69,740 $74,580 $32,668 $22,214 $10,884,988 0.813 $6,728,198
25-34 M 53 $68,406 $73,153 $19,917 $13,543 $717,791 0.930 $507,362
F 207 $55,504 $59,356 $24,357 $16,963 $3,511,402 0.792 $2,114,377
Graduate Diploma $1,368,382
55-64 M 23 $130,163 $139,196 $70,584 $45,299 $1,041,876 0.775 0.76 $613,755
F 3 $76,543 $81,855 $40,538 $27,549 $82,648 0.646 $40,564
45-54 M 5 $147,392 $157,621 $82,443 $52,074 $260,369 0.920 $182,095
F 6 $77,011 $82,356 $37,047 $25,156 $150,934 0.828 $94,924
35-44 M 0 $112,534 $120,344 $54,333 $35,390 $0 0.941 $0
F 11 $69,740 $74,580 $32,668 $22,214 $244,357 0.813 $151,041
25-34 M 0 $68,406 $73,153 $19,917 $13,543 $0 0.930 $0
F 28 $55,504 $59,356 $24,357 $16,963 $474,972 0.792 $286,003
Master's $442,562,929
55-64 M 2643 $130,163 $139,196 $70,584 $45,299 $119,725,129 0.775 0.76 $70,528,489
F 2941 $76,543 $81,855 $40,538 $27,549 $81,022,385 0.646 $39,765,773
45-54 M 3151 $147,392 $157,621 $82,443 $52,074 $164,084,489 0.920 $114,756,086
F 3322 $77,011 $82,356 $37,047 $25,156 $83,567,202 0.828 $52,556,447
35-44 M 3137 $112,534 $120,344 $54,333 $35,390 $111,019,966 0.941 $79,395,332
F 2980 $69,740 $74,580 $32,668 $22,214 $66,198,498 0.813 $40,918,429
25-34 M 2125 $68,406 $73,153 $19,917 $13,543 $28,779,351 0.930 $20,342,353
F 2379 $55,504 $59,356 $24,357 $16,963 $40,355,673 0.792 $24,300,019
PhD $277,056,116
55-64 M 2112 $130,163 $139,196 $70,584 $45,299 $95,671,386 0.775 0.76 $56,358,748
F 954 $76,543 $81,855 $40,538 $27,549 $26,281,998 0.646 $12,899,200
45-54 M 2635 $147,392 $157,621 $82,443 $52,074 $137,214,417 0.920 $95,963,912
F 1284 $77,011 $82,356 $37,047 $25,156 $32,299,906 0.828 $20,313,810
35-44 M 2225 $112,534 $120,344 $54,333 $35,390 $78,743,839 0.941 $56,313,234
F 1335 $69,740 $74,580 $32,668 $22,214 $29,656,039 0.813 $18,330,907
25-34 M 952 $68,406 $73,153 $19,917 $13,543 $12,893,149 0.930 $9,113,374
F 760 $55,504 $59,356 $24,357 $16,963 $12,892,102 0.792 $7,762,932
* *

22
Appendix 1B: Average Net Income for Alberta Region below Bachelor Level
2005 2009
Age Group
Sex Net Income
(Census) Net Income
(Est.)
Certificate or Diploma Below Bachelor’s Level
55-64 M $64,160 $68,613
F $38,636 $41,317
45-54 M $70,299 $75,178
F $42,368 $45,308
35-44 M $61,727 $66,011
F $39,192 $41,912
25-34 M $49,782 $53,237
F $32,728 $34,999
Appendix 1C: Work Participation in Alberta
Age Group
Participation (Male; %)
Male Labor Force (M)
Participation (Female; %)
Female Labor Force (M)
Male Participation
Female Participation
60-64 0.688 56.2 0.535 43.7
55-59 0.830 89.2 0.710 75.4 0.775 0.646
50-54 0.907 121.4 0.800 99
45-49 0.933 125.7 0.851 116 0.920 0.828
40-44 0.942 121.1 0.832 101.3
35-39 0.940 126.1 0.793 93.2 0.941 0.813
30-34 0.929 128.4 0.777 97.9
25-29 0.931 142.1 0.806 109.3 0.930 0.792