university of azuay faculty of law school of …
TRANSCRIPT
UNIVERSITY OF AZUAY
FACULTY OF LAW
SCHOOL OF INTERNATIONAL STUDIES
Graduation Project prior to obtaining the Degree in
International Studies, with a major in Foreign Trade
INTERNALIZATION PLAN FOR
INSERTING THE BLAUPUNKT BRAND IN
THE PERUVIAN MARKET
Authors:
Fausto Andrés Ortega Coronel,
Sofía Nicole Ottati Vélez
Director:
Arq. Ramón Valdivieso
Cuenca, Ecuador
2021

II
DEDICATION
To my entire family, especially my parents Fausto and Nube for their support. Also, to the people
who transformed my time into one of the best experiences of my life during my university
career.

III
DEDICATION
I dedicate this work to my family, to my parents Fernando and María Paz for their
unconditional support during my university career, for being my guide to achieve my greatest
victories. Without them it would have been impossible to be where I am today.

IV
GRATEFULNESS
I thank my parents for their support; the Arq. Ramón Valdivieso for his valuable lead and
advice; and my partners for their friendship until the end of this journey.

V
GRATEFULNESS
I thank God for his blessings during this pandemic; my parents for their unconditional
support; and Arq. Ramón Valdivieso for his teachings in the classrooms, for sharing with us
his knowledge, experience and commitment in this degree project.

VI
ABSTRACT
The current degree project consists of an Internalization Plan for the Blaupunkt television
brand into the Peruvian market through the firm MP3 that owns a license on the television
brand. The first chapter will include a brief introduction of International Trade Theories, an
analysis of the Ecuadorian political, economic, social, technological, ecological and legal
framework, a Porter's Competitive Diamond based on the same framework, and finally a
SWOT analysis will be carried out to raise the firm’s awareness of the risks, challenges and
benefits of internalization into the Peruvian market. Finally, the Peruvian market will be
evaluated through a PESTEL analysis; and the Porter Diamond will be discussed. This
project will conclude with a financial analysis to know the feasibility of the internalization of
the Blaupunkt TV brand into the Peruvian market.
Key Words
International Trade, Internalization plan, Covid-19, Free Trade, Competence, Retail chains.
VII
GENERAL INDEX
DEDICATION II
DEDICATION III
GRATEFULNESS IV
GRATEFULNESS V
ABSTRACT VI
1 CHAPTER I 12
1.1 Introduction 12
1.2 Concepts and the importance of International Trade 12
1.3 Theories of International Trade 13
1.3.1 Mercantilism 13
1.3.2 Singer and Prebish's Thesis. 14
1.3.3 Absolute Advantage by Adam Smith 16
1.3.4 Comparative Advantage Theory by David Ricardo 18
1.3.5 Product Life Cycle Theory 21
1.3.6 Hecksher and Ohlin's Theory 22
1.3.7 Competitive Advantage Theory by Michael Porter 23
1.3.8 Leontief's Paradox 25
1.3.9 The New Theory of International Trade by Krugman 25
1.3.10 Theory of Internalization. 26
1.4 Conclusions of the chapter 28
2 CHAPTER II 31
2.1 Introduction to the selected firm 31
2.2 History of Blaupunkt 32
2.2.1 Awards 35
2.3 PESTEL Analysis 35
2.3.1 Political Analysis 35
2.3.2 Economic analysis 40
2.3.3 Social analysis 51
2.3.4 Technological Analysis 52
2.3.5 Legal Analysis 54
2.4 Porter Diamond Analysis 55
2.4.1 Demand 55
2.4.2 Competence 57

VIII
2.4.3 Factor 61
2.4.4 Cooperation 63
2.5 SWOT ANALYSIS 64
2.5.1 Strengths 64
2.5.2 Weakness 65
2.5.3 Opportunities 65
2.5.4 Threats 66
2.6 Conclusions of the chapter 66
2.7 Summary Tables 70
2.7.1 PESTEL Analysis 70
2.7.2 Porter's Diamond 73
3 CHAPTER III 76
3.1 PESTEL Analysis of the Peruvian market 76
3.1.1 Political Analysis 76
3.1.2 Economic Analysis 80
3.1.3 Social Analysis 85
3.1.4 Technological Analysis 87
3.1.5 Ecological Analysis. 89
3.1.6 Legal Analysis 90
3.2 Interview to the Head of Television Line. 92
3.3 Internalization Case of the Peruvian market 95
3.4 Competitive Diamond by Porter 96
3.4.1 Demand 96
3.4.2 Competence 98
3.4.3 Factors 107
3.4.4 Related and support sectors 108
3.5 Marketing Plan 109
3.6 Product 110
3.6.1 Product Inventory 110
3.6.2 Technical Assistance, Installation and Training System. 110
3.6.3 Additional Products 111
3.7 Price 111
3.8 Place: La Curacao 113
3.9 Promotion 113
3.10 Financial Analysis 114
3.11 Conclusions of the chapter 115
3.12 Summary Tables 120

IX
3.12.1 PESTEL Analysis 120
3.12.2 Competitive Diamond 124
4 GENERAL CONCLUSIONS 127
5 RECOMMENDATIONS 132
6 BIBLIOGRAPHY 134

X
LIST OF TABLES
TABLE 1. BANANA AND COFFEE PRODUCTION WITHOUT TRADE 17
TABLE 2. BANANA AND COFFEE PRODUCTION WITHOUT TRADE 18
TABLE 3. BANANA AND COCOA PRODUCTION WITHOUT TRADE 19
TABLE 4. EXAMPLE OF COMPARATIVE ADVANTAGE BETWEEN ECUADOR AND BRAZIL 20
TABLE 5. .ECUADOR'S RATING IN THE DOING BUSINESS REPORT 38
TABLE 6. INDICATOR IPC ( NOVEMBER) 45
TABLE 7. OBLIGATIONS WITH REGULATORY ENTITIES 54
TABLE 8. ANALYSIS OF THE PRICES OF SAMSUNG TV BRAND 57
TABLE 9. ANALYSIS OF THE PRICES OF INDURAMA TV BRAND 58
TABLE 10. ANALYSIS OF THE PRICES OF TCL TV BRAND 58
TABLE 11. ANALYSIS OF THE PRICES OF HYUNDAI TV BRAND 58
TABLE 12. ANALYSIS OF THE PRICES OF LG TV BRAND 58
TABLE 13. ANALYSIS OF THE PRICES OF DIGGIO TV BRAND 59
TABLE 14. ANALYSIS OF PRICES OF RIVIERA TV BRAND 59
TABLE 15. ANALYSIS OF PRICES OF SONY TV BRAND 59
TABLE 16. ANALYSIS OF PRICES OF GLOBAL TV BRAND 60
TABLE 17. ANALYSIS OF PRICES OF GLOBAL TV BRAND 60
TABLE 18. POLITICAL, LEGAL AND SOCIAL ENVIRONMENT OF THE ECUADORIAN MARKET 70
TABLE 19. ECONOMIC SPHERE OF THE ECUADORIAN MARKET 71
TABLE 20. ECOLOGICAL SPHERE IN THE ECUADORIAN MARKET 73
TABLE 21. TECHNOLOGICAL SPHERE IN THE ECUADORIAN MARKET 73
TABLE 22. DEMAND OF THE TV MARKET 73
TABLE 23. COMPETENCE OF THE TV MARKET 74
TABLE 24. INFRASTRUCTURE, INPUTS, LABOR AND COOPERATION 74
TABLE 25. REPORT DOING BUSINESS IN PERU 78
TABLE 26. INFLATION RATE 2020 IN PERU 83
TABLE 27. GROWTH PROJECTIONS BY WORK BANK 85
TABLE 28. DISTRIBUTION OF EXPENSES IN PERUVIAN HOUSEHOLDS 86
TABLE 29. RANKING GLOBAL INNOVATION INDEX OF LATIN AMERICA 88
TABLE 30. ANALYSIS OF THE SAMSUNG TV IN THE STORE EL METRO 98
TABLE 31. ANALYSIS OF THE LG TV IN THE STORE EL METRO 99
TABLE 32. ANALYSIS OF THE PANASONIC TV IN THE STORE EL METRO 99
TABLE 33. ANALYSIS OF THE PHILIPS TV IN THE STORE EL METRO 99
TABLE 34. ANALYSIS OF THE AOC TV IN THE STORE EL METRO 100
TABLE 35. ANALYSIS OF THE HISENSE TV IN THE STORE EL METRO 100
TABLE 36. ANALYSIS OF THE SONY TV IN THE STORE EL METRO 100
TABLE 37. ANALYSIS OF THE SAMSUNG TV IN THE STORE LA CURACAO 100
TABLE 38. ANALYSIS OF THE LG TV IN THE STORE LA CURACAO 101
TABLE 39. ANALYSIS OF THE HISENSE TV IN THE STORE LA CURACAO 102
TABLE 40. ANALYSIS OF THE AOC TV IN THE STORE LA CURACAO 102
TABLE 41. ANALYSIS OF THE PHILIPS TV IN THE STORE LA CURACAO 102
TABLE 42. ANALYSIS OF THE HYUNDAI TV IN THE STORE LA CURACAO 103
TABLE 43. ANALYSIS OF THE HAIER TV IN THE STORE LA CURACAO 103
TABLE 44. ANALYSIS OF THE PANASONIC IN THE STORE LA CURACAO 103
TABLE 45. ANALYSIS OF THE SAMSUNG TV IN THE STORE LINIO-PERU 104
TABLE 46. ANALYSIS OF THE SONY TV IN THE STORE LINIO-PERU 104
TABLE 47. ANALYSIS OF THE PHILIPS TV IN THE STORE LINIO-PERU 105
TABLE 48. ANALYSIS OF THE PANASONIC TV IN THE STORE LINIO-PERU 105
TABLE 49. VIEW, MISIÓN, OBJECTIVES OF THE FIRM 109

XI
TABLE 50. TVS IN STOCK 110
TABLE 51. COMPETITOR'S PRICE RANGE 112
TABLE 52. PRICE OF THE PRODUCT 112
TABLE 53. FINANCIAL ANALYSIS 114
TABLE 54. POLITICAL, SOCIAL AND LEGAL ANALYSIS 120
TABLE 55. ECONOMIC ANALYSIS OF PERU 121
TABLE 56. TECHNOLOGICAL ANALYSIS 123
TABLE 57. . ECOLOGICAL ANALYSIS 123
TABLE 58. COMPETENCE OF PRICES 124
TABLE 59. DEMAND 125
TABLE 60. FACTORS: INFRASTRUCTURE, INPUTS, LABOR AND COOPERATION 126
LIST OF FIGURES
FIGURE 1. EASE OF DOING BUSINESS INDEX IN ECUADOR 39 FIGURE 2. EASE OF DOING BUSINESS INDEX IN ECUADOR 41 FIGURE 3. OIL AND NON-OIL GVA 43 FIGURE 4. GLOBAL INNOVATION INDEX IN ECUADOR 46 FIGURE 5. UNIFIED BASIC SALARY 50 FIGURE 6. TV IMPORTATIONS IN THE LAST 5 YEARS 56 FIGURE 7. MP3 INSTALLATIONS 62

12
1 CHAPTER I
THEORIES OF INTERNATIONAL TRADE
1.1 Introduction
The Chapter analyzes the several theories of International Trade promoted over time to
understand the reasons why countries seek to participate in International Trade. The analysis
begins studying Protectionist Theories such as Mercantilism and the Prebisch-Singer Thesis,
as well as Free Trade Theories such as Adam Smith's Absolute Advantage Theory, David
Ricardo's Comparative Advantage Theory, Product Life-Cycle Theory, Hecksher and Ohlin's
Theory, Leontief Paradox Theory, the New Theory of International Trade by Krugman. Then,
Porter’s Competitive Advantage Theory is mentioned and finally, the Internalization Theory
is presented as the core argument for carrying out this brand internalization.
1.2 Concepts and the importance of International Trade
The definitions of International Trade can vary depending on the author. According to Oscar
Bajo (1991), International Trade is the exchange of goods and services between agents that
reside in different nations (understood as different political jurisdictions). This scenario is the
result of the complexity of modern societies and requires a greater degree of specialization of
the economic units that comprise them. Furthermore, the diverse needs and preferences of the
different economic agents, provoke a growth of the exchange of goods between these agents.
On the other hand, Alfonso Ballesteros (2001) defines International Trade as an ancient
practice as any other human activity. Subsequently, it would be complex to find a whole
definition that includes all the faces of Foreign Trade. During the last century, the Industrial
Revolution represented the starting point of the international division of labor in
industrialized countries. Based on those facts, the International Trade refers to the economic

13
activity of exchange of goods, capital and services performed by a certain country with the
rest of the countries; thus, it will be regulated by international norms or bilateral agreements.
According to Krugman (2006), International Trade is understood as the sale of goods and
services by countries which means export goods whose production requires an intensity of
their abundant resources and imports those goods whose production requires intensity in the
use of their scarce resources.
At present, living in a globalized world where there is a reduction of distance due to
technological and telecommunications advances has generated a more interconnected
relationship between countries in the trade field. Consequently, the shifts in direction and
composition of world trading have generated a smaller world; thereby, causing a process of
globalization of markets and production. This exchange of goods and services between
countries is what today we call Foreign Trade or International Trade (Lombana, Rozas and
Corredor).
1.3 Theories of International Trade
1.3.1 Mercantilism
Based on the Theories of International Trade promoted around centuries, the first
theory is Mercantilism. This theory emerged in England in the mid-sixteenth century when
currency used in the trade exchange of the time was based on precious metals, mainly gold
and silver. The accumulation of those metals, obtained by the exportation towards external
markets, meant wealth and prosperity for a nation. In contrast, the importation of goods
generates an outflow of gold and silver in favor of other markets. Thereby, the vision for
mercantilism was that it was more convenient for a country to maintain the trade surplus,
14
which means to export more than import; in this way, the wealth, gold and silver will
increase, and it will represent prestige and power for a nation (Hill).
This doctrine emphasizes state intervention in terms of economy. To achieve this trade
surplus, it is necessary to stimulate the sales and to curb the flow of imports; so gold and
silver outputs were limited by using economic tools such as quotes or duties while exports
had subsidies. However, in 1752 the economist David Hume analyzed the contradictions of
this theory. Once a trade surplus entry of precious metals was reached, it would lead to an
increase of supply of money in the exporting country and then lead to inflation. On the
contrary, in the importing country, the outflow of wealth would have an opposite effect
because prices will fall due to the increased demand of money. In the long-term the importing
country will take advantage of the reduction in price of its products and the increase in price
of the rival nation since the nation that originally had a trade surplus would be forced to buy
more products from its competitors. For that reason, this cycle will continue, and any of the
nations will maintain a positive trade balance (Rojas).
As we can notice, the Mercantilism Approach tends to be a very short-sighted view as its
boosters consider commercial relations as games of power, where there is a winner nation
based on its economic profits, and a loser nation where there is no mutual benefit among
nations (Rojas).
1.3.2 Singer and Prebish's Thesis.
The publication of the first two works in English of Singer and Prebish’s Thesis were
almost simultaneous. In May 1950 the first English version emerged from “The Economic
Development of Latin America and its main issues'', by Raúl Prebisch; equally, in the same
month, Hans Singer published his article called” The distribution of gains between investing
and borrowing countries''. The Singer and Prebish's Thesis is based on the barring major

15
shifts in the structure of the world economy, the profits from trade will continue to be
distributed unfairly between nations that export primary products and nations whose imports
are manufactured products. Thus, the inequality of per capita income between these two types
of countries will increase with the growth of trade, rather than decrease. It was taken as an
indicator of the need for both industrialization and tariff protection (Toye).
Prebisch and Singer identified two types of negative effects on the trade conditions of
primary commodities. One effect occurs because of the different characteristics of the
product, the market factor as cost plus a margin and unionization of labor in the industry.
Another negative effect happens due to the asymmetric distribution of the results, and its
impact on future demand. It is beneficial for the industry and unfavorable for agriculture
(Toye).
Singer and Prebish's Thesis mentioned that there is a secular decline in terms of trade for
the developing countries in their relations with industrialized countries. The Studies are often
focused on the temporal trend of the price of primary products relative to the price of
manufacturers in International Trade, as Prebisch and Singer noted that the exportations of
developing countries are dominated by the raw materials and the importations are dominated
by manufactured products. The issue is whether a clear downward trend can be established in
the relative price of primary products throughout the 20th century or in substantial portions of
it. The results of this study showed that the situation is even more unfavorable for developing
countries, due to the products in which they specialize today are replaced more easily by
artificial raw materials. Additionally, an increased evolution of the processed food industry
has gained a large market share from food products from developing countries. For that
reason, these countries should keep a policy of industrialization through import substitution,
for which they should encourage a trade policy of selective protectionism (Bloch).
16
1.3.3 Absolute Advantage by Adam Smith
According to this model, it has been substantiated that Mercantilism is an unsustainable
model that portrayed wealth in precious metals; thus, trade could be limited. For that reason,
a doctrine based on a free trade emerged, and that trading exchange between nations will
bring mutual benefits. In this way, Adam Smith, the father of the modern economy, set a
dichotomy concept of the classical notion about “wealth” in his book the Wealth of Nations
(1776) he considered that the wealth of a nation is based on their production capacity, and the
man force. His way of thinking shook up the thoughts that considered International Trade as a
zero-sum (Lombana, Rozas and Corredor).
Based on this concept of wealth, the Absolute Advantage Theory emerges based on the
fact that a country should specialize in the production of the good that is produced more
efficiently. In other words, the good that is produced using the least number of resources. As
they specialize in its production, countries will try to access the highest level of customer
satisfaction. (Lombana, Rozas and Corredor)
This model is focused in a world conformed by two countries and two goods in which
there is a free mobility of production factors. Also, there are constant production costs, thus,
it requires the same number of available resources for each unit produced. Conversely, this
model does not consider transportation costs. There is a perfect market which does not
consider the existence of tariff-quotas or differentiated tax rates and the amount of land,
capital and labor resources are limited (Lombana, Rozas and Corredor).
To better understand this model there are the following assumptions:

17
● There is a world conformed by two countries Ecuador and Bolivia, both countries
produce bananas and coffee and they have 600 units of resources that require to be
allocated in the production of bananas and coffee.
● Ecuador will allocate 20 resources for the production of bananas while for the
production of coffee, it will be 60 resources. On the other hand, Bolivia will allocate
50 resources for the production of bananas while for the production of coffee, it will
be 30 resources.
Table 1. Banana and coffee production without trade
Resource per ton Total of Resources
Countries Banana Coffee
Ecuador 20R 60R 80R
Bolivia 50R 30R 80R
Elaborated: Authors
Applying the model of Absolute Advantage, Ecuador must specialize in the
production of bananas given that it is more efficient than producing coffee, while
Bolivia must specialize in the production of coffee given that it is more efficient than
producing bananas.
Additionally, Ecuador must allocate all resources to the production of bananas (80
resources), while Bolivia must allocate all resources to the production of coffee (80

18
resources). Hence, it is proved the Absolute Advantage Theory in which both
countries must specialize in what they produce with more efficiency.
Table 2. Banana and coffee production without trade
Resource per ton
Countries Banana Coffee
Ecuador 80R
Bolivia 80R
Total 80R 80R
Elaborated: Authors
1.3.4 Comparative Advantage Theory by David Ricardo
David Ricardo analyzed the Absolute Advantage Theory, he mentioned that with this
model a country would not obtain any benefit from International Trade. In such a way,
Ricardo promoted the Comparative Advantage Theory in his book “Principles of Economic
Policy and Taxation “(1817), it refers to the fact that a country must specialize in the goods
that produces with more efficiently, and besides import from other countries what they
produce with less efficiently (Hill).
Therefore, this model emerged as the contemporary argument in favor of Free Trade
without restrictions. Notwithstanding at the moment of import, export, it is indispensable to
consider the relative prices which are the cost of producing one good in terms of the cost of
producing the other within the same country. Conversely, despite a country having an

19
absolute advantage in both goods, it will generate trade due to the differences in opportunity
costs and relative prices in each country, so this will bring mutual benefits from trade
(Lombana, Rozas and Corredor).
To better understand the model, it will be analyzed the following assumptions:
● A world conformed by two countries Ecuador and Brazil; they have 200 units of
resources. Suppose that Ecuador produces bananas and cocoa and has the absolute
advantage in both goods. However, in Ecuador they need 10 resources to produce one
ton of cocoa and 15 resources to produce one ton of bananas, Ecuador can produce 20
tons of cocoa without bananas, 13.33 tons of bananas without cocoa.
● By contrast, in Brazil, they need 40 resources to produce one ton of cocoa and 25 to
produce one ton of bananas. In this way, Brazil can produce 5 tons of cocoa without
bananas and 8 tons of bananas without cocoa.
Table 3. Banana and cocoa production without trade
200 Resource Units Resource per ton
Countries Banana Cocoa
Ecuador 15R 10R
Brazil 25R 40R
Total 40R 50R
Elaborated: Authors

20
Table 4. Example of Comparative Advantage between Ecuador and Brazil
200
Resource
Units
Resource per ton
Countries Banana Cocoa
Ecuador 13.33 t 20t
Brazil 8t 5t
Elaborated: Authors
Suppose that without trade each country dedicates half of its resources to cocoa production
and the other half for banana production, in these situations without trade Ecuador will
produce 10 tons of cocoa and 6.7 tons of bananas. Even though Ecuador has the absolute
advantage in both goods, it only has a comparative advantage in producing cocoa since
Ecuador produces four times more cocoa than Brazil, but only 1.6 times more than bananas.
This means that Ecuador must specialize in the production of cocoa.
To conclude, without trade, each country consumes what they produce; conversely, if
there is a trade exchange between two countries, this means that they can increase their joint
production of bananas and cocoa. Therefore, consumers from Brazil and Ecuador can have
mutual benefits.

21
1.3.5 Product Life Cycle Theory
In 1966 the American economist, Raymond Vernon, promoted the Product Life Cycle
Theory which is based on how the production of a specific product is carried out in the
country where was invented the product, since the rest of countries are supplied by exports
until there is a change; thus, at the moment the product is standardized, the production of it, is
transferred to other countries where labor costs are lower (Casanova and Zuaznábar).
This process is comprised by three stages:
1. Stage of creation: in this stage the product is manufactured, it keeps the internal
consumption in this country and the constant improvement of the productive process;
therefore, in this stage does not take place International Trade;
2. Stage of maturation: in this stage the production is standardized and is produced on
a larger scale. For that reason, when a foreign demand arises from other countries
with high incomes, the product is exported and it can be produced in other places;
3. Stage of uniform product: in this stage the product becomes dominant in the foreign
and domestic market, since their production is transferred to countries with lower
labor costs. The importance of this stage is that the exporter can become an importer
and can generate new dynamics in the International Trade (Casanova and
Zuaznábar).
It is crucial to highlight that, production cannot always be transferred completely to
another country, as this model determine because sometimes this product has a great
acceptance in the domestic market, the strength of work that presented differences in value
from one country to another; thus, there can be other factors such as the qualification, the

22
existence of raw materials and the technology production that is the case of foodstuffs which
does not relocate from one place to another (Casanova and Zuaznábar).
1.3.6 Hecksher and Ohlin's Theory
One of the pillars of the modern theory of international exchange is the Heckscher-Ohlin
theorem which was mentioned by Eli Heckscher (1919), and developed by Bertil Ohlin
(1935). Swedish economists suggested an alternative to the Comparative Advantage Theory,
which developed from the differences regarding the productivity of diverse countries as a
notion of advantage. In the Hecksher and Ohlin Theory, the advantage factor is given by the
different production factors that each country has (land, capital and workforce). Thus,
Heckscher and Ohlin argued that countries require to specialize in the production of the
goods that take advantage of their most abundant factors, and should import goods elaborated
with scare factors. In this sense, Heckscher and Ohlin affirmed how the framework of the
International Trade is determined by differences in factor endowments, rather than the
differences in productivity (Hill).
This model is comprised by two proposals:
● The last reason that explains the differences of the comparative costs and
consequently, of the exchange between different countries is the diverse factor
endowments of them. Hence, each country specializes in the production of goods that
incorporate its abundant factor or factors in order that the Foreign Trade supposed a
change of abundant factors for scarce, included all of them in the exchanged goods
(Requeijo).
● The Free Trade of products tends to equal the relative prices of the production factors
in all countries (Requeijo).

23
1.3.7 Competitive Advantage Theory by Michael Porter
Michel Porter proclaimed "The Competitive Advantage of Nations", it refers that
competitiveness has become an issue of concern for governments and industries due to the
fact that competitiveness will depend on the level of competition that a country has (Revista
Facetas).
The main objective of a nation is to promote a high level of life for its citizens and for
that it depends on the productivity with which the capital and labor resources in a nation are
harnessed. When productivity is mentioned, it refers to the value of the yield of a unit of
labor or capital, this depends on the quality and characteristics of products and the efficiency
of the manufacturing process (Revista Facetas).
It is indispensable to emphasize that competitiveness is interconnected to the productivity
of the firms, efficient production methods, the quality of the products, and also the
improvement over time and the effectiveness of business management. In this way, to
achieve this competitive advantage it requires the improvement in innovation and change. In
addition, innovation refers to the design of a new product, in the way of approaching the
market or in a new way of training and organizing. In such a way, some innovations create
competitive advantages when a company considers something entirely new that buyers need.
Porter provided four features that operate competitive advantage at the national and
enterprise sphere.
1. Factor Condition: Porter's analysis goes beyond the relevance of natural resources
rather focusing on the importance of human resources especially the level of training,
knowledge, skills and abilities acquired from workers (París).
24
2. Demand conditions: Demand conditions: if a product demands a large number of
consumers, this will stimulate the growth of companies in that sector. Likewise, it
is relevant the size of the market, and the level of consumer requirements; thus, at
the moment of having demanding consumers, this generates an incentive to improve
the quality of companies and achieve a higher level of success in the international
markets. It is important to keep in mind innovation in the companies given that
consumers are always looking for new products open to improvement (París).
Therefore, when the consumers of a country are proponents of trends that with the
time are expanded to the rest of the world, the firms of that country are prepared to
meet the demand related to new trends in other countries. Finally, it is necessary to
have a large domestic market, but also to position brands worldwide (París).
3. Strategy, structure and competence of a firm: while more competitors coexist in
the market, there are more opportunities for the firms to be forced to improve. The
existence of more competence in a specific field generates natural selection and the
strengthening of survivors. That is the case of the Japanese automotive industry where
many manufacturers’ cars have competed intensely for many years for the Japanese
domestic market. The Japanese car manufacturers with success in international
markets are the most successful survivors in this internal controversy (Paris). On the
other hand, sometimes there is saturation on the market and this makes companies
look for new markets abroad. Furthermore, there are other reasons why companies
seek to internalize business management, the knowledge and skills of managers, their
motivation, knowledge of languages and culture. Likewise, the behavior of the
government and the public administrations, legislation, tax system, subventions and
incentives favor internalization (París).
25
4. Related and supporting industries: to be successful in a sector, it requires the
cooperation between companies to generate enterprise networks, facilitating the
competitiveness among firms, it also allows the multiplicity of provision and
advanced suppliers very competitive which provide quality components at low cost in
favor of the competitiveness of a specific sector. Hence, it is set out as one of the
main factors that determine the location of a productive installation (París).
1.3.8 Leontief's Paradox
In 1953 Wassily Leontief published his most important article based on the analysis of the
Heckscher-Ohlin Theory. In which he substantiated with statistical information of that period
about the economic outlook of the United States, in which the world's most developed
economy was specialized in labor-intensive exports rather than capital-extensive exports. The
paradox is generated when we lead that labor is a relative production factor and does not
imply the same costs in all countries. In the case of the United States, goods were produced
employing expensive labor, instead of taking advantage of the abundant capital; in this way, a
paradox was generated. This is at odds with the belief of that time about developed countries
due to their technological advances, which would breed products that would require less labor
to produce the same. Immediately, this theory can be moot introducing other aspects such as
rates, endowments of natural resources, human capital, technological differences and the
reversal of techniques (Cuevas).
1.3.9 The New Theory of International Trade by Krugman
In 1970 the New Theory of International Trade emerged when several economists led by Paul
Krugman accentuated the capacity of the firms to achieve scale economies that would have
crucial implications to International Trade. In this sense, Krugman promoted his theory with
the concept of “Scale Economies”, which states that higher volumes of production cause

26
lower costs which facilitate the supply of products, and benefit consumers. We could infer
those countries would be more competitive, in economic terms, if their industry is able to
increase their average costs regarding marginal costs; at the moment these are reduced, the
production is increasing in escalation (Hill).
Krugman recognized that in International Trade, countries also make exchanges of goods
and services for their industries in what is known as Interindustry Trade. Based on these
concepts, Krugman focused this theory in the hypothesis that consumers appreciate the
diversity of consumption and from the supply or producer side, Krugman explained that
Interindustry Trade is advantageous for a country, by allowing each country to take
advantage of the scale economies and also in a global context, consumers are advantaged by
low prices and the diversity of products (Sánchez).
In the same way, Krugman proved a valuable analysis about the global dynamics North-
South. He explained that the productive labor factor seeks to be located where it has income
and well-being, in this case we call North. In this way, it is easy for the North to carry out an
economy of scale in the production of products. On the contrary, the South becomes an
exporter of raw materials, this area stands out for having an abundant productive land factor.
Thus, an Interindustry Trade relationship is generated between economies of scale. (Hill)
1.3.10 Theory of Internalization.
Buckley and Casson in their work "The Future of Multinational Enterprise" (1976) carried
out a theory based on the growth of the company using the concept of market internalization
(Renau). In this way, four relevant factors were determined for the market’s internalization:
1.Specific factors of the industry based on the nature of the product and the structure of
markets;

27
2. Specific factors of a region concerning to the geographic and social characteristics of the
regions connected with the market;
3. Specific factors of a nation concerning to the political and fiscal relations between these
nations;
4. Specific factors of the firm which are focused on the ability of the firm to manage,
organize the domestic markets, clearer to internalize transactions (Renau).
Hence, the internalization of transactions will be interconnected to multinational
companies which are created when transactions are internalized beyond national borders
(Renau). Thus, multinationals are an alternative mechanism to the market in order to manage
value activities of the firms across national border to get involved in direct investments
abroad; so, there must be two conditions:
1. When locating activities in abroad there are several advantages this means, compare the
unit costs of producing in the domestic market and exporting the product to the foreign
country regarding to the costs of producing in that country in which influence some aspects
such as the cost of productive factors, transport costs and tariffs, state intervention, the
economies of scale in certain activities, their complexity and the degree of integration and
finally, the type of market structure (Cardoso, Chavarro and Ramírez).
2. It is vital to be more efficient when organizing certain activities within the company, it
refers to the transaction costs associated with the market, there are classified as:
A. Delays caused by having different activities connected by the market.
B. Conflicts arising from the bilateral concentration of power.
C. Difficulty in pricing a technology transfer.

28
D. Specific aspects regarding the international markets such as tariffs and restrictions on
capital movements.
In this sense, the benefits of internalization emerge by avoiding the costs associated with
the imperfections of foreign markets, and will imply the creation of a multinational company
to the extent that it is carried out beyond national borders (Cardoso, Chavarro and Ramírez).
1.4 Conclusions of the chapter
The globalization of markets and production caused the evolution of International Trade;
that is the reason why, today countries are more interconnected and have increased the
commercial exchange of goods and services between countries. In this way, free trade is a
basic tool for the economic growth of nations. Thus, the Absolute Advantage Theory
highlights the importance of specialization in the production of the most efficient good that a
country has, using the least number of resources. Likewise, David Ricardo complements this
theory and emphasizes not only the relevance of specialization in the most efficient good, but
also the need to import from other countries what is produced less efficiently.
Further on with the evolution of the International Trade Theories, several of these
postulates will be updated, as the case of the Hecksher and Ohlin Theory, where the
advantage is given by the productive factors (labor, land and capital). Consequently, without
commerce each country consumes what it produces; conversely, through commercial
exchange both countries can increase their joint production.
Currently, these productive factors of labor, capital, and land are not the only facts that
determine the competitiveness of a country. The technological factor has taken a leading role
in the production of the modern firm since it increased the levels of competitiveness and
development. In the case of India, this country stands out for its abundant labor force, for

29
having financial capital and recently the addition of technology to its production is a factor
that determines the success of the companies.
On this basis, it is important to mention competitiveness in the field of International Trade,
given that it allows countries to develop in international markets and improve the standard of
living of its populations. Competition is set out as a positive side for companies since it
allows them to have more opportunities as they are forced to improve. In addition, business
networks strengthen sectors and make them more competitive. Nevertheless, according to
Porter, to achieve this competitive advantage, it is necessary to improve innovation and
change, since innovation is carried out through the application of new technologies. On the
other hand, Porter emphasized not only natural resources but also human resources, based on
the fact that this human factor must be trained in order to achieve competitiveness, and for
achieve this competitiveness in the company, it is necessary to take account the level of
consumer demand because it as allows to improve its quality and achieve success in
international markets by positioning the brand in new markets.
The internalization process of companies allows greater economic growth by expanding
their market, and increasing their business volume. With this, companies generate new
opportunities abroad to offer their products, goods or services, thus facing situations such as
the case of the home market saturation. Conversely, internalization is a process that requires
several factors to be successful. In general, there are many factors that could pose both a risk
and a favorable variable for the internalization process, such as the behavior of the
government regarding foreign trade, economic policies, public administration, legislation, tax
system, subsidies, incentives, etc. All the same, it is indispensable to know through a study,
the current situation of the company to be internationalized, using the theoretical tools that

30
allow us to access this information, in order to be able to make projections that guarantee the
success of our brand internalization.
Finally, the study of economic theories is highly relevant for this internalization project;
since, it takes us through a historical account of the evolution of International Trade around
the centuries, which facilitates the understanding of the trade field in the international sphere.
In this way, it seeks to point up the importance of trade exchange between nations; since free
trade represents a tool that underpins economic growth and reinforces the relations among
countries.

31
2 CHAPTER II
INTERNAL ANALYSIS OF THE FIRM MP3
2.1 Introduction to the selected firm
The firm MP3 is located in Quito, Guayaquil and Cuenca, and has 15 years of experience
in the Ecuadorian market, as trade leader of audio, video and technology equipment for cars.
Currently, it is the third largest Tv assembly firm in the country, which was built together
with Clarion and OEM, among other brands. Moreover, MP3 stands out for manufacturing
certain national Tv brands such as Indurama and Innova. Also, the firm has production
licenses of international brands such as Motorola, Blaupunkt y Nakamichi. Furthermore, the
firm is distinguished for their exclusive distribution of worldwide brands such as Clarion,
OEM, Alpine, JBL, Infiniti, Parrot, DB-Drive and Quantum. They are the main suppliers in
audio and video systems for the most important dealerships: Nissan, General Motors, Toyota,
Mitsubishi, Peugeot, Chevrolet and SsangYong with a complete line of OEM equipment in
the worldwide brand like the case of Clarion.
According to the company website, the mission is based on highlighting the importance of
being at the forefront of all technological advances, to offer the latest models in audio,
amplification and video systems to satisfy the consumer's needs by offering them efficient
work. Based on all these brands and production lines that the firm offers to the Ecuadorian
market, the Blaupunkt TVv accomplished a crucial role in this research given that it was
selected to be internalized to the Peruvian market. During a visit to the staff of the Company
we did an interview to know about the history of Blaupunkt in Ecuador and the historical-
political context that facilitated its insertion in the market.

32
In 2009, the government of Rafael Correa led out certain policies to foster local
production to correct the negative balance of trade. Nevertheless, since 2008 the country had
a trade deficit, which was caused by the poor exportable supply and the need to import in
large volumes to satisfy domestic demand. In response to this crisis, the government issued
norms and regulations that seek to stimulate national production (Huayamave).
The reduction and import substitution plan driven by the Government affected the
Ecuadorian business and industrial sector. One of the strategies for reducing imports in the
technological field is to encourage companies to carry out part of the production in Ecuador
(Pérez). In this context, MP3 obtained the licenses for the Tv production, including the
Blaupunkt brand. Initially, assembling televisions whose parts were produced abroad. Further
on, a quality leap was generated when MP3, Clarion, OEM and other local stakeholders
invested in a plant of electronic card production. In this sense, the Blaupunkt Tv has
consolidated in the Ecuadorian market, of which it has a significant market participation.
2.2 History of Blaupunkt
In November 1923 the Company was founded under the name of “Ideal Radiotelefon and
Apparatenfabriek”, its production headquarters was located in Bollersdorf. Initially the
Company started with a portfolio of products that included headphones and radios to Galena,
these headphones had good sound quality, as they were marked with a "Blue Dot" it
represented a seal of quality. In 1938 the Company changed its name to Blaupunkt which
meant in German "Blue Point". Furthermore, its seal of quality became the company brand.
On the other hand, Blaupunkt used the slogan "Just a small point" to advertise their products
in the market, which were innovators and high-tech pioneers, it is pertinent to mention that in
that time these terms did not even exist.

33
Regarding the innovations, Blaupunkt had the first European car radio, the Blaupunkt
Autosuper AS 5 car radio (1932), the first transistor radio (1975), the first car CD player
(1983) and the first European navigation unit (1989), among others like DX-N-Online, the
navigation unit with online functionality (2001), the first digital car radio with an MP3
decoder, card slot multimedia and recording function (2003), the first dynamic navigation
system and intuitive with TFT color screen (2005) (Blaupunkt).
Since the end of 1950, Blaupunkt continued with the current trends of the market, and
also has introduced new devices in short development cycles, offering a full range of
consumer electronics products. Based on this approach the company achieved new product
advancements that influenced global consumer behavior over the past eight decades. In 1956
the super hi-fi sound devices were endowed with a HiFi button, for the most authentic sound
(Blaupunkt).
Besides, it is important to mention the quality of the Hi8 CCR-880H camcorder, or the
SVHS-C model CC 695; it initially had new video recorders, which included the RTV-800
HiFi with electronic programming. Its broad range of consumer electronics products was
completed with the combinations of Blaupunkt televisions and Tv-radio. In the late 1950s the
Arkona series was very successful after its launch. In 1986, the production of television was
suspended for purchasing them from a German Tv manufacturer. Ten years later, Blaupunkt
ceased the marketing of video recorders, camcorders and televisions to concentrate entirely
on the mobile communication field. Nowadays, Blaupunkt has a broader portfolio than ever,
in this way his brand was the beginning of a new era in 2010 in order to continue the success
story of the Blue Dot in the consumer electronics field (Blaupunkt).
Since 2010, these business segments have been kept by the partners who have expanded
the Community of the Blaupunkt Global Brand. However, the partners of this Community are

34
selected for being the leaders in their business sectors; they have a lot of experience regarding
the products and the market. On this basis, the partners are part of a rigorous selection
process to guarantee customer confidence in the brand (Blaupunkt).
First, the partners must have a permanent long- term partnership, they must get involved
in terms of product quality, they need to be concern in terms of transparence and maintain
good communication, they need to preserve the essence and values of the brand, they must be
concerned about the Blaupunkt Brand in the global context, they must be open to new ideas,
and finally have first-class experience in the business and market field. As a result, Blaupunkt
has more than 80 years of experience in the market, offering its products in the whole world
with the best relation in terms of quality and price, each product manufactured must be
inspected, tested and controlled for the sale by business partners (Blaupunkt).
Currently, Blaupunkt is one of the German commercial brands more recognized in the
market, representing a symbol of quality, which has expanded to 95 countries around the
world. It represents trusted technology in leisure, communication, mobility, logistics,
cleaning, air conditioning, security and hobbies, offering today tablets, computers,
televisions, air conditioners and kitchen appliances, as well as audio, security systems and
navigation since 2010 (Blaupunkt).
The Blaupunkt brand represents:
● Innovation Force
● Quality
● Technological competence
● Reliability
35
● Sympathy (Blaupunkt).
2.2.1 Awards
Finally, in 2016 Blaupunkt received the Award for "Brands of the Century Stars ", giving
the brand greater recognition and decoration alongside other recognized German brands
(Blaupunkt).
2.3 PESTEL Analysis
In 1967 the term emerged by Francis J. Aguilar, a Harvard professor. The PESTEL
analysis describes the context or environment of the company, beside those relevant external
factors to the organization. This allows us to create short and long-term strategies, taking
advantage of the opportunities of the analysis or increasing the ability to respond to risks. The
name PESTEL has the acronyms of the six factors:
● Political analysis;
● Economic analysis;
● Social analysis;
● Technological analysis;
● Environmental analysis;
● Legal analysis (Betancourt).
2.3.1 Political Analysis
The first point to analyze is the political environment of Blaupunkt in Ecuador, in order to
identify the most relevant aspects on this issue, which could have had an impact on MP3, the
36
company that owns the brand's production license. During the last decade certain stability has
been maintained among the Ecuadorian governments; thus, former President Rafael Correa,
at the beginning of the first period of his regime, introduced the project to change the
productive matrix, developed by the National Secretariat for Planning and Development.
The project was based on a set of policies that encouraged the development of scientific
and technological capacities, as well as the insertion and assimilation of these in an effective
way in the economy as an element for strengthening the productive sector. The Ecuadorian
economy has been characterized by being a supplier of raw materials in the international
market and at the same time, an importer of goods and services with greater added value. The
constant changes in the international prices of raw materials, as well as their growing
difference compared to the prices of products with higher added value and advanced
technology, have placed the Ecuadorian economy in a situation of unequal exchange,
submitted to the world market fluctuations. This practice does not constitute a profitable
system, nor is it sustainable in the long term; also, it does not adapt to the commercial context
of Latin America and the world that offers highly competitive products against which the
Ecuadorian product was in a clear disadvantage (Molina).
The change in the productive matrix has had positive and negative implications for each
industry in particular. In the case of television production, data from the Ministry of
Industries and Productivity (MIPRO) are encouraging: 70% of the televisions sold in the
country are locally assembled. We have the case of brands such as Sony, where only 20% of
the components of the artifacts are imported, since the remaining 80% are assembled at the
Audioelec plant, in the province of Guayas. Sony's Ecuadorian plant is the fourth largest in
Latin America, where between 500 and 800 Smart TV sets are manufactured daily, with 4K
technology and Android operating systems. In addition, we can find the Motsur assembler in

37
the city of Cuenca and the MP3 assembler where TCL and Blaupunkt brand televisions are
assembled respectively. For these reasons, it was necessary to achieve technological and
quality standards, in order to get a final product capable of competing with any assembly
factory anywhere in the world (El Telégrafo).
MP3 and other related companies have had to face the challenges posed by the change in
the production matrix. Mainly, the consequences of an import substitution industrialization;
understood as a strategically oriented process to develop technological tools, information,
machinery and methods that allow the country to optimize the production processes of the
principal products of its economy. It also serves to identify their added value, in order to
achieve a competitive export model that favors their participation in global dynamics in a
proactive way and with better benefits for the country. Consequently with this policy, it is
imperative that part of the television production be carried out in the country. For this reason,
investments made it possible to manufacture locally the main card or mainboard of the
devices. Although not all parts are available in the country, companies like Sony have
products with a local component percentage of 24%. According to MIPRO, this practice
brings benefits for the country: the local assembly of these teams helps to lower costs and
have competitive prices. This difference is useful after the imposition of tariffs on the
finished televisions, since the importer pays 75% of taxes, while for the CKD (parts and
pieces to assemble); the charge is almost 30%. This measure has represented an opportunity
for the local industry to gain its margin of preference in the market (Guarín).
In the International Scope, there are also tools to measure if the regulations imposed by
the government have affected companies in Ecuador. The World Bank created an index of
ease of doing business (Doing Business), in order to demonstrate the effect on the
improvement of certain standards linked to economic growth and to quantify the impact of

38
government legislation on business activity. The Doing Business report encourages
economies to compete to achieve more efficient regulations that are in accordance with
international best practices. In addition, it offers measurable parameters, which serve as an
academic resource for researchers or investors interested in the business climate of each
economy (World Bank).
To produce the Doing Business report, quantitative data is collected and analyzed to
compare business regulatory environments across economies. In this way, it produces a
ranking that classifies economies on a scale from 1 to 190 according to their ease of doing
business index. Forty one indicators are taken into account, which are synthesized in 10
topics. For each indicator, a performance limit is established, and based on that limit; it is
given a rating of 100. As shown in the following table, Ecuador presents low calcifications on
issues such as obtaining electricity, cross-border trade and openness to business (World
Bank).
Table 5. .Ecuador's Rating in the Doing Business Report
Parameters DB 2020 DB 2020
Ranking Score
Starting Business 177 69.1
Construction Permits 114 66.4
Getting electricity 100 72.3
Registering Property 73 67.7
Getting Credit 119 45.0
Protecting minority interests 114 44.0
Paying taxes 147 58.6
Trade 103 71.2
Enforcing Contracts 96 57.5
Resolving insolvency 160 25.5
Source: World Bank, 2020 Elaborated: Authors

39
Ecuador is currently ranked 129 out of 190 in the general ranking, falling from position
123 in relation to last year. Although Ecuador was one of the 115 economies that introduced
substantial regulatory improvements that facilitate business activity, Ecuador (129) barely
surpasses Bolivia (150) and Venezuela (188) in this annual ranking. This positions Ecuador
in the last category of the five that make up the ranking. Naturally, the situation reflected in
the Doing Business report suggests that doing business in the country carries a risk;
especially if we compare it with its neighbors Colombia (67) and Peru (76), which have better
positions. It can be assumed that, despite the attempts carried out by the government in recent
times; Ecuador still does not offer attractive business conditions. (World Bank)
Figure 1. Ease of doing business index in Ecuador
Source: World Bank, 2020
Elaborated: Authors
Another issue to take into account in any analysis is the health emergency caused by Covid-
19; in Ecuador, a State of Exception was declared on March 16, 2020. In this context, the
lack of credibility of the government of President Lenin Moreno has been highlighted, added
40
to a public agenda that does not enjoy great popularity. The economic crisis that the country
is going through has worsened as a result of the pandemic, due to factors such as the fall in
the price of oil, and a weak fiscal performance; added to the huge external debt. This has had
a great impact on Ecuadorian companies, where small and medium-sized companies have
been the hardest hit. While large companies bear the crisis at the cost of significant economic
losses (López).
2.3.2 Economic analysis
The pandemic led to a negative effect on the global economy. That is the case of the
Ecuadorian economy which has been severely affected and provoked the suspension of
productive activities in the country. According to the reports from the Central Bank of
Ecuador (CBE) in the second quarter of 2020 the Product Gross Domestic (GDP) decreased
by 12.4% compared to the same period of 2019; even so, since 2000 it is the largest quarterly
drop. Despite the Ecuadorian economy was severely hit, the decrease was less regarding to
other countries in the region in the second quarter of 2020, that is the case of several
countries such as Chile whose economic contraction was of -14.1%; Colombia, with -15.7%;
Mexico, with -18.7%; Argentina, -19.1%; and finally, Peru -30.2% (Banco Central del
Ecuador).
As previously mentioned, the fall of the Gross Domestic Product (GDP) is provoked by
the decrease in investment with 18.5%, also the decrease in exports of goods and services
with 15.7%; the reduction of final consumption expenditure of households with 11.9%; and
by the contraction in the government's final consumption expenditure with 10.5%. Moreover,
imports of goods and services that generally decrease GDP, were 20.8% lower than the
recorder in the same period of 2019. Based on the composition of the Gross Domestic
Product, distributed by sectors, the Gross Fixed Capital Formation (FBKF) registered a

41
decrease of 18.5% in the second quarter of 2020 regarding to the same period of 2019 due to
the negative performance of the construction (-12.7%), this sector represents the 70% of the
structure of this variable (Banco Central del Ecuador).
Figure 2. Ease of doing business index in Ecuador
Reference: Central Bank of Ecuador, 2020
Elaborated: Authors
On the other hand, in the second quarter of 2020 exportations of goods and services
decreased 15.7% compared to the second quarter of 2019. Despite the negative impact of the
Covid-19 in the global context, some Ecuadorian products were outstripped in their annual
external sales such as processed shrimp with 8.1%; bananas, coffee and cocoa with 3.2%;
other food products with 0.2%, among others. Nevertheless, these results did not offset the
decline in flower farming, animal husbandry and forestry. Equally, importations decreased by
20.8%. The products that showed a greater drop were refined petroleum oils with -22.6%;
basic chemicals with -11.7%; machinery, equipment and electrical appliances with -18.5%
and finally, common metal products with -5.8% (Banco Central del Ecuador).

42
Furthermore, there was a decrease of 11.9 % in final consumption expenditure of
households in the second quarter of 2020 compared to the same period of 2019. This
generated a reduction in imports of goods consumption of 61.6% and the decrease of
remittances received of 16.3%, which exceeded USD 809.6 million in the second quarter of
2019 to USD 677.5 million in the second quarter of 2020. Additionally, there was a decrease
of 44.7% in the consumer credit operations (ordinary and priority) granted by the Private
Financial System and the Popular and Solidarity Economy. Furthermore, there was a decrease
of the expense of final government consumption of 10.5% compared to the second quarter of
2019 due to the 5.1% decrease in salaries, which totaled USD 2,073.1 million, this refers to
USD 110.8 million less than in the second quarter of 2019 given by the interannual decrease
of 3.2% in the total number of public employees (Banco Central del Ecuador).
Meanwhile, the petroleum sector had a contraction of the inter-annual variation in its
Added Value Gross (GVA) of 29.4%, due to a decrease in the crude extraction of 28.3%
since the national crude oil production in the second quarter of 2020 was 32.1 million barrels,
this means 33.5% less than the second quarter of 2019. This event happened by the rupture of
the pipes of the Trans-Ecuadorian Pipeline System (SOTE) and the Heavy Crude Oil Pipeline
(OCP) of April 7, 2020 due to the erosion of the riverbed Coca, causing the gradual shutdown
of several blocks and the temporary suspension of some oil wells. In contrast, the non-oil
GVA decreased by 10.0% as a result of the health emergency. Thus, the most affected
industries were especially those of transport, construction, accommodation and food services,
education and social and health services, among others (Banco Central del Ecuador).

43
Figure 3. Oil and non-oil GVA
Reference: Central Bank of Ecuador, 2020
Elaborated: Authors
Another point of analysis, set that the financial services had decreased 4.8% in their rate
year-on-year due to the decrease of 43.7% in credit operations in the second quarter of 2020,
which reached 1.7 million. In this way, a lower loan placement was raised due to the
confinement measures. In the business sector, the GVA presented a negative variation of
9.8%, besides in the second quarter of 2020 the manufacturing field decreased to 9.8%.
However, some manufacturing industries showed a positive performance year-on-year such
as shrimp processing and preservation, production of the milling, bakery and noodles, food
products, and industries manufacturing (Banco Central del Ecuador).
According to the Central Bank of Ecuador, the construction sector had a decrease of
12.7%; thus, some projections anticipate that by 2020 will be one of the most affected
sectors; likewise for 2021 will be the second sector with the highest decrease after the Public
Administration due to low public investment.

44
In the second quarter of 2020, the private financial sector, the popular and solidarity
conferred 838 operations in the property field, which mean 77.5% less than the second
quarter of 2019, when 3,721 credit operations were granted. Another point of analysis is the
transport sector which was one of the most affected due to the mobility restrictions
established by the government. It presented a decrease of 29.7% in the second quarter of
2020, which represented a reduction of 46.9% in the consumption of extra and diesel gasoline
which is aimed for land and sea transportation (Banco Central del Ecuador).
Even though the second quarter represented a negative impact for the economy, the
indicators that show the country's performance for the next few months present a challenge to
economic reactivation. In Addition, Ecuador has the support of the International Monetary
Fund (IMF) to equilibrate the balance of payments and revert the economic slowdown
registered in the second quarter of 2020. Therefore, the IMF made a disbursement of USD
6,500 million to the country (Banco Central del Ecuador).
Regarding consumer prices, the CPI Indicator measures the variation of prices
corresponding to the set of consumer goods and services that are acquired by households in a
given period of time, it represents the measure of inflation rate registered in the country
(INEC). In the following frame are the results in inflationary terms for the month of
November 2020.

45
Table 6. Indicator IPC ( November)
Indicators: Percentage Variations November 2020
Monthly Variation -0,01
Annual Variation -0,91
Cumulative Variation -0,90
● Monthly variation: variation of the last month with respect to the previous
month.
● Annual variation: price variation of the month in relation to the same month of
the previous year, that is, the variation of the last 12 months.
● Cumulative variation: price variation of the month with respect to December of
the previous year.
Reference: INEC, 2020
Elaborated: Authors
According to the latest report of the National Survey of Employment, Unemployment and
Underemployment (ENEMDU), the Unemployment Index recorded a value of 13.3% in June,
whereas in September the index decreased to 6.6%. However, this value is still considerable
if this index is compared with the same month of 2019; so, there is an increase of 1.7% this
means that at least 115,749 Ecuadorians lost their jobs. On the contrary, regarding
underemployment, the index fell from 34.7% in June to 23.4% in September, which means
that 780,541 people left informal employment; whereas the unpaid employment increased
from 7.7% to 10.8%. Andrés Isch, the Minister of Labor, clarified that in the last three
months there has been an advance in the labor market due to economic reactivation,
especially in agricultural and business activities (El Telégrafo).
Moreover, the GINI Index measures the level of inequality that exists in a country based
on the income distribution. According to the World Bank there is a scale from 0 to 100 where
0 symbolizes a perfect equity, while 100 a perfect inequality, in this case Ecuador scores 45.4

46
points. On the contrary, neighboring countries such as: Peru has 42.8, Colombia with 50.4
Brazil with 53.9 points respectively (Banco Mundial).
The Global Innovation Index has a scale from 0 to 100, with 100 means the best results in
terms of innovation such as Switzerland, Sweden, the United States, the United Kingdom and
Netherlands. By contrast, Ecuador obtained 24.1 points, which means that it requires
improvement on innovation issues in order to achieve greater competitiveness at the
international level (The Global Economy).
Figure 4. Global Innovation Index in Ecuador
Reference: World Bank, 2020
Elaborated: Authors
The Forecast 2021
It is projected that by 2021, the economy will recover and grow 3.1%, equivalent to a
Product Gross Domestic (GDP) of USD 67,539 million in constant values. This economic
recovery will be mainly by Household Expenditure, which would increase by USD 3,441
million, due to higher imports of consumer goods (USD 136.2 million) and an increase in
remittances received (USD 272.5 million) (Banco Central del Ecuador).
47
The exportations of goods and services would increase USD 1,095.2 million, due to the
possible recovery in the prices of crude oil, in the same way the non-oil products such as
bananas, plantains, shrimp and cocoa, which will show a growth trend. In addition, there will
be an improvement in the dynamism of the domestic economy due to importations of goods
and services which are expected to increase by 3.2% in comparison to 2020, a percentage that
corresponds to USD 936.6 million (Banco Central del Ecuador).
For 2021 the Gross Formation of Fixed Capital will be reduced in the public investment of
USD 171.2 million, while private investment would increase by USD 114 million (Banco
Central del Ecuador).
World Bank Projections
The World Bank estimates that Ecuador will finish the year with an economic contraction
of 11%, whereas in 2021 there will be an increase of 4.8% in its Product Gross Domestic
(GDP). Nowadays, Latin America and the Caribbean are the most affected regions by the
spread of Covid-19; thus, at the end of 2020 there will be a GDP contraction of 7.9% and for
2021 is expected an economic recovery of 4%.
International Monetary Fund Projections
The International Monetary Fund (IMF) projects that in 2020 the Gross Domestic Product
(GDP) of Ecuador will decrease by 11%; However, this estimate is a bit more optimistic than
the GDP contraction projected by 2021. Also, growth of 2.5% is expected in the medium
term.

48
Trade Agreements
In order to stimulate International Trade, Ecuador subscribed some trade agreements with
several countries to be inserted in the global economy. For that reason, Ecuador set a
negotiating agenda to be open to new markets, consolidate new markets of export
destinations, and diversify the exportable basket. On this basis , the government has adopted
some reforms to have a stable legal environment at the national level to be open to
investment.
The following agreements are subscribed by Ecuador:
● Free Trade Agreement with the European Union;
● Partial Scope Agreements with Chile, México, Cuba, Guatemala, El Salvador and
Nicaragua;
● Customs union with the Andean Community comprised by Bolivia, Colombia and
Peru;
● Inclusive Economic Association Agreement between the Ecuador and the European
Free Trade Association comprised by Switzerland, Norway, Iceland and
Liechtenstein;
● Ecuador became an associated member of MERCOSUR;
● Currently Ecuador keeps a negotiation process with South Korea and Turkey (Banco
Central del Ecuador).

49
● Today there is progress in the negotiation to join Ecuador to the Pacific Alliance
because it is a crucial regional integration bloc of which Ecuador will have access to
new markets (El Comercio).
● Ecuador is interested in subscribing trade agreements with the Eurasian Economic
Union, Canada, Japan, Costa Rica and the Dominican Republic (Banco Central del
Ecuador).
● Actually, Ecuador started the first phase of negotiation for the Trade Agreement with
the United States; this phase is concerned about trade facilitation. However, sensitive
issues such as tariffs for agricultural goods will not be part of this initial phase (El
Comercio).
Agreement between Ecuador and the International Monetary Fund.
On August 28, 2020, Ecuador agreed to a loan program from the International Monetary
Fund of USD 6.5 billion with a period of repayment of 10 years. In order to implement
economic policies that allow greater coverage of social assistance programs, protect
vulnerable populations, guarantee fiscal sustainability and the debt, and finally, strengthen
national institutions to promote a solid, lasting and inclusive growth. Even though, the
government require to cut spending for the crisis in 2021; so, the government must
implement a package of fiscal reforms, to have a good management of current and capital
spending, an integral tributary reform where there is great management of public spending, in
order to expand the coverage of social protection (Primicias).
The Gross Minimum Wage in Ecuador
On the other hand, an analysis of the evolution of the Gross Minimum Wage in Ecuador in
the previous years will be carried out. In 2011 there was a minimum wage of $ 264, in 2012

50
there was an increase of $ 292, in 2013 there was an increase of $ 318, in 2014 it increased of
$ 340, in 2015 it increased of $ 354, in 2016 it increased of $ 366, in 2017 it increased of $
375, in 2018 it increased of $ 386, in 2019 it increased of $ 394 and in 2020 it increased of $
400. According to some projections for 2021, the Unified Basic Wage it has remained at $
400 due there was not a formal agreement in the National Labor and Salaries Council
(CNTS) between workers and employers; thus, it is the first time that the wage does not
increase in the country (El Universo).
Nevertheless, for January 2021 were announced two compensations, a bonus of $ 60 for
those who earn the Unified Basic Wage and another of $ 100 for those who lost their job
during the pandemic and have not recovered it (El Universo).
Figure 5. Unified Basic Salary
Reference: El Universo, 2020
Elaborated: Authors

51
2.3.3 Social analysis
According to data from the survey applied by the INEC, the average expenditure per
household is $ 809.6 per month. It indicates that 58.8% of the population has the capacity to
save, while 41.1% has higher expenses than income. In addition, it is reported that the
consumer manifests preferences in three categories, led by the food and non-alcoholic
beverages sector, in the order of 22%; followed by the transportation sector with 15% and the
services sector, mostly made up of personal care, financial, insurance, jewelry with 10%.
That represents about 50% of consumer spending. In this case, the expense is usually made in
cash at 80%. Only 3% of purchases are made through credit cards.
The current behavior of the Ecuadorian consumer occurs as a result of the economic crisis
of 1999. After this impact, it would pass a decade before the middle class could recover its
consumption flow. Certain conditions, such as dollarization, the development of information
technologies and a new boom in oil prices, favored the recovery of consumer purchasing
power. In addition, the presence of accessible information gave way to an evolution of the
type of Ecuadorian consumer, going from being a thoughtless and uninformed buyer, to
becoming an informed, demanding, thoughtful buyer, endowed with skills and tools in the
technological field (Revelo ).
According to (Fedexpor), Ecuadorian consumers stand out for their sense of individuality
and a growing national identity, which is why they look for local products and brands that are
authentic and native to a certain territory. In this way, niche brands begin to have great
regional and even global success. Multinational companies are interested in localizing their
production or acquiring established local players. Companies like MP3, whose production is
located in the country, can take advantage of this trend to develop business strategies that
allow them to win and retain consumer loyalty.

52
The pandemic caused by Covid-19 has also had an influence on consumer habits. Mainly,
the usual practices of buying and selling have been replaced by the digital factor. There has
been a marked increase in online stores, which is a disadvantage compared to the
competition and the lack of digital means for the sale of the product. People prefer the use of
digital sales media; that save time and pose less danger by limiting contact with vendors;
reduce potential buyer / seller clashes; provide flexibility and efficiency by allowing access to
a greater diversity of products and stores; provide information at the moment and; allow an
immediate price comparison. Similarly, consumers have greater control in the purchasing
process by increasing interaction between business and consumer, while breaking down
geographical barriers by making purchases from anywhere in the world (Rohm and
Swaminathan).
2.3.4 Technological Analysis
The World Intellectual Property Organization (WIPO) is the Global Forum responsible for
services, policy, cooperation and information in terms of Intellectual Property, it is composed
of 193 members. Every year this organization carries out the Global Innovation Index, this
report classifies countries in terms of innovation based on the political, economic,
infrastructure, business and social development context. Through these standards it is
possible to understand the level of development of the countries in the technological sphere
(Organización Mundial de Propiedad Intelectual).
Currently, the Global Innovation Index is led by Switzerland with 66 points, followed by
Sweden with 62 points, the United States with 61 points, the United Kingdom with 60 points.
In the same way, the Latin American region is led by Chile with 33,86 points, followed by
Mexico with 33,60 points, Costa Rica with 33,51 points, Brazil with 31,94 points, Colombia
with 30,84 points, Uruguay with 30,84 points, Panama with 29,04 points and Perú 28,79

53
points, among others. Nowadays, Ecuador has 24.11 points in the ranking, occupying the 99
out of 133 countries. It is essential to point out that Ecuador continues in the same position as
the previous year. According to this study, Latin America is a region with serious imbalances
in terms of innovation, countries do not invest much in research, and they do not consider the
importance of intellectual property (Angle).
1.3.5 Ecological Analysis
In 2012 the Ministry of the Environment announced the Unique System of Environmental
Information, which refers to a Web application that manages procedures and projects directed
on control, registration, maintenance and preservation of the environment at the national
level, and in the service of all citizens in order to integrate all environmental information in a
single place to generate Geographic standards, Documentaries, Statistical Indicators and
automation of institutional processes (SUIA).
In Ecuador, the Environmental Management Law is based on policies of sustainable
development for the conservation of natural heritage and the sustainable use of nature. For
that reason, there are some tools to applied the environmental standards such as:
environmental quality standard, effluent standards and emissions, technical standards for
product quality, permit system and administrative licenses, environmental impact
assessments, lists of polluting and harmful products for human health and the environment,
environmental quality certifications of products, services and others. Moreover,
environmental contributions and fines are applied for the environment protection and
sustainable use of natural resources, as well as risk insurance and deposit systems, which may
encourage environmental protection. On the other hand, the government set economic
incentives towards productive activities to protect the environment and sustainable
management of natural resources (Ministry of the Environment).

54
It is important to emphasize that the firm MP3 is dedicated to the assembly of televisions
and also produces electronic cards. Therefore, the firm needs to follow certain environmental
standards, although it is not considered a polluting firm.
2.3.5 Legal Analysis
It is important for the analysis to consider legal aspects such as employment, quotas, taxes,
resources, imports, exports, etc. There are certain laws that affect the business environment in
a market; In addition, companies operate internally according to certain policies. Companies
in Ecuador, both limited and anonymous, are regulated by the Superintendency of
Companies, and ruled by the Law of Companies. To start a new commercial company, it is a
requirement to establish the corporate purpose or activity to be carried out, choose an original
name and verify that it has not been previously occupied in the registry of the
Superintendency of Companies (Superintendency of Companies).
This process can be completed within a period of eight days that begins with the
application for incorporation until obtaining the Single Registry of Taxpayers before the
Internal Revenue Service of Ecuador (SRI). Once a company is constituted, it acquires a
series of formal and fiscal obligations before the different regulatory entities and the SRI:
Table 7. Obligations with regulatory entities
Monthly Obligations
Monthly declaration of taxes withheld at source.
Value added taxes VAT.
Preparation and monthly declaration of Transactional Annex (SRI).
Annual Obligations
Preparation and declaration of 1.5% of the municipal tax on assets
Patent tax declaration
Preparation and transmission of reports to the Ministry of Labor Relations.
Preparation of income tax (SRI). Source: SRI, 2020
Elaborated: Authors

55
It should be remembered that, in the case of having employees, the company acquires
certain obligations related to payroll management. The Ministry of Labor is in charge of
establishing the modifications regarding the value of the Unified Basic Salary and the amount
destined for Social Security. Currently, the basic salary is set at 400 USD per month
(Ministry of Labor). Regarding Social Security contributions (IESS), the calculation is made
based on the Unified Basic Salary: in the case of an employee with a dependency
relationship, he or she will be required to deliver a contribution to the IESS of 9.45%
equivalent to $ 37.80 of their salary or salary, while, to the employer, 11.15% equivalent to $
44.60 of the worker's salary (IESS).
2.4 Porter Diamond Analysis
As previously mentioned, Michael Porter performed an analysis of the companies, and the
influencing factors of the environment for incorporation and success in the international
markets. Each of these factors will be analyzed below.
2.4.1 Demand
Based on the information obtained from MP3, the following chart shows how the TV market
has performed in the country in the last five years focusing on brand imports such as LG,
Riviera, Samsung, TCL, Sony, Global, Innova, Diggio, Prima, JVC, Riviera, Hyundai,
Doppio, RCA, Nakamichi, Daewoo, Indurama, Zitro, Icesa, Westinghouse, Ecoline, Electric
Life, Blaupunkt, Tomico, Tekno, Coby, Innova, Evvo, Erion, King Post, Konka, Xtratech,
Gadyet, SM, LG Electronics, Goldstar, Ecasam Nakamichi, among others. In 2015,
330,130.00 televisions were imported while in 2016 imports increased with 392,318.00
televisions. In 2017 imports decreased with 577,535.0 televisions. Likewise, in 2018 imports

56
decreased compared to 2017, with a value of 72,057.00 televisions. By contrast, in 2019
importations increased with a value of 223,462.00 and actually, importations have increased
in relation to the previous year, with a value of 3059,773.00.
Figure 6. TV importations in the last 5 years
Reference: MP3, 2020
Elaborated: Authors
In 2020 the TV imports increased due to the confinement measures for Covid-19 carried out
by the national government, which caused an increase in television consumption in
households. According to the report on Audience Behavior in Ecuadorian households by
Kantar Ibope Media, 843,000 people turned on their Tv on March 2, 2020; so, there was an
increase of 35% for March 16 with 1,141,000 viewers. In this way, this study showed that on
March 16 television consumption increased by 24% (El Telégrafo).

57
2.4.2 Competence
Since 2008, to have a greater market participation several television brands such as LG,
Sony, Riviera, Diggio, Innova, Indurama, Blaupunkt, among others are assembled in Ecuador
with the creation of the tariff headings that allow importing television parts (CKD). In this
way, greater cost competitiveness is achieved in order to increase the demand given that the
importation of manufactured televisions is more expensive (El Comercio).
An analysis of the market was carried out at Créditos Económicos and Marcimex Stores
where certain factors were considered like prices, sizes, models, and brands benefits of
Samsung, Indurama, Sony, Riviera, TCL, LG, Diggio, Riviera, Innova to compare with
Blaupunkt.
The following charts will analyze the following information about the market
Table 8. Analysis of the prices of Samsung Tv brand
Brand TV SAMSUNG Price Size TV
RESOLUTION
SMART UN55RU7100PCZE
(MARCIMEX)
$ ,521.07 55 inches 4K UHD
TELEVISOR LED
UN50RU7100PCZEPCZE
(MARCIMEX)
$ ,318.27 50 inches UHD
SMART UN43J5290AHCZE
(MARCIMEX)
$1,040.75 43 inches FHD
SMART UN32J4290AHCZE
(MARCIMEX)
$ 718.79 32 inches HD
TELEVISOR LED
UN49NU7100PCZE(MARCIMEX)
$ ,276.64
49 inches UHD
LED SMART UN55RU7100PCZ
(CREDITOS ECONOMICOS)
$ 763.56 55 inches HDR
LED Smart UN58NU7103 (CE) $ 887.54 58 inches 4K UHD
UN65NU8500PCZE (CE) $ 1157.52 65 inches HDR
LED Smart UN43RU7100PCZE
(CE)
$ 543.30 43 inches 4K UHD
LED Smart UN85TU8000PXPA
(CE)
$ 2311.70 85 inches UHD 4K

58
LED Smart QN65Q6FNAPCZ (CE) $ 1188.92 65 inches 4K UHD
LED Smart UN32J4290A (CE) $ 333.59 32 inches HD
LED Smart UN43RU7100PCZE
(CE)
$ 499.00 43 inches 4K UHD
LED Smart UN49NU7100PCZ (CE) $ 559.00 49 inches 4K UHD
LED Smart QN55Q6FNAPCZ (CE) $ 949.02 55 inches 4K UHD
LED Smart UN75NU7100PCZ (CE) $ 1348.97 75 inches 4K UHD
Elaborated: Authors
Table 9. Analysis of the prices of Indurama Tv brand
INDURAMA TV BRAND PRICE SIZE TV
RESOLUTION
SMART SIN
BORDES(MARCIMEX)
$1,267.49 55 Inches UHD
SMART SIN BORDES
(MARCIMEX)
$ 1,665.28 65 inches UHD
TELEVISOR 58TIHX1UHD
(MARCIMEX)
$ 1,412.64 58 inches UHD
LED Smart 10000099 (CE) $ 1180.17 65 inches 4K UHD
LED Smart 10000099 (CE) $ 1180.17 65 inches 4K UHD
Elaborated: Authors
Table 10. Analysis of the prices of TCL Tv brand
BRAND TCL TV PRICE SIZE TV
RESOLUTION
LED Smart 43P615 P27893 (CE) $ 505.08 43 inches UHD Android
Elaborated: Authors
Table 11. Analysis of the prices of Hyundai Tv brand
BRAND HYUNDAI TV PRICE SIZE TV
RESOLUTION
P49890 (CE) $ 880.00 65 inches LED
Elaborated: Authors
Table 12. Analysis of the prices of LG Tv brand
BRAND TV LG PRICE SIZE TV
RESOLUTION

59
LED 32LM630BPSB
(MARCIMEX)
$ 746.56 32 inches HD
LED Smart 70UN7310PSC (CE) $1119.23 70 inches HD
LED Smart 49UM7360-P1 (CE) $ 693 49 inches 4K
LED Smart 55UM7470-P3 (CE) $ 708.99 55 inches 4K HDR
LED Smart 32LM630B (CE) $ 361.54 32 inches HD
Elaborated: Authors
Table 13. Analysis of the prices of Diggio Tv brand
BRAND TV DIGGIO PRICE SIZE TV
RESOLUTION
LED Smart DG-TV32UB01 (CE) $ 219.31 32 inches HD
HDR DG-TV58DN4-P1 (CE) $ 689.92 58 inches HDR
LED Smart DG-TV50DN4 (CE) $ 501.98 50 inches 4K UHD
LED Smart DG-TVLS55DN4-7
(CE)
$ 569.09 55 inches LED SMART
LED Smart DG-TV58DN4 (CE) $ 676.17 58 inches
4K UHD
LED Smart DG-TV50CH6000SB
(CE)
$ 445.85 50 inches 4K UHD
Elaborated: Authors
Table 14. Analysis of prices of Riviera Tv brand
BRAND TV RIVIERA PRICE SIZE TV
RESOLUTION
TV LED Smart DSF43HIKN18
(CE)
$ 372.80 43 inches HD
Elaborated: Authors
Table 15. Analysis of prices of Sony Tv Brand
BRAND TV SONY PRICE SIZE TV
RESOLUTION
LED KDL32W609D $ 818.72 en 32 inches FHD

60
(MARCIMEX) efectivo
$339.98
LED KDL40W659D
(MARCIMEX)
$ 1,029.65
en efectivo
$444.97
40 inches FHD
LED Smart XBR-55X805H (CE) $ 1034.31 55 inches 4K UHD
Android
Smart LED HD KDL32W609D
(CE)
$ 345.14 32 inches LED HD
Elaborated: Authors
Table 16. Analysis of prices of Global Tv brand
BRAND TV GLOBAL PRICE SIZE TV
RESOLUTION
SMART GL58B2000NHS
(MARCIMEX)
$ 1,273.99 58 inches UHD
Elaborated: Authors
Table 17. Analysis of prices of Global Tv brand
BRAND TV INNOVA PRICE SIZE TV
RESOLUTION
LED Smart P59960 (CE) $ 352.58 43 inches 4K UHD
Elaborated: Authors
As can be noted, all brands have a developed operating system a Smart Tv, regarding
prices Samsung has an expensive price range above $ 1000 as well as Indurama, LG, Global,
Sonywhile Diggio has an intermediate price range between $ 200 to $ 700. On the other hand,
Riviera has a low-price range of $300, also Innova with a range of $ 400. In addition,
Blaupunkt has a range between $ 300 to $ 1,000 depending on the size and the Tv resolution.
Related to the Tv sizes, Samsung has 32 inches, 43 inches, 49 inches, 50 inches, 55
inches, 58 inches, 65 inches, 75 inches and 85 inches, while Indurama has 43 inches, 55
inches, 58 inches and 65 inches, LG Tv has 32 inches, 49 inches and 55 inches, while Diggio
Tv has 32 inches, 50 inches, 55 inches and 58 inches, Riviera Tv has 43 inches, Sony Tv has

61
32 inches, 40 inches and 55 inches, Global Tv has 58 inches , Innova Tv has 43 inches and
finally, Blaupunkt has 40 inches, 43 inches, 55, 65 and 75 inches.
Regarding the Tv Resolution, Samsung has an advantage compared to other brands
because it has a 4K UHD resolution in most of its televisions; while Indurama already has 4K
UHD, UHD resolutions. LG has several resolutions like HD, HDR and 4K, Diggio has HD,
HDR and 4K UHD; while Riviera has an HD resolution. By contrast, Sony has 4k, UHD and
FHD and HD; Global has UHD resolution, Innova has 4K UHD resolution and finally,
Blaupunkt has Full HD, UHD and 4K UHD resolutions.
2.4.3 Factor
The hiring of labor in Ecuador currently has become a complicated process, according to
several Human Resources Managers or Directors, mainly in private sector companies. The
challenge for entrepreneurs is to know how to choose their employees correctly, to avoid high
levels of turnover. The task is becoming more and more complex, due to the massive demand
for a job, which forces a tighter pre-selection process. According to the statistics of personnel
recruitment companies in Ecuador, of the total resumes received by the human development
departments for a job application, only 2% of applicants meet the expectations and
requirements for a job. (Acosta)
In addition, due to the low demand for graduated professionals in the formal sector, and
especially in the country's largest cities such as Quito and Guayaquil, many professionals
must go to apply for work at the expense of not exercising their careers of, for example,
doctors, lawyers, etc., or even work in the manufacturing sector. This phenomenon is due to
the large number and overexploitation of some university courses. (Acosta)

62
In the other hand, it is difficult for the companies to find skilled workers in new
technologies and modern manufacturing processes, so many times they are forced to invest in
training for their employees just to cover the demand for this type of work, proving that in
Ecuador, more training is needed in new branches and sciences not yet exploited and with
high growth potential (Molina).
Regarding factors such as infrastructure and supplies, a visit was made to the plant of the
MP3 Company. it was found that the televisions have an adequate assembly area, as shown in
the image. In this plant, approximately 300 units are produced every day, using the inputs that
are generally imported from China, except for the mainboard, whose production is carried out
in the country.
Figure 7. MP3 Installations
Elaborated: Authors
In this plant the process of assembling a television is carried out, as we were able to
verify, in this procedure seven activities are identifiable:

63
1. Merchandise reception: once the Blaupunkt TV parts have been imported, the purchased
quantities are reviewed to avoid shortages.
2. Quality control of parts and pieces: verify the state in which the merchandise arrives, once
this filter passes, the parts and pieces are inventoried.
3. Warehouse dispatches all the pieces and parts necessary for the assembly of the televisions.
4. The factory personnel carry out the assembly of the pieces and parts to the televisions
(among which there are: bluetooth, the mainboard card, audio and video connectors, digital
signal receiver) all these parts are assembled on the panel principal.
5. Once the TV is assembled, they go to quality control where it must be verified that all the
lights on the panel are working.
6. We proceed to the packaging of the televisions.
7. For quality control, it is done with random sampling and the chosen televisions are
subjected to all quality control tests of the television's functions.
2.4.4 Cooperation
The televisions assembled in MP3 belong to the renowned international brand
Blaupunkt, from which it derives a license to manufacture its products in Ecuador. This
implies that there are reliable suppliers of the necessary supplies for the manufacture of
televisions. In addition, as already mentioned, during the first years, the assembly companies
had the support of the government of the day, as part of an incentive plan for local industries.
This support was reflected in tax benefits, which the assembler received during its first five
years.

64
2.5 SWOT ANALYSIS
Based on the Porter Diamond, the SWOT Analysis is a basic tool that details the current
situation of a firm by analyzing the strengths, weaknesses, opportunities and possible threats
of the environment.
2.5.1 Strengths
● Ecuador is a member of the Andean Community (CAN). It means, there is a free trade
zone allowing the free movement of goods, that promotes the elimination of tariffs
between the members (Ecuador, Bolivia, Peru, and Colombia).
● Since 1923 Blaupunkt has been a prestige brand with international experience due to
its great added value. As a recognized brand, it does not require positioning; it means
that the partner who has the degree is the one who benefits from the brand.
● In the Tv market, Blaupunkt represents a brand of quality which prevails the customer
trust in the brand due they associate it with the benefits of the product.
● Blaupunkt has several benefits over its competitors because it is not only focused on a
product line but rather offers a diverse range of products such as: radios, car alarms,
televisions, headphones, among others.
● Blaupunkt has the UHD 4K Resolution that stands out in the market nowadays.
● Blaupunkt has a price range depending on the resolution, services and size.
● Blaupunkt offers several Tv sizes: 40 inches, 43 inches, 55 inches and 65 inches and
75 inches.

65
2.5.2 Weakness
● For firms that require skilled labor in new technologies and modern manufacturing
processes, quality human resources are scarce.
● Brand dependency for television production.
● Requires developing strategic alliances with trading houses to expand their product
portfolio.
2.5.3 Opportunities
● The insertion of the Blaupunkt brand into new markets like the Peruvian market.
● The company has an adequate infrastructure and assembly area.
● The existence of reliable suppliers that offer high-quality supplies.
● Some essential parts for the production are manufactured in the country like the
Mainboard card.
● Ecuador is changing the productive matrix which implies an incentive to the
industries to bring back their production to the country.
● Certain circumstances such as the Dollarization, the development of technologies and
a new boom in oil prices benefit the recovery of the purchasing power of the
Ecuadorian consumer.
● It is a decisive factor for the Ecuadorian consumer having the specific information
when choosing a product because they recognize immediately the quality of a brand.

66
2.5.4 Threats
● The Peruvian Tv market has strong competitors such as Riviera, Samsung, LG, TCL,
Innova, it is indispensable to consider whether it is feasible to internalize the
Blaupunkt brand to this market.
● Due to the health emergency, there is an economic contraction in the country, due to
the decrease in investment, exports of goods and services, household final
consumption expenditure, and finally by the contraction of government final
consumption expenditure.
● Actually, in the Ranking of Doing Business, Ecuador is ranked 129 out of 190 that is
the reason why the market is less competitive regarding other countries of the region
such as Peru or Colombia.
● Ecuador has inflexible legislation in terms of labor contracting or types of wages.
2.6 Conclusions of the chapter
A PESTEL analysis was carried out to analyze the Blaupunkt Tv brand in the
Ecuadorian market, to understand the business environment and Porter's Competitive
Diamond, and to achieve greater competitiveness for the firm. With this information a
SWOT analysis was realized which reflected the internal and external factors that
influence the performance of the Blaupunkt brand in the country.
In the PESTEL, the development of policies and projects was analyzed in order to
focus on strengthening the productive sector. The change of the production matrix
benefits the Tv assembly industry in Ecuador; thus 70% of televisions in the market are
assembled domestically. On the other hand, international indicators are not very

67
advantageous at this level. According to the Doing Business Report, Ecuador is currently
ranked 129 out of 190, falling from position 123 compared to the previous year.
Furthermore, in the economic sphere, Covid-19 is a barrier to economic growth, in the
case of the Ecuadorian economy has been seriously affected, generating a suspension of
economic activities. Despite the GDP decrease, the reduction was less compared to other
countries in the region. The GDP contraction is due to the decrease in investment, in
exports of goods and services, the reduction in household final consumption expenditure
and the contraction in the government's final consumption expenditure.
In the exports of goods and services, several Ecuadorian industries were hit, such as
the floriculture sector, the livestock and forestry sector. Despite this, certain Ecuadorian
industries benefited from their annual external sales, such as processed shrimp, bananas,
coffee, cocoa, among other food products. On the other hand, despite unemployment
increasing during the confinement, nowadays there is a significant advance in the labor
market due to the economic reactivation. According to the World Bank for 2021 it is
expected a GDP growth of 4.8% in Ecuador.
Regarding the GINI Index, which measures the level of inequality in a country with a
scale from 0 to 100. It should be noted that Peru has 42.8 points, while Ecuador has 45.4
points and Colombia 50.4 points; this means that the region needs to be concerned on
equality issues based on income distribution.
Based on the social field the Ecuadorian consumer has experienced several changes
since the dollarization of the country, when it comes to consumption is thoughtful and
informed. The Ecuadorian consumers seek a sense of individuality and a growing national
identity that is why they look for domestic products and brands that are native of a certain

68
territory. At this point there is an advantage for firms like MP3, which carry out part of
the production in the country.
According to the technological analysis in the Global Innovation Index, Ecuador is
ranking in the 99 out of 133 countries, keeping the same position as in 2019 this means,
that it must strengthen innovation and emphasize Intellectual Property.
On the other hand, based on the ecological field, companies in Ecuador must follow
environmental regulations; so, many of them must comply with certain environmental
standards. In the case of MP3, it is a non-polluting firm.
Regarding the legal framework, for assemblers were not found conditions that
establish a great difference between Ecuador and other countries in the region. On this
wise, the only barrier in the hiring laws of staff is that they are inflexible in relation to
hours and salaries.
Currently it has become a complex process in Ecuador, in respect of the availability of
productive factors and the hiring of the staff. According to some Managers or Directors of
Human Resources of private firms; especially skilled labor is required in new
technologies and in modern assembly processes. Regarding infrastructure and supplies,
the televisions have a proper assembly area, where approximately 300 units are produced
each day, using the supplies imported from China, whereas the mainboard card is
produced in Ecuador.
Based on the competitors, the Tv market is comprised by highlighted brands such as
Riviera, with a share of 22.3%, Samsung with a share of 15.2%, LG with a share of
10.2%, TCL with a share of 12.8%, Innova with a share of 9.2%. Notwithstanding, in
relation to the prices, the Tv market presents several prices with an expensive price range

69
such as Samsung, Indurama, Sony, LG and Global brands. By contrast, intermediate price
ranges such as Diggio and TCL, and finally an economic price range such as Riviera and
Innova. It is pertinent to consider these price ranges to internalize the Blaupunkt Tv brand
into the Peruvian market.
Finally, in relation to the demand in 2019 importations increased with a value of
223,462.00. Currently the imports increased compared to the previous year, with a value
of 3059,773.00 this increase is due to confinement measures caused by the health
emergency.

70
2.7 Summary Tables
2.7.1 PESTEL Analysis
Table 18. Political, Legal and Social Environment of the Ecuadorian Market
Political
Analysis
● 70% of televisions on the market are locally assembled.
● Ecuador is ranked 129 out of 190 in the Doing Business
ranking.
● Lack of credibility to the government due to poor handling
of the pandemic.
Social Analysis
● Average household spending is $ 809.6 per month.
● The Ecuadorian Consumer is informed, demanding,
thoughtful and endowed with technological skills and tools.
● Consumers with a feeling of national identity, looks for local
products and brands.
Legal Analysis
● The companies are regulated by the Superintendence of
Companies.
● They acquire tax obligations before the SRI.
Basic Salary of 400 USD, plus Social Security affiliation for
employees.
Elaborated: Authors

71
Table 19. Economic sphere of the Ecuadorian market
Covid-19
Influence
● The Ecuadorian economy was seriously affected, it generated the
suspension of productive activities.
● The GDP decreased, whereas compared to other countries of the
region the impact was less.
● The GDP contraction occurred because of the decrease in
investment, exports, the reduction of the household final
consumption expenditure and the reduction of government's final
consumption expenditure.
Construction
Sector
● This sector had a decrease of 12.7%.
● One of the sectors most affected by the confinement.
● According to projections, it is the second sector with the highest
reduction by 2021.
Oil Sector ● This sector presented a year-on-year fall of 29.4% in its Gross
Added Value (GVA) due to the decrease in the extraction of crude
oil.
Transport Sector ● This sector is one of the hardest hit due to the mobility
restrictions.
● The gasoline consumption of Extra and Diesel decreased 46.9%.
Exportations 2020 ● Export products benefited: shrimp, banana, coffee, and cocoa.
● Harmed export products: flowers and forestry
Unemployment
Rate
● Unemployment had increased due to confinement measures;
however, the productive sector recovered at the moment
restrictions were moved.
Global Innovation
Index
● Scale 0 -100 in terms of innovation.
● Top Ranking: Switzerland, Sweden, United States, United
Kingdom and Netherlands.
● Ecuador obtained 24.1 points; so, should improve on innovation
issues.

72
GINI Index ● Indicator based on the measurement of the level of inequality
according to the income distribution, scale (0-100).
● Ecuador scores 45.4 points.
● Peru scores 42.8 points.
Projections for
2021
● Challenge towards economic reactivation.
● IMF support to equilibrate the balance of payments by offering a
loan of USD 6,500 million with a period of 10 years
● It is projected an economic growth of 3.1% due to the increase of
household spending, an increase in the import of consumer goods
and the remittances received.
● Exports will increase to USD 1,095.2 million due to the recovery
of crude oil prices, banana, shrimp, and cocoa production.
● Imports will increase by 3.2% compared to 2020.
● It is projected as a reduction in public investment and an increase
in private investment.
● The World Bank estimates that Ecuador will end 2020 with
economic contraction of 11%, while in 2021 the GDP will
increase 4.8%.
Basic Wage ● In 2020 basic wage did not increase, remaining at $ 400 because
there was no formal agreement in the National Council of Work
and Salaries.
Elaborated: Authors

73
Table 20. Ecological sphere in the Ecuadorian market
Ecological Analysis
● The Environmental Management Law is based on sustainable development
policies for the conservation of natural heritage and the sustainable use of
natural resources.
● Environmental instruments: environmental quality parameters, effluent
standards and emissions, technical standards for product quality, among
others.
● Economic incentives for productive activities that seek to protect the
environment.
● MP3 is not a polluting firm.
Elaborated: Authors
Table 21. Technological sphere in the Ecuadorian market
Country Global Innovation Index
Ecuador Position 99 out of 133 (2019-2020)
• Latin America is a region with strong imbalances in innovation, so it is
indispensable to invest in research and take into account Intellectual
Property
Elaborated: Authors
2.7.2 Porter's Diamond
Table 22. Demand of the Tv market
Year Tv Imports
2015 330,130.00 TVs
2016 392,318.00 TVs
2017 577,535.0 TVs
2018 72,057.00 TVs
2019 223,462.00 TVs
2020 3059,773.00 TVs
● In 2020 the imports increased due to the
confinement which caused an increase in television
consumption in households. Elaborated: Authors

74
Table 23. Competence of the Tv market
Tv Brands
High
range of
prices (>
1000$)
Intermedi
ate range
of prices
(< 700)
Economic
range of
prices (<
400)
Samsung X
Indurama X
Sony X
TCL X
LG X
Diggio X
Riviera X
Innova X
Global X
Elaborated: Authors
Table 24. Infrastructure, inputs, labor and Cooperation
Factor
Labor
● High rate of informal labor, mainly concentrated in rural areas.
● Shortage of skilled labor in new technologies and modern
manufacturing processes.
● Overexploitation of some university careers.
Infrastructure and inputs
● The company has a suitable plant for the assembly of televisions.
● The inputs are imported from China, except the mainboard card.
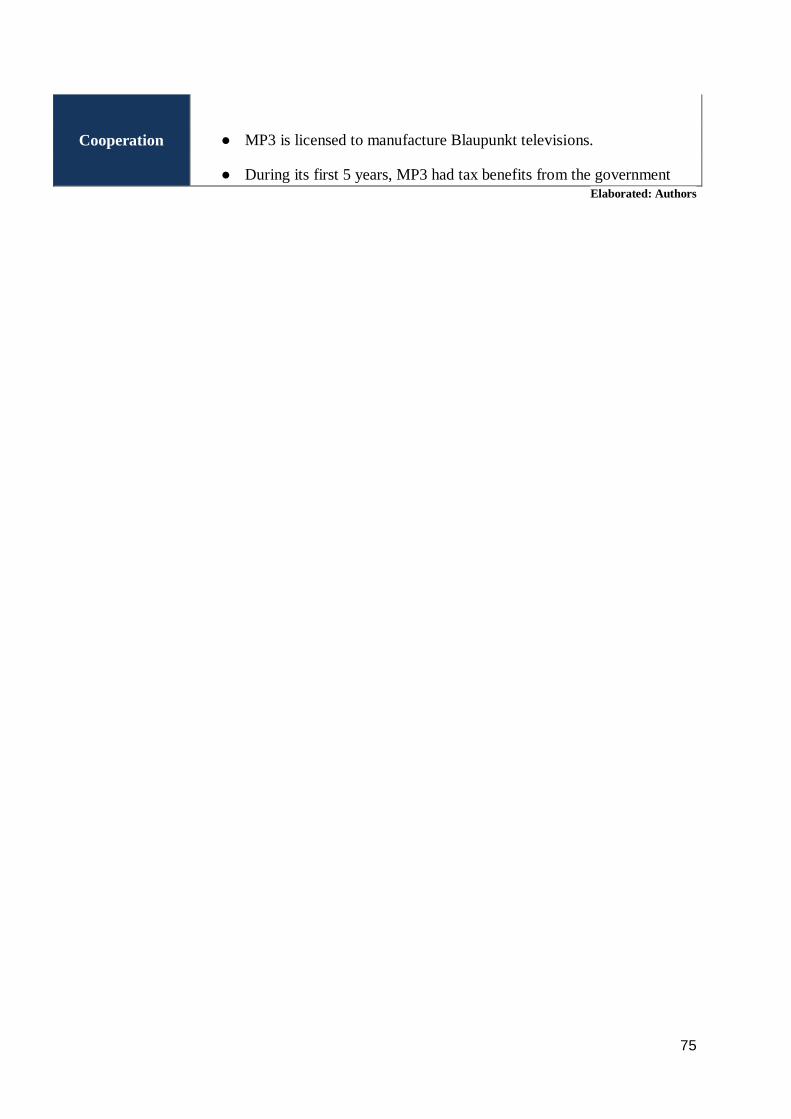
75
Cooperation
● MP3 is licensed to manufacture Blaupunkt televisions.
● During its first 5 years, MP3 had tax benefits from the government Elaborated: Authors

76
3 CHAPTER III
ANALYSIS OF THE PERUVIAN MARKET
3.1 PESTEL Analysis of the Peruvian market
Hereunder, several factors are detailed to consider into the Peruvian market in the
political, economic, social, technological, ecological and legal sphere to carry out a feasibility
study to insert the Blaupunkt television brand to the Peruvian market.
3.1.1 Political Analysis
Unlike Ecuador, Peruvian governments have not promoted policies to encourage the
development of an assembly industry. Although, at the end of the 60s there is an interesting
antecedent to take into account during the Peruvian military dictatorship, which promoted the
development of the local assembly industry, so that household appliances should have a
percentage of up to 40% of local production, to access tariff benefits. The plants of the Philco
and Zenith brands stood out in the manufacture of televisions, importing supplies from the
United States; while in Peru protection furniture was produced. (Morrison)
Then, in the 1980s, these companies faced the challenges of an increasingly globalized
international market. In this case, they were surpassed by Asian companies in terms of the
production of household appliances and televisions. Philco was sold to the South Korean
company Goldstar, which would later become LG. Zenith, for its part, ended up closing its
headquarters. Since then, Peru has not ventured again into the assembly of televisions
(Morrison).
Regarding the current situation in the political sphere, we highlight that, within the Latin
American region, Peru has been one of the most affected countries by Covid-19 and state

77
abandonment. In this context, the situation has become even more critical, due to the political
crisis it is going through, with Congress and the Executive branch as protagonists in a long
chain of mutual attacks. In March 2018, pressured by several allegations of corruption, Pedro
Pablo Kuczynzki resigned from the Presidency of the Republic, and appointed Vice President
Martín Vizcarra as his successor. (Guevara)
At the beginning, the Vizcarra government was firm and committed to the fight against
corruption, for this reason a referendum was called to reform four chapters of the
Constitution, including one related to the reelection of congressmen. Subsequently, Congress
was dissolvedin October 2019 due to criminal maneuvers by the majority of its members,
represented by the Fujimori party. However, in March 2020 the pandemic caused by Covid-
19 revealed the shortcomings of a country that, despite sustained economic growth, was not
able to avoid the ravages of the health crisis. The Government of Vizcarra had to face the
health emergency with a collapsed health system and a population mostly subsisting in
informality, which made it impossible to guarantee confinement measures (Guevara).
After the dissolution of Congress, Peruvians elected new legislators, to end the previous
period and deliver the position in July 2020, without the possibility of reelection. The new
Congress confronted the Executive by questioning the economic management during the
pandemic, which led to the removal of Vizcarra, and Manuel Merino was appointed as the
new president. This decision, quite unpopular for a large part of the Peruvian people,
triggered a series of protests, leading to Merino's resignation. Despite the fact that Francisco
Sagasti was appointed by Congress as the new President of the Republic; it has not been
possible to solve the underlying problems in this crisis, nor to overcome popular discontent
with the political class and the prevailing order (Parodi-Revoredo).

78
Despite the political crisis, the country has experienced constant growth in its Gross
Domestic Product (GDP) in recent years, driven mainly by the production and export of
commodities. This stability is the product of government reforms, aimed at improving the
business climate, promoting foreign investment and boosting the country's competitiveness.
However, Peru is still vulnerable to external shocks, such as the fall in the price of
commodities, changes in international financial conditions or the pandemic. Despite this,
Peru remains one of the most stable and promising economies in the region (Lovón).
Regarding the perception of international entities, Peru fell eight positions, from 68 to 76 in
the Doing Business 2020 ranking. According to the World Bank report, the country climbed
positions in the indicators of Cross-border Trade, Management of Construction permits,
Registration Property and Insolvency Resolution. Meanwhile, it maintained its position in the
indicators of Payment of taxes; Obtaining electricity; Obtaining credit; Protection of minority
investors and Compliance with contracts. As a weak point, there is a decrease in the indicator
of Opening a Business. Despite Peru's decline in the ranking, it still holds the third position in
Latin America after Chile and Colombia; surpassing Panama; Brazil, Argentina, Ecuador and
Honduras (World Bank).
Table 25. Report Doing Business in Peru
Parameters
DB 2020 DB 2020
Ranking Score
Starting Business 133 82.1
Construction Permits 63 72.5
Getting electricity 88 74.5
Registering Property 55 72.1
Getting Credit 37 75
Protecting minority interests 45 68

79
Paying taxes 121 65.8
Trade 102 71.5
Enforcing Contracts 83 59.1
Resolving insolvency 90 46.6
Source: Banco Mundial, 2020
Elaborated: Authors
Regarding government management during the pandemic, measures were taken from the
beginning to stop the spread of the virus among the population; however, the results were
unfavorable and unsatisfactory. It should be noted that the vast majority of the population
within the Peruvian economy performs informal jobs, as they are not salaried, it is impossible
to stay at home due to lack of income. In addition, a small number of people were willing to
abide by the restrictions imposed by the government, the Police reported that only in Lima
321 illegal parties were held during 2020. In addition, the reduced investment in the health
system was evidenced when Peru faced the start of the pandemic with only 100 intensive care
beds for 32 million people; likewise, during the peak of infections, oxygen bottles for
treatments began to be scarce. Having a greater number of beds became a priority for the
government, neglecting other issues such as expanding the capacity of testing laboratories or
the provision of basic medical supplies, such as oxygen tanks, essential for treating critically
ill patients. . Humanitarian assistance programs were created, such as the payment of
economic aid, which caused agglomerations because only 38% of Peruvians had a bank
account and the rest of them had to collect the money in person in large queues in front of the
banks. These have been some of the factors that contributed to Peru leading the mortality rate
from Covid-19 in Latin America, a few months after the start of the pandemic (Humaní).

80
3.1.2 Economic Analysis
Export Sector
Peruvian exports are composed of traditional or extractive, which represent 80% and non-
primary or added value, represent 20% of the amount. Peru is characterized for being a
mining country that exports copper, gold, zinc and iron. By contrast, the nontraditional sector
is comprised by the textile industry and the agroindustry (Parodi).
According to the World Bank, Peru has had two growth phases since the beginning of the
new century. Among 2002 to 2013 Peru was one of the most developed countries in Latin
America, with a rate of average growth of the Gross Domestic Product (GDP) of 6.1% per
year, with low inflation levels and structural reforms for a favorable external landscape.
Moreover, poverty rates were reduced in the country which fell from 52.2% in 2005 to 26.1%
in 2013, this means that during this period 6.4 million people out of poverty. Likewise,
extreme poverty decreased from 30.9% to 11.4% during the same period.
Furthermore, among 2014 to 2019, the Gross Domestic Product (GDP) had an average
annual rate of 3.1%, this means that compared to previous years, there was a GDP contraction
due to the fall in the international price of raw materials, this external event lead to a
temporary reduction in investment of the private sector, slowdown in consumption and lower
tax collection. Despite this, there was a responsible management of the fiscal, monetary and
rate policy during the economic boom that led to endure the tax reduction fall without an
adjustment in spending.
In addition, the government had enough reserves to adjust the exchange rate. Besides that,
in order to increase exports and compensate for the slowdown in the domestic demand the

81
mining production was increased. In this landscape, the deficit in the current account has
decreased from 4.8% of GDP in 2015 to 1.5% in 2019 (Banco Mundial).
In 2020, the National Institute of Statistics and Informatics (INEI) estimated in the first
and second quarter of 2020 a GDP contraction of 3.4% and 30.2% due to the health
emergency. Conversely, the major economic contraction during confinement was in March
with - 16.7%, followed in April with -39.9%, in May with - 32.7% and June with -18.1%.
Since June the Peruvian economy started to recover due the national government
implemented an economic reactivation plan. In the first semester the hit hardest sectors were
restaurants and accommodation sector with a contraction of - 51.7%, the constructions with a
contraction of - 42.1% as well as the transport sector - 29.7%, while other sectors continued
growing such as the agriculture sector with a growth of 2, 1%, the telecommunications sector
with growth of 2.6% and financial services with a growth of 6.7% (Díaz, Deza and Moreno).
According to the World Bank, compared to other countries of the region, Peruvian
households were one of the most affected in terms of employment and income generating a
reduction to the consumption (Banco Mundial). Based on the National Institute of Statistics
and Informatics of Peru (INEI) in the months of May, June, July 2020 compared to the same
period of 2019 1, 9 million jobs were lost, a value that represents 40% of total employment.
Also, in the same period there was a wage contraction of 10.6% of people that did not lose
their jobs. Despite this, these impacts tend to be highest among the population segments with
lower wages (Díaz, Deza and Moreno).
In fact, due to the economic crisis, the Central Bank with the Ministry of Economy offered
a strategy to benefit households and businesses with the implementation of a program for
economic recovery based on containment and economic reactivation. So, the government to
contain the spread, had implemented some measures to restrict mobility which generated a

82
negative impact for the Peruvian economy. On the other hand, the Central Bank implemented
the Plan Reactiva Peru in which was provided liquidity to commercial banks for a value of
60,000 million soles, which is equivalent to 18 billion dollars in order to grant loans to formal
firms with a guarantee from the Ministry of Economy that fluctuates between 80% and 98%
of the loan, depending of the size of it. The loan was granted for 36 months with a minor
interest of 2% per year, the 98% were micro and small firms including firms linked to
agriculture and tourism. In this way, the credit for the private sector had grown by similar
amounts to a year without a pandemic (Parodi).
On the other side, the Ministry of Economy and Finance (MEF) implemented several
relief measures to all economic agents, and in the same way offered a monetary bonus for
vulnerable families. Nevertheless, the framework of bonds did not include or o partially
included informal independents, which are a mass of workers that amounts to 7 of each 10
workers; for that reason, it was pertinent to give the bonus for the most vulnerable (Parodi).
Inflation and Exchange Rate.
The Central Bank of Peru manages the floating exchange rate system, in which the free
market defines the exchange rate; however, requires the intervention of the monetary
authority to avoid abrupt fluctuations. Additionally, the Central Bank manages the Inflation
Targeting Scheme which its annual inflation aim is 2% +/- 1%. Therefore, in the months of
July, August and September 2020 the inflation was 0.46%, -0.11% and 0.14%, respectively.
Despite this, since March the reference rate has been reduced from 2.25% to 0.25%, in line
with the measures taken to face the impacts of the Covid-19. As can be seen in the checkbox,
in any month of 2020 year-on-year inflation does not exceed 1.90%. The expectation of
inflation of the economic agents remains at 1.8% for 2020, in relation to the expected results
(Parodi).

83
Table 26. Inflation rate 2020 in Peru
Months Monthly Year-on-year
February 0,14 1,90
March 0,65 1,82
April 0,10 1,72
May 0,20 1,78
June -0,27 1,70
July 0,46 1,86
August -0,11 1,69
September 0,14 1,82
Elaborated: Authors
It is noted that the monetary stability represents the soundness of the Peruvian economy.
The exchange rate, after being in a band between 3.30 to 3.40 soles per dollar from 2018 to
2019, in the first months of 2020 it had a jump to 3.57 soles per dollar, due to the uncertainty
generated by the health emergency, but it was offset by the Central Bank. In 2020 the
exchange rate would close among 3.55 to 3.60 soles per dollar. Conversely, the Federal
Reserve (FED) and the Central Reserve Bank of Peru reduced their interest rates, due to
global uncertainty (Parodi).

84
Trade Agreements
Since 1995 Peru has been part of the World Trade Organization (WTO). Moreover, since
1969 it is a member of the Andean Community of Nations (CAN). On the other hand, Peru
subscribed several Free Trade Agreements with some countries such as: Australia, Honduras,
Japan, Costa Rica, Panama, Mexico, South Korea, China, Canada, Singapore, Chile, the
United States and Thailand. In 2005 Peru joined the MERCOSUR, in 2008 subscribed a Free
Trade Agreement with the Association Free Trade Agreement (EFTA) and finally in 2014
Peru joined the Pacific Alliance (SICE).
Growth of Projections
According to the World Bank report, Latin America and the Caribbean are the most
stricken regions due to the health emergency. It requires the protection of the population
while returning towards growth. In 2020 it is projected in Latin America and the Caribbean
regions a GDP decreases of 7.9%. On the contrary, for 2021 is expected a growth of 4%.
As can be seen in the following box, in 2020 Peru presented a GDP growth of -12.0%.
Conversely, for 2021 is expected a growth of 7.6%, while for 2022 a growth of 4.5%. It is
important to keep in mind that Peru will be the country in the region with the best economic
recovery (Banco Mundial).

85
Table 27. Growth projections by Work Bank
GDP Growth Projections
Países 2020 2021 2022
Argentina -12,3 5,5 1,9
Brasil -6,3 4,2 3,1
Bolivia -7,3 4,4 3,8
Colombia -7,2 4,5 4,2
Chile -6,3 4,2 3,1
Ecuador -11,0 4,8 1,3
Paraguay -3,2 3,5 3,7
Perú -12,0 7,6 4,5
Uruguay -4,0 4,2 3,1
Reference: World Bank
Elaborated: Authors
Additionally, the Peruvian economy must face several challenges such as the GDP growth
acceleration, promote shared prosperity and protect citizens. To this effect, it is necessary to
achieve more efficiency in the provision of public services to generate protection by the
government, provide an efficient connectivity infrastructure and promote policies that reduce
inflexibilities in factor and product markets (Banco Mundial).
3.1.3 Social Analysis
According to the National Institute of Statistics and Informatics (INEI), the average
monthly expenditure per household in Peru is 2,797.90 soles. It should be noted that Peru is

86
going through a difficult situation with a depressed labor market; in 2020 the unemployment
rate reached 8.8%, double compared to last year, which translates to 6.7 million people
without work. Naturally, this directly affects household spending, which has registered a
decrease of 14.2% since the start of the health crisis. (INEI)
The population has shown a cautious attitude in their consumption habits. Products and
services related to health, food, basic services and communications have been those that have
shown favorable increases in their consumption. On the other hand, entertainment groups,
restaurants and hotels have been affected, despite the support that home services have
generated. A recovery is expected for 2021 compared to the catastrophic year that 2020 has
been. Remember that the presented numbers are a reflection of the incomes lack; In other
words, the growth in spending responds to the recovery of the labor sector and the consequent
reduction in unemployment (INEI).
Table 28. Distribution of expenses in Peruvian households
Distribution of expenses in Peruvian households
Consumption Groups
Before
Quarentine
After
Quarentine
Food and non-alcoholic beverages 27,10% 33,50%
Restaurants y hotels 13,60% 10,80%
Transports 11,60% 8,40%
Education 9,90% 8,20%
Accommodation and basic services 8,50% 10,10%
Goods and services 6,50% 8,10%
Vestment 5,60% 3,90%
Furniture and household items 5% 4,60%
Recreation and culture 4,70% 4%
Health 3,20% 3,80%
Communications 3% 3,40%
Alcoholic beverages and tobacco 1,30% 1,20%
Source: INEI
Elaborated: Auuthors

87
On the other hand, the Peruvian consumer has not been oblivious to the evolution that the
way of doing business has gone through, due to factors such as innovation in technology and
globalization. Their consumption habits, as well as their relationship with brands, are now
determined by the use of mobile devices. The use of digitally available information is a useful
tool in the stage that precedes the purchase, allowing people to compare prices, find out the
characteristics of the product or learn the opinions of other consumers. This has created a
more demanding consumer, who needs to highlight their individuality by being served in a
personalized way (Mukherjee). The customer expects a greater offer aimed at him, greater
fluency in communication and direct interaction with retail to solve problems related to the
purchase process or the product (Osorio).
All of the above has contributed to creat a Peruvian consumer who demands quality, but
above all who rationalizes their purchasing decisions, with quality being their main concern,
which implies that only the minority of consumers have uncritical consumption impulses.
However, what is most relevant is that the majority of the Peruvian consumer states that they
are inclined to adopt new products early, while less than half are inclined to buy products
from famous brands or aspirations. This last point becomes relevant when it comes to the
acquisition of durable goods such as automobiles or electrical appliances (Frenk).
3.1.4 Technological Analysis
Based on the Global Innovation Index report, Peru ranked at 76 out of 131 economies;
however, compared to 2019 Peru fell seven positions and five compared to 2018 (Mendoza).
In the following box will be detailed the top ranking in terms of innovation at the regional
level and the positions in the global ranking (Mendoza).

88
Table 29. Ranking Global Innovation Index of Latin America
Countries of Latin America
and the Caribbean
Position in the
regional
ranking
Position in
the global
ranking
Chile 1 54
México 2 55
Costa Rica 3 56
Brasil 4 62
Colombia 5 68
Uruguay 6 69
Jamaica 7 72
Panamá 8 73
Perú 9 76
Argentina 10 80
Elaborated: Authors
The results demonstrate that the Peruvian performance in terms of innovation matches
with the Gross Domestic Product Per Capita. The index indicates that Peru has fewer results
in terms of innovation based on the investments that make.
Therefore, it is necessary that the region invest in research and development, in
technological advances to achieve greater competitiveness, also in intellectual property
systems, the disconnection between the public and private sectors regarding the prioritization
of direct investment and innovation. It is important to underline that only Brazil performs
direct investment at the European level. Likewise, Brazil, Mexico and Argentina have global
companies of direct investment. Thus, Chile, Uruguay and Brazil formulate technical and
scientific articles of high level, and besides Brazil is the only country in the region to register
patents developed in its territory (Mendoza).

89
3.1.5 Ecological Analysis.
The Directorate of Control, Sanction and Incentive Application of the OEFA publish and
update the information of the Record of Good Environmental Practices of the Evaluation and
Enforcement Agency Environmental. It establishes that everyone has the right to live in a
healthy, balanced and adequate environment for the development of human living. Moreover,
there are some obligations to contribute to an effective environmental management ensuring
the health of people individually and collectively, conservation of biological diversity,
sustainable use of natural resources and the sustainable development of the country (El
Peruano).
The aim of this Record is to regulate the operation of the Register of Good Environmental
Practices carried out by natural persons or legal, public or private, that comply with their
environmental obligations and are under the jurisdiction of the OEFA, and these are
applicable for the accountable units (mining unit, lot, central, plant, concession, between
others (El Peruano).
To carry out these economic activities, the managed must have the updated environmental
management instrument which refers to the Environmental Impact Statement (EIS), Impact
Study Detailed environmental (EIA-d) or semi-detailed (EIA-sd), Adequacy Program,
Environmental Management (PAMA), Complementary Annual Fishing Plan (PACPE), Plan
Environmental Management (PMA) or other instrument that regulates the obligations
management (El Peruano).
Additionally, in the Register of Good Environmental Practices of the OEFA will record
the following information:
a) Company Name, denomination of the managed owner of the unit audited;

90
b) Name and location of the audited unit;
c) Number of National Identity Document or Unique Taxpayer Registry of the administered;
d) Sector and subsector to which the company belongs;
e) Summary of the activity carried out in the auditable unit;
f) Date of direct supervision on which compliance with the environmental obligations (El
Peruano).
Within the grounds for withdrawal, the auditable unit will be removed from the Recover
of Good Environmental Practices of the OEFA for the following reasons:
a) If it is detected a finding of an alleged administrative infraction for a direct supervision;
b) If it improperly disseminates its incorporation in the Register of Good Practices
Of the OEFA, in breach of the provisions of Article 10 of the Regulation. In this way, the
auditable unit withdrawn from the Recover of Good Environmental Practices may not be
incorporated again in a period of 12 months, counted from retirement (El Peruano).
3.1.6 Legal Analysis
The regulatory entity for business activity in Peru is INDECOPI, which promotes healthy
competition and respect for Intellectual Property. The process for the creation of a company
in Peru can be carried out through a natural or legal person. It can take between 10 and 26
days, it all depends on the particularities and nature of each business. It should be noted that
the average time is the lowest in all of Latin America and the Caribbean. The World Bank
estimates that the costs of starting a business in Peru are around 9.4% of per capita income,

91
which is still lower than the approximate average for Latin America and the Caribbean
(World Bank).
Since November 1991, the Framework Law for the Growth of Private Investment was
approved in Peru, which eliminates and prohibits all forms of reservation of economic
activities in favor of the State, except for reasons of public interest or national security. From
that moment, the main function of the State was to supervise and promote free competition,
avoiding abuses or the formation of Monopolies (Echecopar).
The Peruvian legal framework, in order to encourage foreign investment and attract new
capital, provided that prices will be regulated only by the law of supply and demand,
relegating to the state only the designation of tariffs for public services. For the same
purpose, the same rights were established for foreign investors as for domestic investors.
Certain guarantees were introduced, such as the free right to possession and disposal of
foreign currency; and the repatriation of capital and dividends. Naturally, with regard to
exchange matters, there is no distinction between sectors or types of activities when
determining tariffs. The right to freely transfer foreign currency without any authorization
was guaranteed, preserving the integrity of its capital, profits and royalties. The only
restriction reserved by the State is to prohibit foreigners from possessing mines, forests,
water, fuels and energy sources, except for an exception declared by Supreme Decree based
on public necessity or national utility (Echecopar) .
To start a business in Peru or apply for a work visa in Peru, a deep understanding of
Peruvian labor law is essential. In addition, the importance of protecting the rights of local
employees is of great concern to the Peruvian government and therefore, it is important to
know the restrictions for employing foreign employees (Garcia).

92
3.2 Interview to the Head of Television Line.
On January 25, 2021, an interview was conducted to Dr. Luis Guillermo Crespo, Head of
Television Line of the firm MP3, through a virtual meeting by zoom; in order to analyze
several factors of the Peruvian market. Several questions were asked to know some
particularities of the market and the most important differences in comparison with the
Ecuadorian market.
Regarding the internalization process carried out with its products; the Dr. Crespo
mentioned that the firm MP3 has the Blaupunkt brand license, and other brands for the
production in Latin America. When starting with the commercialization of televisions outside
of Ecuador, the different competitive advantages of each market are analyzed. In the case of
Peru, the assembly industry is almost nil, at least in the television market. Thus, certain
brands have been inserted to Peru, sending a final product from China to MP3 commercial
office. It is relevant to emphasize that the business model of the firm does not sell to the final
consumer, conversely is directed to large chains.
To have a successful internalization it is necessary to analyze the differences between the
Peruvian and the Ecuadorian market. The Ecuadorian market stands out for its Smart Tv
televisions, representing 100% of televisions to sell, this means that televisions require access
to the Internet. It is noteworthy that there is not even 50% penetration of the Internet in
Ecuador; thus, many televisions that are sold do not connect to the Internet or are given to the
Internet through the plans of the user's cell phones. By contrast, in the Peruvian market,
Smart Tv only represents 60% of the market and 40% are not Smart Tv. On the other hand, it
is essential to consider that Ecuador is a dollarized country, where costs are higher and the
final consumer price. Thus, in Peru televisions stand out for their quality and require a lower
cost in comparison to Ecuador. Peru does not have national brands; televisions are imported

93
whereas in Ecuador are assembled national brands in the white brand market which
represents 60% of sales.
By all means, the importation of international brands in the Peruvian market such as
Samsung, Edge, TCL, Hyundai, Sony, Orion, among others are leading the sales in the
country; in this way, Blauplunkt has to compete against these brands, highlighted for their
quality and prestige, it is important to focus on giving it an appropriate position in the market.
The challenge is to sell a product of good quality and affordable price to offset the fight
against the top of mind.
As the firm MP3 is the licensee of the Blaupunkt brand, it is possible to offer televisions
as an exclusive brand. Retail chains assess the competitive advantage that this gives them,
avoiding entering a competition of prices, because they are able to set them and choose their
target. Regarding its price, is an approachable rank below the top-of-mind brands, without
being so cheap that to question the quality. In order to reach the clients, televisions have an
innovative and modern Android 6.0 Operating System, as well as offering a technical service
back up.
The Peruvian market offers several advantages to internalization like the opportunity to
replicate the business model of Ecuador by indirect export with a foreign agent. As
mentioned before, Peru doesn’t have national brands; they rather import televisions taking
advantage of the Free Trade Agreements with the United States, China and Korea, these 3
countries are the major producers of televisions. Instead, Ecuador is an TVv assembler;, that
is the case of MP3, which produces brands as Blaupunkt, and offers its products to retail
chains. It’s important to mention that televisions are offered only to Grupo El Rosado as an
exclusive brand. In this sense, the benefits of the retail chain will be set relative to the target
and demand, unlike other brands that do not have this exclusivity and are distributed in

94
several stores where there is a price competition. Another advantage of the Peruvian market
is that their products are free of importation, whether of any type of finished product;
likewise, in Ecuador there are certain tariffs towards finished products.
Finally, we move to the current context caused by the Covid-19 where the government
implemented restrictions and measures to slow down the spread of the virus among the
population like other companies, MP3 was not able to produce during the first days of the
health emergency, Notwithstanding, when the restrictions were lifted, the television market
had an increase in its sales. Since the population was forced to deprive a large part of its
social activities, televisions had a great acceptance among the consumers. Moreover, in
recent years the boom of Stream services, such as Netflix, Amazon Prime, Disney Plus, Blim,
HBO Go, etc., have become popular to televisions with Smart Tv technology. The
counterpart of this situation would be later, since higher consumption, higher demand. Today,
the supply from China had increased, this caused a rise in manufacturing costs between 30%
to 40%, including logistics costs $ 800 to $ 1500 in low season, at a value that goes from $
6000 to $ 8000.

95
3.3 Internalization Case of the Peruvian market
On February 4, 2021, a virtual interview was conducted via zoom to the Ing. Pedro
Espinoza, Commercial Manager of Indurama, who has a profound knowledge of the Peruvian
market. Several questions were asked to know some particularities of the market.
Indurama is the result of the entrepreneurship of a group of cuencans in order to develop
the industrial sector, carrying out the assembly of refrigerators with the advice and license of
WCI-USA. Additionally, the assembly of refrigerators, Indurama began with the production
of oven stoves which had the support of Tecnogas-Italia. In 1982 its products had a great
acceptance in the Ecuadorian market, this led to the firm systematizing its online production,
allowing it to achieve high levels of quality, expand the supply of models and finally increase
the production of household appliances. In 1985 Indurama expanded into new markets in
Latin America, becoming Peru the first export destination. It is worth mentioning that
Indurama has 47 years of market participation, standing out for its high-quality products.
Currently, it is one of the brand leaders in kitchens representing 42% of the market.
According to the Commercial Manager, the Peruvian market is an open competitive
market where there are no tariffs due to the fact that Peru has Free Trade Agreements with
other countries. Furthermore, in this market there is strong competition with large
participation as the case of Samsung, LG, Sony, Panasonic, among other recognized brands;
conversely, what highlights in this market are the major chains, as SAGA Falabella which is
a Chilean department store, considered the major retail company in Latin America which has
several branches in Chile, Peru, Argentina and Colombia, offering a range of products such
as clothing, footwear, jewelry, appliances, among others. One of its major competitors is the
Ripley Store, which is a Chilean chain of department stores which have operated in Peru
since 1997, offering financial services, a supermarket and department stores where clothing,

96
footwear, furniture, kitchenware, food, clothing, among other products. In 2020 Tiendas
París, the Chilean department store, liquidated its stores in Peru given that did not obtain the
expected participation.
To become part of these chains, brands must comply with certain standards because chains
are demanding at the time of insertion since they represent 60% of the market. By contrast,
the stores by departments, supermarkets, and horizontal distributors represent the 80% in the
appliance sector. One of the most important stores of appliances is the Hiraoka Store in the
District of Lima, which from the point of view of the Indurama Commercial Manager is an
opportunity for our product to internalize. Based on the state support, some areas are assisted
like the Development Zones; so, the government provides them labor and machinery for its
growth; similarly, to the agro-industrial and the mining sectors. By contrast, in the appliance
market there is no state assistance.
This market has some challenges such as the price wars, the issue of credits required by
the chains and related to technical service in Peru due to long distances. Equally, many of
these stores tend towards the liquidation of the exhibition, a point to take into account at the
moment of internalization to this market. It could even say that the Peruvian market is a
competitive market but at the same time it is profitable.
3.4 Competitive Diamond by Porter
Next, an analysis of the Peruvian market will be carried out based on Porter's forces:
demand, competence, factors and supporting sectors.
3.4.1 Demand
According to the Lima Chamber of Commerce, Peru is an importing country of
televisions. Thus, during February of the previous year, 142,528 televisions were imported

97
with a value of 30 million dollars which meant an increase in quantity of 17.71% in
comparison to September 2019. Conversely, due to the confinement measures carried out by
the Peruvian government the imports of televisions have been affected (Andina).
As from the month of March the import market reported a contraction, in May its lowest
peak with 57,566 units imported, that means a decline of 73.08% by a value of eight million
dollars this represents 84.54% less compared to May 2019. By contrast, in July the imports
had increased with 182,842 televisions (74.94%) by a value of 42 million dollars (56.56%)
compared to July 2019. In September the performance of the market was positive with
imports of 147,388 devices by a value of 35 million dollars, this represents 5.62% more than
September 2019. Likewise, in October the imports of televisions by a value of 49 million
dollars, which is equivalent to a growth of 26.92% in comparison to October 2019 (Andina).
Additionally, in 2020 was conducted a study by Concortv which clarified that 99% of the
Peruvians consume an average of two hours of television a day. However, comparing the
value of the television audience from March 1 to 15 with the audience of March 16 to 26,
there is an increase in the consumption by 42%, while Colombia with 36%; Guatemala with
32% and Ecuador with 29%. Thus, due to the restrictions, television consumption had
increased during April where it shows that Peruvians spent up to 6.41 hours watching Tv.
Even though all the age ranges increased their television consumption, especially it
highlighted people between 38 to 49 years, which had a greater consumption increase if we
compare the week of March 9 with the week of April 6, 2020 (Mercado Negro).

98
3.4.2 Competence
As mentioned before, Peru does not assemble televisions but rather import the top
trademarks such as Samsung, LG, Panasonic, Philips, AOC, Hisense, Sony, Hyundai and
Haier. An analysis of the television market was carried out in the following stores: El
METRO, El Curacao, and Linio.
In the following tables will be analyzed several factors:
Table 30. Analysis of the Samsung Tv in the store El METRO
TV BRAND FEATURES RESOLUTION PRICE IN
SUNS
PRICE IN
DOLLARS
Samsung Smart
Tv Crystal
50 inches 4K S/1,699.00 $ 466,75
Samsung Smart
Tv Crystal
65 inches 4K S/2,399.00 $ 659,06
Samsung Smart
TV Crystal
55 inches 4K UHD S/1,999.00 $ 549,17
Samsung Smart
TV Crystal
50 inches 4K UHD S/1,799.00 $ 494,23
Samsung Smart
TV Crystal
55 inches 4K UHD S/2,299.00 $ 631,59
Samsung Smart
TV Crystal
55 inches 4K UHD S/1,899.00 $ 521,70
Samsung Smart
TV Crystal
75 inches 4K UHD S/4,399.00 $1208,51
Samsung Smart
TV LED
75 inches 4K UHD S/5,999.00 $ 1648,07
Samsung Smart
TV LED
55 inches 4K UHD S/4,499.00 $ 1235,98
Elaborated: Authors

99
Table 31. Analysis of the LG Tv in the store El METRO
TV BRAND FEATURES RESOLUTIONS PRICE IN SUNS PRICE IN
DOLLARS
LG Smart Tv 32 inches HD S/899.00 $246,97
LG Smart Tv 60 inches UHD S/1,899.00 $521,70
LG Smart TV
NanoCell
55 inches UHD S/2,099.00 $576,64
LG Smart Tv 55 inches UHD S/1,749.00 $480,49
LG Smart Tv 49 inches UHD S/1,499.00 $411,81
LG Smart Tv 50 inches UHD S/1,899.00 $521,70
LG Smart Tv
NanoCell
86 inches UHD S/12,999.00 $3571,15
LG Smart TV
NanoCell
65 inches UHD S/3,499.00 $ 961,26
LG Smart TV 70 inches UHD S/3,599.00 $988,73
Elaborated: Authors
Table 32. Analysis of the Panasonic Tv in the store El METRO
TV BRAND FEATURES RESOLUTIONS PRICE IN SUNS PRICE IN
DOLLARS
Panasonic
Smart TV
55 inches 4K UHD S/1,549.00 $425,54
Panasonic
Smart TV
43 inches 4K UHD S/1,299.00 $ 356,86
Panasonic
Smart TV
50 inches 4K UHD S/1,299.00 $356,86
Elaborated: Authors
Table 33. Analysis of the Philips Tv in the store El METRO
TV BRAND FEATURES RESOLUTIONS PRICE IN SUNS PRICE IN
DOLLARS
Philips Smart
TV
50 inches 4K UHD S/1,299.00 $ 356,86
Philips Smart
TV
70 inches 4K UHD S/2,699.00 $741,48
Philips LED 55 inches ULTRA HD 4K S/1,499.00 $411,81
Philips Smart
TV
50 inches UHD S/1,599.00 $439,28
Philips Smart
TV
43 inches Full HD S/1,099.00 $301,92
Elaborated: Authors

100
Table 34. Analysis of the AOC Tv in the store El METRO
TV BRAND FEATURES RESOLUTIONS PRICE IN SUNS PRICE IN
DOLLARS
AOC Smart TV 55 inches 4K UHD S/1,549.00 $425,54
AOC Smart TV 43 inches Full HD S/1,099.00 $301,92
Elaborated: Authors
Table 35. Analysis of the Hisense Tv in the store El METRO
TV BRAND FEATURES RESOLUTIONS PRICE IN SUNS PRICE IN
DOLLARS
Hisense Smart
Tv
32 inches HD S/829.00 $227,74
Hisense Smart
TV
43 inches Full HD S/1,249.00 $343,13
Elaborated: Authors
Table 36. Analysis of the Sony Tv in the store EL METRO
TV BRAND FEATURES RESOLUTIONS PRICE IN SUNS PRICE IN
DOLLARS
Sony Smart TV 49 inches UHD S/2,399.00 $ 659,06
Sony Smart TV 65 inches 4K UHD S/3,549.00 $ 975
Elaborated: Authors
Table 37. Analysis of the Samsung Tv in the store La Curacao
TV BRAND FEATURES RESOLUTIONS PRICE IN SUNS PRICE IN
DOLLARS
Samsung Smart
TV Crystal
50 inches Ultra HD S/ 1,649.00 $ 453,02
Samsung Smart
TV Crystal
55 inches Ultra HD S/ 1,999.00 $549,17
Samsung Smart
TV Crystal
65 inches UHD 4K S/ 2,599.00 $ 714,01
Samsung Led 55 inches 4K Ultra HD S/ 4,399.00 $ 1208.51
Samsung Smart
TV Led
55 inches 4K Ultra HD S/ 4,499.00 $1235,98
Samsung Smart
TV Led
65 inches 4K Ultra HD S/ 5,599.00 $1538,18
Samsung Smart
TV Led
65 inches 4K Ultra HD S/ 4,499.00 $1235,98
Samsung Led 50 inches 4K Ultra HD S/ 3,499.00 $961,26
Samsung Smart
Tv Crystal
50 inches Ultra HD S/ 1,649.00 $453,02
Samsung Smart
Tv Crystal
55 inches Ultra HD S/ 1,999.00 $549,17
Samsung Smart 65 inches UHD 4K S/ 2,599.00 $714,01

101
Tv Crystal
Samsung Led 55 inches Ultra HD S/ 4,399.00 $1208,51
Samsung Smart
Tv Led
55 inches Ultra HD S/ 4,499.00 $1235,98
Samsung Smart
Tv Led
65 inches 4K Ultra HD S/ 5,599.00 $1538,18
Samsung Smart
Tv Led
65 inches 4K Ultra HD S/ 4,499.00 $1235,98
Samsung Led 50 inches 4K Ultra HD S/ 3,499.00 $961,26
Elaborated: Authors
Table 38. Analysis of the LG Tv in the store La Curacao
TV BRAND FEATURES RESOLUTION
S PRICE IN SUNS
PRICE IN
DOLLARS
LG Smart TV 43 inches 4K Ultra HD S/ 1,399.00 $ 384,34
LG Smart TV 49 inches 4K Ultra HD S/ 1,499.00 $411,81
LG Smart TV 55 inches 4K Ultra HD S/ 1,799.00 $494,23
LG Smart TV 65 inches 4K Ultra HD S/ 2,299.00 $631,59
LG Smart TV 70 inches 4K Ultra HD S/ 3,099.00 $851,37
LG Smart TV
Nanocell
50 inches 4K S/ 1,999.00 $549,17
LG Smart Tv
Nanocell
55 inches 4K S/2,499.00 $686,53
LG Smart TV
Nanocell
65 inches 4K S/ 3,499.00 $961,26
LG Smart TV 75 inches 4K Ultra HD S/ 3,899.00 $1071,15
LG Smart TV
Nanocell
55 inches 4K S/ 3,199.00 $878,84
LG Smart TV
Nanocell
75 inches 4K S/ 9,499.00 $2609.61
LG Smart TV 86 inches Ultra HD S/ 8,799.00 $2417,30
LG Smart TV
Oled
65 inches 4K S/ 7,999.00 $2197,52
LG Smart TV
Oled
65 inches Ultra HD 4K S/ 5,999.00 $1648,07
LG Smart TV
Oled
55 inches Ultra HD 4K S/ 4,199.00 $1153,57
LG Smart TV 50 inches Ultra HD S/ 1,899.00 $521,70
Elaborated: Authors

102
Table 39. Analysis of the Hisense Tv in the store La Curacao
TV BRAND FEATURES RESOLUTIONS PRICE IN SUNS PRICE IN
DOLLARS
Hisense Led 58 inches Ultra HD S/ 1,599.00 $439,28
Hisense Smart
TV Led
32 inches HD S/ 749.00 $205,76
Hisense Smart
TV Led
49 inches FHD S/ 1,249.00 $343,13
Hisense Smart
TV Led
50 inches Ultra HD S/ 1,399.00 $384,34
Hisense Smart
TV Led
55 inches Ultra HD S/ 1,599.00 $439,28
Hisense Smart
TV Led
65 inches Ultra HD S/ 2,099.00 $576,64
Hisense Smart
Tv Led
43 inches Full HD S/ 1,049.00 $288,18
Elaborated: Authors
Table 40. Analysis of the AOC Tv in the store La Curacao
TV BRAND FEATURES RESOLUTIONS PRICE IN SUNS PRICE IN
DOLLARS
AOC Smart TV 50 inches Ultra HD 4K S/ 1,449.00 398,07$
AOC Smart TV 55 inches Ultra HD 4K S/ 1,649.00 453,02$
Elaborated: Authors
Table 41. Analysis of the Philips Tv in the store La Curacao
TV BRAND FEATURES RESOLUTIONS PRICE IN SUNS PRICE IN
DOLLARS
Philips Smart
TV
50 inches 4k Ultra HD S/ 1,699.00 $466,75
Philips Smart
TV
58 inches 4K Ultra HD S/ 2,199.00 $604,12
Philips Smart
TV Led
70 inches 4K UHD S/ 2,899.00 $796,42
Elaborated: Authors

103
Table 42. Analysis of the Hyundai Tv in the store La Curacao
TV BRAND FEATURES RESOLUTIONS PRICE IN SUNS PRICE IN
DOLLARS
Hyundai Smart
TV
58 inches Ultra HD S/ 1,499.00 $411,81
Hyundai Smart
TV Led
32 inches HD S/ 749.00 $205,76
Hyundai Smart
TV Led
40 inches Full HD S/ 949.00 $260,71
Hyundai Smart
TV
50 inches 4K Ultra HD S/ 1,299.00 $356,86
Hyundai Smart
TV Led
65 inches UHD S/ 2,299.00 $631,59
Elaborated: Authors
Table 43. Analysis of the Haier Tv in the store La Curacao
TV BRAND FEATURES RESOLUTIONS PRICE IN SUNS PRICE IN
DOLLARS
Haier Smart TV 50 inches 4K Ultra HD S/ 1,399.00 $384,34
Haier Android
TV
55 inches 4K Ultra HD S/ 1,599.00 $439,28
Haier Smart TV 55 inches 4K Ultra HD S/ 1,299.00 $356,86
Haier TV 32 inches HD S/ 449.00 $123,35$
Elaborated: Authors
Table 44. Analysis of the Panasonic in the store La Curacao
TV BRAND FEATURES RESOLUTIONS PRICE IN SUNS PRICE IN
DOLLARS
PANASONIC
Smart TV
43 inches Ultra HD 4K S/ 1,399.00 $384,34
PANASONIC
Smart TV
50 inches Ultra HD 4K S/ 1,599.00 $439,28
PANASONIC
Smart TV
55 inches Ultra HD 4K S/ 1,799.00 $494,23
PANASONIC
Smart TV
65 inches UHD S/ 2,499.00 $686,53
Elaborated: Authors

104
Table 45. Analysis of the Samsung Tv in the store Linio-Peru
TV BRAND FEATURES RESOLUTIONS PRICE IN SUNS PRICE IN
DOLLARS
Samsung Smart
TV Crystal
50 inches UHD 4K S/ 1,799.00 $494,23
Samsung Smart
TV Led
50 inches 4K S/ 2,149.00 $590,38
Samsung Smart
TV Led
65 inches 4K S/ 6,799.00 $1867,85
Samsung Led 58 inches UHD 4K S/ 2,199.00 $604,12
Samsung Smart
TV Led
55 inches 4K S/ 5,499.00 1510,71$
Samsung Led
Crystal
55 inches UHD 4K S/ 2,049.00 562,91$
Samsung Smart
TV Crystal
75 inches UHD 4K S/ 4,299.00 1181,04$
Samsung Smart
TV Crystal
55 inches UHD 4K S/ 1,899.00 521,70$
Samsung Led
Crystal
65 inches UHD 4K S/ 2,799.00 768,95$
Elaborated: Authors
Table 46. Analysis of the Sony Tv in the store Linio-Peru
TV BRAND FEATURES RESOLUTIONS PRICE IN SUNS PRICE IN
DOLLARS
Sony Smart TV 55 inches 4K UHD S/ 2,049.00 $562,91
Sony Android
Smart TV
75 inches 4K UHD S/ 5,999.00 $1648,07
Sony Android
Smart TV
85 inches 4K UHD S/ 8,999.00 $2472,25
Sony Android
Smart TV
65 inches 4K UHD S/ 3,549.00 $975
Sony Android
Smart TV
55 inches 4K UHD S/ 3,999.00 $1098,62
Sony Smart TV 32 inches HD S/ 1,149.00 $315,65
Sony Android
Smart TV
65 inches 4K UHD S/4,299.00 $1181,04
Sony Android
Smart TV
65 inches 4K UHD S/ 5,799.00 $1593,13
Sony Android
Smart TV
55 inches 4K UHD S/ 4,299.00 $1181,04$
Elaborated: Authors

105
Table 47. Analysis of the Philips Tv in the store Linio-Peru
TV BRAND FEATURES RESOLUTIONS PRICE IN SUNS PRICE IN
DOLLARS
Philips Smart
TV Led
50 inches 4K UHD S/ 1,499.00 $411,81
Philips Smart
TV Led
58 inches 4K UHD S/ 1,799.00 $494,23
Philips Smart
TV Led
55 inches 4K UHD S/ 1,699.00 $466,75
Philips Smart
TV Led
55 inches 4K UHD S/ 1,799.00 $494,23
Philips Smart
TV Led
50 inches 4K UHD S/ 1,519.00 $417,30
Philips Smart
TV Led
58 inches 4K UHD S/ 1,999.00 $549,17
Philips Smart
TV Led
70 inches UHD S/ 2,799.00 $ 768,95
Elaborated: Authors
Table 48. Analysis of the Panasonic Tv in the store Linio-Peru
TV BRAND FEATURES RESOLUTIONS PRICE IN SUNS PRICE IN
DOLLARS
Panasonic TV
Led
65 inches 4k HDR S/ 2,199.00 $604,12
Elaborated: Authors
Regarding the Peruvian television market, El Metro is a chain of Peruvian supermarkets
which is part of the Chilean holding Cencosud firm, located in Peru since 1992. This chain
offers several Tv brands such as: Samsung, LG, Panasonic, Philips, AOC, Hisense and Sony.
Besides, La Curacao Retail Chain specializes in household appliances, has more than 80
stores all over the country, also stand out 30 years of experience in the market offering the
following Tv brands: Samsung, LG, Hisense, AOC, Philips, Hyundai, Haier and Panasonic.
Similarly, Linio is a Peruvian online store that offers several Tv brands: Samsung, Sony,
Philips and Panasonic with low prices.
In these stores the 90% of the Tv brands are Smart Tv with an operating system.
Regarding the Tv features, Samsung has the following features: 50 inches, 55 inches, 58

106
inches, 65 inches, and 75 inches. LG, 32 inches,43 inches,49 inches, 50 inches, 55 inches, 60
inches, 65 inches,70 inches, 75 inches, 85 inches, and 86 inches while Panasonic, 43 inches,
50 inches, 55 inches and 65 inches. Philips, 43 inches, 50 inches, 55 inches, 58 inches and 70
inches. AOC, 43 inches, 50 inches and 55 inches. Hisense, 32 inches, 43 inches, 49 inches, 50
inches, 55 inches, 58 inches and 65 inches. Hyundai, 32 inches, 40 inches, 50 inches, 58
inches and 65 inches and finally Haier, 32 inches, 50 inches and 55 inches.
Regarding the Tv resolution, Samsung has HD, UHD 4K, 4K Ultra HD,4K and 4K UHD
resolutions; LG has 4K, 4K Ultra HD, HD and UHD resolutions. By contrast, Panasonic has
UHD, Ultra HD 4K, 4K HDR and 4K UHD resolutions while Philips has UHD, full HD, 4K
UHD and Ultra HD 4K resolutions; AOC has Ultra HD, 4K, Full HD and 4K UHD
resolutions; Hisense has HD, FHD and Ultra HD resolutions; Sony has HD, UHD and 4K
UHD resolutions; Hyundai has HD, UHD, Ultra HD and 4K Ultra HD resolutions; Haier has
HD and Ultra HD 4K resolutions.
Finally, concerning the prices it will depend on the feature and the Tv resolution.
Therefore, in the following box are a range of prices depending on the brand. Samsung is
positioned in a high price range offering televisions between $ 450 to $ 1500; likewise, LG
with televisions between $ 240 to $ 2,600, Sony between $ 660 a $ 2470 and Philip between
$ 300 to $ 800. However, brands like AOC, Hisense, Hyundai, Panasonic are in an
intermediate range of prices, AOC with a range between $ 425 to $ 450, Hisense between $
230 to $ 580, Panasonic between $ 425 to $ 690 and Hyundai between $ 200 to $ 630, and
finally Haier is an economic range of prices with a range between 120$ to 400$.

107
3.4.3 Factors
3.4.3.1 Labor
In the Peruvian labor market (as in other countries in the Latin American region) we can
highlight that there is a low level of open unemployment; however, there is also a low level
of salaried personnel. In fact, we can find a high rate of labor informality, mainly
concentrated in rural areas. It can be noted that a large part of the active population, made up
of working-age inhabitants who have paid employment, work mainly in micro and small
companies, developing occupations of salespeople, service workers and even professionals
and technicians. Empirical information shows that, in Peru, men predominate among properly
employed workers. On the other hand, underemployment due to income predominates among
women and among the younger active population (less than 24 years old) or among the
elderly (older than 65 years). (Rees)
It has been evident that in Peru there is a shortage of qualified labor, causing the salaries
for competent professionals to increase, which reduces the competitiveness of the Peruvian
economy. Today, the high demand for technicians has caused an increase in their salaries
reaching up to 2,000 USD per month. It is increasingly common for foreign workers to
replace the national workforce, significantly reducing household income for Peruvian
families. This is because the educational offers of the Universities are not aligned with the
labor demand. It produces an overexploitation of certain careers, which insert thousands of
professionals each year in a labor market that does not have the capacity to support them.
(Proexpansión)

108
3.4.3.2 Inputs and infrastructure
In Porter's model, the competitiveness of a sector is based on the availability of suppliers or
related industries that, in turn, are themselves competitive. Related industries include all
those that share common technologies, inputs and complementary products. In other words,
related industries are those with which companies can share or coordinate activities in their
value chain, such as technology development, manufacturing, distribution, marketing or
product service. Typically, in developing countries, given the lack of competitive suppliers,
industries appear as isolated sectors rather than clusters or related industries. This forces most
of the components to be imported. In the case of Peru, the absence of a television assembly
industry would initially force the products to be imported into the country, directly by the
MP3 Company. Therefore, the infrastructure destined to be the intermediary between MP3
and the Peruvian consumer would be some of the large retail chains that operate in the
country, such as Saga Falabella, Ripley, Tiendas Paris, Sodimac, La Polar, among others.
3.4.4 Related and support sectors
According to Porter, it is important to understand the role that a country's government
plays in influencing each market through laws, regulations and policies. With each change in
the rules of the game, it brings with it consequences that can negatively or positively alter the
business climate. In the Peruvian case, in 1990 the opening and liberalization of the markets
took place, eliminating the barriers to entry and exit of capital, while reducing the
participation of the State in economic affairs. Once these conditions were met, a more
competitive market began to emerge, creating a stimulus for companies to improve the
quality of their products and services. This change allowed to a cultural evolution in the
Peruvian market, causing many companies to internalize new standards and norms (Prado).

109
3.5 Marketing Plan
Table 49. View, misión, objectives of the firm
Marketing Plan
View Retain our client segment, satisfying their needs above their expectations,
providing them quality products to hand with technological advances in their
field.
Mission Position Blaupunkt as a competitive Tv brand in the Peruvian market, to be a
reference of quality, innovation, and avant-garde for our clients.
General
Objective
Position the Blaupunkt Tv brand in the Peruvian market.
Specific
Objectives
● Increase 10% of the firm's sales with the internalization of Blaupunkt
to the Peruvian market in a period of 5 years.
● Retain client's loyalty in the Peruvian market with the Blaupunkt Tv
brand.
● Position the Blaupunkt Tv brand in the leading appliance store in
Peru (La Curacao).
Elaborated: Authors

110
3.6 Product
3.6.1 Product Inventory
MP3 has several Blaupunkt Tv models such as Blaupunkt Smart Tv 65 inches with UHD
resolution, Blaupunkt Smart Tv 75 inches with 4K UHD resolution, Blaupunkt Smart Tv 55
inches with an Ultra HD resolution, Blaupunkt Smart Tv 55 inches with an UHD 4K
resolution, Blaupunkt Smart Tv 43 inches with Full HD resolution and Blaupunkt Smart Tv
40 inches with Full HD resolution. Even though, we chose a sample of three televisions that
represent 90% of the company sales, which are described in the following box:
Table 50. TVs in stock
Blaupunkt Tv Features Cost
Smart Tv 32 inches 144$
Smart Tv 43 inches 227$
Smart Tv 50 inches 293$
Elaborated: Authors
3.6.2 Technical Assistance, Installation and Training System.
● Online advice on the Tv operation.
● Advice and training about the Tv operation at household.
● Tv installation and configuration, operating systems and programs.
● Product return policy up to seven days after delivery.

111
● One-year warranty in the event of a product failure.
3.6.3 Additional Products
Currently, MP3 Company does not have the following Blaupunkt products, but it seeks to
import them to internalize in the Peruvian market:
● Antennas;
● Monitoring Systems;
● Remote control;
3.7 Price
To define the price, we use an estimated range in the prices of our potential competitors in
the Peruvian market. Since the Blaupunkt televisions to be internalized correspond to the
three most representative sizes in sales (32, 43 and 50 inches), we choose analogue products
from other brands.
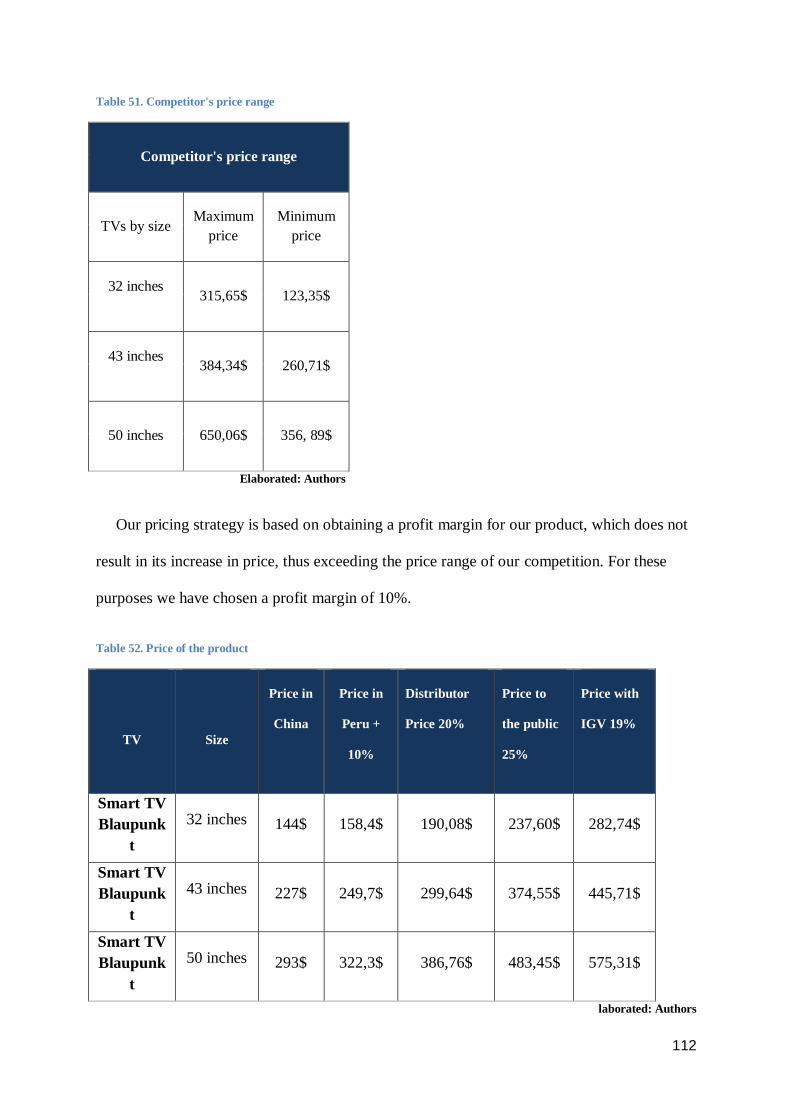
112
Table 51. Competitor's price range
Competitor's price range
TVs by size Maximum
price
Minimum
price
32 inches
315,65$ 123,35$
43 inches
384,34$ 260,71$
50 inches 650,06$ 356, 89$
Elaborated: Authors
Our pricing strategy is based on obtaining a profit margin for our product, which does not
result in its increase in price, thus exceeding the price range of our competition. For these
purposes we have chosen a profit margin of 10%.
Table 52. Price of the product
TV
Size
Price in
China
Price in
Peru +
10%
Distributor
Price 20%
Price to
the public
25%
Price with
IGV 19%
Smart TV
Blaupunk
t
32 inches
144$
158,4$
190,08$
237,60$
282,74$
Smart TV
Blaupunk
t
43 inches
227$
249,7$
299,64$
374,55$
445,71$
Smart TV
Blaupunk
t
50 inches
293$
322,3$
386,76$
483,45$
575,31$
laborated: Authors

113
3.8 Place: La Curacao
It is relevant to consider what store to commercialize the Blaupunkt Televisions. For this
reason, we consider the leading appliance store, La Curacao of Peru, this store
commercializes household appliances and household items. Currently, La Curacao is located
in several countries of the region such as: El Salvador, Guatemala, Nicaragua, Honduras,
Costa Rica, República Dominicana, Colombia and Perú. Thus, is the first retail chain
specialized in household appliances which is part of the Conecta Retail Group. It has more
than 30 years of experience in the Peruvian market, with more of 80 stores with a presence
throughout the country and the best human team of technological advisers. Their vision is
based on modeling the market to improve the lives of the clients by facilitating accessibility
and promoting the common welfare and also offering several Tv brands such as LG,
Samsung, Hyundai, Panasonic, Hisense, Haier, Polarid, AOC, Philips,Sony and Orizon.
Concerning the benefits, La Curacao has brands products offering the best prices and
online promotions, there is a return policy until the seven days after the delivery of the
product, and the online purchase is quickly and safely (La Curacao).
3.9 Promotion
In order to reach our potential customers, which are large retail stores in Peru, it is
believed appropriate to use three strategies for the promotion for Blaupunkt televisions:
● Apply a discounts on the product after the purchase of a accorded number of units. With
this, it seeks to encourage the client to make an investment in large quantities of the product,
to obtain the economic benefit that it entails.
● Use the prestige of the Blaupunkt brand by offering high-tech products and at the forefront
of all the advances in its area, all of which have passed through strict quality control.

114
● Offer exclusivity agreements for the distribution of the Blaupunkt brand in Peru,
constituting for our client as a differentiating factor with respect to other retail chains.
3.10 Financial Analysis
In order to know the probability of success of an internationalization of the Blaupunkt
television brand in Peru, a financial analysis was carried out, projected for a period of five
years. This tool allows us to create awareness about business risks, as it projects their
possible evolution to us, thus facilitating decision-making. As the table indicates, the project
is attractive, since it has an IRR (Internal Rate of Return) of 15% over a period of five years.
Table 53. Financial Analysis
YEAR1 YEAR2 YEAR3 YEAR4 YEAR5
Initial Investment 1660000$
Sold units
7500 7500 9000 9000 10500
Projected Income
2191200$ 2191200$ 2629440$ 2629440$ 3067680$
Projected Selling Costs
1660000$ 1660000$ 1992000$ 1992000$ 2324000$
GROSS PROJECTED
PROFIT 531200$ 531200$ 637440$ 637440$ 743680$
SALES EXPENSE
Marketing Expenses
21912$ 21912$ 26294,4$ 26294,4$ 30676,8$
Distribution Expenses
2000$ 2000$ 2000$ 2000$ 2000$
Transportation
expenses 75000$ 75000$ 90000$ 90000$ 105000$
TOTAL EXPENSES
98912$ 98912$ 118294,4$ 118294,4$ 137676,8$
TOTAL PROFIT -1660000$ 432288$ 432288$ 519145,6$ 519145,6$ 606003,2$
IRR 15%
Elaborated Authors
115
3.11 Conclusions of the chapter
Based on the previous analysis, despite the political crisis, the Peruvian economy grew
during the previous years, mainly driven by the production and export of commodities. This
stability is possible due to several reforms carried out by the government, in order to improve
the business environment, promote foreign investment and boost the competitiveness of the
country. Nevertheless, it remains vulnerable to external shocks, such as changes in
international financial conditions or the pandemic. Despite this, Peru is one of the most stable
and encouraging economies in the region.
Regarding the assembly industry, Peruvian governments did not implement any project for
its development since the late 1960s, when the household appliances needed to have a
percentage of up to 40% of domestic production, to access tariff benefits. However, this
industry was overtaken by the international competence.
Concerning the characteristics of the consumers of the market, at the moment of making
purchasing decisions the Peruvian consumer is strict and rational. In this sense, quality is the
main concern at the moment of purchasing a product. Moreover, only a minority group
affirmed they prefer new products and less than half of the interviewees preferred to purchase
products of famous brands. Despite this, when it comes to the purchase of durable goods such
as appliances and automobiles, the brand is presented as one of the most important
purchasing factors in contrast with what happens with massive categories such as food and
beverages, where the functionality and quality of the product prevails.
Based on the previous economic analysis, between 2002 to 2013 Peru was one of the
countries of the region of highest growth, with low inflation levels and unemployment.
Conversely, between 2014 to 2019 there was a GDP contraction due the fall of the price of
raw materials that caused a reduction in the private inversion, in the consumption and a

116
reduction in the tax revenues. Despite this, the government realized a good fiscal, monetary
management and foreign exchange policy which allowed to offset the tax reduction, there
were international reserves to set the exchange rate. Even, the mining production increased
which led to higher economic growth in the country.
Currently due to the health emergency, in the first and second quarter of 2020 there was a
GDP contraction of 3.4% and 30.2%. The Peruvian households were one of the most affected
in the region in terms of income and employment; so, it generated a negative effect on
consumption. For that reason, “Plan Reactiva Peru " was implemented to grant credits with
low interest rates to the productive sector, another measure carried out was tax relief to all
economic agents, and also was granted a bonus to the most vulnerable families. Even though
Peru faces a difficult economic situation, for 2021 it is projected that there will be a growth of
7.6% and by 2022 a growth of 4.5%.
Regarding the technological field, countries such as Switzerland, Sweden, United States,
United Kingdom and Netherlands lead the Global Innovation Index while in the Latin
American region countries such as Chile ranked 54 followed by México, Costa Rica, Brazil,
Colombia, among others. Likewise, Peru ranked 76 out of 131 economies; which means that
the region needs to improve on innovation issues and in Intellectual Property to achieve
greater competitiveness against other countries.
Based on the ecological field, The Register of Good Environmental Practices in Peru,
refers to environmental obligations that must be fulfilled by natural or legal persons, public or
private. It is essential to consider these ecological standards when internalizing a brand in this
market.
Finally, the Peruvian legal framework opens the economy to private investment, which is
implemented in a market social economy Furthermore, promotes competence, and guarantees

117
foreign investment in any type of firm. Thus, the prices are regulated by the law of supply
and demand, it demonstrates that the only prices regulated are the tariffs for public services
established by Law of the Congress of the Republic. Likewise, it recognized the freedom of
trade and industry and of exports and imports. Since the early 1990s investment guarantees
were introduced such as the right to free possession and disposition of foreign currency, and
the capital and dividend repatriation to all persons natural and legal, national and foreign. In
addition, it is guaranteed not to establish discriminatory or differentiated treatments in
exchange matters, prices, tariffs among investors based on sectors or types of activity or
geographical location, nor between natural or legal persons, national or foreign. There is a
regime to obtain legal stability of the rights as an investor and in tax and labor matters.
On the other hand, to obtain information about the Peruvian market two interviews were
conducted. Dr. Luis Crespo, Tv Line Manager of MP, affirmed that for a possible
internalization it is necessary to analyze the different competitive advantages of each market.
In the case of Peru, the assembly industry is almost null. It is pertinent to take into account
the differences between the Ecuadorian and the Peruvian markets, like the underdevelopment
Peruvian market of technology of Smart Tv, or issues of differences regarding the currency
exchange. In Peru there are no national brands, all televisions for sale are imported, while in
Ecuador are assembly Ecuadorian brands in the market of white marks, representing 60% of
the sales. The Peruvian market offers several benefits to internalization such as the
opportunity to replicate the business model of Ecuador through indirect export with an
external agent. In the current context of the pandemic, the Tv market has increased in its
sales. Since the population was forced to avoid social activities, there was also a boom in
Stream services.

118
In addition, Ing. Pedro Espinoza of Indurama, affirmed that this is a competitive market
given that Peru has a free market economy with tariff-free due its free trade agreements with
China and other exporting countries. Even though, of the benefits of this market, it has certain
challenges because of the strong competence and many of them have certain exclusivity in
chains and retail stores which are demanding for their inclusion. It is relevant to consider
what chain or retail store is more convenient to sell the product.
Concerning the Competitive Diamond, was analyzed the demand, competence, factors and
support networks. Due to the confinement measures caused by the pandemic, the Tv imports
were affected in March; however, in July there was an increase in imports due to the
reduction of mobility restrictions, and it led to the economic reactivation. In spite, the fact
that the imports were affected in March, due to the confinement, the Peruvian Tv audience
increased by 42% compared to other countries such as Colombia with 36%, Guatemala with
32% and Ecuador with 29%. So, the segment with the highest consumption was people
between 38 and 49 years.
Based on the competence, several brands of the Peruvian market were analyzed; thus, to
classify the brands were established price ranges. Among the expensive brands are Sony,
Samsung, Philip and LG, the brands with intermediate price ranges are AOC, Hisense,
Hyundai, Panasonic and in the inexpensive range is the Haier brand. It is necessary to
consider the price range when internalizing the Blaupunkt brand to this market. It's important
to keep in mind that the Blaupunkt brand stands out for its quality and price. For this reason,
it must be established at an adequate price in the market considering the competence.
The factor analysis determined in terms of labor, that there is a low level of open
unemployment in Peru, but also, there is a low level of wage earners (around 50% of the
employed EAP, higher in urban areas and among men). By contrast, there is a persistent high

119
labor informality and is located in rural areas. Another characteristic of the Peruvian labor
market is that most of the PEA is busy and works in micro and small firms, as salespeople,
service workers and even professionals and technicians. In the case of inputs and
infrastructure, when there is no assembler industry it would force import the products into the
country, directly by MP3 firm. Therefore, the infrastructure which is the intermediary
between MP3 and the Peruvian consumer, would be the major retail chains that operate in the
country such as Saga Falabella, Ripley, Paris Stores, Sodimac, La Polar, etc.
Based on the supporting sectors, in 1990 Peru changed towards a more competitive
environment, with the opening and liberalization of markets, the elimination of inputs and
outputs barriers to products, and also less intervention of the State. These were the conditions
to create a competitive market, besides a complementary job will prevent anti-competitive
practices and abuses against consumers. Naturally, this drives a lack of state aid to industries.

120
3.12 Summary Tables
3.12.1 PESTEL Analysis
Table 54. Political, social and legal analysis
Political
● Lack of policies to develop the assembly industry.
● Peru is ranked 76 out of 190 in the Doing Business
ranking.
● Despite the political crisis, there has been steady
economic growth in recent years.
● The government of Peru has been one of the most
criticized for poor handling of the pandemic.
Social
● The average monthly expenditure per household in Peru
is 2,797.90 soles.
● Spending has decreased as a result of the health crisis
● An informed, demanding, thoughtful consumer, endowed
with technological skills and tools.
● Consumers who demand quality and tend to adopt new
products.
Legal
● The companies are regulated by INDECOPI.
● It is one of the countries that offers the easiest way to
create businesses in Latin America and the Caribbean.
● All forms of reservation of economic activities in favor
of the State were eliminated.
● Legal framework in favor of foreign investment.
Elaborated: Authors

121
Table 55. Economic Analysis of Peru
Event Economic Analysis
2002-2013 ● A period of economic Boom, with low inflation levels where
there were reduced poverty rates in the country.
2014-2019 ● GDP decreases due to the fall in the international price of raw
materials. However, there was an economic recovery though a
proper fiscal monetary exchange rate management and the
international reserves. Also, the mining production was
increased.
Covid-19
Influence
● In the first and second quarter of 2020, there was a GDP
contraction of 3.4% and 30.2% due to the health emergency.
● Peruvian households were one of the most affected of the
region in terms of employment and income; so, it generated a
negative impact on consumption.
● The Central Bank alongside the Ministry of Economy
implemented the Reactiva Peru plan in which it injected
liquidity to commercial banks to grant credits with low interest
rates for micro and small businesses.
● Tax relief measures were implemented for all economics
agents.
● The government offered a monetary bonus to the most
vulnerable.
Injured
Economic
Sectors
The following sectors were contracted
● Accommodation Sector and restaurants - 51.7%.
● Construction Sector with - 42.1%.

122
● Transportation Sector with - 29.7%.
Advantaged
Economic
Sectors
The following sectors were advantaged
● Agricultural Sector with 2.1%.
● Telecommunications Sector with 2.6%.
● Financial Services with 6.7%.
Inflation and
exchange rate
● In the months of July, August and September 2020, the
inflation rate was 0.46%, -0.11% and 0.14%.
● In any month of 2020, Year-on-year inflation does not exceed
1.90%.
● Between 2018 to 2019, the exchange rate was in a band
between 3.30 to 3.40 soles per dollar, while in the first months
of 2020 had a jump to 3.57 soles per dollar, due to uncertainty
for the Covid-19, which was offset by the Central Bank.
● In 2020 the exchange rate would be between 3.55 to 3.60 soles
per dollar.
Projections
2021-2022
● By 2021, is expected a GDP growth of 4% in Latin America
and the Caribbean region.
● By 20201, is expected a GDP growth of 7.6% in Peru.
● By 2022 is expected a GDP growth of 4.5% in Peru.
● It is predicted that Peru will be the country of the region with
the best economic recovery.
Elaborated: Authors

123
Table 56. Technological analysis
Peru Ranking of the Global Innovation Index
2018 Position 64 of 131 economies
2019 Position 69 of 131 economies
2020 Position 76 of 131 economies
● The Ranking concerning innovation is led by Switzerland, Sweden, Kingdom
United, Netherlands and the United States.
● Latin America has low investments in research, development and innovation,
also in intellectual property systems. It is clear the disconnection between the
public and private sector with respect to the prioritization of foreign investment.
Elaborated: Authors
Table 57. . Ecological Analysis
Ecological Analysis
● The Good Environmental Practices Record of the Evaluation and Environmental
Inspection promotes good environmental practices carried out by natural or legal
persons, public or private.
● Nevertheless, MP3 does not need to comply with these ecological standards to
internalize in the Peruvian market due only seek to export.
Elaborated: Authors

124
3.12.2 Competitive Diamond
Table 58. Competence of prices
TV BRANDS High range of
prices
(> $ 1000)
Intermediate
range or prices
(< 700)
Inexpensive
range of prices
(< 400)
AOC X
Haier X
Hisense X
Hyundai X
LG X
Panasonic X
Philip X
Samsung X
Sony X
Elaborated: Authors

125
Table 59. Demand
● Due to the containment measures as of March 2020, the imports were
contracted.
● As of July, there was an increase in Tv imports.
● In comparison to other countries in the region, Peru has a major Tv
consumption.
● During April the television consumption was increased (6.41 hours).
● The population with the major consumption is between 38 and 49 years old
(PEA = Purchase Power).
Elaborated: Authors

126
Table 60. Factors: Infrastructure, inputs, labor and Cooperation
Factors
Labor
● High rate of informal labor, mainly concentrated in rural areas.
● Shortage of skilled labor in new technologies and modern
manufacturing processes.
● Overexploitation of some university careers.
Infrastructure and inputs
● Industries appear as isolated sectors forcing most inputs to be imported.
● The infrastructure destined to be the intermediary between MP3 and the
Peruvian consumer, would be one of the large retail chains.
Cooperation
● Liberalization of markets, eliminating barriers to the entry and exit of
capital, reduces the participation of the State in economic affairs.
● High competition between companies.
Elaborated: Authors

127
4 GENERAL CONCLUSIONS
In order to seek new foreign markets for its expansion, thus increasing its business volume,
the MP3 Company began a process of internalizing the Blaupunkt brand televisions,
manufactured in Ecuador, to the Peruvian market. This work analyzes some of the different
variables that could pose both a threat to the success of internalization, and an advantage that
facilitates achieving the company's objectives. It began with the study of the Peruvian and
Ecuadorian business environment through a PESTEL analysis; then the competitiveness of
each market with the Porter Diamond was analyzed; In addition, professionals with
experience in Foreign Trade in both markets were consulted; to end with a Marketing Plan
and Financial Analysis. All this information, once verified, will facilitate decision-making
regarding the course of internalization.
Based on the PESTEL analysis, Peru was one of the countries of the region with the
highest affection by the health emergency and that caused an increase of the unemployment
and the reduction of the household income, it caused a negative effect on the consumption.
Thus, in the second quarter of 2020 there was a GDP contraction of 3,4% y 30, 2%. In
response, the Central Bank and the Ministry of Economy implemented a plan for economic
reactivation in which it injected liquidity to the banks in order to grant credits with low
interest rates to micro and small firms. Moreover, tax relief measures were carried out for all
economic agents and also the government offered a monetary bonus to the most vulnerable.
Among the sectors most hit were the restaurants, accommodation, construction and
transportation sectors.
Even though the Ecuadorian economy was seriously affected by the pandemic, the
decrease was less compared to Peru, whose contraction was of -30,2%. In Ecuador the GDP
contraction was due to the decrease in investment, exports of goods and services, the
128
reduction of household final consumption expenditure and the contraction of government
final consumption expenditure. Among the most disadvantaged sectors in Ecuador were the
oil sector, non-oil GVA, construction, transportation, financial services, accommodation and
restaurants, among others. It is important to mention that both countries were affected
regarding employment; conversely, the economic situation will improve when the restrictions
lead to an economic recovery.
The World Bank anticipated that in 2021 Ecuador will have a GDP growth of 4.8%;
likewise, Peru will have a GDP growth of 7.6%. Also, by 2022, Ecuador will have a GDP
growth of 1.3% while Peru will have GDP growth of 4.5%. So, it is important to keep in
mind that in this aspect Ecuador is at a disadvantage compared to Peru, when internalizing
this market.
In the technological field, was analyzed the Global Innovation Index, an annual
publication created by the INSEA Business School, which classified the countries based on
innovation to analyze development in terms of technology in each country. Currently,
Ecuador is positioned at 90 out of 133 countries, having 24.11 points in the ranking; likewise,
Peru has 28.79 points. So, in this field, Peru has an innovation advantage in comparison with
Ecuador. On this wise, it is necessary that Ecuador emphasizes creativity, in doing things in a
different way to achieve greater competitiveness in relation to other countries in the region.
In the ecological analysis, in both countries companies must comply with certain non-
contamination standards. Despite this, MP3 is not considered a polluting firm; so, would not
have this inconvenience in the Peruvian market.
The political analysis revealed important differences between the markets. In Ecuador, the
government's support for the assembly industry was evident, achieving through tax incentives
that 70% of the televisions in the market are assembled locally. For its part, Peru is

129
committed to a free market, relegating the participation of the State in economic affairs to the
background; which explains the absence of policies for the development of an assembly
industry. Regarding the general perception about the governments of each country; low
credibility, corruption cases, and especially criticism for the handling of the health crisis
during the pandemic, have reduced the popularity of each regime. However, due to the nature
of its economic policy, the different political crises have not affected the constant growth of
the Peruvian economy in recent years. Consequently with this fact, the international
perception leans favorably towards the Peruvian market, which is located at 53 positions over
the Ecuadorian market in the Doing Business Ranking.
In order to know the consumers in both markets, a social analysis was carried out. In
general terms, both populations show similarities, starting with the monthly expenditure of
each household, which in Ecuador is USD 809, while in Peru it is 2,797.90 Soles (USD
748.45). Regarding consumption habits, the populations of both countries are thoughtful and
have enough information, provided by modern technological tools. It is possible that the only
difference is that the Ecuadorian consumer is influenced by a sense of national identity,
which motivates them to seek local brands, creating great loyalty for certain brands; while the
Peruvian consumer prioritizes quality, adopting new products quickly.
Finally, with the legal analysis, it is clear that both markets differ diametrically. Peru
being one of the countries that offer the greatest facility to create businesses in Latin America
and the Caribbean, given that the State eliminated all forms of economic activity in its favor,
acting as an arbitrator for the private sector. On the other hand, the Ecuadorian legal
framework gives the State a leading role with regard to the production of wealth and its
distribution. Therefore, Peru ends up becoming a more attractive country due to its legal
framework in favor of foreign investment.

130
According to Porter's Competitive Diamond analysis, compared to other countries of the
region Peru had the highest Tv consumption during the confinement. The population of major
Tv consumption is the Economically Active Population, which means that they are people
between 38 and 49 years old, with strong purchasing power it also means, they can pay for an
intermediate range and a product of quality. It is pertinent to highlight that the Peruvian
market is highly competitive due to expensive brands such as Samsung, Sony, Philip, LG, but
also the intermediate price brands such as AOC, Hisense, Hyundai and Panasonic and finally
the inexpensive brands like Haier. In fact, the Blaupunkt brand is ranked within the
intermediate range but differs from the other brands because it not only offers price or
quality, but also offers both in a single product.
After studying the production factors in each of the countries, we can conclude that the
labor force, both Ecuador and Peru have a high rate of labor informality, mainly concentrated
in rural areas. In addition, the overexploitation of certain university courses makes it difficult
to find qualified labor in new technologies and modern manufacturing processes.
Infrastructure and inputs are easily distinguishable factors, the Ecuadorian assembly industry
is ahead, since it has an adequate plant for the production of televisions and part of the inputs
are manufactured in the same country. Peru, although it lacks an assembly industry, makes up
for it with a market open to trade, where the distribution of the product could be carried out
by one of the large retail chains. Naturally, in terms of cooperation, the Ecuadorian State is
more oriented to encourage local production. In the case of MP3, during its first five years it
received tax benefits from the government. In Peru this would be unthinkable, given the
reduced state participation in economic affairs, creating a fairly competitive market.
Based on the data of the market, the Marketing Plan was carried out, beginning with the
mission, vision and the aims of the firm. To proceed to the internalization were selected 3 tv

131
models which represent the 90% of the company's sales: 32 inches, 43 inches and 50 inches
to which we applied our pricing policy, resulting in a cost of $ 190.08, $ 299.64 and $ 386.76
respectively. Concerning the place, it is proposed a distribution to the stores of La Curacao
which has recognized brands, offering the best prices and online promotions, besides there is
a return policy up to the first 7 days after the delivery of the product and online purchase. As
strategy of promotion, it seeks to offer discounts and enact into exclusive agreements for the
product distribution. Finally, a financial analysis was carried out which led to an Internal Rate
of Return of 15%, it is an attractive value to carry out a long-term project.

132
5 RECOMMENDATIONS
When internalizing, discretion is suggested regarding the number of units destined to be
exported. The health crisis caused by Covid-19 had serious repercussions on the economy of
each country, reducing the income of each household by increasing unemployment. This led
to a reduction in consumption, which will gradually recover as the immunization process
advances. Therefore, sales must go hand in hand with this economic recovery.
The MP3 Company is recommended to carefully analyze the different economic policies
applied in the country. Unlike the target market, the Ecuadorian State has great decision-
making capacity regarding the country's economic growth, making decisions that could both
affect and favor trade between both markets.
Given the Ecuadorian and Peruvian consumer appreciates immediacy, security and
fluency at the moment of making your purchases. It is crucial to have a retail chain that
manages online stores. Thus, clients have the chance to easily access to information about the
product. Thus, the most accurate store to internalize the brand is La Curacao which stands out
for its leadership in the commercialization of household appliances. In addition, it has 30
years of experience in the Peruvian market, offering the best prices and online promotions to
their clients.
Likewise, it is recommended to the firm MP3 that the target be directed towards the
Peruvian Economically Active Population because according to some studies this range is the
major Tv consumption during the health emergency, and also has a high purchasing power
which will lead to access to the product.
Finally, the Peruvian market provides enough guarantees to the foreign investor, thus
facilitating trade. It constitutes a highly competitive market, varied in brands of all quality.

133
For this reason, it is recommended to insert Blaupunkt televisions as products with an
intermediate price range, with high-quality technology and innovation.

134
6 BIBLIOGRAPHY
Acosta, Alberto, Susana López, and David Villamar. "ECUADOR: OPORTUNIDADES Y
AMENAZAS." Migraciones: un juego con cartas BRANDdas (2004): 259
Andina. «CCL: importaciones de televisores crecieron 26.9% en octubre de este año.»
Andina 19 de noviembre de 2020.Angulo, Sebastián. «Ecuador se estanca en el ranking
global de innovación y se mantiene en el puesto 99 entre 131 países.» 5 de septiembre de
2020.
Bajo, Oscar. Teorías del comercio internacional. Antoni Bosch editor, 1991.
Banco Central del Ecuador. BCE. 2020. 5 de diciembre de 2020.
—. BOLETÍN 31.- ECUADOR Y LOS ACUERDOS COMERCIALES. junio de 2019. 5 de
diciembre de 2020.
Banco Mundial. Banco Mundial. 2018. 5 de diciembre de 2020.
Banco Mundial. 13 de octubre de 2020. 4 de enero de 2021.
—. 2020. 4 de enero de 2021.
—. Banco Mundial. 2020. 11 de enero de 2021.
Banco Mundial. Datos.Bancomundial.Org, 2020,
https://datos.bancomundial.org/indicador/IC.BUS.EASE.XQ?end=2019&start=2019&type=s
haded&view=map. Accessed 10 Dec 2020.

135
Banco Mundial. Doingbusiness.Org, 2020,
https://www.doingbusiness.org/content/dam/doingBusiness/country/e/ecuador/ECU.pdf.
Accessed 10 Dec 2020.
Blaupunkt . Blaupunkt. s.f. 16 de diciembre de 2020.
Betancourt, Diego Fernando. Cómo hacer un Análisis PESTEL. 01 de septiembre de 2018. 03
de diciembre de 2020. <www.ingenioempresa.com/analisis-pestel>.
Bloch, Harry, and David Sapsford. "Some estimates of Prebisch and Singer effects on the
terms of trade between primary producers and manufacturers." World Development 25.11
(1997): 1873-1884.
Cardoso, Pedro, Andrés Chavarro y Carlos Ramírez. «Teorías de
internacionalización.» Leeds Beckett University (2007): 4-23
Casanova, Alfonso y Ismael Zuaznábar. El Comercio Internacional: teorías y políticas.
Universo Sur, 2018.
Chacholiades, Miltiades, et al. Economía internacional. No. 04; HF1411, C4.. McGraw-Hill,
1982.
Cuevas, Homero. "Una explicación alternativa de la paradoja de Leontief." Cuadernos de
economía (Santafé de Bogotá) 14.21 (1994): 157-163.
De Compañias, Superintendencia. "Superintendencia de compañías." Recuperado el 10
(2014).
De Rentas Internas, Servicio. "SRI." Recuperado el (2016).

136
Díaz, Javier, María Deza y Kenji Moreno. Banco Interamericano de Desarrollo . septiembre
de 2020. 15 de marzo de 2021.
Echecopar. «Guia de negocios en el Perú.» Lima, 2017.
El Comercio. Ecuador avanza en su ingreso a la Alianza del Pacífico 6 de julio de 2019.
—. El Gobierno anuncia que Ecuador y Estados Unidos acordaron negociar un Acuerdo
Comercial de Primera Fase 16 de noviembre de 2020.
—. «La TV ensamblada en el país es más competitiva.» 2 de diciembre de 2015.
El Peruano. «TV RESOLUTION de Consejo Directivo N.034-2014-OEFA/CD.» 25 de
octubre de 2014: 3. 1 de enero de 2021.
El Telégrafo. 2020. Ensamblaje, "Made In Ecuador". [online] Available at:
<https://www.eltelegrafo.com.ec/noticias/economia/4/el-70-de-televisores-ya-se-ensambla-
en-ecuador> [Accessed 9 December 2020].
El Telégrafo. El índice de desempleo disminuyó de 13,3% a un 6,6%, según el INEC 7 de
diciembre de 2020.
—. «Ecuatorianos aumentan el consumo de televisión en los días de cuarentena.» 28 de
marzo de 2020.
El Universo. Salario Básico de Ecuador se mantiene en $400 para 2021; Gobierno anuncia
compensaciones de $60 y $100 30 de noviembre de 2020.
"Fedexpor". Fedexpor.Com, 2020, https://www.fedexpor.com/tendencias-de-consumo-2020/.
Accessed 16 July 2020.

137
Frenk, André. Nielsen.com. 28 de Julio de 2018. 22 de Enero de 2021
<https://www.nielsen.com/pe/es/insights/article/2014/como-es-el-consumidor-peruano/>.
Garcia Escajadillo, Maria Kattia. "La excepción a la prestación personal en el contrato de
trabajo en el Perú a la luz de la Ley de Productividad y Competitividad Laboral." (2020).
Guarín Grisales, Álvaro, and Daniel Franco López. "La sustitución de importaciones como
medio para un desarrollo sostenible." Revista Universidad EAFIT 44.151 (2011): 56-67.
Guevara, Anahí Durand. Celag.org. 15 de 09 de 2020. 26 de 01 de 2021
<https://www.celag.org/crisis-politica-en-peru-nueva-temporada/>.
Heckscher-Ohlin-Samuelson." Revista de economía política 83 (1979).
Hill, Charles. Negocios Internacionales. México D.F: INTERAMERICANA EDITORES,
S.A. DE C.V., 2011.
Huamaní, Charles, et al. "Condiciones estimadas para controlar la pandemia de COVID-19 en
escenarios de pre y postcuarentena en el Perú." Revista Peruana de Medicina Experimental y
Salud Pública 37 (2020): 195-202.
Huayamave, Germán. "La Sustitución de importaciones como política para alcanzar el
desarrollo económico del Ecuador. Caso de estudio: Ecuador–Corea del Sur (1950–2013)
Análisis comparativo de su Comercio Exterior." Gaceta Sansana 1.4 (2014).
INEC. Noviembre de 2020. 5 de diciembre de 2020.
Krugman, Paúl y Maurice Obstfeld. Economía Internacional: teoría y política. Madrid:
PEARSON EDUCACIÓN, S.A, 2006.
La Curacao . 2021. 15 de marzo de 2021.

138
Lombana, Jahir, y otros. Negocios Internacionales. Barranquilla: Universidad del Norte,
2011.
López–Altamirano, Diego Alberto, et al. "La economía de las empresas del Ecuador en el
contexto de la pandemia." Polo del Conocimiento 5.1 (2020): 285-304.
Lovón Cueva, Marco Antonio, Hendrik Anderson Camarena Champi, and María Mercedes
Mendoza, Tereza Marleny. «El panorama mundial de la innovación y la situación peruana.
Mercado Negro. «Perú es el país que más TV consume en Latinoamérica durante
cuarentena.» Mercado Negro abril de abril.
Ministerio del Ambiente. 10 de septiembre de 2004. 9 de diciembre de 2020.
Molina, Dayni L. Palacios, and Pedro E. Reyes Vélez. "Cambio de la matriz productiva del
Ecuador y su efecto en el comercio exterior." Dominio de las Ciencias 2.2 (2016): 418-431.
Molina Freire, Denise Andrea. "Migración calificada de españoles al Ecuador." (2014).
Morrison, Andrew R. "Incentivos tributarios y política de descentralización productiva: Perú,
1968-1986." (1988).
Mukherjee, Sovik, and Praveen Kaur. "SYNOPTICALLY DECODING
NEUROMARKETING: ENTERING INTO THE BRAIN OF THE CONSUMER."
Organización Mundial de Propiedad Intelectual. Global innovation index, 2019:
Organización Mundial de Propiedad Intelectual. julio de 2019. 5 de diciembre de 2020.

139
Osorio Malqui, Kelly Belen, and Gwendoline Margot Percca Linares. "Revisión sistemática
de la literatura sobre los principales factores que influyen en el comportamiento del
consumidor en los últimos diez años en Perú y América Latina." (2020).
Palomino Gonzales. "Martín Vizcarra Cornejo en el poder: los presuntos actos de corrupción
en su contra y su lucha contra la corrupción."
París, Jose Antonio. Marketing Internacional desde la óptica latinoamericana. Buenos Aires:
ERREPAR S.A, 2008.
Parodi-Revoredo, Daniel. "¿ Por qué apoyar a Martín Vizcarra?." (2019)
Parodi, Carlos. Cesla. noviembre de 2020. 10 de enero de 2021.
Pérez, Carlota. "La modernización industrial en América Latina y la herencia de la
sustitución de importaciones." Comercio exterior 46.5 (1996): 347-363.
Prado, Jorge Nicanor Arroyo. "El desarrollo de las ventajas competitivas de Porter y los IPAS
verdes en el comercio exterior del Perú." Paideia XXI 4.5 (2014): 13-27.
Primicias. Ecuador logra un nuevo acuerdo con el FMI por USD 6.500 millones 2020.
Rees, Gareth H., Felipe Peralta Quispe, and Cris Scotter. "The implications of COVID‐19 for
health workforce planning and policy: the case of Peru." The International Journal of Health
Planning and Management (2021).
Renau, Juan. «El Por qué, el cómo y el dónde de la internacionalización de la
empresa.» Revista Austuriana de Economía (1996): 7-8.
Retos para el Perú.» Científicos.PE (2020).

140
Revelo Ron, Oswaldo. "El comportamiento del consumidor ecuatoriano desde la perspectiva
psicológica." (2017).
Revista Facetas. «La ventaja competitiva de las naciones.» Revista Facetas (2008): 1.
—. «La ventaja competitiva de las naciones.» Revista Facetas (2008): 1-2.
—. «La ventaja competitiva de las naciones.» Revista Facetas (2008): 3.
Requeijo, Jaime. "Ideas y creencias en la teoría del intercambio internacional: el teorema de
Rohm, Andrew J., and Vanitha Swaminathan. "A typology of online shoppers based on
shopping motivations." Journal of business research 57.7 (2004): 748-757
Rojas, Jorge. "El Mercantilismo. Teoría, política e historia." Economía 30.59-60 (2007): 76-
96.
Román, Alfonso J. Ballesteros. Comercio exterior (2a edicion): TEORIA Y PRACTICA.
EDITUM, 2001.
Sánchez, José Zacarías Mayorga, and Clemencia Martínez Aldana. "Paul Krugman y el
nuevo comercio internacional." Criterio libre 8 (2008): 73-86..
SICE. Sistema de Información sobre Comercio Exterior. s.f. 10 de enero de 2021.
Sistema Único de Información Ambiental- SUIA. 2015. 5 de diciembre de 2020.
The Global Economy . Índice de innovación. 2020. 5 de diciembre de 2020.
Toye, John FJ, and Richard Toye. "The origins and interpretation of the Prebisch-Singer
thesis." History of political Economy 35.3 (2003): 437-467.

141