university of birmingham high-resolution mass spectrometry
TRANSCRIPT
University of Birmingham
High-resolution mass spectrometry provides novelinsights into products of human metabolism oforganophosphate and brominated flame retardantsAbdallah, Mohamed Abou Elwafa; Zhang, Jinkang; Pawar, Gopal; Viant, Mark R.; Chipman,J. Kevin; D'Silva, Kyle; Bromirski, Maciej; Harrad, StuartDOI:10.1007/s00216-015-8466-z
License:None: All rights reserved
Document VersionPeer reviewed version
Citation for published version (Harvard):Abdallah, MAE, Zhang, J, Pawar, G, Viant, MR, Chipman, JK, D'Silva, K, Bromirski, M & Harrad, S 2015, 'High-resolution mass spectrometry provides novel insights into products of human metabolism of organophosphateand brominated flame retardants', Analytical and Bioanalytical Chemistry, vol. 407, no. 7, pp. 1871-1883.https://doi.org/10.1007/s00216-015-8466-z
Link to publication on Research at Birmingham portal
Publisher Rights Statement:Eligibility for repository: Checked on 23/09/2015
General rightsUnless a licence is specified above, all rights (including copyright and moral rights) in this document are retained by the authors and/or thecopyright holders. The express permission of the copyright holder must be obtained for any use of this material other than for purposespermitted by law.
•Users may freely distribute the URL that is used to identify this publication.•Users may download and/or print one copy of the publication from the University of Birmingham research portal for the purpose of privatestudy or non-commercial research.•User may use extracts from the document in line with the concept of ‘fair dealing’ under the Copyright, Designs and Patents Act 1988 (?)•Users may not further distribute the material nor use it for the purposes of commercial gain.
Where a licence is displayed above, please note the terms and conditions of the licence govern your use of this document.
When citing, please reference the published version.
Take down policyWhile the University of Birmingham exercises care and attention in making items available there are rare occasions when an item has beenuploaded in error or has been deemed to be commercially or otherwise sensitive.
If you believe that this is the case for this document, please contact [email protected] providing details and we will remove access tothe work immediately and investigate.
Download date: 17. Mar. 2022
This document is confidential and is proprietary to the American Chemical Society and its authors. Do not copy or disclose without written permission. If you have received this item in error, notify the sender and delete all copies.
HIGH RESOLUTION MASS SPECTROMETRY PROVIDES NOVEL
INSIGHTS INTO PRODUCTS OF HUMAN METABOLISM OF
ORGANOPHOSPHATE AND BROMINATED FLAME
RETARDANTS
Journal: Analytical Chemistry
Manuscript ID: ac-2014-041132
Manuscript Type: Article
Date Submitted by the Author: 04-Nov-2014
Complete List of Authors: Abdallah, Mohamed; University of Birmingham, Division of Environmental Health & Risk Management Zhang, Jinkang; University of Birmingham, School of Biosciences Pawar, Gopal; University of Birmingham, Division of Environmental Health & Risk Management
Viant, Mark; University of Birmingham, School of Biosciences Chipman, James; University of Birmingham, School of Biosciences D'Silva, Kyle; ThermoFisher Scientific, Bromirski, Maciej; ThermoFisher Scientific, Harrad, Stuart; University of Birmingham, Division of Environmental Health & Risk Management
ACS Paragon Plus Environment
Analytical Chemistry
HIGH RESOLUTION MASS SPECTROMETRY PROVIDES NOVEL INSIGHTS
INTO PRODUCTS OF HUMAN METABOLISM OF ORGANOPHOSPHATE AND
BROMINATED FLAME RETARDANTS
Mohamed Abou-Elwafa Abdallah1,2*
, Jinkang Zhang3, Gopal Pawar
1, Mark Viant
3, J. Kevin
Chipman3, Kyle D'Silva
4, Maciej Bromirski
4, Stuart Harrad
1
1Division of Environmental Health and Risk Management, School of Geography, Earth and
Environmental Sciences, University of Birmingham, Birmingham, B15 2TT, UK.
2Department of Analytical Chemistry, Faculty of Pharmacy, Assiut University, 71526 Assiut,
Egypt.
3School of Biosciences, University of Birmingham, Birmingham, B15 2TT, UK.
4Thermo Fisher Scientific (Bremen) GmbH, 28199 Bremen, Germany.
* Corresponding author
Email [email protected]
Tel. +44 121 414 7297
Fax. +44 121 414 3078
Page 1 of 30
ACS Paragon Plus Environment
Analytical Chemistry
123456789101112131415161718192021222324252627282930313233343536373839404142434445464748495051525354555657585960
Abstract
The high resolution, accurate mass and fast scanning features of the OrbitrapTM mass
spectrometer, combined with the separation power of ultrahigh performance liquid
chromatography were applied for the first time to study the metabolic profiles of several
organic flame retardants (FRs) present in indoor dust. To mimic real-life exposure, in
vitro cultured human hepatocytes were exposed simultaneously to various FRs in an
indoor dust extract for 24 hours. Target parent FRs, hexabromocyclododecanes (α-, β-
and γ-HBCDs), tris-2-chloroethyl phosphate (TCEP), tris (1-chloro-2-propyl) phosphate
(TCIPP) and tris (1,3-dichloro-2-propyl) phosphate (TDCIPP), were separated in a
single run for the first time using alternating positive and negative heated ESI source.
Further metabolite separation and identification was achieved using full scan (70,000
FWHM), accurate mass (up to 1 ppm) spectrometry. Structural confirmation was
performed via all ion fragmentation (AIF) spectra using the optional higher collisional
dissociation (HCD) cell and MS/MS analysis. First insights into human metabolism of
HBCDs revealed several hydroxylated and debrominated phase I metabolites, in
addition to conjugated phase II glucuronides. Furthermore, various hydroxylated,
oxidized and conjugated metabolites of chlorinated phosphorous FRs were identified,
leading to the suggestion of α-oxidation as a significant metabolic pathway for these
compounds.
Page 2 of 30
ACS Paragon Plus Environment
Analytical Chemistry
123456789101112131415161718192021222324252627282930313233343536373839404142434445464748495051525354555657585960
1 Introduction
Cellular stress is a general term covering a wide range of molecular changes that cells
undergo in response to various stressors. Environmental stressors may include
extremes of temperature, mechanical damage and exposure to toxins or xenobiotics
(e.g. flame retardant chemicals (FRs)).1 Several studies have highlighted the importance
of indoor dust as a pathway of human exposure to FRs and related persistent organic
pollutants (POPs).2,3 However, few studies have investigated the metabolic pathways of
FRs present in indoor dust. Most of these studies have focused on metabolism of
polybrominated diphenyl ethers (PBDEs) using animal or human liver microsomes,4
hepatic S9 fractions5 and rarely, human hepatocytes.6 Furthermore, the restrictions on
production and usage of PBDEs followed by inclusion of the Penta- and Octa-BDE
commercial formulations as persistent organic pollutants (POPs) under Annex A of the
UNEP Stockholm Convention on POPs7 have led to the application of alternative FRs to
meet fire safety regulations. Currently, very little is known about the metabolic
pathways of alternative FRs in humans. Among these alternatives, the chlorinated alkyl
phosphates: tris-2-chloroethyl phosphate (TCEP), tris (1-chloro-2-propyl) phosphate
(TCIPP) and tris (1,3-dichloro-2-propyl) phosphate (TDCIPP), in addition to
hexabromocyclododecane (HBCD); are associated with a variety of applications in a
wide range of consumer products.
TCEP, TCIPP and TDCIPP have been widely applied as FRs in polyurethane foam for
domestic, public, and automotive applications with an estimated annual consumption of
91,000 tonnes in 2006.8 Each were subject to an EU risk assessment process under an
Existing Substances Regulation (EEC 793/93). As a result, all 3 compounds were
classified as persistent organic compounds in the aquatic environment and reported to
fulfil PBT criteria.9 In addition, several studies have reported them to display adverse
Page 3 of 30
ACS Paragon Plus Environment
Analytical Chemistry
123456789101112131415161718192021222324252627282930313233343536373839404142434445464748495051525354555657585960
effects including reproductive toxicity and carcinogenic effects on lab animals.8 Hence,
TCEP is classified by the EU as a “potential human carcinogen”,10 while TDCIPP is
classified under regulation EC 1272/2008 as a category 2 carcinogen with hazard
statement H351 “suspected of causing cancer”.11 Information on the biotransformation
pathways of organophosphate flame retardants (PFRs) is limited. While phosphoric acid
diesters were the major metabolites of TDCIPP and TCEP identified in rat urine,12 a
recent in vitro study using human liver microsomes and S9 fractions reported the
replacement of Cl with OH followed by conjugation as a major metabolic pathway for
TCEP and TCIPP.13
HBCD is an additive FR widely applied in expanded and extruded polystyrene foams
(EPS/XPS) used for thermal insulation of buildings and to a lesser extent in the
backcoating of fabrics and high impact polystyrene casing for electrical goods. The
commercial formulations consist mainly of α-, β-, and γ-diastereomers with γ-
predominant (>70% ΣHBCD). HBCD has low water solubility (49, 15, and 2 µg L-1 for α-,
β-, and γ-HBCD respectively), a fairly low vapor pressure (6.27 x 10⁻⁵ Pa) and is
persistent. It can therefore bioaccumulate and undergo long-range transport.14 Oral
exposure to HBCDs was reported to induce hepatic cytochrome P450 enzymes and alter
the normal uptake of neurotransmitters in rat brain. It can cause disruption of thyroid
function, the reproductive system, nerve function and development in various classes of
vertebrates.15 Therefore, HBCD was recently included in Annex A of the Stockholm
Convention on POPs with an exemption for use in EPS/XPS in buildings.7 Currently, little
is known about the metabolism of HBCDs in humans or other biota. Recent in vitro
studies in rat and trout liver S9 fractions showed oxidation (hydroxylation) and
reductive debromination as the main biotransformation pathways,16 which was in
agreement with in vivo studies in Wistar rats17 and female mice.18 To the authors’
Page 4 of 30
ACS Paragon Plus Environment
Analytical Chemistry
123456789101112131415161718192021222324252627282930313233343536373839404142434445464748495051525354555657585960
knowledge, there exists hitherto, no studies of HBCD metabolism in human liver
preparations. Moreover, there are no studies on the biotransformation of HBCDs, TCEP,
TCIPP, and TDCIPP in indoor dust by human hepatocytes which contain the full system
for Phase I and Phase II metabolic reactions. Furthermore, very little is known about the
metabolic behavior of human liver cells upon concomitant exposure to multiple
stressors which mimic the real life situation. Biotransformation of FRs can be a major
determinant of the toxicological and bioaccumulative properties of these xenobiotics in
humans.
Although targeted routine analysis of HBCD diastereomers and chlorinated alkyl
phosphates using various LC-MS and GC-MS techniques is well-documented,8,15
separation and identification of metabolites following exposure of human hepatocytes
to a complex mixture of the target FRs requires use of high resolution mass
spectrometric methods (HR-MS). While the application of time-of-flight (TOF-MS)
coupled to HPLC to study the in vitro biotransformation of individual chlorinated alkyl
phosphates has been recently reported;13 the ability of ultra high mass resolution mass
spectrometric methods like Orbitrap-MS to inform understanding of human metabolism
of FRs has not yet been evaluated. The mass resolution of Orbitrap-MS (up to 140,000
full width at half maximum (FWHM)) and mass accuracy (up to 1 ppm), provides
accurate mass measurements facilitating resolution of target analytes from background
matrix interferences and isobaric compounds. Such capacity to obtain mass spectra with
high mass accuracy at sufficient mass resolution and scan rates, opens substantial
opportunities for combining targeted analysis with unbiased metabolite profiling which
can provide new perspectives in metabolite analysis.19 Review of the available literature
on in vitro metabolism of FRs present in indoor dust shows that studies were carried
out via exposure of the metabolising system (i.e. liver microsomes, liver S9 fractions,
Page 5 of 30
ACS Paragon Plus Environment
Analytical Chemistry
123456789101112131415161718192021222324252627282930313233343536373839404142434445464748495051525354555657585960
hepatocytes and/or liver slices) to a single contaminant or a small group of closely
related contaminants (e.g. HBCDs).16,20 This simplified approach may allow for the
detection and identification of the small number of metabolites formed using the most
commonly available low/medium resolution MS or MS/MS systems. However, this
might not closely reflect the in vivo situation where the metabolising system is
simultaneously exposed to a wide range of various xenobiotics, which may greatly
influence both the activity (e.g. induction or suppression) of the enzymes and the nature
of the produced metabolites (i.e. presence of preferential substrates for certain enzyme
groups). Nevertheless, separation and identification of the complex metabolites mixture
resulting from simultaneous exposure of hepatocytes to a wide range of contaminants
present in indoor dust, needs a combination of high performance chromatographic
separation and ultra high resolution mass spectrometry.
Against this backdrop, the aim of the current work was to study for the first time the
metabolic profiles of HBCDs, TCEP, TCIPP and TDCIPP in indoor dust applied
concomitantly to human hepatocyte cultures using UPLC-OrbitrapTM-MS.
2 Experimental
2.1 Chemicals and reagents
All chemicals were HPLC grade obtained from Sigma-Aldrich Chemical Company (UK)
unless otherwise stated.
2.2 Cell culture
Human HepG2/C3A cells were generously provided by Prof. Ronny Blust from the
University of Antwerp, Belgium. HepG2/C3A cells were cultured in William’s E
medium(Sigma, UK) supplemented with 5% heat-inactivated fetal bovine serum (FBS)
Page 6 of 30
ACS Paragon Plus Environment
Analytical Chemistry
123456789101112131415161718192021222324252627282930313233343536373839404142434445464748495051525354555657585960
(APP, Germany), 100 U penicillin/mL and 100 μg streptomycin/mL (APP, Germany),
4µM L-glutamine (APP, Germany) and 0.4 µM sodium pyruvate (Sigma, UK) and
incubated in 37°C with humidified air containing 5% CO2. Cells were digested with
0.25% trypsin-EDTA and sub-cultured at 80% to 90% confluence exponentially growing
HepG2/C3A cells were used for all assays.
The potential cytotoxicity of HBCD to HepG2/C3A cells was evaluated by the CCK-8
assay using a commercial kit, according to the manufacturers’ instruction (Dojindo
Laboratories, Kumamoto, Japan).
2.3 Dosing solutions
The dosing solutions for this study were prepared to mimic real-life exposure of a 12.3
kg toddler to indoor dust assuming a high dust ingestion scenario (200 mg dust day-1).21
We used standard NIST SRM 2585 dust with known indicative values for all target
compounds (Table SI-1). 240 mg of NIST SRM 2585 dust were extracted using
pressurized liquid extraction (Dionex ASE 350, Sunnyvale, CA, USA) according to a
previously reported method.22 The extract was concentrated under a gentle stream of
nitrogent, followed by solvent exchange to 2 mL of DMSO using 500 µL of toluene as a
“keeper” to minimize analyte loss (D1). Another dosing solution (D2) containing 100
times the concentrations of target analytes in D1 was prepared by appropriate dilution
of α-HBCD, β-HBCD, γ-HBCD, TCEP, TCIPP, and TDCIPP reference standards (Wellington
Laboratories Inc., ON, Canada) with DMSO. D2 was used to mimic episodic high dose
exposure which can be several orders of magnitude higher than average exposure
scenarios. 23
2.4 Human hepatocytes exposure experiments
HepG2/C3A cells were seeded into 6 well plates at density of 106 cells in 2 mL culture
media per well. After 24 hours acclimatization, cells were exposed to D1 or D2 (10 µL in
Page 7 of 30
ACS Paragon Plus Environment
Analytical Chemistry
123456789101112131415161718192021222324252627282930313233343536373839404142434445464748495051525354555657585960
DMSO added into 2 mL media) and incubated at 37°C with humidified air containing 5%
CO2. DMSO (10 µL) as vehicle was added into the same volume media as a control, while
10 µL of D1 or D2 were also incubated alone with the culture media on the well plates
adjacent to the hepatocytes and analyzed at the end of exposure to determine “real”
exposure concentrations for QA/QC purposes (the final concentration of DMSO was
0.5% (v/v) in all treatments). All experiments were performed in triplicate. After 24
hours exposure, cells were harvested and kept frozen at -80°C until analysis.
2.5 Sample extraction
Samples were spiked with 2 mL of methanol and extracted by vortexing for 60 seconds,
followed by ultrasonication for 5 minutes and centrifugation at 4,000 g for 3 minutes.
This extraction cycle was repeated twice before the combined methanol extracts were
reduced under a gentle stream of N2 to 150 µL in a HPLC vial.
2.6 Instrumental Analysis
Chromatographic analysis was achieved using a dual pump Ultimate 3000TM
(ThermoScientific, Bremen, Germany) UHPLC system equipped with an Ultimate
3000TM XRS autosampler. Analyte separation was achieved on an AccucoreTM RP-MS
column (100 x 2.1 cm, 2.6 µm, ThermoScientific, Bremen, Germany) using a mobile
phase of 1 mM ammonium acetate (mobile phase A) and Methanol (mobile phase B),
each modified with 0.1% formic acid. The elution programme commenced with 25% B
ramped up to 50% B over 0.5 min, then increased linearly to 100% B over 6 minutes.
This was held for 4 minutes, then decreased to 50% B over 0.5 min and kept at this
composition (to equilibriate the column) for a further 1 minute. Overall analysis time
was 12 minutes using a constant flow rate of 0.18 mL min-1. The injection volume was
10 μL and the column maintained at 37 °C throughout.
Page 8 of 30
ACS Paragon Plus Environment
Analytical Chemistry
123456789101112131415161718192021222324252627282930313233343536373839404142434445464748495051525354555657585960
Identification of target analytes (HBCDs, TCEP, TCIPP and TDCIPP) and their
metabolites was performed using an ExactiveTM Plus OrbitrapTM mass spectrometer
(Thermo Scientific, Bremen, Germany) using an ESI source operated in both positive
and negative ionization modes.
Due to the lack of reference standards, high resolution full scan mass spectra were used
to identify metabolites. Based on the chemical structures of individual studied
substrates and the enzyme families (phase I and II metabolism) present in human
hepatocytes, a database containing the molecular structures of all theoretically possible
metabolites was prepared and saved in TraceFinderTM software. Three successive filters
were set in the software for initial metabolite identification:
i. The peak signal to noise ratio (S/N) must exceed 10:1.
ii. The m/z value of the molecular ion peak must be within 10 ppm of its theoretical
value.
iii. The Br or Cl isotope pattern must match within 5 % of the theoretically predicted
abundances.
The identity of potential metabolites were confirmed via all ion fragmentation (AIF)
using the higher collisional dissociation (HCD) cell. Thermo XcaliburTM and
TraceFinderTM 3.0 software was used for raw data interpretation and for
targeting/identification of metabolites. The fragmentation patterns obtained from each
metabolite provided additional information for structural elucidation. Further
confirmation of metabolite structures were achieved via MS/MS analysis using the
parent (nominal) mass from the Orbitrap full scan and the most predominant fragment
obtained from the AIF analysis. Confirmatory tandem mass analyses were performed
using a AB Sciex API 2000TM triple quadrupole mass spectrometer equipped with a
TurboIonSpray® source used in the multiple reaction monitoring (MRM) mode. Source
Page 9 of 30
ACS Paragon Plus Environment
Analytical Chemistry
123456789101112131415161718192021222324252627282930313233343536373839404142434445464748495051525354555657585960
and compound specific parameters were adjusted for each parent compound (i.e.
HBCDs, TCEP, TCIPP and TDCIPP) via direct infusion experiments (2 ng µL-1 standard
solution each, in methanol) using a built-in Harvard syringe pump at a flow rate of 10 µL
min-1 (Table SI-2).
3 Results and discussion
3.1 Optimization of instrumental parameters
Due to the lack of reference standards for metabolites of the target compounds,
instrumental parameters were initially optimized using standard solutions of the parent
analytes. While several studies exist for the analysis of HBCDs,15 with fewer reporting
the analysis of chlorinated alkyl phosphates using LC/MS based techniques.8; this is the
first study to attempt separation and identification of all target compounds within the
same run. Several mobile phase gradients with different proportions of water,
acetonitrile and methanol were tested, with various percentages of different additives
including formic acid, ammonium acetate and ammonium chloride. While inclusion of
acetonitrile in the mobile phase enhanced the resolution between β- and γ-HBCDs, it
was not essential for baseline separation and caused a general decrease in the ESI signal
intensity for all target analytes. Therefore, acetonitrile was removed from the mobile
phase and baseline separation of all target compounds within a reasonable run time (12
min) was achieved using the mobile phase program described under section 2.6 (Figure
1).
Several C18-RP columns (100 x 2.1 cm) with different particle sizes, namely: SyncronisTM
(1.7 µm), Hypersil goldTM (1.9 µm), AcclaimTM (2.2 µm), HypersilTM (2.4 µm) and
AccucoreTM (2.6 µm) were tested for separation of the studied compounds. While all the
tested columns provided baseline separation, better resolution factors with reasonable
retention of the target analytes within acceptable pressure range, was achieved using
Page 10 of 30
ACS Paragon Plus Environment
Analytical Chemistry
123456789101112131415161718192021222324252627282930313233343536373839404142434445464748495051525354555657585960
the AccucoreTM column (Figure 1). Columns with smaller stationary phase particle size
required very high pressures - accompanied by higher column temperatures -
throughout the run, with potential for solvent leaks or emergency termination of the
run should the pressure limit be exceeded.
Following chromatographic separation, the analytes were introduced to the Orbitrap-
MS via a heated electrospray ionization (HESI) source with fast polarity switching
between positive (PFRs) and negative (HBCDs) ionization modes. Optimised ESI source
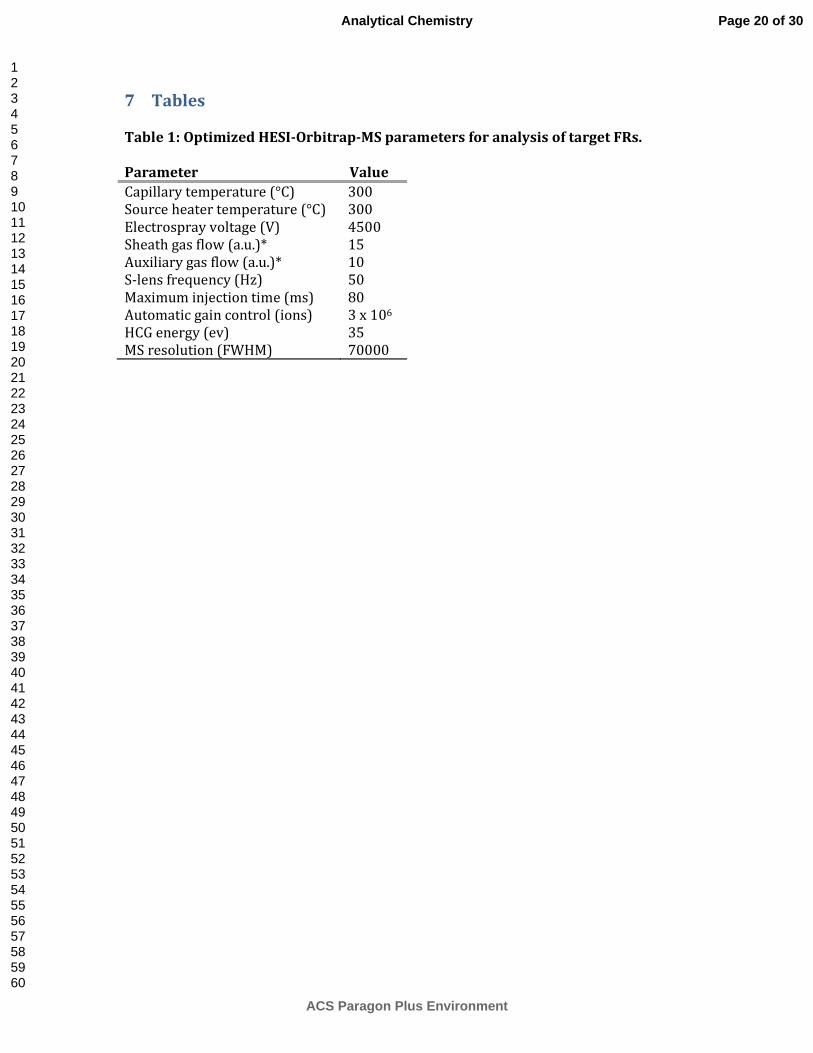
parameters are provided in table 1. The ions were then guided via a complex optical
system to the C-trap which allows storage of a significant ion population prior to quick
injection into the Orbitrap analyzer in short pulses, so that each mass-to-charge (m/z)
population forms a sub-microsecond pulse. In this study, the automated gain control
(AGC) was set to 3 x 10⁶ ions for full scan analysis and 1 x10⁶ ions for semi-quantitative
analysis. The Orbitrap-MS can provide high mass accuracy (typically less than 3 ppm)
with high resolution. While the maximum mass resolution of the Orbitrap-MS is 140,000
FWHM, this resulted in highly deformed peaks and a long scan time. Therefore, a mass
resolution of 70,000 FWHM was selected for full scan analysis while a mass of 35,000
FWHM was used for semi-quantitative analysis. Due to the lack of reference standards
for putative Phase-I and Phase-II metabolites of the target compounds, identification of
metabolites was based on their accurate mass provided by: a full MS scan, their
fragmentation pattern obtained using the optional high energy collisional dissociation
(HCD) cell, isotope patterns which reflect the presence of naturally occurring heavier
isotopes of common atom (e.g. 81Br or 37Cl) (Figure SI-1), and confirmational MS/MS
analysis (Table SI-2).
Page 11 of 30
ACS Paragon Plus Environment
Analytical Chemistry
123456789101112131415161718192021222324252627282930313233343536373839404142434445464748495051525354555657585960
3.2 HBCD metabolic profile
Following incubation of α-, β- and γ- HBCDs (present in a SRM2585 dust extract) with
human hepatocytes, 2 peaks for pentabromocyclododecene (PBCD) and 1 peak for
tetrabromocyclododecadiene (TBCD) were observed. The metabolites were identified
and linked to their parent compounds based on: the acquired accurate mass spectra
(Figure 2), AIF fragmentation pattern, retention time windows (on the basis that peaks
of the lower brominated compounds will appear before the less polar parent
compound) and LC-ESI-MS/MS analysis using the respective MRM for each metabolite
(table SI-2). While this study is the first to report on HBCD metabolism in human
models; PBCDs and TBCDs metabolites were previously reported in rat17 and mice18 in
vivo studies. Moreover, we have recently reported on the formation of 3 PBCDs and 2
TBCDs following incubation of α-, β- and γ- HBCDs with rat S9 fractions.16 The
debrominated metabolites have also been identified in human milk samples from UK24
and USA25.
As a result of phase I metabolism, several hydroxylation products of HBCDs, PBCDs and
TBCDs were identified with a major ion cluster at [M+16]¯ and a predominant fragment
at m/z = 80.9153 corresponding to the Br¯ ion (Figure 2). One di-hydroxylated and five
mono-hydroxylated metabolites were identified for parent HBCDs; two mono-hydroxyl
metabolites were identified for PBCDs and one mono-hydroxyl metabolite for TBCD
(Table 2). Previous in vitro studies have reported several hydroxylated metabolites of
HBCDs and its debrominated metabolites using induced rat liver microsomes26 and S9
fractions.16 Brandsma et al. identified mono-hydroxyl metabolites of both PBCD and
TBCD in male Wistar rats17. Another in vivo metabolic study in female mice detected
both mono- and di- hydroxyl metabolites of PBCD but no hydroxyl TBCD derivatives18.
Theoretically, the 6 main HBCD enantiomers can produce 48 possible allylic PBCD
Page 12 of 30
ACS Paragon Plus Environment
Analytical Chemistry
123456789101112131415161718192021222324252627282930313233343536373839404142434445464748495051525354555657585960
structures and each HBCD enantiomer can lead to a maximum of six different
diastereomeric mono- hydroxyl HBCD structures which can result in a huge number of
possible di-hydroxyl HBCDs.26 Therefore, while the different number of metabolites
identified in various studies may be attributed to species-specific variability in phase I
metabolism and different exposure conditions,16, co-elution of one or more HBCD
metabolites cannot be excluded in the absence of reference standards for these
compounds. Collectively, these results support our previous findings that while
cytochrome P450 enzymes are involved in the stereoselective phase I oxidative
metabolism of HBCDs; the detection of penta- and tetra- brominated metabolites
together with their hydroxylated products indicate sequential reductive debromination
(not catalysed by cytochrome P450 enzymes27) as a potential pathway of HBCD
metabolism. Despite mounting evidence of the involvement of deiodinase enzymes in
the metabolic debromination of PBDEs28,29, further research is required prior to
comparing these studies to HBCDs, due to the aliphatic nature of HBCDs as opposed to
the aromatic structure of PBDEs.
As a result of phase II metabolism, glucuronide conjugates were identified for the first
time for both HBCDs and PBCDs at [M+176]¯. Glucuronide formation was identified via
accurate MS spectra and matching isotope fractions (Figure 3). Conformatory AIF MS2
spectra showed characteristic glucuronide fragments at m/z = 176 and 11330 (Figure SI-
2), which were used for confirmatory MS/MS analysis of the formed conjugates. An in
vivo study identified a methylmercapturate conjugate of TBCD in the urine of female
mice exposed orally to γ-HBCD.18 However, no mercapturate or sulfate conjugates could
be identified in this study which may indicate species-specific differences in HBCD
metabolism. To the author’s knowledge, this is the first study of HBCD metabolism in
humans, which precludes comparison of results within the same species.
Page 13 of 30
ACS Paragon Plus Environment
Analytical Chemistry
123456789101112131415161718192021222324252627282930313233343536373839404142434445464748495051525354555657585960
3.3 TCEP metabolic profile
Several TCEP metabolites were identified using accurate MS spectra and confirmatory
Cl isotope fractions (Figure 4). Based on relative peak area to the parent compound,
bis(2-chloroethyl) hydrogen phosphate (BCEP) (Table SI-3) appeared the major
metabolite formed by the studied human cell lines. This is in agreement with previous in
vivo metabolic studies in rats and mice,31 and a previous in vitro study using human and
rat liver preparations.32 In addition, a hydroxylated metabolite, bis(2-chloroethyl) 2-
hydroxyethyl phosphate (TCEP-M1), and its oxidation product, bis(2-chloroethyl)
carboxymethyl phosphate (TCEP-M2), were positively identified (Figure 4 and Table SI-
3). TCEP-M1 was previously identified as a major TCEP metabolite following incubation
with human liver microsomes,13 While TCEP-M2 was found in rat urine exposed to
TCEP via gavage.31 Therefore, we hypothesize α-oxidation as a significant metabolic
pathway of TCEP in human hepatocytes (Figure 5). The reaction starts with α-
hydroxylation of a terminal chloromethyl group resulting in an unstable chlorohydrin
intermediate (IM-1), which loses a HCl moiety to produce an aldehyde (IM-2). The
formed aldehyde can then be oxidized by an aldehyde dehydrogenase to produce TCEP-
M2, or reduced by an alcohol dehydrogenase to the corresponding alcohol (TCEP-M1)
(Figure 5 and Table SI-3). Metabolic α-oxidation has been previously reported for
halomethyl groups in other chemicals e.g. 1-chloropropane33 and was also suggested for
TCEP in rats.31
Phase II metabolism resulted in the formation of a glutathione conjugate of the parent
compound TCEP (Figure 4). Identification of the glutathione conjugate was confirmed
via LC-MS/MS analysis in neutral loss mode where the characteristic fractions of m/z =
308 and 179 (neutral loss of 129) were observed in positive ion ESI mode (Figure SI-3).
Moreover, the glucoronide conjugate of TCEP-M1 was also identified (Figure 4 and
Page 14 of 30
ACS Paragon Plus Environment
Analytical Chemistry
123456789101112131415161718192021222324252627282930313233343536373839404142434445464748495051525354555657585960

Table SI-3). This conjugate was previously reported in rat and mice urine31 and
suggested following in vitro exposure of rat and human liver preparations to TCEP.32
3.4 TCIPP metabolic profile
Very little is known about the biotransformation of TCIPP. To the authors’ knowledge,
there is only one recent paper studying the biotransformation of TCIPP by human liver
microsomes and S9 fractions.13 In the current work, bis(1-chloro-2-propyl) hydrogen
phosphate (BCIPP) was identified as a major metabolite by human HepG2 cells (Table
3). Interestingly, two isomeric peaks were observed for BCIPP in samples exposed to
the dust extract, while only one BCIPP peak was found in samples exposed to the
standard mixture D2. Van den Eede et al. reported two BCIPP isomers after incubating
human liver microsomes with a TCIPP mixture of tris(1-chloro-2-propyl) phosphate
(>66%) and tris(1-chloropropyl) phosphate (~30%). The formation of two BCIPP
isomers was attributed to exposure of the microsomes to two TCIPP isomers.13
Therefore, the detection of one BCIPP isomer following exposure of human HepG2 cells
to D2, can be attributed to the presence of pure tris(1-chloro-2-propyl) phosphate in the
Wellington® standard for TCIPP, which was used to prepare the dosing mixture D2 in
this study.
Furthermore, a hydroxylated metabolite, bis(1-chloro-2-propyl) hydroxy 2-propyl
phosphate (TCEP-M1), and a carboxylic acid, bis(1-chloro-2-propyl) carboxy 2-ethyl
phosphate (TCEP-M2), were also identified (Table 3). This suggests that α-oxidation
(Figure 5) may constitute a major metabolic pathway for TCIPP in human hepatocytes.
As a result of Phase II metabolism, the glutathione conjugate of TCIPP was identified
(Table 3). However, no glucuronide or sulfate conjugates could be confirmed.
Page 15 of 30
ACS Paragon Plus Environment
Analytical Chemistry
123456789101112131415161718192021222324252627282930313233343536373839404142434445464748495051525354555657585960
3.5 TDCIPP metabolic profile
Biotransformation of TDCIPP in indoor dust by human hepatocytes followed a similar
profile to that observed for TCEP and TCIPP (Table 4). The diester, bis(1,3-dichloro-2-
propyl) hydrogen phosphate (BDCIPP), was the major metabolite formed after 24 hours
of exposure (based on the relative peak area to that of the parent TDCIPP). This is in
agreement with a previous in vivo study, which reported BDCIPP as the major urinary,
fecal and biliary metabolite in rats following intravenous administration of radiolabeled
TDCIPP.34 Another in vitro study also reported BDCIPP as the major metabolite of
TDCIPP by human liver microsomes.13 In addition to the hydroxylated metabolite
(TDCIPP-M1) and the carboxylic acid metabolite (TDCIPP-M2), the monoester, 1,3-
dichloro-2-propyl dihydrogen phosphate (DCIPP), was also identified (Table 4). Further
hydrolysis of BDCIPP by esterases was previously suggested following in vitro
incubation of TDCIPP with human liver microsomes.35
The glutathione conjugate of TDCIPP was identified as a result of phase II metabolism
(Table 4). This is in agreement with the results of previous in vitro studies using human
liver microsomes.13,35
4 Conclusion
A novel multi-residue analytical method was developed and applied to study the
metabolic products formed when human HepG2 cell lines were challenged
simultaneously – for the first time - with several widely-used organic flame retardants
present in indoor dust. To mimic real-life exposure scenarios, human hepatocytes were
concomitantly exposed for 24 hours to α-HBCD, β-HBCD, γ-HBCD, TCEP, TCIPP, and
TDCIPP extracted from indoor dust. To identify the large number of metabolites formed,
an ExactiveTM Plus OrbitrapTM high resolution mass spectrometer was applied following
Page 16 of 30
ACS Paragon Plus Environment
Analytical Chemistry
123456789101112131415161718192021222324252627282930313233343536373839404142434445464748495051525354555657585960
chromatographic separation via UPLC. For the first time, target parent compounds were
separated and monitored in a single run using an alternating positive and negative
heated ESI source. Further metabolite separation and identification was performed
using the high resolution (70,000 FWHM) accurate mass (up to 1 ppm) features of the
OrbitrapTM-MS. Structural confirmation of the detected metabolites was achieved via all
ion fragmentation (AIF) spectra using the optional higher collisional dissociation (HCD)
cell of the MS. Hepatic metabolism of HBCDs in human was investigated for the first
time. Several hydroxylated and debrominated phase I metabolites were identified, while
conjugated phase II glucuronides of HBCDs were also confirmed. Hydroxylated, oxidized
and conjugated metabolites of chlorinated phosphorous flame retardants were also
observed and α-oxidation was proposed as a metabolic pathway for target PFRs in
human hepatocytes.
5 Supporting Information
Further details on analytical method optimization, QA/QC measurements and structural
confirmation of metabolites are provided as supporting information.
6 Acknowledgement
The research leading to these results has received funding from the European Union Seventh
Framework Programme FP7/2007-2013 under grant agreements PIIF-GA-2012-327232
(ADAPT project), 316665 (A-TEAM project), and 264600 (INFLAME project).
Page 17 of 30
ACS Paragon Plus Environment
Analytical Chemistry
123456789101112131415161718192021222324252627282930313233343536373839404142434445464748495051525354555657585960
References
(1) Lokke, H.; Ragas, A. M. J.; Holmstrup, M. Toxicology 2013, 313, 73-82.
(2) Trudel, D.; Scheringer, M.; von Goetz, N.; Hungerbuehler, K. Environ Sci Technol
2011, 45, 2391-2397.
(3) Cao, Z. G.; Xu, F. C.; Covaci, A.; Wu, M.; Wang, H. Z.; Yu, G.; Wang, B.; Deng, S. B.; Huang,
J.; Wang, X. Y. Environ Sci Technol 2014, 48, 8839-8846.
(4) Hakk, H.; Letcher, R. J. Environ Int 2003, 29, 801-828.
(5) Browne, E. P.; Stapleton, H. M.; Kelly, S. M.; Tilton, S. C.; Gallagher, E. P. Aquat Toxicol
2009, 92, 281-287.
(6) Stapleton, H. M.; Kelly, S. M.; Pei, R.; Letcher, R. J.; Gunsch, C. Environ Health Persp
2009, 117, 197-202.
(7) United Nations Environment Programme (UNEP).
http://chm.pops.int/TheConvention/POPsReviewCommittee/OverviewandMandate/tabid
/2806/Default.aspx 2014.
(8) van der Veen, I.; de Boer, J. Chemosphere 2012, 88, 1119-1153.
(9) Regnery, J.; Puettmann, W.; Merz, C.; Berthold, G. J Environ Monitor 2011, 13, 347-
354.
(10) Regnery, J.; Puttmann, W. Water Res 2010, 44, 4097-4104.
(11) ECHA. http://echa.europa.eu/documents/10162/0410f4e3-7838-4819-b321-
f9d75d3a9cce (accessed 19-6-2012) 2010.
(12) Environmental Health Criteria. International Programme on Chemical Safety. World
Health Organization, Geneva, 1995, 172.
(13) Van den Eede, N.; Maho, W.; Erratico, C.; Neels, H.; Covaci, A. Toxicol Lett 2013, 223,
9-15.
(14) KEMI. R044_0710_env_hh.doc; Sundbyberg, Sweden 2007.
(15) Marvin, C. H.; Tomy, G. T.; Armitage, J. M.; Arnot, J. A.; McCarty, L.; Covaci, A.; Palace,
V. Environ Sci Technol 2011, 45, 8613-8623.
(16) Abdallah, M. A.-E.; Uchea, C.; Chipman, J. K.; Harrad, S. Environ Sci Technol 2014, 48,
2732-2740.
(17) Brandsma, S. H.; van der Ven, L. T. M.; de Boer, J.; Leonards, P. E. G. Environ Sci
Technol 2009, 43, 6058-6063.
(18) Hakk, H.; Szabo, D. T.; Huwe, J.; Diliberto, J.; Birnbaum, L. S. Environ Sci Technol
2012, 46, 13494-13503.
(19) Werner, E.; Croixmarie, V.; Umbdenstock, T.; Ezan, E.; Chaminade, P.; Tabet, J. C.;
Junot, C. Analytical Chemistry 2008, 80, 4918-4932.
(20) Alves, A.; Kucharska, A.; Erratico, C.; Xu, F. C.; Den Hond, E.; Koppen, G.; Vanermen,
G.; Covaci, A.; Voorspoels, S. Anal Bioanal Chem 2014, 406, 4063-4088.
(21) Jones-Otazo, H. A.; Clarke, J. P.; Diamond, M. L.; Archbold, J. A.; Ferguson, G.; Harner,
T.; Richardson, G. M.; Ryan, J. J.; Wilford, B. Environ Sci Technol 2005, 39, 5121-5130.
(22) Harrad, S.; Abdallah, M. A.-E. Chemosphere 2011, 82, 1240-1245.
(23) Abdallah, M. A.; Harrad, S. Environ Int 2009, 35, 870-876.
(24) Abdallah, M. A.; Harrad, S. Environ Int 2011, 37, 443-448.
(25) Carignan, C. C.; Abdallah, M. A.; Wu, N.; Heiger-Bernays, W.; McClean, M. D.; Harrad,
S.; Webster, T. F. Environ Sci Technol 2012, 46, 12146-12153.
(26) Esslinger, S.; Becker, R.; Maul, R.; Nehls, I. Environ Sci Technol 2011, 45, 3938-3944.
(27) Benedict, R. T.; Stapleton, H. M.; Letcher, R. J.; Mitchelmore, C. L. Chemosphere
2007, 69, 987-993.
(28) Butt, C. M.; Wang, D.; Stapleton, H. M. Toxicol Sci 2011.
Page 18 of 30
ACS Paragon Plus Environment
Analytical Chemistry
123456789101112131415161718192021222324252627282930313233343536373839404142434445464748495051525354555657585960
(29) Szabo, D. T.; Richardson, V. M.; Ross, D. G.; Diliberto, J. J.; Kodavanti, P. R. S.;
Birnbaum, L. S. Toxicol Sci 2009, 107, 27-39.
(30) Holcapek, M.; Kolarova, L.; Nobilis, M. Anal Bioanal Chem 2008, 391, 59-78.
(31) Burka, L. T.; Sanders, J. M.; Herr, D. W.; Matthews, H. B. Drug Metabolism and
Disposition 1991, 19, 443-447.
(32) Chapman, D. E.; Michener, S. R.; Powis, G. Fundamental and Applied Toxicology
1991, 17, 215-224.
(33) Stubbings, W. A.; Harrad, S. Environ Int 2014, 71, 164-175.
(34) Lynn, R. K.; Wong, K.; Garviegould, C.; Kennish, J. M. Drug Metabolism and
Disposition 1981, 9, 434-441.
(35) Cooper, E.; Stapleton, H. SETAC North America 32nd Annual Meeting.
http://orbit.dtu.dk/fedora/objects/orbit:105810/datastreams/file_6352082/content
2011, 176.
Page 19 of 30
ACS Paragon Plus Environment
Analytical Chemistry
123456789101112131415161718192021222324252627282930313233343536373839404142434445464748495051525354555657585960
7 Tables
Table 1: Optimized HESI-Orbitrap-MS parameters for analysis of target FRs.
Parameter Value
Capillary temperature (°C) 300
Source heater temperature (°C) 300
Electrospray voltage (V) 4500
Sheath gas flow (a.u.)* 15
Auxiliary gas flow (a.u.)* 10
S-lens frequency (Hz) 50
Maximum injection time (ms) 80
Automatic gain control (ions) 3 x 10⁶
HCG energy (ev) 35
MS resolution (FWHM) 70000
Page 20 of 30
ACS Paragon Plus Environment
Analytical Chemistry
123456789101112131415161718192021222324252627282930313233343536373839404142434445464748495051525354555657585960
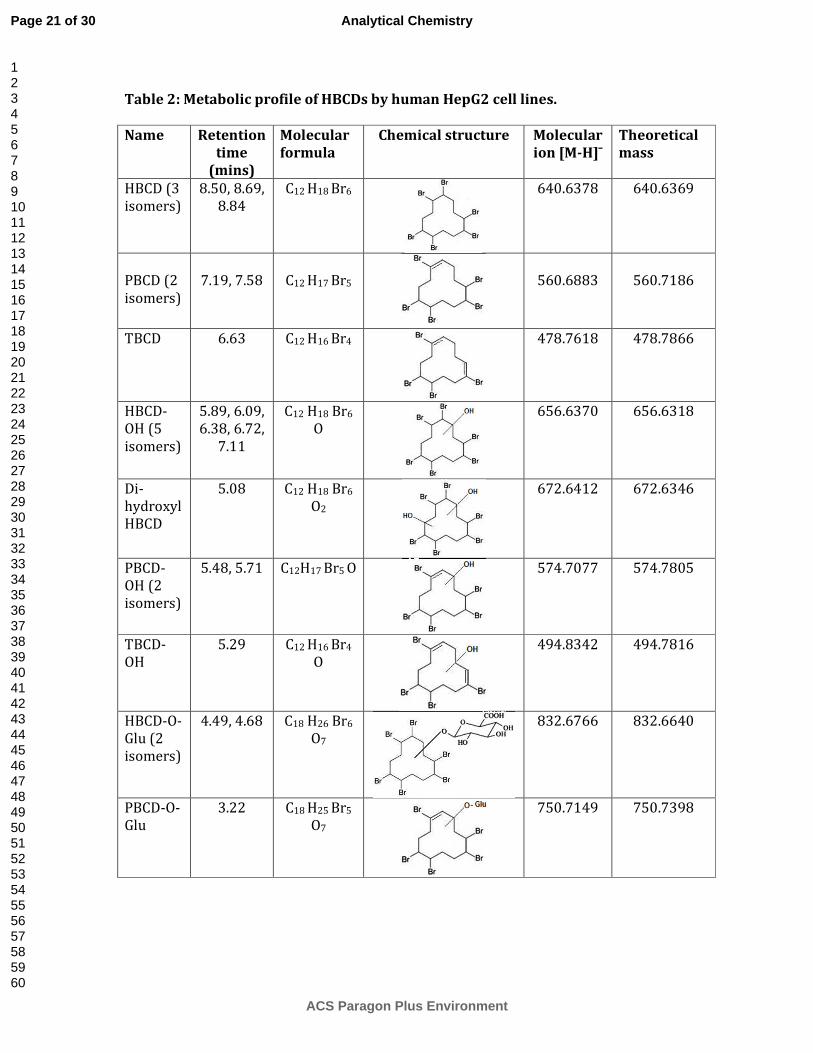
Table 2: Metabolic profile of HBCDs by human HepG2 cell lines.
Name Retention
time
(mins)
Molecular
formula
Chemical structure Molecular
ion [M-H]¯
Theoretical
mass
HBCD (3
isomers)
8.50, 8.69,
8.84
C12 H18 Br6
640.6378 640.6369
PBCD (2
isomers)
7.19, 7.58
C12 H17 Br5
560.6883
560.7186
TBCD 6.63 C12 H16 Br4
478.7618 478.7866
HBCD-
OH (5
isomers)
5.89, 6.09,
6.38, 6.72,
7.11
C12 H18 Br6
O
656.6370 656.6318
Di-
hydroxyl
HBCD
5.08 C12 H18 Br6
O2
672.6412 672.6346
PBCD-
OH (2
isomers)
5.48, 5.71 C12H17 Br5 O
574.7077 574.7805
TBCD-
OH
5.29 C12 H16 Br4
O
494.8342 494.7816
HBCD-O-
Glu (2
isomers)
4.49, 4.68 C18 H26 Br6
O7
832.6766 832.6640
PBCD-O-
Glu
3.22 C18 H25 Br5
O7
750.7149 750.7398
Page 21 of 30
ACS Paragon Plus Environment
Analytical Chemistry
123456789101112131415161718192021222324252627282930313233343536373839404142434445464748495051525354555657585960
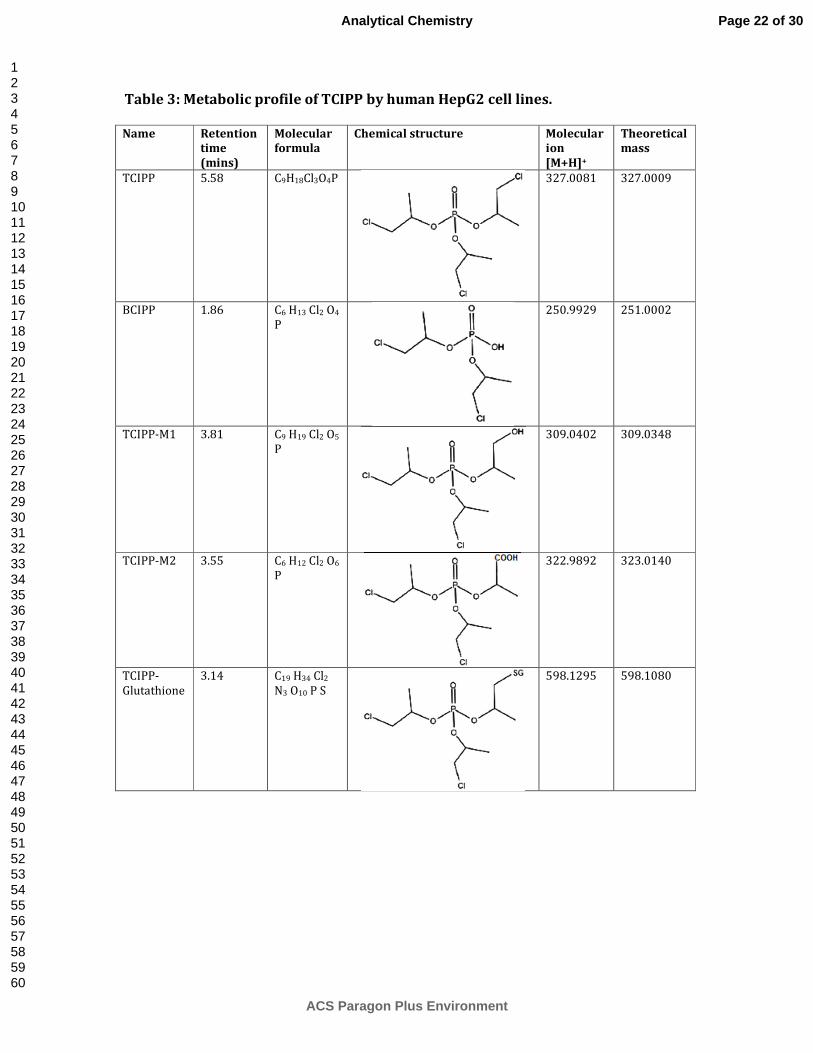
Table 3: Metabolic profile of TCIPP by human HepG2 cell lines.
Name Retention
time
(mins)
Molecular
formula
Chemical structure Molecular
ion
[M+H]+
Theoretical
mass
TCIPP 5.58 C9H18Cl3O4P
327.0081 327.0009
BCIPP 1.86 C6 H13 Cl2 O4
P
250.9929 251.0002
TCIPP-M1 3.81 C9 H19 Cl2 O5
P
309.0402 309.0348
TCIPP-M2 3.55 C6 H12 Cl2 O6
P
322.9892 323.0140
TCIPP-
Glutathione
3.14 C19 H34 Cl2
N3 O10 P S
598.1295 598.1080
Page 22 of 30
ACS Paragon Plus Environment
Analytical Chemistry
123456789101112131415161718192021222324252627282930313233343536373839404142434445464748495051525354555657585960
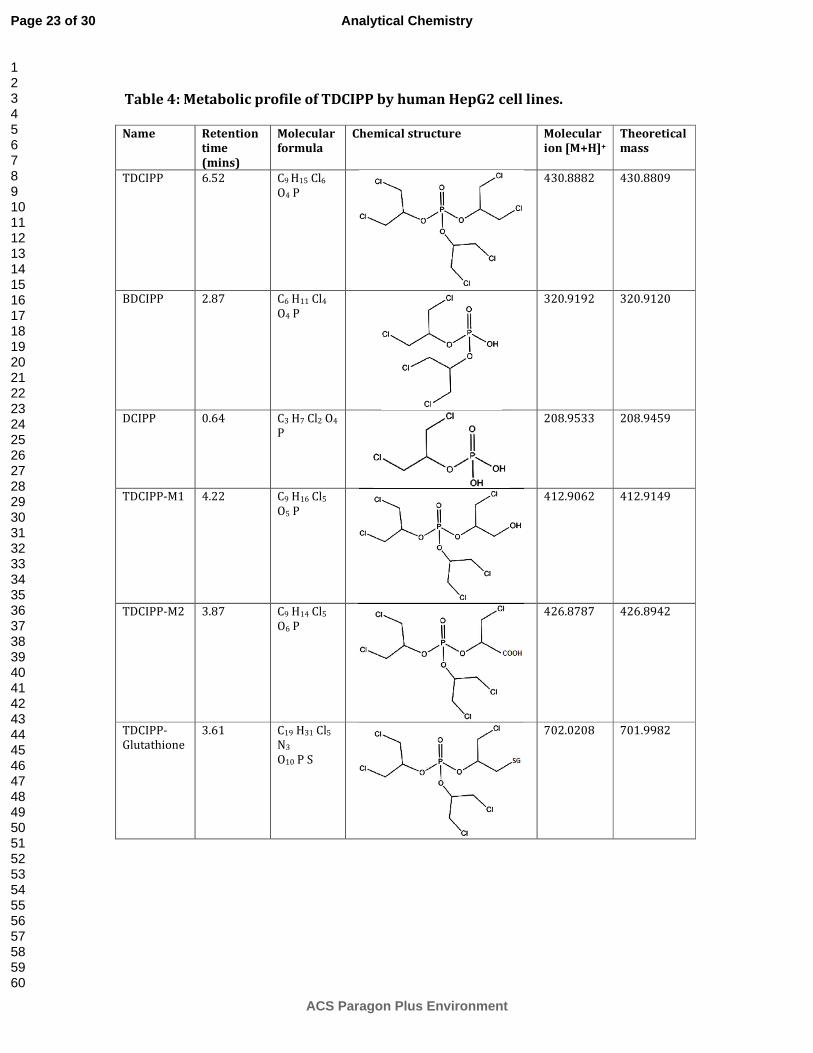
Table 4: Metabolic profile of TDCIPP by human HepG2 cell lines.
Name Retention
time
(mins)
Molecular
formula
Chemical structure Molecular
ion [M+H]+
Theoretical
mass
TDCIPP 6.52 C9 H15 Cl6
O4 P
430.8882 430.8809
BDCIPP 2.87 C6 H11 Cl4
O4 P
320.9192 320.9120
DCIPP 0.64 C3 H7 Cl2 O4
P
208.9533 208.9459
TDCIPP-M1 4.22 C9 H16 Cl5
O5 P
412.9062 412.9149
TDCIPP-M2 3.87 C9 H14 Cl5
O6 P
426.8787 426.8942
TDCIPP-
Glutathione
3.61 C19 H31 Cl5
N3
O10 P S
702.0208 701.9982
Page 23 of 30
ACS Paragon Plus Environment
Analytical Chemistry
123456789101112131415161718192021222324252627282930313233343536373839404142434445464748495051525354555657585960

8 Figures 1
2
Figure 1: Chromatographic separation of HBCDs, TCEP, TCIPP and TDCIPP using alternating positive and negative ESI mode. 3
4
5
Page 24 of 30
ACS Paragon Plus Environment
Analytical Chemistry
123456789101112131415161718192021222324252627282930313233343536373839404142434445464748495051525354555657585960
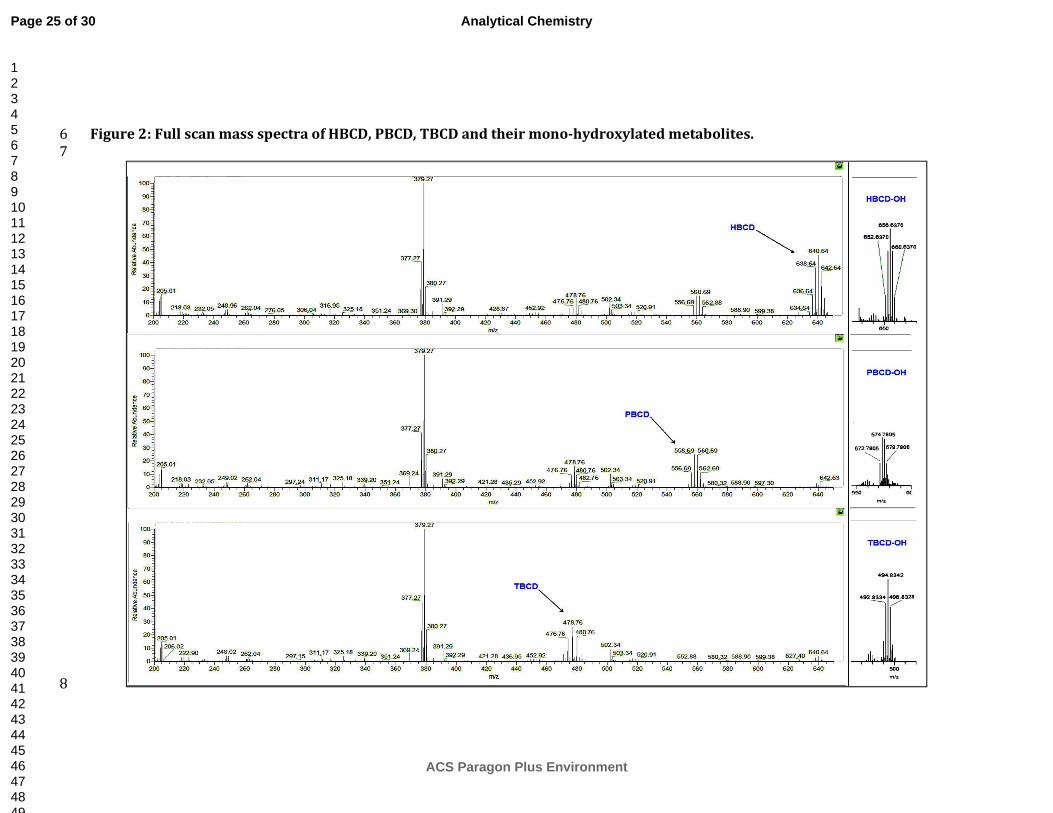
Figure 2: Full scan mass spectra of HBCD, PBCD, TBCD and their mono-hydroxylated metabolites. 6
7
8
Page 25 of 30
ACS Paragon Plus Environment
Analytical Chemistry
123456789101112131415161718192021222324252627282930313233343536373839404142434445464748495051525354555657585960
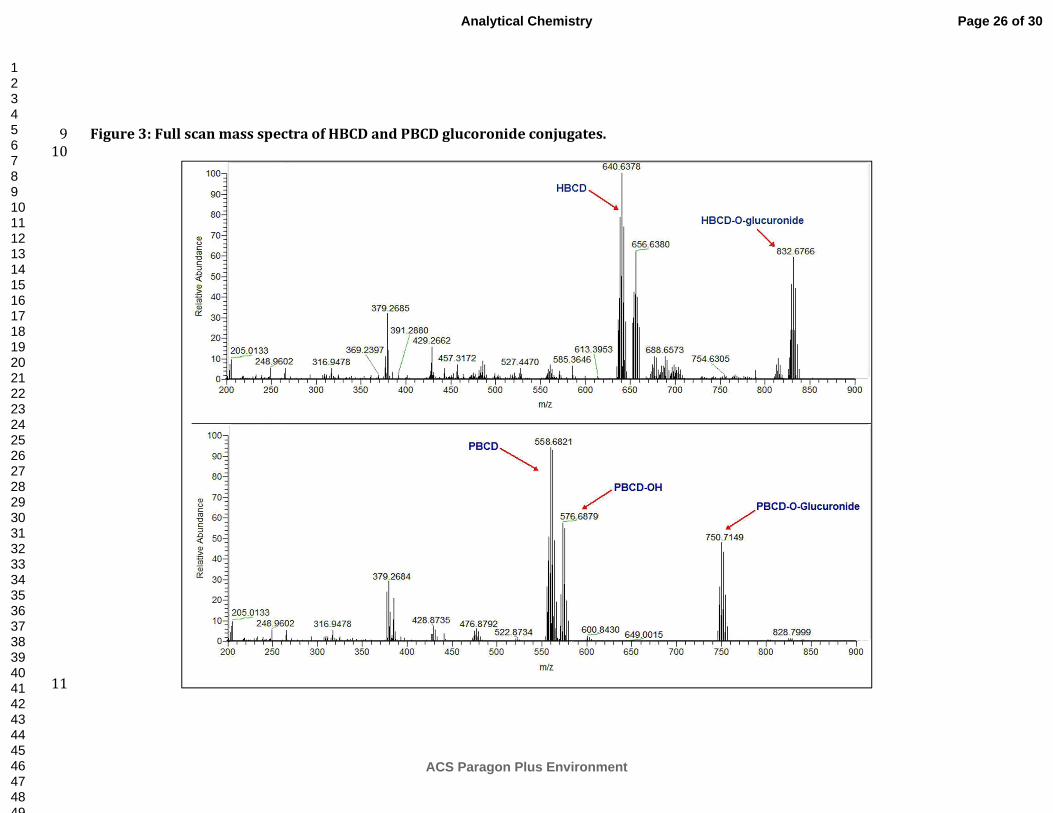
Figure 3: Full scan mass spectra of HBCD and PBCD glucoronide conjugates. 9
10
11
Page 26 of 30
ACS Paragon Plus Environment
Analytical Chemistry
123456789101112131415161718192021222324252627282930313233343536373839404142434445464748495051525354555657585960
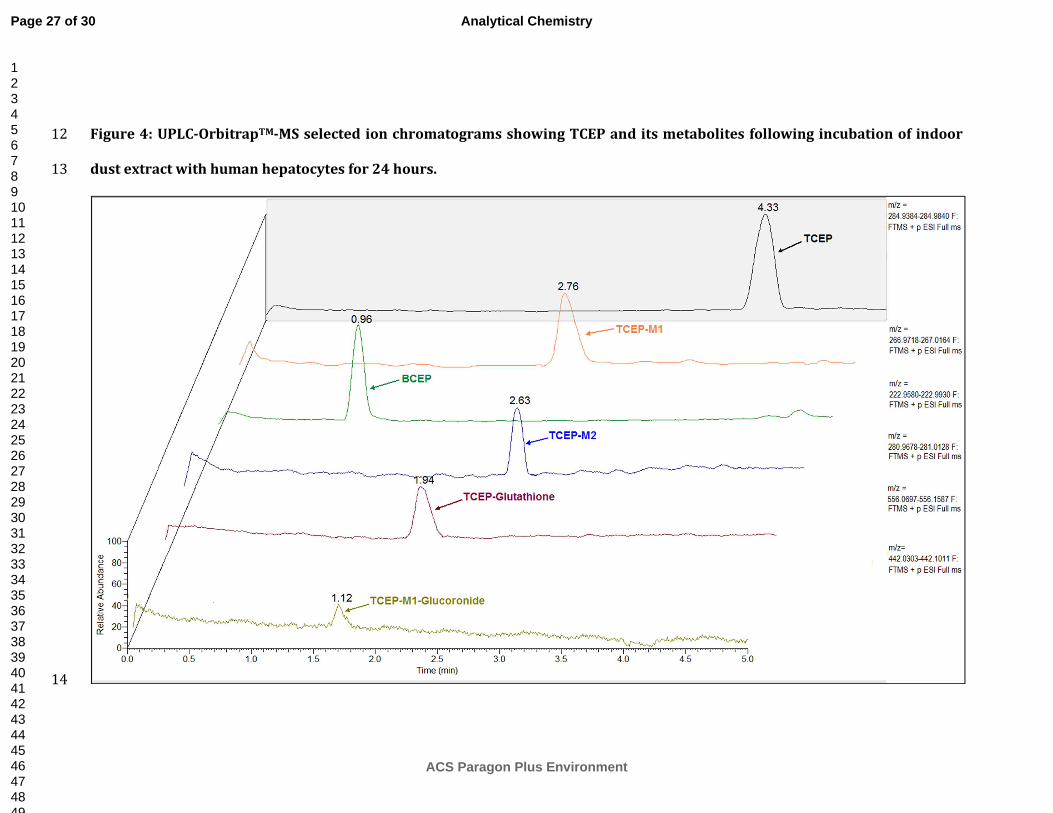
Figure 4: UPLC-OrbitrapTM-MS selected ion chromatograms showing TCEP and its metabolites following incubation of indoor 12
dust extract with human hepatocytes for 24 hours. 13
14
Page 27 of 30
ACS Paragon Plus Environment
Analytical Chemistry
123456789101112131415161718192021222324252627282930313233343536373839404142434445464748495051525354555657585960
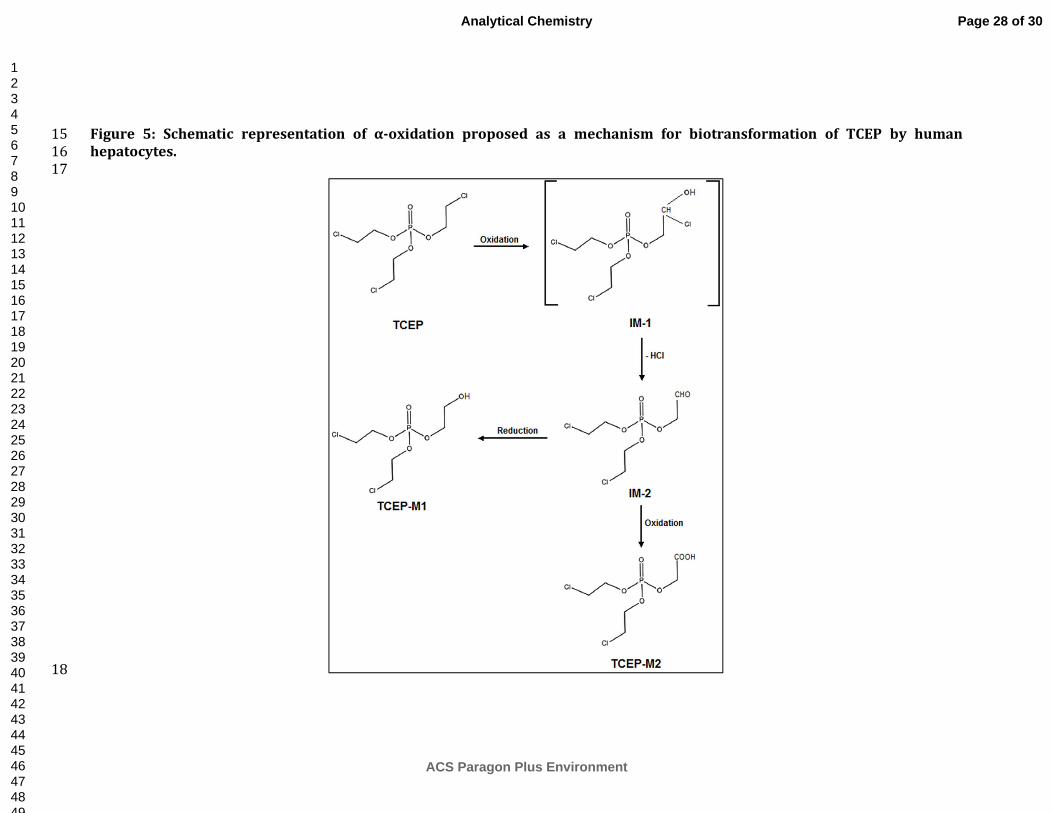
Figure 5: Schematic representation of α-oxidation proposed as a mechanism for biotransformation of TCEP by human 15
hepatocytes. 16
17
18
Page 28 of 30
ACS Paragon Plus Environment
Analytical Chemistry
123456789101112131415161718192021222324252627282930313233343536373839404142434445464748495051525354555657585960

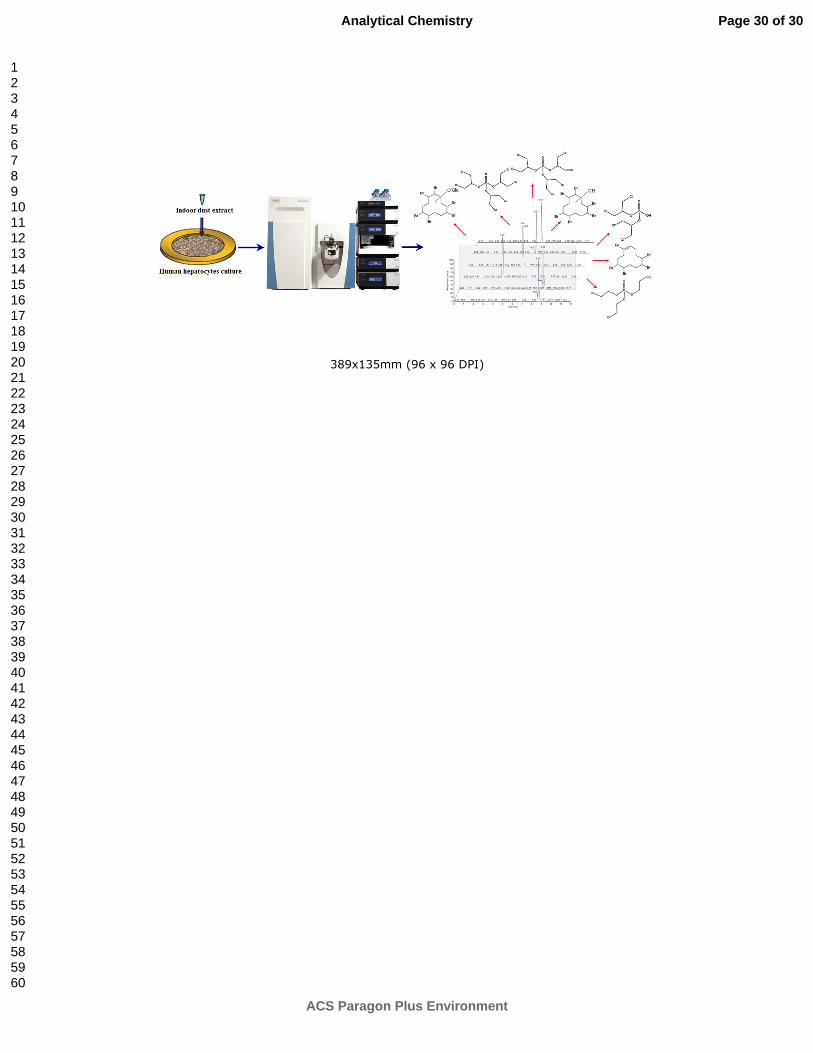
For TOC only. 19
20
21
Page 29 of 30
ACS Paragon Plus Environment
Analytical Chemistry
123456789101112131415161718192021222324252627282930313233343536373839404142434445464748495051525354555657585960
389x135mm (96 x 96 DPI)
Page 30 of 30
ACS Paragon Plus Environment
Analytical Chemistry
123456789101112131415161718192021222324252627282930313233343536373839404142434445464748495051525354555657585960