university of birmingham multi-point monitoring of cross
TRANSCRIPT

University of Birmingham
Multi-point monitoring of cross-linking reactionsMachavaram, Venkata Rajanikanth; Wang, Liwei; Pandita, Surya Darma; Hellmann,Sebastian; Bogonez, Francisco Nieves; Fernando, Gerard FranklynDOI:10.1002/app.41088
License:Creative Commons: Attribution (CC BY)
Document VersionPublisher's PDF, also known as Version of record
Citation for published version (Harvard):Machavaram, VR, Wang, L, Pandita, SD, Hellmann, S, Bogonez, FN & Fernando, GF 2014, 'Multi-pointmonitoring of cross-linking reactions', Journal of Applied Polymer Science, vol. 131, no. 22, 41088.https://doi.org/10.1002/app.41088
Link to publication on Research at Birmingham portal
Publisher Rights Statement:Eligibility for repository : checked 1/08/2014
General rightsUnless a licence is specified above, all rights (including copyright and moral rights) in this document are retained by the authors and/or thecopyright holders. The express permission of the copyright holder must be obtained for any use of this material other than for purposespermitted by law.
•Users may freely distribute the URL that is used to identify this publication.•Users may download and/or print one copy of the publication from the University of Birmingham research portal for the purpose of privatestudy or non-commercial research.•User may use extracts from the document in line with the concept of ‘fair dealing’ under the Copyright, Designs and Patents Act 1988 (?)•Users may not further distribute the material nor use it for the purposes of commercial gain.
Where a licence is displayed above, please note the terms and conditions of the licence govern your use of this document.
When citing, please reference the published version.
Take down policyWhile the University of Birmingham exercises care and attention in making items available there are rare occasions when an item has beenuploaded in error or has been deemed to be commercially or otherwise sensitive.
If you believe that this is the case for this document, please contact [email protected] providing details and we will remove access tothe work immediately and investigate.
Download date: 15. Jan. 2022

Multi-Point Monitoring of Cross-Linking Reactions
Venkata Rajanikanth Machavaram,* Liwei Wang,y Surya Darma Pandita, Sebastian Hellmann,Francisco Nieves Bogonez, Gerard Franklyn FernandoSchool of Metallurgy and Materials, University of Birmingham, Edgbaston, Birmingham B15 2TT, United Kingdom.*Present address: School of Electronics Engineering VIT University, Vellore- 632 014 Tamil Nadu, India.†Present address: Department of Chemistry and Chemical Engineering, Minjiang University, Fuzhou 350108, People’s Republic ofChina.Correspondence to: G. F. Fernando (E - mail: [email protected]).
ABSTRACT: The feasibility of deploying optical fiber sensors to obtain qualitative and quantitative information on the cross-linking
characteristics of thermosetting resin systems has been demonstrated by a number of researchers. This article is concerned with the
demonstration of a low-cost fiber-optic Fresnel sensor system for monitoring the cross-linking reactions at multiple locations. Cross-
linking reactions can be influenced by a number of parameters including the stoichiometry of the resin and hardener, and the heat-
transfer rates in and out of the preform as a function of the cross-section of the preform. In situations where there is a variation in
the thickness of the preform or when large components are processed, a facility to monitor the cross-linking reactions at multiple loca-
tions will be valuable because the rate and extent of the cross-linking can be inferred. In this article, six Fresnel sensors were immersed
in individual vials containing an epoxy/amine resin system and processed (cross-linked) in an air-circulating oven. One additional vial
with a Fresnel sensor immersed in the neat epoxy resin (no hardener) was co-located in the oven to enable the effect of temperature
to be monitored. The feasibility of using the multiplexed Fresnel sensors for cure monitoring was demonstrated successfully. The sen-
sors in the post-cross-linked samples were used to study the effects of heating and cooling cycles. The feasibility of detecting the glass
transition temperature using the Fresnel sensor is discussed along with the factors that give rise to variability in the output Fresnel sig-
nals. VC 2014 The Authors. Journal of Applied Polymer Science Published by Wiley Periodicals, Inc. J. Appl. Polym. Sci. 2014, 131, 41088.
KEYWORDS: cross-linking; resins; manufacturing; optical properties; thermosets
Received 5 December 2013; accepted 27 May 2014DOI: 10.1002/app.41088
INTRODUCTION
Thermosetting resins are used extensively as adhesives, coatings,
and matrices for fiber reinforced composites. In general, ther-
mosets consist of two primary components namely; the resin
and hardener.1 In a typical manufacturing operation, the resin
and hardener are weighed in the required stoichiometric ratio
and mixed thoroughly prior to use. Depending on the chemical
reactivity of the hardener, the cross-linking reaction can be ini-
tiated at room-temperature or by the application of heat. The
transformation of the mixed resin and hardener from a liquid
(or semi-solid) state to a highly cross-linked structure is com-
monly referred to as “curing”.
Generalized cross-linking reaction schemes between an epoxy
resin and an amine hardener are illustrated in Figures 1(a,b).1
Figure 1(a) illustrates the reaction between an epoxy and amine
functional group that leads to the formation of a covalent bond
between the two reagents, along with the formation of a hydroxyl
group. In addition, it is seen that the primary amine is converted
to a secondary amine. The secondary amine in turn can react
with another epoxy group with the formation of a tertiary amine
and another hydroxyl group; this is illustrated in Figure 1(b).
With reference to cross-linking of thermosets illustrated in Fig-
ures 1(a, b), the following additional comments can be made.
i. The resin and the hardener are generally mixed manually
prior to initiating the cross-linking reaction via the appli-
cation of heat. The issue here is the homogeneity of the
mixed resin system and the possibility of entrapped and
dissolved gasses. Hence, it is a common practice to de-gas
the mixed resin in a vacuum chamber prior to use. A facil-
ity to track the progression of the cross-linking reaction in
This is an open access article under the terms of the Creative Commons Attribution License, which permits use, distribution andreproduction in any medium, provided the original work is properly cited.
VC 2014 The Authors. Journal of Applied Polymer Science Published by Wiley Periodicals, Inc.
WWW.MATERIALSVIEWS.COM J. APPL. POLYM. SCI. 2014, DOI: 10.1002/APP.4108841088 (1 of 11)

real-time, against a previously determined profiles, will
offer a means for appropriate remedial action to be taken
in the event that a deviation is observed.
ii. The molecular weight of the resin system increases over
the course of the reaction in proportion to the cross-link
density. As a consequence, the density of the resin system
and the refractive index increase during the cross-linking
reactions. Therefore, there is significant interest in develop-
ing techniques to monitor the evolution of the molecular
weight and the refractive index in real-time.
iii. The ring-opening reactions are exothermic. Therefore, the
volume of the resin system used can have a major bearing
on the temperature attained within the reaction vessel; in
other words, the actual peak temperature experienced by
the resin can be significantly higher than the set or desired
isothermal condition. Hence, efficient thermal management
and accurate monitoring of the temperature is important if
data on the cross-linking kinetics are required.
iv. In a typical cure schedule, the resin system is heated from
ambient to the desired isothermal value and it is held at this
point for a specified time (dwell). The viscosity of the resin
system initially reduces as the temperature is increased from
ambient to the desired isothermal temperature. At some stage
during the temperature-ramp, the resin system starts to
cross-link and consequently, the viscosity and the refractive
index increase rapidly. This increase in the viscosity reaches a
point where the liquid resin system is converted to a gel; this
is generally referred to as the gel-point. The other important
stage in the processing of thermosets is vitrification; this is
the conversion of the gel to a glassy solid. Tools to identify
these transitions in the resin system during processing will
enable process optimization routines to be specified.
v. The formation of covalent bonds between the resin and
hardener leads to shrinkage in typical high-performance
thermosetting resins. The shrinkage stresses can be high
enough to cause debonding from the reinforcement or the
container/substrate. There is significant interest developing
technique to quantify the magnitude of the shrinkage asso-
ciated with thermosetting resin systems.
vi. During the heating phase of the mixed resin system and
the reinforcement, the constitutive components expand. It
is important to appreciate that the peak temperature expe-
rienced will be a function of the set isothermal value, the
thermal management and the magnitude of the exotherm.
At some stage in the cross-linking process, “bonding”
between the surface of the fiber reinforcement and the
matrix will occur and this may be a combination of chemi-
cally and/or mechanically induced processes. Cooling the
material from the processing temperature to ambient will
result in the generation of residual fabrication stresses.
Residual stresses can initiate debonding and cracking in
composites materials even without the application of
mechanical load. Furthermore, they can also lead to warp-
ing and loss of dimensional stability.
vii. The glass transition temperature of the cross-linked resin
system represents a second-order thermodynamic transition
where the properties such as the heat capacity, thermal
expansion, and the stiffness undergo reversible changes
over a specified temperature range. Therefore, there is sig-
nificant merit in developing techniques to monitor the
occurrence of the glass transition temperature.
With reference to the above-mentioned issues, the ability to
monitor progression of the cross-linking reaction at multiple
points in the preform may be necessary in some instances. For
example, in situations where the cross-section of the preform
changes or when thick laminated preforms are being processed.
A number of the above-mentioned topics and parameters can
be accessed and/or monitored using optical fiber-based sensor
systems.1
For example, extrinsic2 and intrinsic3 fiber Fabry-Perot inter-
ferometric sensors have been used for in situ strain monitoring.
The extrinsic fiber Fabry-Perot interferometric sensor has also
been adapted for monitoring temperature.4,5 Intensity-based
optical fiber sensors have been used for logging strain.6 Fiber
Bragg gratings continue to be used extensively for monitoring
strain and temperature during the processing of fiber reinforced
composites.7,8 The feasibility of using combined strain and tem-
perature monitoring via optical fibers has also been demon-
strated.9 Long-period gratings have been used for cure
monitoring.10 More recently, the feasibility of monitoring multi-
ple parameters (strain, temperature, refractive index, and cross-
Figure 1. General reaction schemes for epoxy and amine-based reactions: (a) primary amine-epoxy addition; and (b) secondary amine-epoxy addition.
ARTICLE WILEYONLINELIBRARY.COM/APP
WWW.MATERIALSVIEWS.COM J. APPL. POLYM. SCI. 2014, DOI: 10.1002/APP.4108841088 (2 of 11)

linking) using a single sensor and interrogation system was
demonstrated.11 Sensor designs for the quantitative monitoring
of the relative concentrations of specified functional groups are
predominantly based on transmission and reflection and evanes-
cent wave near-infrared spectroscopy.12,13
As this article is concerned with Fresnel sensors, the following
section provides a brief review of this intensity-based sensor
design.
Fresnel Reflection Sensors
Fresnel sensors are essentially based on the measurement of
light reflected at the interface of two dielectric media owing to
the discontinuity in the refractive index. A schematic illustration
of the Fresnel reflection sensor is presented in Figure 2 where
the cleaved fiber-end is shown to be surrounded in the resin
system. The reflection at normal incidence is also indicated.
Light undergoing Fresnel reflection is governed by the refractive
index contrast between the core of the optical fiber and the
medium surrounding the cleaved-end. When light illuminates
the interface of two dielectric media of refractive indices n1 and
n2 at an angle of incidence of h1, the coefficients of the reflected
field amplitudes parallel (r||) and perpendicular (r?) to the
plane of incidence can be expressed using the Fresnel
equations14:
r?5n1cos h12n2cos h2
n1cos h11n2cos h2
; rll5n2cos h12n1cos h2
n2cos h11n1cos h2
(1)
where h2 is the angle of refraction into the second medium.
During normal incidence (h15h250), the magnitudes of
the field amplitudes are retained and the reflectivity “R” at the
interface can be expressed as:
R5n12n2
n11n2
� �2
(2)
Optical fiber-based Fresnel reflection sensors have been used to
track the changes in the refractive index of thermosetting resin
systems during cross-linking.15–18 For example, Crosby et al.
reported on an optical fiber-based refractometer for monitoring
the cross-linking of an epoxy/amine resin system.19 The reflec-
tion from the cleaved-end of the fiber was calibrated using ref-
erence refractive index liquids. The response of the Fresnel
reflection sensor showed a good correlation with the quantita-
tive cross-linking kinetic data obtained using a conventional
Fourier transform near-infrared spectrometer. Liu et al. reported
on a multipoint cure monitoring system that employed Fresnel
reflection sensors in conjunction with optical time domain
reflectometry.20 The degree of conversions calculated from the
calibrated Fresnel sensors were found to be in good agreement
with data obtained from a differential scanning calorimeter
(DSC). Huang et al. demonstrated a parallel multipoint Fresnel-
based temperature sensor.21 Chen et al. used the same sensor
design concept to monitor the temperature and liquid
concentration.22,23
Cusano et al. demonstrated a Fresnel reflection sensor using a
modulated light source and a lock-in amplifier.24 The degree of
conversion obtained via the sensor was said to correlate with
the DSC data.
It is generally accepted that intensity-based sensing techniques
can suffer from fluctuations in the light source. This issue was
addressed by Chang et al.25 and Kim and Su.26 They used a 2 3
2 fiber coupler with a splitting ratio of 50 : 50, where one of
the output arms (one of the cleaved fiber-ends) served as the
sensing element and the other was spliced to a fiber spool and
this cleaved-end served as a reference element. A pulse generator
was used to modulate the laser source. The sensing arm of the
coupler was placed in the liquid of interest whilst the other lon-
ger section of the reference arm was left in air. The reflected
light from the cleaved fiber-ends were detected by a de-coupled
detector. As the light source was modulated and because the
lengths of the sensing and reference arms of the coupler were
significantly different, it was possible for the two signals to be
separated temporally. The dual-coupler-based sensor interroga-
tion design of Buggy et al. enabled monitoring of the refractive
index during the cure reaction of epoxy resin via UV-light irra-
diation.27 The reflection from air served as the reference. Gior-
dano et al. demonstrated an optical fiber sensing system for the
simultaneous measurement of refractive index via Fresnel reflec-
tion, and strain via a fiber Bragg grating.28 More recently,
Mahendran et al. demonstrated a multifunctional sensor system
where a conventional fiber-coupled FTIR near-infrared spec-
trometer was used to monitor four independent parameters
simultaneously: strain, temperature, refractive index, and cross-
linking kinetics of an epoxy/amine resin system.29 Fiber-optic
Fresnel sensors have also been used for cure monitoring of ther-
moset resins containing fillers30 and during resin infusion.31
With reference to the routine manufacture of fiber reinforced
composites in industry, in general, the same resin system is
used over long periods for a given product range. This may be
because of end-user specifications or to comply with certifica-
tion requirements. In such circumstances, once the resin system
has been characterized thoroughly in terms of its mechanical,
thermal, optical, and chemical properties, on-line quality assess-
ment can be provided by intensity-based sensor systems. Multi-
point monitoring during processing can provide valuable
information on the relative rates of reactions at specified loca-
tions within large preform or where there is a change in the
cross-section. The advantage of intensity-based sensors is that
they offer a low-cost option to infer the relative rates of reac-
tions of thermosetting resin systems. As the sensors are embed-
ded in the composites, they can be used in-service to monitor
Figure 2. Schematic illustration of the Fresnel reflection at the cleaved-
end of an optical fiber that is surrounded by the resin system. (i) Input
light. (ii) Cladding. (iii) Core. (iv) Reflected light. (v) Fresnel reflection at
the core/resin interface. (vi) Transmitted light. (vii) Resin system. [Color
figure can be viewed in the online issue, which is available at wileyonline-
library.com.]
ARTICLE WILEYONLINELIBRARY.COM/APP
WWW.MATERIALSVIEWS.COM J. APPL. POLYM. SCI. 2014, DOI: 10.1002/APP.4108841088 (3 of 11)
parameters that influence the refractive index of the cross-linked
resin. For example, temperature and ingress and egress of fluids.
The majority of the previous publications on the use of the
Fresnel reflection sensor have been associated with primarily
single sensors. With reference to the limited previous publica-
tions on multiplexed Fresnel reflection sensor designs, the
device reported in the current publication is significantly sim-
pler because it merely involves cleaved optical fibers. The
rationale for the current work was to study the cross-linking
behavior of a thermosetting resin system using a low-cost multi-
plexed Fresnel reflection sensor system. The evolution of the
refractive index and the output from multiple Fresnel reflection
sensors during the processing of an epoxy/amine resin system
was monitored and analyzed in detail.
EXPERIMENTAL
Fresnel Sensor
The Fresnel sensors were manufactured from single-mode SMF-
28 (Corning) fiber. These sensors were prepared by stripping
the polymer buffer (protective coating) and cleaving the fibers
using a conventional optical fiber cleaver. The cleaved-ends were
cleaned with a lint-free tissue soaked in isopropanol and then
dried and examined under a microscope to verify that the
cleaved-end was perpendicular.
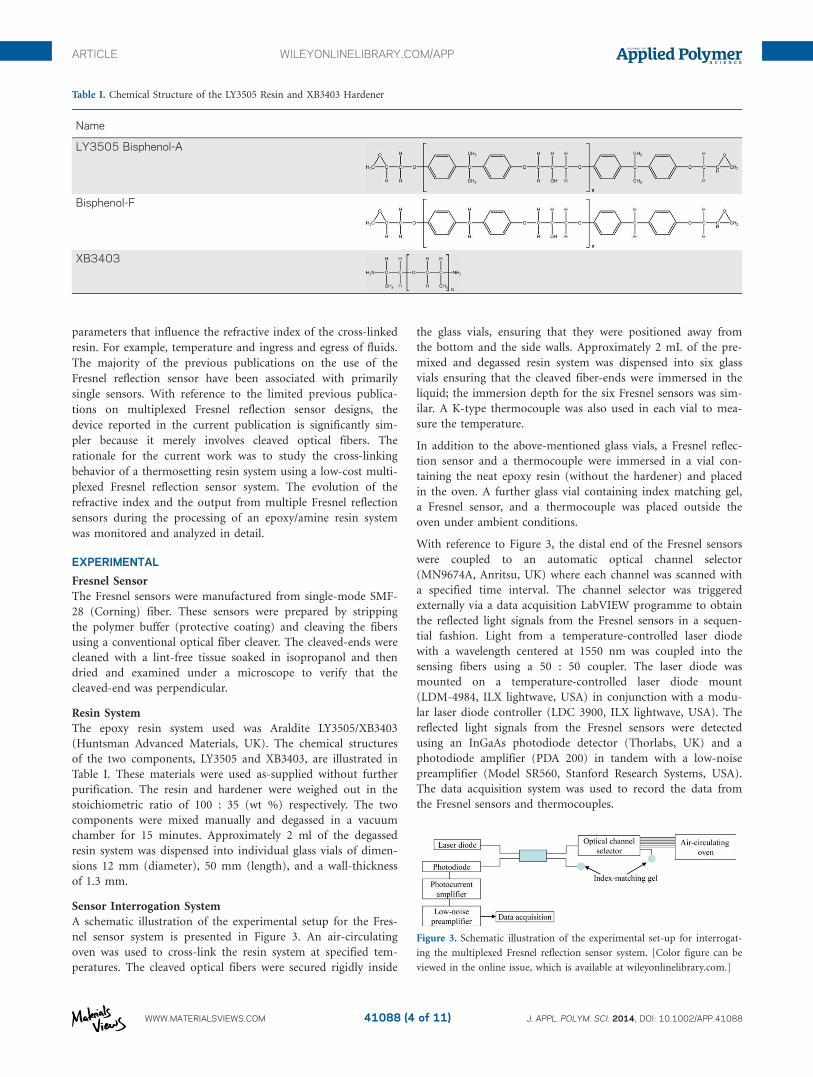
Resin System
The epoxy resin system used was Araldite LY3505/XB3403
(Huntsman Advanced Materials, UK). The chemical structures
of the two components, LY3505 and XB3403, are illustrated in
Table I. These materials were used as-supplied without further
purification. The resin and hardener were weighed out in the
stoichiometric ratio of 100 : 35 (wt %) respectively. The two
components were mixed manually and degassed in a vacuum
chamber for 15 minutes. Approximately 2 ml of the degassed
resin system was dispensed into individual glass vials of dimen-
sions 12 mm (diameter), 50 mm (length), and a wall-thickness
of 1.3 mm.
Sensor Interrogation System
A schematic illustration of the experimental setup for the Fres-
nel sensor system is presented in Figure 3. An air-circulating
oven was used to cross-link the resin system at specified tem-
peratures. The cleaved optical fibers were secured rigidly inside
the glass vials, ensuring that they were positioned away from
the bottom and the side walls. Approximately 2 mL of the pre-
mixed and degassed resin system was dispensed into six glass
vials ensuring that the cleaved fiber-ends were immersed in the
liquid; the immersion depth for the six Fresnel sensors was sim-
ilar. A K-type thermocouple was also used in each vial to mea-
sure the temperature.
In addition to the above-mentioned glass vials, a Fresnel reflec-
tion sensor and a thermocouple were immersed in a vial con-
taining the neat epoxy resin (without the hardener) and placed
in the oven. A further glass vial containing index matching gel,
a Fresnel sensor, and a thermocouple was placed outside the
oven under ambient conditions.
With reference to Figure 3, the distal end of the Fresnel sensors
were coupled to an automatic optical channel selector
(MN9674A, Anritsu, UK) where each channel was scanned with
a specified time interval. The channel selector was triggered
externally via a data acquisition LabVIEW programme to obtain
the reflected light signals from the Fresnel sensors in a sequen-
tial fashion. Light from a temperature-controlled laser diode
with a wavelength centered at 1550 nm was coupled into the
sensing fibers using a 50 : 50 coupler. The laser diode was
mounted on a temperature-controlled laser diode mount
(LDM-4984, ILX lightwave, USA) in conjunction with a modu-
lar laser diode controller (LDC 3900, ILX lightwave, USA). The
reflected light signals from the Fresnel sensors were detected
using an InGaAs photodiode detector (Thorlabs, UK) and a
photodiode amplifier (PDA 200) in tandem with a low-noise
preamplifier (Model SR560, Stanford Research Systems, USA).
The data acquisition system was used to record the data from
the Fresnel sensors and thermocouples.
Table I. Chemical Structure of the LY3505 Resin and XB3403 Hardener
Name
LY3505 Bisphenol-A
Bisphenol-F
XB3403
Figure 3. Schematic illustration of the experimental set-up for interrogat-
ing the multiplexed Fresnel reflection sensor system. [Color figure can be
viewed in the online issue, which is available at wileyonlinelibrary.com.]
ARTICLE WILEYONLINELIBRARY.COM/APP
WWW.MATERIALSVIEWS.COM J. APPL. POLYM. SCI. 2014, DOI: 10.1002/APP.4108841088 (4 of 11)

RESULTS AND DISCUSSION
Fresnel Reflection Sensor
The responses of the six individual Fresnel reflection sensors in
the glass vials and the corresponding temperature data from the
thermocouples during cross-linking in the oven are presented in
Figures 4(a,b).
With reference to Figures 4(a), the cross-linking process was
monitored through channels 2–7 of the optical channel selector.
Channel 1 was used to monitor a Fresnel sensor that was
immersed in index-matching gel but located outside the oven
under ambient conditions. Channel 8 was used to monitor the
Fresnel signal emanating from a cleaved optical fiber that was
immersed in neat epoxy resin (no hardener), and located in the
oven along with the other vials containing the mixed epoxy/
amine resin. The response of each of the Fresnel sensors was
normalized to its respective signal when the temperature of the
oven was between 23�C and 24�C.
The outputs from each of the Fresnel sensors and the corre-
sponding temperature of the resin system in the vials were
recorded simultaneously. The sequential switching of the array
of Fresnel sensors via the optical switching unit was carried out
automatically at an interval of 16 seconds.
The following section presents a discussion on the general
trends observed in Figures 4(a,b).
i. Magnitude of the exotherm: The magnitude of the exo-
therm recorded by the thermocouples is around 85–95�C;
the set (desired) dwell temperature was 70�C. There are
three possible reasons for this. Firstly, as the experiments
were carried out in an air-circulating oven, it was not pos-
sible to compensate for the exotherm by cooling the con-
tainer to maintain isothermal conditions. Secondly, the
glass vials were placed on a PTFE block with holes drilled
to accommodate the samples. Hence, the heat dissipation,
originating from the exothermic cross-linking reactions,
was not ideal. Finally, the magnitude of the exotherm is
proportional to the volume of the resin used. In the current
series of experiments, approximately 2 mL of the mixed
resin system was dispensed manually via a syringe. How-
ever, the actual volume of the resin dispensed per vial may
have varied slightly. The magnitude and the duration of the
exotherm are important because it can influence the rate
and the extent of the cross-linking reactions, and hence, the
resultant properties of the thermosetting resin [32].
ii. Magnitude of the Fresnel signal: The general trends in the
outputs from the Fresnel sensors deployed in different vials
containing resin system are similar. However, the magni-
tude of the reflected Fresnel signal is slightly different and
this may be because of one or more of the following rea-
sons: (a) approximately 5 m of fiber was used per sensor
(distance between the glass vial containing the resin in the
oven and the interrogation unit). Bend-induced losses along
the fiber path and losses at the fusion splices may account
in part to the observed small differences in the magnitude
of the Fresnel signals; (b) the optical losses across the chan-
nels in the switching unit were quantified and the variation
was found to be in the range of 2–10%; (c) the quality of
the cleaved optical fiber is unlikely to be a contributing fac-
tor because each sensor was inspected prior to use. How-
ever, the possibility of localized variations in the
homogeneity of the resin system, in the vicinity of the core
of the cleaved optical fiber (9 mm), cannot be ruled out.
The channel selector used in this work has a switching
reproducibility of 0.02 dB or less at a constant temperature
(manufacturer’s data) within the operable temperature
range of 0–50�C. The variation in the temperature in the
laboratory, over the duration of the cross-linking experi-
ments (12 hours), was 20–24�C. The variation in the out-
put signal from channel 1 (Fresnel sensor immersed in the
index matching gel but located outside the oven) over the
duration of the experiment was less than 1%.
iii. Correlation between the Fresnel reflection signal, tempera-
ture, and cross-linking: Close inspection of the data [see
Figure 4(b)] during the first 20 minutes after the onset of
heating shows that the Fresnel signal dropped by �12–20%;
this is because the density of the resin system decreases as
Figure 4. (a) Response of the six independent Fresnel reflection sensors
and the corresponding temperature data from the thermocouples during
cross-linking and cooling of the resin system in the oven. (b) Expanded
view of Figure 4(a). [Color figure can be viewed in the online issue, which
is available at wileyonlinelibrary.com.]
ARTICLE WILEYONLINELIBRARY.COM/APP
WWW.MATERIALSVIEWS.COM J. APPL. POLYM. SCI. 2014, DOI: 10.1002/APP.4108841088 (5 of 11)

it is heated because of thermal expansion.32,33 In the
absence of chemical reactions, degradation, or volatility of
the constituent components in the resin, it can be assumed
that the refractive index will decrease with increasing tem-
perature. The refractive index is defined as the ratio of the
velocity of light in a vacuum to that in the medium (resin
system). With reference to Figure 4(b), the normalized
refractive index decreases initially with heating because of
the decrease in the density and the concomitant increase in
the volume. As the temperature is increased further, at
some point the cross-linking reactions proceed at an appre-
ciable rate. In other words, as far as the refractive index of
the resin system is concerned, two competing effects have
to be considered: firstly, the density decreases in the initial
heating period and then secondly, as evident in Figure 4(b),
it increases as cross-linking reactions predominate.34–36
However, as mentioned previously, the cross-linking reac-
tions are exothermic and if isothermal conditions are not
maintained, this temperature excursion will accelerate the
rate of consumption of the reactive functional groups. This
is generally referred to as the auto-acceleration of cross-
linking reactions [37]. Therefore, it is not straightforward
to decouple these various factors with regard to their
respective contribution to the magnitude of the Fresnel
reflection signal during the initial stages of the cross-linking
reactions. This issue is discussed further when considering
Figure 5.
iv. The dip in the temperature and the effect on Fresnel signals
after �40 minutes: As the maximum temperature that was
reached during the exotherm was approximately 95�C(25�C above the set temperature), the oven door was
opened briefly to verify visually that the resin had not
degraded. This accounts for the decrease in the recorded
temperature to below the set value of 70�C; when the oven
door was closed, the temperate equilibrated back to 70�C.
A corresponding increase in the Fresnel reflection signal
was observed when the temperature was lowered followed
by an increase to an equilibrium value. After approximately
420 minutes, the Fresnel signals in the epoxy/amine vials
had increased by �17–30% when compared to their respec-
tive values prior to heating. After this period, the oven was
switched off and allowed to cool; after 440 minutes
(�60�C), the oven door was opened to accelerate the cool-
ing of samples to ambient temperature.
In order to analyze the output from the sensors in detail, only
the data for the Fresnel reflection signal as a function of tem-
perature for the epoxy/amine resin system (channel 3) and the
neat epoxy without the amine hardener (channel 8) are pre-
sented in Figure 5. Horizontal lines (A, B and C) have been
superimposed on Figure 5 to indicate the magnitudes of the
temperature and the normalized Fresnel reflection data; the ver-
tical lines (D–G) have been superimposed to indicate the speci-
fied time during processing.
It is apparent from Figure 5 that the temperature profile for the
neat epoxy resin as a function of time shows an inverse rela-
tionship with the Fresnel signal. In other words, as the tempera-
ture is increased, the Fresnel signal decreases proportionally and
vice versa; thus, the time taken for an equilibrium value to be
reached for the temperature and the Fresnel signal is similar.
The effect of opening the oven door is once again apparent in
the Fresnel reflected signal where an increase is observed as the
temperature is lowered.
With reference to Figure 5, the temperatures recorded by the
two thermocouples (line A) for the neat epoxy and the epoxy/
amine resin system show that an equilibrium value of �70�Cwas attained after approximately 60 minutes (line F). The Fres-
nel signal for the neat epoxy is also seen to equilibrate at 70�Cafter 60 minutes. However, this was not the case for the Fresnel
signal for the epoxy/amine resin system where an equilibrium
value was attained after approximately 140 minutes (line G).
The observed differences may be attributed to the following: (a)
The magnitude of the exotherm where the peak temperature
recorded by the thermocouple for the amine/epoxy resin system
was 94.2�C; here the rapid increase in the temperature would
have accelerated the formation of the cross-link networks. As
the temperature was relatively constant after approximately 60
minutes, the gradual increase in the Fresnel signal can be attrib-
uted to the gradual increase in the cross-link density, in the
diffusion-controlled phase of the cross-linking reactions, until
cessation after approximately 140 minutes. (b) The temperature
of the oven was lowered to approximately 65�C when the oven
door was opened to inspect the samples as mentioned
previously.
With reference to time-line (D) for the epoxy/amine resin, it is
seen that the time for the peak temperature recorded by the
thermocouple does not coincide with the minimum value for
the Fresnel reflection signal. As, the synchronization between
the thermocouples and the Fresnel data are reliable, the follow-
ing explanation is proposed: In the case of the epoxy/amine
resin system, as it is heated, the refractive index decreases. How-
ever, above a certain temperature range, the cross-linking reac-
tions commence, and the reaction rate increases as a function
of temperature. Thus, initially, the heating phase dominates the
decrease in the refractive index and then the cross-linking
Figure 5. Comparison of the relative outputs from the Fresnel reflection
sensors and thermocouples for the neat epoxy resin (channel 8) and the
cross-linking reactions (channel 3) involving the epoxy/amine resin sys-
tem. [Color figure can be viewed in the online issue, which is available at
wileyonlinelibrary.com.]
ARTICLE WILEYONLINELIBRARY.COM/APP
WWW.MATERIALSVIEWS.COM J. APPL. POLYM. SCI. 2014, DOI: 10.1002/APP.4108841088 (6 of 11)

reactions dominate. In situations where a large exotherm is
observed, unlike the case where isothermal conditions prevail, it
will be difficult to decouple the contribution of temperature
and cross-link density to the refractive index.
On inspecting the thermocouple data for the neat epoxy and
the epoxy/amine resin system, it can be observed that the two
samples experience the same heating rate until about 55�C; as
the temperature of the oven was preset to attain 70�C, the
temperature-controller reduces the rate of power input to the
heaters to prevent over-shooting the set temperature. This
reduction in the rate of heating within the oven is also seen in
the Fresnel reflection data from the neat epoxy resin. As men-
tioned previously, the effect of opening the oven door is also
evident in the Fresnel data for the neat resin. After the oven
door was closed, the temperature within the neat epoxy sample
rose steadily (period between lines E and F) until the set tem-
perature was reached.
Postcure Thermal Cycling
The cured resins and the neat epoxy (no amine hardener) sam-
ples were subjected to three sequential heating and cooling
regimes, and the responses of the Fresnel sensors and the ther-
mocouples were recorded. During the first two cycles, the oven
was heated from ambient to 70�C and cooled back to room
temperature with the oven door closed. After the third heating/
cooling cycle, the samples were heated to 78�C and held for 1–2
minutes and then ramped to approximately 84�C to dwell for
�30 minutes. Subsequently, it was ramped to 94�C after which
the power to the oven was switched off and allowed to cool nat-
urally with the oven door closed.
The output data for the Fresnel sensors for the epoxy/amine
resin system and the corresponding thermocouples are pre-
sented in Figure 6.
In Figure 6, consideration is given initially to the thermocouple
data where linear regression lines have been superimposed on
the linear portions of the heating (A1–A4) and cooling (B1–B3)
regimes; the criterion for performing the linear regression was
to obtain the rates of heating and cooling. The coefficient of
determination (R2) was 0.99. A summary of the slopes for the
temperature channel 3 is presented in Table II where it can be
seen that slopes A1 and A2 are similar. However, the rate for
A3 is relatively higher and is probably because of the higher set
temperature. The slope for A4 is lower because the set tempera-
ture of 94�C is relatively close to the preceding dwell tempera-
ture of 84�C. The same conclusion can be reached for the
cooling rates (slopes B1–B3) from Table II.
As stated previously, the temperature controller adjusts the heat-
ing rate at approximately 25�C below the set isothermal temper-
ature. This is evident on inspecting the slopes and the data
from the thermocouples for the first and second temperature
cycles. The heating regime for the third cycle, which accounts
for the short dwell of 1–2 minutes at 78�C followed by a 30
minute dwell at 84�C, shows the modulations imposed by the
temperature controller. The third heating regime was used to
investigate if: (i) any additional cross-linking had taken place;
and (ii) the glass transition temperature (Tg) could be detected
by the Fresnel sensors.
On inspecting the Fresnel data in Figure 6, the overall trends for
channels 2–8 look similar but some anomalies are apparent. For
example, (i) Figure 7(a) (expanded view of Figure 6) shows an
uncharacteristic fluctuation in the data are observed for channel
6 within the region “A”. As the resin in the vial was already
cross-linked, the anomaly may have been caused by some unin-
tentional perturbation of the optical fiber connectors that were
located outside the oven. Moreover, this feature in channel 6 is
not observed in the two subsequent heating and cooling cycles.
However, three further possible contributing reasons for the
anomaly need to be considered. Firstly, considering the situation
prior to cross-linking but during the first heating regime (to
cross-link the resin), the coefficient of thermal expansion of the
liquid epoxy/amine resin is higher than that of the optical fiber.
This difference in the thermal expansion is “locked” when the
resin cross-links to an infusible solid. When the assembly is
cooled to room temperature, residual stresses will develop. Hence,
during the cooling cycle, debonding between the optical fiber
and the matrix can occur. This may not be a repeatable process
because it will also depend on the magnitude of interfacial bond
strength. Secondly, it is also worth noting that the resin shrinks
as it cross-links and this too will contribute to the magnitude of
the residual stresses. Finally, the Tg needs to be considered when
the postcured resin is subjected to further heating. If the heating
regime transgresses the Tg of the cross-linked polymer, properties
such as the heat capacity, specific volume, and stiffness undergo
a reversible change.34,38,39 The unfortunate complication in the
current experiment is the fact that the Tg is in the same tempera-
ture range over which the temperature controller on the oven
adjusts the power input as the preset isothermal temperature is
approached. (ii) Channels 3, 5, and 7 show a distinct inflection
region over the period marked “A”.
Figure 7(b) shows an expanded view of the second postcure
heating cycle. The anomaly observed previously for channel 6 is
Figure 6. Postcure thermal cycling and the responses of the Fresnel sen-
sors for the cured epoxy/amine resin system and the corresponding data
from the thermocouples. [Color figure can be viewed in the online issue,
which is available at wileyonlinelibrary.com.]
ARTICLE WILEYONLINELIBRARY.COM/APP
WWW.MATERIALSVIEWS.COM J. APPL. POLYM. SCI. 2014, DOI: 10.1002/APP.4108841088 (7 of 11)

not apparent but the inflection point is present for channel 5
within zone-A.
An expanded view of the third heating and cooling cycle is pre-
sented in Figure 7(c) where three time zones of interest (A, B,
and C) have been highlighted. Zones A and B show the inflec-
tion points mentioned previously. The third heating cycle
involved ramping the samples from room temperature to 78�C
with a short dwell of 1–2 minutes and then a temperature ramp
to 84�C with a dwell for �30 minutes; this is clearly observable
in the Fresnel and thermocouple data in zone B. An expanded
section of zone-A is presented in Figure 7(d) where the inflec-
tion points are clearly visible.
With regard to the cooling curves for channels 2–7 [zone C of
Figure 7(c)], the trends for the Fresnel sensors seem to reflect
the temperature profile inside the oven. In other words, the
inflection regions are not detected for any of the samples.
The final part of this discussion is concerned with the relative
outputs from the neat epoxy sample (channel 8) and one of the
cured samples that was subjected to three heating/cooling cycles
(channel 3). The Fresnel sensor and thermocouple data from
channels 3 and 8 is presented in Figure 8. The trends in the
thermocouple data were discussed previously; therefore the cur-
rent discussion is focused on the Fresnel sensor outputs for
these two datasets.
Table II. Heating and Cooling Rates from Figure 6 for the Cured Resin
(CH 3) During the Post-Cure Heating/Cooling Regimes
Slopes for specified regression lines
Heating Rate A1 A2 A3 A4
(�C minute21) 3.51 3.00 3.72 0.77
Cooling Rate B1 B2 B3 –
(�C minute21) 22.89 22.23 22.20 –
Figure 7. (a) An expanded view of Figure 6 showing the first postcured heating and cooling cycle. (b) An expanded view of the second heating and cool-
ing cycle for the postcured resins where the temperature and Fresnel reflection data are presented. (c) An expanded view of Figure 6 where the third
heating and cooling cycle is shown for the Fresnel sensor and thermocouple data. (d) A magnified view of Figure 6 illustrating the inflection points in
the Fresnel sensor data during the third heating cycle. [Color figure can be viewed in the online issue, which is available at wileyonlinelibrary.com.]
ARTICLE WILEYONLINELIBRARY.COM/APP
WWW.MATERIALSVIEWS.COM J. APPL. POLYM. SCI. 2014, DOI: 10.1002/APP.4108841088 (8 of 11)

With reference to the neat epoxy Fresnel sensor data presented
in Figure 8, linear regression lines (A1–A3) were calculated as
described previously for the three sequential heating cycles. A
summary of the slopes for these regression lines is presented
in Table III; it is apparent that the slopes are similar and the
deviation from linearity starts at about �50�C for the first two
cycles and approximately 55�C for the third cycle. The charac-
teristics of the Fresnel signals (B1–B3) during the cooling
phase of the neat resin also show a similar dependence on
temperature. In this instance, deviation from linearity is
observed at approximately 45�C for the three cooling cycles;
this corresponds to the time when the oven was switched off
and permitted to cool.
The corresponding Fresnel sensor output for the cured epoxy/
amine sample during heating (C1–C3) show a similar depend-
ency on temperature. However, in the case of the third heating
cycle (where the sample was heated from ambient to 80�C), a
distinct change in the slope is observed. This is concurrent with
the trends observed for the neat epoxy sample. The trends dur-
ing the cooling phase are represented by lines (D1-D3). A linear
behavior is observed from 93�C to 65�C; the change in slope
for the cured resin after 65�C is mirrored in that observed for
the temperature profile and the neat epoxy resin.
A further analysis of Figure 8 is presented in Figures 9(a and b)
representing the time derivatives of normalized Fresnel reflec-
tion (NFR) and the corresponding temperature for channels 8
(neat resin) and 3 (epoxy/amine cure) respectively. It is readily
apparent from Figure 9(a), that the plots of the derivatives of
NFR and temperature show mirror-image-like trends for the
neat epoxy. In Figure 9(a), the perturbation observed in the
Fresnel signal may have been because of mechanically induced
perturbations caused by opening/closing of the door of the
oven. Figure 9(b) shows the time-derivative data for channel 3
(epoxy/amine resin system). Peak-splitting is seen in the time-
derivative of the NFR data as the cross-linked resin is heated to
the set temperature. As this feature was not observed in for the
neat epoxy resin, it is concluded that the peak-splitting may be
a manifestation of Tg the resin system. The Tg obtained via a
differential scanning calorimeter is generally defined as the mid-
Figure 8. Responses of Fresnel sensors for the cured epoxy/amine resin
(channel 3) and the neat epoxy resin (channel 8). The data from the cor-
responding thermocouples from each vial are also presented. [Color figure
can be viewed in the online issue, which is available at wileyonlinelibrary.
com.]
Table III. Slopes of the Fresnel Signals from Channels 3 and 8 during the Post-Cure Thermal Cycles as Shown in Figure 8
Slopes for specified regression lines
Fresnel signal (Neat resin – CH8) A1 A2 A3 B1 B2 B3
20.0169 20.0140 20.0184 0.0046 0.0085 0.0130
Fresnel signal (Cured resin – CH3) C1 C2 C3 D1 D2 D3
20.0064 20.0051 20.0055 0.0030 0.0055 0.0123
Figure 9. (a) Time derivatives from Figure 8 for the NFR and temperature
data for channel 8 (neat resin). (b) Time derivatives from Figure 8 for the
NFR and temperature data for channel 3 (cross-linked resin).
ARTICLE WILEYONLINELIBRARY.COM/APP
WWW.MATERIALSVIEWS.COM J. APPL. POLYM. SCI. 2014, DOI: 10.1002/APP.4108841088 (9 of 11)

point of the inflection in the thermogram. With the current
resin system, the Tg was measured to be in the region of 75�C.
It is worth noting that the glass transition is a second-order
transition (Tg) and its value will depend on the technique
(dynamic mechanical thermal analysis, differential thermal anal-
ysis, torsional braid, etc) that is used to obtain it.32–39
CONCLUSIONS
In this study, six independent Fresnel sensors were immersed in
vials containing an epoxy/amine resin system and cross-linked
in an oven. A thermocouple was also co-located in the vials to
monitor the temperature. Two additional sensors were also
used: one was immersed in a neat epoxy sample (no hardener)
which was placed alongside the six epoxy/amine specimens, and
the other was immersed in an index-matched gel and placed
outside the oven. After cross-linking, the cured specimens and
the vial containing the neat epoxy resin were subjected to three
successive heating and cooling regimes.
The following conclusions were reached: (i) multiple Fresnel
sensors can be used in tandem with an optical switching unit to
track the cross-linking process at specified locations; (ii) the
Fresnel sensor is sensitive to temperature; (iii) under isothermal
conditions, it is possible to infer the cross-linking rate and
when an equilibrium value is attained. However, it is necessary
to bear in mind that the exotherm can complicate the interpre-
tation of the Fresnel signal if the temperature is not monitored
independently; (iv) the Fresnel sensors can be used after curing
to study the effects of heating and cooling; (v) the derivative of
the NFR for the epoxy/amine resin system showed peak-
splitting during the heating cycle, this may be indicative of the
glass transition temperature.
ACKNOWLEDGMENTS
The authors wish to acknowledge financial support from the
EPSRC (TS/G000387/1) and the Technology Strategy Board, Proj-
ects AB134K and BD072K. The support given by the industrial
partners (Pultrex, PPG, CTM, Bruker Optics, Mould Life, Luxfer
Gas Cylinders, Halyard, and Huntsman Polyurethanes) is duly
acknowledged. GF and VRM acknowledge the financial support
provided by the Royal Society. VRM acknowledges the assistance
given by Drs R.S. Mahendran, M.S. Irfan, and D. Harris for speci-
fied aspects of the experimental work. The authors wish to
acknowledge the technical assistance provided by Professor Brian
Ralph, Mark Paget, and Frank Biddlestone.
REFERENCES
1. Fernando, G. F.; Degamber, B. Int. Mater. Rev. 2006, 51, 65.
2. Liu, T.; Brooks, D.; Martin, A.; Badcock, R. A.; Ralph, B.;
Fernando, G. F. Smart Mater. Struct. 1997, 6, 464.
3. Machavaram, V. R.; Badcock, R. A.; Fernando, G. F. Sens.
Actuators A Phys. 2007, 138, 248.
4. Doyle, C.; Martin, A.; Liu, T.; Hayes, S.; Crosby, P. A.;
Brooks, D.; Badcock, R. A.; Fernando, G. F. Smart Mater.
Struct. 1998, 7, 145.
5. Degamber, B.; Tetlow, J.; Fernando, G. F. J. Appl. Polym. Sci.
2004, 94, 83.
6. Martin, A.; Badcock, R. A.; Nightingale, C.; Fernando, G. F.
IEEE Photonics Technol. Lett., 1997, 9, 982.
7. Sorensen, L.; Gmur, T.; Botsis, J. Composite A 2006, 37, 270.
8. Tanaka, N.; Okabe, Y.; Takeda, N. Smart Mater. Struct. 2003,
12, 940.
9. Liu, T.; Wu, M.; Fernando, G. F.; Rao, Y. J.; Jackson, D.
A.; Zhang, L.; Bennion, I. Smart Mater. Struct. 1998, 7,
550.
10. James, S. W.; Ralph, P. T. Meas. Sci. Technol. 2003, 14, 49.
11. Mahendran, R. S.; Machavaram, V. R.; Wang, L.; Burns, J.
M.; Harris, D.; Kukureka, S. N.; Fernando, G. F. SPIE. 2009,
7293, C1.
12. Fernando, G. F.; Liu, T.; Crosby, P. A.; Doyle, C.; Martin, A.;
Brooks, D.; Ralph, B.; Badcock, R. A. Meas. Sci. Technol.
1997, 8, 1065.
13. Wang, L.; Pandita, S.; Machavaram, V. R.; Malik, S.;
Harris, D.; Fernando, G. F. Compos. Sci. Technol. 2009, 69,
2069.
14. Born, M.; Wolf, E. In Principles of Optics, 7th ed.; Cam-
bridge University Press: Cambridge, 1999.
15. Crosby, P. A.; Powell, G. R.; Fernando, G. F.; France, C. M.;
Waters, D. N.; Spooncer, R. C. Sensors Ser, 1995, Institute of
Physics, Dublin, 10–13 September.
16. Cusano, A.; Cutolo, A.; Giordano, M.; Nocolais, L. IEEE
Sens. J. 2003, 3, 781.
17. Vacher, S.; Molimard, J.; Gagnaire, H.; Vautrin, A. Polym.
Polym. Compos. 2004, 12, 269.
18. Aduriz, X. A.; Lupi, C.; Boyard, N.; Bailleul, J. L.; Leduc,
D.; Sobotka, V.; Lefevre, N.; Chapeleau, X.; Boisrobert, C.;
Delaunay, D. Compos. Sci. Technol. 2007, 67, 3196.
19. Crosby, P. A.; Powell, G. R.; Fernando, G. F.; France, C. M.;
Spooncer, R. C.; Waters, D. N. Smart Mater. Struct. 2006, 5, 415.
20. Liu, Y. M.; Ganesh, C.; Steele, J. P. H.; Jones, J. E. J. Compos.
Mater. 1996, 31, 87.
21. Huang, X. G.; Wu, Y. T.; Yang, H.; Xiong, Y. K. J. Lightwave
Technol. 2009, 27, 2583.
22. Chen, J. H.; Huang, X. G.; He, W. X.; Tao, J. Opt. Laser
Technol. 2011, 43, 1424.
23. Chen, J. H.; Huang, X. G. Opt. Commun. 2010, 283,
1674.
24. Cusano, A.; Breglio, G.; Giordano, M.; Calabro, A.; Cutolo,
A.; Nicolais, L. Sens. Actuators A Phys. 2000, 84, 270.
25. Chang, K. A.; Lim, H. J.; Su, C. B. Meas. Sci. Technol. 2002,
13, 1962.
26. Kim, C. B.; Su, C. B. Meas. Sci. Technol. 2004, 15, 1683.
27. Buggy, S. J.; Chehura, E.; James, S. W.; Tatam, R. P. J. Opt.
2007, 9, S60.
28. Giordano, M.; Laudati, A.; Russo, M.; Nasser J.; Persiano, G.
V.; Cusano, A. Thin Solid Films 2004, 450, 191.
29. Mahendran, R. S.; Wang, L.; Machavaram, V. R.; Pandita, S.
D.; Chen, R.; Kukureka, S. N.; Fernando, G. F. Opt. Laser
Eng. 2009, 47, 1069.
ARTICLE WILEYONLINELIBRARY.COM/APP
WWW.MATERIALSVIEWS.COM J. APPL. POLYM. SCI. 2014, DOI: 10.1002/APP.4108841088 (10 of 11)

30. Dimopoulos, A.; Buggy, S. J.; Skordos, A. A.; James, S. W.;
Tatam, R. P.; Patridge, I. K. J. Appl. Polym. Sci. 2009, 113, 730.
31. Wang, P.; Molimard, J.; Drapier, S.; Vautrin, A.; Minni, J. C.
J. Compos. Mater. 2011, 46, 691.
32. Holst, M.; Schanzlin, K.; Wenzel, M.; Xu, J.; Lellinger, D.;
Alig, I. J. Polym. Sci. Part B Polym. Phys. 2005, 43, 2314.
33. Priyadarshi, A.; Shimi, L.; Wong, E. H.; Rajoo, R.; Mhaisalkar,
S. G.; Kripesh, V. J. Electron. Mater. 2005, 34, 1378.
34. Chang, T. D.; Carr, S. H.; Brittain, J. O. Polym. Eng. Sci.
1982, 22, 1213.
35. Degamber, B.; Winter, D.; Tetlow, J. Fernando, G. F. Meas.
Sci. Technol. 2004, 15, L5.
36. Muller, U.; Philip, M.; Gervais, P. -C.; Possart, W.; Wehlack,
C.; Kieffer, J.; Sanctuary, R.; Kruger, J. K. New J. Phys. 2010,
12, 083036, 1.
37. Crosby, P. A.; Fernando, G. F. The Application of Optical
Fibre Sensors in Advanced Fibre Reinforced Composites. –
In Cure Monitoring, Optical Fibre Sensor Technology; Grat-
tan, K. T. V.; Meggitt, B. T., Eds.; Kluwer Academic Publish-
ers; London, 1999; Vol III, Chapter 3. ISBN 0412825708.
38. Muller, U.; Philipp, M.; Thomassey, M.; Sanctuary, R.;
Kruger, J. K. Thermochem. Acta, 2013, 555, 17.
39. Yu, H.; Mhaisalkar, S. G.; Wong, E. H. Macromol. Rapid
Commun. 2005, 26, 1483.
ARTICLE WILEYONLINELIBRARY.COM/APP
WWW.MATERIALSVIEWS.COM J. APPL. POLYM. SCI. 2014, DOI: 10.1002/APP.4108841088 (11 of 11)