university of california annual report on sustainability...
TRANSCRIPT

University of California ANNUAL REPORT ON SUSTAINABILITY PRACTICES
2011
Budget and Capital Resources University of California, Office of the President
January 2012

Table of Contents I. EXECUTIVE SUMMARY ....................................................................................................................................... 3 II. BACKGROUND AND PURPOSE...................................................................................................................... 4 III. GREEN BUILDING DESIGN ............................................................................................................................... 4
a. Policy Update .................................................................................................................................................................. 4 b. Project Status Summary .............................................................................................................................................. 4
1. Table 1: LEED Certifications Received in 2011 ........................................................................................... 5 c. Energy Efficient Design of New Buildings and Major Renovations .............................................................. 5
IV. CLEAN ENERGY STANDARDS ....................................................................................................................... 5 a. Energy Efficiency in Existing Buildings ................................................................................................................ 5 b. Demonstrating and Deploying New Energy Efficiency Technologies .......................................................... 6 c. Industrial Hygiene Smart Labs Program ................................................................................................................. 6 d. Onsite Generation and Grid Purchases of Renewable Energy ......................................................................... 6
1. Table 2: Photo-voltaic (PV) and Biogas Projects Installed or In Progress ............................................ 7 V. CLIMATE PROTECTION PRACTICES ........................................................................................................ 7
a. Greenhouse Gas Inventories & Climate Action Plans ........................................................................................ 7 b. Planning for Climate Neutrality ................................................................................................................................ 8 c. Preparing for Regulatory Change ............................................................................................................................. 8
VI. SUSTAINABLE TRANSPORTATION ........................................................................................................... 8 VII. SUSTAINABLE OPERATIONS .......................................................................................................................... 9
a. Project Status Summary ................................................................................................................................................ 9 VIII. RECYCLING AND WASTE MANAGEMENT .......................................................................................10
1. Municipal Solid Waste Diversion Rate at UC Campuses and Medical Centers FY 2007-'08 - FY 2010-'11 ................................................................................................................................ 10
IX. PROCUREMENT .........................................................................................................................................................11 1. Sustainable Procurement—Percent Sustainable by Commodity ............................................................ 11
X. FOODSERVICES .........................................................................................................................................................12 XI. FACULTY, STAFF, AND STUDENT COLLABORATION ...........................................................13 XII. MEDICAL CENTERS ...............................................................................................................................................14 XIII. TRAINING .......................................................................................................................................................................14 XIV. EXTERNAL RECOGNITION FOR UC ........................................................................................................15 XV. FUTURE STEPS ...........................................................................................................................................................15
ATTACHMENTS I. New Construction and Renovation Projects: Compliance with UC Policy on Sustainable Practices ........16 II. Analysis of Campus Climate Action Plans ................................................................................................................24 III. Fleet Fuel Consumption Data ..........................................................................................................................................36 IV. External Sustainability Awards and Rankings Received by UC: 2011 ..............................................................43

Page | 3
I. EXECUTIVE SUMMARY As required by the University’s Sustainable Practices Policy (“Policy”), the attached eighth annual report provides the Regents with a summary of the University’s sustainability efforts in eight areas of sustainable practices: green building, clean energy, sustainable transportation, climate protection, sustainable operations, waste reduction and recycling, environmentally preferable purchasing, and sustainable foodservice. The University’s campuses and medical centers continue to be recognized as national leaders in modeling sustainable business practices. This report highlights the main achievements in 2011 for each area of the Policy while also identifying several challenges that need to be addressed in coming years. With 38 new LEED TM1 certifications in 2011, the University now has 87 LEED certifications (total of new construction, renovation, homes, and existing building certifications), the most of any university in the country. The Santa Barbara campus leads the nation with eight existing building certifications. The West Village housing project at the Davis campus opened in October as the largest zero net energy community in the nation. The University’s sustainability leadership attracts resources, most notably more than $47.5 million in energy efficiency grant funding that UC has received since 2004 through a partnership with utility companies. In 2011, the University received approximately $11 million. More than $32 million in annual cost savings are being realized from energy efficiency projects implemented to date. Additional investment in energy efficiency is needed to meet the University’s long-term climate action goals, as discussed in the UC Climate Solutions Steering Group’s recommendations that are also being presented during the January, 2012 Regents meeting. Nine campuses have met the goal of diverting at least 50 percent of municipal waste from landfills, and of those, four campuses and the Davis Medical Center have achieved a 65 percent diversion rate. However, because a significant proportion of waste diversion is construction and demolition waste, which is highly variable on a year-to-year basis, it is an ongoing challenge to achieve the next target of 75 percent diversion in 2012. In 2011, the University received twelve national and state awards and continues to be recognized in the top tiers of national campus sustainability rankings. UC also received media acclaim in local and regional newspapers, national publications such as New York Times, and Forbes, and in television and radio news broadcasts. In September, 2011, President Yudof issued an updated version of the Sustainable Practices Policy.
1 LEED stands for Leadership in Energy and Environmental Design. LEED is a registered trademark of the U.S. Green Building Council. This trademark applies to all occurrences of LEED in this document. LEED is a green building rating system developed and administered by the non-profit U.S. Green Building Council.

Page | 4
Policy Goals • Design and construct all new buildings
(except acute care facilities) to a minimum LEED for New Construction “Silver” rating.
• Design and construct all renovation projects (except acute care facilities) with a cost of $5 million or greater to a minimum LEED for Commercial Interiors “Certified” rating.
• Outperform the energy provisions of Title 24 by at least 20 percent on all new construction and major renovation projects.
II. BACKGROUND & PURPOSE Pursuant to the Regents’ action of July 2003, UC formally issued the “Presidential Policy on Green Building Design and Clean Energy Standards” in June 2004. Six additional policy sections have been subsequently added to those first two, and the expanded Policy is now referred to as the “Sustainable Practices Policy” (“Policy”). In 2011, the Policy was revised to incorporate updates in the areas of green building design, climate protection practices, sustainable operations, environmentally preferable purchasing, and sustainable foodservice practices. The Policy was also updated to remove past deadlines and edited to clarify requirements. The current version of the Policy can be accessed at http://www.ucop.edu/ucophome/coordrev/policy/sustainable-practices-policy.pdf. As required by the Policy, this Annual Report is a summary of the University’s sustainability efforts and progress on goals in each of the eight areas of sustainable practices. This report also includes annual highlights in four cross-cutting topic areas: faculty, staff, and student collaboration; medical centers; training; and external recognition.
III. GREEN BUILDING DESIGN
III. a. Policy Update The 2011 update of the Policy requires LEED for Commercial Interiors (LEED-CI) certification for
all renovation projects with a budget of $5 million or more. The Policy had previously allowed such projects to go through an internal “LEED equivalency” review in lieu of actual LEED certification. III. b. Project Status Summary The University has completed 87 LEED certified projects, the most of any university in the country.2 LEED certification occurs only after projects are completed, thus the comprehensive reporting in Attachment 1 also includes the substantially larger number of projects with established LEED targets that are in design or under construction. Since the establishment of the Policy in 2004, 160 new construction projects, 46 renovation projects, and 13 faculty housing projects have set green building goals. In 2011, two projects applied for and were granted exemptions from the Policy: UCSD University House and LBNL User Test Bed Facility. Both projects are undertaking significant sustainable design measures but had programmatic or scoping constraints that would not allow for LEED certification. LEED certifications achieved in 2011 are shown in the table on the following page. 2 This is the sum total of new construction, renovation, homes, and existing building certifications. This section will discuss the new construction and renovation certifications, while the existing building certifications will be covered in Section VII. Sustainable Operations. The UC Sustainability website provides a complete list of all UC LEED certifications: http://www.universityofcalifornia.edu/sustainability/gb_leed.html.

Page | 5
Policy Goals • Reduce system-wide growth-adjusted energy
consumption to 10 percent below year 2000 levels by 2014
• Deploy 10 megawatts of onsite renewable energy generation by 2014
Table 1. LEED certifications received in 2011 for new buildings and renovations
LEED-NC (New Construction
Certification Level
Plat
inum
Gol
d
Silv
er
1 Davis: Graduate School of Management
2 Davis: Winery, Brewery and Food-Processing Complex
3 Irvine: Humanities Gateway 4 Irvine: Gross Hall 5 Santa Barbara: Sedgwick Reserve
Tipton Meeting House 6 Davis: Tercero Housing Phase II 7 San Diego: Cardiovascular Center 8 San Diego: Village East Transfer
Student Housing 9 San Diego: Rita Atkinson Residences 10 San Francisco: Institute for
Regenerative Medicine 11 Santa Cruz: Cowell Student Health
Center 12 Berkeley: Blum Hall 13 Los Angeles: 720 Hilgard Graduate
Housing 14 Los Angeles: 824 Hilgard Graduate
Housing 15 San Francisco: Osher Building
LEED-CI (Commercial Interiors) Certification Level
1 Berkeley: Clark Kerr Campus Phase II
2 Davis: Cuarto Dining Commons 3 Irvine: Environment Institute 4 San Diego: Stewart Commons 5 San Francisco: Pharmaceutical
Packaging Facility 6 Santa Cruz: Porter College C
LEED for Homes Certification Level
1. Santa Barbara: North Campus Faculty Housing, Phase 13
III.c. Energy Efficient Design of New Buildings and Major Renovations All new construction and major renovation projects are required to register with the Residential or Non-
3 UCSB’s North Campus Faculty Housing Phase 1 includes 13 LEED for Homes certified projects: 5 gold and 8 silver.
Residential New Construction Programs (formerly the Savings By Design Program). These energy efficiency programs, offered by California’s four investor-owned utility companies and the Sacramento Municipal Utility District, provide design assistance, energy analysis, life-cycle costing, and financial incentives to help projects exceed the energy provisions of California’s building code. To date, more than 185 University projects totaling more than 27 million gross square feet have registered with these programs. The University will have received more than $10.9 million in incentive payments from the utility companies, and is projected to avoid approximately $7.2 million per year in energy costs upon completion of these projects. The Davis West Village housing project opened as the largest zero net energy community in the country, producing as much energy onsite as it consumes. The zero net energy strategy starts with energy efficiency, including technologies such as solar-reflective roofing, radiant barrier roof sheathing and extra insulation. Energy-efficient exterior lighting fixtures, indoor occupancy sensors and “daylighting” techniques are expected to consume 60 percent less energy than standard lighting. A web-based tool will allow energy monitoring by unit and a smartphone app will let residents turn off lamps and plugged-in electronics remotely. A four-megawatt photovoltaic system is expected to meet the energy needs of the first 1,980 apartment residents and commercial spaces.
IV. CLEAN ENERGY STANDARDS
IV. a. Energy Efficiency in Existing Buildings To improve the energy performance of its existing building stock, the University formed a unique statewide Energy Efficiency Partnership program

Page | 6
(the Partnership) with the California State University system and the state’s four investor-owned utilities. Through this program, the University has initiated an ambitious portfolio of infrastructure projects and building upgrades to reduce energy consumption, lower campus operating costs, shrink carbon footprints, and improve indoor environmental quality and safety for the university community. Since its inception in 2004, the Partnership has resulted in $47.5 million in utility grants ($11 million received in 2011), which the University has leveraged with over $150 million in campus contributions and some external financing to avoid 230 million kWhs of electricity and 17.7 million therms of natural gas. Net of debt-service, the Partnership is saving the University approximately $32 million dollars per year and is a cornerstone of the University’s Working Smarter initiative and UC’s climate action efforts. Energy savings achieved through the Partnership equate to roughly 168,000 thousand metric tonnes in avoided greenhouse gas emissions, an amount equal to approximately 10 percent of the University 2010 carbon footprint. As detailed in Section V and in Attachment II, campus emissions levels either remained steady or fell between 2009 and 2010 thanks to projects implemented through the Partnership. Projects implemented through the Partnership typically fall into three categories: Heating, Ventilation, Air Conditioning (HVAC) and Monitoring Based Commissioning (MBCx); Central Plant and Energy Distribution; and Lighting. In 2011, campuses initiated 169 projects, accounting for 43.4 million kWhs, 1.9 million therms. The Office of the President is updating its systemwide utilities database with electricity and natural gas data from 2009-2011. Pending completion, next year’s annual report will include a status update on UC’s progress toward reducing growth-adjusted energy consumption relative to the 2000 baseline year.
IV. b. Demonstrating and Deploying New Energy Efficiency Technologies With support from the California Energy Commission’s Public Interest Energy Research (PIER) program, the UC's California Institute for Energy and Environment partners with the California Lighting Technology Center (CLTC) and Western Cooling Efficiency Center at UC Davis to accelerate statewide deployment of new technologies. 2011 highlights included demonstration of bi-level controls for parking garage lighting at Irvine, air-conditioning and lighting demonstrations at Davis, and identification of new technology projects for the 2013 Partnership on multiple campuses. Campuses are expanding energy efficiency project portfolios with additional measures based on these technologies, installing the most successful measures in multiple buildings and leveraging Partnership funding. By acting as early adopters of emerging technologies, many of which were developed based on UC research, campuses are helping transform the market for energy efficient products in California. IV. c. Industrial Hygiene Smart Labs Program Irvine has pioneered innovations in designing and operating “smart labs” with sophisticated monitoring techniques, improving laboratory safety while reducing ventilation rates to achieve significant energy savings. The Office of Risk Services at the Office of the President is providing funding to spread those best practices to other UC campuses. The newly created Irvine “Center for Excellence for Industrial Hygiene and Smart Labs” will support development of procedures and tools to share with all UC campuses, including webinars and training to share lessons learned. This will reduce risk of employee injury and illness, code violations, lawsuits, and property damage, while reducing energy costs and greenhouse gas emissions by 50 percent or more. IV. d. Onsite Generation and Grid Purchases of Renewable Energy The University expects to exceed, two years early, its goal of installing ten megawatts of onsite renewable energy generation. UC now has 9.86 megawatts of solar photo-voltaics (PV) installed or currently under construction, and another 1.15

Page | 7
Policy Goals • Reduce greenhouse gas emissions to year 2000
levels by 2014, and to 1990 levels by 2020
• Achieve climate neutrality as soon as possible
megawatts of PV projects in advanced stages of design. In addition to these PV projects, the Los Angeles campus runs its cogeneration plant on a mix of natural gas and biogas from a nearby landfill, and the San Diego campus is using biogas from a nearby waste water treatment facility to power a new fuel cell. Technology now enables development of zero net energy projects (buildings that generate as much energy onsite as they consume) in certain circumstances. This requires combining high efficiency new building designs with renewable energy installations and energy storage technologies. For example, the Davis West Village project is the largest zero net energy community in the country, and Merced’s long-range development plan commits the entire campus to becoming zero net energy by 2020. Table 2. Photo-voltaic (PV) and Biogas Projects Installed or In Progress (systems > 50 kW)
Campus Technology & capacity (kw)
Status Start date
Berkeley PV (100) Installed 11/2003
Davis PV (782) Installed/ Under Construction
12/2011
Davis (West Village)
PV (4,000) Installed/Under Construction
1/2012
Davis Health System
PV (145) Under Construction
1/2012
Irvine PV (895) Installed 1/2009 Irvine PV (136) Installed 3/2011 Merced PV (1000) Installed 1/2010 San Diego PV (1330) Installed 7/2011 San Diego PV (995) Under
Construction 4/2012
San Diego PV (150) Planned 4/2012 San Francisco PV (250) Installed 1/2008 San Francisco PV (250) Planned 7/2012 Santa Barbara
PV (550) Design 6/2012
Santa Barbara
PV (225) Installed 12/2008
Santa Cruz PV (200) Design 2/2012 Total PV (by 2012)
11,008
Campus Technology & capacity (kw)
Status Start date
Los Angeles Biogas from landfill (3,500)
Installed 1990s
San Diego Biogas Fuel Cell (2,800)
Under Construction
11/2011
Total Biogas 6,300
V. CLIMATE PROTECTION PRACTICES V. a. Greenhouse Gas Inventories & Climate Action Plans All campuses have completed greenhouse gas emissions inventories for calendar year 2010. As members of The Climate Registry, campuses have verified or are in the process of verifying emissions associated with purchased electricity and steam, onsite combustion of fossil fuels, and other emissions sources (as required by the Climate Registry’s General Reporting Protocol). The Climate Registry is a non-profit entity that sets consistent and transparent standards to calculate, verify and publicly report greenhouse gas emissions. Eight campuses—Davis, Los Angeles, Merced, Riverside, San Diego, San Francisco, Santa Barbara, and Santa Cruz—reduced emissions in 2010, and emissions remained stable at Berkeley and Irvine. Overall, the University’s 2010 emissions levels decreased by approximately 42,000 metric tonnes compared to 2009. In 2010, Berkeley, Davis, Riverside, Santa Barbara, and Santa Cruz emitted less greenhouse gas than they did in the year 2000. See Attachment II for more detailed analysis of each campus’s progress toward the Policy goal of reducing emissions to year 2000 levels by 2014. Most campuses developed their climate action plans in 2009 and are currently updating those documents, in accordance with requirements of the Policy.

Page | 8
Policy Goal Reduce university-related transportation emissions, including those from commuting, business travel, and vehicle fleets.
V. b. Planning for Climate Neutrality The Climate Solutions Steering Group continues to evaluate large-scale opportunities for the University to greatly reduce greenhouse gas emissions and move towards its carbon neutrality goal. The group identified three broad strategies for UC: expand the highly successful Partnership program; develop a wholesale power procurement strategy that provides a steadily increasing amount of renewable power; and procure large quantities of biomethane in lieu of natural gas.4 The systemwide strategies being developed by the Climate Solutions Steering Group are complementary to the initiatives being implemented at the campuses, such as the energy efficiency Partnership, solar photovoltaic installations, and green building projects. The Climate Solutions Steering Group prepared a report that describes each of these strategies in detail. The report concludes that proactive investments in carbon abatement projects will allow UC to meet its climate commitments while avoiding millions of dollars in direct and indirect costs associated with cap-and-trade regulation (see III.c.) and other recently enacted State policies and regulations. These findings have been discussed at meetings of the Administrative Vice Chancellors, Executive Vice Chancellors, and Chancellors. V. c. Preparing for Regulatory Change Pursuant to Assembly Bill 32, the California Air Resources Board (ARB) will establish a greenhouse gas cap-and-trade program starting in 2013.5 Based on current emissions levels, five UC campuses and one medical center will be directly regulated under the program and will be required to hold an allowance for each ton of greenhouse gas they emit. The future market price of allowances is uncertain, but is estimated to be between $10 and $40 –
4 Biomethane is methane that is generated from controlled decomposition of organic matter and processed to standards suitable for natural gas pipeline transmission. 5 Cap-and-trade is a regulatory system that sets a limit on overall emissions of pollutants – the "cap." A central authority, in this case ARB, issues pollution permits; each permit entitles its holder to emit a specific amount of pollution. The total number of permits issued equals the pollution cap. Emitters can "trade" pollution permits among themselves. The cap reduces over time, increasing the cost of polluting.
possibly much higher. Assuming the $10-$40 allowance price range, if the University is required to purchase allowances, its annual compliance payments will be between $7 million and $28 million. The University has proposed that ARB create an optional cap-and-trade compliance path that would allow entities like UC to make direct investments in greenhouse gas abatement projects instead of buying allowances. This outcome would allow UC to continue investing in projects that reduce greenhouse gas emissions and operating costs, thereby contributing to AB 32 goals while reducing net compliance costs for the University. In late October 2011, ARB’s Board passed a resolution that directed ARB staff to continue working with UC and California State University stakeholders and to report back to the Board in summer of 2012 with final recommendations on how the university entities should be treated under cap-and-trade. The ARB Board direction leaves open the possibility that UC’s proposal (or something similar) will eventually be adopted. At this time the University’s status under the cap-and-trade program remains uncertain.
VI. SUSTAINABLE TRANSPORTATION
The recession and budget cuts have influenced commuting patterns in several ways. The economic recession and higher gas prices have encouraged more people to commute via alternative modes. However, budget cuts have forced campuses to reduce alternative transportation subsidies at the same time that local transit agencies have had to curtail service. Nevertheless, most campuses have been able to maintain alternative commuting levels through programmatic changes and increased marketing. Nearly all campuses have also added additional support for bicycle commuters through measures such as increased bike parking, rental bikes, bike repair stations, and increased bike capacity on campus shuttles.

Page | 9
Policy Goals
• Each campus will submit for certification one pilot building at a LEED-EBOM “Certified” level or higher.
• Each campus shall certify campus-wide LEED-EBOM credits and prerequisites to streamline the certification of multiple buildings through the LEED-EBOM rating system by July 1, 2012.
• Each campus shall seek to certify as many buildings as possible through the LEED-EBOM rating system.
Los Angeles, Riverside, Davis, and Santa Cruz bought hybrid or alternative fuel vehicles to replace aging campus vehicles, and Davis also downsized its fleet. While budget constraints prevented other campuses from upgrading to more fuel efficient cars and trucks, Berkeley, Davis, and Davis Health System did expand their fleets of rental bikes for department use in lieu of using fleet vehicles. Overall, campus use of unleaded gasoline was down three percent last year. Greenhouse gas emissions from the University’s fleet have been essentially flat for the last three years, however the proportion of greenhouse gas emissions associated with shuttle busses (as opposed to smaller vehicles) have increased, suggesting a decrease in greenhouse gas emissions per passenger. Attachment III shows trends in fuel consumption and greenhouse gas emissions associated with the University’s vehicle fleet. As travel budgets are cut, several campuses are reporting increased demand for remote conferencing (webinars, and video conference) and campuses such as Los Angeles, Santa Barbara and Santa Cruz plan to expand these capabilities to meet demand and further reduce the need for air travel.
VII. SUSTAINABLE OPERATIONS
VII. a. Project Status Summary The University is using the LEED for Existing Buildings: Operations and Maintenance (LEED-EBOM) rating system to evaluate and improve the environmental performance of its existing building
stock. In 2011, Santa Barbara added three additional LEED-EBOM certified buildings, and San Diego added one, to the ten already certified in the UC system. The new Santa Barbara EBOM certifications are for the Marine Science Research Building (Gold); Kohn Hall (Silver); and the Material Research Laboratory (Certified). The new San Diego certification is for the Supercomputer Center (Gold). The Policy requires that all campuses certify one building through the LEED-EBOM program. The Office of the President and the Los Angeles, San Francisco, and Santa Cruz campuses have certified one building each. San Diego has two certifications and Santa Barbara now has eight certifications, more than any other university in the country. Santa Barbara ultimately plans to certify 25 total buildings by 2013. Berkeley, Davis, Irvine, Merced, and Riverside are pursuing their first LEED-EBOM certification. After years of advocacy from UC, and successful pilots on the Santa Barbara, Merced, and Irvine campuses, in November 2010 the U.S. Green Building Council (USGBC) published the “2010 Application Guide to Multiple Buildings and On-Campus Building Projects” (AGMBC). This new guide allows campuses to certify some LEED-EBOM credits and prerequisites on a campus-wide basis, thereby reducing time spent on individual building certifications.

Page | 10
Policy Goals • Increase the proportion of waste that is reused,
recycled, composted, or otherwise diverted from landfill. o By 2008, divert 50% of waste from landfill,
by 2012 divert 75% of waste from landfill, and achieve “zero waste” by 2020.
0%10%20%30%40%50%60%70%80%90%
100%
UC
B
UC
D
DH
S
UC
I
UC
LA
UC
LA M
C
UC
M
UC
R
UC
SD
UC
SD M
C
UC
SF
SFM
C
UC
SB
UC
SC
Municipal Solid Waste Diversion Rate at UC Campuses and Medical Centers FY 2007-'08 - FY 2010-'11
CY 2007 FY 07 - 08 FY 08 - 09 FY 09 - 10 FY 10 - 11
The decrease in 2010-11 diversion rates for several campuses results from the year-to-year variability of C&D waste (eg: Berkeley)
VIII. RECYCLING AND WASTE MANAGEMENT
All campuses met the Policy goal of diverting 50 percent of municipal solid waste from landfills, with only one exception. Four of the five medical centers reported their solid waste diversion. The increased focus on recycling is encouraging as medical centers face additional challenges in meeting solid waste diversion goals. For example, mingled waste streams from mixed-use buildings make recycling more difficult, and some portion of the medical center waste stream is classified as medical waste and thus cannot be recycled. The perception of contamination of the waste stream from medical centers – even if appropriately separated – can make recycling especially difficult.
Diversion data for the FY 2010-11 appears below.
Calendar year 2007 data, the earliest period for which data was collected, is included to show the impact that recycling and waste management policy provisions had following their adoption in 2007. The volume of construction and demolition (C&D) materials vary significantly from year to year depending on the level of construction and demolition activity. Because C&D waste is so heavy, the variation in C&D activity has a big impact on diversion rates. Large volumes of C&D waste typically boost campus diversion rates. Conversely, decreased volumes in C&D waste explain the drop in overall diversion rate visible in the data for Berkeley. The next policy target is 75 percent diversion of municipal solid waste from landfills by the end of 2012, mirroring the state requirement for municipalities and state agencies. Achieving this goal will be challenging for our campuses.

Page | 11
Policy Goal Increase the proportion of University expenditure on products that meet one or more third-party environmental certification.
IX. PROCUREMENT
Sustainable procurement in FY 10/11 shows a steady increase in total purchases of environmentally preferable products. As one example, use of recycled-content multi-use paper purchased from the systemwide Strategic Sourcing Agreement increased for the fourth year in a row. A total of 89 percent of multi-use paper purchased through the Vendor Agreement contained 30 percent or more post-consumer recycled content. This is up from 85 percent in FY 09/10 and 66 percent in FY 08/09. The graph below shows the percentage of purchases that meet one or more of the third-party
environmental certifications that are recognized in the Policy. This is the first year that UC has been able to obtain this data across the 14 Strategic Sourcing commodities areas included in the graph.
0%10%20%30%40%50%60%70%80%90%
100%
Off
ice
Equi
pmen
t (C
olor
C
opie
rs)
Off
ice
Equi
pmen
t (D
igita
l C
opie
rs)
Off
ice
Furn
iture
Car
pets
& F
loor
ing
PC's
& lo
w-e
nd se
rver
s
Off
ice
Equi
pmen
t (P
rinte
rs/F
axes
)
Gas
es
Woo
d C
ase
Off
ice
Furn
iture
Jani
toria
l
Off
ice
Supp
lies
Ergo
nom
ic O
ffic
e Fu
rnitu
re
Ani
mal
Car
e
Bot
tled
Wat
er
Mai
nten
ance
Rep
air &
O
pera
tions
Sustainable Procurement—Percent Sustainable by Commodity
Sustainable Spend (as a % of total spend for that commodity)

Page | 12
Policy Goals • Procure 20 percent sustainable food
products (as defined by the UC Sustainable Foodservice Working Group) by the year 2020 for Campus and Medical Center foodservice operations.
• Certify at least one foodservice facility on each campus as a green business.
• Educate both patrons and foodservice staff about sustainable food products and sustainable foodservice operations.
X. FOODSERVICES
Sustainable foodservice policy requirements were established in September 2009 and dining services on each campus submitted action plans with campus-specific goals in December 2009. Goals were established for sustainable food purchasing, sustainable facility operations, educational and training programs, and community outreach programs. In September 2010, policy requirements were extended to foodservice operations at the medical centers and in retail operations. In August 2011, all campus and medical center foodservice operations reported initial progress toward their sustainability goals. Four campuses – Berkeley, Davis, Santa Barbara and San Diego – have already exceeded the 2020 goal to purchase twenty percent sustainable food. Cal Dining at the Berkeley campus became the first public university foodservice operation to achieve the Marine Stewardship Council’s chain of custody certification for seafood. The San Francisco Medical Center is collaborating with other Bay Area hospitals and local and national healthcare sustainability organizations in an effort to convince national food distribution companies to track and report local and sustainable food products that hospitals purchase.
Sustainability is commonly understood as having environmental, economic, and social dimensions. Health and wellness are integral components of social sustainability. In that light, UCLA Health
System Nutritional Services and UCSD Health System Nutrition Services have both removed fryers in 2011 and no longer serve fried food.
Berkeley, Santa Cruz, Santa Barbara, San Diego, and Davis have each certified at least one foodservice facility as a certified green business, with Berkeley, Santa Cruz, and Davis certifying all of their dining halls. Other campuses expect to certify their first facilities through green business certification programs in 2012.
The 2011 CA Higher Education Sustainability Conference recognized two Davis projects with Best Practice awards: Cuarto Dining Commons for its comprehensive sustainable foodservice program, and the “Zero Waste Stadium” in the category of Innovative Waste Reduction. Other significant accomplishments in waste reduction in 2011 include two dining halls at Irvine achieving zero waste status and the San Francisco Medical Center Nutrition and Food Services recycling or composting 85 percent of its waste. Riverside achieved impressive results for water conservation in the form of a new dishwashing machine that uses 500,000 gallons less water per year than the older
Page | 13
machine. These savings will also be matched by a significant decrease in the energy needed to heat the water and additional savings in dishwashing chemicals will apply as well.
Two more campuses – Los Angeles and Santa Barbara – benefitted from energy audits of all campus and medical center foodservice facilities performed by the Food Service Technology Center at no cost to the university system. The auditsidentified energy savings opportunities such as lighting retrofits and high-efficiency dishwashing machines, refrigerators, ovens, and steamers. The comprehensive energy audits, performed free of charge through the Energy Efficiency Partnership with the utility companies and already conducted on the San Francisco, Davis, and San Diego campuses in 2010, will hopefully be conducted on the Irvine and Riverside campuses in 2012. The audits have already identified approximately $25,000 - $65,000 in annual savings for each of the first five campuses audited.
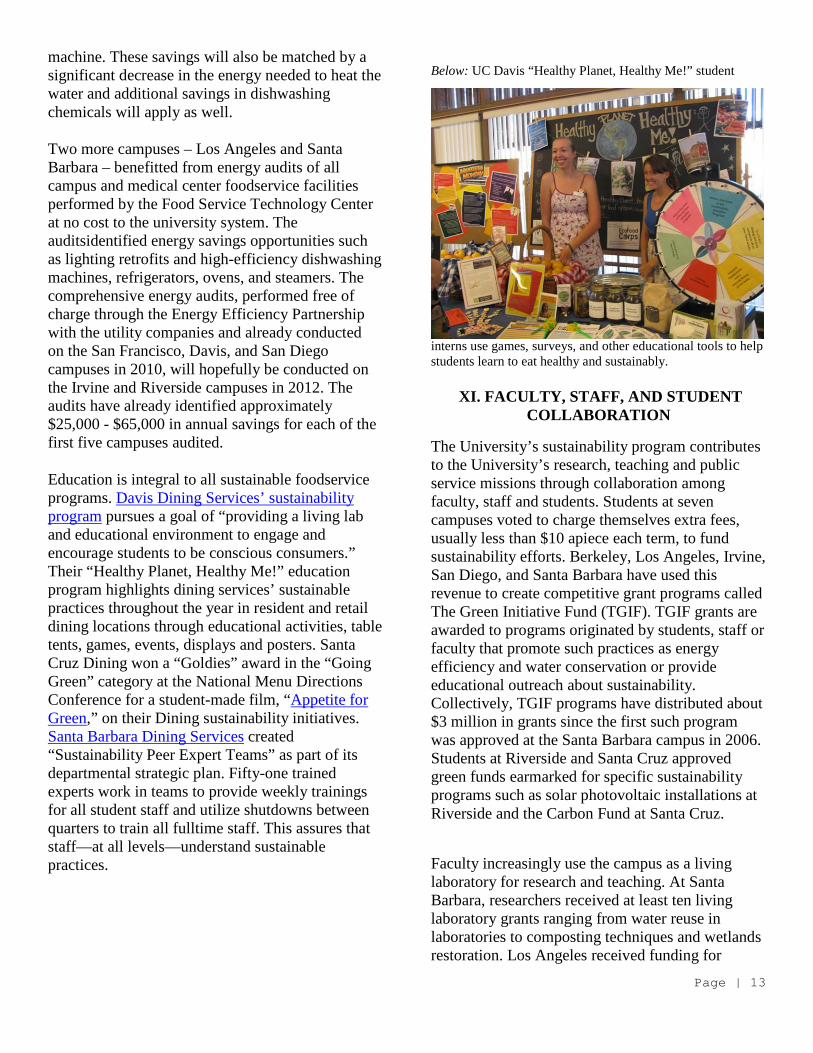
Education is integral to all sustainable foodservice programs. Davis Dining Services’ sustainability program pursues a goal of “providing a living lab and educational environment to engage and encourage students to be conscious consumers.” Their “Healthy Planet, Healthy Me!” education program highlights dining services’ sustainable practices throughout the year in resident and retail dining locations through educational activities, table tents, games, events, displays and posters. Santa Cruz Dining won a “Goldies” award in the “Going Green” category at the National Menu Directions Conference for a student-made film, “Appetite for Green,” on their Dining sustainability initiatives. Santa Barbara Dining Services created “Sustainability Peer Expert Teams” as part of its departmental strategic plan. Fifty-one trained experts work in teams to provide weekly trainings for all student staff and utilize shutdowns between quarters to train all fulltime staff. This assures that staff—at all levels—understand sustainable practices.
Below: UC Davis “Healthy Planet, Healthy Me!” student
interns use games, surveys, and other educational tools to help students learn to eat healthy and sustainably.
XI. FACULTY, STAFF, AND STUDENT COLLABORATION
The University’s sustainability program contributes to the University’s research, teaching and public service missions through collaboration among faculty, staff and students. Students at seven campuses voted to charge themselves extra fees, usually less than $10 apiece each term, to fund sustainability efforts. Berkeley, Los Angeles, Irvine, San Diego, and Santa Barbara have used this revenue to create competitive grant programs called The Green Initiative Fund (TGIF). TGIF grants are awarded to programs originated by students, staff or faculty that promote such practices as energy efficiency and water conservation or provide educational outreach about sustainability. Collectively, TGIF programs have distributed about $3 million in grants since the first such program was approved at the Santa Barbara campus in 2006. Students at Riverside and Santa Cruz approved green funds earmarked for specific sustainability programs such as solar photovoltaic installations at Riverside and the Carbon Fund at Santa Cruz.
Faculty increasingly use the campus as a living laboratory for research and teaching. At Santa Barbara, researchers received at least ten living laboratory grants ranging from water reuse in laboratories to composting techniques and wetlands restoration. Los Angeles received funding for

Page | 14
energy conservation and smart grid research projects including a $300,000 grant to study electrical consumption behaviors at University-owned apartments. San Diego received grant funding for twenty public electric vehicle charging stations worth approximately $200,000 in its “Tailpipe Endgame” research project. Funded by national and local grants, the San Diego project reduces greenhouse gases and local air pollutants from tailpipes of the transportation sector by using renewable energy resources to charge a variety of new models of electric vehicles (EVs). The Berkeley Center for Green Chemistry integrates research, teaching, and operations. For example, the Center redesigned lab experiments for Berkeley’s introductory chemistry classes, supported a student seminar on green chemistry, added new labs for Chemistry 4A and 4B, and worked to develop three new advanced graduate-level chemistry classes. Now Chem1A labs on campus include numerous experiments investigating topics such as bio-fuels and ocean acidification, with overall goals of waste reduction, “using fewer nasty chemicals, while teaching students how chemistry can be used to solve problems.”6 The UC public service mission calls for the University to provide sustainability leadership to the communities surrounding its campuses. In a recent example of this, Santa Barbara gathered sustainability decision makers, officials, and representatives from organizations throughout the region for the inaugural South Coast Sustainability Summit on the Santa Barbara campus. The summit discussed common issues in energy, transportation, waste and water management.
XII. MEDICAL CENTERS Building on the medical centers’ recent adoption and ongoing implementation of UC sustainable foodservice goals, the Office of the President now organizes quarterly sustainability conference calls to facilitate sustainability best practice sharing across the five medical centers. Two or more sustainability contacts from each of the five medical
6 Robert Sanders, “Green Chemistry in the lab and beyond,” UC Berkeley NewsCenter, March 22, 2011
centers regularly participate in these calls.
The organization Practice Green Health honored the San Francisco Medical Center with a Partner for Change with Distinction award and the Los Angeles Medical Center with a Partner for Change award. The awards recognize health care facilities that have established environmental programs and continuously improve and expand upon these programs on the path to sustainability.
XIII. TRAINING The University continues to promote excellence through training, via individual training workshops and an annual statewide conference organized in a unique collaboration with the California State University (CSU) system and the California Community College (CCC) system. The tenth annual California Higher Education Sustainability Conference hosted by CSU Long Beach attracted nearly 1000 attendees—including 250 students—from 84 colleges and universities throughout California and neighboring states. The conference highlighted best practices in sixteen tracks of sessions including each of the sustainability topics in the UC Policy. The seventh annual Energy Efficiency and Sustainability Best Practice Awards were presented at the conference to exemplary UC, CSU and CCC energy and sustainability projects. A complete list of award winners and case studies on energy efficiency best practice award winners are available online. The energy efficiency and green building training program established in 2004 now offers fewer trainings because of continued constrained budgets both within the University and in grant funding from utility companies. However, the Partnership grant funding still provided for some critical training opportunities to equip University staff with skills needed to achieve the goals in the Policy:
• Eight campuses sent a total of 49 key campus engineering and maintenance staff to earn Building Operator Certification7;
7 Building Operator Certification (BOC®) is a nationally recognized, competency-based training and certification program that offers facilities personnel the improved job skills and knowledge to transform workplaces to be more

Page | 15
• Two more campuses – Los Angeles and Santa Barbara—took advantage of free energy efficiency audits for every foodservice kitchen on their campus and medical center, to identify numerous low- and no-cost efficiency measures they can take to save energy and money;
• Three campuses—Riverside, Santa Cruz, and Davis—received training on “LEED Project Management” in order to more effectively manage LEED certification and thereby reduce costs.
• Two regional workshops on “Deep Energy Efficiency Strategies” informed 75 total staff attendees about campus energy efficiency projects that can yield 50 percent savings in both energy and carbon footprint. Such projects provide the most financially and technically feasible means to significantly reduce the University’s carbon emissions in the short term.
UC’s Capital Programs Institute became a Certified Education Provider for the LEED Credential Maintenance Program, so UC trainings sessions now provide continuing education credits for the 108 UC staff that are LEED Accredited Professionals.
XIV. EXTERNAL RECOGNITION FOR UC During 2011, approximately 100 articles on UC campus and system-wide sustainability initiatives appeared in media outlets such as the New York Times, Forbes, Los Angeles Times, Sacramento Bee, and San Diego Union-Tribune. Even as the field of colleges and universities that embrace sustainability goals has grown, UC continues to be recognized as a national leader in this area. For example, San Diego and Los Angeles both achieved high marks in the Sustainability Tracking Assessment and Rating System (STARS). Developed by the Association for the Advancement comfortable, energy-efficient and environmentally friendly. The BOC credential is recognized by employers across the country as a sign of the value and contributions certified facilities management personnel can bring to their organizations.
of Sustainability in Higher Education (AASHE), STARS is emerging as a national benchmark for higher education sustainability. In addition, Santa Cruz was among sixteen universities named to Princeton Review’s “Green Honor Roll.” The San Diego, Irvine, Santa Cruz, and Davis campuses were in the top 10 in the Sierra Club’s annual list of “Cool Schools” and Los Angeles ranked fifteenth. These rankings continue the trend of one or more UC campuses appearing at or near the top of every national higher education sustainability ranking. Attachment IV provides a summary of the sustainability rankings and awards that the University received in 2011.
XV. FUTURE STEPS The University will continue its extensive efforts to meet requirements in each of eight Policy areas, while continuing to explorethe addition of a ninth section of the Policy to address water conservation and storm water management. Staying on track to achieve both short-term and long-term goals for reducing greenhouse gas emissions will again require significant focus and resources in 2012. The University will continue to implement the more than one thousand energy efficiency projects funded through the Partnership program, while also taking steps towards the large-scale, system-wide renewable energy and related projects proposed by the Climate Solutions Steering Group. These initiatives to reduce greenhouse gas emissions will reduce the regulatory risk and costs for the University under the state’s new climate regulations. The University will work with the California Air Resources Board to develop a compliance path that meets the requirements of those new regulations and maximizes the University’s emissions reductions while minimizing the cost impact to its primary missions.
Other specific areas of focus in 2012 will include work on increasing waste diversion rates through initiatives like composting, and collecting data to assess the progress toward the 2014 goal of reducing growth-adjusted energy consumption by ten percent relative to the 2000 baseline year.
Page | 16
(Attachments)
I. New Construction and Renovation Projects: Compliance with UC Policy on Sustainable Practices
II. Analysis of Campus Climate Action Plans III. Fleet Fuel Consumption Data IV. External Sustainability Awards and
Rankings Received by UC: 2011

ATTACHMENT INew Construction and Renovation Projects: Compliance with UC Policy on Sustainable Practices
Total LEED Certifications for New Construction and Renovations:6 Total: 73 LEED certified projects
23 Subtotal: 44 LEED NC projects37 Subtotal: 16 LEED CI projects7 Subtotal: 13 LEED H projects
No. Proj. Type
Name of Project Bud. Appr.
Building Type Projected Certification Date
Date By Date Rating Pts. Rating Pts.BERKELEY
1 NC Doe Annex Seismic & Program Impr 8/04 R 12/05 Special Coll Library UC Silver 33 20122 NC Underhill Field and Parking Replacement
Project 8/04 R 7/05 Parking Strucutre UC Cert. 16 2007 Exempted*
3 NC Early Childcare Education Center 4/05 SVP 5/05 Childcare Center, research LEED Silver 33 2006 Silver 384 NC University Village 11/03 R 2/04 Housing LEED Cert. 28 2010 Certified 285 NC Durant Hall 8/06 SVP 1/08 Office LEED Silver 33 2009 Silver 366 NC SAHPC 12/06 R 12/06 Athletics UC Cert. 26 20127 NC Computational Research Facility 3/07 R 5/08 Class/labs/data center LEED Silver 34 20128 NC LKS Biomedical Sciences Building 11/07 R 5/07 Laboratory/office LEED Silver
/Labs 2133 2012
9 NC Helios Energy Research Facility - West 3/07 R 1/10 Labs 21 & LEED for Labs LEED Silver 50 201210 NC Law School Infill 1/08 R 7/08 Class/office/café/library LEED Gold 39 201211 NC Naval Architecture Bldg N/A R 2/09 Office LEED Silver 35 2011 Silver 3512 NC Cal. Memorial Stadium Seismic Corrections 1/10 R 1/10 Athletics LEED Silver 2012 13 NC BAM R pending Museum LEED Silver 26 201214 NC Anna Head West Student Housing 7/11 R 11/09 Housing LEED Gold15 CI Clark Kerr Campus Renovation 9/07 R N/A renovation LEED Silver 27 2010 Gold 3316 CI Clark Kerr Renovations Phase 2 9/07 R N/A Housing LEED Gold 28 2011 Gold 35.517 CI Campbell Hall Replacement 11/07 R 3/08 Class/office/lab LEED Silver 33 201218 CI Law Renovations 1/08 SVP 7/08 Classroom/office LEED Silver 34 2012 19 CI King Student Union Renovations 4/08 SVP 7/08 UC Cert. 32 201220 CI 3300 Regatta 4/09 R N/A Office UC Cert. 23 201221 CI Morgan Hall Laboratory Renovation 7/09 C 5/09 Lab LEED Silver 39 2010 Gold 35
Total Achieved Ratings:LEED Certified
LEED GoldLEED Platinum
LEED Silver
PROJECTS IMPLEMENTED UNDER UC SUSTAINABILITY POLICY (BUDGET APPROVAL AFTER JULY 1, 2004)(State Projects that fall under this Policy are those that were included in the 2005-06 Budget and later years)
Design Appr. Proposed Rating Achieved Rating
Legend - Approval LevelR = Regents Approval (For projects >$10M)P = President's Approval (For projects >$5M and <$10M that require financing)SVP = Senior Vice-Pres., Business & Finance, Approval (For projects >$5M & <$10M) C = Chancellor's Approval (For projects <$5M)
Legend - Project TypeNC = New ConstructionRe = Renovation (For projects <$5M)CI = Renovation (For projects >$5M)H = HomesCS = Core and Shell * Policy exemptions are only granted when a project is still undertaking significant sustainable design measures but has programmatic
or scoping constraints that would not allow for LEED certification.
16

ATTACHMENT INew Construction and Renovation Projects: Compliance with UC Policy on Sustainable Practices
No. Proj. Type
Name of Project Bud. Appr.
Building Type Projected Certification Date
Date By Date Rating Pts. Rating Pts.
PROJECTS IMPLEMENTED UNDER UC SUSTAINABILITY POLICY (BUDGET APPROVAL AFTER JULY 1, 2004)(State Projects that fall under this Policy are those that were included in the 2005-06 Budget and later years)
Design Appr. Proposed Rating Achieved Rating
DAVIS22 NC Tahoe Environ Research Center 7/00 2/01 Research Lab LEED Plat 52 2006 Platinum 5623 NC Vet Med Instructional Facility 1/01 R 7/02 Classroom LEED Gold 201224 NC Warren & Leta Giedt Hall 11/04 SVP 1/05 Offices UC Cert. 2006
25 NC Physical Sciences Expansion 3/05 R 5/05 Teaching & Research Labs UC Cert. 201226 NC Service Unit Park 7/05 C 4/05 Maintenance UC Cert. 200627 NC Vet Med 3B 11/05 R 7/07 Research Labs LEED Gold 201328 NC King Hall Renovation & Expansion 11/06 R 11/06 Offices/Classroom/Library LEED Silver 201229 NC Health and Wellness Center 1/07 C 1/07 Office/Health Clinic LEED Silver 201230 NC Virology & Immunology 5/07 R 10/07 Laboratory UC Silver 201231 NC Translational Shared Research Facility 8/07 C 12/07 Laboratory UC Cert. 200832 NC Building J1 Renovation & Upgrade 8/08 C Laboratory LEED Silver 201233 NC Advanced Transportation Center Phase 2 8/07 C 2/08 Research facility LEED Silver 201234 NC Graduate School of Management R 1/08 Office/Conference Center LEED Gold 2011 Platinum 5435 NC Segundo Services Center 7/01 R 8/09 Office Building LEED Silver 201236 NC Winery, Brewery and Food Lab 3/08 R 2/09 Laboratory LEED Plat 2010 Platinum 6037 NC Tercero Housing Phase II 5/08 R 5/08 Housing LEED Gold 40 2011 Gold 4038 NC Student Community Center 7/08 R 10/09 Office/multi purpose LEED Gold 201239 NC CNPRC Respiratory Disease Center 4/10 C 10/10 Laboratory LEED Gold 201340 NC Music Instruction & Recital Building 3/08 R N/A Performing Arts Facility UC Silver 201541 NC Foundation Plant Services Expansion 4/09 C 2/09 Office/Classroom LEED Silver 201342 NC Memorial Union & Bookstore Expansion 1/10 C 3/10 Retail LEED Silver 201343 NC California Animal Health & Food Safety
Diagnostic Lab, Tulare5/08 R N/A Laboratory UC Silver 2014
44 NC Tercero Housing Phase III 1/11 R N/A Housing LEED Gold 201545 Re Robbins Hall Renovations 8/07 C 3/09 Laboratory LEED Silver 201246 Re Kerr Hall Renovations 12/07 C 1/07 Offices UC Cert. 201247 Re Coffee House Renovation 9/07 C 1/08 Dining UC Gold 201248 Re Oxford Dining Commons 1/08 C 2/08 Dining LEED Silver 2011 Gold 35
Did not achieve
Did not achieve goal*
Did not achieve
* Some Davis projects that were approved before the Policy required LEED certification were not able to collect documentation to demonstrate LEED equivalence, and are thus listed here as not having achieved the policy goal of achieving at least a LEED Certified equivalency.
17

ATTACHMENT INew Construction and Renovation Projects: Compliance with UC Policy on Sustainable Practices
No. Proj. Type
Name of Project Bud. Appr.
Building Type Projected Certification Date
Date By Date Rating Pts. Rating Pts.
PROJECTS IMPLEMENTED UNDER UC SUSTAINABILITY POLICY (BUDGET APPROVAL AFTER JULY 1, 2004)(State Projects that fall under this Policy are those that were included in the 2005-06 Budget and later years)
Design Appr. Proposed Rating Achieved Rating
DAVIS MEDICAL CENTER49 NC Cancer Center Expansion 11/05 R 3/06 Clinic UC Cert. 28 TBD50 NC Same Day Surgery 11/05 P N/A Clinic UC Cert. 27 201251 NC Telemed Resource Center 11/06 R 1/08 Class/labs/offices UC Silver 33 201252 CI Stockton Boulevard Research Cntr 5/08 R N/A Vivarium/labs/off. UC Cert. 16 2012
IRVINE53 NC Palo Verde Expansion 10/1 R 9/02 Housing LEED Gold 2007 Gold 3954 NC Anteater Instruction & Research Bldg R LEED Gold 2009 Gold 4255 NC Student Center Expansion Phase 4 11/2 R 9/03 LEED Gold 2009 Gold 3956 NC Bren Hall R LEED Gold 2009 Gold 4257 NC Anteater Recreation Center Exp 5/06 R 7/06 Activity spaces LEED Gold 39 2009 Gold 3958 NC Puerta del Sol Student Apts 3/08 R 3/08 Housing LEED Gold 43 2010 Gold 4259 NC Camino del Sol Student Apts R Housing LEED Gold 2010 Gold 4460 NC Clinical Lab Building 1/08 R Labs LEED Silver 36 2010 Gold 4061 NC Engineering Unit 3 11/03 R 11/05 Classrm, labs, offices LEED Gold 41 201262 NC Social & Behavioral Sciences 11/04 R 5/06 Classrm, labs LEED Gold 42 201263 NC Humanities Building 11/05 R 2/08 Classroom LEED Gold 42 2012 Platinum 5764 NC Telemed Prime LC 11/06 R 7/07 Computer labs, offices LEED Gold 43 201265 NC Arts Building 11/06 R 12/07 Studios, perfomance spaces LEED Gold 40 201266 NC New Hospital Site Improvements 1/08 R Demolition, outdoor spaces NA 201267 NC New Hospital Shell Space 1/08 R Hospital NA 201268 NC Stem Cell Research 7/08 R Laboratory/vivarium LEED Gold 44 2012 Platinum 5269 NC Verano Unit 4 Replacement - Building 1 3/10 C 6/10 Housing LEED Gold 201270 NC Verano Unit 4 Replacement - Building 2 3/10 C 6/10 Housing LEED Gold 201271 NC Verano Unit 4 Replacement - Building 3 3/10 C 6/10 Housing LEED Gold 201272 NC Verano Unit 4 Replacement - Building 4 3/10 C 6/10 Housing LEED Gold 201273 NC Infant Toddler Center 3/10 C 6/10 LEED Gold 201274 NC Biological Sciences 3 5/04 R 9/04 Classrooms, Labs, Offices LEED Gold 201275 NC Alumni Center 4/11 R Alumni Center LEED Silver 201276 CI Environmental Institute 1/09 C 4/09 Labs, offices LEED Gold 37 2011 Gold 3277 CI Middle Earth Housing Phase I Renovation 5/10 C 5/10 Housing Certified 2012
LAWRENCE BERKELEY NATIONAL LAB78 NC Helios Energy Research Facility East 07 R Labs LEED Silver 201279 NC User Test Bed Facility 11 R Labs NA NA Exempted*
* Policy exemptions are only granted when a project is still undertaking significant sustainable design measures but has programmatic or scoping constraints that would not allow for
18

ATTACHMENT INew Construction and Renovation Projects: Compliance with UC Policy on Sustainable Practices
No. Proj. Type
Name of Project Bud. Appr.
Building Type Projected Certification Date
Date By Date Rating Pts. Rating Pts.
PROJECTS IMPLEMENTED UNDER UC SUSTAINABILITY POLICY (BUDGET APPROVAL AFTER JULY 1, 2004)(State Projects that fall under this Policy are those that were included in the 2005-06 Budget and later years)
Design Appr. Proposed Rating Achieved Rating
LOS ANGELES80 NC La Kretz Hall 3/02 R 9/02 Classrooms, Offices LEED Silver 34 2006 Silver 3481 NC Life Sciences Replacement Building 8/05 R 9/05 Classroom, Labs, Offices UC Silver 33 201282 NC Spieker Aquatic Center 3/07 R 7/07 pool/locker bldg. UC Cert. 27 201283 NC Police Station Replacement 5/07 R 7/07 Police station LEED Silver 35 2010 Silver 3384 NC 720 Hilgard Grad Student Housing 11/07 R 3/08 Housing LEED Silver 34 2011 Silver 3685 NC 824 Hilgard Grad Student Housing 11/07 R 3/08 Housing LEED Silver 34 2011 Silver 3786 NC South Campus Student Center 9/08 R 2/09 Dining LEED Silver 35 201287 NC Hershey Hall Seismic Renovation 7/08 N/A N/A Offices LEED Silver 33 201288 NC NW Student Housing Infill - Sproul 9/08 R 3/09 Housing LEED Silver 37 201389 NC NW Student Housing Infill - DeNeve 9/08 R 3/09 Housing LEED Gold 39 201390 NC Dykstra Repairs & Refurbishment 11/09 C 11/09 Housing LEED Silver 33 201391 NC Pauley Pavilion Renov & Expansion 7/09 R 7/09 Athletics LEED Silver 33 201392 NC Weyburn Terrace Grad Student Hsg 7/09 R 1/10 Housing LEED Silver 38 201393 CS Wasserman Building N/A R 5/10 Health Sciences LEED Silver 50 201494 NC Landfair Apartments 1/11 R 7/11 Housing LEED Silver 50 201495 NC Glenrock Apartments 1/11 R 7/11 Housing LEED Silver 50 201496 NC Ostin Music Center 10/11 C 10/11 Music LEED Silver 54 201497 NC School of Public Health Seismic
Improvement9/11 C 9/11 Health Sciences LEED Silver 56 2013
98 CI Rieber Hall Repair & Refurbishment 5/07 R 5/07 High-rise student housing UC Silver 27 201299 CI CNSI BSL3 7/07 SVP N/A Lab UC Silver 27 2012100 CI Hedrick Repairs and Refurbish 5/08 R 5/08 Housing LEED Silver 39 2012101 CI GCRC CHS Parking E 6/08 EVP N/A Clinical Research/Biomarker LEED Silver 35 2012102 CI Young Research Library 8/08 EVP 8/08 1st Floor interior renov. LEED Gold 34 2012103 CI Rieber Dining Renovation 9/08 P 9/08 Dining UC Cert. 22 2012104 CI CHS South Tower Seismic Renov 3/11 P 9/10 Health Sciences LEED Silver 50 2015105 CI Kinross Graduate Fitness Center 9/10 C N/A Recreation LEED Silver 50 2012106 CI Boelter Hall Laboratory Renovation 10/10 C 10/11 Laboratories LEED Silver 50 2014107 CI Wasserman Building Tenant Improvement 10/11 C 10/11 Health Sciences LEED Silver 50 2014108 CI Semel IPCN 9/10 C 9/10 Health Sciences LEED Silver 50 2013
MERCED109 NC Central Plant 12/00 R 1/02 Central Plant LEED Gold 2007 Gold 39110 NC Kolligian Library 11/00 R 5/02 Library LEED Gold 2007 Gold 46111 NC Garden Suites and Lakeview Dining 9/02 EVP 9/02 Housing/dining common LEED Silver 2007 Silver 35112 NC Classroom and Office Building 12/00 R 5/02 Classrooms/Offices LEED Gold 2008 Gold 44113 NC Joseph Gallo Center 6/04 R 1/05 Recreation Center LEED Gold 44 2007 Gold 44
19

ATTACHMENT INew Construction and Renovation Projects: Compliance with UC Policy on Sustainable Practices
No. Proj. Type
Name of Project Bud. Appr.
Building Type Projected Certification Date
Date By Date Rating Pts. Rating Pts.
PROJECTS IMPLEMENTED UNDER UC SUSTAINABILITY POLICY (BUDGET APPROVAL AFTER JULY 1, 2004)(State Projects that fall under this Policy are those that were included in the 2005-06 Budget and later years)
Design Appr. Proposed Rating Achieved Rating
MERCED (continued)114 NC Sierra Terrraces 9/05 R 9/05 Student housing LEED Gold 44 2009 Gold 40115 NC Science and Engineering 12/00 R 5/02 Classrooms/Labs LEED Gold 2009 Gold 39116 NC Logistical Site Service Facility 12/02 R 6/04 Facility Support Building LEED Gold 2012117 NC Dining Expansion 9/05 R 9/05 Food servery, dining LEED Plat 2012118 NC Soc Sciences & Mgmt Bldg. 11/05 R 07/07 Classroom/Labs LEED Gold 44 2012119 NC Early Childhood Ed. Center 5/08 EVP 06/08 Child Care Center LEED Silver 40 2012120 NC Student Housing Phase 3 7/08 R 09/08 Housing LEED Silver 2012121 NC Science and Engineering 2 7/09 R 9/09 Classroom/Labs LEED Platinum 88 2014122 NC Housing 4 10/10 C 8/11 Student housing LEED Gold 87 2013123 NC Recreation Center North 3/11 C 9/11 Recreation Center LEED Gold 85 2012
RIVERSIDE*124 NC Arroyo Student Housing (Glen Mor 1) 4/05 R 11/05 Apartment Housing UC Cert. 2007125 NC SASS 11/04 R 3/06 Office UC Silver 37 2009126 NC Culver Center for the Arts 11/04 C 04/06 Historical Rehab/Art Studios UC Silver 2010127 NC East Campus Child Development Center 8/06 EVP 07/08 Child Care Center UC Cert. 2009128 NC Materials Science & Engineering 11/05 R 1/06 Labs/ offices/classrooms UC Silver 2011129 NC Health Sciences Teaching Center 3/10 EVP Labs/offices/ classrooms LEED Silver 2012130 NC Glen Mor 2 Student Apts. 3/10 R Housing LEED Silver 2013131 NC Health Science Surge Building 7/10 R 9/08 Labs/offices LEED Silver 2012132 NC Engineering Bldg. Unit 3 8/10 R Classrm, Lab LEED Silver On Hold133 NC Environ. Health & Safety Expansion 11/10 R 11/08 Waste Handling Lab/Off. LEED Silver 2014134 NC Student Recreation Center Expansion 4/10 R 12/13 Recreation Center LEED Silver 2014
SAN DIEGO135 NC East Campus Graduate Housing 11/04 R 7/05 Housing UC Cert. 2012136 NC Original Student Center Phase II 11/04 SVP 5/05 Student Center UC Cert. 27 2012137 NC Price Center Expansion 11/04 R 7/05 Student Center UC Silver 26 2012138 NC San Diego Supercomputer 11/04 R 1/05 Computer Rm, Classrm UC Cert. 2012139 NC Structural Engineering 11/05 R 3/07 Research labs/offices LEED Silver 2012140 NC Cardiovascular Center 1/06 R Medical LEED Gold 2011 Gold 39141 NC RIMAC Annex 8/06 SVP 3/07 Multi-purpose UC Cert. 2012142 NC SIO Seaside Forum 11/06 P 7/07 Meeting space LEED Cert. 29 2009 Certified 29
Did not achieve Did not achieve Did not achieve
Did not achieve Did not achieve
* Riverside projects that were approved before the Policy required LEED certification were not able to collect documentation to demonstrate LEED equivalence, and are thus listed here as not having achieved the policy goal of achieving at least a LEED Certified equivalency. All Riverside projects approved in 2010 or later are pursuing actual LEED
20

ATTACHMENT INew Construction and Renovation Projects: Compliance with UC Policy on Sustainable Practices
No. Proj. Type
Name of Project Bud. Appr.
Building Type Projected Certification Date
Date By Date Rating Pts. Rating Pts.
PROJECTS IMPLEMENTED UNDER UC SUSTAINABILITY POLICY (BUDGET APPROVAL AFTER JULY 1, 2004)(State Projects that fall under this Policy are those that were included in the 2005-06 Budget and later years)
Design Appr. Proposed Rating Achieved Rating
SAN DIEGO (continued)143 NC Management School Phase 2 11/06 R 3/08 Classroom, Office UC Silver 2012144 NC Revelle College Housing 11/08 R 7/09 Apartment Housing LEED Silver 2012145 NC H&DS Administration Building 11/07 R 11/07 Office/Catering LEED Silver 34 2012146 NC Telemedicine & PRIME-Heq 3/07 SVP 11/07 Classrooms LEED Silver 2012147 NC North Campus Housing, Phase 2 1/08 R 3/09 Housing LEED Gold 2011 Gold 41148 NC North Campus Housing Phase 1 5/08 R 11/06 Housing UC Silver 2012149 NC Health Sciences Graduate Hsg 5/08 R 2/09 Housing LEED Silver 2011 Gold 41150 NC Muir College Housing/Dining 11/08 R 7/09 Housing/Dining LEED Silver 2012151 NC SIO Research Support Facilities 11/09 C 12/10 Laboratory LEED Silver 2013152 NC Health Sciences Biomedical Research
Facility 25/08 R 9/09 Research labs/offices LEED Silver 2012
153 NC SIO MESOM Facility 3/09 R 5/10 Laboratory LEED Silver 2012154 NC SIO Research Support Facilities 11/09 C 12/10 Laboratory LEED Silver 2013155 NC Jacobs Medical Center 3/10 R 7/10 Medical LEED Silver 2014156 NC Jacobs Medical Center Central Plant 3/10 R 7/10 Central Plant LEED Silver 2014157 NC East Campus Parking Structure 6/10 C 5/10 Parking LEED Gold 60 2012158 NC Torrey Pines Center North 9/10 C 9/10 Office LEED Silver 2012159 NC CTRI 11/10 R 1/12 Research/Medical LEED Silver 2015160 CI Stewart Commons 11/08 C 7/09 Dining LEED Gold 2011 Gold 32161 CI Mesa Childcare Center 8/10 P N/A Childcare facility LEED Gold 2009 Gold 33162 CI Student Resource Center 1/10 C 1/10 Office space LEED Gold 2010 Gold 32163 CI Goody's Place and Market 1/10 C 1/10 Dining LEED Silver 2010 Silver 29164 CI The Zone (Price Center) 1/10 C Office LEED Gold 2012165 CI Student Health Services 1/11 C Office LEED Silver 2012166 RE University House Rehabilitation SPIO P SPIO Rehabilitation of residence NA NA 2011 Exempted* NA
SAN FRANCISCO167 NC Diller Family Cancer Research 9/04 R 11/04 Biomedical Research UC Silver 2012168 NC 145 Irving Street 3/05 SVP Apartment Housing UC Cert. 2012169 NC The Osher Building 11/06 R 11/07 Clinic LEED Silver 36 2012 Silver 36170 NC Cardiovascular Research Building 11/07 R 11/07 Lab LEED Silver 41 2012171 NC Institute for Regenerative Medicine 3/08 R Lab LEED Silver 2011 Gold 42172 NC Mission Bay Building 19A 2/10 R 2/09 Lab, Vivarium LEED Silver 2012
* Policy exemptions are only granted when a project is still undertaking significant sustainable design measures but has programmatic or scoping constraints that would not allow for LEED certification.
21

ATTACHMENT INew Construction and Renovation Projects: Compliance with UC Policy on Sustainable Practices
No. Proj. Type
Name of Project Bud. Appr.
Building Type Projected Certification Date
Date By Date Rating Pts. Rating Pts.
PROJECTS IMPLEMENTED UNDER UC SUSTAINABILITY POLICY (BUDGET APPROVAL AFTER JULY 1, 2004)(State Projects that fall under this Policy are those that were included in the 2005-06 Budget and later years)
Design Appr. Proposed Rating Achieved Rating
SAN FRANCISCO (continued)173 NC The Aldea Center on Mount Sutro Community Center LEED Silver 38 2012174 CI HSW Dentistry Lab N/A N/A N/A Labs LEED Cert. 2005 Certified 21175 CI 654 Minnesota Street 2009 C Tenant Improvements LEED Cert. 2009 Certified 25176 CI Data Center 8/09 C Tenant Improvements LEED Silver 2009 Silver 29177 CI HSE 15 S/D Craniofacial & Mesenchymal
Biology Program Lab Renovation 9/08 C 8/08 Lab LEED Silver 2010 Gold 32
174 CI HSE 5 Center for Bioengineering and Tissue Regeneration
7/09 C 7/09 Lab LEED Cert. 2011
175 CI MSB 13 S1372 Anatomy Dept. Renovation 6/10 P 9/09 Laboratory LEED Silver 31 2011176 CI Telemedicine and PRIME-US Educational
Facilities9/06 R 9/06 Clinical Skills/Simulation Center LEED Cert. 2011
177 CI 1500 Owens Pharmacy - pending lease appr 5/09 N/A Tenant Improvements LEED Silver 2011 Gold 65178 CI 1500 Owens Third Floor Clinics Tenant Improvements LEED Silver 2012
SAN FRANCISCO MEDICAL CENTER179 NC UCSF Medical M-3 Body Interventional
Equipment Replacement10/09 P Laboratory, Hospital
180 NC Medical Center at Mission Bay 9/08 P 9/08 Hospital Gold 47 2014
SANTA BARBARA181 NC Bren Hall 7/99 R 9/99 Laboratory LEED Plat 2002 Platinum 37182 NC Marine Sc. Research Bldg 3/00 R 1/01 Laboratory LEED Cert. 28 2006 Certified 26183 NC Student Resources Building 7/02 R 10/02 Administrative LEED Silver 37 2008 Silver 36184 NC Education & Social Sc. Bldg 1/07 R 2/04 Academic LEED Silver 33 2009 Silver 36185 NC San Clemente Villages 1/06 R 2/04 Housing LEED Gold 2009 Gold 42186 NC Engineer II Addition 11/06 R 6/07 Academic LEED Silver 37 2010 Gold 42187 NC Tipton House (Sedgewick Res) 7/04 C 5/07 Academic LEED Platinum 42 2011 Platinum 53188 NC Biomedical Sciences Facility 11/08 R 8/06 Lab, Vivarium LEED Silver 2012189 NC Ocean Sc. Education Bldg 8/08 R 7/06 Academic LEED Gold 42 2012190 NC Bioengineering 6/10 R 7/10 Laboratory LEED Silver 34 2012191 NC Davidson Library Addition 4/10 R 6/10 Library LEED Silver 2012192 CI Santa Rosa Renovation Residence Hall LEED Gold 2012193 CI Alts for Physical, Biological and Social
Sciences- R - Labs UC Cert. 2016
194 H N. Campus Faculty Housing – Phase 1 - Single-Family Building 1 Faculty/Staff Housing LEED Silver 2011 Silver 55.5
22

ATTACHMENT INew Construction and Renovation Projects: Compliance with UC Policy on Sustainable Practices
No. Proj. Type
Name of Project Bud. Appr.
Building Type Projected Certification Date
Date By Date Rating Pts. Rating Pts.
PROJECTS IMPLEMENTED UNDER UC SUSTAINABILITY POLICY (BUDGET APPROVAL AFTER JULY 1, 2004)(State Projects that fall under this Policy are those that were included in the 2005-06 Budget and later years)
Design Appr. Proposed Rating Achieved Rating
SANTA BARBARA (continued)195 H N. Campus Faculty Housing – Phase 1 - SF Building 2 Faculty/Staff Housing LEED Silver 2011 Silver 55.5196 H N. Campus Faculty Housing – Phase 1 - SF Building 3 Faculty/Staff Housing LEED Silver 2011 Silver 55.5197 H N. Campus Faculty Housing – Phase 1 - SF Building 4 Faculty/Staff Housing LEED Silver 2011 Silver 55.5198 H N. Campus Faculty Housing – Phase 1 - SF Building 5 Faculty/Staff Housing LEED Silver 2011 Silver 55.5199 H N. Campus Faculty Housing – Phase 1 - SF Building 6 Faculty/Staff Housing LEED Silver 2011 Silver 55.5200 H N. Campus Faculty Housing – Phase 1 - SF Building 12 Faculty/Staff Housing LEED Silver 2011 Silver 55.5201 H N. Campus Faculty Housing – Phase 1 - SF Building 13 Faculty/Staff Housing LEED Silver 2011 Silver 55.5202 H N. Campus Faculty Housing – Phase 1 - SF (2 units) Building 7 Faculty/Staff Housing LEED Gold 2011 Gold 70.5203 H N. Campus Faculty Housing – Phase 1 - SF (2 units) Building 8 Faculty/Staff Housing LEED Gold 2011 Gold 70.5204 H N. Campus Faculty Housing – Phase 1 - SF (2 units) Building 9 Faculty/Staff Housing LEED Gold 2011 Gold 70.5205 H N. Campus Faculty Housing – Phase 1 - Multi-F (4 units) Bdg 10 Faculty/Staff Housing LEED Gold 2011 Gold 68206 H N. Campus Faculty Housing – Phase 1 - Multi-F (4 units) Bdg 11 Faculty/Staff Housing LEED Gold 2011 Gold 68
SANTA CRUZ207 NC Biomedical Sciences Facility 11/07 R 8/06 Lab, Vivarium LEED Silver 38 2012208 NC Cowell Student Health Center 1/08 R 1/08 exam rooms/offices LEED Silver 36 2011 Gold 46209 NC Porter College Phase 1-House B & Dining 3/08 R 7/08 Housing/dining LEED Silver 2010 Silver 33210 NC Coastal Biology Building 10/08 R 11/08 Laboratory LEED Silver 2014211 NC Porter College Phase 2-House A 11/08 R 5/09 Housing LEED Silver 2012212 NC East Campus Infill Housing 5/09 R 7/09 Housing LEED Silver 2014213 CI Cowell College Commons Seismic Renew 12/07 R 1/08 Dining Commons LEED Cert. 24 2010 Certified 21214 CI Alts for Physical, Biological and Social Scien N/A R N/A Labs UC Cert. 2016215 CI Porter College C LEED Silver 2011 Silver 27
23

Attachment II Progress Toward 2014 UC Climate Goals
How to read these graphs The following graphs show campus emissions data for 2009 and 2010, in relation to the University’s policy goal of reducing emissions to year 2000 levels by 2014. UCLA’s 2009 and 2010 emissions are also shown with reference to the University’s policy goal of reducing emissions to 1990 levels by 2020.
Some campuses have also adopted emission reduction targets that are more ambitious than UC policy. In these cases, the graphs also show campus-specific commitments.
Campus-identified greenhouse gas abatement measures are depicted in the pie charts to the right of the bar graphs. Abatement measures are classified by project type (e.g., energy efficiency, renewable energy, transportation, etc.). They are further categorized as “under way or imminent,” “proven technology or approach with uncertain funding & support,” or “conceptual.”
1. Underway or imminent: Emission reductions from campus-implemented projects for which a feasibility study has been completed (where necessary) and/or at least partial funding has been identified. Example: 1) Efficiency retrofit projects committed to during the current round of the Energy Efficiency Partnership;
2. Proven technology/approach, uncertain funding/support: Emission reductions that rely on proven technologies/methods/policy initiatives and are expected to be effective, but for which a feasibility study (if necessary) has not been conducted, funds have not been identified, and/or needed support has not been granted. Examples: 1) Energy efficiency retrofits beyond the current Partnership funding horizon; 2) Onsite renewable energy projects using existing technology, but for which no power purchase agreement or budget allocation exists.
3. Conceptual: Emission reductions that rely on technology that is currently unavailable at scale, and/or a
policy initiative that has never been tested, and/or action by a third-party over which the University has no control. Conceptual measures are contingent upon further study and demonstration of overall cost-effectiveness. Examples: 1) Carbon neutral air transportation fuels; 2) utility-supplied renewable energy beyond what is required be the State’s Renewable Portfolio Standard law.
Data are based on emissions of carbon dioxide, methane, nitrous oxide, sulfur hexafluoride, hydrofluorocarbons, and perfluorocarbons associated with scope 1, scope 2, and scope 3 emissions, defined below.
• Scope 1 encompasses emissions that result directly from campus activities, primarily fossil fuel combustion.
• Scope 2 covers emissions associated with electricity and steam that are generated by a third party and sold to a campus.
• Scope 3 refers to emissions resulting from faculty, student, and staff commute, and from university-funded air travel.
All data are displayed in metric tonnes of carbon dioxide equivalent (CO2e), which normalizes measurement of greenhouse gasses based on their climate impact compared to carbon dioxide.
24

Attachment II Progress Toward 2014 UC Climate Goals
An important note regarding campus growth
The graphs in this report do not include forecasts for campus growth. While several campuses are currently below UC policy targets for 2014 emissions levels, growth in energy-intensive building space and increases in student, faculty, and staff populations will exert upward pressure on campus emissions levels. Since UC’s emissions reduction goals are absolute (i.e., not growth-adjusted), most campuses have accounted for future growth by identifying additional abatement measures to offset increased emissions from new buildings and increased population.
Data quality and consistency and reporting
Overall campus inventories are developed using the best available data and methods and are subject to change as the state of the art evolves. Inventorying greenhouse gas emissions is not an exact science, and while the University takes steps to maintain quality and consistency of data, variations based on differing methods of data collection are inevitable. Reflecting the uncertainty of the data, the emissions numbers included in the text boxes on each graph have been rounded to the nearest thousand tonnes.
On an annual basis, all campuses catalog scope 1 and scope 2 emissions using The Climate Registry’s General Reporting Protocol. The Climate Registry is a non-profit entity that sets consistent and transparent standards to calculate, verify and publicly report greenhouse gas emissions. As members of The Climate Registry, campuses obtain third party verification of scope 1 and scope 2 inventories and report these inventories through The Climate Registry’s website.
At the time of this report, some campuses had received third-party verification for their scope 1 & 2 inventories, while other campuses were still awaiting verification. The verification status of each campus’s inventory is noted below that campus’s graph.
Because the University is a signatory to the American College and University Presidents Climate Commitment (ACUPCC), campuses also report their emissions data on the ACUPCC website.
Scope 3 emissions are reported based on best available information and using methods best suited to each campus. There is a higher degree of comparability between campuses’ scope 1 and scope 2 emissions inventories than there is between inventories of scope 3 emissions.
UC policy does not require that campuses conduct annual inventories of scope 3 emissions. In cases where campuses did not conduct scope 3 inventories for 2009, 2010 data was included to provide a more representative picture of overall campus emissions levels. In cases where 2010 scope 3 data was unavailable, 2009 data was included. These instances are documented in the "notes” section of the campus graphs.
25

Attachment II, Progress Toward 2014 UC Climate Goals
Energy efficiency - underway or imminent
Water efficiency and waste reduction - proven technology and approach, uncertain funding or support
Renewable energy onsite - proven technology and approach, uncertain funding or support
Renewable energy from the grid - Conceptual
Transportation - underway or imminent
Energy conservation / behavior changes - underway or imminent
RECs/Offsets - proven technology or approach, uncertain funding & support
Biomethane - conceptual
0
50,000
100,000
150,000
200,000
250,000
300,000
350,000
2009 2010
met
ric
tonn
es o
f CO
2e
2009 emissions 2010 emissions
2014 UC policy goal 2014 campus commitment
Notes:
• In 2007, UC Berkeley committed to reducing its greenhouse gas emissions to 1990 levels by 2014.
• UC Berkeley’s emissions levels are currently below the 2014 UC policy goal because the campus switched to PG&E as its electricity provider in 2006. PG&E provides less carbon-intensive power generation than the previous provider.
• Third-party verification of 2009 and 2010 scope 1 & scope 2 emissions inventories is underway.
• The results of the preliminary UC Berkeley 2010 Greenhouse Gas Inventory reveal an increase in greenhouse gas (GHG) emissions of 0.8%, or about 1,400 metric tons CO2e, relative to the 2009 inventory. Even with this small increase in 2010, emissions are still almost 5% below 2008 levels. Electricity use in 2010 is down 1.1% on the main campus and 1.5% overall relative to 2009.
UC Berkeley’s 2009 and 2010 Emissions Levels in Relation to the 2014 UC Policy Goal and Campus Commitment How UC Berkeley Plans to Achieve its 2014 Campus Commitment
Campus is 54,000 tonnes below 2014 UC policy goal
Campus is 31,000 tons above 2014 campus commitment
Total abatement identified: 37,000 metric tonnes CO2e
26

Attachment II, Progress Toward 2014 UC Climate Goals
0
50,000
100,000
150,000
200,000
250,000
300,000
350,000
2009 2010
met
ric
tonn
es C
O2e
2009 emissions 2010 emissions
2014 UC policy goal 2014 campus stretch goal Energy efficiency - underway or imminent
Energy efficiency - proven technology and approach, uncertain funding & support
Renewable energy onsite - underway or imminent
Renewable energy onsite - proven technology and approach, uncertain funding & support
Renewable energy from the grid - proven technology and approach, uncertain funding & support
Energy conservation / behavior changes - underway or imminent
Energy conservation / behavior changes - proven technology or approach, uncertain funding & support
Notes:
• UC Davis has adopted a campus “stretch” goal of reducing scope 1 & scope 2 emissions to 10% below year 2000 levels by 2014.
• Third-party verification of the 2010 scope 1 & 2 emissions inventory is complete.
• UC Davis achieved reductions of over 36,000 metric tonnes CO2e with energy efficiency projects between 1999-2009.
• Davis campus has a policy of exceeding Title 24 energy provisions by 25%, 5% more than required by UC policy.
• The UC Davis fleet has in use 99 CNG-powered vehicles, 63 electric and neighborhood electric vehicles, 53 hybrid sedans and 17 plug-in hybrid electric (PHEV) sedans. Approximately 100 campus vehicles run on B20 biodiesel.
UC Davis’s 2009 and 2010 Emissions Levels in Relation to the 2014 UC Policy Goal and Campus “Stretch” Goal How UC Davis Plans to Achieve its 2014 Stretch Goal
Campus is 15,000 tonnes below 2014 UC policy goal
Campus is 21,000 tons above 2014 campus commitment
Total abatement identified: 34,000 metric tonnes CO2e
27

Attachment II, Progress Toward 2014 UC Climate Goals
0
50,000
100,000
150,000
200,000
250,000
300,000
350,000
2009 2010
met
ric
ton
nes
CO
2e
2009 emissions 2010 emissions 2014 UC policy goal
Energy efficiency - underway or imminent
Energy efficiency - proven technology and approach, uncertain funding or support
Renewable energy onsite - underway or imminent
Renewable energy onsite - proven technology and approach, uncertain funding or support
Renewable energy onsite - conceptual
Transportation - underway or imminent
Transportation - proven technology and approach, uncertain funding or support
Energy conservation / behavior changes - underway or imminent
Biomethane - conceptual
Notes:
• Third-party verification of the 2010 scope 1 & scope 2 emissions inventory is underway.
UC Irvine’s 2009 & 2010 Emissions Levels in Relation to the 2014 UC Policy Goal
How UC Irvine Plans to Achieve the 2014 UC Policy Goal
Campus is 27,000 tonnes above 2014 UC policy goal
Total abatement identified: 43,000 metric tonnes CO2e
28
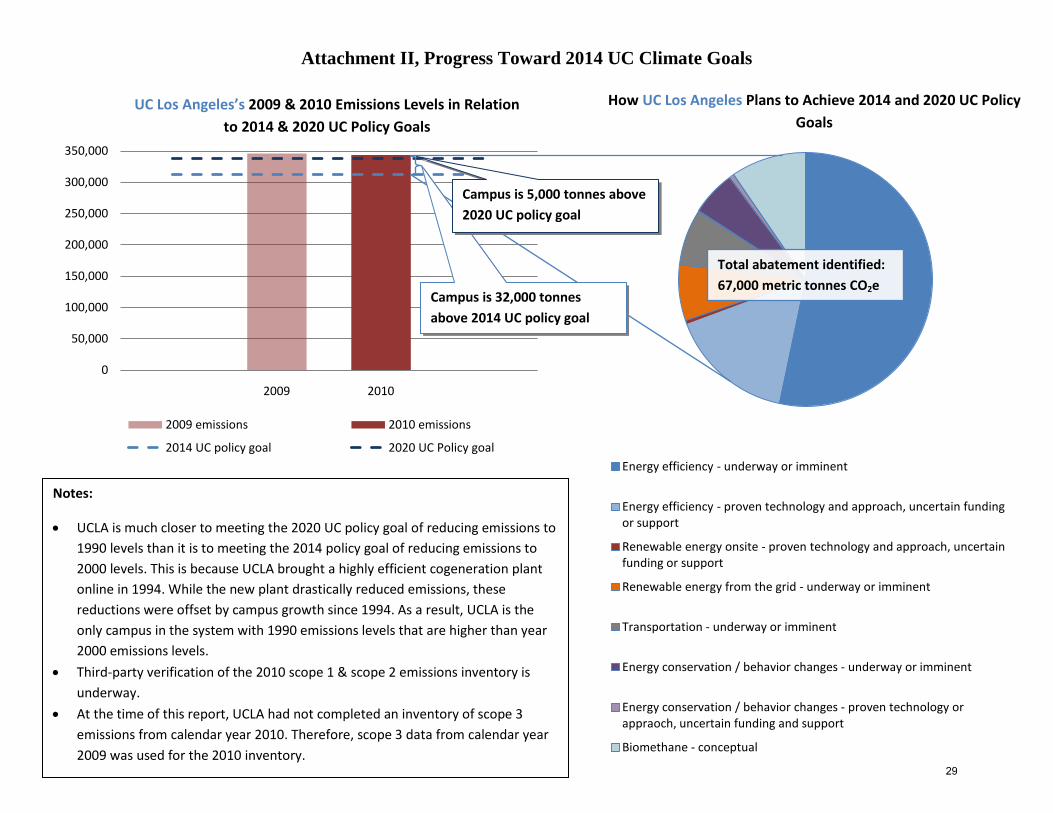
Attachment II, Progress Toward 2014 UC Climate Goals
0
50,000
100,000
150,000
200,000
250,000
300,000
350,000
2009 2010
2009 emissions 2010 emissions
2014 UC policy goal 2020 UC Policy goalEnergy efficiency - underway or imminent
Energy efficiency - proven technology and approach, uncertain funding or support
Renewable energy onsite - proven technology and approach, uncertain funding or support
Renewable energy from the grid - underway or imminent
Transportation - underway or imminent
Energy conservation / behavior changes - underway or imminent
Energy conservation / behavior changes - proven technology or appraoch, uncertain funding and support
Biomethane - conceptual
Notes:
• UCLA is much closer to meeting the 2020 UC policy goal of reducing emissions to 1990 levels than it is to meeting the 2014 policy goal of reducing emissions to 2000 levels. This is because UCLA brought a highly efficient cogeneration plant online in 1994. While the new plant drastically reduced emissions, these reductions were offset by campus growth since 1994. As a result, UCLA is the only campus in the system with 1990 emissions levels that are higher than year 2000 emissions levels.
• Third-party verification of the 2010 scope 1 & scope 2 emissions inventory is underway.
• At the time of this report, UCLA had not completed an inventory of scope 3 emissions from calendar year 2010. Therefore, scope 3 data from calendar year 2009 was used for the 2010 inventory.
UC Los Angeles’s 2009 & 2010 Emissions Levels in Relation to 2014 & 2020 UC Policy Goals
How UC Los Angeles Plans to Achieve 2014 and 2020 UC Policy Goals
Campus is 32,000 tonnes above 2014 UC policy goal
Campus is 5,000 tonnes above 2020 UC policy goal
Total abatement identified: 67,000 metric tonnes CO2e
29

Attachment II, Progress Toward 2014 UC Climate Goals
0
50,000
100,000
150,000
200,000
250,000
300,000
350,000
2009 2010
Met
ric
ton
nes
CO
2e
2009 emissions 2010 emissions 2014 UC policy goal
Renewable energy onsite - proven technology and approach, uncertain funding or support
Renewable energy from the grid - conceptual
Energy efficiency - underway of imminent
Biomethane - conceptual
Notes:
• UC Merced has committed to eliminating or offsetting its scope 1 & 2 emissions by 2020. In the chart above, UC Merced’s 2009 and 2010 emissions are shown with reference to its forecasted 2020 scope 3 emissions.
• Third-party verification of the 2010 scope 1 & scope 2 emissions inventory is underway.
• Scope 3 data from 2009 was used for the 2010 inventory.
How UC Merced Plans to Achieve 2014 UC Policy Goal UC Merced’s 2009 & 2010 Emissions Levels in Relation to 2014 UC Policy Goal
Campus is 11,000 tons above 2014 UC policy goal
Total abatement identified: 14,000 metric tonnes CO2e
30

Attachment II, Progress Toward 2014 UC Climate Goals
0
50,000
100,000
150,000
200,000
250,000
300,000
350,000
2009 2010
Met
ric
ton
nes
CO
2e
2009 emissions 2010 emissions 2014 UC policy goal
Notes:
• The reduction in campus emissions from 2009 to 2010 is attributable to changes in Riverside Public Utility’s (RPU) generation mix.
• Third-party verification of the 2010 scope 1 & scope 2 emissions inventory is underway.
Renewable energy from the grid - underway or imminent
Transportation - underway or imminent
Energy conservation / behavior changes - underway or imminent
Biomethane - conceptual
UC Riverside’s 2009 & 2010 Emissions Levels in Relation to the 2014 UC Policy Goal
How UC Riverside Plans to Meet the 2014 UC Policy Goal
Campus is 17,000 tonnes below 2014 UC policy goal
Total abatement identified: 35,000 metric tonnes CO2e
31

Attachment II, Progress Toward 2014 UC Climate Goals
0
50,000
100,000
150,000
200,000
250,000
300,000
350,000
2009 2010
Met
ric
ton
nes
CO
2e
2009 emissions 2010 emissions 2014 UC policy goal
Energy efficiency - underway or imminent
Renewable energy onsite - underway or imminent
Transportation - underway or imminent
Transportation - proven technology or approach, uncertain funding & support
RECs/Offsets - proven technology or approach, uncertain funding & support
Biomethane - conceptual
Notes:
• Third-party verification of the 2010 scope 1 & scope 2 emissions inventory is underway.
• UC San Diego has set of goal of achieving carbon neutrality by 2025
UC San Diego’s 2009 & 2010 Emissions Levels in Relation to the 2014 UC Policy Goal How UC San Diego Plans to Meet the 2014 UC Policy Goal
Total abatement identified: 137,000 metric tonnes CO2e
Campus is 115,000 tonnes above 2014 UC policy goal
32

Attachment II, Progress Toward 2014 UC Climate Goals
0
50,000
100,000
150,000
200,000
250,000
300,000
350,000
2009 2010
Met
ric
ton
nes
CO
2e
2009 emissions 2010 emissions 2014 UC policy goal
Energy efficiency - underway or imminent
Energy conservation / behavior changes - underway or imminent
Biomethane - conceptual
Transportation - conceptual
Notes:
• Third-party verification of the 2009 and 2010 scope 1 & scope 2 emissions inventories is underway.
UC San Francisco’s 2009 & 2010 Emissions Levels in Relation to
the 2014 UC Policy Goal
Campus is 13,000 tonnes above 2014 UC policy goal
How UC San Francisco Plans to Meet the 2014 UC Policy Goal
Total abatement identified: 14,000 metric tonnes CO2e
33

Attachment II, Progress Toward 2014 UC Climate Goals
0
50,000
100,000
150,000
200,000
250,000
300,000
350,000
2009 2010
Met
ric
ton
nes
CO
2e
2009 emissions 2010 emissions 2014 UC policy goal
Energy efficiency - underway or imminent
Renewable energy onsite - underway or imminent
Renewable energy onsite - proven technology and approach, uncertain funding or support
Renewable energy from the grid - proven technology and approach, uncertain funding or support
Renewable energy from the grid - conceptual
Energy conservation / behavior changes - proven technology or approach, uncertain funding & support
Energy conservation / behavior changes - conceptual
Biomethane - conceptual
Notes:
• Third-party verification of the 2010 scope 1 & scope 2 emissions inventory is complete.
UC Santa Barbara’s 2009 & 2010 Emissions Levels in Relation to
the 2014 UC Policy Goal How UC Santa Barbara Plans to Meet the 2014 UC Policy Goal
Campus is 3,000 tonnes below 2014 UC policy goal
Total abatement identified: 19,000 metric tonnes CO2e
34

Attachment II, Progress Toward 2014 UC Climate Goals
0
50,000
100,000
150,000
200,000
250,000
300,000
350,000
2009 2010
Met
ric
ton
nes
CO
2e
2009 emissions 2010 emissions 2014 UC policy goal
Energy efficiency - underway or imminent
Energy efficiency - proven technology or approach, uncertain funding & support
Renewable energy onsite - underway or imminent
Renewable energy onsite - proven technology or approach, uncertain funding & support
Renewable energy from the grid - conceptual
Transportation - conceptual
Energy conservation / behavior changes - proven technology or approach, uncertain funding & support
Energy conservation / behavior changes - conceptual
Biomethane - conceptual
Notes:
• Third-party verification of the 2009 and 2010 scope 1 & scope 2 emissions inventories is underway.
UC Santa Cruz’s 2009 & 2010 Emissions Levels in Relation to the 2014 UC Policy Goal
How UC Santa Cruz Plans to Meet the 2014 UC Policy Goal
Total abatement identified: 20,000 metric tonnes CO2e
Campus is 4,000 tonnes below 2014 UC policy goal
35

Attachment III Fleet Fuel Consumption Data
This attachment shows the trends in fuel consumed by UC vehicular fleets over time, as well as trends in greenhouse gas emissions from those vehicles. Fuel consumption figures are broken down by vehicle type to show that fleets are comprised of shuttle buses, vanpools and trucks as well as traditional passenger vehicles. Vanpools and shuttle buses reduce the amount of single occupancy vehicles, thus reducing GHG emissions from commuting. Fleets continue to expand use of alternative fuels. Compressed Natural Gas (CNG) use is up by ten percent over last year, because of the increased number of CNG buses. Biodiesel use has decreased by nine percent because of fleets electing to switch to CNG vehicles. Unleaded gas consumption is down three percent, while diesel consumption is up three percent. 2010-11 Fuel Consumption and associated CO2 emissions
The amount and proportion of unleaded gas has gone down over the last several years as campuses increase their use of alternative fuel vehicles.
Data is differentiated by vehicle type to show that shuttles account for an increasing proportion of greenhouse gas emissions associated with campus fleet. Shuttles typically carry more passengers than other vehicle types. Thus, although overall emissions have remained steady over the past three years, the emissions per passenger carried have likely decreased.
36

Attachment IV 2011 Awards and Rankings
Artist’s rendering of UC Merced at full build-out
Solar panels on a UC Irvine roof
Awards
UC Merced Campus Plan Wins National Award The Society for College and University Planning has announced that the University of California, Merced has earned an Excellence in Planning for an Established Campus honor award for its Long-Range Development Plan. The plan will be used to guide the campus physical growth, development and land-use priorities. Included within the plan is a Triple Zero Commitment that aims to produce as much energy from renewable sources as is used, eliminate landfill waste and produce zero net greenhouse gas emissions by 2020. http://ucmercednews.blogspot.com/2011/04/campus-plan-wins-national-award.html http://www.sacbee.com/2011/04/20/3567618/uc-merceds-long-range-development.html
UCLA honored for sustainability curriculum Joining notable peer schools like Stanford Graduate School of Business, Harvard Business School and Michigan's Ross School of Business, UCLA has received the 2010 Dr. Alfred and Lynn Manos Page Prize for Sustainability Issues in Business Curricula. UCLA was recognized for its Leaders in Sustainability certificate program, a joint venture between the Institute on the Environment and the Anderson School of Management. The Page Prize encourages efforts to expose business students to state-of-the-art environmental sustainability knowledge. The 2010 Page prize was announced and presented in 2011. http://sustain.ucla.edu/article.asp?parentid=10878
Second Nature recognizes climate leadership at UC Irvine Second Nature recently honored several institutions with its 2nd Annual Climate Leadership Award. Award recipients, recognized during the 5th Annual American College & University Presidents' Climate Commitment (ACUPCC) Summit on June 23, include University of Maryland, College Park; University of Maine; University of California, Irvine; Frostburg State University (MD); Delaware State University; Green Mountain College (VT); Colgate University (NY); Mount Wachusett Community College (MA); Montgomery County Community College (NC); and Bunker Hill Community College (MA). UCI news release: http://today.uci.edu/news/2011/06/nr_acupcc_110623.php
37

Attachment IV 2011 Awards and Rankings
Shuttle buses at UC Los Angeles
UC Davis has fourth greenest vehicle fleet according to 100 Best Fleets Program UC Davis has been named the #4 Green Government Fleet in North America by the 100 Best Fleets Program, a fleet industry program that recognizes high performing fleet operations in North America. The 100 Best Fleets award, now in its seventh year, identifies and encourages continuous improvement in the use of green technology in the fleet industry. The campus’s #4 ranking is up from #11 last year. According to Richard Battersby, director of Fleet Services, “This recognition is acknowledgement of a true team effort, since the evaluation criteria include categories expertly handled on campus by our Fleet Services staff as well as our colleagues in [Transportation and Parking Services] and Unitrans.” http://www.the100bestfleets.com/gf_winners_2010.htm http://www.the100bestfleets.com/gf_about.htm
UCD, UCLA, and UCSD Fleet and Transit Directors named Sustainability All-Stars Richard Battersby of UC Davis, Sherry Lewis of UCLA, and Jim Ruby of UC San Diego were selected as Sustainability All-Stars by Green Fleet magazine. They are among the 50 individuals nationwide to earn this distinction, given to individuals who have made significant contributions to environmental sustainability in the fleet industry. The three UC leaders are featured, along with all the newly named Sustainability All-Stars, in the September/October issue of Green Fleet magazine and were honored at the 2011 Green Fleet Conference in Grapevine, Texas on October 3-4. http://www.greenfleetmagazine.com/article/50622/40-sustainability-sluggers-first-ever-all-star-awards/p/4 UCLA, UCI win awards for alternative commuting programs UCLA Transportation wins the top Corporate Blue Diamond Award for pioneering development and robust management of wide array of commuting options for a daily campus population of 65,000. When all efforts to mitigate traffic are considered, UCLA generates less vehicle traffic today than it did in 1990, despite a 30 percent growth in the campus population. Awards for Orange County top efforts in commuting and parking management on behalf of their employees and the community went to "ETC of the Year" Michael Davis of U.C. Irvine. http://today.ucla.edu/portal/ut/staff-applause-transportation-204302.aspx http://www.metro.net/news/simple_pr/a-sweet-ride-annual-Diamond-Awards-showcase-commut/ UCSC Health Center receives sustainable design award from Structural Engineers Association UC Santa Cruz continues to earn recognition and honors for the newly completed "green" renovation of the Cowell Student Health Center. Previously, the building earned the campus its first "Gold" certification from LEED, a non-profit trade organization that promotes sustainability in the design, construction and daily operation of buildings. That recognition was the end result of a four-year, $17 million project to expand and
38

Attachment IV 2011 Awards and Rankings
UC Davis Graduate School of Management’s Gallagher Hall
seismically retrofit the 42-year-old health center, while making the building more energy efficient and environmentally friendly. Now, the Structural Engineers Association of Northern California has selected the health center for a merit award in the category of sustainable design. The jury of five members included two structural engineers, a structural engineering professor, a general contractor and an architect. They evaluated 27 entries in eight categories. http://news.ucsc.edu/2011/04/more-honors-for-health-center.html UC San Francisco and UCLA Medical Centers win awards from Practice Greenhealth
Recognizing sustainability leadership in the challenging healthcare setting, the organization Practice Greenhealth honored the San Francisco Medical Center with a Partner for Change with Distinction award and the Los Angeles Medical Center with a
Partner for Change award. The awards recognize health care facilities that have established environmental programs and continuously improve and expand upon these programs on the path to sustainability. http://practicegreenhealth.org/awards/award-winners
UC Davis, UC Irvine, and UC San Francisco win 2011 National Design-Build Awards for campus projects
The UC Davis Graduate School of Management’s (GSM) Maurice J. Gallagher Jr. Hall includes a three-story office/classroom structure and a related, two-story Conference Center providing a restaurant, café, office space, meeting rooms and a one-story ballroom. Enabled by a team-wide commitment to Building Information Management, the GSM – delivered on time and under budget – demonstrates that design-build can lead to exceptional levels of innovation, superior building performance, client satisfaction and award-winning design character at no cost premium.
UC Irvine’s Engineering Unit 3 was the seventh campus project constructed by Hensel Phelps. The project provided 122,000 gross square feet primarily consisting of wet and dry labs for five engineering departments and a 340-seat lecture hall. The facility is used to foster a growing trend toward collaborative inquiry between faculty in the School of Information and Computer Sciences and the California Institute for Telecommunications and Information Technology.
UC San Francisco’s Dolby Regenerative Medicine Building houses the Eli and Edythe Broad Center of Regeneration Medicine and Stem Cell Research at UCSF. Nestled in the sloping hillside of UCSF’s Parnassus campus, the $123-million, 660-foot-long LEED-Gold facility features a serpentine design with four split-level
39

Attachment IV 2011 Awards and Rankings
floors and terraced green roofs, sitting on a structural framework 40 to 70 feet off the ground. http://www.dbia.org/about/awards/national/2011projects.htm
US EPA’s National Partnership for Environmental Priorities recognizes UC Davis, UC Irvine, UCLA, and UC San Diego
• UC Davis: Second Largest Fleet in the University of California System successfully “Got the Lead Out”. The UC Davis Fleet, with over 1,100 pieces of equipment, successfully eliminated a total of 243 pounds of lead by replacing lead wheel weights.
• UC Irvine: The fleet services of UCI accomplished its lead-free wheel weight partnership for the complete fleet, eliminating 300 pounds of lead. With the support of its campus sustainability program and a vendor, UCI also ran a rebate program to encourage all university personnel, students and employees to have steel wheel weights installed on their automobiles.
• University of California-Los Angeles: UCLA removed over 28 pounds of mercury from 3,000 wet labs. The hazmat team collected thermometers as well as barometers and sphygmomanometers, which all contain mercury. All new equipment on campus is now mercury-free.
• University of California San Diego: Fleet Services serves over 900 vehicles and installed zinc coated steel weights instead of lead, preventing 40 pounds of lead from getting into the environment.
The National Partnership for Environmental Priorities (NPEP) is a voluntary program that fosters collaborative efforts to reduce the use and/or release of highly toxic chemicals and share best practices: http://www.epa.gov/epawaste/partnerships/npep/success.htm
UC San Francisco and UC Irvine win “Gold” awards in national sustainable transportation competition Best Workplaces for Commuters, a program designed to encourage sustainable transportation innovation and managed by the University of South Florida’s National Center for Transit Research, singled out UCSF and UCI, among 21 other companies, institutions and individuals nationwide, in the 2010 “Race to Excellence” Virtual Awards Ceremony (awards were given in January 2011). The awards recognize organizations who have taken exemplary steps to for their efforts to offer alternatives for their employees driving alone and thereby reduce air pollution, traffic congestion, and fuel usage from Jan. 1, 2010 to Oct. 15, 2010. UCSF was further recognized with a “Best Of” distinction for meeting the National Standard of Excellence in commuter benefits – a standard created by the National Center for Transit Research and the U.S. Environmental Protection Agency. http://www.bestworkplaces.org/race-to-excellence-2/2010-race-winners/
UC Irvine wins “Best of the Best” sustainability award from the Urban Land Institute for “Organizational Leadership” The Orange County/Inland Empire chapter of the Urban Land Institute (ULI) presented UC Irvine with the first ever “Best of the Best” sustainability award for “Organizational Leadership.” The award is a program of the ULI’s Sustainable Communities Initiatives Council and recognizing projects, programs and policies of exceptional value in Orange County and the Inland Empire. http://orangecounty.uli.org/News%20Awards/~/media/DC/Orange%20County/2011%20Documents/BOB%20A
40

Attachment IV 2011 Awards and Rankings
UC Irvine’s Zot Wheels bike sharing program
Bicycles at UC Santa Barbara
wards%20Booklet%20for%20Web.ashx http://orangecounty.uli.org/News%20Awards/Best%20of%20the%20Best%20Awards.aspx
UC Irvine bike-sharing program wins award from the American Society of Public Administration
UC Irvine won the 2011 President’s Award from the American Society for Public Administration for its “Zot Wheels” program. Zot Wheels is a bike-sharing service that provides dozens of bikes for use by UC Irvine faculty, students, and staff. Bikes are available at stations throughout campus and can be checked out for up to three
hours. For more on Zot Wheels, see: http://www.parking.uci.edu/zotwheels/main.cfm
UC Irvine Transportation Coordinator wins Rideshare Diamond Award for Individual Achievement UC Irvine Transportation Coordinator Mike Davis received a 2011 individual achievement Diamond Award for his contribution to UCI’s sustainable transportation efforts. The Diamond Awards honor companies, organizations, and individuals for their outstanding contributions to relieving traffic congestion, reducing greenhouse gas emissions, and improving mobility in the southland region. Diamond Award-winning organizations promote alternatives to driving alone, including vanpooling, carpooling, use of public transit, teleworking, flexible scheduling, walking, biking, or a combination of these. http://www.parking.uci.edu/parking/pop.cfm
UC Davis, UC Santa Barbara, UC Irvine, UCLA, and UC Berkeley among the most bike friendly campuses in the country The League of American Bicyclists has announced the institutions to receive its Bicycle Friendly University designation. The program recognizes colleges and universities that create environments where bicycling can thrive and provides a roadmap and technical assistance to create great campuses for bicycling. Both Gold designations went to UC campuses - UC Davis and University of California, Santa Barbara. One of the nine Silver designations went to UC Irvine, UCLA earned recognition at the Bronze level, and UC Berkeley received an honorable mention.
http://www.bikeleague.org/programs/bicyclefriendlyamerica/bicyclefriendlyuniversity/pdfs/bfu_masterlist_october2011.pdf http://www.bikeleague.org/programs/bicyclefriendlyamerica/bicyclefriendlyuniversity/index.php
http://www.ia.ucsb.edu/pa/display.aspx?pkey=2444
41

Attachment IV 2011 Awards and Rankings
Rankings and Ratings
UCLA achieves STARS Silver rating UCLA earned a Silver rating in the Association for the Advancement of Sustainability in Higher Education’s (AASHE) Sustainability Tracking Assessment and Rating System (STARS). https://stars.aashe.org/institutions/university-of-california-los-angeles-ca/report/2011-08-02/
UCSD achieves STARS Gold rating UC San Diego has been named the first college or university in California and one of only 10 campuses in the United States and Canada to earn a gold sustainability-performance rating. “This gold rating attests to the collaborative efforts made by our students, staff, faculty, and community members to pioneer sustainable solutions,” said UC San Diego Chancellor Marye Anne Fox. “In the six years since I declared sustainability a top educational priority and goal of all campus operations, UC San Diego has been
transformed into a living laboratory of sustainability solutions. From economics to mechanical engineering, academic departments have incorporated sustainability concepts into majors, minors, internships, classes and a wide range of research experiences.” http://ucsdnews.ucsd.edu/newsrel/general/05-20-11GoldStars.asp
Sierra magazine ranks four UC campuses among the Top 10 Greenest Colleges in America Four UC campuses are among Sierra magazine's Top 10 Greenest Colleges in America for 2011, highlighting the University of California's commitment to sustainability. UC San Diego was third, UC Irvine sixth, UC Santa Cruz seventh and UC Davis eighth on Sierra Magazine's fifth annual rankings. Also making the list were UCLA at No. 15 and UC Santa Barbara at No. 72. UC San Diego jumped to third from 15th in last year's rankings by Sierra magazine, the flagship publication of the Sierra Club, one of the nation's most influential environmental organizations.
http://ucsdnews.ucsd.edu/newsrel/general/2011_08ucranks.asp http://news.ucsc.edu/2011/08/sierra-club-cool-schools-UCSC-recognition.html http://www.sierraclub.org/sierra/201109/coolschools/ http://www.businessweek.com/bschools/blogs/mba_admissions/archives/2011/08/the_sierra_club_ranks_coolest_schools.html
42

Attachment IV 2011 Awards and Rankings
UCSC makes Princeton Review’s honor roll of 16 greenest colleges in the country UC Santa Cruz is piling up so many high-profile sustainability rankings and honors that its easy to lose track of them all. But UCSCs latest recognition, in the Princeton Reviews newly published green colleges guidebook, is more than just another honor. Its also a history of successful green-energy projects on campus. The Princeton Review has given the campus a prominent, detailed and highly complimentary entry in The Princeton Review's Guide to 311 Green Colleges: 2011 Edition, which profiles 308 eco-friendly colleges and universities in the United States and three in Canada. http://news.ucsc.edu/2011/04/princeton-review-green-campuses.html http://www.princetonreview.com/green-honor-roll.aspx University of Indonesia names UC Berkeley as the world’s greenest university
The University of Indonesia has named UC Berkeley the world's "greenest" university. In its index released last month, the Jakarta school ranked Berkeley's environmental policies and other factors just ahead of the University of Nottingham in the United Kingdom. Northeastern University in Boston was third on the list. "It's really nice to be recognized, especially by your peers," said Lisa McNeilly, UC Berkeley's sustainability director. The Indonesian list is one of many that measure universities' commitment to environmentalism and renewable energy. In a news release, the Jakarta school did not specifically say what had elevated Berkeley over other institutions, but said its researchers measured energy efforts, transportation and water use, among other factors. UC Berkeley is trying to reduce its greenhouse-gas emissions to 1990 levels by 2014, McNeilly said. Students interested in choosing a "green" college should look at a variety of rankings, she said. "Sustainability can be so many things," she said. "When you put (the lists) all together, I think you see a complete picture of where an institution stands." http://www.berkeleyside.com/2011/01/24/uc-berkeley-is-ranked-the-worlds-greenest-university/
College guide places UC Davis in the top ten for environmental studies undergraduate program In the 2011 edition of the Fiske Guide to Colleges, UC Davis was listed as one of the top 10 environmental studies undergraduate degree programs. This listing was noted by the Daily Green blog and Mother Nature News.UC Davis was described as a "research-driven campus ... renowned for its innovations in the environmental, agricultural and biological sciences" as well as sustainable transportation and alternative energy. http://www.thedailygreen.com/living-green/blogs/recycling-design-technology/best-environmental-studies-colleges-460710?click=main_sr http://www.mnn.com/money/green-workplace/blogs/top-10-environmental-studies-programs
43