university of canberra
TRANSCRIPT

Adoption of the smart system & its impact on organizational
performace in the United Arab Emirates.
By
Sultan Alyammahi (Bachelor of Arts in Public Communication, University of Technology, Sydney
Master of Arts Degree in Diplomacy & International Affairs, Zayed University, UAE)
Thesis submitted in fulfillment of the requirement for the Degree
Doctor of Philosophy (Ph.D)
Faculty of Business, Government & Law
University of Canberra
February 2018

i
ABSTRACT
The purpose of this research is to investigate the adoption of smart systems and their impact
on the performance of organizations in the United Arab Emirates (UAE). Although many
studies have been conducted on the adoption of technology in developed nations, only a few
have focused on the Middle East (particularly the UAE) with reference to the adoption of
smart systems. Therefore, this study will address: firstly, a significant gap in the literature by
examining the effects of external, organizational and individual factors on smart systems
adoption in the UAE and, secondly, the impact of smart system adoption on organizational
performance in terms of efficiency and enhanced service quality.
This study aims to provide a deeper understanding of an integrated model for smart system
adoption and to examine the impact of such systems on organizational performance in the
UAE. The integrated model is developed based on the following theories: the theory of
reasoned action (TRA) by Ajzen and Fishbein (1980); the technology acceptance model
(TAM) by Davis (1989); the unified theory of acceptance and use of technology (UTAUT) by
Venkatesh, Morris, Davis and Davis (2003); the theory of planned behavior (TPB) by Ajzen
(1991); the diffusion of innovations (DOI) theory by Rogers (1995); the technology–
organization–environment (TOE) framework by Tornatzky and Fleischer (1990); the social
construction of technology (SCT) model by Pinch and Bijker (1987); and the information
systems (IS) success model developed by DeLone and McLean (1992). The model
constructed for this study includes several additions and modifications to models developed
in previous studies.
Data for this study was collected from senior managers and general employees in the UAE
Ministries of Foreign Affairs and International Cooperation, Economy and Health. The study
evaluated the processes operating in the Federal Authority for Government Human Resources
(FAHR) which allowed services to be provided through innovative technology platforms,
particularly smart phones, and able to be used by federal government employees in their
business operations. The structured survey questionnaire employed here involved samples
drawn from a list of the ministry’s employees in its database. The questionnaire was
distributed to all 2,200 ministerial staff, using the ministry’s email system, and was followed
up with invitations to individuals to participate in the study. A total of 369 questionnaires
ii
were returned, of which 357 were usable, yielding a response rate of about 16% from this one
ministry. The statistical techniques used to analyze the data included frequency distributions,
factor analysis, validity and reliability analysis, correlation matrices and multiple regression
analyses. Structural Equation Modeling was used for further analysis of the data.
The model developed from theories was tested using gathered survey data. The findings show
that the model is supported and can serve to identify factors that would create a broader
understanding of the adoption and usage of smart systems by employees in the UAE. In
addition, these findings offer us empirical evidence, thereby providing one source of
objective information in the Gulf countries. Findings indicate that the two dominant variables
for smart system adoption are: firstly, attitudinal – in other words, appreciation of innovation
and technology: and, secondly, innovativeness itself. Employees’ adoption of smart systems
can be influenced by government support, perceived benefits, training and prior experience
with similar technology. The results also indicate that adoption of smart systems significantly
impact on organizations by cutting expenditure; increasing efficiency, loyalty, service quality
and reputation; and developing better relationships with customers.
The theoretical model developed in this study (generalizing from smart phones) provides a
strong basis for this comprehensive theoretical model improving our understanding of
employees’ acceptance and usage of smart systems. Accordingly, the study contributes to
theoretical knowledge and has practical implications for organizations, managers,
administrators and employees concerned with the adoption of smart systems. In addition, the
research will assist managers and organizations to develop policies for implementing smart
systems in the UAE. Notably, no study to date has addressed these factors in the context of
the UAE. Therefore, this research makes a significant contribution in terms of identifying key
factors influencing the adoption of smart systems in the UAE, and possibly the Middle East
more generally, and how smart systems can create economic and social benefits for the
country’s government, public sector and private sector.

v
TABLE OF CONTENTS
ABSTRACT ................................................................................................................................ i
CERTIFICATE OF AUTHORSHIP OF THESIS ................................................................... iii
TABLE OF CONTENTS ........................................................................................................... v
LIST OF TABLES ................................................................................................................. xiii
LIST OF FIGURES ............................................................................................................... xvii
LIST OF APPENDICES ......................................................................................................... xix
ACKNOWLEDGEMENTS .................................................................................................... xxi
CHAPTER ONE INTRODUCTION ........................................................................................ 1
1.1 Background to the Problem ............................................................................................. 1
1.2 Research Objectives ......................................................................................................... 4
1.3 Research Questions .......................................................................................................... 5
1.4 Motivation for the Research ............................................................................................. 6
1.5 Significance of the Study ................................................................................................. 6
1.6 Contribution of the Study................................................................................................. 7
1.6.1 Theoretical contribution ............................................................................................ 7
1.6.2 Practical contribution ................................................................................................ 9
1.7 Structure of the Thesis ................................................................................................... 10
Chapter One – Introduction ............................................................................................. 10
Chapter Two – Literature Review and Theoretical Framework ...................................... 10
Chapter Three – Research Model and Hypothesis Development .................................... 11
Chapter Four – Research Methodology ........................................................................... 11
Chapter Five – Data Analysis and Discussion (Regression Analysis) ............................ 11
Chapter Six- Data Analysis and Discussion (Structure Equation Modleing) ................. 11
vi
Chapter Seven – Conclusion and Implications ................................................................ 12
1.8 Conclusion ..................................................................................................................... 12
CHAPTER TWO LITERATURE REVIEW AND THEORETICAL FRAMEWORK ......... 13
2.1 Introduction .................................................................................................................... 13
2.2 Definitions of Smart Systems ........................................................................................ 13
2.3 Functions of the Smart System ...................................................................................... 16
2.4 Benefits of Smart Systems ............................................................................................. 20
2.5 Smart Recommender Systems ....................................................................................... 30
2.6 Specific Developments in Smart Systems ..................................................................... 33
2.6.1 Cooperative Networks for Intelligent Road Safety (COOPERS) project (integrated
traffic management) ......................................................................................................... 34
2.6.2 European project Dependable Embedded Components and Systems (DECOS)
(safety-critical real-time systems) .................................................................................... 34
2.6.3 Autonomous systems (safety-critical embedded systems and intelligence) ........... 36
2.7 Smart Systems and Management Science...................................................................... 36
2.7.1 eCall: a sensor-based emergency system ................................................................ 37
2.7.2 Smart system to stop illegal parking ....................................................................... 38
2.7.3 Smart cats’ eyes ...................................................................................................... 39
2.7.4 Smart tagging system .............................................................................................. 39
2.7.5 Smart trading systems ............................................................................................. 40
2.7.6 Lip-reading computer system ................................................................................. 40
2.7.7 Smart information modeling and management systems ......................................... 41
2.7.8 Smart production management systems.................................................................. 42
2.7.9 Polyglot healthcare information systems ................................................................ 43
2.7.10 Smart control systems in buildings ....................................................................... 44
2.8 Smart Systems in the UAE ............................................................................................ 47
2.8.1 Smart system initiatives in the UAE ....................................................................... 50

vii
2.8.2 Future initiatives in the UAE .................................................................................. 53
2.9 Theoretical Framework .................................................................................................. 54
2.9.1 Theory of reasoned action (TRA) ........................................................................... 55
2.9.2 Technology acceptance model (TAM) ................................................................... 56
2.9.3 Unified theory of acceptance and use of technology (UTAUT) ............................. 58
2.9.4 Theory of planned behavior (TPB) ......................................................................... 59
2.9.5 Diffusion of innovations (DOI) .............................................................................. 61
2.9.6 Technology–organization–environment (TOE) framework ................................... 63
2.9.7 Technological determinism (TD) ............................................................................ 64
2.9.8 Social construction of technology (SCT) ................................................................ 65
2.9.9 The DeLone and McLean information systems success model (IS success model)
.......................................................................................................................................... 66
2.10 Conclusion ................................................................................................................... 68
CHAPTER THREE RESEARCH MODEL AND HYPOTHESIS DEVELOPMENT .......... 71
3.1 Introduction .................................................................................................................... 71
3.2 Development of the Conceptual Model ......................................................................... 71
3.3 Hypothesis Development ............................................................................................... 75
3.3.1 Political drivers ....................................................................................................... 75
3.3.2 Social influence ....................................................................................................... 77
3.3.3 Technological orientation ....................................................................................... 79
3.3.4 Personal factors ....................................................................................................... 82
3.4 Attitude to Smart Systems and Their Adoption ............................................................. 85
3.5 Outcome Variables (Economic and Social Benefits) ..................................................... 85
3.5.1 Cost effectiveness ................................................................................................... 86
3.5.2 Organizational efficiency ........................................................................................ 86
3.5.3 Loyalty to the organization ..................................................................................... 87
3.5.4 Enhanced service quality ........................................................................................ 87
viii
3.5.5 Reputational development ...................................................................................... 88
3.5.6 Better relationships with customers ........................................................................ 88
3.6 Demographics ................................................................................................................ 88
3.7 Conclusion ..................................................................................................................... 89
CHAPTER FOUR RESEARCH METHODOLOGY ............................................................. 91
4.1 Introduction .................................................................................................................... 91
4.2 Research Design............................................................................................................. 91
4.3 Quantitative Research Design ........................................................................................ 92
4.4 Sampling Frame ............................................................................................................. 92
4.5 Sampling Population ...................................................................................................... 94
4.6 Sampling Size ................................................................................................................ 94
4.7 Survey Instrument .......................................................................................................... 95
4.7.1 The “Federal Authority for Government Human Resources” Application (FAHR)
System in the UAE............................................................................................................... 96
4.8 Variables in the Study .................................................................................................... 96
4.9 Definition of Constructs and Measures of the Variables ............................................... 98
4.9.1 Individual adoption of smart systems ..................................................................... 98
4.9.2 Attitude towards smart systems .............................................................................. 99
4.9.3 Political factors ..................................................................................................... 100
4.9.4 Social influence ..................................................................................................... 101
4.9.5 Technological orientation ..................................................................................... 102
4.9.6 Personal factors ..................................................................................................... 103
4.9.7 Outcome variables (economic and social benefits) .............................................. 105
4.10 Validity and Reliability of the Study ......................................................................... 107
4.11 Pilot Study .................................................................................................................. 108
4.12 Data Collection Procedures ........................................................................................ 108
4.13 Data Analysis ............................................................................................................. 109

ix
4.14 Conclusion ................................................................................................................. 111
CHAPTER FIVE DATA ANALYSIS AND DISCUSSION ............................................... 113
5.1 Introduction .................................................................................................................. 113
5.2 Demographic Information about Respondents ............................................................ 113
5.3 Smart System Usage Level by Employees .................................................................. 119
5.3.1 Time spent per week using smart systems for workplace duties .......................... 120
5.3.2 Frequency of use of smart systems in job-related activities ................................. 120
5.3.3 Level of usage of smart systems in any workplace duties .................................... 121
5.3.4 Different types of smart systems applications used .............................................. 121
5.3.5 Usage of advanced features on smart systems ...................................................... 122
5.4 Cross-Tabulation for Level of Usage by Demographics ............................................. 122
5.4.1 Cross-tabulation (gender by time) ........................................................................ 122
5.4.2 Cross-tabulation (gender by frequency) ................................................................ 123
5.4.3 Cross-tabulation (gender by usage) ...................................................................... 124
5.4.5 Cross-tabulation (gender by features) ................................................................... 125
5.4.6 Cross-tabulation (age by time) .............................................................................. 126
5.4.7 Cross-tabulation (age by frequency) ..................................................................... 127
5.4.8 Cross-tabulation (age by usage) ............................................................................ 127
5.4.9 Cross-tabulation (age by application) ................................................................... 129
5.4.10 Cross-tabulation (age by features) ...................................................................... 130
5.4.11 Cross-tabulation (academic by time) .................................................................. 131
5.4.12 Cross-tabulation (academic by frequency) ......................................................... 131
5.4.13 Cross-tabulation (academic by usage) ................................................................ 132
5.4.14 Cross-tabulation (academics by application) ...................................................... 133
5.4.15 Cross-tabulation (academic level by advanced features used) ........................... 134
5.4.16 Cross-tabulation (position by time) .................................................................... 135
5.4.17 Cross-tabulation (position by frequency) ............................................................ 135

x
5.4.18 Cross-tabulation (position by usage) .................................................................. 136
5.4.19 Cross-tabulation (position by application) .......................................................... 137
5.4.20 Cross-tabulation (position by features) ............................................................... 138
5.4.21 Cross-tabulation (ministry by time) .................................................................... 138
5.4.22 Cross-tabulation (ministry by frequency) ........................................................... 139
5.4.23 Cross-tabulation (ministry by usage) .................................................................. 139
5.4.24 Cross-tabulation (ministry by application) ......................................................... 141
5.4.25 Cross-tabulation (ministry by features) .............................................................. 141
5.5 Reliability and Validity of the Study ........................................................................... 142
5.6 Inter-correlations Among Study Variables .................................................................. 146
5.7 Regression Analysis ..................................................................................................... 151
5.7.1 Outcome variables ................................................................................................ 154
5.8 Checking Assumptions ................................................................................................ 154
5.9 Discussion of the Hypothesis Testing .......................................................................... 157
5.9.1 Hypotheses 1, 2 and 3 ........................................................................................... 157
5.9.2 Hypotheses 4, 5 and 6 ........................................................................................... 158
5.9.3 Hypotheses 7, 8, 9 and 10 ..................................................................................... 158
5.9.4 Hypotheses 11, 12, 13 and 14 ............................................................................... 159
5.9.5 Hypothesis 15........................................................................................................ 160
5.9.6 Hypotheses 16, 17, 18, 19, 20 and 21 ................................................................... 160
5.9.7 Summary of hypothesis testing ............................................................................. 161
5.10 Conclusion ................................................................................................................. 163
CHAPTER SIX ...................................................................................................................... 165
DATA ANALYSIS AND DISCUSSION: STRUCTURAL EQUATION MODELING ..... 165
6.1 Introduction .................................................................................................................. 165
6.1.1 Political Drivers .................................................................................................... 165
6.1.2 Social Infleunce .................................................................................................... 169
xi
6.1.3 Technological Orientation .................................................................................... 172
6.1.4 Personal Factor...................................................................................................... 176
6.1.5 Attitudes towards Smart Systems ......................................................................... 180
6.1.6 Adoption of Smart Systems .................................................................................. 183
6.1.7 Economic Benefits ................................................................................................ 183
6.1.8 Social Benefits ...................................................................................................... 186
6.2 Measurement Model .................................................................................................... 189
6.2.1 Assumption of Normality and Outlier .................................................................. 195
6.2.2 Discriminant Validity............................................................................................ 196
6.2.3 Nomological Validity............................................................................................ 204
6.2.4 Construct Reliability ............................................................................................. 213
6.3 Structural Model Analysis ........................................................................................... 217
6.3.1 Goodness-of-fit Test ............................................................................................. 217
6.3.2 Path Analysis of Structural Model ........................................................................ 218
CHAPTER SEVEN CONCLUSION AND IMPLICATIONS ............................................. 223
7.1 Introduction .................................................................................................................. 223
7.2 Summary of the Research ............................................................................................ 223
7.3 Conclusions and Implications for adoption of Innovation ........................................... 226
7.4 Contribution to Knowledge and Theory ...................................................................... 231
7.5 Limitations of the Study............................................................................................... 232
7.6 Future Directions for Research .................................................................................... 234
REFERENCES ...................................................................................................................... 237
APPENDICES ....................................................................................................................... 283
APPENDIX 1 PARTICIPANT INFORMATION FORM .................................................... 285
APPENDIX 2 ETHICS APPROVAL .................................................................................... 289
APPENDIX 3 SURVEY QUESTIONNAIRE ...................................................................... 291
APPENDIX 4 VALIDITY AND RELIABILITY OF THE STUDY .................................... 299

xii
APPENDIX 5 ......................................................................................................................... 321
OBSERVATIONS FARTHEST FROM THE CENTROID (MAHALANOBIS DISTANCE)
(GROUP NUMBER 1) .......................................................................................................... 321

xiii
LIST OF TABLES
Table 4.1: Variables of the study ............................................................................................ 97
Table 5.1: Demographic profiles of respondents .................................................................. 119
Table 5.2: Time spent per week using smart systems for workplace duties ......................... 120
Table 5.3: Frequency of use of smart systems in job-related activities ................................ 120
Table 5.4: Level of usage of smart systems in any workplace duties ................................... 121
Table 5.5: Different types of smart systems applications used ............................................. 121
Table 5.6: Usage of advanced features on smart systems ..................................................... 122
Table 5.7: Cross-tabulation (gender by time) ....................................................................... 123
Table 5.8: Cross-tabulation (gender by frequency) .............................................................. 123
Table 5.9: Cross-tabulation (gender by usage) ..................................................................... 124
Table 5.10: Cross-tabulation (gender by application) ........................................................... 125
Table 5.11: Cross-tabulation (gender by features) ................................................................ 125
Table 5.12: Cross-tabulation (age by time) ........................................................................... 126
Table 5.13: Cross-tabulation (age by frequency) .................................................................. 127
Table 5.14: Cross-tabulation (age by usage) ......................................................................... 128
Table 5.15: Cross-tabulation (age by application) ................................................................ 130
Table 5.16: Cross-tabulation (age by features) ..................................................................... 130
Table 5.17: Cross-tabulation (academic level by time) ........................................................ 131
Table 5.18: Cross-tabulation (academic level by frequency) ............................................... 132
Table 5.19: Cross-tabulation (academic level by usage) ...................................................... 132
Table 5.20: Cross-tabulation (academic level by and number of applications used) ........... 134
Table 5.21: Cross-tabulation (academic level by features) ................................................... 134
Table 5.22: Cross-tabulation (position by time) ................................................................... 135
Table 5.23: Cross-tabulation (position by frequency) .......................................................... 135
Table 5.24: Cross-tabulation (position by usage) ................................................................. 136
Table 5.25: Cross-tabulation (position by application) ......................................................... 137
Table 5.26: Cross-tabulation (position by features) .............................................................. 138
Table 5.27: Cross-tabulation (ministry by time) ................................................................... 138
Table 5.28: Cross-tabulation (ministry by frequency) .......................................................... 139
Table 5.29: Cross-tabulation (ministry by usage) ................................................................. 140
Table 5.30: Cross-tabulation (ministry by application) ........................................................ 141

xiv
Table 5.31: Cross-tabulation (ministry by features) ............................................................. 141
Table 5.32: Results of reliability and convergent validity .................................................... 143
Table 5.33: Inter-correlations among study variables ........................................................... 149
Table 5.34: Inter-correlations among adoption and outcomes variables .............................. 150
Table 5.35: Regression model summary ............................................................................... 152
Table 5.36: Results of regression analysis with attitude as dependent variable ................... 153
Table 5.37: Results of regression analysis with adoption as dependent variable ................. 154
Table 5.38: Results of regression analysis with adoption as independent variable .............. 154
Table 5.39: Correlation between demographics and attitudes towards smart system adoption
................................................................................................................................................ 161
Table 5.40: Results of hypothesis testing at a glance ........................................................... 161
Table 6.1: Goodness-of-fit measures of political drivers ...................................................... 166
Table 6.2: Political drivers Regression Weights: (Group number 1 - Default model) ......... 166
Table 6.3: Political drivers CR and AVE .............................................................................. 167
Table 6.4: Goodness-of-fit measures of social influence ...................................................... 169
Table 6.5: Regression Weights of social influence: (Group number 1 - Default model) ..... 169
Table 6.6: Social influence CR and AVE ............................................................................. 170
Table 6.7: Goodness-of-fit measures of technological orientation ....................................... 173
Table 6.8: Regression Weights of technological orientation: (Group number 1 - Default
model) .................................................................................................................................... 173
Table 6.9: Technological orientation AVE and CR .............................................................. 174
Table 6.10: Goodness-of-fit measures of personal factor ..................................................... 177
Table 6.11: Regression Weights of Personal Factors (Group number 1 - Default model) ... 177
Table 6.12: Personal Factors AVE and CR........................................................................... 178
Table 6.13: Goodness-of-fit measures of attitudes towards smart systems .......................... 181
Table 6.14: Regression Weights of attitudes towards smart systems: (Group number 1 -
Default model) ....................................................................................................................... 181
Table 6.15: Attitudes towards smart systems AVE and CR ................................................. 182
Table 6.16: Goodness-of-fit measures of economic benefits ................................................ 183
Table 6.17: Regression Weights of economic benefits: (Group number 1 - Default model)184
Table 6.18: Economic benefits AVE and CR ....................................................................... 185
Table 6.19: Goodness-of-fit measures of social benefits ...................................................... 186
Table 6.20: Regression Weights of social benefits: (Group number 1 - Default model) ..... 187
xv
Table 6.21: Social benefits AVE and CR ............................................................................. 188
Table 6.22: Goodness-of-fit Measures of Measurement Model ........................................... 190
Table 6.23: Measurement Model Regression Weights ......................................................... 192
Table 6.24: Correlations (Group number 1 - Default model) ............................................... 196
Table 6.24: Covariance: (Group number 1 - Default model) ................................................ 205
Table 6.25: Results of Confirmatory Factor Analysis (CFA) ............................................... 214
Table 6.26: Goodness-of-fit Measures of Structural Model ................................................. 218
Table 6.26: Hypothesis Testing ............................................................................................ 221

xvii
LIST OF FIGURES
Figure 2.1: Theory of reasoned action (TRA) (Kautonen et al., 2011) .................................. 55
Figure 2.2: Technology acceptance model (TAM) (Davis, 1989) .......................................... 57
Figure 2.3: Unified theory of acceptance and use of technology (UTAUT) (Venkatesh et al.,
2003) ........................................................................................................................................ 59
Figure 2.4: Theory of planned behavior (TPB) (Ajzen, 2011) ............................................... 60
Figure 2.5: The DeLone and McLean model (DeLone & McLean, 1992) ............................. 67
Figure 3.1: The Outline of the Research Model ..................................................................... 72
Figure 5.1: Participants’ gender distribution ........................................................................ 114
Figure 5.2: Respondents’ age distribution. ........................................................................... 115
Figure 5.3: Respondents’ academic levels ............................................................................ 116
Figure 5.4: Respondents’ workplace position....................................................................... 117
Figure 5.5: Respondents’ ministry distribution .................................................................... 118
Figure 5.6: Extent of use by gender ...................................................................................... 124
Figure 5.7: Feature usage by gender ..................................................................................... 126
Figure 5.8: Extent of use by age ........................................................................................... 129
Figure 5.9: Extent of use by academic qualification ............................................................ 133
Figure 5.10: Extent of use by position .................................................................................. 137
Figure 5.11: Extent of use by sector ..................................................................................... 140
Figure 5.12: Extent of features used by sector...................................................................... 142
Figure 5.13: Plot of standardized residuals against standardized predicted values .............. 155
Figure 5.14: Histogram of normally distributed residuals .................................................... 156
Figure 5.15: Normal P-P plot of regression standardized residuals ..................................... 157
Figure 6.1: Political drivers: 1st order measurement model after 3nd iteration ................... 168
Figure 6.2: Social influence: 1st order measurement model after 3nd iteration ................... 172
Figure 6.3: Technological orientation: 1st order measurement model after 3nd iteration ... 176
Figure 6.4: Personal factors: 1st order measurement model after 2nd iteration ................... 180
Figure 6.5: Attitudes towards smart systems: 1st order measurement model after 2nd
iteration .................................................................................................................................. 183
Figure 6.6: Personal factors: 1st order measurement model after 2nd iteration ................... 186
Figure 6.7: Social benefits: 1st order measurement model after 4th iteration ...................... 189

xviii
Figure 6.8: 1st Order Measurement Model ........................................................................... 191

xix
LIST OF APPENDICES
APPENDICES ....................................................................................................................... 283
APPENDIX 1 PARTICIPANT INFORMATION FORM .................................................... 285
APPENDIX 2 ETHICS APPROVAL .................................................................................... 289
APPENDIX 3 SURVEY QUESTIONNAIRE ...................................................................... 291
APPENDIX 4 VALIDITY AND RELIABILITY OF THE STUDY .................................... 299
APPENDIX 5 ......................................................................................................................... 321
OBSERVATIONS FARTHEST FROM THE CENTROID (MAHALANOBIS DISTANCE)
(GROUP NUMBER 1) .......................................................................................................... 321

xxi
ACKNOWLEDGEMENTS
In writing this thesis, I was the recipient of gracious help from several individuals. Without
their assistance, support and advice, this study would have been difficult to accomplish. I am
grateful to all of them. I wish to express my deepest appreciation and gratitude to the UAE
Government, provided the opportunity, funding and nurturing for me to embark and complete
this study. Special appreciation goes to my supervisors, Dr Majharul Talukder and Dr Chris
Sadleir, who provided me with continual assistance, valuable suggestions, encouragement
and scholarly advice throughout this journey. For this I am very grateful. Both of you always
responded promptly, sharing your ideas, motivating and guiding me towards the conclusion
of the study.
I also take this opportunity to express my gratitude to: Professor Lawrence Pratchett, Dean of
the Faculty of Business, Government and Law (BGL); Dr David Carter, Associate Dean of
Research; and Dr Craig Applegate, PhD program coordinator, the Faculty of BGL. You all
guided my research and provided me with excellent research facilities and inspired me to
overcome all obstacles and difficulties. I also thank Sue Uzabeaga for her valued assistance
and support. I sincerely thank all the employees who completed the survey questionnaire for
their valuable time and sharing their experiences.
Special appreciation goes to my beloved parents, wife, daughter and son, whose support,
understanding, inspiration and encouragement were very important in the completion of this
study.
Finally,I would like to thank the authorities of the University of Canberra for giving me the
opportunity to study at the university.

1
CHAPTER ONE
INTRODUCTION
1.1 Background to the Problem
Advances in technology have created massive changes in people’s daily lives. Technology
now facilitates a wide variety of tasks which humans used to do manually (Wang, Li, Li, &
Zhang, 2016; Zhang, 2009). Technological innovation affects the survival and success of a
business organization (Eoma, Choi, & Sung, 2016; Holsapple & Singh, 2000). However,
technology adoption is often obstructed by users’ unwillingness to accept innovations.
Because this problem persists, explaining how people adopt and use technological innovation
has been a long-term interest of organizational researchers (Davis, 1989; Hsu & Lin, 2016).
This is why scholars and practitioners emphasize the need for a better understanding of the
possible factors influencing user acceptance of innovation in organizations (Sherif, Zmud, &
Browne, 2006; Venkatesh, Morris, & Ackerman, 2000). Today, information technology is
universally regarded as an essential tool in enhancing the competitiveness and productivity of
business organizations (Vu, 2011). In this century, smart technology is changing people’s
lives (Yu, Hong, & Hwang, 2016). There is a consensus that technology does significantly
improve the productivity and efficiency of firms. The adoption of smart systems can create
benefits such as reductions in commuting times, improvements in the quality of individuals’
work lives, more environmentally friendly workplaces leading to reductions in pollution, and
further use of information and communication technology (ICT). These opportunities can
result in enhanced workplace productivity and employees achieving work–life balance (Eoma
et al., 2016). However, these outcomes will only be realized if the technologies are used
effectively. Therefore, it is essential to understand the determinants of adoption of smart
technology.
One of the more significant technological innovations of recent years is the smart system,
which has the ability to react based on the surrounding conditions through adjustment, sense,
inference, learning, prediction and self-organization (Worden, Bullough, & Haywood, 2003).
Smart systems can be defined as a new generation of systems architecture that combines
2
hardware, software, network technologies and managed services which provide real-time
awareness based on inputs from machines, people, video streams, maps, newsfeeds and
sensors (Harbor Research, 2013). These variables integrate people, processes and knowledge
to enable collective awareness and better decision-making (Harbor Research, 2013). Smart
systems can be regarded as self-sufficient, intelligent, technical systems with advanced
functionality which is made possible by underlying micro-, nano- and bio-systems and
components (European Commission, 2014).
According to Santos, Doz and Williamson (2013), in today’s diversified technological
environment the drive to innovate is much stronger than ever before. Novel technologies, as
well as applications, have been widespread in all fields of science. This explains why the rush
to adopt smart technologies is accelerating. Smart technologies are at the forefront of the
innovation process and have resulted in economic growth, with the potential to revolutionize
person–technology interaction (Roy, Balaji & Sadeque, 2017; Nancy, Florian, & Mary,
2013). The deployment of smart systems in a business can enhance effectiveness and service
quality (Pentikousis, Aguero, & Timm-Gie, 2014). It can enable organizational systems to
make more effective decisions. Furthermore, it can support the identification of the means
through which the organization can attain its core objective of delivering the best results in
various functional departments (Fanning, & Centers, 2013).
The use of smart technology is becoming more popular at both the individual and
organizational levels (Hsu, & Lin, 2016; Park, Woo, & Lee, 2014; Shen, 2015). Smart
systems make substantial impacts on people’s lifestyles, as shown by the integration of smart
systems into the healthcare sector, such as via telemedicine (Li, 2013); the evolution of smart
homes (Reeder, Meyer, Lazar, Chaudhuri, Thompson & Demiris, 2013); and the development
of entertainment devices manufactured using smart systems (Shin, Hwang, & Choo, 2013).
As well, smart technology has supported public sector agencies or departments to manage the
transportation flow and respond to issues such as traffic congestion, for instance re-routing
traffic (Khan & Khan, 2013).
In recent decades, there has been significant investment in technological innovation and
particularly smart technologies in many kinds of organizations. These investments aimed to
increase productivity at the individual level and organizational productivity in the long run.
3
Individual users being unwilling to accept new innovation often obstruct better performance.
For that reason, it is important to understand the possible factors influencing users’
acceptance of smart systems in the workplace. This study aims to theoretically construct an
integrated model for smart system adoption and examine the outcomes of such acceptance.
A recent report by Harbor Research (2013) indicates that the total smart systems market value
forecast for 2018 is expected to grow to $873 billion, compared to $275 billion in 2013. The
cumulative worth of networked devices in use is expected to grow to over $26 billion by
2018. The growth of their importance in the marketplace provides further evidence of the
importance of understanding the factors that affect the adoption of smart systems in the
workplace (Hsu & Lin, 2016).
Various testimonials have suggested that the world of smart systems is entering an era where
people, machines, devices, sensors and businesses are all connected and able to interact with
one another. As these parties are better integrated, the evolution in smart technologies will
make a truly connected world. For government departments, smart technologies offer
opportunities for collective awareness, creativity and better decision-making capabilities for
societies that increasingly rely on real-time information and interactions (Harbor Research,
2013). Many observers believe that this phenomenon will drive the largest growth
opportunity in the history of business (Al-Khaouri, 2012). Based on the current scenario,
smart systems can certainly be considered an innovation in business, and it is imperative to
study the factors influencing their adoption.
A range of political, social, technological and individual factors influence the adoption of
smart technologies in organizations. Prior research has focused on the adoption of technology
in developed nations (Balta-Ozkan, Davidson, Bicket, & Whitmarsh, 2013a; Haque, Chin, &
Debnath, 2013; Komninos, Pallot, & Schaffers, 2013). However, only a few studies have
examined the adoption of smart systems in developing nations, particularly in the Middle
East. Only a few scholars have identified factors that can limit the adoption of innovations in
developing regions (Balta-Ozkan, Davidson, Bicket, & Whitmarsh, 2013b), indicating a need
for further investigation on this topic. Analyses of this situation in the Middle East have been
limited, particularly in the United Arab Emirates (UAE), to the factors affecting the adoption
of smart systems and their impact on organizational performance.

4
Accepting and implementing smart systems is becoming an integral part of life and work in
the UAE (Al-Khouri, 2012b). Smart systems are used in several sectors of the UAE
economy, such as transportation, health, finance and the public service. However, despite the
significant role that smart systems play in day-to-day economic, social and political activities,
there has been little or no empirical research conducted on the issues identifying the factors
that have contributed to the uptake and use of these smart systems. This study will seek to
identify the factors that are influencing the acceptance of smart systems in the UAE and their
impact on organizational performance. A key element of this research will be the in-depth
analysis of the political, social, technological orientation and personal factors that must be
addressed when implementing a smart system. The study will also examine the impact of
demographic factors on the adoption of smart systems. Finally, the study will investigate
what the adoption of smart systems in the UAE means in terms of economic and social
benefits.
1.2 Research Objectives
The primary objective of this study is to evaluate the factors affecting the adoption and use of
smart systems in the UAE. The researcher will seek to achieve the following specific research
objectives:
What is the impact of attitude to smart systems on adopting smart systems in the UAE?
What is the impact of political factors on adopting smart systems in the UAE?
V1 Government support
V2 Government strategy
V3 Government regulations
What is the impact of social influence on adopting smart systems in the UAE?
V4 Cultural values
V5 Social networks
V6 Peers’ influence
What is the impact of the technological orientation factors on adopting smart systems in the
UAE?
V7 Technology readiness
5
V8 Training
V9 Managerial support
V10 Incentives
What is the impact of personal factors on adopting smart systems in the UAE?
V11 Perceived benefits
V12 Personal innovativeness
V13 Prior experience
V14 Enjoyment with innovation
What are the economic and social benefits of adopting smart systems for the UAE? What
impact do they have on the following?:
V15 Cost effectiveness in UAE organizations
V16 Organizational efficiency
V17 Loyalty to UAE organizations
V18 Service quality of the UAE organization
V19 The reputation of UAE organizations
V20 Better customer relationships of UAE organizations.
All the above hypotheses will be explained and justified later in the thesis (see section 3.2
Development of the Conceptual Model, Figure 3.1 and 3.4 – Hypotheses Development)
1.3 Research Questions
The primary research question for the study is:
What are the drivers of smart systems adoption in the UAE and their impacts on economic
and social development?
The specific questions are as follows:
1. What is the impact of political factors on adopting smart systems in the UAE?
2. What is the impact of social influence on adopting smart systems in the UAE?
6
3. What is the impact of the technological orientation factors on adopting smart systems
in the UAE?
4. What is the impact of personal factors on adopting smart systems in the UAE?
5. What is the impact of demographics on the adoption of smart systems on the UAE?
6. What is the impact of attitude to smart systems on adopting smart systems in the
UAE?
7. What are the economic and social benefits of adopting smart systems for the UAE?
1.4 Motivation for the Research
Although many studies have been conducted on technology adoption in developed nations,
only a few have been done on the Middle East (particularly in the UAE) with reference to
smart systems. Smart system adoption is a growing area of interest in Middle Eastern
countries. Technology and smart systems play an important role in the UAE’s economic
growth. While technology adoption theories are well established in the literature, they have
been applied mostly in developed countries, and little research has been done on the factors
affecting the adoption and use of smart systems in the UAE; this study will fill this gap in the
literature.
A key element of this thesis will be the in-depth analysis of the political, cultural, social,
technological orientation and personal factors that affect the adoption of smart systems in the
UAE. In particular, the study will investigate the expected outcomes of the adoption of smart
systems as perceived by employees. This study will also investigate the impact of
demographic characteristics affecting the adoption and use of smart systems, as well as the
expected outcomes of their adoption in terms of economic and social benefits.
1.5 Significance of the Study
This research will make a significant contribution in terms of understanding, firstly, what are
the key factors influencing the adoption of smart systems in the UAE and, secondly, how

7
smart systems can create economic and social benefits for the government, the public sector
and private organizations.
The aim of this study is to develop an integrated model for smart system implementation in
the UAE. The new model is based on recent adoption and innovation theories and combines a
number of variables that entail the organizational, individual, technological and social factors
that affect organizations’ decisions concerning the acceptance of smart systems. Additionally,
the study has significant implications from the managerial perspective, as the research will
enable managers to understand the impacts of various factors affecting smart systems
implementation. The inferences drawn from this research will encourage managers to make
effective decisions regarding the efficient usage and implementation of smart systems. The
extent of probable improvement in the workplace environment, as well as the level of
assistance and support that will be necessary in order to consolidate organizational needs, will
be assessed accurately in this research. The research will investigate the factors affecting
individual acceptance and use of smart systems in government departments, and the results
will help us to understand how to reduce implementation-related costs and improve efficiency
at the same time.
The UAE government has announced that all departments, agencies etc..must adopt smart
systems and optimize the use of these devices in order to upgrade the quality of their services
and increase their efficiency. The goal is to achieve a “virtual government” through the
provision of high-quality, customer-focused services for individuals, business organizations
and government departments. This study will also help inform the government when it
develops policies on how to implement smart systems in the UAE.
1.6 Contribution of the Study
The theoretical and practical contributions made by the study are described in detail below.
1.6.1 Theoretical contribution
The study aims to develop an integrated theoretical model. The integrated model uses a large
number of factors found in the literature on the subject of innovation adoption. Theories
8
related to technology adoption end with the organization’s adoption of the technology. This
research makes a theoretical contribution by extending the model to the expected outcomes
within the organization as perceived by employees. A lack of research in the existing
literature makes it possible to devise this new model, which fully explains the factors
influencing the adoption and user acceptance of innovation in the Middle East. The model
considers user acceptance of new technology such as smart systems, along with the
outcomes.
The study explores past literature on the stages of innovation adoption, theories of innovation
adoption, models of technology acceptance and popular frameworks developed by
researchers. The study then extracts well-known theories, models and frameworks used in
technology acceptance and information systems research for innovation adoption and usage.
The theoretical gap and limitations are identified and used to inform the integrated model that
is then developed. Based on the extant literature, the study combines the most suitable
innovation theories, models and frameworks that depict organizations’ adoption of
information technology. The study uses a combination of political, organizational, individual
and social factors as antecedents of smart system adoption. This study explores the outcome
variables of smart system adoption, which have not been covered in other studies on
technology adoption. Consequently, the conceptual framework will provide a new direction
in the technology adoption-related literature.
Furthermore, this research will help to fill the research gap and contribute to knowledge, as
very limited research has been conducted in similar areas in the Middle East, where its
various national communities have diverse characteristics and strong cultural values.
Although some studies do exist, the issues explored here have not been conclusively dealt
with in previous research. It is essential to identify the factors involved in the adoption and
user acceptance of information technology to ensure that new technologies such as smart
systems are successfully implemented. This research offers a comprehensive model to fully
understand the factors influencing the adoption and usage of smart systems in the Middle
East. This research will make a significant contribution in terms of identifying the key factors
influencing the adoption of smart systems in the UAE and their expected outcomes.

9
1.6.2 Practical contribution
Contribution to the work of government
Globalization and technological transformation have in recent times initiated a paradigm shift
in the way interactions occur between citizens and their governments in the Gulf countries.
Serious efforts are being made in these countries to develop electronic operating
environments with advanced capabilities to build the right conditions for adopting technology
in government departments and agencies. This study serves as a guide for government
officials in Gulf countries, and will enhance their understanding of core factors that influence
the acceptance and implementation of smart systems. Understanding the key factors will
enable them to develop policies for the successful use of new systems. If empirically
supported, the study can help evaluate the impact of smart systems and provide guidance for
how political action can assist smart system implementation. The results of the study should
guide governments to improve their understanding of factors that influence the acceptance
and implementation of smart systems.
Contributions to workplace managers
The research will benefit managers and organizations in developing policies for the adoption
and use of smart systems. This study will effectively identify the critical factors behind the
adoption of smart systems, and the outcomes will enable government officials and managers
to successfully implement the system. Managers who are interested in and responsible for
testing, understanding and implementing smart systems in the public and private sectors will
be assisted by the content of this thesis. The proposed model will help them obtain a deeper
understanding of the external and internal factors of adoption and implementation. Moreover,
it will be valuable in helping them respond more rapidly to changes in their external
environment, and to reduce risk and uncertainty. The study will enable managers to plan and
prepare for the adoption process and establish conditions which will encourage user
acceptance of the new system, and enable a smooth transition.
Contribution to the ways of working in organizations
This study also will help organizations that are concerned with the adoption and
implementation of smart systems in the UAE. It will contribute by helping both government
10
agencies and private organizations to improve their understanding of new technology
adoption, the implementation process and the factors driving these. This study examines the
expected outcomes within an organization as perceived by its employees. Organizations will
be able to evaluate the proposed model and assess the external and internal forces influencing
the adoption process and the possible factors that lead to successful adoption of new
technology. Understanding the key factors will enable organizational leaders to develop
policies for the successful use of smart systems.
1.7 Structure of the Thesis
This thesis is organized into seven chapters, as follows.
Chapter One – Introduction
Chapter One introduces the study by describing the context of the research problem, in which
the research objectives and questions are also established. It starts with an outline of the
background of the problem, followed by the objective of the study and the research questions.
It discusses the significance of the study and the significant gap in the literature. This is done
by examining the effect of external, organizational and individual factors affecting smart
system adoption in the UAE. The chapter highlights the theoretical and practical contribution
to governments, managers and organizations. It also discusses why the proposed research
model is important to researchers and practitioners.
Chapter Two – Literature Review and Theoretical Framework
Chapter Two presents the literature review which serves as the foundation for this study. It
includes a general review of the literature concerning smart system concepts, its usage, the
benefits of smart system adoption and the application of smart systems in the government
sector. In this chapter smart systems and their evolution are explained. Additionally, various
technology adoption models and theories relevant to the proposed conceptual framework are
discussed. These include the theory of reasoned action (TRA), the technology acceptance
model (TAM), the unified theory of acceptance and use of technology (UTAUT), the theory
of planned behavior (TPB), diffusion of innovations (DOI), technology–organization–
environment (TOE) framework, technological determinism (TD), social construction of
technology (SCT), and DeLone and McLean’s information systems success model (IS

11
success model). The limitations of those theories are highlighted, and directions to construct a
new and comprehensive model are discussed.
Chapter Three – Research Model and Hypothesis Development
Chapter Three describes the proposed model based on the literature review and the existing
theoretical models. It starts with an outline of the research model and an exploration of the
four broad categories examined in this study: political, social, technological and personal
factors. Discussions on specific variables are then provided. The development of hypotheses
for the proposed model is described in detail. The outcomes of the model, including the social
and economic benefits, are explained. A summary of the literature review is also provided.
Chapter Four – Research Methodology
Chapter Four discusses the research methodology used to achieve the objectives of the study.
The chapter’s introduction is followed by an outline of the research design, sampling frame,
sampling population, sampling size, sampling method, survey instrument, and validity and
reliability of the study. The chapter discusses details concerning the survey instruments’
construction and development of the survey questionnaire.
Chapter Five – Data Analysis and Discussion (Regression Analysis)
Chapter Five provides a systematic analysis of data collected from individual employees in
the UAE. The proposed model of innovation adoption is tested statistically using data from
the questionnaire survey. The chapter starts with an analysis of the respondents’
demographics, followed by correlations of the study variables. It then discusses the validity
and reliability of the study, along with the variables affecting smart system adoption,
regression analyses, model assumptions and hypotheses. This chapter concludes with a
summary and discussion of the main findings, including an analysis of employees’
perceptions that support the proposed model.
Chapter Six- Data Analysis and Discussion (Structure Equation Modleing)
Chapter Six presents the concept of Structure Equation Modeling (SEM). A confirmatory
factor analysis (CFA) is undertaken to validate the proposed research model ‘Smart System
Adoption’ in the measurement model and structural model. The chapter employs the

12
structural path model using SEM AMOS to test the proposed model and its hypothesis path.
Results are presented as goodness-of-fit model, IFI, TLI and RMSEA.
Chapter Seven – Conclusion and Implications
Chapter Seven concludes the study. It summarizes the main themes of the research and makes
conclusions about the implications of smart systems. The conclusion shows how this research
has extended previous studies and contributed to knowledge in the field, particularly the
broader theoretical understanding of innovative technology adoption. It also discusses the
practical implications for governments, managers and organizations, including the limitations
of the study and future research possibilities in this area.
1.8 Conclusion
Chapter One introduced the concept of smart systems and their emergence, and outlined how
smart systems now constitute an integral part of the organizational process. The chapter
defined smart systems and their benefits, based on recent literature. It also outlined the
objectives of this study, which include an assessment of factors influencing the adoption of
smart systems in the UAE, their adoption and what it means for organizational performance,
and the economic and social benefits arising from the acceptance of smart systems.
The research questions which guided the study were also presented. The study is significant
in that it attempts to address the gaps in recent literature by discussing recent analyses on the
theme of technology adoption. The chapter also drew the theoretical and practical
implications of the study and concluded that the study has important theoretical and practical
perspectives, in that the analysis integrates past adoption models and formulates a new
comprehensive model. The proposed model is more suitable for understanding the factors
influencing smart system adoption, as it includes multiple sets of variables. Finally, the
inferences drawn from this research will enable managers and practitioners to make effective
and valid decisions regarding the efficient implementation and usage of smart systems.
13
CHAPTER TWO
LITERATURE REVIEW AND THEORETICAL
FRAMEWORK
2.1 Introduction
This chapter discusses the literature review and theoretical framework of the study. The
chapter reviews relevant literature on the issue of employees’ adoption of innovation of smart
systems in the United Arab Emirates (UAE). It provides definitions, functions and benefits of
smart systems. It also discusses the relevant theoretical framework and models. Explained
here are the various definitions of smart systems which refer to the incorporation of
diversified functions like sensing, actuation as well as controlling to overview and analyze a
situation. The chapter provides a detailed overview of important theories concerning the
adoption of smart systems and innovation. Theories discussed include the theory of reasoned
action (TRA), the technology acceptance model (TAM), the unified theory of acceptance and
use of technology (UTAUT), the theory of planned behavior (TPB), diffusion of innovations
(DOI), technology–organization–environment (TOE) framework, technological determinism
(TD), social construction of technology (SCT) and the DeLone and McLean information
systems success model (IS success model). Furthermore, the suitability and limitations of
these theories are discussed.
2.2 Definitions of Smart Systems
Smart systems can be regarded as self-sufficient, intelligent, technical systems with advanced
functionality, enabled by underlying micro-, nano- and bio-systems and components
(European Commission, 2014). The deployment of smart systems in a business can enhance
its effectiveness and the quality of its services, and enable decisions to be made more
effectively (Chen, Chiang, & Storey, 2012). It supports the identification of the means
through which a firm can attain its core objective of delivering the best results in various
functional departments (Fanning & Centers, 2013). In turn, decisions are made on the basis of
collected data, and smart actions are executed. According to Jara, Parra and Skarmeta (2014),
14
smart systems can overcome issues that beset environment, society and the economy because
they serve to solve problems like resource scarcity and where globalization fails to deliver
benefits. Accordingly, they are used in almost every industry throughout the world to achieve
a competitive edge and increase productivity.
Soh, Yang and Bhalla (2012) indicated that a smart system is a device that can sense changes
in its environment and respond ideally by changing its properties related to material,
geometry, mechanical framework and response. Soh et al. (2012) offered another perspective
on smart systems: a smart system consists of a built-in or intrinsic sensor, actuator and
control mechanism whereby it is capable of sensing a stimulus, responding to it quickly in a
predetermined manner and extent, and reverting to its original state as soon as the stimulus is
removed. Smart systems are also defined as integrated interwoven sensors and computational
systems seamlessly embedded in everyday systems and tools of our lives connected through a
continuous network (Kantola & Karwowski, 2012). Vojdani (2008) postulated that smart
system integration is a crucial innovation domain empowering the concept of ‘smart
anything everywhere’, while Juuso (2004) defined a critical global correspondence stage for
exploration institutes and manufacturers from the field of smart system integration. Smart
system integration permits people to create a system out of components which pick up
information from the environment, to process it electronically and impart signals and
information.
Similarly, Simmonds and Bhattacherjee (2015) defined a smart system as a framework which
supports and facilitates the delivery of any task or project, especially those which are
complex; subject to uncertainty; in the context of the business sector, experiencing time and
cash pressures; and generally difficult to manage. Agius (2012) stated that smart systems are
important to furnish information to project groups or teams charged with accomplishing
project goals. They also provide real-time execution feedback of where the project is in
connection to the values set for objective purposes. The vital prerequisite of a smart system is
to deliver information in real time (Simmonds & Bhattacherjee, 2015).
Moreover, the term ‘smart’ is closely linked to – attributes such as ‘intelligent, agile, bright,
clever’, etc. (Abramovici, 2015). Smart systems are used and integrated by internet-based
services to perform a required functionality. A smart system is also defined as an ‘intelligent’
15
mechatronic system capable of communicating and integrating with others (Ramchurn,
Vytelingum, Rogers, & Jennings, 2012). There are various distinctive names given to smart
systems that claim to incorporate a level of intelligence. Schoistsch and Skavhaug (2006)
surmise that ‘intelligence’ assesses self-sufficient thinking and acting in a cooperative
manner. The level of intelligence is rarely defined and indicated in scientific terms. Currently,
the term ‘intelligence system’ is designated to mean a smart system with an embedded
intelligence. There is no misperception in depicting a smart system as one that is implanted,
but it has been pointed out by numerous researchers that a smart system is also intelligent
(Abramovici, 2015; Ramchurn et al., 2012). ‘Intelligence’ refers to a new paradigm in
information systems. Demirkan (2013) argued that smart systems can sense and analyze
complex circumstances. Smart systems are predictive; they have the capacity to choose,
decide and communicate with the environment. Catarinucci et al. (2015) argued that smart
systems may also be energy autonomous and networked. According to Demirkan (2013) and
Rahmani et al. (2015), smart systems enable new care delivery models consisting of
nanotechnology, microsystems technology, microfluidics-based miniaturized diagnostics
platforms, implantable devices, drug delivery technologies, embedded systems and
mechatronics.
The origins of smart systems can be traced to a field of research that intended to develop
devices and materials that could copy human muscular and sensory systems (Akhras, 2000).
The key idea was to deliver non-biological systems that would accomplish the optimum
functionality observed in biological systems by copying their versatile capacities and designs.
Tilli et al. (2015) defined smart material and smart structures as consisting of systems with
sensors and actuators that are either embedded in or joined to a system to form an integrated
part of it. Porter and Heppelmann (2014) postulated that the smart system and its related parts
shape a substance that will act and respond in an anticipated way and carry on in an example
that emulates a biological function. The human body is the perfect or ultimate smart system.
One of the first attempts to utilize smart materials innovation included the development of
materials to do the work of electromechanical devices. From that point, numerous sorts of
sensors and actuators have been created to measure a system. This technology is starting to
reach its potential. With a touch of creative energy, enormous advantages to society can be
made.
16
Accordingly, Schoitsch et al. (2003) described this paradigm as one in which individuals are
involved through a digital environment that is aware of their presence and is sensitive,
emotional, habitual, adaptive and responsive to their needs. This paradigm may refer to
safety-related applications, not only for individual-centered tasks but also for purely technical
solutions like smart sensors and control systems (Herzner, Huber, Gyorgy, & Balogh, 2006;
Strasser et al., 2015). Suri (2006) identified some emerging challenges of smart systems in
the related European research project, including heterogeneity (environment, protocols,
applications etc.), autonomy (self-organizing, self-awareness, self-healing etc.), nomadic
mobility (heterogeneous, ad hoc, unreliable etc.) and inability to scale (structure, geography,
number of users etc.)
These definitions indicate that smart systems have one common feature: interactivity. On this
theme, the ability to detect a stimulus and respond to it is an additional feature of a smart
system. The following section discusses the different functions of smart systems.
2.3 Functions of the Smart System
The literature suggests that smart technologies are replacing traditional business models
(Davenport, 2013; Earl & Feeney, 2012; Xu, 2012). New technologies such as virtualization
and cloud computing have facilitated the reallocation of technological costs and created new
ways of organizing business processes. Entrepreneurs are using innovative technologies to
develop viable business models for information dissemination (Beloglazov & Buyya, 2010).
Smart technology is important for business entities because it enables them to increase
efficiency. For example, retail stores use sensors to ensure the availability of stock and
analyze information displayed on tags (Yeh, Chen, & Chen, 2011). Another area where smart
technology has been shown to be important is improved product and service quality. Bughin,
Chui and Manyika (2010) have identified that luxury automobile manufacturers have
equipped vehicles with networked sensors which automatically take evasive action when
accidents are about to happen.
Kortuem, Kawsar, Fitton and Sundramoorthy (2010) described the importance of smart
systems in the construction industry, where work environments are highly dynamic. Smart
systems are used in activity-aware smart objects that record information related to work
activity and automatically correct the direction and operation of machines. In addition,

17
businesses use smart meters to monitor energy consumption and identify false usage (Wang
& Lu, 2013). Businesses employ smart technologies to respond to the changing marketplace
environment where competition is ubiquitous. For example, business intelligence smart
technology – which is a collection of decision support technologies – enables organizations
and people to make decisions quickly (Chaudhuri, Dayal, & Narasayya, 2011).
In the medical field, smart technologies have generated tremendous change. Hospitals and
practitioners now use smart systems to improve operations and increase efficiency (Luxton
et al., 2011). Behavioral health applications are an example of smart technologies used by
mental health practitioners due to their ease of use and compatibility with their needs. For
example, with the help of global positioning systems (GPSs), these technologies can track
patients easily (Luxton et al., 2011). Moreover, smart technologies play a significant role in
developing and improving communities. For example, the increase in the urban population
creates challenges in managing living conditions within communities. The notion of the smart
city, also known as the digital city, has become better accepted. The smart city refers to a
connected community that utilizes broadband communications infrastructure; a flexible and
service-oriented computing infrastructure; and innovative services to meet the needs of
governments, citizens and businesses (Nam & Pardo, 2011).
Furthermore, smart technology plays an important role in energy consumption and savings
for an organization (Paetz, Dütschke, & Fichtner, 2012). Organizations use smart systems,
like smart grids, to reduce the impact of electricity current in the energy grid on the
environment. A smart grid has an information technology layer that increases the
communication level between different stakeholders and integrates them with other systems,
such as smart factories and smart cities, so that they operate more effectively (Wagner,
Speiser, & Harth, 2010). In the United Kingdom (UK), the government is implementing the
Smart Metering Programme to stop the impact of waste energy on the environment, because
global warming is emerging as a critically important issue worldwide (Zhang & Nuttall,
2011).
Shaikh et al.(2014) explained that a smart system maintains safe ventilation levels while
minimizing a facility’s energy expenses and its carbon footprint. Controlling to a static
pressure set point in ventilation work, the smart system powerfully measures fan

18
performance, permitting it to securely control fan speed while never dropping below a
minimum outlet velocity and stack height. When fan speed is diminished to achieve a
minimum outlet velocity, bypass dampers are adapted to meet lower building demand. In
addition, the smart system is intended to rapidly react to fan failures and different shocks to
the systems. In case of a fan failure, a backup fan will instantly engage and ramp up speed,
rapidly restoring system pressure. Moreover, an alarm will be sent by email or text message
to one or several people at the same time, to notify them of the failure (Sechilariu, Wang, &
Locment, 2013).
Smart systems are viewed worldwide as one of the most critical areas of emerging research.
Research and development in this field is firmly supported by enlightened governments,
especially when they promote or initiate new activities and projects (Abramovici, 2015;
Thierauf, 2001). Specifically, it is reported that smart systems developed in combination with
research in pervasive computing and intellectual knowledge, and combined with the
improvement of software-intensive systems, furnishes one of the most imperative challenges
of organizations today (Rudall & Mann, 2007; Strasser et al., 2015). Such improvements will
enormously affect societies and economies of all countries. To be effective, smart systems
should be instrumented, interconnected and intelligent. Instrumentation empowers the
accumulation of timely, high-quality information through embedded sensors that are imparted
over wired systems. Instrumented devices – for example, smart meters for gas, electricity and
water – persistently monitor the supply and demand for these utilities, and might actuate
strategies formulated by intelligent components (Alahakoon & Yu, 2016). Interconnection
links information, systems and individuals, and a high degree of interconnectivity empowers
smart systems to become a reality.
Porter and Heppelmann (2014) discussed how smart, connected products are driving a new
wave of value creation, and they discovered the effect of these products on competition and
organizational structures. They also explained the emergence of smart systems, products and
service in the third wave of transformation, which is being driven by information technology.
The first wave of the 1960s and 1970s was described as the automation of people’s activities
in the value chain. The second wave’s power derived from the internet, with its universal and
inexpensive connectivity that empowered the integration of people-based activities. In the
developing third wave, Porter and Heppelmann (2014) contended that information

19
technology with embedded sensors, software, processors, storage, mobile connectivity, cloud
connectivity and wearable capabilities is becoming part of the product itself. However, smart
systems are more about service advancement than products (Wuenderlich et al., 2015). A new
business plan of action will disrupt existing relationships with users, consumers and products,
and open new doors for quality creation in ways that are just starting to be investigated.
Porter and Heppelmann (2014) argued that information technology is transforming products,
ranging from appliances to cars to mining hardware. Products once made exclusively from
mechanical and electrical parts have become complex systems consolidating equipment,
sensors, electronics and software that connect through the internet in myriad ways. These
smart connected products offer exponentially expanding open doors for new functionality,
and far more prominent reliability and capabilities that cut across and transcend traditional
product boundaries. The emergence of smart connected products raises a wide set of new
strategic decisions for organizations about how value is created and captured, how to work
with traditional partners, which new partners will be required, and how to secure competitive
advantage as the new abilities reshape industry limits.
Moreover, the interconnections among individuals, objects and systems are supporting better
approaches to collect, share and follow up on information. Intelligence in the types of new
processing models, calculations and advanced investigations will assist better choices and
results for business, non-profit organizations, government and individual clients (Nakashima,
Aghajan, & Augusto, 2009). Smart connected objects, whether or not they are embedded, will
produce huge sums of valuable information to enable the improvement, development and
utilization of smart products and services. This information should be combined with
analytical models to become useful. Models that can enhance e-commerce (Shi, Ghedira, &
Marini, 2015), healthcare treatments, manufacturing, transportation, public safety, energy and
water management, environmental sustainability, and training generate better results and
lower costs. Indeed, the emerging smart systems are becoming significant areas of
information technology-enabled development, with disruptive capacities for development and
competitive advantage. Wewalaarachchi, Shivanan and Gunasingham (2016) indicated that
the scope incorporates smart mindful recommender systems that are enabled by semantic
innovations, smart systems for data demonstrating and energy management in a smart

20
systems context. Furthermore, at long last, smart healthcare information systems are starting
to enhance the practices and services of medical care organizations.
2.4 Benefits of Smart Systems
It has been estimated that the market value of smart systems in 2013 was approximately
$275 billion (Harbor Research, 2013), and it is expected to grow to $873 billion by 2018. It
has also been identified that the value of cumulative networked devices will grow to
$26 billion by 2018. Research analysis carried out by Harbor Research (2013) highlights that
the rate at which investment in smart systems is growing is very high compared to
information technology and network infrastructure technologies, which are only slowly
maturing. The research also shows that smart systems are estimated to grow at three times the
compounded growth rate which information and communications technology (ICT) are
expected to provide. This has enabled players to recognize the gains from both the demand
and supply side perspectives, and will result in larger investment by as much as 20% of all
the ICT investment which has occurred in the last five years.
Smart technologies offer numerous benefits to their users. One of the biggest gains is that the
infrastructure cost for smart technologies is low and provides faster connectivity. This has
been substantiated by Paetz, Dütschke and Fichtner (2012), who stated that use of smart
technologies has resulted in a decline in electricity consumption. In turn, this has reduced
electricity wastage and helped people to save more. Smart systems have advantages for
economic growth, which have encouraged many countries to adopt smart systems in
healthcare, transportation, communication and government services. The benefits of the
adoption of a smart system outweigh the costs of its implementation.
Looking at the advantages of smart systems, economies like the UAE are continuously trying
to implement such systems in their public and private sectors. The UAE has a geographical
advantage in that it is located in the south-east of the Arabian Peninsula, which allows
various kinds of investors in technology projects. The country is over 83,600 square
kilometers in size, with an estimated population of 9 million. The UAE has made significant
progress in the field of technology, which helped its gross national income rise to
$7.891 million in 2011 (World Bank, 2011). A study by Alfaki and Ahmed (2013) highlights
the manner in which ICT has contributed to the growth and development of the UAE. It has

21
been stated that technology has helped the UAE’s economy in terms of infrastructure,
communication and service delivery compared with other countries in the region.
In recent times, smart systems have been used more frequently in the UAE. Reports indicate
that 62% of mobile phone users in the UAE use smart phones and 43% of people use the
internet for travel-related information. In addition, 54% of smart phone users make online
purchases. As a result of the widespread use of smart technology in the private sector, the
UAE government has focused heavily on the importance of smart systems. For example, the
Dubai eGovernment Department (DeG) is looking at increasing the usage of smart systems in
all areas. His Highness Sheikh Mohammed bin Rashid al Maktoum, the Vice-President and
Prime Minister of the UAE and Ruler of Dubai, has personally undertaken an initiative to
provide support for the rapid adoption and implementation of smart systems in all
government services.
There is great potential for future advantages from the use of smart materials, structures and
systems (Akhras, 2000). This innovation guarantees the best responses to highly complex
problem areas. For example, this system provides early warnings of problems, thus enhancing
the survivability of systems and developing their life cycles. Additionally, enhancements to
numerous products could provide better control by minimizing distortion and increasing
accuracy. Another conceivable advantage is enhanced protection maintenance of systems and
thus better performance of their functions (Srinivasan, Priya, & Sun, 2015). By its nature, the
development of innovations such as smart materials and structures is a highly
interdisciplinary field, incorporating the essential sciences such as physics, mechanics,
chemistry, computing, electronics, applied science and engineering. This may clarify the
moderate advances made in the utilization of smart structures in engineering systems, even if
the science of smart materials is moving very quickly.
Street et al. (2015) specified the importance of smart printing systems, pointing out that it is a
manufacturing technique that is a promising approach to dealing with low-cost, flexible and
large-area electronics. In the last two decades, an extensive variety of utilizations have been
investigated, among them presentations, sensors and printed radio-recurrence identification
devices. Advances in material science, devices and procedure innovations have made
practical applications conceivable – for example, printed sensor labels. The journey

22
prompting this exciting opportunity has been complex. Printed smart labels open up low-cost
solutions for following and detecting applications that require high volumes and would be
profit from disposability. Examples incorporate radiation tags, one-time-use healthcare
sensors, tracking devices for the temperature of pharmaceuticals at the item level, and devices
that check food sources for spoilage and contamination. Ota et al. (2016) articulated that
better performance can be accomplished with printed hybrid electronics, integrating
microchip-based signal processing, wireless communication, sensing multiplexing and
ancillary passive elements for low-profile microelectronic devices, and opening up further
applications.
The UAE government has taken steps to modernize the way in which technology
infrastructure is growing and looks to develop a unified information network where sharing
of information can take place. The government is also looking to align the platform and
government resources so that goals will be achieved. Consolidating the system will help
government entities to more effectively manage and control their workplace responsibilities.
Ward and Peppard (2016) stated that the process will improve people’s experience and help
the public to receive all government information, communication and services through their
mobile smart systems, which will ultimately allow people to receive services in their homes.
It also means they will not be required to visit government offices for any kind of service.
This will save people time and money and provide the opportunity to interact with the
government electronically (Qi, Bai, Li, Dong, & He, 2015). To achieve this, it will be
imperative to plan appropriately so that smart systems are implemented without any
difficulties.
Bin Humaidan (2013) has further clarified that the government’s objective is to develop an
application through the use of smart systems which will increase the ease with which people
can search for information and use the feature to obtain better responses. The objective is to
provide different services through a single application that is secure and reliable. One such
example is mPay, which helps the UAE government to collect fees and services, receive news
and information, and track complaints. In a similar manner, SMS Dubai is a service which
has been developed for customers to utilize government services based on short messaging
services (SMS) (Margo, 2012).

23
As customer preferences and conduct overflow into the business workforce, it is becoming
increasingly important that access be provided to business data and applications through
smart mobile technologies, like the Apple iPhone and iPad, and devices running Google
Android and Windows7 Mobile or utilizing RIM Blackberry (Page, 2014). The huge
development in the adoption of these technologies worldwide has numerous business
managers thinking about how to successfully position their organizations to benefit from the
trend. Lee, Phaal and Lee (2013) argued that the drive for mobility is a critical aspect of the
business innovation agenda for most organizations today. Clearly, in a business instead of an
individual setting, more types of data are required, which are more complex, extending from
access to documents and presentations to status on activities and procedures, and for their
particular application the systems need to have different business knowledge capacities. In
addition, Page (2014) articulated that, against this quick-moving mobile background, it is
clear that simply having mobile access to email is significantly not enough for expanding
efficiency and helping employees to become better informed. The integration of cell phones,
for example, as well as portable personal computers (PCs) or laptops, tablet PCs, personal
digital assistants (PDAs) and smart phones, alongside their different applications and
programming, make it easier than ever for workers to collaborate and for businesses to
communicate with employees, clients and vendors.
Smart mobile technology permits individuals to use organizations’ information (Alawadhi et
al., 2012) and resources without being tied to a solitary area. Whether a company’s
employees are traveling to meetings, working from a customer’s site, out on sales calls, or
working from home or anywhere around the world, smart phones can help them to stay in
contact, to continue to benefit the organization, and to utilize its resources. Moreover, smart
mobile information technology devices can change the way the organization works together
(Lee et al., 2013). New technologies prompt better approaches for working, and new products
and services that can be offered to customers. Smart innovation devices can make an
organization’s team more effective, creative, productive and profitable. Consistently,
organizations are adapting more in terms of the ways smart mobile technology can be utilized
to increase efficiency and other benefits.
Accordingly, Alawadhi et al. (2012) explained that smart mobile technology allows
organizations to develop and profit from a phenomenal level of network between employees,

24
stakeholders, suppliers and customers. Workers can download applications on their smart
phones and they can connect with others through online networking – for example, LinkedIn,
Twitter and Facebook. According to Weichhart et al (2016), an organization can use local or
web-based applications to empower direct correspondence with these audiences in a variety
of ways. Anderson et al. (2012) demonstrated that real-time correspondence with the office
can be vital in delivering business benefits – for example, effective utilization of employee
time, enhanced client benefit or services, and a more noteworthy range of products and
services delivered. Real-time communication is also important in providing business
advantages, such as making presentations to customers and being able to download product
information to their network during the visit, collaborating on responses to tenders, sending
and receiving emails, interacting with colleagues, and delivering work-related trip reports in a
timely manner.
Sharing information through smart mobile technology permits businesses to receive prompt
feedback from clients on products and services (Salehan & Negahban, 2013). This speed and
accessibility has led to faster development within organizations. It has likewise prompted
product redesigns to move at a faster rate. Customers and employees feel as if they have a
direct role in an organization’s development. In addition, smart phone technology has
introduced another variable into advertising and marketing for organizations around the
world. Potential clients now observe business promotions on smart phones through a wide
assortment of mobile marketing technologies, including text messaging (SMS), mobile
applications, interactive voice response (IVR) messaging (Shaikh & Karjaluoto, 2016),
mobile websites, quick response (QR) codes, banner ads and more (Lee et al., 2013; Page,
2014). These advertisements can be modified to achieve more particular emphasis for a
business. Consumers are searching on their smart phone devices and being shown
advertisements that relate to the information they seek. Marketing is made more effective by
this customization; in light of the fact that most potential clients always have a smart phone
or similar device handy, their exposure to advertisements is expanded. For example, air
tickets can be booked and canceled by a smart phone using an assortment of technologies.
Salehan and Negahban (2013) stated that customers are able to use their tickets instantly, by
presenting their smart phones at the venue. Lee et al. (2013) stated that smart mobile
innovation can also be utilized for the dispersion of vouchers, coupons and loyalty cards to
25
customers. These items are represented by a virtual token that is sent to the smart mobile
phone.
Another sophisticated benefit of smart systems is related to mobile banking, which leads to
more efficient organizations. Banks and other financial and non-financial organizations use
mobile commerce to allow their customers to access account information and make
transactions; they can check their account balances, transfer funds, make bill payments and
deposits, and conduct other transactions (Shaikh & Karjaluoto, 2016). Vendors accept orders
from customers electronically through smart mobile devices using mobile websites or apps.
Smart mobile technology can advance the services that organizations offer their employees.
For example, when meeting with employees, managers or administrators can access their
organization’s customer relationship management systems over the internet to update
customer details. Business organizations can enable their employees or customers to pay for
services or goods without having to write a check, swipe a credit card or use cash (Salehan &
Negahban, 2013). These arrangements can connect an individual or organization directly to
the office network while working off-site, to access resources such as an organization’s
database or accounting systems.
Smart systems must operate in a multichannel world where clients and different partners
expect quick responses, activities and decisions. Suppliers expect reports on the demand
chain to be made available quickly, and retailers and wholesalers want to instantly identify
issues in the supply chain (Martínez, Gracia, Muñoz, & García, 2017). Integrating learning
management systems and human resource information systems permits organizations to
utilize information strategically to spot patterns and relationships between training and
promotion. Smart accounting systems that are also integrated between training and
productivity may even be viewed in real time. Having the capacity to easily recognize these
types of connections can help managers or directors to advance training requirements and
enhance profitability and turnover in their business (Dokic, Müller, & Meyer, 2015).
Empowering individuals to work with smart technologies can enhance employees’
profitability in the field and adjust their work and home lives for the better (Scardamalia &
Bereiter, 2014). This brings critical benefits to organizations through expanded efficiency,
profitability and cost savings. Smart mobile innovation can likewise cut carbon emissions by

26
reducing the requirement for office space and everyday commuting, and benefit employees
and organizations by supporting training and feedback mechanisms. Smart working
technologies are a key part of business in developed markets and organizations (Park, Koh,
Huh, Kim, Lee, Kang & Park, 2015). In emerging markets, smart communication technology
may bring shared value for both organizations and employees for delivering many social and
economic benefits.
Smart mobile technology systems helped New Zealand police officers cut 30 minutes of
administration time per shift, which equated to 520,000 hours of time saved a year
(Huntsville, 2013). Using smart phones, 8,500 officers could access information on suspects,
vehicles and areas while on duty. Almost 4,000 officers who needed to undertake more
intricate information entry were provided with tablets, and cost savings have been made by
replacing desktop phones with smart phones for 2,700 corporate personnel. This smart mobile
technology system helps organizations to become more efficient in terms of saving time and
being cost effective.
Using smart phones in the workplace environment can be important in promoting autonomy,
strengthening associations with companions and improving knowledge-sharing. Additionally,
these three primary elements can expand employees’ job satisfaction, which prompts better
efficiency in the workplace. Organizations will be better able to effectively adjust to the
changes that are taking place every day by incorporating the use of smart phones.
The number of smart phone users between the ages of 18 and 24 has significantly increased,
by 18%, from 49% in 2011 to 67% in 2012 (Smith, 2012). These people are the new
workforce generation – potentially, they have smartphones that always connect their lives to
their workplaces. Chief executive officers (CEOs) of organizations and other corporate
leaders should encourage their employees to use their smart phones as tools for expanding
their organization’s efficiency (Thiraput, 2013).
Today, many organizations use smart information systems that have been connected to
business knowledge or decision support systems, so that the analyzed data can help
employees or other stakeholders to make decisions (Ancillotti, Bruno, & Conti, 2013).
According to Polese et al. (2016), decision support as a discipline has always been aimed at
27
the small segment of the population that uses information to make important decisions in
organizations. Operational decision-making is just as significant to an organization’s well-
being. Moreover, current enterprise information models are divided between smart
operational systems (Verbong, Beemsterboer, & Sengers, 2013) and those that support the
analytical and reporting forms behind decision support (Ancillotti, Bruno, & Conti, 2013).
Smart technology systems are intended to enhance management procedures and expand the
effectiveness of employees from individual teams. Han and Lim (2010) stated that smart
innovation systems are focused on helping employees and individual team members to
understand employees’ roles, which can contribute to organizational success. Concentrating
on smart management systems that are intended to help employees assess and organize the
tasks they undertake in their organizational roles can ensure that those efforts are focused on
organizational values and the bottom line (Zhou et al., 2016).
Service systems have become smarter over time, as large information analytics have been
utilized to produce data and mechanize operations that create more significance to individuals
in the service system (Maglio & Lim, 2016). Many businesses are now taking a smart view,
and think that smart services that include all economic activity in which employees, units or
departments and smart technologies work together to apply particular skills and capacities
can ensure that employees perform better together than independently (Spohrer & Maglio,
2010). According to this view, smart service contributes to the value co-creation that
underlies all financial trade. Maglio et al (2009) and Maglio, Kwan and Spohrer (2015)
argued that the key to effective smart service lies in arranging the capacities of different
stakeholders or partners so that together they can maximize value.
As Maglio and Lim (2016) explained, smart service systems are a sort of human-focused
administration framework, implying that knowledge, capacities and value are all controlled
by the people in the system. The huge amounts of information and analysis made available by
smart service systems can benefit stakeholders with multiple points of view – for example,
client information may be transformed into data that is helpful in client value creation
processes. In addition, employee or customer information can be investigated to comprehend
patterns of client conduct (Porter & Heppelmann, 2014) to realize why clients make certain
decisions, making it possible to design new services to accommodate them. Utilization of
enormous amounts of information via the use of smart service systems can encourage a

28
commonly beneficial relationship between an organization, its employees and clients, and
potentially society (Kumar et al., 2013). Subsequently, a key issue in developing smart
service systems lies in taking advantage of enormous quantities of information analytics to
create value.
Smart service systems are the configurations of organizations, people, information and
technologies that operate together for mutual benefit. Smart service system technology can
take incredible advantage of enormous quantities of data analytics (Medina-Borja, 2015). The
term ‘enormous information’ is commonly used to portray vast and complex arrangements of
information representing digital traces of human activities and might be used to refer to scale,
volume (Zomerdijk & Voss, 2010) or impact on organizations. Smart service systems can
frequently be accomplished through offering a new core benefit or building up a new
approach to deliver a core benefit to organizations. Smart technology exists in different
structural forms in numerous organizations and is clearly evident in traditional service and
manufacturing industries. Kim et al. (2012) stated that sustainable service innovation requires
constant cycles of new advances in service, service operations and service improvement.
Smart systems help employees and provide significant benefits to organizations. Employees
gain a new vision and tools to implement best practices and monitor their impact. Smart
systems enable organizations to produce a tangible return on investment as a consequence of
an enhanced working environment and culture, development capture and risk alleviation
(Simmonds & Bhattacherjee, 2015). Smart systems make sustainability and corporate social
responsibility commitments visible. By creating this visibility, organizations may stay on
track and measure and report on results. Chourabi et al. (2012) stated that using smart
systems provides organizations with positive differentiation that builds trust and validity in
markets.
Smart systems help executives to discover, measure and control diverse aspects of the
business, permitting better risk management. Organizations’ reputational, legal and
operational risks are more visible with the use of a smart system (Ortiz‐de‐Mandojana &
Bansal, 2015), since the risks are measured and shown in the integrated management system.
Smart systems support employee frameworks for a positive and strong corporate culture.
Smart systems allow a business organization to support a positive working environment,
29
improve staff efficiency and productivity, and enhance quality and diversity. Smart systems
also attract and retain quality employees, customers and investors (Dedrick et al., 2015).
Moreover, they create a sense of belonging, strength and pride among employees of a good
business. Smart assurance systems are benchmarked against global standards and place
businesses in a superior position to manage government regulations and different
stakeholders concerned about consistency. Smart systems not only unite numerous
technologies but are also strongly tailored to application sectors (Ward & Peppard, 2016).
Today, adaptations are made to all forms of transport and mobility, and their related essential
infrastructure, which will continually increase their levels of safety, efficiency and
responsibility to the environment. Smart systems offer reduced administrator distraction and
error, and advances in vehicle control, navigation and logistics. According to Charani,
Castro-Sánchez, Moore and Holmes (2014), in healthcare organizations, smart systems
ensure benefits to the entire range of human services and prosperity, from individual
diagnosis and observation, through to treatment and the arrangement of focused medications
and implants, and improved telemedicine and personalized medical care systems in the
community. Smart systems in manufacturing ensure local enhancement.
Added to this, the ability of smart systems to communicate with clients is paramount. Smart
systems are set to make tremendous strides in all areas of communications within a connected
world. Sources of energy are behind practically every aspect or type of human effort
(Verbong, Beemsterboer, & Sengers, 2013). It is essential that in each phase of energy
production care is taken to ensure that processes are secure and efficient – civilization relies
on this. Smart systems, either independently or through networking, can improve each part of
this critical chain of energy production. Accordingly, given the demand for energy efficiency
and rapid developments in technology, smart systems have the potential to eliminate human
error in the control, direction and navigation of energy production, and for constant
observation of basic security structures and mechanisms (Lund, 2014). Smart systems accept
various information sources and drive proper responses. Smart systems have the capacity to
empower area-wide enhancements in living spaces and workplaces, as well as to encourage
responsible reuse and disposal of waste materials.
30
Human activities in smart service systems can be categorized as physical, informational and
interpersonal. The automation of these activities has advanced from automatic teller machines
used for banking services (Yoon & Occeña, 2014) to warehouse robots used in delivery
services, and the application of technology has made these services smarter. With smart
service systems, tasks that involve decision-making and data exchange can be made more
efficient by access to analytics based on enormous information – intellectual frameworks that
can follow up on their own or provide support to employees or individuals (Kelly & Hamm,
2013). However, with numerous channels now accessible, the potential for accidentally
overlooking clients is increasing. Competitors are continually constrained in the number of
responses they can deliver, since clients may discover another supplier who offers them
something more appealing (Martínez, Gracia, Muñoz, & García, 2017). These clients need to
be able to effectively engage in self-service in their dealings and relationships with suppliers,
and organizations must make it possible for them to do so. As interactive web applications
have improved, many individuals have come to prefer self-service over customer service.
Accordingly, an agile organization can effectively change the way it operates when it needs
to, but only if it has a good comprehension of how it is working and why it works that way.
Smart systems support this agility by delivering organizations information on how they work
that is explicit, easy to understand and easy to modify (Roche, Nabian, Kloeckl, & Ratti,
2012). Agility is an estimation of the total time and cost involved in moving from having the
information that implies change is needed to actually rolling out the improvement. Gartner
Group Inc. characterizes ‘agility’ as the ability of an organization to sense environmental
change and to respond efficiently and effectively to that change. Numerous organizations fail
to respond to clients in a consistent, focused way, and use client forms that are expensive in
terms of consumer satisfaction. As the world moves faster and becomes more complex and
competitive, this scenario will deteriorate. Clients of any organization will expect faster
decisions (Ancillotti, Bruno, & Conti, 2013) and will no longer be willing to wait for them.
With easy and fast access to data about competitors, clients can easily find an alternative.
2.5 Smart Recommender Systems
E-commerce recommender systems are broadly utilized by online traders to encourage
purchasing choices (Harmon, Corno, & Castro-Leon, 2015; Shi et al., 2015). Clients’

31
real-time states of mind and budget contemplations are logically imperative to
decision-making processes for purchasers occupied with the buying experience. Current
e-commerce recommender systems can provide customized proposals in view of past
searches and shopping practices. Boehmer et al. (2015) argued that such recommendations
can increase website sales and improve client satisfaction. Nonetheless, minimal efforts have
been made to use recommender systems to drive click-through rates and purchase rates for
recommended products or items. Recommender systems are not identified by recommender
user interfaces, but contextual factors also intercede in a customer’s purchasing decision. In a
marketing sense, context is important information that describes the circumstance of the
individual and their location, and ultimately leads to the association between the client and an
application being questioned (Knijnenburg et al., 2012). Click-stream information is a record
of a clients’ online conduct, unobtrusively gathered during web searching, and utilizing data
on time, browsing paths, earlier site visits, page requests, mouse actions, keystrokes and other
measurements, to evaluate users’ decision-making processes. Consideration of customers’
perspectives and budget contexts in the recommender systems can fundamentally expand
utilization of the system (Shi et al., 2015). The context-aware smart recommender systems
approach should be considered by online marketers looking to enhance sales, consumer
satisfaction and loyalty.
In addition, although an organization can use numbers to make adjustments to its operations,
the interaction skills of the individuals who serve as the point of contact should also be
considered (Lü et al., 2012). Palopoli, Rosaci and Sarnè (2013) postulated that personal
interactions inform decisions, and that analysis of past achievement and making expert
judgments can ensure that clients have an ideal experience – in this way, organizations can
achieve perfect results. E-commerce recommender systems are crucial in managing the
information overburden that exists in today’s information society. E-commerce recommender
systems use information on client preferences to help e-commerce retailers choose which
products to display, help clients personalize their searches, and help streaming services to
make customized playlists (Boehmer, Jung, & Wash, 2015). Customers’ trading activities are
supported by recommender instruments that can produce personalized recommendations.
E-commerce recommender systems are centralized, productive and versatile. A distributed
recommender system is based on a multi-tiered agent system, where the agents of every tier
have expertise in an alternate e-commerce activity. Palopoli et al. (2013) stated that

32
e-commerce recommender systems present significant advantages in relation to privacy and
security. According to Lü et al. (2012), the internet’s rapid expansion has in turn increased
the need for successful e-commerce recommender systems for filtering abundant information.
Nowadays, many recommender systems are utilized to advance e-commerce activities
(Schafer et al., 2001). E-commerce recommender systems are necessary to facilitate
transactions between customers and merchants (B2C). They are essential in order to
investigate the market space, enable effective communications between stakeholders, and
ensure security and privacy in transactions (Rosaci & Sarne, 2012). Generally, e-commerce
recommender systems display a typical representation of consumers’ ideas and the
connections required in the client domain to encourage mutual cooperation (De Meo et al.,
2012; Garruzzo et al., 2011). Specifically, e-commerce recommender systems provide
customers or users with suggestions for products available for purchase (Wei et al., 2007), in
light of that user’s interests and inclinations over the distinctive period of a B2C transaction,
and are built by programming specialists (Garruzzo et al., 2006). Distinctive behavioral
models portray a series of stages. For example, the consumer buying behavior model is based
on six phases: need identification, merchant brokering, product brokering, negotiation,
service and evaluation, and purchase and delivery (Rosaci & Sarne, 2007).
On this theme, recommender systems play an increasingly important part in the success of
online networking sites. Social recommender systems target the social media domain (Guy,
2015). Social media introduces many types of information, such as tags and explicit online
relationships, which can be used in a unique manner by recommender systems to develop
their effectiveness (Casino, 2015). Recommender frameworks depend on individual data
about client conduct in order to make suggestions and generate recommendations.
Furthermore, recommender systems are utilized to enhance sales in retail websites like, for
example, Amazon or eBay (Friedman, Berkovsky, & Kaafar, 2016). Ricci et al. (2015)
argued that recommender systems improve user involvement with online services, and
rearrange basic decision-making as well as information access for website services.
Ordinarily, recommender frameworks use client data embodied in the client models, keeping
in mind the goal of recommending products that customers are likely to buy.
33
2.6 Specific Developments in Smart Systems
In 2006, the European Technology Platform launched a new initiative on smart systems
integration (Rudall & Mann, 2007; Schoitsch, 2006), with the goal of concentrating on smart
systems integration. This was considered to be an imperative area of development. The key
aspects of the platform were to enhance energy autonomy and networking, build systems
from components, and promote interdisciplinary and fast integration of diversity technologies
(Liserre, Sauter, & Hung John, 2010; Lund et al., 2014). The European Technology Platform
on Smart Systems Integration is expected to unite European private and public stakeholders
with the specific goal of coordinating and bundling efforts. Furthermore, the platform aims to
establish sustainable structures for enhancing the intensity of European innovative work on
smart systems technologies, specifically their coordination. Obviously, any systems that plan
to consolidate sensing, handling and compelling capacities will be increasingly complex, and
various features will need to be included.
In addition, various disciplines and standards are required from different functions such as
science, design and material science. It is also thought that the smart system may incorporate
mechanical, electrical and biological functions to incorporate new features like continuous
access to information and security (Gabler et al., 2016). It is deemed crucial that such created
smart systems should be easy to use. The areas that the European Technology Platform on
Smart Systems Integration plan to cover include telecommunications, commonalities (cross-
cutting issues), logistics or radio frequency identification (FRID), medtech systems, and the
aerospace and automotive industries (Schoitsch, 2006).
Rudall and Mann (2007) identified a number of research projects covering a wide range of
applications of smart systems that have been achieved in the European Community. For
example, a new technology and communicating agent has permitted scientists at the Sony
Computer Science Laboratory in France to include a new level of intelligence to a robotic
dog. Rather than teaching the puppy new tricks, the algorithm’s design plan standards and
systems developed by the European Community agency’s project permit the robotic pet to
learn a new trick itself and impart the information to others. In another initiative, a European
project team has created an open-source programming, investigation and optimization toolkit
for pervasive calculating systems utilizing Constraint Logic Programming languages. This

34
toolkit is required to help provide the best approach to smart systems’ more powerful
advances in the future (Prabhu et al., 2015). Davcev et al. (2008) recognized that an
embedded WisNts project has brought together 12 partners from driving research
organizations in the fields of wireless correspondence, distributed computing and
collaborating objects in 10 diverse European nations, to concentrate on advancing remote or
wireless sensor systems and their applications. Based on this theme, the following section
discusses the different specific developments of smart systems.
2.6.1 Cooperative Networks for Intelligent Road Safety (COOPERS) project (integrated
traffic management)
According to Pfliegl (2006) the Cooperative Networks for Intelligent Road Safety
(COOPERS) project in European countries employs a smart system to exchange information
relevant to the particular road segment, improve overall road safety and empower traffic
management. Papadimitratos et al. (2009) stated that this particular project aimed to develop
and test new safety-related services, equipment and applications, utilizing two route
correspondences between street infrastructure and vehicles from a traffic management
viewpoint. COOPERS will build upon existing equipment and infrastructure as far as
possible, to join bi-directional infrastructure vehicles in order to open institutionalized
wireless correspondence technology (Gruber & Schoitsch, 2007). Pfliegl (2006) specified that
the COOPERS project enhanced street sensor foundations and traffic control applications for
more exact circumstance-based traffic information and driver guidance. The project also
established a connection between road toll systems and intelligent integrated video (I2V). It
advanced the communications and applications necessary to cope with the I2V requirements
in terms of reliability, robustness, real-time capacity and use of diverse technologies (Rudall
& Mann, 2007).
2.6.2 European project Dependable Embedded Components and Systems (DECOS)
(safety-critical real-time systems)
Herzner et al. (2006) described the European project Dependable Embedded Components and
Systems (DECOS) as distributed, embedded, safety-critical, real-time systems. The goal of
DECOS is to pinpoint and alleviate the obstacles that hinder the development of highly
reliable embedded systems. According to Herzner et al. (2006), smart systems applications
like versatile journey control or brake-by-wire depend on predictable and reliable embedded
35
systems as infrastructure. Advances made in such dependable applications will help to avoid
faults during their design and development.
Likewise, to avoid any risk of damage, all new technological inventions and systems must
first be considered with regard to their potential for harm, before they are discharged for use
in business (Braga et al., 2012). In general, every innovation contains an element of risk;
extra risk mitigation measures are required when rolling out new security- and safety-relevant
systems, in order to avoid harm caused by the system itself (Schoitsch et al., 2006). Another
new safety-relevant application which is receiving increasing attention is driverless cars.
These vehicles do not need a human driver to control them; they make sensible choices and
avoid accidents in the event of a risky situation. To allow the widespread use of these sorts of
vehicles, all the pertinent security and safety points must be investigated in advance. The
complete product life cycle must be adjusted by utilizing highly safety-relevant systems
(Kristen & Althammer, 2015).
Evidently, intensive testing can minimize the risk of faults (Kopetz, 2004; Kristen &
Althammer, 2015), but it is imperative that the configuration and advancement process is
controlled (Althammer et al., 2008; Schoitsch et al., 2006). A model-based instrument chain
was created by DECOS in 2007 and is described by Herzner et al. (2006). DECOS’s high
standing is independently a direct function of the great strength of its industrial and scholastic
partners (Kristen & Althammer, 2015). The partners jointly built a set of generic hardware
and software equipment within the system of the time-triggered architecture. Importantly,
time-triggered architecture is the engineering of decisions for high-constancy circulated
systems in an assortment of utilization areas. It is a significant mechanical accomplishment in
the range of distributed real-time systems (Balogh, Pataricza, & Polgár, 2007). Kristen and
Althammer (2015) stated that, as time-triggered architecture is the most dependable
methodology for high-reliability systems, it has been widely considered in a wide range of
businesses, including automotive, aerospace, unique vehicles, railroad and industrial control.
Reliable integration of safety-relevant and non-safety-relevant subsystems is a major concern
in these areas.
36
2.6.3 Autonomous systems (safety-critical embedded systems and intelligence)
There is an abundance of embedded smart systems (Wilhelm et al., 2013). Recently, the
majority of embedded smart systems have executed straightforward control and support tasks
in a command pre-modified way (Rudall & Mann, 2007). Nonetheless, they are intended to
complete independent tasks and show ‘intelligence’. Thus, they are called ‘smart systems’,
which from numerous points of view are the best designation (Schoitsch & Kubinger, 2006).
According to Schoitsch and Kubinger (2006), the essential attributes of smart systems are
circulated and networked electronic control units incorporated into their specialized or
common environment. The embedded systems are connected to sensors and actuators with
properties like cognition and they are controlled by robust algorithms which imply some
intelligence (Papatheocharous, Axelsson, & Anderrson, 2013). These smart systems are now
found in numerous areas, such as basic applications for security or safety in aerospace,
railroads, cars, machinery and medical systems, as well as entertainment. Secundo et al.
(2015) stated that the Austrian Research Centers’ (ARC) Seibersdorf research, is at present
engaged with research in this area of autonomous systems, providing vision systems (optical
and laser light systems), advanced driver help systems, distinguishing traffic and other signs,
model autos and robots.
2.7 Smart Systems and Management Science
In management, a smart system is frequently referred to as a system where the ‘smartness’
originates from the system’s designer or indeed its manager, administrator leader, team leader
or other system users (Ward & Peppard, 2016). ‘Smart’ is translated as a term for tasks which
can be determined, measured and achieved. Morris (2006) trusted that such undertakings
ought to be realistic and auspicious. He goes significantly further to portray ‘super smart’
tasks, and portrays the ordinary use of ‘smart or super smart’ in administration or
management work. Other management experts utilize the term in connection with the
development of systems such as decision-making systems, data-processing systems,
modeling systems or other PC-oriented systems which display some level of intelligence or
smartness (Anderson, Sweeney, Williams, Camm, & Cochran,, 2015; Ward & Peppard,
2016). The following section discusses innovative systems in cybernetics and management
science.

37
2.7.1 eCall: a sensor-based emergency system
A new system called eCall may well save 2,500 road deaths a year in the European Union
(EU). The European Parliament has voted for EU-wide emergency alert systems, named
eCall, to help emergency vehicle groups (ambulance crews) get to road accidents more
quickly. Bethany (2015) stated that new cars and light vans will have the systems as standard
from 2018. The essential information will be sent just after an accident happens. This
innovation was initially proposed in 2012, but the relevant legislation was delayed due to
safety concerns (Rudall & Mann, 2007). After negotiations between members of the
European Parliament and EU governments, it was agreed that eCall would provide essential
information, such as on the type of vehicle that had been involved in the accident, the amount
of fuel used, and time and location of the accident.
Accordingly, if the project tests are successful, all new cars in the EU will be fitted with a
device that calls the emergency services after an accident. The device tracks the vehicle’s
developments by satellite and is connected to sensors positioned around the vehicle
(Telematics News, 2015). To avoid false alarms, a message is sent to an emergency call
center only if no fewer than two sensors are activated. Details of the vehicle’s location, the
owner, and seriousness of the accident are sent by a cellular telephone connection to a call
center. According to Rudall and Mann (2007), the system is designed so that, if it neglects to
work, an injured driver or passenger can simply press a button to contact the call center. The
center’s operator can likewise talk to the vehicle’s passengers.
The European Commission, which financed the project, has set a due date of 2018 for eCall
to be fitted to every single new car. The manufacturing companies say that it will add £300 to
the cost of a new automobile, but the European Commission estimates that cost to be £100
(Rudall & Mann, 2007). The system is accessible right now in some vehicles. Some member
states of the EU are still in the process of assessing the proposition. It is proposed that a
yearly saving of some £15.2 billion in accident cost reserve funds could be achieved, and a
saving of £2.8 billion in accident-caused traffic congestion is expected. Moreover, the EU
study promises that more exact data provided by the system will enhance emergency
response times by 40% in urban areas and 50% outside towns (Rudall & Mann, 2007).

38
Chen and Lughofer (2013) stated that this system could in reality be termed ‘smart’.
Contingent upon the quantity of sensors fitted and their locations, and the sophistication of
the monitoring PCs, a wealth of information will be made accessible. Currently, the system
can provide details of the vehicle’s position and the seriousness of the damage (Chen &
Lughofer, 2013). Sensors fitted at the back, side and front of a vehicle can provide vital data
about its condition. Karthika and Sumathi (2012) stated that an evaluation of where a crash
has happened, whether an airbag has been activated, whether there is a fire and so on can
allow a decision about the appropriate response and set it in motion.
2.7.2 Smart system to stop illegal parking
The combination of satellite innovation, sophisticated sensors and progressive programming
of PC systems implies that surveillance and monitoring of a country’s residents is inescapable
(Shinde, Bhagwat, Pharate, Paymode, & Scholar, 2016). Vehicle drivers in the UK will now
need to deal with a system called Volis, developed by Partem, a company based in
Cheltenham, Gloucestershire. This company has delivered a system of road sensors which
will send instant messages to traffic superintendents when a vehicle is determined to have
been parked illegally. Rudall and Mann (2007) postulated that the system involves separately
fitting five sensors on a street or territory where parking limits apply. The sensors receive a
signal from a satellite overhead (Wang, 2015). This signal is provided by either the GPS or
the European system, Galileo. This activity triggers the transmission of a text message to the
traffic specialist or warden to show where the vehicle is parked. The system can also utilize
the same modern technology to monitor parking meters so that when the purchased parking
time expires a GPS sensor informs the warden (Yagi, Watanabe, & Nagayama, 2015).
Although in its present form it is an ‘information collector’, the system also naturally has the
capability of informing a traffic controller. It is very likely to be developed further; currently,
various local governments are participating in the project.
Wang (2015) has developed Disclosed, a system and technique for alerting drivers on the best
way to avoid receiving parking violation citations. A location-determining device confirms
the location of a client. A database stores recorded parking violation citations, real-time
crowd-sourced parking violation citations and other relevant information, with the use of a
confirmation calculation and a deduction calculation. Kim and Oh (2016) stated that the
parking plan is dictated by a client’s location and speed, and, once the assurance is made, the

39
database is surveyed to distinguish whether a potential parking violation exists. If it does, an
alert is sent.
2.7.3 Smart cats’ eyes
The cats’ eye is a road reflector developed in 1934 (Rudall & Mann, 2007). It now acts as a
road marker to help people driving in the dark, and it is undergoing a major high-tech
redesign (El-Tawab, Abuelela, & Gongjun, 2009). The cats’ eye is currently being
transformed into an ‘intelligent road stud’ that will do significantly more than simply help
drivers follow the road at night. The UK highways agency, Highways England, plans to
overhaul the existing system so that it can provide its control centers and drivers with an
array of information (Marco & Hooper, 2016). Initially, the project studs have been
introduced on a 1.8-mile stretch of a UK motorway and overhauled, the objective being they
will become brighter as visibility worsens and can be made to flash at the flick of a switch.
Moreover, they can turn blue at the point where the road temperature drops to below freezing
and can caution drivers about delays ahead by changing to red. Obviously, these devices will
have other potential uses and capacities; it is likely that the level of smartness will be
incremental as the present trials progress.
2.7.4 Smart tagging system
In Hungary, preparatory trials have taken place for new electronic tagging systems for air
travelers checking in at air terminals. In the initial project, air travelers will be required to
wear the tags; thereafter, each of their steps will be monitored, from the check-in desk to
boarding an airplane (Gupta, Kumar, Mishra, Semwal, & Siwach, 2017). The gadget will be
connected to closed-circuit cameras controlled by PC systems. The tags are the size of a
credit card and worn on the traveler’s wrist after checking in. Rudall and Mann (2007) stated
that a signal will be transmitted each second to advise the PC of the traveler’s name, flight
number and location, to a precision of three feet. Video-imaging software will plot the
movement of each tag and have the capacity to send information to the air terminal staff.
Patterns of movements can also be followed, and any unusual conduct or meetings noted.
Removal of the tag would trigger an alert for alarm.
Such a system could be fitted with a network of a combination of cameras and tag readers
and used to monitor all travelers and react appropriately to their actions (Ghazal, Haneefa, &

40
Sweleh, 2016). Dr Paul Brennan of the University College, London reported that £67 million
is lost every year due to travelers arriving late to board flights and to security checks. Dr
Brennan believes that the tags would reduce this loss and act as an intense observation
instrument. Similarly, with all such systems there is great scope to enhance both the nature of
the information obtained and the level of processing required; smartness is consolidated in
such an innovative project.
2.7.5 Smart trading systems
Computer systems can read news stories and use the gathered data as a basis for trading. It is
predicted that smart trading systems will become widespread over the next five years.
Reuters, the overall data supplier for this kind of system, has effectively made accessible a
tagged version of its news feed. This service provides 8,000 news stories a day (Rudall &
Mann, 2007). Its new system will make news stories easier for PC-based trading systems to
process as ‘machine-readable’ news. Trading in the United States (US) and the UK is now
directed by computer systems. Trading patterns use algorithmic systems based on cost and
volume information. Computer systems that read the news go a step further and in effect
make an effort to simulate human judgment (Xu & Zhang, 2016).
This development definitely implies that trading systems will be dominated by computer
systems. This presents a challenge for software designers to create proficient observing
systems (Rylatt et al., 2015). The challenge to Reuters is huge, and massive amounts of data
are included in an archive that will incorporate something in the range of 12 million news
items and pieces of pricing information acquired from 259 trades and markets around the
world up to 23,000 times each second. Reuters says that it expects its computer systems will
have the capacity to weight news stories in view of the language used to assess how tentative
they are and to check the writer’s by-line on each story, to measure whether it has been
compiled by a specialist in the area reported. These systems have already been formally
connected to the term ‘smart’, and they will soon be qualified for such a designation.
2.7.6 Lip-reading computer system
Computer programming that is able to read lips at any point has been developed. The
potential of this innovation is growing, and it has already been utilized to write subtitles for
movies (Bowden et al., 2013). The innovation is called automated lip-reading (ALR), a

41
software technology developed by speech recognition expert Frank Hubner (Rudall & Mann,
2007). Bear et al (2014) stated that the software empowers PC systems to identify the shapes
that the lips make, and then to turn them into sounds and match them with a dictionary. The
system has already been utilized effectively to interpret the silent movies made by Eva Braun
at Adolf Hitler’s mountain retreat, The Berghof, taken from the archives of the US Office of
Strategic Services.
2.7.7 Smart information modeling and management systems
Patti et al. (2015) explained a program called District Information Modelling and
Management for Energy Reduction (DIMMER), which is distributed software infrastructure
for information modeling and energy management, linking data with user behavior patterns
and feedback. It can also collect, process and remotely visualize data on heterogeneous
energy use, warming dispersion and the power grid for buildings in the region (Harmon et al.,
2015). The information is obtained from devices and sensor systems in every building that
monitors and manages energy use. Middleware empowers interoperability for the exchange
of data among different information sources (Wang, 2015), addressing data integration as one
of the central boundaries for energy management systems (Patti et al., 2015). Data is
gathered, examined and stored in a distributed smart digital archive that provides knowledge
of district-wide energy management. In this way, clients can access data on district energy
production and consumption to increase their awareness of energy use behaviors (Andrić et
al., 2016) and inform control strategies that can take advantage of the successful features of
buildings and usage patterns to lower energy use and carbon emissions (Balaras,
Kontoyiannidis, Dascalaki, & Droutsa, 2013).
In a smart city context, this information can support advances in imaginative business models
for sustainable energy generation (Vibhute & Gawali, 2013). According to Wang (2015), a
comparable methodology can be developed for district-level water resources. Implementation
of this kind of smart system requires distributed architecture empowering the interoperability
of regional energy sourcing and use with the environmental conditions of the building and
client feedback information (Andrić et al., 2016). Coordination of this real-time information
provides pervasive and real-time feedback about the effect of energy use practices, which can
then drive new arrangements and plans of action. Patti et al. (2015) articulated that DIMMER
requires real-time information accumulation, client social conduct profiling, advanced
42
middleware for information integration, asynchronous communication, energy proficiency, a
cost investigation engine, and a web interface with tools and end-user services that contribute
to sustainable energy practices. Kensek and Noble (2014) contended that DIMMER’s smart
digital archive is unique for cities and a useful support for the development of strategic plans
in the city itself.
2.7.8 Smart production management systems
The expanding accessibility of real-time information from smart production management
systems is quickly changing the production environment (Porter & Heppelmann, 2014). The
upside of such systems is the prediction of unexpected disruptive events that can greatly
affect manufacturing yields. Interruptions can originate from industrial accidents,
earthquakes, tsunamis, storms and other climate events (Harmon et al., 2015). Nevertheless,
Wuenderlich et al. (2015) explained that, over a long period of time, it is competitive
dynamics and technological change upsetting markets that can significantly make an impact
on manufacturing and firm performance. Meridou et al. (2015) wrote about the ARUM
project, which provides decision-making programming tools for strategic and operational
planning, scheduling and real-time optimization strategies. The objective is to support
efficient, real-time event management that can affect production, including worker
accessibility, competing priorities, unexpected requests, accidents and breakdowns.
Accordingly, ARUM utilizes multi-agent innovation to create a complex system of systems
that serves as a swarm of schedulers. Swarm standards improve system design by arranging
various elements of scheduling devices in a holonic way to accomplish coordination of
company-wide interdependent schedules (Barbosa, Leitão, Adam, & Trentesaux, 2013). A
holonic production system is an emerging paradigm in agile manufacturing (Barbosa, Leitão,
Adam, & Trentesaux, 2015a). Generally, such multi-agent systems comprise an arrangement
of individual specialists (Marik et al., 2015) that contribute to the systems by autonomous
calculation within every agent and by correspondence among agents (Barbosa Leitão, Adam,
& Trentesaux, 2015b).
The intelligence of the systems is a function of its reliance on a typical vocabulary shared by
all instruments and services conveyed on the ARUM platform. According to Meridou et al.
(2015) ARUM is a smart production management system aiming to fill the gap in real-time
43
decision-making abilities for resource allocation, planning and developing in existing
enterprise resource planning solutions that cannot satisfactorily address highly complex
customized products and variable manufacturing environments. The ARUM adaptive
production management is being guided to address three situations: new product ramp-up,
small-lot production and planning of wafer fabrication at Infineon Technologies (Harmon et
al., 2015). ARUM’s performance is being analyzed and compared against existing legacy
systems.
2.7.9 Polyglot healthcare information systems
In “A Smart Polyglot Solution for Big Data in Healthcare”, Kaur and Rani (2015a) contend
that the medical services industry cannot completely depend on traditional techniques for
information storage. The differing qualities and high volume of frequently semi-structured or
unstructured information, coupled with the mission-critical dependence on real-time
information, requires new methodologies (Kaur & Rani, 2015b). Database solutions that
support versatility, schema-less storage capacity and scientific handling ought to be
considered to enlarge the ability of legacy social databases. For displaying and storing
clinical information in electronic medical records, non-relational databases are more
reasonable. Non-relational (NoSQL) or cloud databases are perfect for storing large amounts
of semi-structured information in settled structures with high levels of detail, adaptability and
real-time capability (Kaur & Rani, 2013). Relational databases, with their atomicity,
consistency, isolation and durability (ACID) properties are more fitting for money-related
exchanges, such as patient billing, payroll, pharmacy or drug store records, and other
business-related information (Kaur & Rani, 2016).
In addition, Kaur and Rani (2015a) discuss PolyglotHIS, a multiplatform system that can
coordinate information from an assortment of formats and inquiring modes. Kaur and Rani
(2016) stated that software that can utilize more than one sort of data store is referred to as
‘polyglot persistent programming or software’. Kaur and Rani (2015a) have commented on
the advantages and challenges of designing as well as executing the complex PolyglotHIS
system as far as maintaining consistency over multiple underlying information stores. The
future of the system is to investigate information on the data storage in multiple data storage
systems as well as to analyze other use cases in which polyglot persistence might be helpful.

44
Demirkan (2013) indicated that smart systems are critical in driving advances in the field of
healthcare technology, as they provide the source for information-based medical care and
cure. The integration of micro-sensors and micro-actuators in products will provide medical
care services with the skills to better treat and deal with patients in doctors’ facilities or at
home. The consistent connecting of microsystems to a telemetric and telediagnostic base will
fundamentally reduce response time and simultaneously contribute to containing the cost of
public medicinal services. Smart system enhancements are driving innovations in medical
care, enabled by microsystems and nanotechnology. Smart systems are addressing today’s
challenges.
2.7.10 Smart control systems in buildings
The building control system, also named building automation systems or building
management systems, has probably prompted the development of monitoring and metering
systems for buildings (Shaikh et al., 2014). These control systems are generally centralized,
integrated hardware and programming systems; thus, they monitor and control the indoor
climatic conditions in building facilities. The operational execution of the buildings, along
with occupants’ safety and comfort, is typically guaranteed with these control systems. Smart
building control systems are ordinarily prompted by mechanical, electrical and plumbing
system controls. Ippolito, Sanseverino and Zizzo (2014) postulated that the objective of the
smart building control systems is to maintain energy and comfort. For example, comfort
requirements might include factors such as warmth, visuals, air quality, humidity and
different plug loads. Moreover, the tenant’s inclinations, conduct, inhabitance design and
adaptive comfort needs can be integrated into the building’s comfort conditions, along with
energy and cost savings procedures. Features are activated in order to ensure the satisfaction
and comfort of tenants. These include, for example, ventilation and temperature control
systems that might control chillers, boilers, air handling units, rooftop units, fan coil loop
units, heat pump units and variable air volume boxes. Visual comfort can include artificial
lighting technologies, and the adjustment of solar radiation through blind control (Soares,
Costa, Gaspar, & Santos, 2013). Air quality may be treated with window openings, air
conditioning units and fan controllers. Plug loads constitute kitchen appliances, laundry
accessories, and charging portables.

45
Shaikh et al. (2014) also identified intelligent controllers, which consisted of learning-based
methods (i.e., artificial intelligence, fussy systems and neural networks), model-based
predictive control and agent-based control systems. Learning control systems have been
developed and successfully applied to electrical and mechanical systems, mostly in robotics
and automation and manufacturing areas. Such intelligent controls have been intended for
attaining system stability and execution through unknown learning outcomes, which exist in
system progression (Janssens, Pipeleers, & Swevers, 2013). These controls are designed like
artificial intelligence, with little need for details. Algazar, El-halim and Salem (2012)
indicated that fuzzy logic controllers utilizing the standard base would make possible a multi-
criteria control system incorporating an expert system. With the execution of complex control
systems, fuzzy controllers ought to operate rationally and offer enhanced performance. Fuzzy
systems are able to map non-linear attributes of the system execution. Fuzzy adaptive
controllers have been applied to heating systems (Gago, Muneer, Knez, & Köster, 2015) to
capitalize on energy efficiency, thermal comfort, visual solace and regular ventilation
(Eftekhari, Marjanovic, & Angelov, 2003).
Additionally, a model-based predictive control method is critical for warmth control in
buildings, since it permits the maximum potential for imposing temperature limits (Shaikh et
al., 2014). This kind of system can also directly incorporate instabilities in the improvement
procedure, thereby helping the control of the indoor climate. Agents are generally
intelligence, virtual or physical entities that co-operate rationally in a situation with both
perceiving and influencing qualities. Scerri, Pynadath and Tambe (2002) stated that agent-
based control systems operators are capable of coordinating and communicating with each
other. Agents in control systems are arranged in different layers according to their
functionality. Agents possess a distinctive behavior but share and coordinate some common
properties. The system of various operators might be utilized to model complex issues with a
few cyber agents in simulations or physical agents with intermediaries, which may then be
applied in reality.
According to Shaikh et al. (2014), the design of multi-agent systems technology (MAST) is
an immensely complex issue that needs to be divided into a few sub-problems which can be
dealt with by their representative agents. The resolution of these sub-problems is integrated
with the need to change the current global state regarding agent coordination (Dounis, 2010).

46
This system involves different particular functionalities – for example, evaluative, speculative
and teaching. In this way, it permits operators and policy makers to understand the system’s
working abilities, make improvements to elicit proof from the emerging theories, and obtain
data on decisions from system designers (Scerri, Pynadath, & Tambe, 2002). According to
Zeng, Wu, Jun-feng, Gao and Li (2008), the building intelligence control with a MAST
structure permits two things: firstly, the learning of building inhabitance patterns and energy
resources coordination; and, secondly, the capacity to respond to real-time indoor
environmental conditions. Recognizing the capability of the appropriated plan for improving
building energy, different researchers have utilized MAST to oversee receptive and
anticipatory control, and lighting and air quality for smart homes and office structures
(Ramchum, Vytelingum, Rogers, & Jennings, 2011). It has served to organize the building of
electrical devices and warming systems to optimize smart grid energy demand. It has also
been utilized for the management of micro-grids and renewable energy in building supply
systems in coordination with the utility grid supply, along with energy tariffs and trade-offs
for renewable energy suppliers.
Moreover, MAST integrates facility systems and appliances with sensors and actuators
(Shaikh et al., 2014). These controllers in energy management systems work to satisfy and
discover equalizations between the building energy requirements and the inhabitants’ comfort
(Timm, Woelk, Knirsch, Tönshoff, & Herzog, 2016). All of these help resolve different client
inclinations in buildings (Lee, 2010) and the intricacy of an optimal building environment
control. The warmth responses of buildings with respect to outdoor atmosphere and
inhabitance loads for the management of building energy and comfort have been studied.
Occupancy prediction and behavioral qualities in zone and room levels, and the peer impact
of simulation have been conducted and created utilizing the MAST inhabitant reproduction
tool (Azar & Menassa, 2011). According to Abras et al. (2007), the MAST approach has been
utilized to manage systems that can be demonstrated by non-linear equations. This method
provides an open design where agents can be arranged smoothly and progressively. These
systems imitate various rules and requirements, which can be modified by agents. Wen et al.
(2013) stated that the agents in the MAST approach must have the capacity to show a
customizable autonomy and provide manual override where human and artificial agents may
act simultaneously.

47
2.8 Smart Systems in the UAE
The movement of people from rural to urban regions has led to uncontrolled urbanization and
sustainability issues in the UAE. It is essential to manage infrastructure and resources in
crowded urban areas (Akcin et al., 2016). Population management issues have led to more
demands for smart systems. Subsequently, the efficiency of smart systems is becoming a real
challenge in urban life. For all intents and purposes, smart systems are required for city-
dwellers to make all sorts of arrangements – for example job activities, security-related
matters, transport, entertainment, commerce and catering.
The history of smart systems in the UAE can be traced back to 2013, when the government
introduced the partial transition of some services from eGovernment to mGovernment, or
mobile government (Albesher & Stone, 2016). Plans were made to pursue both strategies at
the same time. According to ElSherif, Alomari and Alkatheeri. (2016), a mobile government
is the aggregate administration of government services which can be accessed by mobile
devices or wifi devices at any time and from any place to increase customer satisfaction,
reduce management bureaucracy and help achieve governmental strategic objectives. The
authors further argued that the government needed to accelerate the development process of
smart systems standards (ElSherif et al., 2016). Since that time, many new smart system
projects have been completed.
According to the UAE’s smart systems initiative, there are more than 150 smart services in
UAE (Telecommunications Regulatory Authority, 2013). The UAE government has
developed a road map (mGovernment, Version 1.0, 7 October 2013) for the transformation of
the UAE. In this 83-page document, the Telecommunications Regulatory Authority reported
that four steps were needed to complete the transformation:
1. establish the environment for mGovernment to flourish,
2. assess the capability and capacity of government entities to adopt and use smart
systems effectively,
3. establish shared resources across government entities at the national level, and
4. achieve citizen “happiness” (Telecommunications Regulatory Authority, 2013).

48
In fact, the UAE government has recently established a Ministry of Happiness with a full
cabinet minister. The Telecommunications Regulatory Authority in 2013 reported these four
steps would contain many milestones. Moreover, Al-Khouri (2011) stated that the
Telecommunications Regulatory Authority (2013) has clarified the scope of the road map,
which runs parallel with the existing federal eGovernment strategy. The road map stated that
the project would be completed in May 2015. However, some of the tasks have been
extended beyond that time.
The UAE is considered one of the world’s developed nations. Its government started its smart
systems project by establishing the environment for mGovernment to flourish (Albesher &
Stone, 2016), with the establishment of a program management office to oversee the work of
different departments and ensure that tasks are completed effectively and on time. With the
formation of the program management office, the government aimed to satisfy the major
stakeholders involved in the projects, and then carry on with the essential task of integrating
all the systems.
The next significant achievement of the UAE government in its smart systems initiative was
the development of a smart mobile value chain and affordable public access to wireless
networks and services. Lower prices and significantly increasing demand stimulated greater
revenue for telephone service providers. Albesher and Stone (2016) stated that the UAE
government achieved this by attracting mobile technology companies to the country, while
also ensuring strict requirements were in place, such as the need to show national
identification cards in virtually every transaction. Clients were able to use smart systems for a
range of requirements, such as applying for a driving licenc, purchasing car insurance and
paying utility bills such as water, electricity and telephones, to receiving treatment at
hospitals and clinics, paying traffic fines, applying for permits and trade licenses, renewal of
annual car registration, enrolling children in schools, purchasing air tickets, as well as making
transactions in all banks or exchange bureaus. With such a strong requirement for the use of
mServices in virtually all areas of life, integrating the government’s systems ensured they
could effectively ‘talk’ to each other. This made it possible for the UAE population to
become skilled in these smart systems, and ensured free and/or affordable access to
mServices for public sector entities.

49
The government also encouraged capacity-building in all its departments and agencies. To
complete the process of establishing the environment in which mGovernment could flourish,
the UAE government strengthened the legal framework associated with the protection of
information (Al-Khouri, 2011). The second step was to assess the capacity and capability of
government entities to effectively conduct and provide services via mGoverment. The first
part of this second step was to assess the development and sharing capabilities of the
government entities, a milestone linked to developing government applications and services
and sharing them among different agencies. The second part was to assess the data-sharing
capabilities of government entities (Albesher & Stone, 2016). After assessing these
capabilities, the UAE government evaluated the overall security of the applications and data.
In today’s world, security of government data and privacy of data is of great significance; for
this reason, the UAE government examined the security implications, not just the skills and
resources requirements. According to Albesher and Stone (2016), this was done by the
program management office, which ensured that every department was mandatorily equipped
with the required skills and resources. It also worked to improve people’s skills throughout
the country, in all levels of government, roles and positions.
While the second step was being completed, the UAE government began work on the third
step, which was to establish shared resources across government entities at the national level.
This was the core process of the transformation of eGovernment to mGovernment (Faisal &
Talib, 2016). The first milestone in this track was to enable mobile payments, or mPayments,
which was made possible with the introduction of a mobile identity and authentication
system. Shuhaiber (2016) stated that the mobile identity system enabled the government to
roll out the mPayment system. According to Dwivedi and Bruggink (2016), mPayment is the
payment process between two parties through mobile devices. After the first milestone was
achieved, a neutral independent entity – a trusted service manager (TSM) – was appointed to
serve as a single point of contact for the service providers to reach their customer base
through the network operators (Musfeldt, Adkisson, & Kean, 2016). Furthermore, a mobile
innovation center was established to achieve mGovernment targets (Albesher & Stone, 2016).
Government data was integrated to ensure that the targets of mGovernment were achieved
(ElSherif et al., 2016). Government apps were made available via the Google Play Store,
Apple iTunes etc.. The last phase in this step was to develop a nationwide security platform
to ensure that data security was maximized.
50
The final stage was to achieve citizen happiness. Rodrigues, Sarabdeen and Balasubramanian
(2016) stated that the UAE government always strives to make its citizens satisfied and
happy. The first hurdle in achieving a citizen’s happiness was to improve mobile accessibility
and usability (see Telecommunications Regulatory Authority, Version 1.0 2013). The UAE
government achieved this by improving general mobile accessibility throughout the country
and focusing on things such as the special requirements of people with disabilities. According
to Faisal and Talib (2016), this helped to ensure that people could easily use and access the
mGovernment apps. Today, most services in the UAE are accessible through mobile phones,
through services such as mPayment. The residents of Dubai have an app that integrates
information which provides access to 2,000 services provided by 19 government
departments, which was launched by the UAE government (Gulf News, 2016a).
2.8.1 Smart system initiatives in the UAE
The UAE government seeks to use modern technology efficiently in order to realize its full
potential. These various efforts have given the country its high ranking in many global
indices of performance and progress (Al-Awadhi, 2013). Furthermore,the UAE government
has implemented the following projects under the smart system initiative.
According to His Highness Sheikh Mohammed bin Rashid Al Maktoum, Vice President and
Prime Minster of the UAE and Ruler of Dubai, the main aim of his administration’s smart
system initiative is to make the country the world’s leading center for technological
innovation, development and design. In supporting this objective, His Highness Sheikh
Ahmed bin Saeed Al Maktoum, Chairman and CEO of Emirates, pointed out that the Airline
and Dubai Aviation City Corporation will play an essential role of boosting the country’s
economy. The corporation will also provide a platform for UAE nationals to learn about new
opportunities and how to be innovative (Scott, 2015). The Smart Dubai initiative and the
Dubai Silicon Oasis Authority (DSOA) 2021 Strategy aims to make people happy through
innovation and to fulfill the vision of the founding members of the Dubai Silicon Oasis
(DSO). Another project of the DSOA is Dubai Smart City, where the main aim is to establish
a society through innovation with the help of a smart community known as Silicon Park
(DSOA, 2014). In accomplishing this goal, the DSOA, in collaboration with the Dubai
51
Electricity and Water Authority (DEWA), installed the first charging station for electric
vehicles at the beginning of 2015 (Khaleej Times, 2015a). With plans to install 100 such
charging stations by the end of 2016, it is hoped this will cut fuel usage, help the
environment, and promote healthy and smart living.
Khaleej Times (2015a) reported that DSOA has also signed an agreement with Intel to
establish a lab in the smart city, which will be the only one of its kind. The main aim of the
lab, located in the Dubai Technology Entrepreneur Center (DTEC), is to make things that are
innovative and overcome the differences between the real and the virtual world. The DSOA
(2016) reports that it signed an agreement with traffic police in 2015, under which the police
department and the authority will exchange all the necessary information and data regarding
infrastructure management of traffic congestion, the highway bus network, a blueprint for
intelligent transport systems, electronic toll systems and other related issues. The latest
technology will enable the development of smart traffic systems, automated security controls
and security systems, as well as spread awareness of traffic safety.
A DSO smart waste management system is another initiative of smart living. In this system,
sensors are installed in bins, which will send a signal when they need to be emptied and
cleaned. This system will help to reduce carbon dioxide emissions and save time and fuel
costs (Smart Dubai, 2016). Furthermore, as part of the Smart Dubai initiative, the Roads and
Transport Authority (RTA) has installed nearly 618 information screens which display the
bus schedules of 461 stops, including the details of bus arrival times (Abbas, 2014). There are
94 screens at 37 locations in the Dubai Metro, 83 screens in 14 places at bus stops, 399
screens in all air conditioned buses in the Emirates, and 42 screens in 11 places in shopping
malls (Dubai Silicon Oasis Authority, 2016).
As part of the Smart Dubai initiative, the Dubai municipality has signed a contract with a
Swiss company to ensure the safety of drinking water. Research has proven that there is a
limit to the number of times a five-gallon water bottle can be safely reused, so the company
will install a sensor and tracking number through which users can ensure that the
municipality authority does not cross the safety limit. This system will be based on a mobile
application (Gulf News, 2016b).

52
The Nol Card is another initiative of Dubai RTA’s smart system for better public
transportation. This online card was introduced in 2009 (Arabian Business, 2016) and allows
users to pre-pay for public transport. The authority has issued different types of cards,
depending on user need. The system was awarded the Best Prepaid Card at the Smart Card
Awards Middle East 2013. In another initiative, on 4 May 2015 His Highness Sheikh
Hamdan Bin Mohammed Al Maktoum, Crown Prince of Dubai, launched an app named
Makani. This app is connected to a satellite and sends the user real-time data that enables
them to pinpoint their location or destination, and to estimate the time required to make a
journey to a nominated destination. It also tells users about nearby buildings, along with their
entry and exit points – around 10 for a single building.
Du, a UAE mobile company, in collaboration with Dubai Film launched an app called
Dubai360 during GITEX Technology Week 2015. It is a free virtual reality app available for
Apple and Android systems (UAEinteract, 2015). It helps users to make 360-degree high-
definition time-lapse videos and take panoramic images. Also, with the help of a high-
definition multimedia interface (HDMI) cable, multiple users can be connected so that they
have real-life experiences. The app has many other features. Other apps for Apple and
Android systems on smart phones and other devices have been made available by the Dubai
Rental Dispute Settlement Center, the Dubai Land Department, Registration Trustees (RT),
partners of the Dubai real estate market and Dubai brokers, some of which are Ejari,
mTrakheesi, Smart Investment Map and Mashrooi (Land Department, 2016). These apps
provide information for users on rent and tenancy issues, land disputes, investment options
and availability of land. The apps can also be tailored to users depending on their role as
owner, broker, tenant or investor.
In August 2015, the Abu Dhabi government introduced a smart system to rescue the victims
of traffic accidents. The crash recovery system (CRS) is a device-based program that ensures
immediate assistance after an accident by sending a signal to the emergency and rescue
agencies. This enables rescue teams to plan which tools or gadgets they will require at the
accident site (Khaleej Times, 2015b).
In addition, in 2015 the Dubai government launched the Mohammed bin Rashid Smart
Council. The initiative behind the app, MBR Majlis, was to blend traditional ways of ruling

53
with modern technology. It works in three stages. Firstly, the user is registered and given new
ideas related to technology and innovation, which are discussed in groups called majlis.
Secondly, the audience is asked to give their opinions on the innovation (UAEinteract, 2016).
Thirdly, decision-makers discuss the idea.
In May 2016, the government announced a smart beaches project, as wifi stations are already
available at these locations. The first smart beach will be on Umm Suqeim 2, and its
attractions will include a smart wind pool, smart changing rooms, and lockers with key codes,
to contribute to an eco-friendly environment. Once this project is completed, other smart
beaches will be created.
Previously, in May 2010, 24x7 Dubai Civil Defence (DCD) announced the success of its
smart system, which electronically protects buildings. The system provides network and
security help with the use of sensors, and has resulted in fewer fire incidents and victims
(Hosn, 2010).
2.8.2 Future initiatives in the UAE
The UAE government is planning to create Smart Water Networks to reduce residents’ water
usage, since the region has limited water resources (EcoMENA, 2015). The Smart Water
Networks will not only help the population be more efficient in its water use but also help to
identify leaks in pipelines which would otherwise go unnoticed. In another environment-
related project, the government launched the largest concentrated solar power project, and is
now planning to make a battery with limitless capacity. This project is making the UAE a
regional leader in clean and renewable energy. Similarly, the demand for the latest smart grid
systems in the country requires proper strategies for their implementation, including the
investigation of life cycle costs or benefits (Taqqali & Abdulaziz, 2010). An effective road
map, activity plan, and suggestions will be required for the smart grid to meet is objectives.
The UAE’s date industry faces great challenges in adopting and aligning its business strategy
with the use of information systems and information technology (IS/IT) to optimize supply
chain management business practices (Al-Awadhi, 2013). The transformation of
organizations’ manual operations to achieve strategic effectiveness and efficiency is a lengthy
process. However, adopting supply chain principles and implementing a strategy to align both
54
business practices and use of IS/IT will help the UAE’s date industry become one of the
world’s great industries (Jaffar, ElKhatib, Hesson, & Radaideh, 2007). According to Al-
Awadhi (2013) and Du (2016), the Smart Dubai Platform will be the focal operating system
for the city, giving access to city services and information for all people, regardless of
whether they work in the private or public sector.
Furthermore, according to the report by Du (2016), by centralizing information and sharing
tools, the Smart Dubai Platform will develop synergies between government and the private
sector, optimizing costs and delivering efficiencies to both sectors and clients alike. The
Smart Dubai Platform will fundamentally improve real-time and information-driven
decision-making abilities for the city’s government, empowering its leaders to participate in
community-wide exchanges and analyze city data on a variety of issues. The platform will
also empower existing smart initiatives and services through information-driven
investigations and development (Al-Awadhi, 2013).
2.9 Theoretical Framework
The theories used for this research include the following:
theory of reasoned action (TRA) by Ajzen and Fishbein (1980),
technology acceptance model (TAM) by Davis (1989),
unified theory of acceptance and use of technology (UTAUT) by Venkatesh, Morris,
Davis and Davis (2003),
theory of planned behavior (TPB) by Ajzen (1991),
diffusion of innovations (DOI) by Rogers (1995),
technology–organization–environment (TOE) framework by Tornatzky and Fleischer
(1990),
social construction of technology (SCT) by Pinch and Bijker (1987), and
information systems success model (IS success model) by DeLone and McLean
(1992).
55
The model developed as part of this study will incorporate the features of the models listed
above, but it will also contain additions and modifications. These theories are summarized in
more detail below, including explanations of their limitations.
2.9.1 Theory of reasoned action (TRA)
TRA, developed by Fishbien and Ajzen in 1967, postulates that the intention to carry out any
particular behavior is determined by the agent’s attitude towards that behavior and the
relevant subjective norms. TRA is a widely studied model which is concerned with the
determinants of consciously intended behavior. The TRA conceptual framework is based on a
distinction between an individual’s beliefs, attitudes, intentions and behaviors (Al-Gahtani &
King, 1999). TRA focuses on attitude, subjective norm, intention and behavior to elucidate
how individuals integrate technology into their daily lives (Peslak, Ceccucci, & Sendall,
2012). The individual’s perceptions, society’s norms and the willingness to use technology
are core antecedents of technology acceptance.
The theory has received particular attention in the field of consumer behavior because it
provides a simple tool for identifying opportunities to change the behavior of customers when
an innovation is used. The actual use of the innovation is determined by the behavior of the
person intending to use it. The TRA proposes that behavioral intention is affected by attitude
and subjective norms. The attitude towards an act or behavior involves positive or negative
feelings about the person who performs a behavior as determined by an evaluation of beliefs.
Subjective norm is defined as the perception of whether people important to the individual
think the behavior should be performed by an individual (Kautonen, Tornikoski, & Kibler,
2011). Figure 2.1 illustrates the TRA model.
Figure 2.1: Theory of reasoned action (TRA) (Kautonen et al., 2011)

56
However, the TRA has some limitations in explaining all the mechanisms of the actual use of
the innovation and the role of behavioral intention of the individual, which are discussed in
the relevant scientific literature (Rannenberg, Royer, & Deuker, 2009). One limitation is the
potential for confusion between attitudes and norms, and attitudes to be reformulated as rules
and vice versa. Another limitation evident in the case of TRA is the inability to accurately
predict behavioral intention to adopt technology. For instance, the theory does not address the
ability of a person to modify his or her behavior or the degree of control a person has over the
behavior.
In addition, TRA tends to assume that, once an individual has decided to pursue a course of
action (behavioral intention), that course of action remains unchanged. On the contrary, the
intention to act in a particular way is likely to change due to a person’s constant exposure to a
variety of external stimuli and information (Ryan, 2012). The theory fails to address the
external forces that contribute to changes in the behavioral intention. Limitations such as
limited ability, time, environmental and organizational boundaries, and unconscious habits
restrict freedom of action. The availability of resources also matters a great deal. Ryan (2012)
extended the theory to better describe the mechanisms that effectively explain the use of
innovation and the role of different theories on behavioral intentions.
Other important limitations are mentioned by the model’s creators. Ajzen and Fishbein
(1980) state that the TRA model does not include external factors and demographic variables.
They suggested that external factors and demographics can enhance our understanding of a
given behavioral phenomenon. Therefore, this study will use the external variables and
demographic variables in the effort to provide such understanding. This study expands the
TRA model by including external and demographic variables.
2.9.2 Technology acceptance model (TAM)
Based on the TRA, Davis (1989) developed TAM, which is particularly concerned with
predicting the acceptance of an information system. The model provides an explanation of the
determinants of technology acceptance and can explain user behavior across a broad range of
technologies, while at the same time being both parsimonious and theoretically justified
(Davis, Bagozzi, & Warshaw, 1989). TAM suggests that the acceptance of an information
system is determined by two factors: perceived usefulness and perceived ease of use.

57
Perceived usefulness is defined as the extent to which a person believes that using a system
will improve their performance. Perceived ease of use refers to the extent of effort that a
person believes will be required to use the system. Perceived ease of use can improve the
performance of a person in an instrumental way. However, it is interesting to note that Davis
(1989) presented a model showing the link between the intention to use an information
system and perceived usefulness is stronger than perceived ease of use. According to this
model, it can be expected that the factor with the most influence on the majority of users is
the perceived usefulness of a tool. Figure 2.2 depicts TAM.
Figure 2.2: Technology acceptance model (TAM) (Davis, 1989)
Hu, Chau, Liu Sheng and Tam (1999) suggested that TAM is not the best solution for all
technological acceptance problems and is in fact limited. According to Hu et al. (1999), the
TAM model does not take into consideration boundary conditions such as culture, gender and
type of information system. Duffy (2012) stated the limitations of TAM are due to it being
based on a research perspective and not the user’s perspective. Therefore, the main focus of
the model was not to improve the rate of technology acceptance but to search for variables
that can influence technology acceptance. Although the theory recognized perceived ease of
use and perceived usefulness as the key components in developing the intention to adopt
technology, it did not address the impacts of external variables such as government or
political influence. To some extent, political factors determine the availability of technology,
and people can only adopt technology which is available for them to utilize. Government
restrictions can limit the adoption of technology even if behavioral intention exists; TAM has
not incorporated this factor into its framework.
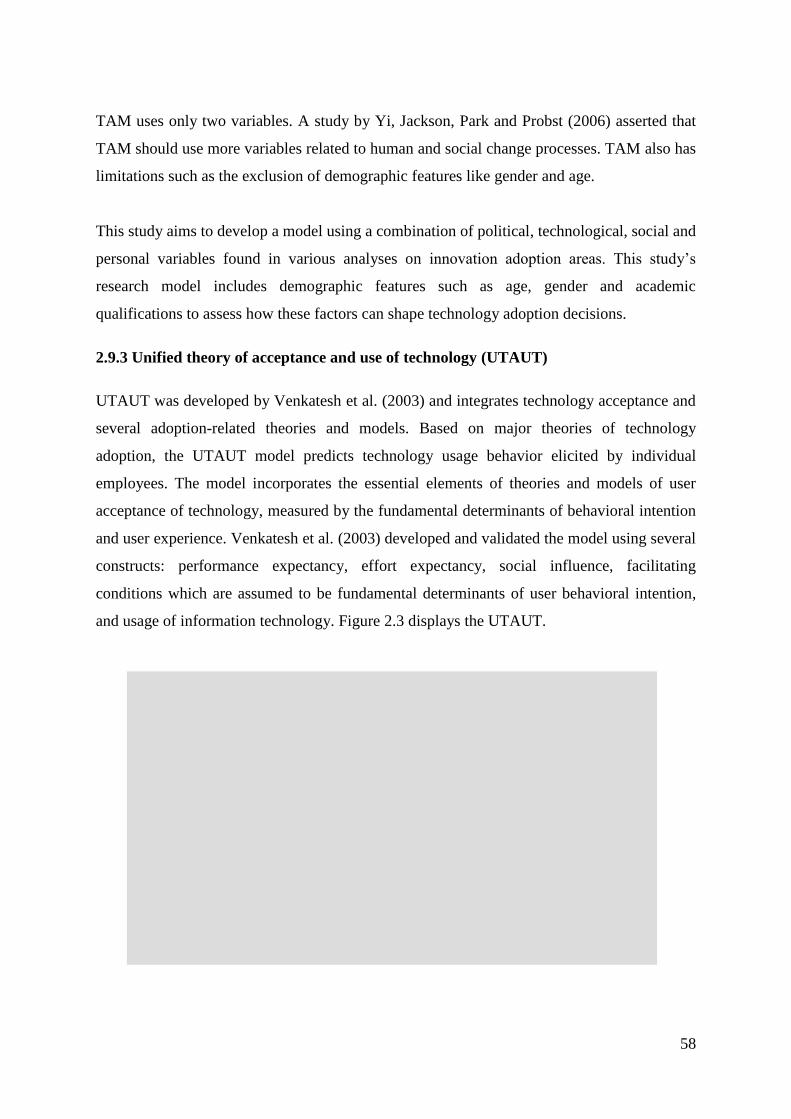
58
TAM uses only two variables. A study by Yi, Jackson, Park and Probst (2006) asserted that
TAM should use more variables related to human and social change processes. TAM also has
limitations such as the exclusion of demographic features like gender and age.
This study aims to develop a model using a combination of political, technological, social and
personal variables found in various analyses on innovation adoption areas. This study’s
research model includes demographic features such as age, gender and academic
qualifications to assess how these factors can shape technology adoption decisions.
2.9.3 Unified theory of acceptance and use of technology (UTAUT)
UTAUT was developed by Venkatesh et al. (2003) and integrates technology acceptance and
several adoption-related theories and models. Based on major theories of technology
adoption, the UTAUT model predicts technology usage behavior elicited by individual
employees. The model incorporates the essential elements of theories and models of user
acceptance of technology, measured by the fundamental determinants of behavioral intention
and user experience. Venkatesh et al. (2003) developed and validated the model using several
constructs: performance expectancy, effort expectancy, social influence, facilitating
conditions which are assumed to be fundamental determinants of user behavioral intention,
and usage of information technology. Figure 2.3 displays the UTAUT.
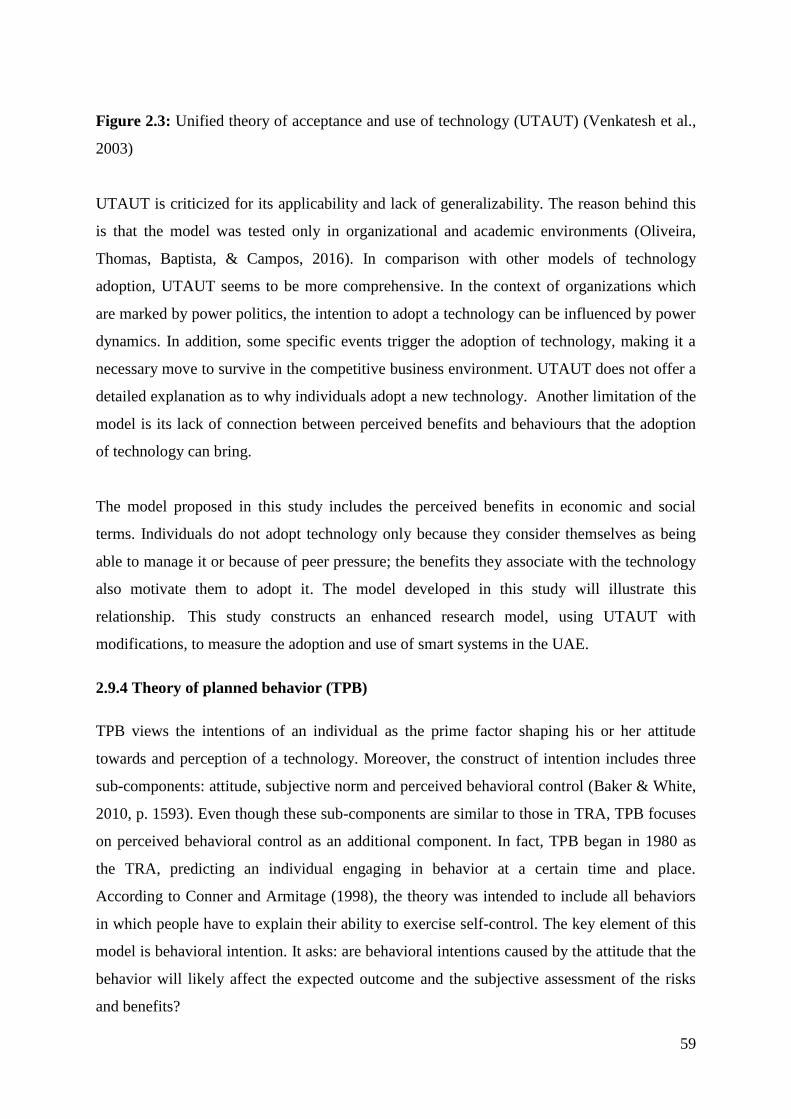
59
Figure 2.3: Unified theory of acceptance and use of technology (UTAUT) (Venkatesh et al.,
2003)
UTAUT is criticized for its applicability and lack of generalizability. The reason behind this
is that the model was tested only in organizational and academic environments (Oliveira,
Thomas, Baptista, & Campos, 2016). In comparison with other models of technology
adoption, UTAUT seems to be more comprehensive. In the context of organizations which
are marked by power politics, the intention to adopt a technology can be influenced by power
dynamics. In addition, some specific events trigger the adoption of technology, making it a
necessary move to survive in the competitive business environment. UTAUT does not offer a
detailed explanation as to why individuals adopt a new technology. Another limitation of the
model is its lack of connection between perceived benefits and behaviours that the adoption
of technology can bring.
The model proposed in this study includes the perceived benefits in economic and social
terms. Individuals do not adopt technology only because they consider themselves as being
able to manage it or because of peer pressure; the benefits they associate with the technology
also motivate them to adopt it. The model developed in this study will illustrate this
relationship. This study constructs an enhanced research model, using UTAUT with
modifications, to measure the adoption and use of smart systems in the UAE.
2.9.4 Theory of planned behavior (TPB)
TPB views the intentions of an individual as the prime factor shaping his or her attitude
towards and perception of a technology. Moreover, the construct of intention includes three
sub-components: attitude, subjective norm and perceived behavioral control (Baker & White,
2010, p. 1593). Even though these sub-components are similar to those in TRA, TPB focuses
on perceived behavioral control as an additional component. In fact, TPB began in 1980 as
the TRA, predicting an individual engaging in behavior at a certain time and place.
According to Conner and Armitage (1998), the theory was intended to include all behaviors
in which people have to explain their ability to exercise self-control. The key element of this
model is behavioral intention. It asks: are behavioral intentions caused by the attitude that the
behavior will likely affect the expected outcome and the subjective assessment of the risks
and benefits?
60
The TPB has been successfully used to explain and predict a wide range of attitudes and
intentions such as smoking, alcohol consumption, use of health services, breastfeeding and
drug use. The theory asserts that the realization of the behavior depends on both the
motivation (intention) and ability (behavioral control). There are three types of beliefs:
behavioral, normative and control. Figure 2.4 shows the TPB model.
Figure 2.4: Theory of planned behavior (TPB) (Ajzen, 2011)
There are several limitations of the TPB, as outlined here. Under the TPB model, it is
assumed that the person in question acquired opportunities and resources in order to
successfully perform the desired behavior, independently of the intention. The theory does
not consider other variables that play a role in behavioral intention and motivation, such as
fear, threat, mood or past experiences. The emotional state of an individual determines the
likelihood of favorable decisions towards technology adoption. In the case where an
individual fears to adopt new technology, the chances of developing a strong intention which
is later translated into actual behavior will be negative.
Normative influences do not take into account environmental and economic factors that can
affect a person’s intention to behave. It is assumed that the behavior is the result of a process
of decision-making and does not change over time (Edberg, 2013). While the construction of
perceived behavioral control was an important addition to the theory, it says nothing about
actual control over the behavior. The time between intent and behavior action is not
addressed by the theory. The TPB is more relevant to healthcare matters and related beliefs

61
(Tucker & Grimley, 2011), but it is limited in its ability to take into account ecological and
economic influences. In recent years, researchers have used the TPB construct and added
other elements of behavioral theory to create an integrated model.
The model adopted in this study addresses the emotional component that is involved in the
decision to accept technology. The variable of enjoyment of innovation represents a positive
emotion, whereby an individual adopts technology and this in turn shapes the attitude to
technology.
2.9.5 Diffusion of innovations (DOI)
DOI theory, developed by EM Rogers in 1962, is one of the oldest social science theories. It
seeks to explain how, over time, an idea or product gains momentum and spreads throughout
a specific population or social system. The result of this final distribution is that people
within the framework of a social system adopt a new idea or product behavior. Adoption
means that a person does something different from what they had previously done. The key is
that the person must perceive adopting the idea, behavior or innovative product from a
favorable perspective to make diffusion possible (Oliveira et al.,2016; Ozaki, 2011).
The adoption of a new idea, product or behavior (e.g., innovation) does not occur
simultaneously in a social system; it is a process in which some people are more likely than
others to adopt innovation. The researchers found that people who adopt an innovation earlier
have different characteristics from those who do so later. During the promotion of innovation
to a target population, it is important to understand the uniqueness of the target population
and whether this helps or hinders the adoption of innovation. During the promotion of
innovation, different strategies can be used to attract the various categories of adopters
(Zhang & Nuttall, 2011). Categories of adopters include:
innovators: people who want to be the first to try an innovation. Innovators are bold
and like new ideas. They are very willing to undertake risks and are enthusiastic in
developing new ideas. Very little, if anything, needs to be done to attract this
population.
62
early adopters: opinion leaders. Early adopters embrace leadership roles and
opportunities for change. They are already aware of the need to change, so they are
very comfortable with the notion of adopting new ideas. However, they need
information to convince them to change, and they demand to see evidence that
innovation works before they are ready to adopt. Strategies to attract this population
include practical guides and information on the implementation specifications,
success stories and evidence of the effectiveness of innovation (Ozer, 2000).
late majority: unwilling to change and adopt an innovation after it has been in the
hands of most people. Strategies to attract the late majority include information on
how others have tried an innovation and successfully adopted it.
laggards: bound by tradition and very conservative in their thinking. Laggards are
extremely skeptical of change and must be brought on board. Strategies to attract this
population include statistics, appeals to fear, and peer group pressure from those in
other groups of adopters.
Rogers (1983) described the following factors that have been found to influence diffusion:
1. adopter characteristics,
2. the social network to which the adopters belong,
3. innovation attributes,
4. environmental characteristics,
5. the process by which an innovation is communicated, and
6. the characteristics of those who are promoting an innovation.
An outcome of DOI research has been the identification of innovation attributes which
ostensibly influence diffusion at the individual level (e.g., relative advantage, compatibility,
complexity, trialability and observability; see Rogers, 1983, 2003).
More than 4,000 papers have been written on DOI, in many disciplines, with the vast
majority written after Rogers created his systematic theory; a few widely adopted changes

63
have been made to his theory (Cho, Hwang, & Lee, 2012). Although each study applies the
theory in a slightly different way, this lack of cohesion has left the theory stagnant and
difficult to apply to new problems with any consistency. In 1987, Midgely conducted a meta-
analysis of 95 studies that employed DOI theory for predicting the rate of adoption outcome.
Of these, 43 studied relative advantage, 27 studied compatibility, 16 studied complexity, and
13 studied trialability. Studies found that 67% of the studies found statistically significant
support for both relative advantage and compatibility, while complexity and trialability
received 56% and 67%, respectively. Interestingly, Midgely made no mention of, or
deference to, the observability attribute.
Diffusion is difficult to quantify because humans and human networks are complex. It is
extremely difficult, if not impossible, to measure what exactly causes the adoption of an
innovation (Damanpour, 1996). The conceptual model developed in this study is more
extensive compared to DOI theory, as it incorporates external environment variables and
considers the individual variables that determine the likelihood of technology adoption. Being
an early adopter or a late adopter is just one aspect of technology adoption. There are various
other influences that determine a favorable or unfavorable attitude to a specific technology.
This model breaks down the different components that shape attitudes towards technology
adoption.
2.9.6 Technology–organization–environment (TOE) framework
The TOE framework was developed by Tornatzky and Fleischer (1990), and it specifies three
integral factors that encourage organizations to adopt and implement innovative technology
that can create a competitive edge for the organization – that is, technological aspect,
organizational aspect and environmental aspect. The technological aspect refers to the
significant internal and external needs for the organization. Current practices and equipment
refer to internal resources of an organization (Starbuck, 1976). On the other hand, a set of
available technologies constitutes the external resources of an organization (Wang et al.,
2016; Thompson, 1967; Khandwalla, 1970; Hage, 1980). The organizational aspect is related
to descriptive measures like scope, size and managerial structure. The environmental aspect
refers to the context in which an organization conducts its business, such as industry,
competitors and transactions with the government (Tornatzky & Fleischer, 1990).
64
Acceptance of the TOE framework in the literature on the adoption of information
technology provides an understanding of adoption and integration of different forms of
innovative technologies. The reason for this is that TOE has a compact theoretical
background despite the fact that technological, organizational and environmental aspects vary
across studies with reference to technological innovation. For example, the TOE framework
is highly consistent with the DOI theory presented by Rogers (1995), who indicated that
individual characteristics, along with internal and external factors, are important drivers for
organizational innovativeness. However, the TOE framework takes into consideration
another important component – the environmental aspect – which is critical for technological
innovativeness because it identifies both constraints and opportunities.
TOE helps to explain why organizations adopt technology; however, it does not explain why
an individual adopts technology. Similar to the adoption of technology by a firm, an
individual goes through the process of decision-making, speculating on the usefulness of
technology from a personal perspective. The conceptual model of this study has incorporated
the theme of TOE, making it relevant for individuals and organizations as well. The inclusion
of the benefits of adopting technology further strengthens the link between the decision to use
technology and the role external benefits play in the technology adoption behavior.
2.9.7 Technological determinism (TD)
The TD view relates to the technology-led theory of social change. In the context of social
change, technology is considered a milestone in history. Furthermore, in the context of
economics, it is known as a technology push theory instead of a demand pull theory.
Technology determinists stated that significant changes in society are the consequence of
specific technical developments, communication technologies or media, or technology in
general (Fritsch, 2011). Moreover, technology determinists take technology as being either
general or specific. They infer technology in general and communication technologies in
particular, on the basis of impact on society in the past, present and future. According to
technological determinists, technologies like computers have changed society at every level,
including in institutional, social, international and individual contexts. Furthermore, it is
considered that social and cultural diversities are shaped by technology, whereas human
factors and social arrangements have secondary importance (Spaargaren, 2011).
65
Karl Marx is considered to have been a technological determinist because he wrote on
technology’s long-lasting, immediate and direct impact on society despitevarious apologists
arguing that Marx was not. On the other hand, various non-Marxist theorists like Sigfried
Giedion, Leslie White, Lynn White Jr, Harold Innis and Marshall McLuhan have documented
the importance of TD. Usually, TD is linked to futuristic commentators who refer to it as a
microelectronic revolution. For example, Christopher Evans indicated that the computer
would be a symbol of revolutionary technology that would transform societies throughout the
world at all levels (Evans, 1979; Robins & Webster, 1989).
TD has mainly focused on explaining the impact of technology on society, culture and social
institutions. etc.It does explain the benefits that technology brings for society, but this
emphasis on the social implications of technology and the changes that occur in a society due
to technology and human interaction provides limited understanding of why people adopt a
specific technology. The model adopted for this study integrates the social and economic
benefits that technology can give to an individual or organization. Additionally, the model
illustrates how external variables such as government and social influence shape the decision
to accept technology. The key consideration here is that not only does technology influence
society but society also has an impact on the probability of adoption of technology.
2.9.8 Social construction of technology (SCT)
In order to understand SCT, it is important to evaluate the basic concept of SCT and critiques
of it. Pinch and Bijker (1987) originally presented the work related to SCT, and they
identified four essential components. Interpretive flexibility provides an insight into
technology design as an open process of producing different results on the basis of social
circumstances of development. On the other hand, some sociologists explained that entities of
physics (particles studied in particle physics) are the outcomes of intergroup negotiations
over the observations’ interpretations (Pinch, 1996). However, scholars of SCT use the
interpretive flexibility concept in application to technological artefacts, specifically in terms
of similarities between intergroup negotiations and artefacts. Technological artefacts facilitate
many possible designs arising from this process. The relevant social group is the second
component of the SCT approach, which particular interpretations have used as an example
(Pinch & Bijker, 1987). According to Pinch and Bijker (1987) these interpretations include
66
all members of the specific social group sharing the same set of meanings attached to a
specific artefact.
The third component relating to the SCT framework is closure and stabilization. It refers to a
multi-group design process that can be involved in controversies such as different
interpretations contributing to conflicting images of an artefact. The process of designing
continues until all conflicts are resolved and there is no threat to any relevant social group.
Consequently, multi-group process achieves closure. No further modifications can be made in
the design; the artefacts stabilize in their final form, and ultimately provide the final decision.
Pinch and Bijker (1987) call this process the closure mechanism. According to Pinch and
Bijker (1987), there are two examples of such a mechanism: rhetorical closure and
redefinition closure. In rhetorical closure, a declaration is made that no further issues exist
and there is no need for an additional design. On the other hand, in redefinition closure,
unresolved issues are redefined to avoid the chances of creating problems for social groups.
The fourth component of the SCT framework consists of the sociocultural and political
milieu, in which artefact development takes place. In the work of Pinch and Bijker,
sociocultural and political milieu does not have enough importance. Various factors are not
presented clearly – for instance, background conditions of group interactions, their
relationships to each other, rules and the factors which contribute to power differences.
However, later critiques focused on these factors, which are presented in more detail below.
2.9.9 The DeLone and McLean information systems success model (IS success model)
DeLone and McLean developed the IS success model as a framework for measuring the
compound dependent variables in information systems research. The first attempts to define
the success of an information system were unclear because of the complexity,
interdependence and multidimensional nature of success. To resolve this problem, DeLone
and McLean (1992) reviewed studies published between 1981 and 1987 and created their
own taxonomy of success, involving system quality, information quality, individual impact
and organizational impact. However, these variables are not independent measures of success
but interdependent variables.

67
Shortly after the launch of this model, researchers began to suggest changes. Seddon and
Kiew (1996) examined some aspects of the IS success model and changed its construction
and operation because of the experiences of researchers who had used the model. Seddon and
Kiew’s concept of utility is equivalent to the perceived notion of TAM as devised by Davis
(1989). They argued that their voluntary schemes are appropriate measures; however, if using
the system is required, then utility is a better measure of success. DeLone and McLean (2003)
reported that the mandatory system can still be maintained.
Seddon (1997) proposed changes to the DeLone and McLean model, stating that in its
original form it was confusing because the process models and variance were combined in the
same framework. In addition to the changes proposed by Seddon, there were more calls to
revise or expand the model. Some researchers evaluated the success of specific applications
such as knowledge management (Jennex & Olfman, 2002; Kulkarni, Ravindran, & Freeze,
2006; Wu & Wang, 2006) and electronic commerce (Molla & Licker, 2001; DeLone &
McLean, 2004; Zhu & Kraemer, 2005). Other researchers have made recommendations on
the more general model (Ballantine, Bonner, Jevy, Martin, & Powell, 1996). The DeLone and
McLean model has been significantly redesigned. The authors (DeLone & McLean, 2003)
explained the construction of the model by indicating the importance of user satisfaction not
only in a process sense but also in the context of optimism with usage. The DeLone and
McLean model is illustrated in Figure 2.5.
Figure 2.5: The DeLone and McLean model (DeLone & McLean, 1992)
68
The DeLone and McLean model explains the factors responsible for an organization’s
success in adopting technology. However, the factors that can restrict the level of success
have not been explained in detail. Another limitation of the model is that it has treated
technology use and technology impact as two separate categories but failed to note that they
are interconnected. The model entails a great deal of subjectivity, as the success of
technology adoption is measured using subjective criteria. This problem with the
measurement of success dimensions poses a key issue when employing the DeLone and
McLean model.
The conceptual model constructed in this study does not focus on the success of adoption of
technology; rather, it emphasizes how the various components from the internal and external
environments work together to shape attitudes to technology and its subsequent adoption.
This behavior is further linked with the benefits of such adoption.
2.10 Conclusion
This chapter presented the theoretical underpinning of technology adoption to understand
how the model developed in this study used existing models and theories, mindful of their
limitations and contributions. Firstly, the chapter elaborated on the dynamics of the concept
of smart systems, their features and functions. Smart systems typically respond to a stimulus
in a pre-programmed way, which creates the interaction between humans and smart
technology. The chapter further elaborated various functions performed by smart systems,
including the construction and healthcare industries, the corporate environment and the
government sector.
The chapter reviewed various technology adoption models, indicating different models that
have made important contributions to understanding how individuals, organizations and
society adopt technology. TRA, TAM and UTAUT served to explain how scholars view the
process of technology adoption. Each theory was examined in terms of its limitations and the
gaps existing in the theoretical framework of technology adoption. The conceptual
framework adopted in this study has been developed to identify how it offers a more
comprehensive view of factors resulting in favorable attitudes to technology and its adoption.
Integrated efforts are required to obtain a better understanding of technology adoption.
Examples of such efforts include TAM and UTAUT.

69
The limitations of various models related to technology adoption reveal that a new and
comprehensive model of technology acceptance is required. For instance, one of the
limitations of the TRA model is that it creates confusion between attitudes and norms. It is
furthermore not able to correctly predict individuals’ behavioral intentions to embrace
technology. Other limitations, such as limited ability, time, environmental and organizational
boundaries, and unconscious habits restrict people’s freedom of action. In addition, TAM
does not provide the ultimate solution for issues relating to technology acceptance. It ignores
other factors such as culture, age, gender and types of information systems. Another theory
with significant disadvantages is the UTAUT model, which cannot be generalized because it
has been tested only in educational institutions. Furthermore, TPB does not take into
consideration the factors of fear, threat, mood and past experiences which are important with
respect to behavioral intention and motivation to embrace an advanced information system.
DOI does not measure the causes of adopting innovation in relation to this theory. In the
same way, other models regarding technology acceptance have limitations – this is why a
new comprehensive model is required to fill the existing knowledge gaps and provide a high
level of generalizability. The next chapter explains the research model and hypothesis
development, in order to determine the factors affecting the adoption of smart systems in the
UAE.

70
71
CHAPTER THREE
RESEARCH MODEL AND HYPOTHESIS
DEVELOPMENT
3.1 Introduction
This chapter discusses the research model, beginning with the development of the conceptual
model followed by the hypothesis development. The chapter explains the variables used in
the model. There are eight categories encompassing a total of 20 variables. The categories
are: political drivers, social influence, technological orientation, personal factors, attitude,
adoption, outcome variables and demographics. Hypotheses are developed based on the
literature review for each factor.
3.2 Development of the Conceptual Model
The research model developed for this study is based on the theoretical foundations discussed
in Chapter Two. Briefly, the technology acceptance model (TAM), theory of reasoned action
(TRA), theory of planned behavior (TPB), unified theory of acceptance and use of
technology (UTAUT) and other theories on technology acceptance did not include any
outcome variables in their models. This study will incorporate expected outcome variables as
perceived by employees. This study will combine the variables found in various research
studies to investigate the uptake and use of a smart system and its impact on organizational
performance in the United Arab Emirates (UAE). The enhanced model devised in this thesis
has been developed using the theoretical framework, as discussed previously. The model
maintains the basic structure of the TRA and incorporates certain elements of TAM, TRA,
TPB, UTAUT and other relevant models. TAM did not include social influence; this model
extends TAM by including a social norms influence. Ajzen and Fishbein (1980) have
suggested that external variables can enhance our understanding of a given behavioral
phenomenon.
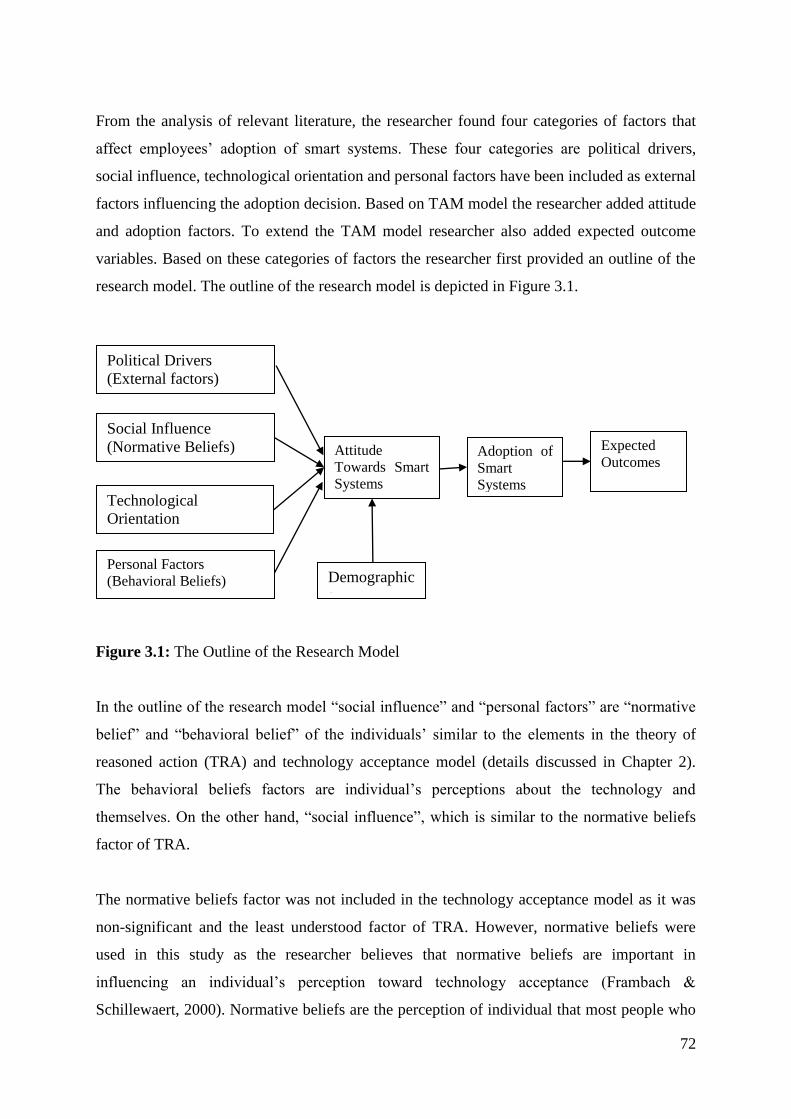
72
From the analysis of relevant literature, the researcher found four categories of factors that
affect employees’ adoption of smart systems. These four categories are political drivers,
social influence, technological orientation and personal factors have been included as external
factors influencing the adoption decision. Based on TAM model the researcher added attitude
and adoption factors. To extend the TAM model researcher also added expected outcome
variables. Based on these categories of factors the researcher first provided an outline of the
research model. The outline of the research model is depicted in Figure 3.1.
Figure 3.1: The Outline of the Research Model
In the outline of the research model “social influence” and “personal factors” are “normative
belief” and “behavioral belief” of the individuals’ similar to the elements in the theory of
reasoned action (TRA) and technology acceptance model (details discussed in Chapter 2).
The behavioral beliefs factors are individual’s perceptions about the technology and
themselves. On the other hand, “social influence”, which is similar to the normative beliefs
factor of TRA.
The normative beliefs factor was not included in the technology acceptance model as it was
non-significant and the least understood factor of TRA. However, normative beliefs were
used in this study as the researcher believes that normative beliefs are important in
influencing an individual’s perception toward technology acceptance (Frambach &
Schillewaert, 2000). Normative beliefs are the perception of individual that most people who
Attitude
Towards Smart
Systems
Expected
Outcomes
Social Influence
(Normative Beliefs)
Technological
Orientation
(External Factors)
Demographic
s
Adoption of
Smart
Systems
Political Drivers
(External factors)
Personal Factors
(Behavioral Beliefs)
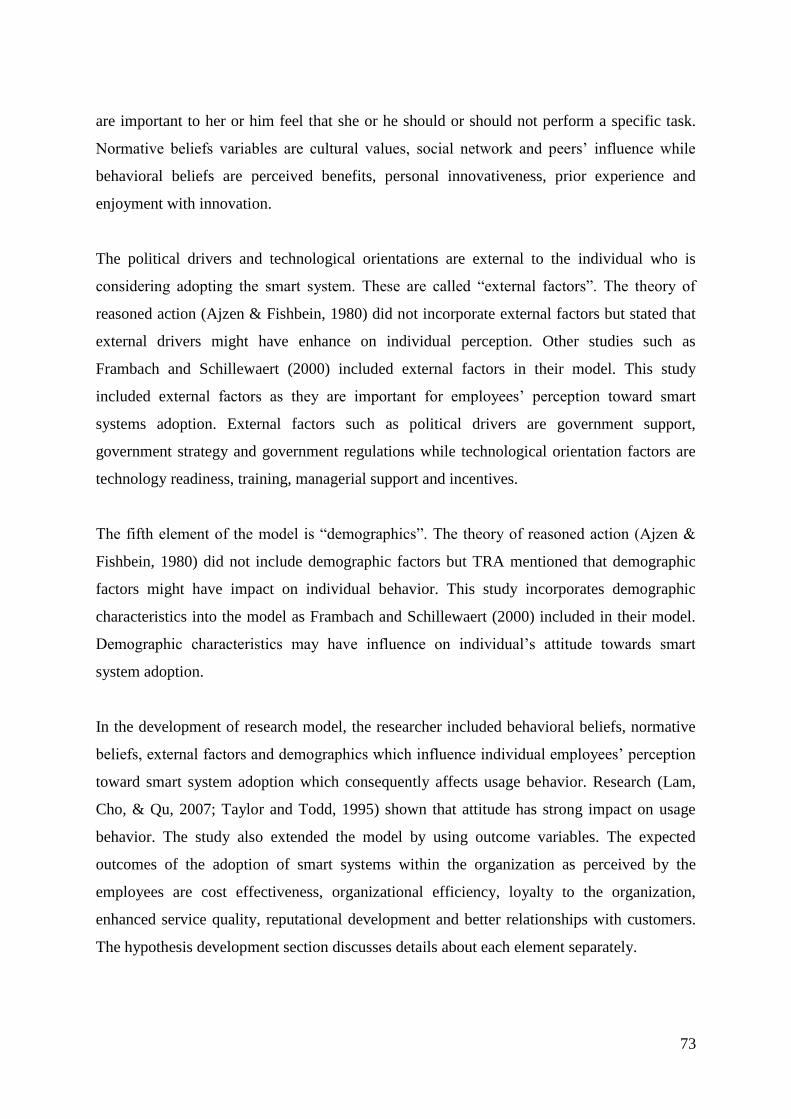
73
are important to her or him feel that she or he should or should not perform a specific task.
Normative beliefs variables are cultural values, social network and peers’ influence while
behavioral beliefs are perceived benefits, personal innovativeness, prior experience and
enjoyment with innovation.
The political drivers and technological orientations are external to the individual who is
considering adopting the smart system. These are called “external factors”. The theory of
reasoned action (Ajzen & Fishbein, 1980) did not incorporate external factors but stated that
external drivers might have enhance on individual perception. Other studies such as
Frambach and Schillewaert (2000) included external factors in their model. This study
included external factors as they are important for employees’ perception toward smart
systems adoption. External factors such as political drivers are government support,
government strategy and government regulations while technological orientation factors are
technology readiness, training, managerial support and incentives.
The fifth element of the model is “demographics”. The theory of reasoned action (Ajzen &
Fishbein, 1980) did not include demographic factors but TRA mentioned that demographic
factors might have impact on individual behavior. This study incorporates demographic
characteristics into the model as Frambach and Schillewaert (2000) included in their model.
Demographic characteristics may have influence on individual’s attitude towards smart
system adoption.
In the development of research model, the researcher included behavioral beliefs, normative
beliefs, external factors and demographics which influence individual employees’ perception
toward smart system adoption which consequently affects usage behavior. Research (Lam,
Cho, & Qu, 2007; Taylor and Todd, 1995) shown that attitude has strong impact on usage
behavior. The study also extended the model by using outcome variables. The expected
outcomes of the adoption of smart systems within the organization as perceived by the
employees are cost effectiveness, organizational efficiency, loyalty to the organization,
enhanced service quality, reputational development and better relationships with customers.
The hypothesis development section discusses details about each element separately.

74
The research model has four fields: drivers of adoption, perception towards innovation,
innovation acceptance behavior and outcome variables. A total of eight categories are
included within these four fields. The four categories contain the determinants of the adoption
as the independent variables. A fifth category is also included; it concerns individuals’
perceptions of a technological innovation as a dependent variable in relation to drivers. At the
same time, this category is also an independent variable to the sixth category, which is
concerned with smart system adoption behavior. The sixth category is a dependent variable in
relation to the fifth category.
The sixth category is an independent variable in relation to category seven, which is
considered to consist of dependent variables. Category eight comprises demographics which
moderate perceptions to technology adoption. Three categories have been developed and
applied to smart system adoption: drivers, adoption and outcomes. A total of eight boxes are
developed to reflect these dimensions. Four boxes are for drivers, two boxes are for adoption
and one box is for outcomes. Drivers are the independent variables in relation to perception
of smart systems as the dependent variable. Again, perception is an independent variable in
relation to adoption of a smart system. Then adoption of a smart system is the independent
variable in relation to expected outcome variables. The proposed relationships of all
independent and dependent variables in the theoretical model are shown in Figure 3.2.
75
Figure 3.2: Conceptual Research Framework
3.3 Hypothesis Development
3.3.1 Political drivers
The role of government is an important factor driving the adoption of innovation in public
sector organizations. The government can motivate employees to adopt and implement new
technologies, and national administrations can use their initiative to deal with any resistance
to technology, developing policies which encourage technology adoption (Suri, 2011).
Government regulations and policies regarding incentives and support impact on the
long-term future of any technology. According to Lee, Chang and Berry (2011), the approach
a government takes to embracing technology plays a large role in deciding the manner in
which technology adoption will occur. Countries with a stable political environment, like the
POLITICAL DRIVERS
----------------------------------------------
Government support
Government strategy
Government regulations
ATTITUDES
TOWARDS
SMART
SYSTEMS
SOCIAL INFLUENCE
----------------------------------------------
Cultural values
Social networks
Peers’ influence
TECHNOLOGICAL ORIENTATION
----------------------------------------------
Technology readiness
Training
Managerial support
Incentives
PERSONAL FACTORS -
---------------------------------------------
Perceived benefits
Personal innovativeness
Prior experience
Enjoyment with innovation
ADOPTION
OF SMART
SYSTEMS
Drivers Adoption
Expected Outcomes
DEMOGRAPHICS
-------------------------------
-Gender
-Age
-Academic qualifications
-Position
-Name of the organization
EXPECTED OUTCOMES
WITHIN THE
ORGANIZATION AS
PERCEIVED BY THE
EMPLOYEES
----------------------------------------
Cost effectiveness
Organizational efficiency
Loyalty to the organization
Enhanced service quality
Reputational development
Better relationships with
customers
Perception
76
United States (US), usually have a positive attitude and are willing to accept new technology
(Henning, 2016; Verma, Kumari, Arteimi, Deiri, & Kumar, 2012; Eoma et al., 2016).
As outlined in Chapter Two, governments in the Middle East are encouraging their
employees and departments or agencies to adopt technological innovation such as smart
systems. For example, the UAE government has looked to implement technology so that
improvements in governance are created and better services can be provided to its citizens
(Al-Khouri, 2011). Government based on smart technology has looked to develop different e-
government programs to help it deliver superior policies and better service delivery
standards. The government is strongly focused on smart technology adoption in different
sectors such as education, healthcare, transportation, communication and judicial services so
that a better society is created (Henning, 2016; Al-Khouri, 2011).
Government support
Prior research has highlighted that government strongly influences technology adoption in the
workplace (Brown, Cajee, Davies, & Stroebel, 2003; AlAwadhi & Morris, 2008). This has
been supported by Nasri and Charfeddine (2012) and Xiao and Ma (2014), who show that a
positive relationship between technology adoption and government support are evident. It has
been further identified that the value of any government program is in the expected benefits.
This has played an important role in influencing governments to ensure acceptance of new
technology and has impacted on how different government decisions are taken. Brown et al.
(2003) and AlAwadhi and Morris (2008) stressed the role of government support in the
adoption of technology. They state that having a process of on-site and off-site training is the
impetus to accept or reject a technology. On this basis, the following hypothesis is proposed:
H1: Government support has an impact on the attitude towards smart system adoption
in the UAE.
Government strategy
Prior studies found that government strategies accelerate new technology acceptance at the
organizational and individual level (Eoma et al., 2016; Alomari, Woods, & Sandhu, 2012).
The government of Jordan uses strategic information technology capabilities to bring about
change in society through the development of e-government services (Alomari et al., 2012).

77
A similar study carried out by Carter and Belanger (2004) stressed the importance of
government strategies in technology adoption and the development of e-government systems.
Papp (2001) contended that it is imperative that a proper fit is developed between the
organizational goals and government strategies so that technology can help to improve
business and commerce. The support provided by government strategies to accelerate
technology adoption includes developing skilled human resources. Therefore, the following
hypothesis is proposed:
H2: Government strategy has an impact on the attitude towards smart system adoption
in the UAE.
Government regulations
Studies found that there is a positive correlation between technology adoption and
government policies and regulations (Baldwin & Lin, 2002; Kerr & Newell, 2003; Joham,
Talukder, & Aseeri, 2014). These scholars found that government regulations wielded a
positive impact on employees to adopt an innovation. Government regulations work to
enforce the continuous use of a technological innovation. A study by Luken and Van
Rompaey (2008) found that poor government policies and regulations can have a negative
influence on technology adoption because employees may think that the new technology is
not significant in their daily work. Therefore, the following hypothesis is proposed:
H3: Government regulations have an impact on the attitude towards smart system
adoption in the UAE.
3.3.2 Social influence
Adoption of technological innovation is influenced by the social environment. Technology
used by employees is likely to play an important role in adoption of that technology in the
wider society. Social influence is the extent to which members of a social group influence
one another’s behavior in adoption (Konana & Balasubramanian, 2005; Venkatesh & Brown,
2001). Individual employees may accept an innovation not because of its benefits but because
of perceived social influence. Studies found that social factors are important in driving the
adoption of innovation by individuals in the workplace (Oliveira et al., 2016; Peansupap &
Walker, 2005; Westphal, Gulati, & Shortell, 1997).

78
Researchers have considered social factors in the context of accepting new technology. Udo
and Guimarases (1994) identified three factors: (a) social desire to change; (b) adopting
social resources and innovation for new developments; and (c) sympathetic social ethos – that
is, an environment which looks at the development of new ideas and the adoption of new
methods. If any of the above factors are missing, adoption of technology will not occur.
Cultural values
Cultural values have long been recognized as important in anthropology and are now very
much part of organizational studies. Culture is imparted through the family, language and
communication, religion, and other activities so that truth, beliefs, values, logic, rules and
actions are articulated. Several studies have reported the impact of cultural values on
technology adoption (Cho, 2011; Ooi, Sim, Yew, & Lin, 2011; Yousafzai, Foxall, & Pallister,
2010). Cultural values such as beliefs have influenced the perceived behavior of using 3G
mobile services in Singapore and Malaysia (Cho, 2012; Ooi et al., 2011). Taherdoost et al.
(2012) and Yi et al. (2006) have also investigated the impact of cultural values on technology
adoption. Therefore, the following hypothesis is suggested:
H4: Cultural values have an impact on the attitude towards smart system adoption in
the UAE.
Social networks
‘Social network’ refers to the extent to which employees are influenced by members of other
organizations (Lewis, Agarwal, & Sambamurthy, 2003). Social networks can enhance the
speed of innovation adoption. Members in informal networks facilitate the spread of
information about an innovation, which consequently positively influences the probability of
adoption. The greater the level of informal information sharing, the more likely that
organizational members will be exposed to new ideas and objects (Frambach & Schillewaert,
2002; Rogers, 1995). Employees of an organization may adopt a new technology based on
the information that other employees in the linked organizations in their market environment
have developed or received (Brown & Venkatesh, 2005). Studies have indicated that social
networks support education and knowledge-sharing (Bandiera & Rasul, 2006; Ajjan &
Hartshorne, 2008). In the same way, Chatti, Jarke and Frosch-Wilke (2007) state that social

79
networks in different fields help individuals to adopt technology. If an individual in a social
network uses a specific technology, the other members in their network are likely to do so as
well. The following hypothesis is proposed:
H5: Social networks have an impact on the attitude towards smart system adoption in
the UAE.
Peers’ influence
Several analyses have reported that peers can significantly influence the adoption of
technological innovation (Venkatesh, Sykes, & Zhang, 2011; Zhou, Lu, & Wang, 2010; Yu,
2012). Zorn, Flanagin and Shoham (2011) considered imitation as a form of peer influence.
Direct influence occurs when peers recommend that an individual adopts a technology and, as
a result, the individual decides to pursue this course. O’Neill (2014) also states that peers can
influence technology adoption. Lai and Chen (2011) demonstrated that peer influence was
one of the factors that encouraged teachers to embrace the use of blogs to impart knowledge
to students, once other teachers did the same. Cheung and Vogel (2013) indicated that peer
influence shapes the attitude of an individual to a technology, which in turn leads to a
positive intention to use it. The hypothesis is therefore developed as follows:
H6: Peers’ influence has an impact on the attitude towards smart system adoption in
the UAE.
3.3.3 Technological orientation
Studies have concluded that an individual’s adoption of innovation depends not only on
individual attitudes but also on organizational policies, approaches and actions (Wang et al.,
2016; Ritchie & Brindley, 2005). Talukder (2011) showed that organizations need to provide
facilitating conditions, such as the extent and type of support that is provided for employees
that will influence their use of innovation. Facilitating conditions are believed to include the
availability of training and provision of support. Organizational factors include training,
managerial support and incentives. Organizational influences can motivate employees to
adopt a technological innovation.

80
Senior management support is essential for technology implementation because resistance
has to be overcome. According to Ritchie and Brindley (2005), managers’ support and
motivation are the most important determinants of information technology usage behaviors in
their employees. In addition, management’s perceptions and attitudes to technology, support
and commitment, and their experiences and knowledge of information technology, will
influence employees’ receptiveness to innovation and desire to influence technology adoption
in the workplace (Ghobakhloo, Hong, Sabouri, & Zulkifli, 2012). Technological readiness is
another factor that influences the decision to adopt technology. Venkatesh and Bala (2008)
stated that training lowers resistance to technology adoption and encourages individuals to
accept it more easily. Their results identified that employees who were properly trained
showed positive responses to technology acceptance.
Technological readiness
Technological readiness is an important factor that influences individuals’ adoption of
technological innovation (Wang et al., 2016; Lin, Shih, & Sher, 2007; Liljander, Gillberg,
Gummerus, & van Riel, 2006). Lin and Chang (2011) examined the role of technological
readiness and how it influenced a positive attitude and subsequent adoption of a self-serving
technology by employees. Studies found that organizations equipped with modern technology
can influence their employees to use the technology. This will also create a positive attitude,
such as viewing the technology as something that will benefit them. In another study, Lee,
Castellanos and Choi (2012) discussed how technological readiness affected the attitude of
individual employees to adopt a new technology in the airline industry. Technological
readiness develops a positive attitude and signals the importance of adopting such technology
among employees, while a low degree of organizational technological readiness creates in
employees little or no intention to use it. Elliott, Meng and Hall (2012) documented similar
results, where technological readiness was significantly associated with a positive attitude
towards new technology adoption. Therefore, the study proposes:
H7: Technological readiness has an impact on the attitude towards smart system
adoption in the UAE.
81
Training
Prior studies have found that training helps individual employees in organizations to use
technology successfully (Carayon et al., 2010; Ziefle & Wilkowska, 2010; Talukder, Harris,
and Mapunda, 2008). When employees are offered training they become acquainted with the
technology, understand its benefits and usefulness, view it as a component in their allocated
tasks, and consider that it makes their jobs easier. The benefit of user training in facilitating
technology adoption is also evident in a study by Ghobakhloo et al. (2012), who offer
evidence that training fills the gap between the existing and required technology skills of the
end users, ensuring they have the required level of competence to utilize the technology.
Achieving competence increases the self-efficacy of users and encourages them to adopt new
technology readily. When users are trained on how to use a specific technology properly, it
minimizes or solves their anxiety and apprehension of failure. On the other hand, lack of
training results in high resistance because users are unsure about the skills needed, and they
question their own competence (Aldunate & Nussbaum, 2013). Therefore, the study proposes
the following hypothesis:
H8: Training has an impact on the attitude towards smart system adoption in the
UAE.
Managerial support
Management support is essential for the successful implementation of technological
innovation (Wang et al., 2016; Ngai et al., 2012; Wu, Li & Fu, 2011). Managerial support is a
part of the facilitating conditions that enable people to use technology and successfully
implement it in their workplace. Čudanov and Jaško (2012) supported the contention that
management support influences individuals’ adoption of technology. Low, Chen and Wu
(2011) asserted that support from senior management helps overcome the barriers that can
hinder technology adoption. Wu, Li and Fu (2011) corroborated this finding by claiming that
employees’ positive perceptions of management as being supportive of technology adoption
determines the intention and behavioral outcomes. Senior management support helps
personnel to understand that they will learn how to use the technology when needed.
Alshawi, Missi and Irani (2011) suggested that little or no support from management

82
discouraged employees from continuous or long-term use of technology. This in turn limited
their intention to use technology. Therefore, the following hypothesis is put forward:
H9: Managerial support has an impact on the attitude towards smart system adoption
in the UAE.
Incentives
Research (Isik, 2004) has found that there is a significant relationship between incentives and
technology adoption. Incentives encourage individual employees to adopt technology.
Government offering incentives to the users of hybrid cars increased favorable attitudes of
the public towards buying them. A similar case can be developed for other forms of
technology, where the pairing of technology with some appealing incentives can encourage
people to adopt the new technology. Milliou and Petrakis (2011) explored how the
technology adoption process is affected by the introduction of incentives. It has been
concluded that, when a technology is viewed as offering a competitive edge, this perceived
benefit is translated into an incentive. As a result the organization is motivated to adopt
technology. The benefits carried by a technology also work as an incentive. Incentives do not
always have to be in monetary forms or bonuses; they can also be formal or informal, such as
the provision of discretionary time to individuals for working with innovation (Talukder,
2014). The following hypothesis is proposed:
H10: Incentives have an impact on the attitude towards smart system adoption in the
UAE.
3.3.4 Personal factors
Personal factors are one of the most important determinants of adopting technological
innovation (Xu, Frey, Fleisch, & Ilic, 2016; Lewis et al., 2003). Studies reported that personal
factors such as perceived benefits, personal innovativeness, prior experience and enjoyment
with innovation have stronger influence on employees’ technology acceptance and
continuous usage (Davis, 1989; Venkatesh & Davis, 2000; Al-Gahtani & King, 1999; Igbaria,
Parasuraman, & Baroudi, 1996; Lewis et al., 2003; Xu et al., 2016).
83
Perceived benefits
Perceived usefulness of a technology is a factor that increases the likelihood of technology
adoption by an individual (Shen, 2015; Alam, Yunus, & Jani, 2011). People who regard a
technology as carrying a higher degree of usefulness are willing to readily adopt it (Yoon &
Cho, 2016). On the other hand, the perception of a technology as carrying little or no benefit
raises questions about its usefulness to people, who will delay adopting it unless it gives them
a substantial benefit (Wang et al., 2016; Behrend, Wiebe, London, & Johnson, 2011). Zorn et
al. (2011) argued that technology adoption in an organization requires examining the
usefulness of a specific system. The intention to employ a technology is formed only when
the concerned authority and users are convinced it will improve productivity. On a personal
level, research (Hsu & Lin, 2016; Lin, Fofanah, & Liang, 2011) has shown how the perceived
usefulness of a technology such as e-government encourages the public to adopt it in their
interactions with government officials or agencies. Therefore, the study proposes:
H11: Perceived usefulness has an impact on the attitude towards smart system
adoption in the UAE.
Personal innovativeness
Another personal factor that can affect the attitude to a technology is personal innovativeness.
Some individuals are innovative – as a result, they are keen to know about new technologies
and embrace them. Yang, Lu, Gupta, Cao and Zhang (2012) concluded that innovation as a
personal trait affects the technological orientation of a person as well as intention to use a
technology. Lee, Hsieh and Hsu (2011) asserted that favorable or unfavorable beliefs about a
new technology are an outcome of the personal attitude to innovation. People who are
inclined to accept new technology believe that the newer version of a technology, or a novel
one, will help them in some aspects of their lives (Oliveira et al., 2016). Consequently, they
are likely to adopt it earlier than people who are not like-minded. Therefore, the study posits
the following hypothesis:
H12: Personal innovativeness has an impact on the attitude towards smart system
adoption in the UAE.
84
Prior experience
Prior experiences with technology determine people’s current attitudes towards similar new
technology adoption and use (Lee, Kim, & Ahn, 2011). Venkatesh, Thong and Xu (2012)
supported this notion and asserted that prior experience helps employees to successfully
embrace a new technology or system. Bhattacherjee and Barfar (2011) have found an
association between prior experience of technology use, the adoption of new similar types of
technology, and the resultant satisfaction an individual can derive from that experience.
Furthermore, prior experience with technology helps individuals to form expectations of the
new technology, sometimes positive and sometimes negative. Akturan and Tezcan (2012)
have indicated that prior experience with technology provides the foundation for an
individual’s self-efficacy regarding the ability to use a new technology successfully or
otherwise. Based on this assumption, the following hypothesis is proposed:
H13: Prior experience has an impact on the attitude towards smart system adoption in
the UAE.
Enjoyment of innovation
The variable of enjoyment of innovation also determines a person’s use of technology.
Research has found that technology acceptance and adoption depends on users perceiving
technology as a source of enjoyment and fulfillment (Yoon & Cho, 2016; Lai & Chen, 2011).
Pantano and Viassone (2014) linked enjoyment to innovative technology as a key construct
that shapes the process of technology adoption. In other work, Antón, Camarero and
Rodríguez (2013) used the example of e-book readers as a new form of technology that is
now more available than before. Their study has examined the role enjoyment with
innovation played in forming a positive attitude and strong intention to adopt the e-book
reader technology. This is applicable to other forms of technology where the perceived
enjoyment by users encouraged them to adopt it. Escobar-Rodriguez and Monge-Lozano
(2012) supported this idea and stated that perceived enjoyment engenders a positive attitude
to technology and innovation (Xu et al., 2016). Hence, it can be posited that:
H14: Enjoyment of innovation has an impact on the attitude towards smart system
adoption in the UAE.

85
3.4 Attitude to Smart Systems and Their Adoption
Adoption of technological innovations such as smart systems is influenced by the individual’s
attitude towards that technology or system (Hsu & Lin, 2016; Ordanini, 2006). A positive
attitude to information systems, along with a recognition of the strategic role of the
information system, is a relevant symptom of readiness and a specific predictor of willingness
to adopt information technologies. For instance, in small to medium enterprises (SMEs),
which usually lack technical expertise or many resources, a positive attitude to information
systems or a technology is linked to the adoption of such technology. Weihrich and Koontz
(2005) stated that attitude towards a technology is a pre-condition of technology adoption.
Rogers (1995) described in his theory of diffusion of innovations (DOI) that adopters’
attitudes are crucial to the innovation decision process. A number of studies have indicated
that teachers’ attitudes to computers are major factors in relation to initial acceptance of
computer technology and behavior (Koohang, 1989; Selwyn, 1997). Technology users
develop attitudes about a smart system’s ease of use by prolonged usage that encourages
them to accept it (Shen, 2015; Adams, Nelson, & Todd, 1992; Eoma et al., 2016).
H15: Attitude to smart system has an impact on the adoption of smart system in the
UAE.
3.5 Outcome Variables (Economic and Social Benefits)
The use of technology in organizations is increasingly ubiquitous due to the benefits that it
has on operations such as increasing productivity and effectiveness. Kiyohide and Saleem
(2014) argue that smart systems enable organizations to automate most of their processes.
However, the costs involved together with the policies that need to be developed to support
the technology may hinder its use. According to Rania, Meredith and Justin (2013),
technology helps organizations in their processes, including aiding professionals to make
rapid decisions, and enabling quick communication and fast delivery of services.
In the global economy, information and communication technology (ICT) is the main driver
for improvements in quality of life and economic growth. The integration of technology
throughout society creates a digitally-based economy; in fact, technology has positive effects
on productivity, and creates higher employment, more efficient markets, and products and

86
services of better quality (Atkinson & McKay, 2007). Another example of economic benefits
through the application of technology can be seen in telemedicine – for instance, electronic
health records, e-prescribing and biomedical products. These are all instances of the
economic and social benefits that technology can create in the healthcare sector, which also
reduce costs and medical errors (Chan, 2012).
3.5.1 Cost effectiveness
Maxwell (2012) examined the increasing impact of adoption of technologies on the cost
effectiveness of organizations. He identified standard ISO/IEC 24751:2008 as an example of
information technology’s adoption and accessibility in the field of e-learning, and described
that this technology standard reduces costs and improves productivity and service quality.
According to Maxwell (2012), the electronic delivery of services curtails costs and increases
improvements and effectiveness in the way organizations do business. Mitra and Chaya
(1996) stated that higher technology investment is linked to lower than average production
costs and lower average total costs. An organization adopts technologies for reasons of cost
effectiveness. For example, many banks invest more in technology in order to reduce overall
costs, and insurance companies are currently spending money on technology to improve their
cost efficiency. Consequently, the following hypothesis is proposed:
H16: Adoption of smart systems has an impact on cost effectiveness in UAE
organizations.
3.5.2 Organizational efficiency
Ayed Mouelhi (2009) asserts that the use of technology increases the efficiency of
organizations and ultimately their overall productivity. Badri and Alshare (2008) described
that the US initiative known as e-government aims to increase ease of access for citizens,
increase the efficiency and effectiveness of government and make it more responsive to
citizens. It has been pointed out that the benefits of implementing technology not only create
organizational efficiency but also reduce costs for all parties. Furthermore, technology helps
organizations to increase their business and reach (Badri & Alshare, 2008). Al-Khouri (2012)
indicated that, in relation to e-government, a government-owned identity management system
could increase the efficiency of the UAE government by providing secure and tamper-proof
87
digital identities which could help process most services much more quickly and effectively.
Therefore, the study advances the following hypothesis:
H17: Adoption of smart systems has an impact on organizational efficiency.
3.5.3 Loyalty to the organization
Research has identified that technology has a significant impact on loyalty to organizations
Cyr et al.2007) mentioned that smart services increase customer loyalty to the organization.
Smart services contribute to electronic communication, information collection and easy
transaction processing and data interchange between online suppliers and customers across
time and space, ultimately leading to e-loyalty. Elsheikh and Azzeh (2014) stated that there is
a direct relationship between technology adoption and customers’ loyalty when organizations
are able to provide better services to their customers. Therefore, the following hypothesis is
proposed:
H18: Adoption of smart systems has an impact on loyalty to UAE organizations.
3.5.4 Enhanced service quality
Adoption of smart systems enhances the service quality and convenience of an organization’s
services (Arabnia, Chang, & Shon, 2011). In addition, a mobile payment system is an
example of the technology that facilitates ease of use (Oliveira et al., 2016). Mobile payment
combined with features like financial management and even identification to mobile wallets
generates customer satisfaction, due to the fact that an easy and convenient service is well
accepted by customers (Toellner, 2014). In addition, cloud computing by organizations
enables clients to use services conveniently through the pay-per-use model (Ciampa &
Revels, 2012). The following hypothesis is suggested:
H19: Adoption of smart systems has an impact on service quality of UAE
organizations.
88
3.5.5 Reputational development
Technology adoption has an effect on the reputations of organizations. Hackler and Saxton
(2007) conducted a study on small minority-based non-profit organizations in Kenosha,
Wisconsin and discovered that the relevant organizations that did not effectively use
information technology could not achieve funding opportunities. This is because they had
difficulty in meeting expectations regarding the quality of proposals and report-keeping
systems. The following hypothesis is therefore considered:
H20: Adoption of smart systems has an impact on the reputation of UAE
organizations.
3.5.6 Better relationships with customers
Adoption of smart systems helps to build better relationships between organizations and their
customers (Kumar, Mukerji, Butt, & Persaud, 2007). For example, e-government services
improve the performance of government institutions and the quality of life of citizens, and
redefine the relationship between citizens and government. Moreover, in the business world
the internet has helped marketers to foster and build better relationships between businesses
and customers. Chan (2012) noted that smart phone technologies build trust, increase
satisfaction and ultimately contribute to superior customer relationship management. For
instance, mobile phones have enabled hotels to reach their customers and develop and
maintain better relationships. Starwood’s W Hotels’ “W to Go” short messaging service
(SMS) is an example of a technology that facilitates better relationships with customers.
Therefore, the following hypothesis is put forward:
H21: Adoption of smart systems has an impact on better customer relationships for
UAE organizations.
3.6 Demographics
This section discusses the demographic variables in the proposed model. These variables
affect individual beliefs and attitudes about the adoption of smart systems (Oliveira et al.,
2016; Eoma et al., 2016). Demographic variables, such as gender, account for some
differences in innovation research outcomes. There are contrary opinions with regard to

89
whether men use technology more than women. Some studies found that males use
technology more than females (Lerouge, Newton, & Blanton, 2005). In contrast, another
study found that females are greater innovation users than males (Bhatnagar & Ghose, 2004).
A significant age difference was found regarding preferences in using technological
innovations. Older people (aged 50 and above) preferred to use innovations significantly less
than younger people (aged between 20 and 49) (Lerouge et al., 2005). This is because older
people have limited experience using technology compared with their younger counterparts.
New technology may create an anxiety-provoking situation that many older people would
like to avoid (Porter & Donthu, 2006).
Education as a demographic variable is another important factor which may moderate the
adoption decision. Generally, education enables individuals to operate technology
successfully compared with those who are not educated. Individual employees who are early
adopters of innovation tend to have higher educational levels and can better understand the
technology (Rogers, 2003; Porter & Donthu, 2006).
The employment variable has an impact on innovation adoption (Eoma et al., 2016). It is
obvious that more senior employees have many more sophisticated decision-making duties to
undertake compared with lower level employees. The latter will generally have fewer
responsibilities, play a lesser role in decision-making and have other types of tasks to
execute.
3.7 Conclusion
This chapter discussed the research model and hypothesis development. It also indicated how
the model used in this study was constructed based on the limitations of previous theories and
models on technology acceptance. The chapter pointed out that smart systems are an
important tool for improving the productivity and performance of any organization. An
organization is affected by different variables, such as cultural, social, political, individual
and technological factors.
Presented in this study is a conceptual framework that includes variables derived from the
external environment, including political, social and technological factors. These can

90
determine the degree of successful adoption of a technology – in this case, smart systems by
individual employees within organizations. The internal factors comprise components of
perceived usefulness, personal innovativeness, prior experience and enjoyment with
innovation. Each of these components has been analyzed using evidence from the literature,
and hypotheses have been generated using this assessment. The demographic features of age,
gender and academic qualifications have also been included in the framework to illustrate
how the characteristics of potential users can impact on the adoption of smart systems.
The framework depicts the relationship of these factors with attitudes to smart systems and
behavioral actions around their adoption. Another important component highlighted in the
framework concerns the outcome variables – that is, the economic and social benefits offered
by the adoption of smart systems. This framework can be regarded as a guideline where
deploying any technology in the organization also considers the factors that are essential to
the model. The factors which may facilitate the adoption of new technology must be
addressed before implementing a smart system.
Smart systems constitute a breakthrough technology, and their implementation depends on
understanding social, political, personal and technological factors. There is a great need to
properly manage technologies as per the specific need, culture and environment of any
organization or country. If a country or company tries to follow another country’s or
company’s technology adoption model, it is not likely to work very well, as the internal and
external environment dynamics of the two groups will differ. Any particular technology
needs to be implemented according to the specific environment, culture and social conditions
of a firm or country. Although barriers to adoption and diffusion of technology have some
degrees of similarity, the unique contextual factors of a firm or region cannot be overlooked.
The proposed conceptual model can provide an effective mechanism for institutions
undertaking smart system adoption and diffusion strategies. The variables included in the
proposed conceptual model have been tested across different countries and organizations in
various contexts. Thus the model is expected to lead to useful results in terms of
understanding the factors that influence the adoption of smart systems in the UAE.
91
CHAPTER FOUR
RESEARCH METHODOLOGY
4.1 Introduction
This chapter discusses the research methodology of the study, including its qualitative
research design, sample frame, sample size, construct of measurement, data collection
procedures and data analysis techniques.
4.2 Research Design
Research is a collaborative human activity in which social reality is studied objectively with
the aim of gaining a valid understanding of it. The methodological dimension of research in
business-related studies may be regarded as objective, by virtue of it being critical, balanced,
unbiased, systematic and controllable (Della Porta, 2014). According to Marais (1988), from
the methodological perspective, three general approaches are usually distinguished in
business analysis: the quantitative approach, the qualitative approach and the participatory
action approach.
As the proposed conceptual model in Chapter Three demonstrates, using the deductive
approach this research proposes an empirical setting to investigate the theoretical relational
path drawn from the literature and to test the hypotheses. The deductive research approach
allows the researcher to devise a hypothesis, and then accumulate data and information to
confirm or reject the hypothesis (Gill & Johnson, 2010). The deductive research approach
uses various steps such as development of theory, formulation of hypotheses, observation
through data collection, and analysis of data, which results in confirmation. The conceptual
framework attempts to quantify in order to explain the causal relationships between variables
(Hall & Page, 2014). The approach used for this investigation is explanatory in character and
comprises quantitative research tools and techniques. Explanatory research attempts to clarify
why a certain phenomenon occurs and assesses causal relationships between variables. Here
the researcher intends to establish that change in one variable results in certain predictable
change in another variable (Gray, 2013). Given the explanatory and exploratory nature of the
92
research, the study employs a quantitative method design which focuses on the quantitative
aspects.
4.3 Quantitative Research Design
The quantitative approach is associated with the positivist perspective, which considers it
mandatory to maintain the focus of a study on observable facts. Quantitative research is
frequently referred to as hypothesis-testing research. Quantitative research is an inquiry based
on testing a theory composed of variables, measured with numbers, and examined with
statistical procedures, in order to determine whether the predictive generalization of the
theory holds true (Creswell, 1994). Typical of this tradition, this study will follow the
common pattern of research operations in investigating, for example, the effects of political,
social, personal and technological factors of smart system adoption. Characteristically, this
study begins with an investigation of the existing literature and theories, from which research
hypotheses are derived. Then an experimental design is established in which the variables in
question (the dependent variables) will be measured while controlling for the effects of
selected independent variables. The procedures that will be followed in this study are
deductive in nature (Jonker & Pennink, 2010). To test the model, various statistical analyses
were conducted to find the level of significance in each variable in the model.
4.4 Sampling Frame
Since this is one of the few studies on smart system adoption in the Middle Eastern region, it
is imperative to restrict the interacting variables to a consistent environment. Consequently,
the rationale for selecting a single country context rather than a multi-country study was to
eliminate the macro-environmental diversity that would complicate the study. The collection
of data in a fairly homogeneous environment is expected to further facilitate the control of
plausible impacts arising from uncontrollable external variables (Amine & Cavusgil, 1986).
The rationale for selecting the United Arab Emirates (UAE) is that the researcher is a native
of the country and works in the public sector, which has facilitated access to data sources.
Furthermore, the study will provide data from the UAE to enhance generalizability to the
wider region.
93
Sampling is one of the most critical aspects of any survey because it forms the basis for the
key claim of generalizability, which is the main strength of any research. Sampling designs
can be very complicated, depending on the goal of the research. For example, researchers can
stratify the sample to ensure sufficient variation in an independent variable of interest.
Members of specific groups of interest may be oversampled, or sampling may be based on an
outcome of interest. The choice of sampling design often balances research goals and the
costs of conducting the survey (Biemer & Lyberg, 2003). Wetcher-Hendricks (2011)
explained that quantitative data often involves random sampling, so that each individual has
an equal probability of being selected and the sample can be generalized to the larger
population. In qualitative data collection, purposeful sampling is used so that individuals are
selected because they have experienced the phenomenon being investigated. Because this
study focuses on factors of smart system adoption by UAE government employees, it
employs a purposeful or convenience sampling method that adds simplicity and flexibility to
the research.
According to Sanders, Clarke, Stewart and Whiteley (2007), the sampling frame is the
complete list of all the cases of the total population from which the sample is drawn. The
sampling frame is determined on the basis of the total number of people in the selected
population. The total number of the individuals employed in the UAE’s Ministry of Foreign
Affairs and International Cooperation, Ministry of Economy and Ministry of Health provided
the basis of the sampling frame. The total number of employees in these three ministries is
approximately 2,200. Questionnaires were sent to each employee, of which 390 completed
questionnaires were received. The standard and sophisticated statistical analysis including
multivariate regression analysis is employed using a recommended sample size of 200 as fair
and 300 as good (Tabachnick & Fidell, 1996). Hair et al. (1998) recommended a sample size
of at least 200 to test a model because 200 is a “critical sample size” (Hoelter, 1983) that can
be used in any common estimation procedure for valid results. An approach using
comparable and similar extant studies’ sample size, however, is recommended as a guide
(Aaker, Benet-Martinez, & Garolera, 2001) to reach a satisfactory level of reliability.
94
4.5 Sampling Population
A research population refers to a large collection of people or objects that is the main focus of
a scientific research. The research is for the benefit of the wider population, but in the case of
large population sizes researchers are not in a position to test every individual in the
population, due to the sampling techniques they employ (Gravetter & Forzano, 2015). The
main reason for using sampling techniques is that testing each individual in a population is
too expensive and time-consuming. A research population refers to a well-defined collection
of individuals or objects having the same characteristics. All individuals or objects in a
specific research population have the same traits, in most cases. For instance, ‘government
employees’ is a collection of individuals; in this population they constitute government
officials (Gravetter & Forzano, 2011). There are two types of populations in research: the
target population and the accessible population. The target population is related to the
aggregation of cases about which the inquirer would like to generalize (Polit & Beck, 2008).
The accessible or source population is the aggregation of cases that meet the designated
criteria and are accessible as subjects for study. Sometimes it is necessary to make a
distinction between target and accessible populations. For instance, the target population can
consist of all diabetic people in the United States (US), but the accessible population might
consist of all diabetic people who are members of a specific health plan or community (Polit
& Beck, 2008).
This study was conducted in the UAE’s Ministry of Foreign Affairs and International
Cooperation, Ministry of Economy and Ministry of Health, These employ approximately
2,200 people. Questionnaires were sent to individual employees via ministry’s centralized
email system and a Survey Donkey link was in the email to respond to to the survey. An
information sheet including a detailed description and purpose of the research were explained
in the email.
4.6 Sampling Size
The goal of the research study is to analyze the sample and then generalize the results to the
wider population. The accuracy of generalization depends on the representativeness of the
sample. Additionally, the degree of representativeness of a sample is associated with how

95
closely the sample resembles the population. Hence, every researcher faces a problem: how
to obtain the sample and what size can provide a comprehensive representation of the
population. In order to generalize the results of the study to a population, the researchers have
to choose a representative sample (Gravetter & Forzano, 2011). A sample is a subset of a
population that accurately represents the members of a given population. It is argued that, the
bigger the sample, the more accurately it reflects the population. However, despite the
benefits of a larger sample size, there is a limit to the number of individuals or sample size
that can be used. This is why researchers usually compromise between the benefits of large
sample size and the demands related to the recruitment and testing of a large sample size
(Gravetter & Forzano, 2011).
The multiple regressions analysis was the main statistical tool that applied to the data in this
study. According to Hair et al. (1998), for the analysis of variances test a minimum of 20
observations is recommended for each variable, although a larger size may be required for
acceptable and more emphatic statistical power. Furthermore, Hair et al. (1998) suggest that
for each independent variable there should be five observations. They state that the minimum
ratio is 5 to 1, but the desired level is between 15 to 20 observations for each dependent and
independent variable. This will help to generalize the results. Stevens (2001) suggested that
15 subjects are needed for every predictor (independent variable) in the social sciences.
Based on the suggestion for 15 to 20 observations regarding each dependent and independent
variable to determine the sample size, a sample of 330 to 440 respondents would be needed
because this study uses 22 variables.
4.7 Survey Instrument
The study used a survey questionnaire to collect the data. The questionnaire items were based
on relevant studies, and empirically tested and validated in the context of technology
acceptance research. The survey instruments collected responses about various issues
concerning the adoption and use of smart systems. The selection of factors was based on the
research questions and the conceptual model developed in this study. The study will use
seven-point Likert-scale items in the questionnaire. Participants will be requested to rate their
perception on questionnaire items on these Likert scales ranging from 1 (“strongly disagree”)
to 7 (“strongly agree”) for seven construct measures. The instruments were reviewed by
96
information technology experts and professionals to ensure content validity. Furthermore,
statistical analysis will be undertaken to ensure the measures’ convergent and discriminant
validity.
4.7.1 The “Federal Authority for Government Human Resources”
Application (FAHR) System in the UAE
The FAHR (Federal Authority for Government Human Resources) Smart System in the UAE
is a government application covering three ministries, specifically the Ministries of Foreign
Affairs and International Relations, Economy and Health. Within the users are allowed to
access services that include innovative technologies, particularly, smart phones.
Individual members of the public also access general information and services. FAHR smart
applications provide thirteen relevant services related to the core businesses of these
ministries. They include the following: basic self-service items (e.g. View My Dashboard,
Request Leave /Exit Permit, Request Letter, View My Pay slip, Medical Centers); Legal
services, Grievances and Advice, “Maaref” (View paid / free workshops and workshop
details by calendar, Subscribing - Booking a seat for workshop); “Ma Qassart” (Send a
Reward card to employees, Receive Reward card from employees); “Media Center” covering
things as News, Photo and video Galleries. In total, other additional six major services areas
are covered, with over eighteen sub-unit areas. (see Appendix 1) .
4.8 Variables in the Study
The following are the factors identified in the literature as independent variables affecting the
adoption of smart systems. There are 23 variables in this study, including the demographic
variables. As shown in Table 4.1, 14 independent variables are considered to be determinants
of employees’ attitudes towards smart systems, which consequently influences the adoption
of smart systems. The conceptual model also proposes the outcomes emanating from the
adoption of smart systems. There are six outcome variables affected by the adoption of smart
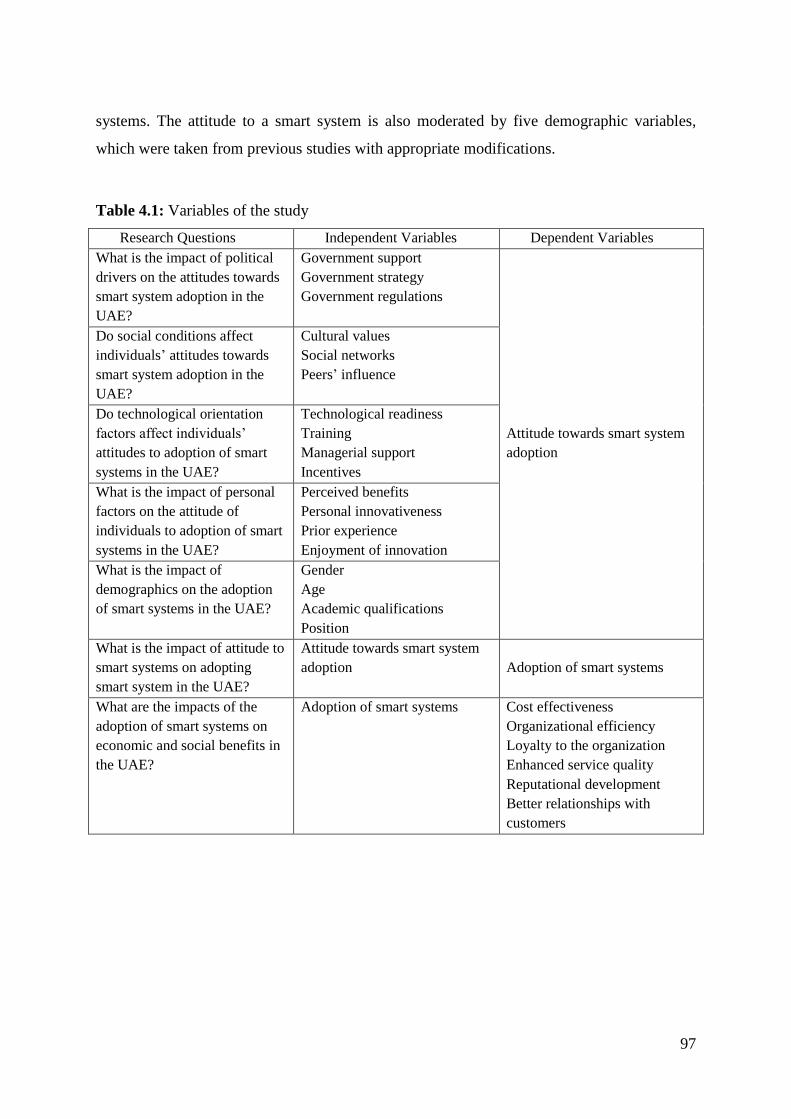
97
systems. The attitude to a smart system is also moderated by five demographic variables,
which were taken from previous studies with appropriate modifications.
Table 4.1: Variables of the study
Research Questions Independent Variables Dependent Variables
What is the impact of political
drivers on the attitudes towards
smart system adoption in the
UAE?
Government support
Government strategy
Government regulations
Attitude towards smart system
adoption
Do social conditions affect
individuals’ attitudes towards
smart system adoption in the
UAE?
Cultural values
Social networks
Peers’ influence
Do technological orientation
factors affect individuals’
attitudes to adoption of smart
systems in the UAE?
Technological readiness
Training
Managerial support
Incentives
What is the impact of personal
factors on the attitude of
individuals to adoption of smart
systems in the UAE?
Perceived benefits
Personal innovativeness
Prior experience
Enjoyment of innovation
What is the impact of
demographics on the adoption
of smart systems in the UAE?
Gender
Age
Academic qualifications
Position
What is the impact of attitude to
smart systems on adopting
smart system in the UAE?
Attitude towards smart system
adoption Adoption of smart systems
What are the impacts of the
adoption of smart systems on
economic and social benefits in
the UAE?
Adoption of smart systems Cost effectiveness
Organizational efficiency
Loyalty to the organization
Enhanced service quality
Reputational development
Better relationships with
customers

98
4.9 Definition of Constructs and Measures of the Variables
The items used to construct the questionnaire were adopted from previously developed and
validated measures relevant to this study. Some items were modified so that they are
applicable to this study. Definitions of each construct in the proposed model are discussed in
more detail below.
4.9.1 Individual adoption of smart systems
System usage is often operationalized using self-reported measures of the system after it is
implemented. System usage was selected as the primary indicator of individual adoption
(Talukder, 2014). Diffusion of innovations (DOI) theory contends that adoption of innovation
by individuals does not occur suddenly, because it is a process by which some people are
more inclined than others to adopt it (Zhang & Nuttall, 2011). Based on analyses such as
those by Talukder (2014), Al-Gahtani and Kind (1999), and Igbaria, Zinatelli, Cragg and
Cavaye (1997), five indicators were used to measure individual adoption. They are as
follows:
1) Actual amount of time spent:
The participants were asked to indicate the amount of time they spent using the smart
systems in their respective departments. They were asked to indicate how many hours per
week they used smart systems, using a seven-point Likert scale ranging from “less than 1
hour” to “more than 7 hours”.
On average, how frequently do you use the smart system for workplace duties?
2) Frequency of use:
The participants will be asked about the frequency of their use of a smart system, using a
seven-point Likert scale ranging from “once a week” to “several times a day”.
On average, how much time do you spend per week using smart systems for job-related
work?

99
3) Usage level:
Usage level of a smart system can provide comprehensive information about the overall
adoption and tasks performed when using it. Participants were asked to identify their level
of usageon a seven-point Likert scale ranging from “not used at all” to “used
extensively”.
Can you please indicate your level of usage of smart systems?
4) Number of features used:
The respondents were asked to identify how many features they used, on a seven-point
Likert scale ranging from “none” to “various features used”.
How many different applications of smart systems do you use?
5) Sophistication level of features used:
Smart systems have many advanced features and sophistication levels. The participants
were asked to indicate how many of the sophisticated features they had utilized, on a
seven-point Likert scale ranging from “not at all” to “using them extensively”.
Do you use the sophisticated features of smart systems?
4.9.2 Attitude towards smart systems
Attitude is an individual’s favor or disfavor, which is a function of behavioral beliefs and
evaluation of outcomes (Talukder, 2014). Attitude refers to a construct that reflects a person’s
degree of like or dislikes relative to an item. The instrument asked participants to rate five
items according to how they feel about using smart systems on a seven-point Likert scale.
The items for this part of the study were adopted from Lam, Cho and Qu (2007), Lin (2011),
Putzer and Park (2010) and Talukder (2014). They are:
1. Using smart systems is important to your job.
2. Using smart systems is relevant to your job.
3. Using smart systems is helpful.
4. Using smart systems is practical.

100
5. I like the idea of using smart systems.
4.9.3 Political factors
Government support
Measuring governmental support includes the assessment of senior management’s
encouragement and allocation of adequate resources to people accessing smart systems. On
the basis of work by Al-Khouri (2012), Khan (2011) and Tan and Teo (2000), the
respondents were asked to provide responses to the following five statements:
1. Government encourages using smart systems.
2. Government facilities are available to use smart systems.
3. Government promotes smart systems usage.
4. Government adopts an assertive policy to use smart systems.
5. Facilitating conditions encourage individuals to use smart systems.
Government strategy
Government strategy refers to the development of various policies and guidelines that assist
individuals to adopt and use smart systems. The following five items were based on studies
by Alghamdi, Goodwin and Rampersad (2011), Papp (2001), and Alomari et al. (2012) with
modifications:
1. Government provides awareness of smart systems.
2. Employment opportunities are better for those who use smart systems.
3. Cooperation with organizations enables adoption of smart systems.
4. Government educational programs lead to greater smart system usage.
5. Government policy helps the adoption of smart systems.
Government regulations
Government regulations refer to legal procedures and systems to facilitate smart systems.
Respondents will be asked how they assess the government rules that assist them. Five items,
based on studies by Al-Khouri (2012) and Luken and Van Rompaey (2008), were employed,
as follows:

101
1. Government establishes regulations in relation to smart systems.
2. Government regulations are important for smart systems adoption.
3. Government policies encourage individuals to use smart systems.
4. Government’s legal system supports adoption of smart system adoption.
5. Government regulations assist individuals to use smart systems.
4.9.4 Social influence
Cultural values
Cultural values were measured by asking questions to respondents about what is good, right,
fair and just regarding smart systems. These items were adopted from Conner and Armitage
(1998) and Spaargaren (2011):
1. I am encouraged by people in the community to use smart systems.
2. Using smart systems is beneficial for the wider society.
3. I think using smart systems is good for people.
4. My religion does not hinder the adoption of smart systems.
5. People’s opinions are positive in regard to using smart systems.
Social networks
Social networks refer to the extent to which employees are influenced by individuals in
similar areas or other organizations (Talukder, 2014). Social networks were measured by a
five-item scale adopted from Talukder (2014) and Lewis et al. (2003):
1. People in my workplace think that smart systems usage is valuable.
2. I use smart systems because my interrelated organizations use smart systems.
3. The opinions of people in my workplace are important to me.
4. I use smart systems because my friends in other divisions use them.
5. I use smart systems because other people use similar systems.
Peers’ influence
The influence of peers was measured using motivation, encouragement and influence given
to an employee by that person’s peers in adopting smart systems. Employees will be asked to
indicate the extent of agreement or disagreement with the five statements concerning peers’

102
influence, motivation and encouragement on a seven-item scale. These items were based on
Lewis et al. (2003) and Talukder (2014):
1. I learned from my friends how to use smart systems successfully.
2. Communicating with your friends helped you to learn smart systems.
3. Performing a task using smart systems increased my intention to adopt it.
4. Opinions of people in informal groups to which I belong are important to me.
5. People in informal groups to which I belong think using smart systems is valuable.
4.9.5 Technological orientation
Technological readiness
This item was used to estimate technology maturity during the technology acquisition process
(Cheung & Vogel, 2013). Based on a fairly recent analysis (Cheung & Vogel, 2013), the
following five statements were put to the participants about their organization’s readiness to
utilize smart systems:
1. My organization is ready to use smart systems.
2. The organization is mature in terms of technology to adopt smart systems.
3. The organization uses updated technology.
4. The organization is technologically sophisticated to use smart systems.
5. The organization is up-to-date regarding modern technology.
Training
Training was assessed by the extent of training provided to employees (Talukder, 2014).
Participants were asked the extent to which training was provided to them and how it
contributed to their knowledge and expertise in using smart systems:
1. Guidance is available for me on how to use smart systems.
2. Specialized instructions concerning smart systems usage are available for me.
3. Internal training courses are available to improve smart systems usage.
4. Training is provided to explain the features of smart systems.
5. A specific person is available for individualized support when I face difficulties.
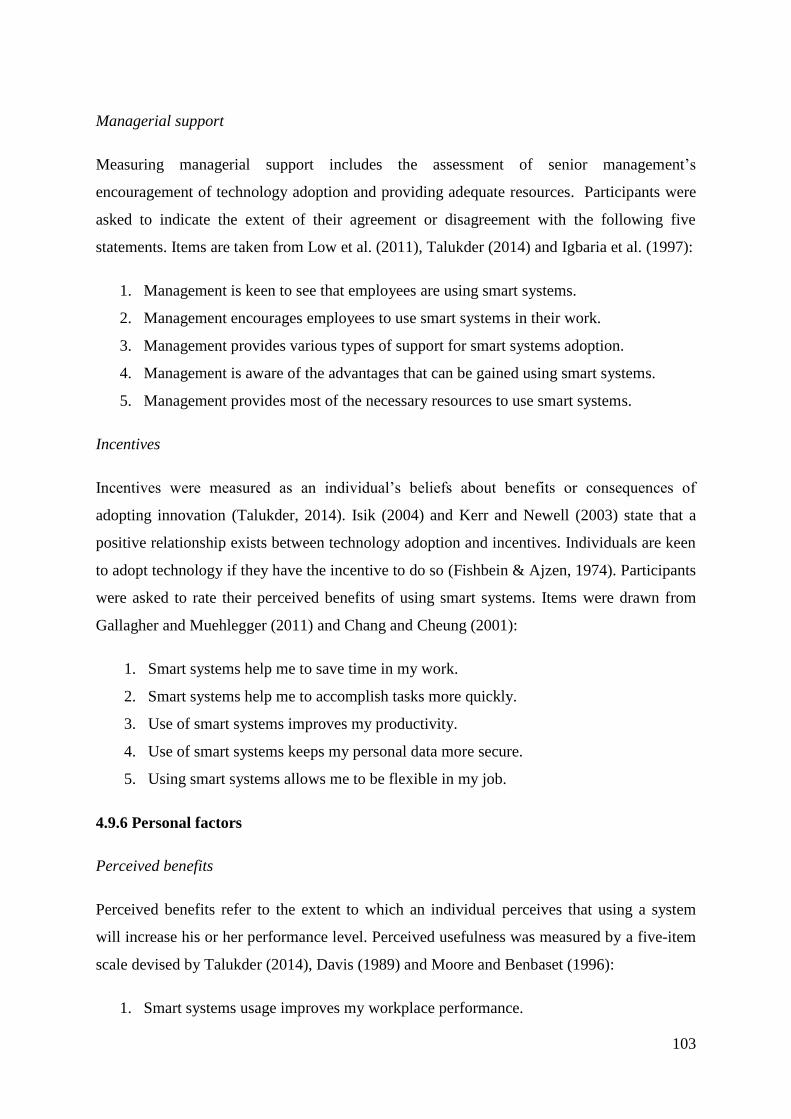
103
Managerial support
Measuring managerial support includes the assessment of senior management’s
encouragement of technology adoption and providing adequate resources. Participants were
asked to indicate the extent of their agreement or disagreement with the following five
statements. Items are taken from Low et al. (2011), Talukder (2014) and Igbaria et al. (1997):
1. Management is keen to see that employees are using smart systems.
2. Management encourages employees to use smart systems in their work.
3. Management provides various types of support for smart systems adoption.
4. Management is aware of the advantages that can be gained using smart systems.
5. Management provides most of the necessary resources to use smart systems.
Incentives
Incentives were measured as an individual’s beliefs about benefits or consequences of
adopting innovation (Talukder, 2014). Isik (2004) and Kerr and Newell (2003) state that a
positive relationship exists between technology adoption and incentives. Individuals are keen
to adopt technology if they have the incentive to do so (Fishbein & Ajzen, 1974). Participants
were asked to rate their perceived benefits of using smart systems. Items were drawn from
Gallagher and Muehlegger (2011) and Chang and Cheung (2001):
1. Smart systems help me to save time in my work.
2. Smart systems help me to accomplish tasks more quickly.
3. Use of smart systems improves my productivity.
4. Use of smart systems keeps my personal data more secure.
5. Using smart systems allows me to be flexible in my job.
4.9.6 Personal factors
Perceived benefits
Perceived benefits refer to the extent to which an individual perceives that using a system
will increase his or her performance level. Perceived usefulness was measured by a five-item
scale devised by Talukder (2014), Davis (1989) and Moore and Benbaset (1996):
1. Smart systems usage improves my workplace performance.
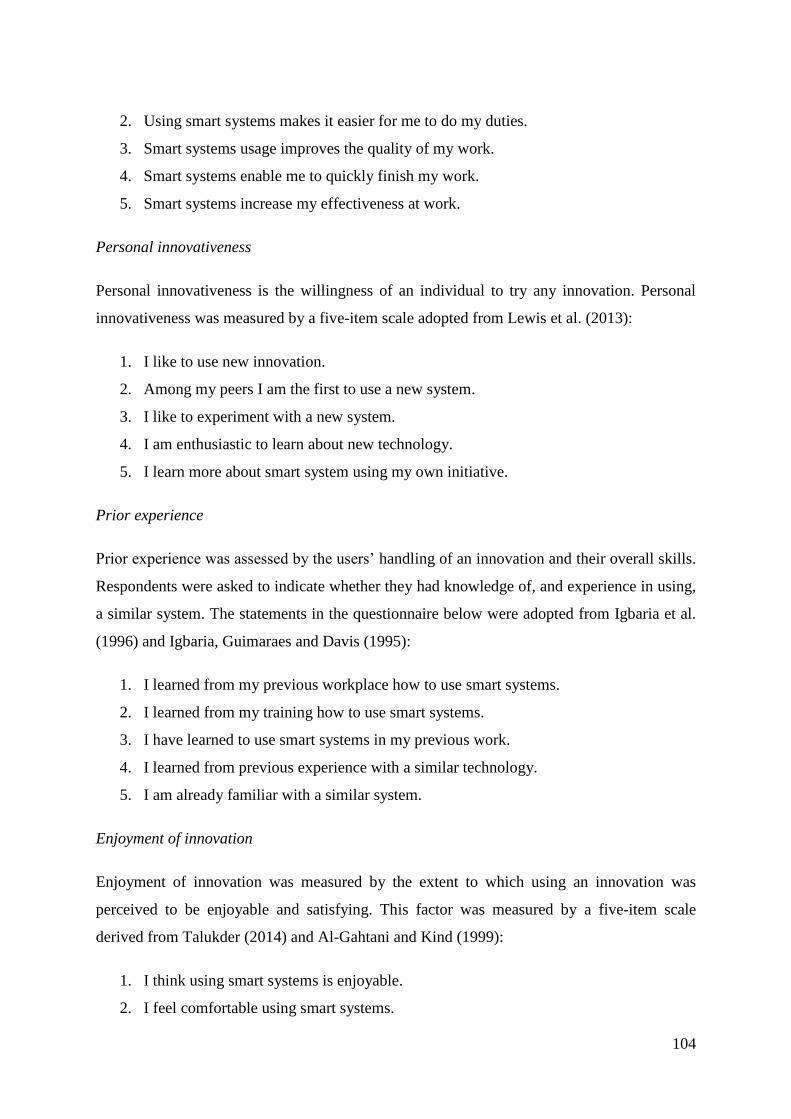
104
2. Using smart systems makes it easier for me to do my duties.
3. Smart systems usage improves the quality of my work.
4. Smart systems enable me to quickly finish my work.
5. Smart systems increase my effectiveness at work.
Personal innovativeness
Personal innovativeness is the willingness of an individual to try any innovation. Personal
innovativeness was measured by a five-item scale adopted from Lewis et al. (2013):
1. I like to use new innovation.
2. Among my peers I am the first to use a new system.
3. I like to experiment with a new system.
4. I am enthusiastic to learn about new technology.
5. I learn more about smart system using my own initiative.
Prior experience
Prior experience was assessed by the users’ handling of an innovation and their overall skills.
Respondents were asked to indicate whether they had knowledge of, and experience in using,
a similar system. The statements in the questionnaire below were adopted from Igbaria et al.
(1996) and Igbaria, Guimaraes and Davis (1995):
1. I learned from my previous workplace how to use smart systems.
2. I learned from my training how to use smart systems.
3. I have learned to use smart systems in my previous work.
4. I learned from previous experience with a similar technology.
5. I am already familiar with a similar system.
Enjoyment of innovation
Enjoyment of innovation was measured by the extent to which using an innovation was
perceived to be enjoyable and satisfying. This factor was measured by a five-item scale
derived from Talukder (2014) and Al-Gahtani and Kind (1999):
1. I think using smart systems is enjoyable.
2. I feel comfortable using smart systems.

105
3. I believe usage of smart systems is interesting.
4. Smart systems usage is pleasant.
5. I believe using smart systems is convenient.
4.9.7 Outcome variables (economic and social benefits)
Cost effectiveness
Cost effectiveness refers to organizations using the innovation efficiently and affordably
according to internal and external pricing mechanisms. Respondents were asked whether the
adoption of smart systems had reduced average production costs and total costs in their
organization. On the basis of studies by Maxwell (2012) and Mitra and Chaya (1996), the
following questions were asked:
1. Smart systems reduce cost of operations in my organization.
2. Smart systems provide cost efficiency to my organization.
3. I believe smart systems help my organization to save money.
4. I think smart systems are beneficial to reducing overall cost.
5. My organization is better now at saving money.
Organizational efficiency
Efficiency was measured by asking questions about whether usage of smart systems
increased organizational efficiency in terms of daily operations. The items are based on Ayed
Mouelhi (2009), Badri and Alshare (2008) and Al-Khouri (2012), and the following questions
were put forward:
1. Does using smart systems improve the efficiency of the organization?
2. Do smart systems usage enable employees to work more efficiently?
3. Do smart systems increase efficiency in collecting information?
4. Do smart systems encourage employees to work with greater efficiency?
5. Do smart systems enable employees to improve efficiency in solving problems?

106
Loyalty to the organization
This variable refers to the process where adoption of smart systems makes employees feel
more satisfied and wanting to remain loyal to their organization. Five items were adopted
from Elsheikh and Azzeh (2014) and Cyr et al. (2007), as follows:
1. Adoption of smart systems helps me to be happy with the organization.
2. Smart systems adoption improves my satisfaction with the organization.
3. Smart systems adoption helps me to remain loyal to the organization.
4. Smart systems make me want to continue working with the organization.
5. I want to stay with this organization due to its use of smart systems.
Enhanced service quality
Enhanced service quality refers to smart systems making it easier and more convenient for
individuals to do things, such as access information and services. The following items were
adopted from Al-Jabri and Sohail (2012) and Ciampa (2013):
1. Smart systems provide convenience in completing tasks.
2. Smart systems enable me to save time and effort.
3. Smart systems help me to access information easily.
4. Smart systems provide me with quick service.
5. Smart systems help me to do the work with less effort.
Reputational development
Reputational development refers to the adoption of smart systems to improve an
organization’s status, profile and image in society. The following items were taken from
Hackler and Saxton (2007):
1. Smart systems adoption increases the organization’s reputation.
2. Using smart systems increases the organization’s image.
3. Using smart systems helps to increase employees’ profiles.
4. People consider this organization to be technologically up-to-date.
5. I believe using smart systems increases the organization’s status.
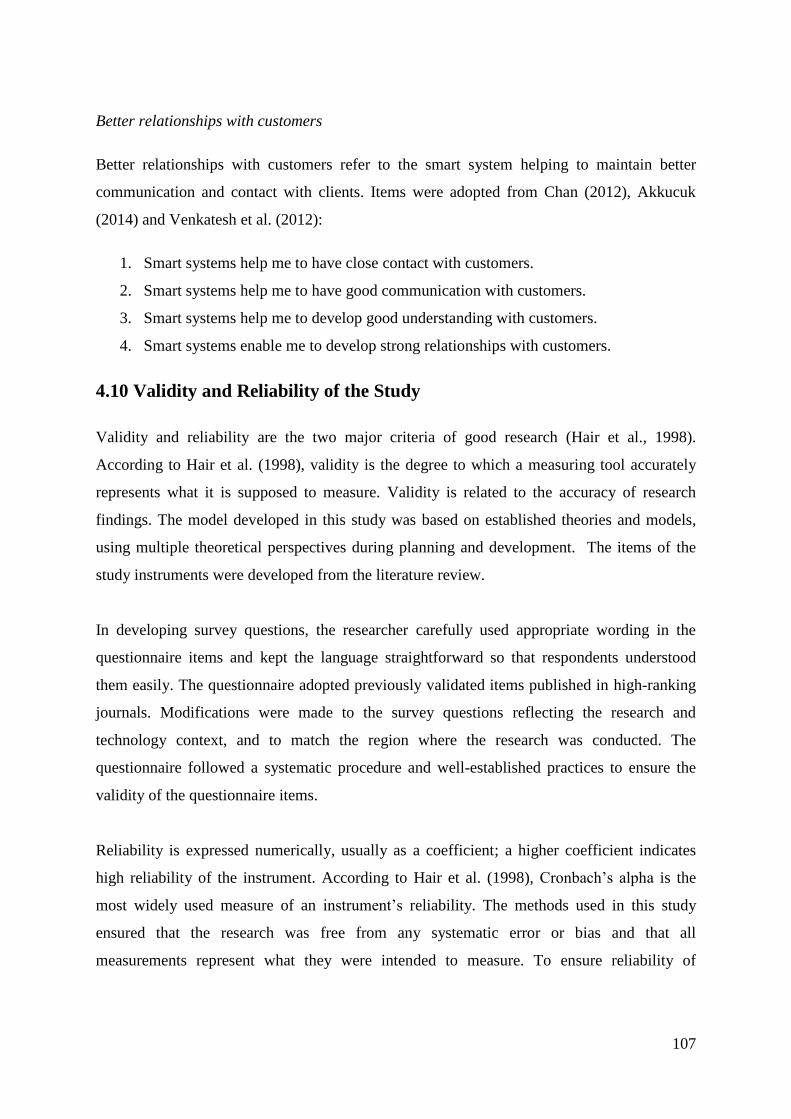
107
Better relationships with customers
Better relationships with customers refer to the smart system helping to maintain better
communication and contact with clients. Items were adopted from Chan (2012), Akkucuk
(2014) and Venkatesh et al. (2012):
1. Smart systems help me to have close contact with customers.
2. Smart systems help me to have good communication with customers.
3. Smart systems help me to develop good understanding with customers.
4. Smart systems enable me to develop strong relationships with customers.
4.10 Validity and Reliability of the Study
Validity and reliability are the two major criteria of good research (Hair et al., 1998).
According to Hair et al. (1998), validity is the degree to which a measuring tool accurately
represents what it is supposed to measure. Validity is related to the accuracy of research
findings. The model developed in this study was based on established theories and models,
using multiple theoretical perspectives during planning and development. The items of the
study instruments were developed from the literature review.
In developing survey questions, the researcher carefully used appropriate wording in the
questionnaire items and kept the language straightforward so that respondents understood
them easily. The questionnaire adopted previously validated items published in high-ranking
journals. Modifications were made to the survey questions reflecting the research and
technology context, and to match the region where the research was conducted. The
questionnaire followed a systematic procedure and well-established practices to ensure the
validity of the questionnaire items.
Reliability is expressed numerically, usually as a coefficient; a higher coefficient indicates
high reliability of the instrument. According to Hair et al. (1998), Cronbach’s alpha is the
most widely used measure of an instrument’s reliability. The methods used in this study
ensured that the research was free from any systematic error or bias and that all
measurements represent what they were intended to measure. To ensure reliability of

108
measurement, this study used expert opinions, data analysis, a pilot study and reporting of the
reliability coefficient.
4.11 Pilot Study
A pilot study was conducted to pretest the research instruments and to identify any problems.
The pilot study was intended to modify the items which respondents tended to misinterpret,
skip over or answer improperly. This also helped to ensure the instrument’s validity and
reliability. Pilot study respondents worked in the Ministry of Foreign Affairs, Ministry of
Economy and Ministry of Health. Pilot survey questionnaires were distributed by email to
respondents, who were asked to complete the questionnaire and return it to the researcher
within a week.. A total of 44 respondents returned the completed questionnaires, which were
then analyzed. The pilot study helped to verify the clarity of the questions and solve
unforeseen problems with wording, directions, phrasing and the sequence of questions. The
researcher engaged in follow-up discussions with respondents in the pilot study to adjust and
clarify those items that were not answered or which received criticism from respondents. This
process helped the researcher to make the questionnaire items consistent and well understood
by the respondents.
4.12 Data Collection Procedures
The data for this study was collected using a survey questionnaire. Items in the questionnaire
were developed, modified and adopted using previously tested items in similar research. The
questionnaire was distributed to respondents by email. Respondents of this research are the
employees of the Ministry of the Foreign Affairs, Ministry of Economy and Ministry of
Health. A reminder was sent two weeks after the survey questionnaire had been distributed.
The questionnaires were sent in November 2015 using each ministry’s email database.
Permission was obtained from each ministryto collect data from their employees. The
purpose of the research was outlined in the introduction to the questionnaire, which urged
employees to complete a 15-minute online questionnaire. Details about the research,
including ethics approval, were provided in another link. The purpose and benefits of the
study, as well as the rights of potential participants, were included in the information sheet.
Once a participant completed the questionnaire and clicked on ‘submit’, it was automatically

109
saved in the Survey Monkey system, which can only be opened and downloaded by the
researcher.
The researcher expected that the response rate would be relatively low, as many people do
not use email regularly. To obtain the required sample size, the researcher sent a reminder
after two weeks to complete the questionnaire. Furthermore, the researcher contacted the
manager of the specific department to send a request to the employees to complete the
survey. This ensured there were adequate numbers of respondents to analyze the data. All
data collection procedures took place from November 2015 to January 2016. There was some
delay because of the public holiday. Questionnaires were sent to 2,200 employees in the three
ministries, and 390 respondents returned the questionnaire. A total of 369 completed
questionnaires were received, of which 357 were deemed usable.
A qualitative research approach was deliberately not adopted for use in the current study.
This is mainly because of the intricacies of using approaches like interviews and subsequent
analysis of what was discussed. Such an approach is not only cumbersome and time-
consuming; it will have the added challenges of translation from Arabic to English, having
appropriate meanings for expressions and will be further complicated by non-verbal gestures
which are a major feature of Arabic culture. Such gestures often do have different meanings
from what is assumed in English-speaking cultures. A simple example is seen in the body
language and gesture of sitting and crossing legs. It is very unacceptable and offensive in
Arabic culture but not so in a Western culture.
4.13 Data Analysis
Statistical Package for Social Sciences (SPSS) served to analyze the data. The researcher
conducted analysis for validity and reliability of the measurement (Cronbach’s alpha).
Multivariate data analysis was employed to conduct the analysis. Correlations, factor analysis
and multiple regression analyses were also undertaken. The study conducted frequency
distribution and employed cumulative percentage as a descriptive tool for the findings. These
descriptive tools outlined the profile of respondents, while the percentage showed the levels
of adoption. Cross-tabulations analysis established, firstly, the relationship between
employees’ acceptance and, secondly, demographic characteristics of the users in terms of
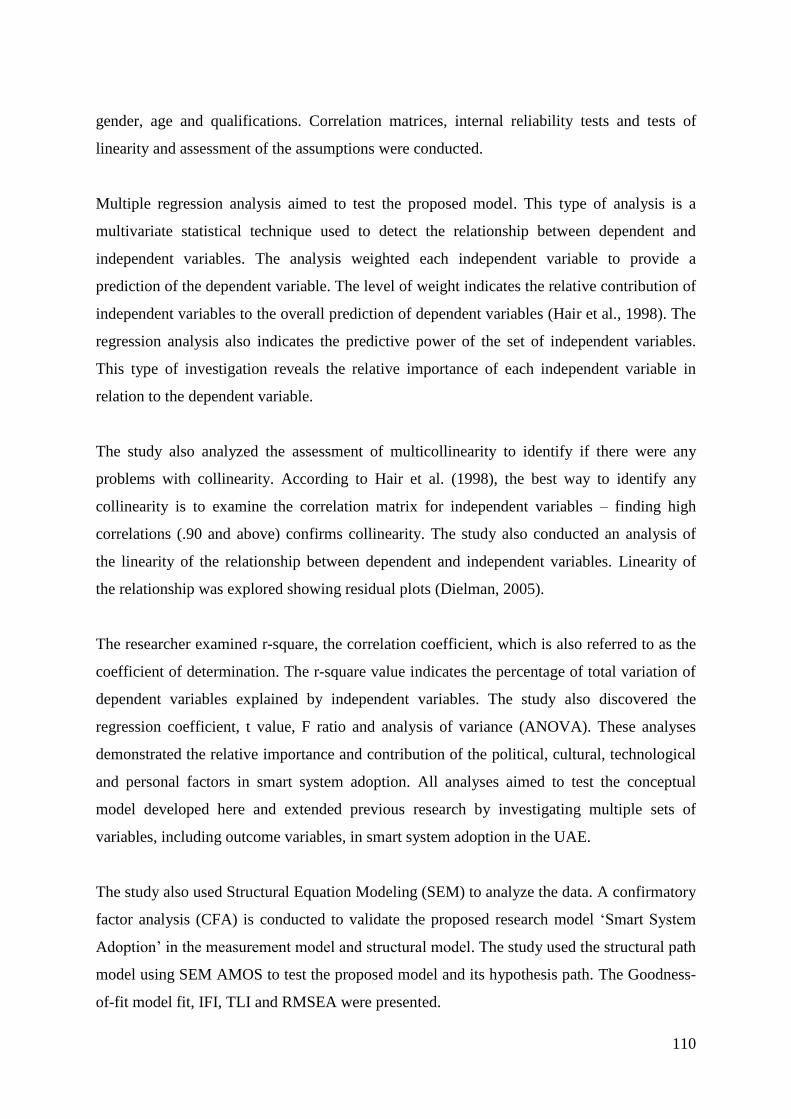
110
gender, age and qualifications. Correlation matrices, internal reliability tests and tests of
linearity and assessment of the assumptions were conducted.
Multiple regression analysis aimed to test the proposed model. This type of analysis is a
multivariate statistical technique used to detect the relationship between dependent and
independent variables. The analysis weighted each independent variable to provide a
prediction of the dependent variable. The level of weight indicates the relative contribution of
independent variables to the overall prediction of dependent variables (Hair et al., 1998). The
regression analysis also indicates the predictive power of the set of independent variables.
This type of investigation reveals the relative importance of each independent variable in
relation to the dependent variable.
The study also analyzed the assessment of multicollinearity to identify if there were any
problems with collinearity. According to Hair et al. (1998), the best way to identify any
collinearity is to examine the correlation matrix for independent variables – finding high
correlations (.90 and above) confirms collinearity. The study also conducted an analysis of
the linearity of the relationship between dependent and independent variables. Linearity of
the relationship was explored showing residual plots (Dielman, 2005).
The researcher examined r-square, the correlation coefficient, which is also referred to as the
coefficient of determination. The r-square value indicates the percentage of total variation of
dependent variables explained by independent variables. The study also discovered the
regression coefficient, t value, F ratio and analysis of variance (ANOVA). These analyses
demonstrated the relative importance and contribution of the political, cultural, technological
and personal factors in smart system adoption. All analyses aimed to test the conceptual
model developed here and extended previous research by investigating multiple sets of
variables, including outcome variables, in smart system adoption in the UAE.
The study also used Structural Equation Modeling (SEM) to analyze the data. A confirmatory
factor analysis (CFA) is conducted to validate the proposed research model ‘Smart System
Adoption’ in the measurement model and structural model. The study used the structural path
model using SEM AMOS to test the proposed model and its hypothesis path. The Goodness-
of-fit model fit, IFI, TLI and RMSEA were presented.
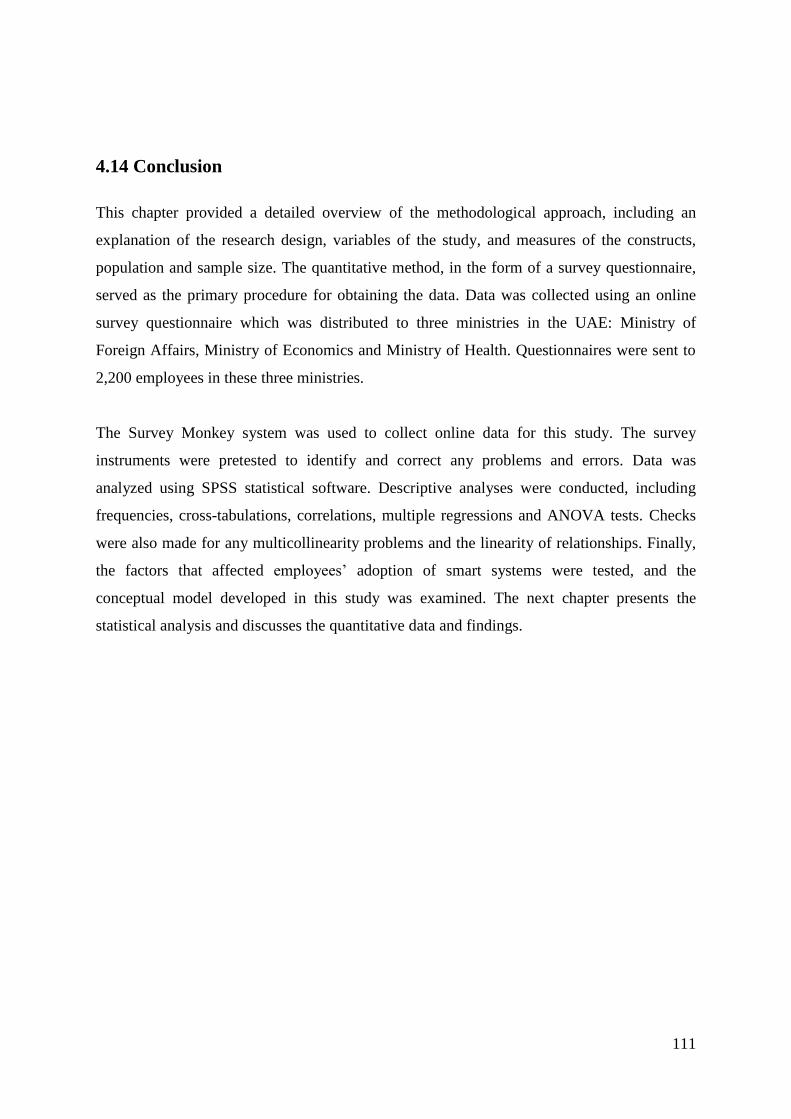
111
4.14 Conclusion
This chapter provided a detailed overview of the methodological approach, including an
explanation of the research design, variables of the study, and measures of the constructs,
population and sample size. The quantitative method, in the form of a survey questionnaire,
served as the primary procedure for obtaining the data. Data was collected using an online
survey questionnaire which was distributed to three ministries in the UAE: Ministry of
Foreign Affairs, Ministry of Economics and Ministry of Health. Questionnaires were sent to
2,200 employees in these three ministries.
The Survey Monkey system was used to collect online data for this study. The survey
instruments were pretested to identify and correct any problems and errors. Data was
analyzed using SPSS statistical software. Descriptive analyses were conducted, including
frequencies, cross-tabulations, correlations, multiple regressions and ANOVA tests. Checks
were also made for any multicollinearity problems and the linearity of relationships. Finally,
the factors that affected employees’ adoption of smart systems were tested, and the
conceptual model developed in this study was examined. The next chapter presents the
statistical analysis and discusses the quantitative data and findings.

112
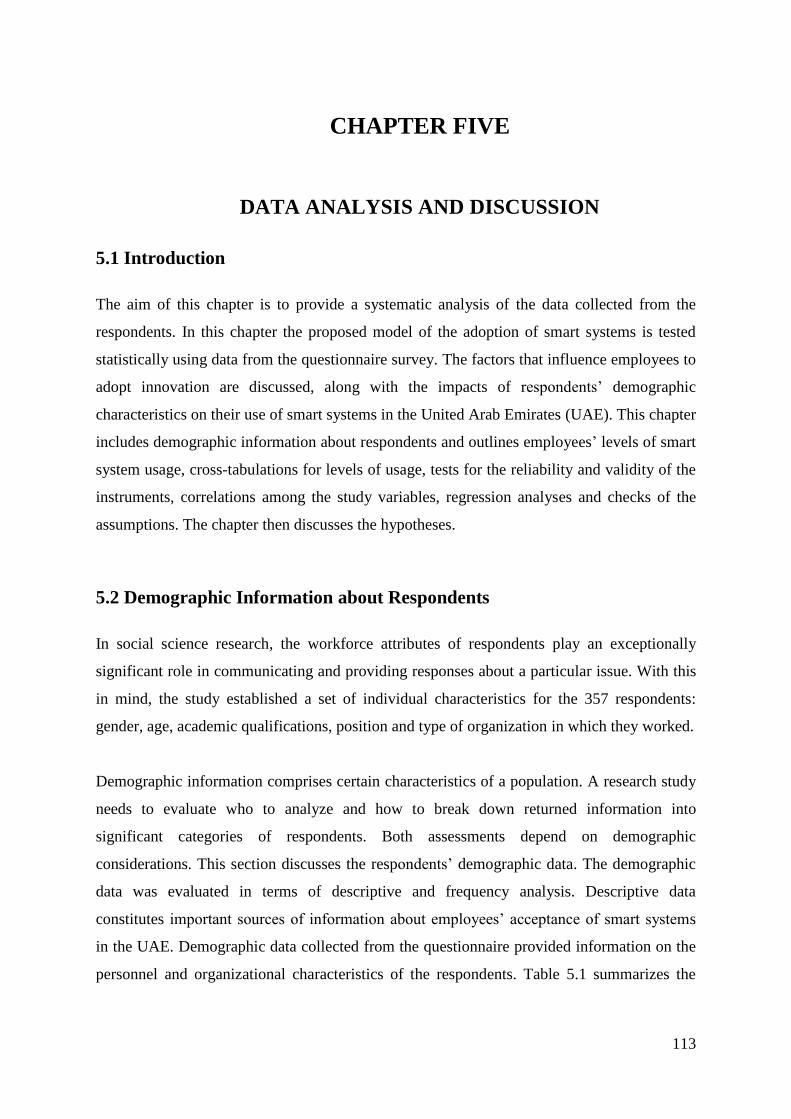
113
CHAPTER FIVE
DATA ANALYSIS AND DISCUSSION
5.1 Introduction
The aim of this chapter is to provide a systematic analysis of the data collected from the
respondents. In this chapter the proposed model of the adoption of smart systems is tested
statistically using data from the questionnaire survey. The factors that influence employees to
adopt innovation are discussed, along with the impacts of respondents’ demographic
characteristics on their use of smart systems in the United Arab Emirates (UAE). This chapter
includes demographic information about respondents and outlines employees’ levels of smart
system usage, cross-tabulations for levels of usage, tests for the reliability and validity of the
instruments, correlations among the study variables, regression analyses and checks of the
assumptions. The chapter then discusses the hypotheses.
5.2 Demographic Information about Respondents
In social science research, the workforce attributes of respondents play an exceptionally
significant role in communicating and providing responses about a particular issue. With this
in mind, the study established a set of individual characteristics for the 357 respondents:
gender, age, academic qualifications, position and type of organization in which they worked.
Demographic information comprises certain characteristics of a population. A research study
needs to evaluate who to analyze and how to break down returned information into
significant categories of respondents. Both assessments depend on demographic
considerations. This section discusses the respondents’ demographic data. The demographic
data was evaluated in terms of descriptive and frequency analysis. Descriptive data
constitutes important sources of information about employees’ acceptance of smart systems
in the UAE. Demographic data collected from the questionnaire provided information on the
personnel and organizational characteristics of the respondents. Table 5.1 summarizes the

114
respondents’ demographic profiles with reference to gender, age, academic qualifications,
position and type of organization.
Gender is an essential variable in acceptance of smart systems in the UAE’s social context,
which is shaped by various cultural, political and economic factors. Subsequently,
information concerning gender is presented in Figure 5.1 and Table 5.1.
Figure 5.1: Participants’ gender distribution
In terms of the participants’ gender specification, the results revealed no significant
difference between males and females was evident (Figure 5.1). There were slightly more
female respondents (51%) than male respondents (49%). Since the UAE has more women
than men, the government provides special consideration for female job seekers in the public
sector.
Age of the respondents does stand out as significant when considering people’s views about
specific issues. Generally, age demonstrates a person’s cognitive level of development and
what they consider to be important responses to questions.
Gender
Male
Female
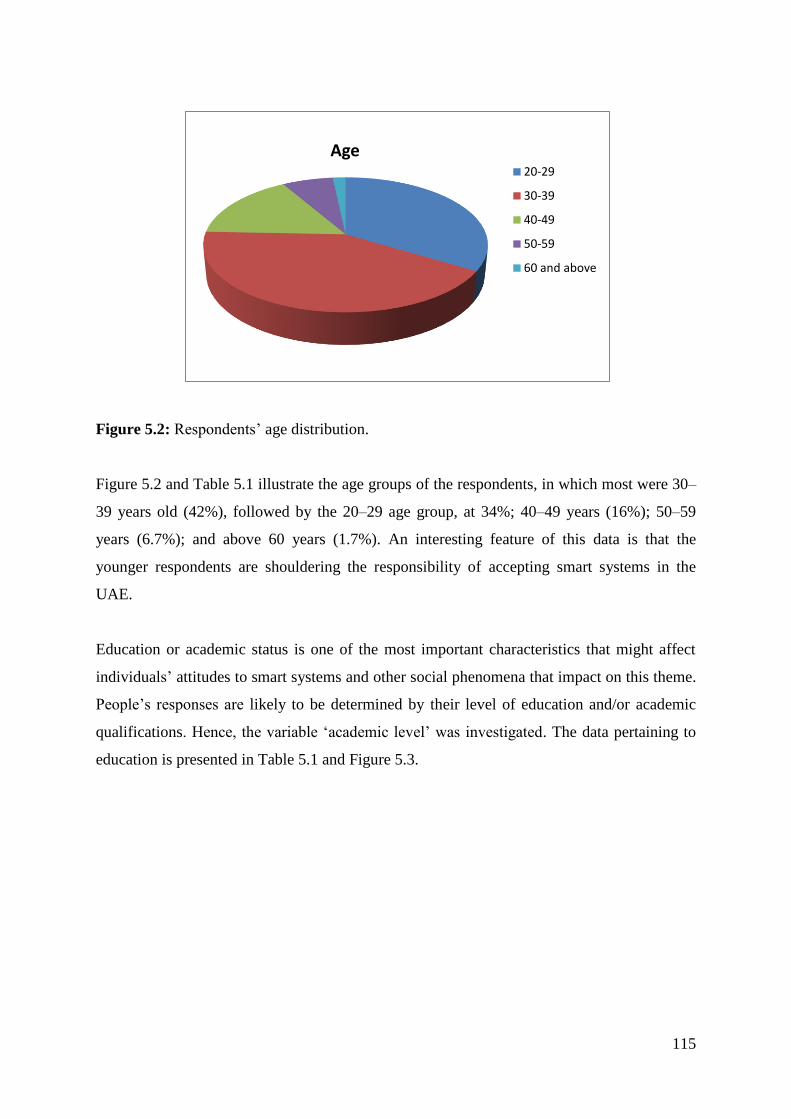
115
Figure 5.2: Respondents’ age distribution.
Figure 5.2 and Table 5.1 illustrate the age groups of the respondents, in which most were 30–
39 years old (42%), followed by the 20–29 age group, at 34%; 40–49 years (16%); 50–59
years (6.7%); and above 60 years (1.7%). An interesting feature of this data is that the
younger respondents are shouldering the responsibility of accepting smart systems in the
UAE.
Education or academic status is one of the most important characteristics that might affect
individuals’ attitudes to smart systems and other social phenomena that impact on this theme.
People’s responses are likely to be determined by their level of education and/or academic
qualifications. Hence, the variable ‘academic level’ was investigated. The data pertaining to
education is presented in Table 5.1 and Figure 5.3.
Age 20-29
30-39
40-49
50-59
60 and above

116
Figure 5.3: Respondents’ academic levels
In terms of academic qualifications (Figure 5.3), the findings showed that a majority of the
respondents had a Bachelor degree (57%), followed by a Master’s degree (24%), while
approximately 12% of respondents had a higher school certificate and 4% had a PhD.
However, it can be concluded from Figure 5.3 above that generally the respondents had not
pursued a higher education qualification, which is something considered critically important
today to create a knowledge-based society and acceptance of smart systems.
A person’s job position does have a bearing on his or her personality and attitude to an issue.
Quality of life is also determined by an individual’s job status and the income he or she
derives from it. A persons’ job socializes him or her to particular fashions which in turn
reflects that person’s pattern of behaviors. In other words, a person’s response to a problem is
possibly determined by the type of job he or she has; hence, the variable job position was
investigated. The data pertaining to this theme is presented in Figure 5.4.
Academic
Primary school
Higher School Certificate
Bachelor Degree
Master Degree
PhD
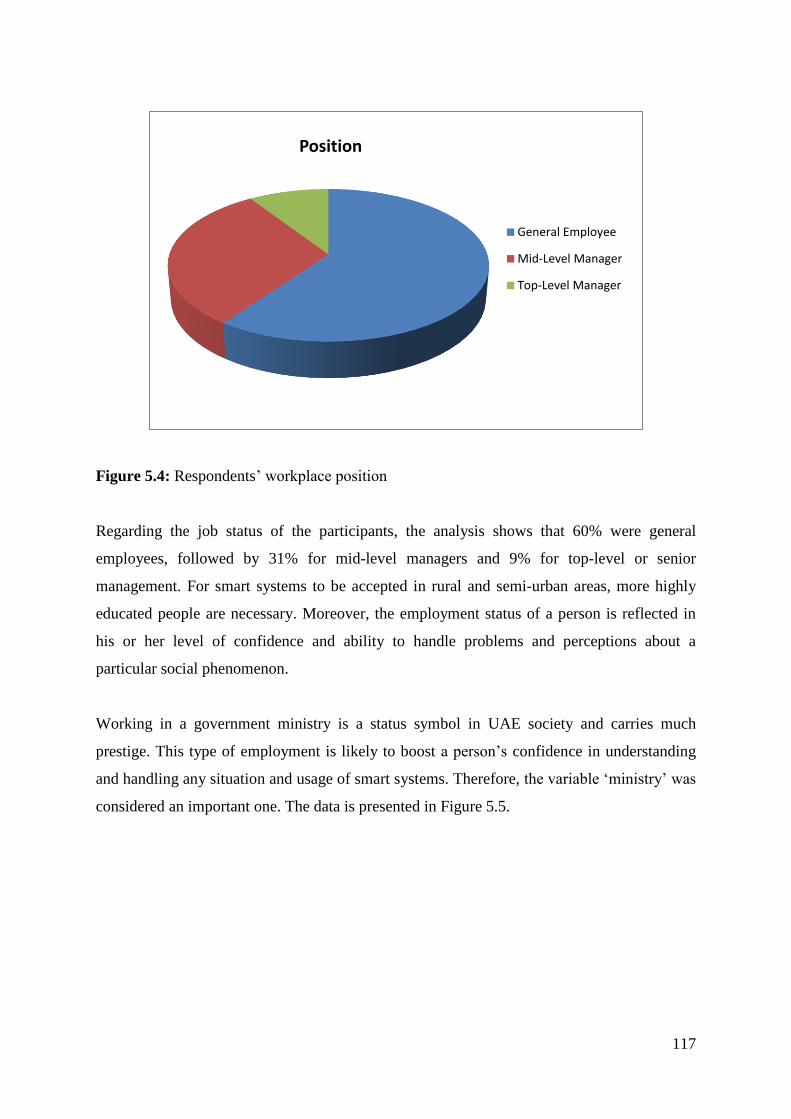
117
Figure 5.4: Respondents’ workplace position
Regarding the job status of the participants, the analysis shows that 60% were general
employees, followed by 31% for mid-level managers and 9% for top-level or senior
management. For smart systems to be accepted in rural and semi-urban areas, more highly
educated people are necessary. Moreover, the employment status of a person is reflected in
his or her level of confidence and ability to handle problems and perceptions about a
particular social phenomenon.
Working in a government ministry is a status symbol in UAE society and carries much
prestige. This type of employment is likely to boost a person’s confidence in understanding
and handling any situation and usage of smart systems. Therefore, the variable ‘ministry’ was
considered an important one. The data is presented in Figure 5.5.
Position
General Employee
Mid-Level Manager
Top-Level Manager

118
Figure 5.5: Respondents’ ministry distribution
Importantly, in terms of participants who work for a ministry, the findings indicated that 58%
were in the Ministry of Foreign Affairs and International Cooperation, 26% in the Ministry of
Economy and 15% in the Ministry of Health.
The demographic analysis shows that the sample is representative of the research population
regarding gender. The analysis indicated that most respondents are young to middle-aged,
moderately to highly educated, and work in the Foreign Affairs and International Cooperation
followed by the Ministry of Economy and then the Ministry of Health. This demographic
analysis can provide critical information when the adoption of smart systems and usage levels
of these respondents are investigated in the subsequent section.
Ministry
Ministry of Foreign Affairs
Ministry of Health
Ministry of Economy

119
Table 5.1: Demographic profiles of respondents
CHARACTERISTICS FREQUENCY PERCENTAGE
GENDER Male 175 49.0
Female 182 51.0
AGE 20–29 120 33.6
30–39 150 42.0
40–49 57 16.0
50–59 24 6.7
60 and above 6 1.7
ACADEMIC
QUALIFICATIONS
Primary School 8 2.2
Higher School Certificate 42 11.8
Bachelor Degree 204 57.1
Master’s Degree 87 24.4
PhD 16 4.5
POSITION General Employee 214 59.9
Mid-Level Manager 110 30.8
Top-Level Manager 33 9.2
MINISTRY Ministry of Foreign Affairs 208 58.3
Ministry of Health 55 15.4
Ministry of Economy 94 26.3
TOTAL 357 100%
5.3 Smart System Usage Level by Employees
In preparing the employees’ workplace objectives and duties, managers or supervisors may
find it helpful to use smart systems application criteria that are measurable, attainable,
specific, relevant and tractable. These criteria contain performance indicators and yield
objectives that are measurable descriptions of what the employee is expected to achieve. This
section provides descriptive statistics on levels of usage in terms of demographic
characteristics. These items verified usage in terms of frequency, time spent, different
features accessed and number of applications used by employees. The following tables
summarize the data collected from respondents and reveals that usage levels of smart systems
is wide-ranging – from none to several times a day.
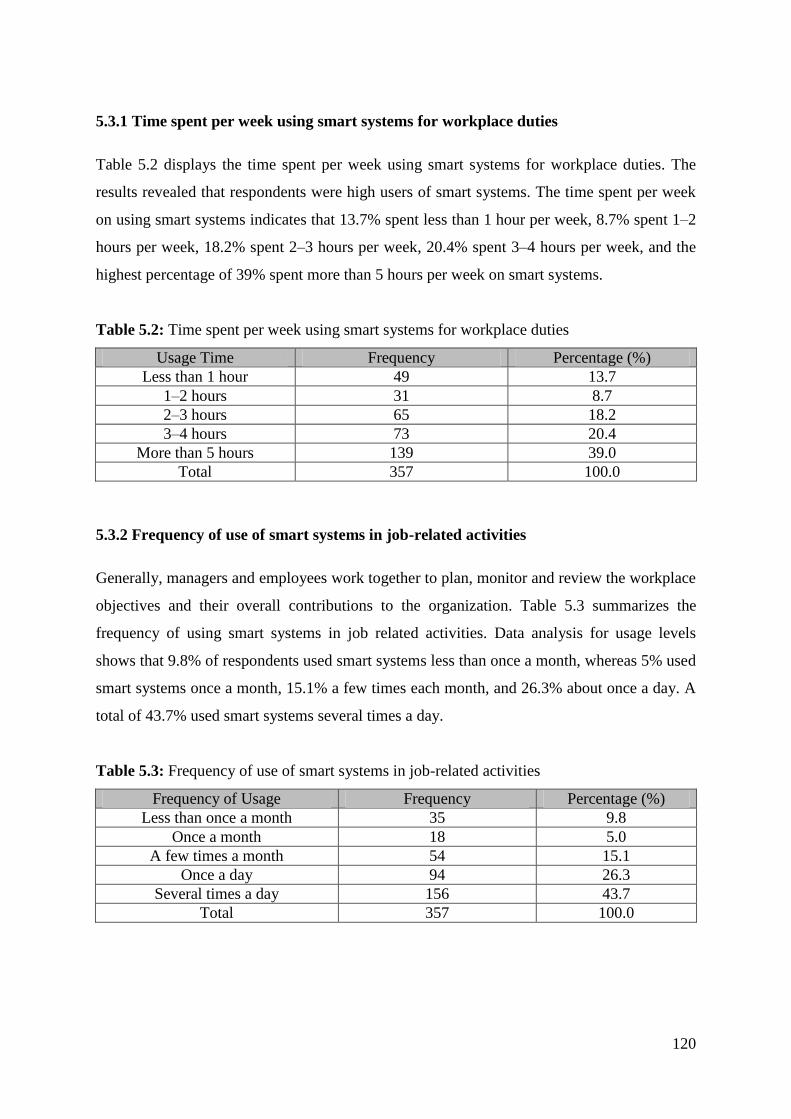
120
5.3.1 Time spent per week using smart systems for workplace duties
Table 5.2 displays the time spent per week using smart systems for workplace duties. The
results revealed that respondents were high users of smart systems. The time spent per week
on using smart systems indicates that 13.7% spent less than 1 hour per week, 8.7% spent 1–2
hours per week, 18.2% spent 2–3 hours per week, 20.4% spent 3–4 hours per week, and the
highest percentage of 39% spent more than 5 hours per week on smart systems.
Table 5.2: Time spent per week using smart systems for workplace duties
Usage Time Frequency Percentage (%)
Less than 1 hour 49 13.7
1–2 hours 31 8.7
2–3 hours 65 18.2
3–4 hours 73 20.4
More than 5 hours 139 39.0
Total 357 100.0
5.3.2 Frequency of use of smart systems in job-related activities
Generally, managers and employees work together to plan, monitor and review the workplace
objectives and their overall contributions to the organization. Table 5.3 summarizes the
frequency of using smart systems in job related activities. Data analysis for usage levels
shows that 9.8% of respondents used smart systems less than once a month, whereas 5% used
smart systems once a month, 15.1% a few times each month, and 26.3% about once a day. A
total of 43.7% used smart systems several times a day.
Table 5.3: Frequency of use of smart systems in job-related activities
Frequency of Usage Frequency Percentage (%)
Less than once a month 35 9.8
Once a month 18 5.0
A few times a month 54 15.1
Once a day 94 26.3
Several times a day 156 43.7
Total 357 100.0
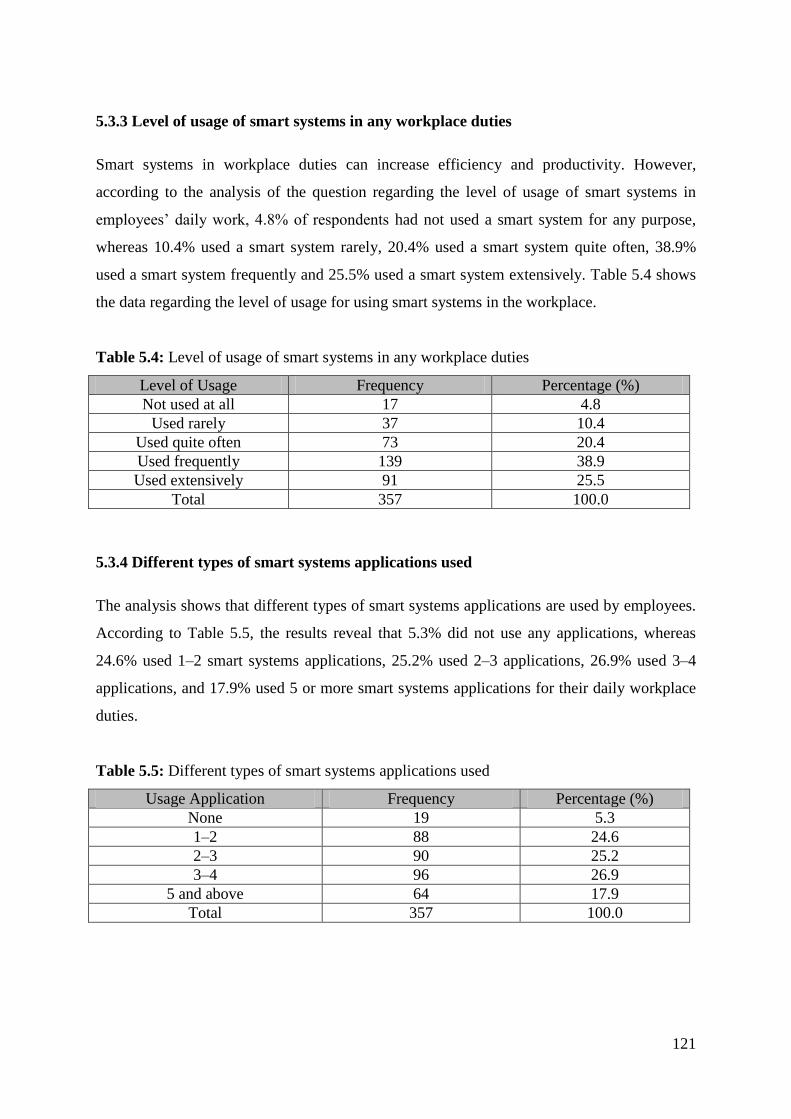
121
5.3.3 Level of usage of smart systems in any workplace duties
Smart systems in workplace duties can increase efficiency and productivity. However,
according to the analysis of the question regarding the level of usage of smart systems in
employees’ daily work, 4.8% of respondents had not used a smart system for any purpose,
whereas 10.4% used a smart system rarely, 20.4% used a smart system quite often, 38.9%
used a smart system frequently and 25.5% used a smart system extensively. Table 5.4 shows
the data regarding the level of usage for using smart systems in the workplace.
Table 5.4: Level of usage of smart systems in any workplace duties
Level of Usage Frequency Percentage (%)
Not used at all 17 4.8
Used rarely 37 10.4
Used quite often 73 20.4
Used frequently 139 38.9
Used extensively 91 25.5
Total 357 100.0
5.3.4 Different types of smart systems applications used
The analysis shows that different types of smart systems applications are used by employees.
According to Table 5.5, the results reveal that 5.3% did not use any applications, whereas
24.6% used 1–2 smart systems applications, 25.2% used 2–3 applications, 26.9% used 3–4
applications, and 17.9% used 5 or more smart systems applications for their daily workplace
duties.
Table 5.5: Different types of smart systems applications used
Usage Application Frequency Percentage (%)
None 19 5.3
1–2 88 24.6
2–3 90 25.2
3–4 96 26.9
5 and above 64 17.9
Total 357 100.0

122
5.3.5 Usage of advanced features on smart systems
Today, many of the world’s leading companies or manufacturers provide advanced features
on smart systems such as Crestron (automation systems and innovating technology), Savant
(luxury home theater and automation solutions), ELAN home systems (multi-room
audio/video and control systems), Lutron (controlled lighting), Stealth Acoustics (premier
systems integration), Integra (building components), etc. This study views the usage of
advanced features on smart systems in the UAE. The results in Table 5.6 indicate that 8.1%
of respondents have not used the advanced features of smart systems, whereas 19.3% only
used them rarely, 33.3% used advanced features frequently, and 8.4% used advanced features
extensively.
Table 5.6: Usage of advanced features on smart systems
Usage Features Frequency Percentage (%)
Not used at all 29 8.1
Used rarely 69 19.3
Used quite often 119 33.3
Used frequently 110 30.8
Used extensively 30 8.4
Total 357 100.0
5.4 Cross-Tabulation for Level of Usage by Demographics
The cross-tabulation of the analysis shows the level of usage as measured by frequency, time
spent, level of usage, number of applications used and advanced features used according to
respondents’ gender, age, education, job position and ministry where they work. This
provides important information on how individual employees use smart systems.
5.4.1 Cross-tabulation (gender by time)
Table 5.7 presents the cross-tabulation analysis for the usage duration of smart systems by
male and female respondents. Results show that the respondents who most actively used
smart systems (for more than 5 hours a week) were females (21.3%). Of the male
respondents, 17.6% used smart systems for more than 5 hours a week. The lowest percentage
of female respondents (2.5%) indicated that their use of smart systems was only 1–2 hours
per week, while 6.2% of males used smart systems for 1–2 hours per week. In terms of usage

123
duration of 2–3 hours, more female respondents (37, 10.4%) intended to use smart systems
for that length of time, followed by male participants (28, 7.8%). A total of 13.7% (males and
females) indicated that they used smart systems for less than 1 hour per week.
Table 5.7: Cross-tabulation (gender by time)
Gender Time Total
Less
than 1
hour
1–2
hours
2–3
hours
3–4
hours
More
than 5
hours
Male 28
7.8%
22
6.2%
28
7.8%
34
9.5%
63
17.6%
175
49.0%
Female 21
5.9%
9
2.5%
37
10.4%
39
10.9%
76
21.3%
182
51.0%
Total 49
13.7%
31
8.7%
65
18.2%
73
20.4%
1139
38.9%
357
100.0%
5.4.2 Cross-tabulation (gender by frequency)
In Table 5.8 the results display the frequency of usage of smart systems by both male and
female respondents. The highest percentage refers to female respondents (86, 24.1%) who
use smart systems several times on a daily basis. Similarly, the highest percentage of male
respondents (70, 19.6%) indicated that they use smart systems several times a day. The
lowest percentages show that both male and female respondents (2.5% each) used smart
systems once a month. Moreover, the analysis identified that a total of 30 (8.4%) male
respondents used smart systems a few times a month, while 24 (6.7%) females used smart
systems infrequently. Importantly, both male and female respondents (35, 9.8%) utilized
smart systems less than once a month.
Table 5.8: Cross-tabulation (gender by frequency)
Gender Frequency Total
Less
than
once a
month
Once a
month
A few
times a
month
Once a
day
Several
times a
day
Male 22
6.2%
9
2.5%
30
8.4%
44
12.3%
70
19.6%
175
49.0%
Female 13
3.6%
9
2.5%
24
6.7%
50
14.0%
86
24.1%
182
51.0%
Total 35 18 54 94 156 357

124
9.8% 5.0% 15.1% 26.3% 43.7% 100.0%
5.4.3 Cross-tabulation (gender by usage)
Table 5.9 below cross-tabulates according to gender the level of usage of smart systems.
Specifically, according to Figure 5.6, the analysis revealed that most respondents use smart
systems frequently – that is, 74 (20.7%) female respondents and 65 (18.2%) male
respondents. A total of 91 (25.5%) for both males (39, 10.9%) and females (52, 14.6%) used
the systems extensively, while only 4.8% of males and females did not use the system at all
for their daily workplace duties. However, a total of 37 (10.4%) participants used smart
systems infrequently, while 73 (20.4%) respondents used smart systems quite often.
Table 5.9: Cross-tabulation (gender by usage)
Gender Usage Total
Not used
at all
Used
rarely
Used
quite
often
Used
frequently
Used
extensively
Male 9
2.5%
20
5.6%
42
11.8%
65
18.2%
39
10.9%
175
49.0%
Female 8
2.2%
17
4.8%
31
8.7%
74
20.7%
52
14.6%
182
51.0%
Total 17
4.8%
37
10.4%
73
20.4%
139
38.9%
91
25.5%
357
100.0%
Figure 5.6: Extent of use by gender
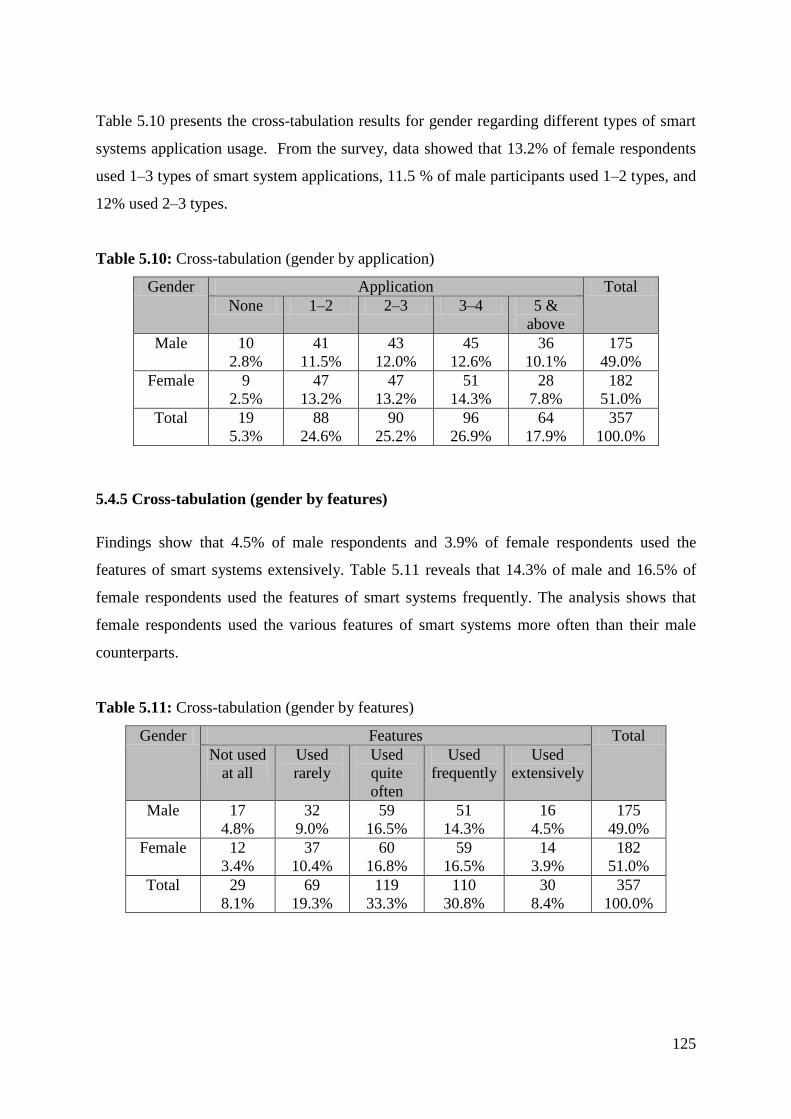
125
Table 5.10 presents the cross-tabulation results for gender regarding different types of smart
systems application usage. From the survey, data showed that 13.2% of female respondents
used 1–3 types of smart system applications, 11.5 % of male participants used 1–2 types, and
12% used 2–3 types.
Table 5.10: Cross-tabulation (gender by application)
Gender Application Total
None 1–2 2–3 3–4 5 &
above
Male 10
2.8%
41
11.5%
43
12.0%
45
12.6%
36
10.1%
175
49.0%
Female 9
2.5%
47
13.2%
47
13.2%
51
14.3%
28
7.8%
182
51.0%
Total 19
5.3%
88
24.6%
90
25.2%
96
26.9%
64
17.9%
357
100.0%
5.4.5 Cross-tabulation (gender by features)
Findings show that 4.5% of male respondents and 3.9% of female respondents used the
features of smart systems extensively. Table 5.11 reveals that 14.3% of male and 16.5% of
female respondents used the features of smart systems frequently. The analysis shows that
female respondents used the various features of smart systems more often than their male
counterparts.
Table 5.11: Cross-tabulation (gender by features)
Gender Features Total
Not used
at all
Used
rarely
Used
quite
often
Used
frequently
Used
extensively
Male 17
4.8%
32
9.0%
59
16.5%
51
14.3%
16
4.5%
175
49.0%
Female 12
3.4%
37
10.4%
60
16.8%
59
16.5%
14
3.9%
182
51.0%
Total 29
8.1%
69
19.3%
119
33.3%
110
30.8%
30
8.4%
357
100.0%
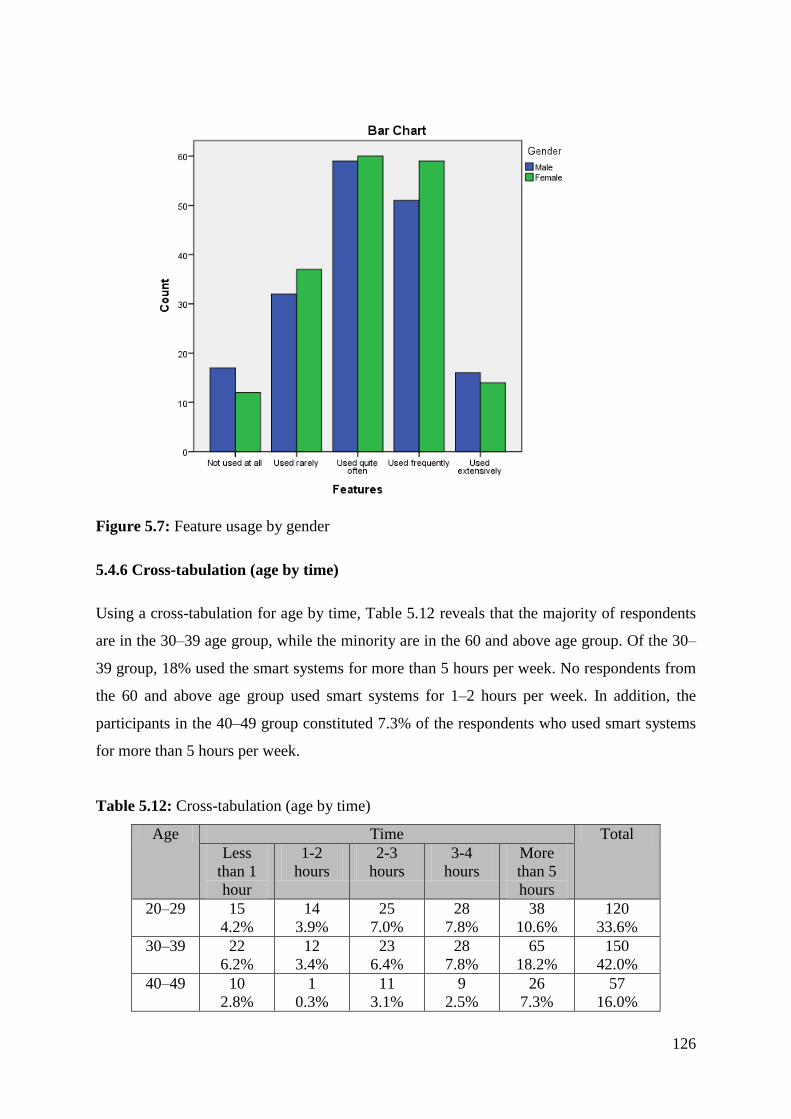
126
Figure 5.7: Feature usage by gender
5.4.6 Cross-tabulation (age by time)
Using a cross-tabulation for age by time, Table 5.12 reveals that the majority of respondents
are in the 30–39 age group, while the minority are in the 60 and above age group. Of the 30–
39 group, 18% used the smart systems for more than 5 hours per week. No respondents from
the 60 and above age group used smart systems for 1–2 hours per week. In addition, the
participants in the 40–49 group constituted 7.3% of the respondents who used smart systems
for more than 5 hours per week.
Table 5.12: Cross-tabulation (age by time)
Age Time Total
Less
than 1
hour
1-2
hours
2-3
hours
3-4
hours
More
than 5
hours
20–29 15
4.2%
14
3.9%
25
7.0%
28
7.8%
38
10.6%
120
33.6%
30–39 22
6.2%
12
3.4%
23
6.4%
28
7.8%
65
18.2%
150
42.0%
40–49 10
2.8%
1
0.3%
11
3.1%
9
2.5%
26
7.3%
57
16.0%

127
50–59 1
0.3%
4
1.1%
5
1.4%
7
2.0%
7
2.0%
24
6.7%
60 and
above
1
0.3%
0
0.0%
1
0.3%
1
0.3%
3
0.8%
6
1.7%
Total 49
13.7%
31
8.7%
65
18.2%
73
20.4%
139
38.9%
357
100.0%
5.4.7 Cross-tabulation (age by frequency)
Table 5.13 shows that about 18% of the respondents aged 30–39 used smart systems several
times a day, while those aged 50–59 accounted for only 3.6% of the sample. The table also
shows that 14.6% of the respondents aged 20–29 used smart systems several times a day, 9%
at least once a day and 4.5% a few times a day. Overall, the results indicate that young people
used smart systems more frequently than older respondents.
Table 5.13: Cross-tabulation (age by frequency)
Age Frequency Total
Less
than
once a
month
Once a
month
A few
times a
month
Once a
day
Several
times a
day
20–29 11
3.1%
9
2.5%
16
4.5%
32
9.0%
52
14.6%
120
33.6%
30–39 18
5.0%
6
1.7%
26
7.3%
36
10.1%
64
17.9%
150
42.0%
40–49 6
1.7%
2
0.6%
8
2.2%
19
5.3%
22
6.2%
57
16.0%
50–59 0
0.0%
0
0.0%
4
1.1%
7
2.0%
13
3.6%
24
6.7%
60 and
above
0
0.0%
1
0.3%
0
0.0%
0
0.0%
5
1.4%
6
1.7%
Total 35
9.8%
18
5.0%
54
15.1%
94
26.3%
156
43.7%
357
100.0%
5.4.8 Cross-tabulation (age by usage)
Table 5.14 shows the cross-tabulation analysis for age groups according to usage of smart
systems. Most people in the 30–39 age group used smart systems frequently, and tended to
use them frequently instead of extensively. Only 12% of this particular age group used the
smart systems extensively. Importantly, among the 357 respondents, a total of 42% of those
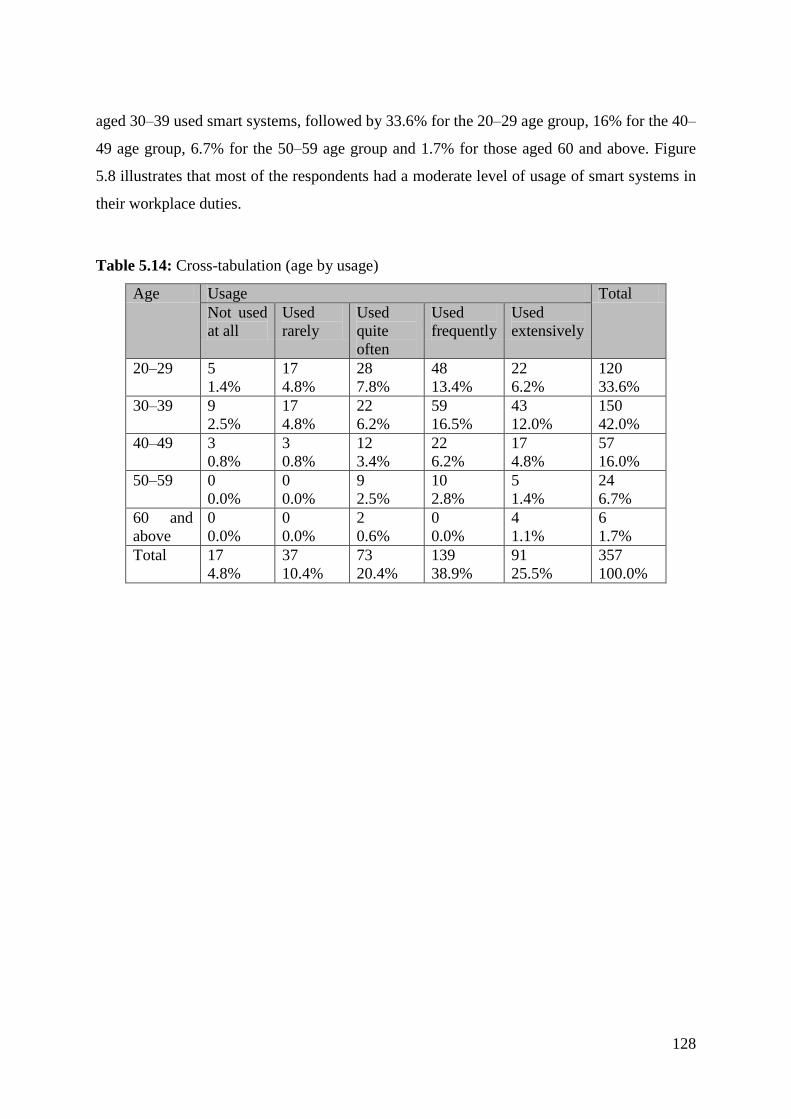
128
aged 30–39 used smart systems, followed by 33.6% for the 20–29 age group, 16% for the 40–
49 age group, 6.7% for the 50–59 age group and 1.7% for those aged 60 and above. Figure
5.8 illustrates that most of the respondents had a moderate level of usage of smart systems in
their workplace duties.
Table 5.14: Cross-tabulation (age by usage)
Age Usage Total
Not used
at all
Used
rarely
Used
quite
often
Used
frequently
Used
extensively
20–29 5
1.4%
17
4.8%
28
7.8%
48
13.4%
22
6.2%
120
33.6%
30–39 9
2.5%
17
4.8%
22
6.2%
59
16.5%
43
12.0%
150
42.0%
40–49 3
0.8%
3
0.8%
12
3.4%
22
6.2%
17
4.8%
57
16.0%
50–59 0
0.0%
0
0.0%
9
2.5%
10
2.8%
5
1.4%
24
6.7%
60 and
above
0
0.0%
0
0.0%
2
0.6%
0
0.0%
4
1.1%
6
1.7%
Total 17
4.8%
37
10.4%
73
20.4%
139
38.9%
91
25.5%
357
100.0%
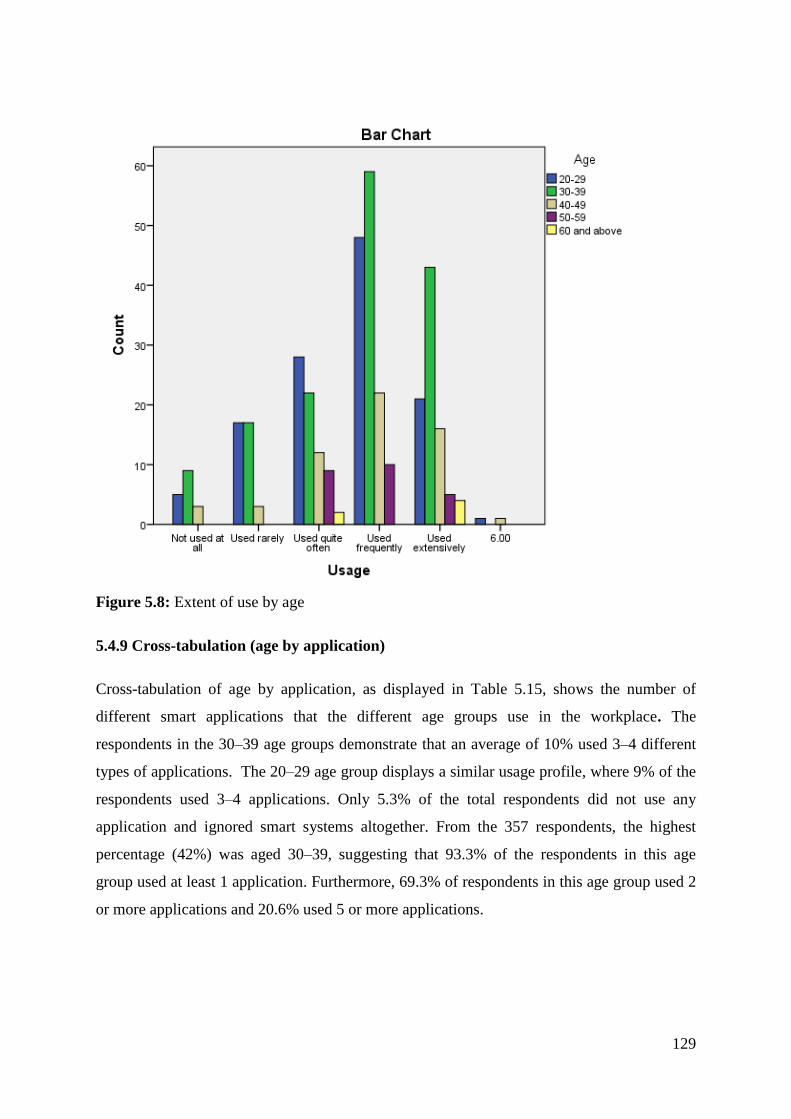
129
Figure 5.8: Extent of use by age
5.4.9 Cross-tabulation (age by application)
Cross-tabulation of age by application, as displayed in Table 5.15, shows the number of
different smart applications that the different age groups use in the workplace. The
respondents in the 30–39 age groups demonstrate that an average of 10% used 3–4 different
types of applications. The 20–29 age group displays a similar usage profile, where 9% of the
respondents used 3–4 applications. Only 5.3% of the total respondents did not use any
application and ignored smart systems altogether. From the 357 respondents, the highest
percentage (42%) was aged 30–39, suggesting that 93.3% of the respondents in this age
group used at least 1 application. Furthermore, 69.3% of respondents in this age group used 2
or more applications and 20.6% used 5 or more applications.
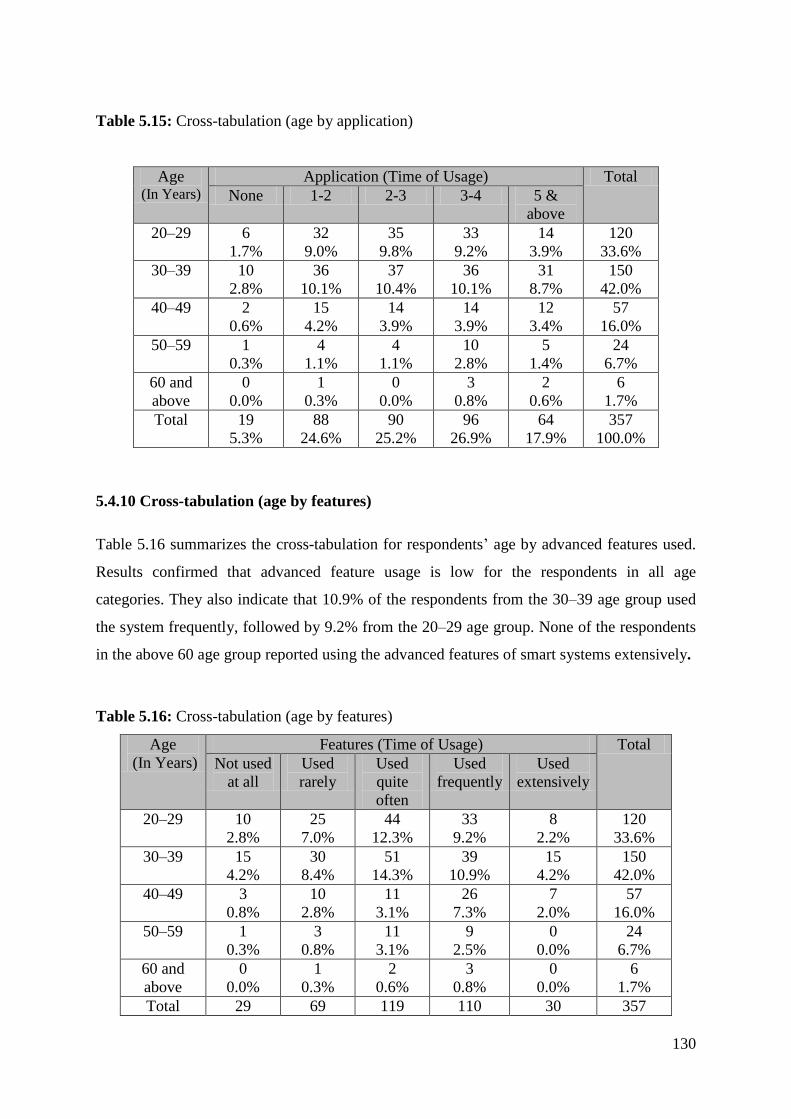
130
Table 5.15: Cross-tabulation (age by application)
Age (In Years)
Application (Time of Usage) Total
None 1-2 2-3 3-4 5 &
above
20–29 6
1.7%
32
9.0%
35
9.8%
33
9.2%
14
3.9%
120
33.6%
30–39 10
2.8%
36
10.1%
37
10.4%
36
10.1%
31
8.7%
150
42.0%
40–49 2
0.6%
15
4.2%
14
3.9%
14
3.9%
12
3.4%
57
16.0%
50–59 1
0.3%
4
1.1%
4
1.1%
10
2.8%
5
1.4%
24
6.7%
60 and
above
0
0.0%
1
0.3%
0
0.0%
3
0.8%
2
0.6%
6
1.7%
Total 19
5.3%
88
24.6%
90
25.2%
96
26.9%
64
17.9%
357
100.0%
5.4.10 Cross-tabulation (age by features)
Table 5.16 summarizes the cross-tabulation for respondents’ age by advanced features used.
Results confirmed that advanced feature usage is low for the respondents in all age
categories. They also indicate that 10.9% of the respondents from the 30–39 age group used
the system frequently, followed by 9.2% from the 20–29 age group. None of the respondents
in the above 60 age group reported using the advanced features of smart systems extensively.
Table 5.16: Cross-tabulation (age by features)
Age
(In Years)
Features (Time of Usage) Total
Not used
at all
Used
rarely
Used
quite
often
Used
frequently
Used
extensively
20–29 10
2.8%
25
7.0%
44
12.3%
33
9.2%
8
2.2%
120
33.6%
30–39 15
4.2%
30
8.4%
51
14.3%
39
10.9%
15
4.2%
150
42.0%
40–49 3
0.8%
10
2.8%
11
3.1%
26
7.3%
7
2.0%
57
16.0%
50–59 1
0.3%
3
0.8%
11
3.1%
9
2.5%
0
0.0%
24
6.7%
60 and
above
0
0.0%
1
0.3%
2
0.6%
3
0.8%
0
0.0%
6
1.7%
Total 29 69 119 110 30 357
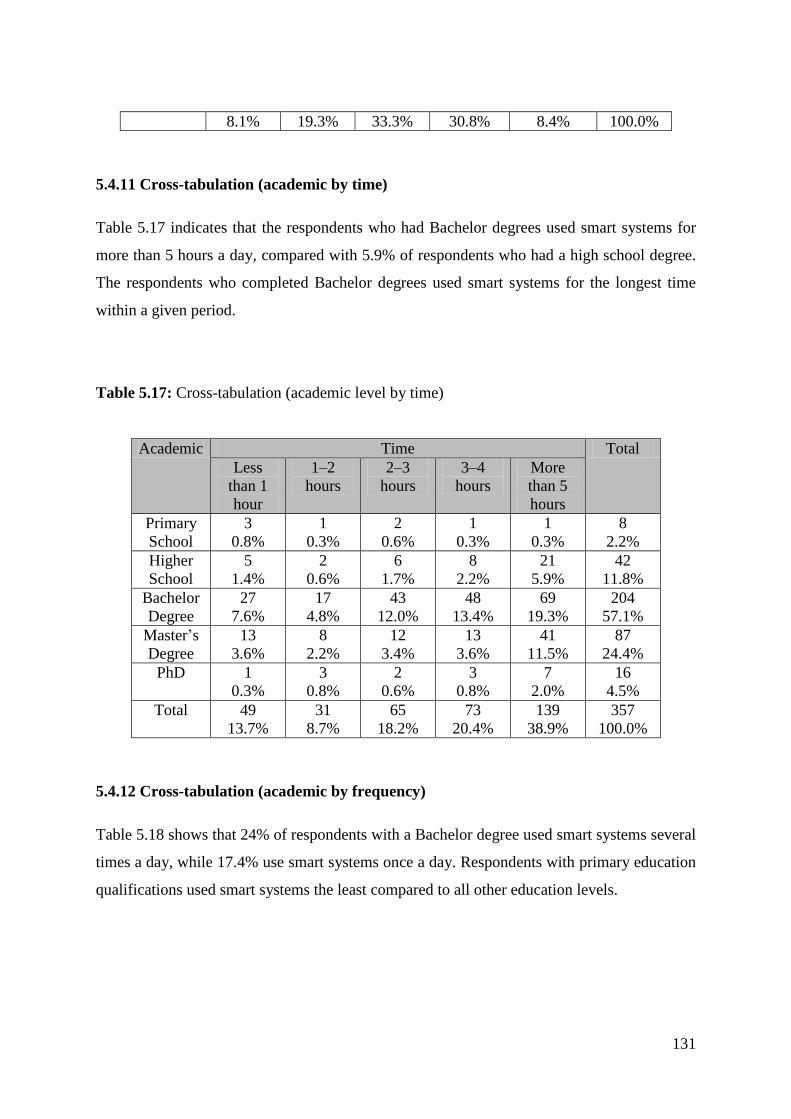
131
8.1% 19.3% 33.3% 30.8% 8.4% 100.0%
5.4.11 Cross-tabulation (academic by time)
Table 5.17 indicates that the respondents who had Bachelor degrees used smart systems for
more than 5 hours a day, compared with 5.9% of respondents who had a high school degree.
The respondents who completed Bachelor degrees used smart systems for the longest time
within a given period.
Table 5.17: Cross-tabulation (academic level by time)
Academic Time Total
Less
than 1
hour
1–2
hours
2–3
hours
3–4
hours
More
than 5
hours
Primary
School
3
0.8%
1
0.3%
2
0.6%
1
0.3%
1
0.3%
8
2.2%
Higher
School
5
1.4%
2
0.6%
6
1.7%
8
2.2%
21
5.9%
42
11.8%
Bachelor
Degree
27
7.6%
17
4.8%
43
12.0%
48
13.4%
69
19.3%
204
57.1%
Master’s
Degree
13
3.6%
8
2.2%
12
3.4%
13
3.6%
41
11.5%
87
24.4%
PhD 1
0.3%
3
0.8%
2
0.6%
3
0.8%
7
2.0%
16
4.5%
Total 49
13.7%
31
8.7%
65
18.2%
73
20.4%
139
38.9%
357
100.0%
5.4.12 Cross-tabulation (academic by frequency)
Table 5.18 shows that 24% of respondents with a Bachelor degree used smart systems several
times a day, while 17.4% use smart systems once a day. Respondents with primary education
qualifications used smart systems the least compared to all other education levels.

132
Table 5.18: Cross-tabulation (academic level by frequency)
Academic Frequency Total
Less
than
once a
month
Once a
month
A few
times a
month
Once a
day
Several
times a
day
Primary
School
2
0.6%
3
0.8%
0
0.0%
2
0.6%
1
0.3%
8
2.2%
Higher
School
4
1.1%
3
0.8%
7
2.0%
11
3.1%
17
4.8%
42
11.8%
Bachelor
Degree
17
4.8%
9
2.5%
29
8.1%
62
17.4%
87
24.4%
204
57.1%
Master’s
Degree
11
3.1%
2
0.6%
17
4.8%
16
4.5%
41
11.5%
87
24.4%
PhD 1
0.3%
1
0.3%
1
0.3%
3
0.8%
10
2.8%
16
4.5%
Total 35
9.8%
18
5.0%
54
15.1%
94
26.3%
156
43.7%
357
100.0%
5.4.13 Cross-tabulation (academic by usage)
Table 5.19 summarizes the cross-tabulation analysis for academic qualifications by usage.
The results show that respondents with a Bachelor degree used smart systems ranging from
frequently (24.4%) to extensively (12.9%). The largest proportion of moderate users (those
who used the smart systems often) had completed a Bachelor degree. Respondents with
Master’s degrees also used smart systems more frequently than those respondents who did
not go on to higher education.
Table 5.19: Cross-tabulation (academic level by usage)
Academic Usage Total
Not used
at all
Used
rarely
Used
quite
often
Used
frequently
Used
extensively
Primary
School
1
0.3%
3
0.8%
2
0.6%
2
0.6%
0
0.0%
8
2.2%
Higher
School
1
0.3%
8
2.2%
6
1.7%
17
4.8%
10
2.8%
42
11.8%
Bachelor
Degree
8
2.2%
19
5.3%
44
12.3%
87
24.4%
46
12.9%
204
57.1%
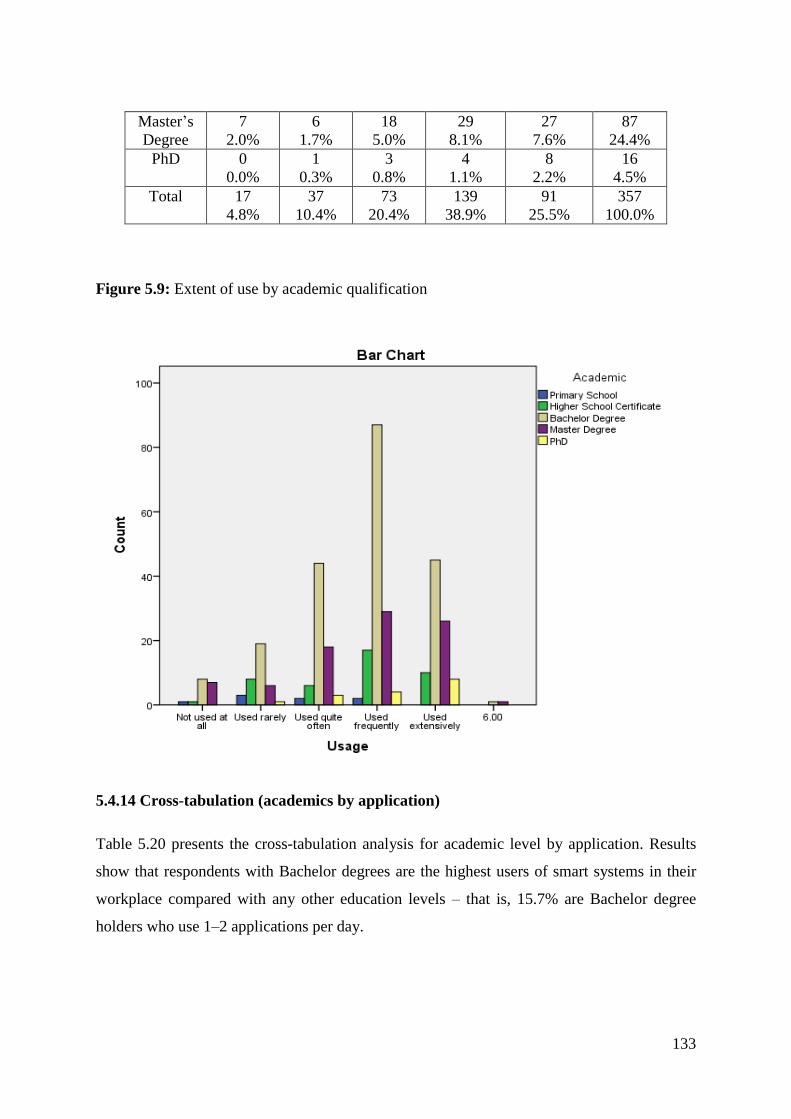
133
Master’s
Degree
7
2.0%
6
1.7%
18
5.0%
29
8.1%
27
7.6%
87
24.4%
PhD 0
0.0%
1
0.3%
3
0.8%
4
1.1%
8
2.2%
16
4.5%
Total 17
4.8%
37
10.4%
73
20.4%
139
38.9%
91
25.5%
357
100.0%
Figure 5.9: Extent of use by academic qualification
5.4.14 Cross-tabulation (academics by application)
Table 5.20 presents the cross-tabulation analysis for academic level by application. Results
show that respondents with Bachelor degrees are the highest users of smart systems in their
workplace compared with any other education levels – that is, 15.7% are Bachelor degree
holders who use 1–2 applications per day.

134
Table 5.20: Cross-tabulation (academic level by and number of applications used)
Academic
Level
Application Total
None 1–2 2–3 3–4 5 &
above
Primary
School
0
0.0%
2
0.6%
1
0.3%
5
1.4%
0
0.0%
8
2.2%
Higher
School
2
0.6%
6
1.7%
15
4.2%
12
3.4%
7
2.0%
42
11.8%
Bachelor
Degree
10
2.8%
56
15.7%
50
14.0%
52
14.6%
36
10.1%
204
57.1%
Master’s
Degree
7
2.0%
19
5.3%
22
6.2%
21
5.9%
18
5.0%
87
24.4%
PhD 0
0.0%
5
1.4%
2
0.6%
6
1.7%
3
0.8%
16
4.5%
Total 19
5.3%
88
24.6%
90
25.2%
96
26.9%
64
17.9%
357
100.0%
5.4.15 Cross-tabulation (academic level by advanced features used)
Table 5.21 is the cross-tabulation for academic qualifications by features used. Respondents
with Bachelor degrees used advanced features of applications significantly more than any of
the other groups. Also, respondents with Bachelor degrees and Master’s degrees used
advanced features frequently compared with respondents with other educational levels.
Table 5.21: Cross-tabulation (academic level by features)
Academic
Level
Features Total
Not used
at all
Used
rarely
Used
quite
often
Used
frequently
Used
extensively
Primary
School
1
0.3%
3
0.8%
3
0.8%
1
0.3%
0
0.0%
8
2.2%
Higher
School
3
0.8%
7
2.0%
17
4.8%
12
3.4%
3
0.8%
42
11.8%
Bachelor
Degree
15
4.2%
42
11.8%
66
18.5%
67
18.8%
14
3.9%
204
57.1%
Master’s
Degree
9
2.5%
14
3.9%
29
8.1%
24
6.7%
11
3.1%
87
24.4%
PhD 1
0.3%
3
0.8%
4
1.1%
6
1.7%
2
0.6%
16
4.5%
Total 29
8.1%
69
19.3%
119
33.3%
110
30.8%
30
8.4%
357
100.0%

135
5.4.16 Cross-tabulation (position by time)
According to Table 5.22, the cross-tabulation results for employees’ position by time found
that most respondents are general employees (59.9%), followed by the mid-level managers
(30.8%) and senior-level managers (9.2%). Findings indicated that 21.3% of general
employees used smart systems more than 5 hours a week, and 13.4% of mid-level managers
used smart systems at the same level. Of the top-level managers, 4% used smart systems for
more than 5 hours a week.
Table 5.22: Cross-tabulation (position by time)
Position Time Total
Less
than 1
hour
1–2
hours
2–3
hours
3–4
hours
More
than 5
hours
General
Employee
34
9.5%
20
5.6%
40
11.2%
44
12.3%
76
21.3%
214
59.9%
Mid-level
Manager
11
3.1%
9
2.5%
20
5.6%
22
6.2%
48
13.4%
110
30.8%
Top-level
Manager
4
1.1%
2
0.6%
5
1.4%
7
2.0%
15
4.2%
33
9.2%
Total 49
13.7%
31
8.7%
65
18.2%
73
20.4%
139
38.9%
357
100.0%
5.4.17 Cross-tabulation (position by frequency)
Table 5.23 shows the cross-tabulation analysis for employees’ workplace position by number
of hours per week using smart systems. Results show that the majority of respondents
(43.7%) used smart systems several times a day. Also, 26.6% of the general employees,
11.5% of the mid-level managers and 5.6% of the senior-level managers used smart systems
several times a day. It is evident that 3.9% of the general employees utilized smart systems
once a month.
Table 5.23: Cross-tabulation (position by frequency)
Position Frequency Total
Less
than
once a
month
Once a
month
A few
times a
month
Once a
day
Several
times a
day
General 23 14 30 52 95 214

136
Employee 6.4% 3.9% 8.4% 14.6% 26.6% 59.9%
Mid-level
Manager
10
2.8%
3
0.8%
18
5.0%
38
10.6%
41
11.5%
110
30.8%
Top-level
Manager
2
0.6%
1
0.3%
6
1.7%
4
1.1%
20
5.6%
33
9.2%
Total 35
9.8%
18
5.0%
54
15.1%
94
26.3%
156
43.7%
357
100.0%
5.4.18 Cross-tabulation (position by usage)
Table 5.24 presents the cross-tabulation analysis of employees’ position by smart systems
usage. The findings revealed that about 39% of the respondents used smart systems
frequently. Of the 25% of the respondents who used smart systems extensively, 14% were
general employees, 8.4% were mid-level employees and 3.1% were top-level employees. A
total of 4.8% of respondents did not use any smart systems at all.
Table 5.24: Cross-tabulation (position by usage)
Position Usage Total
Not used
at all
Used
rarely
Used
quite
often
Used
frequently
Used
extensively
General
Employee
13
3.6%
23
6.4%
46
12.9%
82
23.0%
50
14.0%
214
59.9%
Mid-level
Manager
4
1.1%
12
3.4%
18
5.0%
46
12.9%
30
8.4%
110
30.8%
Top-level
Manager
0
0.0%
2
0.6%
9
2.5%
11
3.1%
11
3.1%
33
9.2%
Total 17
4.8%
37
10.4%
73
20.4%
139
38.9%
91
25.5%
357
100.0%

137
Figure 5.10: Extent of use by position
5.4.19 Cross-tabulation (position by application)
Table 5.25 is the cross-tabulation analysis of employees’ position by smart system
applications. Results show that a total of 16.2% of general employees use 2–3 different types
of smart system applications per day, while 15.4% use 3–4 types of applications per day.
Furthermore, 14% use 1–2 different types of applications per day.
Table 5.25: Cross-tabulation (position by application)
Position Application Total
None 1–2 2–3 3–4 5 &
above
General
Employee
14
3.9%
50
14.0%
58
16.2%
55
15.4%
37
10.4%
214
59.9%
Mid-level
Manager
5
1.4%
28
7.8%
26
7.3%
35
9.8%
16
4.5%
110
30.8%
Top-level
Manager
0
0.0%
10
2.8%
6
1.7%
6
1.7%
11
3.1%
33
9.2%
Total 19
5.3%
88
24.6%
90
25.2%
96
26.9%
64
17.9%
357
100.0%

138
5.4.20 Cross-tabulation (position by features)
Table 5.26 presents the cross-tabulation analysis for features by employees’ position. Shown
here is that at advanced features of smart systems were used moderately by both general
employees and mid-level employees. Results reveal that general employees tended to use
smart systems much more than any of the other respondent categories.
Table 5.26: Cross-tabulation (position by features)
Position Features Total
Not used
at all
Used
rarely
Used
quite
often
Used
frequently
Used
extensively
General
Employee
21
5.9%
43
12.0%
68
19.0%
63
17.6%
19
5.3%
214
59.9%
Mid-level
Manager
6
1.7%
23
6.4%
37
10.4%
36
10.1%
8
2.2%
110
30.8%
Top-level
Manager
2
0.6%
3
0.8%
14
3.9%
11
3.1%
3
0.3%
33
9.2%
Total 29
8.1%
69
19.3%
119
33.3%
110
30.8%
30
8.4%
357
100.0%
5.4.21 Cross-tabulation (ministry by time)
Table 5.27 presents the cross-tabulation analysis for the employees of each ministry by time
using smart systems. The results show that the majority of the respondents were employed by
the Ministry of Foreign Affairs (58.3%). Of those Ministry of Foreign Affairs employees,
22.1% spent more than 5 hours per week on smart systems, while 7.6% used the systems for
less than 1 hour. The Ministry of Economy had a total of 26.3% respondents in this study. Of
the Ministry of Economy employees, 11.5% used smart systems for more than 5 hours per
week, compared with 5.3% usage by the Ministry of Health.
Table 5.27: Cross-tabulation (ministry by time)
Ministry Time Total
Less
than 1
hour
1–2
hours
2–3
hours
3–4
hours
More
than 5
hours
Foreign 27 25 34 43 79 208

139
Affairs 7.6% 7.0% 9.5% 12.0% 22.1% 58.3%
Health 5
1.4%
3
0.8%
12
3.4%
16
4.5%
19
5.3%
55
15.4%
Economy 17
4.8%
3
0.8%
19
5.3%
14
3.9%
41
11.5%
94
26.3%
Total 49
13.7%
31
8.7%
65
18.2%
73
20.4%
139
38.9%
357
100.0%
5.4.22 Cross-tabulation (ministry by frequency)
According to Table 5.28, the findings show that 27.5% of the respondents from the Ministry
of Foreign Affairs used smart systems several times a day, while 10.1% from the Ministry of
Economy and 6.2% from the Ministry of Health used smart systems several times a day.
Results show that 14.3% of the respondents from the Ministry of Foreign Affairs used smart
systems once a day, while 7.0% of the respondents from the Ministry of Economy used smart
systems once a day and 5.0% of the respondents from the Ministry of Health used smart
systems once a day.
Table 5.28: Cross-tabulation (ministry by frequency)
Ministry Frequency Total
Less
than
once a
month
Once a
month
A few
times a
month
Once a
day
Several
times a
day
Foreign
Affairs
22
6.2%
11
3.1%
26
7.3%
51
14.3%
98
27.5%
208
58.3%
Health 1
0.3%
4
1.1%
10
2.8%
18
5.0%
22
6.2%
55
15.4%
Economy 12
3.4%
3
0.8%
18
5.0%
25
7.0%
36
10.1%
94
26.3%
Total 35
9.8%
18
5.0%
54
15.1%
94
26.3%
156
43.7%
357
100.0%
5.4.23 Cross-tabulation (ministry by usage)
Table 5.29 shows the cross-tabulation of ministry by usage. The results indicate that 21.3% of
respondents from the Ministry of Foreign Affairs used smart systems frequently, followed by
16.2% who used smart systems extensively and 12% who used smart systems quite often.
From the Ministry of Economy, 12.9% used smart systems frequently, while 5.6% used smart

140
systems extensively. From the Ministry of Health, 5% of respondents utilized smart systems
quite often and 4.8% did so frequently.
Table 5.29: Cross-tabulation (ministry by usage)
Ministry Usage Total
Not used
at all
Used
rarely
Used
quite
often
Used
frequently
Used
extensively
Foreign
Affairs
11
3.1%
20
5.6%
43
12.0%
76
21.3%
58
16.2%
208
58.3%
Health 1
0.3%
6
1.7%
18
5.0%
17
4.8%
13
3.6%
55
15.4%
Economy 5
1.4%
11
3.1%
12
3.4%
46
12.9%
20
5.6%
94
26.3%
Total 17
4.8%
37
10.4%
73
20.4%
139
38.9%
91
25.5%
357
100.0%
Figure 5.11: Extent of use by sector
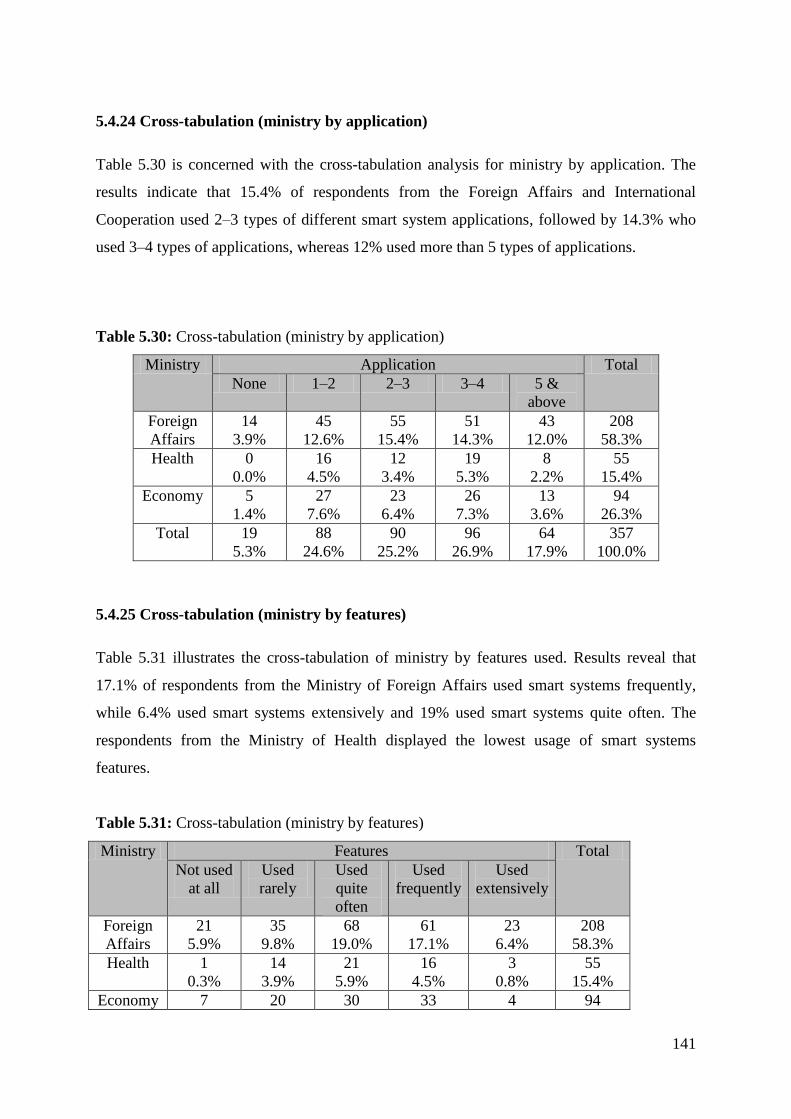
141
5.4.24 Cross-tabulation (ministry by application)
Table 5.30 is concerned with the cross-tabulation analysis for ministry by application. The
results indicate that 15.4% of respondents from the Foreign Affairs and International
Cooperation used 2–3 types of different smart system applications, followed by 14.3% who
used 3–4 types of applications, whereas 12% used more than 5 types of applications.
Table 5.30: Cross-tabulation (ministry by application)
Ministry Application Total
None 1–2 2–3 3–4 5 &
above
Foreign
Affairs
14
3.9%
45
12.6%
55
15.4%
51
14.3%
43
12.0%
208
58.3%
Health 0
0.0%
16
4.5%
12
3.4%
19
5.3%
8
2.2%
55
15.4%
Economy 5
1.4%
27
7.6%
23
6.4%
26
7.3%
13
3.6%
94
26.3%
Total 19
5.3%
88
24.6%
90
25.2%
96
26.9%
64
17.9%
357
100.0%
5.4.25 Cross-tabulation (ministry by features)
Table 5.31 illustrates the cross-tabulation of ministry by features used. Results reveal that
17.1% of respondents from the Ministry of Foreign Affairs used smart systems frequently,
while 6.4% used smart systems extensively and 19% used smart systems quite often. The
respondents from the Ministry of Health displayed the lowest usage of smart systems
features.
Table 5.31: Cross-tabulation (ministry by features)
Ministry Features Total
Not used
at all
Used
rarely
Used
quite
often
Used
frequently
Used
extensively
Foreign
Affairs
21
5.9%
35
9.8%
68
19.0%
61
17.1%
23
6.4%
208
58.3%
Health 1
0.3%
14
3.9%
21
5.9%
16
4.5%
3
0.8%
55
15.4%
Economy 7 20 30 33 4 94

142
2.0% 5.6% 8.4% 9.2% 1.1% 26.3%
Total 29
8.1%
69
19.3%
119
33.3%
110
30.8%
30
8.4%
357
100.0%
Figure 5.12: Extent of features used by sector
5.5 Reliability and Validity of the Study
The study used Cronbach’s alpha coefficient to indicate the construct’s reliability. The results
reveal that the alpha coefficients for all constructs were above .70, which is the standard
threshold of reporting construct reliability (Nunnally, 1978; Hair et al., 1998). This analysis
also used convergent and discriminant validity to measure the validity of the study
instruments. As shown in Table 5.32, all factor loadings range from 0.53 to 0.88, which are
adequate for the purposes of this study. The items under each construct were loaded heavily
within the defined constructs; this provides evidence for the constructs’ convergent validity.
Discriminant validity is considered to be adequate when constructs have an average variance
extracted (AVE) loading greater than 0.50, which means that at least 50% of the
measurement variance is captured by the constructs (Kim & Garrison, 2009). Table 5.32
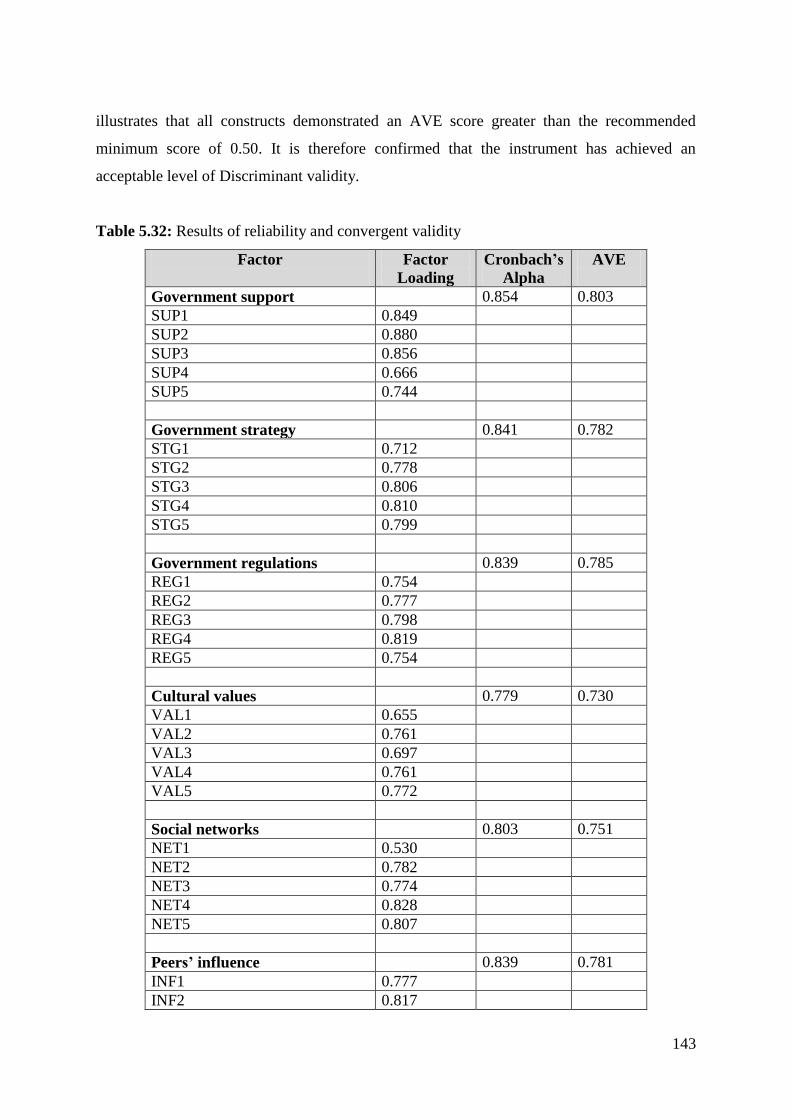
143
illustrates that all constructs demonstrated an AVE score greater than the recommended
minimum score of 0.50. It is therefore confirmed that the instrument has achieved an
acceptable level of Discriminant validity.
Table 5.32: Results of reliability and convergent validity
Factor
Factor
Loading
Cronbach’s
Alpha
AVE
Government support 0.854 0.803
SUP1 0.849
SUP2 0.880
SUP3 0.856
SUP4 0.666
SUP5 0.744
Government strategy 0.841 0.782
STG1 0.712
STG2 0.778
STG3 0.806
STG4 0.810
STG5 0.799
Government regulations 0.839 0.785
REG1 0.754
REG2 0.777
REG3 0.798
REG4 0.819
REG5 0.754
Cultural values 0.779 0.730
VAL1 0.655
VAL2 0.761
VAL3 0.697
VAL4 0.761
VAL5 0.772
Social networks 0.803 0.751
NET1 0.530
NET2 0.782
NET3 0.774
NET4 0.828
NET5 0.807
Peers’ influence 0.839 0.781
INF1 0.777
INF2 0.817

144
INF3 0.786
INF4 0.761
INF5 0.766
Technological readiness 0.887 0.830
TEC1 0.826
TEC2 0.878
TEC3 0.830
TEC4 0.831
TEC5 0.787
Training 0.897 0.842
TRA1 0.830
TRA2 0.862
TRA3 0.860
TRA4 0.830
TRA5 0.830
Managerial support 0.884 0.826
MAN1 0.817
MAN2 0.817
MAN3 0.835
MAN4 0.842
MAN5 0.819
Incentives 0.890 0.834
INC1 0.874
INC2 0.847
INC3 0.831
INC4 0.786
INC5 0.829
Perceived benefits 0.882 0.824
BEN1 0.820
BEN2 0.856
BEN3 0.837
BEN4 0.781
BEN5 0.827
Personal innovativeness 0.823 0.765
PNN1 0.798
PNN2 0.779
PNN3 0.809
PNN4 0.733
PNN5 0.703
Prior experience 0.847 0.787

145
EXP1 0.809
EXP2 0.810
EXP3 0.798
EXP4 0.792
EXP5 0.726
Enjoyment with innovation 0.830 0.771
ENJ1 0.805
ENJ2 0.666
ENJ3 0.807
ENJ4 0.787
ENJ5 0.785
Attitude towards innovation 0.865 0.807
ATT1 0.781
ATT2 0.799
ATT3 0.813
ATT4 0.847
ATT5 0.794
Adoption of smart system 0.851 0.797
ADO1 0.781
ADO2 0.786
ADO3 0.848
ADO4 0.747
ADO5 0.820
Cost effectiveness 0.815 0.758
COS1 0.805
COS2 0.744
COS3 0.751
COS4 0.753
COS5 0.735
Organizational efficiency 0.835 0.776
EFF1 0.763
EFF2 0.736
EFF3 0.784
EFF4 0.829
EFF5 0.768
Loyalty to the organization 0.830 0.772
LOY1 0.733
LOY2 0.774
LOY3 0.781
LOY4 0.799
LOY5 0.774

146
Enhanced service quality 0.844 0.785
QUA1 0.749
QUA2 0.734
QUA3 0.835
QUA4 0.797
QUA5 0.807
Reputational development 0.844 0.786
RED1 0.774
RED2 0.801
RED3 0.813
RED4 0.730
RED5 0.813
Better relationships with
customers 0.843 0.824
REL1 0.811
REL2 0.856
REL3 0.818
REL4 0.813
AVE= Average variance extracted
5.6 Inter-correlations Among Study Variables
The study examined the relationships existing between two or more variables in the model.
The purpose of this analysis is to explore whether there is any primary evidence for
relationships between the variables. The results will then be used as the basis for further
investigation, such as regression. The correlations analysis among all research variables is
presented in Table 5.33. Pearson’s correlation coefficients (r) of the variables were significant
at the 0.01 level. In the analysis, the correlation matrix table shows there is a significant
positive correlation between the dependent and independent variables.
Table 5.33 also shows that attitude is significantly and positively related to three political
drivers: government support (r=.497, p<.01), government strategy (r=.439, p<.01) and
government regulations (r=.469, p<.01). It is evident that level of attitude is significantly and
positively related to three social factors: cultural values (r=.486, p<.01), social network
(r=.428, p<.01) and peers’ influence (r=.490, p<.01). Attitude is also significantly and
positively related to four technological orientation factors: technological readiness (r=.441,
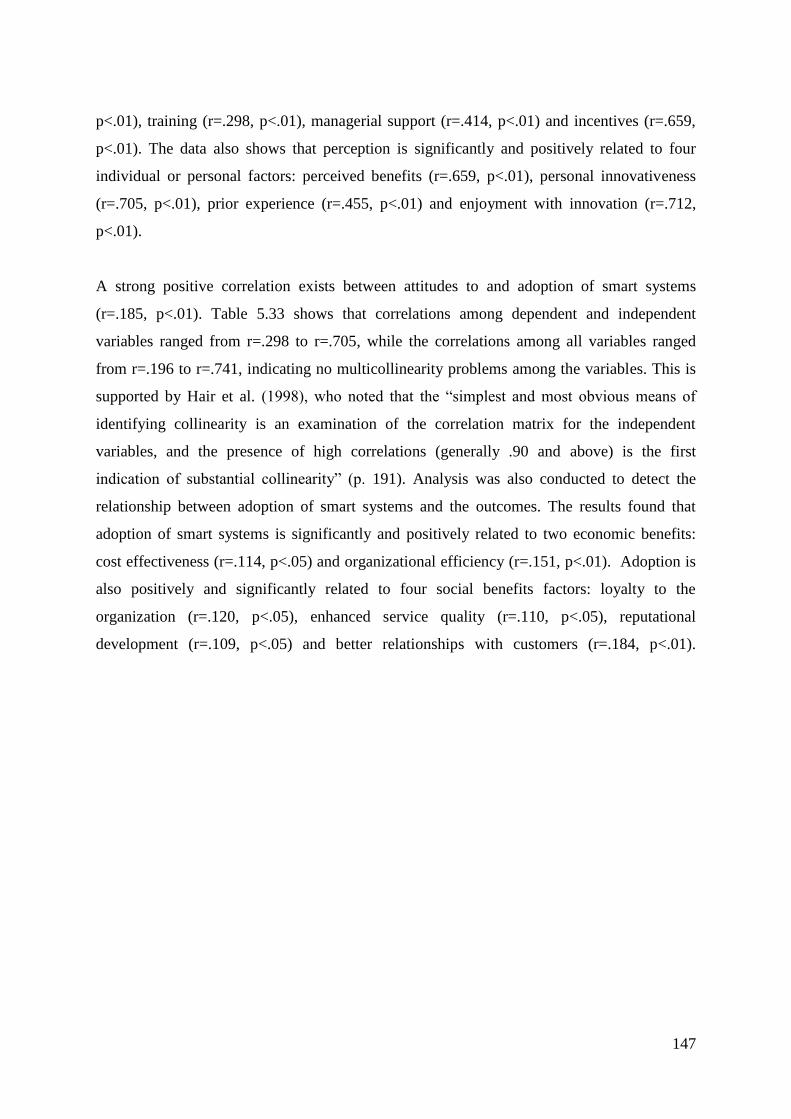
147
p<.01), training (r=.298, p<.01), managerial support (r=.414, p<.01) and incentives (r=.659,
p<.01). The data also shows that perception is significantly and positively related to four
individual or personal factors: perceived benefits (r=.659, p<.01), personal innovativeness
(r=.705, p<.01), prior experience (r=.455, p<.01) and enjoyment with innovation (r=.712,
p<.01).
A strong positive correlation exists between attitudes to and adoption of smart systems
(r=.185, p<.01). Table 5.33 shows that correlations among dependent and independent
variables ranged from r=.298 to r=.705, while the correlations among all variables ranged
from r=.196 to r=.741, indicating no multicollinearity problems among the variables. This is
supported by Hair et al. (1998), who noted that the “simplest and most obvious means of
identifying collinearity is an examination of the correlation matrix for the independent
variables, and the presence of high correlations (generally .90 and above) is the first
indication of substantial collinearity” (p. 191). Analysis was also conducted to detect the
relationship between adoption of smart systems and the outcomes. The results found that
adoption of smart systems is significantly and positively related to two economic benefits:
cost effectiveness (r=.114, p<.05) and organizational efficiency (r=.151, p<.01). Adoption is
also positively and significantly related to four social benefits factors: loyalty to the
organization (r=.120, p<.05), enhanced service quality (r=.110, p<.05), reputational
development (r=.109, p<.05) and better relationships with customers (r=.184, p<.01).


149
Table 5.33: Inter-correlations among study variables
Study
Variables 1 2 3 4 5 6 7 8 9 10 11 12 13 14 15
1. SUP 1
2. STR .698** 1
3. REG .672** .804** 1
4. VAL .533** .553** .564** 1
5. NET .593** .573** .552** .456** 1
6. PEE .626** .637** .632** .462** .688** 1
7. REA .491** .510** .485** .358** .522** .539** 1
8. TRA .391** .438** .411** .235** .516** .489** .723** 1
9. MAN .497** .459** .442** .353** .546** .517** .768** .740** 1
10. INC .479** .472** .456** .518** .475** .616** .618** .496** .588** 1
11. BEN .465** .499** .489** .526** .501** .599** .574** .455** .534** .810** 1
12. INN .491** .488** .502** .483** .402** .445** .387** .279** .361** .562** .592** 1
13. EXP .386** .355** .357** .264** .535** .410** .480** .511** .560** .487** .418** .470** 1
14. ENJ .473** .468** .491** .465** .406** .472** .457** .312** .426** .617** .633** .741** .390** 1
15. ATT .497** .439** .469** .486** .428** .490** .441** .298** .414** .659** .659** .705** .455** .712** 1
Legend: SUP=Support, STR=Strategy, REG=Regulation, VAL=Values, NET=Network, PEE=Peers, REA=Readiness, TRA=Training,
MAN=Managerial Support, INC=Incentives, BEN=Benefits, INN=Innovativeness, EXP=Experience, ENJ=Enjoyment and ATT=Attitude.
**. Correlation is significant at the 0.01 level (2-tailed).
*. Correlation is significant at the 0.05 level (2-tailed).
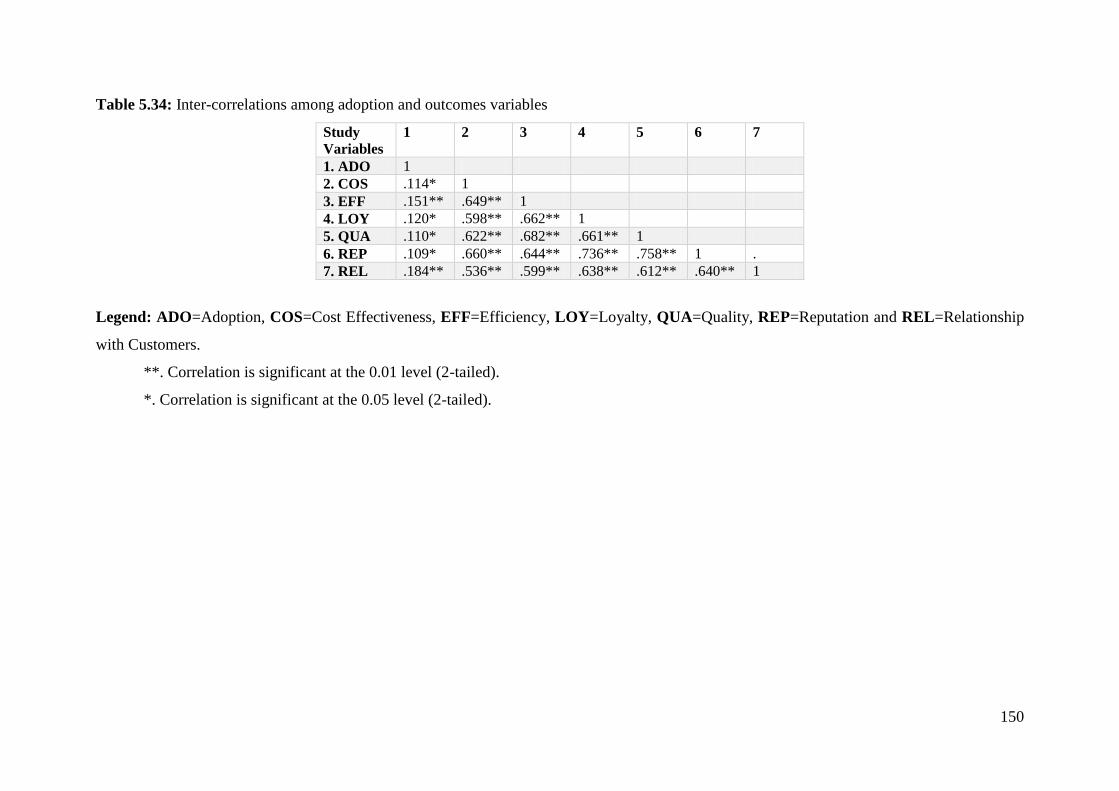
150
Table 5.34: Inter-correlations among adoption and outcomes variables
Study
Variables
1 2 3 4 5 6 7
1. ADO 1
2. COS .114* 1
3. EFF .151** .649** 1
4. LOY .120* .598** .662** 1
5. QUA .110* .622** .682** .661** 1
6. REP .109* .660** .644** .736** .758** 1 .
7. REL .184** .536** .599** .638** .612** .640** 1
Legend: ADO=Adoption, COS=Cost Effectiveness, EFF=Efficiency, LOY=Loyalty, QUA=Quality, REP=Reputation and REL=Relationship
with Customers.
**. Correlation is significant at the 0.01 level (2-tailed).
*. Correlation is significant at the 0.05 level (2-tailed).

151
5.7 Regression Analysis
The model developed for this research helps to improve theoretical foundations and to
promote management awareness of, understanding of and support for smart system adoption
in the UAE. A multiple regression analysis provided an objective means of assessing the
predictive power of a set of independent variables included in the conceptual model. Each
independent variable was weighted by the regression analysis to ensure maximum prediction
from the set of independent variables. The weights denote the relative contribution of the
independent variables and facilitate interpretations that influence each variable in the research
model.
In this research, the following 14 variables were classified as independent variables:
government support, government strategy, government regulations, cultural values, social
network, peers’ influence, technological readiness, training, managerial support, incentives,
perceived benefits, personal innovativeness, prior experience and enjoyment with innovation.
The sample of 357 observations meets the proposed guideline for the ratio of observations to
independent variables (15 to 1) as stated by Hair et al. (1998, p.166). This sample ensures that
there will be no danger of over-fitting the results, and does in fact validate the results, thus
ensuring the findings’ generalizability.
The primary data was tested to observe whether there were any serious violations of the
assumptions that could be detected and corrected. The research tested several assumptions for
the variables, these being: linearity, outliers, normality, multicollinearity, homoscedasticity,
heteroscedasticity and independence of residuals. Scatterplots of the individual variables did
not indicate any non-linear relationships between the dependent and independent variables. A
multicollinearity test confirms there is no problem with multicollinearity.
With the regression analysis specified in terms of dependent and independent variables, the
sample is regarded as adequate, and the assumptions for the individual variables are met. An
estimate of the regression model and an assessment of the overall model fit were then made.
The results of the study are shown in Table 5.35. The results show that r-square (R²) is the
correlation coefficient squared (R²=.652), which is also known as the coefficient of
determination. The R² value indicates the percentage of total variation of Y (dependent

152
variables) that is explained by the independent variables. In this analysis, 65.2% of the
variation in people’s adoption of smart systems can be explained by government support,
government strategy, government regulation, cultural values, social network, peers’
influence, technological readiness, training, managerial support, incentive, perceived benefits,
personal innovativeness, prior experience and enjoyment with innovation. Prior research
suggests that an R² of .15 indicates moderate variance and an R² of .35 indicates a large
amount of variance (Cohen, 1988 as cited in Ahuja & Thatcher, 2005, p. 450). The standard
error of the estimate is another measure of the predictions’ accuracy, which represents an
estimate of the standard deviation of the actual dependent values around the regression line.
Furthermore, results of Durbin-Watson statistics inform us that there is no problem regarding
autocorrelation. As a rule of thumb, values of less than 1 or greater than 3 are definitely cause
for concern (Field, 2005, p. 189). For this study’s data, the value is 1.923, so the assumption
has been met. Table 5.35 summarizes the model.
Table 5.35: Regression model summary
Model R R-Square Adjusted R-
Square
Std Error of
the Estimate
Durbin-
Watson
1 .807a .652 .638 .60186767 1.923
The analysis of variance (ANOVA) outputs tells us whether the model does significantly
predict the outcome. In ANOVA, F-test represents the contribution to prediction accuracy as
a result of fitting the model relative to the inaccuracy that may exist in it. The analysis shows
the model is a significantly better predictor of dependent variables than the intercept alone: F
(10, 264)=29.912, p<0.001. Based on the analysis, it can be concluded that the model is
significant (p<0.001) in predicting the dependent variables.
Table 5.37 summarizes the results of coefficients indicating B-values (unstandardized
coefficient) and the level of significance of each independent variable in the model predicting
the dependent variables. Unstandardized coefficient B-values indicate the individual
contribution of each predictor to the model. The statistically significant variables impacting
on people’s perceptions of smart systems are: government support, training, incentives,
perceived usefulness, personal innovativeness, experience and enjoyment. The variables such
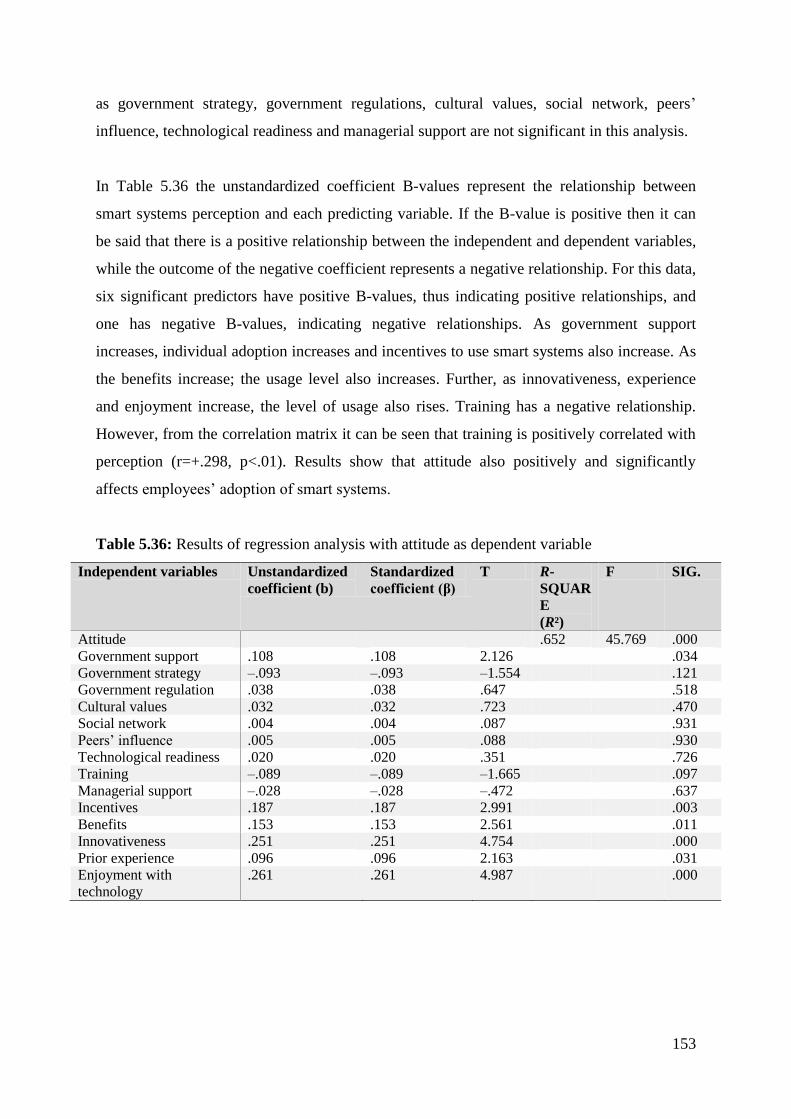
153
as government strategy, government regulations, cultural values, social network, peers’
influence, technological readiness and managerial support are not significant in this analysis.
In Table 5.36 the unstandardized coefficient B-values represent the relationship between
smart systems perception and each predicting variable. If the B-value is positive then it can
be said that there is a positive relationship between the independent and dependent variables,
while the outcome of the negative coefficient represents a negative relationship. For this data,
six significant predictors have positive B-values, thus indicating positive relationships, and
one has negative B-values, indicating negative relationships. As government support
increases, individual adoption increases and incentives to use smart systems also increase. As
the benefits increase; the usage level also increases. Further, as innovativeness, experience
and enjoyment increase, the level of usage also rises. Training has a negative relationship.
However, from the correlation matrix it can be seen that training is positively correlated with
perception (r=+.298, p<.01). Results show that attitude also positively and significantly
affects employees’ adoption of smart systems.
Table 5.36: Results of regression analysis with attitude as dependent variable
Independent variables Unstandardized
coefficient (b)
Standardized
coefficient (β)
T R-
SQUAR
E
(R²)
F SIG.
Attitude .652 45.769 .000
Government support .108 .108 2.126 .034
Government strategy –.093 –.093 –1.554 .121
Government regulation .038 .038 .647 .518
Cultural values .032 .032 .723 .470
Social network .004 .004 .087 .931
Peers’ influence .005 .005 .088 .930
Technological readiness .020 .020 .351 .726
Training –.089 –.089 –1.665 .097
Managerial support –.028 –.028 –.472 .637
Incentives .187 .187 2.991 .003
Benefits .153 .153 2.561 .011
Innovativeness .251 .251 4.754 .000
Prior experience .096 .096 2.163 .031
Enjoyment with
technology
.261 .261 4.987 .000

154
Table 5.37: Results of regression analysis with adoption as dependent variable
Independent
variables
Unstandardized
coefficient (b)
Standardized
coefficient (β)
T R-
SQUARE
(R²)
F SIG.
Usage .034 12.557 .000
Attitude .185 .185 3.544 .000
5.7.1 Outcome variables
An analysis was conducted to establish the impact of adopting smart systems on the
economic and social benefits of working in the organizations. The results of the study are
shown in Table 5.38. They reveal that all six variables – cost effectiveness, efficiency, loyalty
to the organization, quality of the service, reputation and relationships with customers – are
significant.
Table 5.38: Results of regression analysis with adoption as independent variable
Independent
variables
Unstandardized
coefficient (b)
Standardized
coefficient (β)
T R-
SQUARE
(R²)
F SIG.
Cost effectiveness .114 .114 2.161 .013 4.672 .031
Efficiency .151 .151 2.879 .023 8.287 .004
Loyalty .120 .120 2.282 .014 5.207 .023
Quality .110 .110 2.081 .012 4.332 .038
Reputation .109 .109 2.067 .012 4.272 .039
Relationship .183 .183 3.512 .034 12.337 .001
5.8 Checking Assumptions
Results from the statistical analysis for checking assumptions demonstrate that there were no
problems regarding outliers or multicollinearity, and, furthermore, that no autocorrelation
exists. The study analyzed the plot of standardized residuals against standardized predicted
values – the histogram and the normal probability plot of the residuals. The scatterplots show
relationships between predicted values of dependent variables and residuals. This plot makes
it possible to test linearity and homoscedasticity of residual assumptions. The graph should
look like a random array of dots evenly dispersed around zero. Any sort of curve in this graph
will indicate that the chances are that the data has broken the assumption of linearity. Figure
5.13 plots the standardized residuals against standardized predicted values. The points are
randomly and evenly dispersed throughout, and most of these points are evenly dispersed
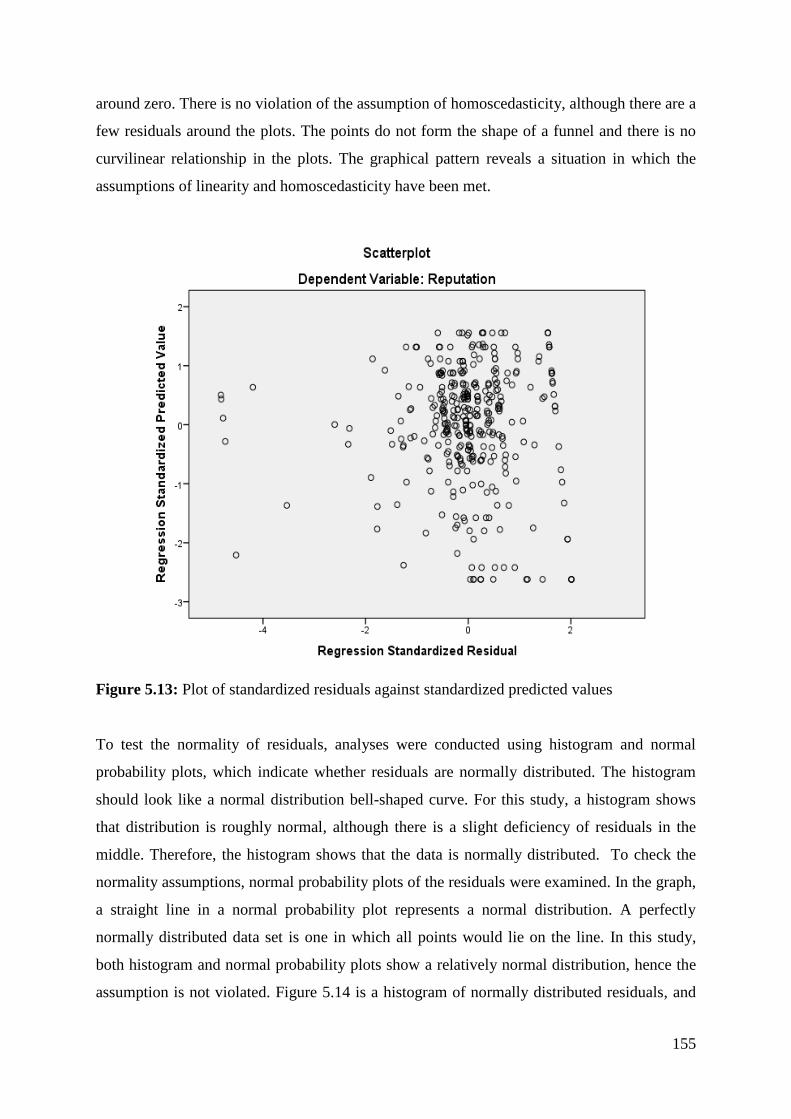
155
around zero. There is no violation of the assumption of homoscedasticity, although there are a
few residuals around the plots. The points do not form the shape of a funnel and there is no
curvilinear relationship in the plots. The graphical pattern reveals a situation in which the
assumptions of linearity and homoscedasticity have been met.
Figure 5.13: Plot of standardized residuals against standardized predicted values
To test the normality of residuals, analyses were conducted using histogram and normal
probability plots, which indicate whether residuals are normally distributed. The histogram
should look like a normal distribution bell-shaped curve. For this study, a histogram shows
that distribution is roughly normal, although there is a slight deficiency of residuals in the
middle. Therefore, the histogram shows that the data is normally distributed. To check the
normality assumptions, normal probability plots of the residuals were examined. In the graph,
a straight line in a normal probability plot represents a normal distribution. A perfectly
normally distributed data set is one in which all points would lie on the line. In this study,
both histogram and normal probability plots show a relatively normal distribution, hence the
assumption is not violated. Figure 5.14 is a histogram of normally distributed residuals, and

156
Figure 5.15 shows a normal probability-probability (P-P) plot of regression standardized
residuals for this study.
Figure 5.14: Histogram of normally distributed residuals

157
Figure 5.15: Normal P-P plot of regression standardized residuals
5.9 Discussion of the Hypothesis Testing
As mentioned previously, a regression analysis was conducted to examine 14 hypotheses.
The details of the hypotheses testing are discussed in more detail below.
5.9.1 Hypotheses 1, 2 and 3
Three hypotheses were proposed to assess the impact of political drivers on the attitudes and
adoption of smart systems by employees in the UAE, as follows:
H1: Government support has an impact on the attitude towards smart system adoption in the
UAE.
H2: Government strategy has an impact on the attitude towards smart system adoption in the
UAE.
H3: Government regulations have an impact on the attitude towards smart system adoption in
the UAE.

158
Results show that only government support significantly affects attitudes regarding the
adoption of smart systems. The other two factors – government strategy and government
regulations – do not significantly affect attitudes concerning adoption of smart systems.
Employees might feel that government support is essential, and that it is enough to motivate
employees to adopt an innovation. In the development of any sort of regulations and policies
regarding smart system adoption, it might not be necessary to require employees to adopt a
new system; as long as there is ample support that is financial, technological and motivational
in nature, employees may be willing to adopt the smart system without being required to do
so.
5.9.2 Hypotheses 4, 5 and 6
The following three hypotheses are concerned with the impact of social factors on
employees’ attitudes towards smart system adoption:
H4: Cultural values have an impact on the attitude to smart system adoption in the UAE.
H5: Social networks have an impact on the attitude to smart system adoption in the UAE.
H6: Peers’ influence has an impact on the attitude to smart system adoption in the UAE.
Results of the regression analysis presented in Table 5.40 indicate that the impacts of cultural
values, social network and peers’ influence are not statistically significant, so these
hypotheses are not supported in the model. While it is difficult to comprehend why this was
the case, one contributor could be that the UAE is a multicultural society with 92% of its
population consisting of foreign nationals. Therefore, culture does not affect the day-to-day
workplace environment. The UAE still has a low level of internet usage; therefore,
employees are not much influenced by social media and social networks like Facebook, and
Twitter, etc... The non-significance of peers’ influence can be attributed to the workplace
environment in each ministry, where most employees operate independently and interactive
conversation between staff may not occur as frequently compared with private sector
organizations. In contrast, private sector organizations often keep their office spaces open so
that individual employees can interact and communicate with colleagues.
5.9.3 Hypotheses 7, 8, 9 and 10
Four hypotheses were designed to ascertain the impact of technological orientation on
attitudes towards smart system adoption as follows:

159
H7: Technological readiness has an impact on the attitude to smart system adoption in the
UAE.
H8: Training has an impact on the attitude to smart system adoption in the UAE.
H9: Managerial support has an impact on the attitude to smart system adoption in the UAE.
H10: Incentives have an impact on the attitude to smart system adoption in the UAE.
Results show that two factors – training and incentives – are statistically significant. It is true
in the work environment that, as incentives increase, individual adoption and usage levels
also rise. Incentives positively influence the adoption and usage of any new technology.
Training assists individuals in how to use new technology. Two other factors – technological
readiness and managerial support – are not significant. Currently, government offices in the
UAE are equipped with modern and sophisticated technologies; therefore, technological
readiness may not be an important issue for employees. As we saw previously, government
support is significant; many employees may think that managerial support is not necessary
while there is ample support at the government level. Employees may also consider that the
government can support employees better than lower level management.
5.9.4 Hypotheses 11, 12, 13 and 14
The following four hypotheses were developed to test the impact of personal factors in
attitudes towards the adoption of smart systems in the UAE:
H11: Perceived usefulness has an impact on the attitude to smart system adoption in the
UAE.
H12: Personal innovativeness has an impact on the attitude to smart system adoption in the
UAE.
H13: Prior experience has an impact on the attitude to smart system adoption in the UAE.
H14: Enjoyment of innovation has an impact on the attitude to smart system adoption in the
UAE.
Results show that personal factors significantly affect attitudes towards smart system
adoption. Perceived benefits or usefulness by individual employees are associated with the
rise in innovation usage. The willingness of an individual to experiment with new technology
increases the rate of adoption. Individuals who are innovative normally try out new things
160
and are willing to experiment with new technology. In the UAE, employees tend to accept an
innovation if they enjoy using it.
5.9.5 Hypothesis 15
H15: Attitude to smart system has an impact on the adoption of smart system in the UAE.
This hypothesis was designed to examine if an employee’s attitude impacts on the acceptance
of smart systems and their usage. The findings show that there is a strong relationship
between attitude and usage behavior, consistent with previous research findings (Talukder,
2011; Davis, 1989; Taylor & Todd, 1995; Lam et al., 2007; Al-Gahtani & King, 1999).
5.9.6 Hypotheses 16, 17, 18, 19, 20 and 21
H16: Adoption of smart systems has an impact on cost effectiveness in UAE organizations.
H17: Adoption of smart systems has an impact on organizational efficiency.
H18: Adoption of smart systems has an impact on loyalty to UAE organizations.
H19: Adoption of smart systems has an impact on service quality of the UAE organization.
H20: Adoption of smart systems has an impact on the reputation of UAE organizations.
H21: Adoption of smart systems has an impact on better customer relationships of UAE
organizations.
Six hypotheses were developed to test the impact of the adoption of smart systems on
economic and social benefits for organizations. They are cost effectiveness, organizational
efficiency, loyalty to the organization, enhanced service quality, reputational development
and better relationships with customers of the organization. The results show that adoption of
smart systems does significantly affect these variables in the UAE. The use of smart systems
curtails operational costs. Smart systems usage also reduces the numbers of employees,
which ultimately is a huge saving to the organization. Smart systems also enable
organizations to respond quickly and efficiently to customers. Results show that these factors
were significant, which means that an organization that adopts smart systems creates
customer loyalty because services are improved. Service quality is also enhanced by
providing prompt services to customers, which consequently enhances the reputation of the
organization as a good, reliable and efficient institution. Smart systems also help
organizations to develop better and closer relationships with customers. Information, policies
and procedures can be communicated quickly and efficiently.
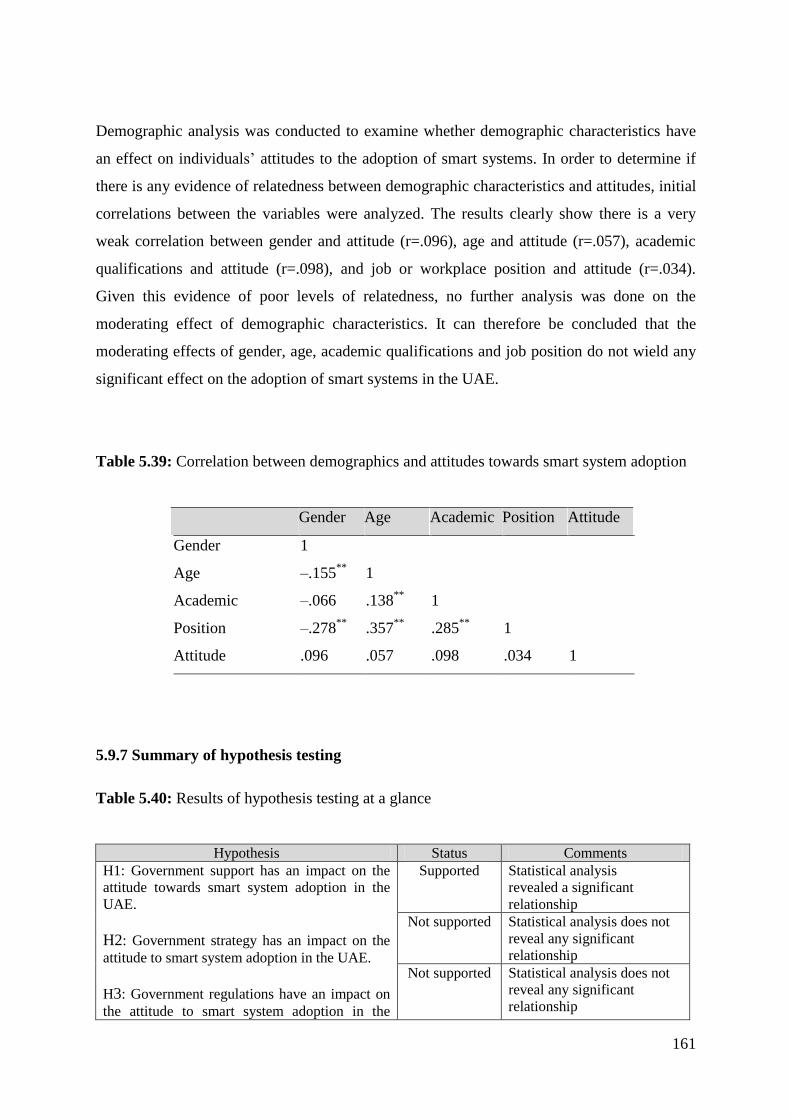
161
Demographic analysis was conducted to examine whether demographic characteristics have
an effect on individuals’ attitudes to the adoption of smart systems. In order to determine if
there is any evidence of relatedness between demographic characteristics and attitudes, initial
correlations between the variables were analyzed. The results clearly show there is a very
weak correlation between gender and attitude (r=.096), age and attitude (r=.057), academic
qualifications and attitude (r=.098), and job or workplace position and attitude (r=.034).
Given this evidence of poor levels of relatedness, no further analysis was done on the
moderating effect of demographic characteristics. It can therefore be concluded that the
moderating effects of gender, age, academic qualifications and job position do not wield any
significant effect on the adoption of smart systems in the UAE.
Table 5.39: Correlation between demographics and attitudes towards smart system adoption
Gender Age Academic Position Attitude
Gender 1
Age –.155**
1
Academic –.066 .138**
1
Position –.278**
.357**
.285**
1
Attitude .096 .057 .098 .034 1
5.9.7 Summary of hypothesis testing
Table 5.40: Results of hypothesis testing at a glance
Hypothesis Status Comments H1: Government support has an impact on the
attitude towards smart system adoption in the
UAE.
H2: Government strategy has an impact on the
attitude to smart system adoption in the UAE.
H3: Government regulations have an impact on
the attitude to smart system adoption in the
Supported Statistical analysis
revealed a significant
relationship
Not supported Statistical analysis does not
reveal any significant
relationship
Not supported Statistical analysis does not
reveal any significant
relationship

162
UAE.
H4: Cultural values have an impact on the
attitude to smart system adoption in the UAE.
H5: Social networks have an impact on the
attitude to smart system adoption in the UAE.
H6: Peers’ influence has an impact on the
attitude to smart system adoption in the UAE.
Not supported Significant relationship was
not found
Not supported No significant relationship is
established
Not supported Statistical analysis does not
reveal any significant
relationship
H7: Technological readiness has an impact on
the attitude to smart system adoption in the
UAE.
H8: Training has an impact on the attitude to
smart system adoption in the UAE.
H9: Managerial support has an impact on the
attitude to smart system adoption in the UAE.
H10: Incentives have an impact on the attitude
to smart system adoption in the UAE.
Not supported Not significant
Supported Statistical analysis revealed a
significant relationship Not supported Statistical analysis does not
reveal any significant
relationship
Supported Statistical analysis
revealed a significant
relationship
H11: Perceived usefulness has an impact on the
attitude to smart system adoption in the UAE.
H12: Personal innovativeness has an impact on
the attitude to smart system adoption in the
UAE.
H13: Prior experience has an impact on the
attitude to smart system adoption in the UAE.
H14: Enjoyment of innovation has an impact on
the attitude to smart system adoption in the
UAE.
Supported Significant relationship is
established
Supported Statistical analysis
revealed a significant
relationship
Supported Significant relationship is
established
Supported Statistical analysis
revealed a significant
relationship
H15: Adoption of smart systems has an impact
on cost effectiveness in UAE organizations.
Supported Significant relationship is
established
H16: Adoption of smart systems has an impact
on organizational efficiency.
Supported Significant relationship is
established
H17: Adoption of smart systems has an impact
on loyalty to UAE organizations.
Supported Statistical analysis
revealed a significant
relationship
H18: Adoption of smart systems has an impact
on service quality of the UAE organization.
Supported Significant relationship is
established
H19: Adoption of smart systems has an impact Supported Statistical analysis

163
on the reputation of UAE organizations. revealed a significant
relationship
H20: Adoption of smart systems has an impact
on better customer relationships of UAE
organizations.
Supported Significant relationship is
established
5.10 Conclusion
This chapter discussed empirical testing on the proposed model of smart system adoption in
the UAE. The conceptual model was developed by integrating the constructs of the theory of
reasoned action (TRA), the technology acceptance model (TAM) and the unified theory of
acceptance and use of technology (UTAUT) and introducing several modifications. Statistical
analysis shows that the proposed conceptual model contributes to a better understanding of
the factors that drive employees’ acceptance of technological innovation in the workplace.
The empirical study showed the effects of political, social, technological and personal factors
on people’s acceptance of smart systems. Three political factors – namely, government
support, government strategy and government regulations – were incorporated into the model
because external factors had been found to affect attitudes about innovation and its
acceptance. Empirical findings revealed that only one variable – government support –
significantly affected individual attitudes towards smart adoption and usage.
Three cultural factors – cultural values, social networks and peers’ influence – were
incorporated into the model because in previous studies they had been shown to influence
employees’ attitudes towards smart system adoption and usage. Results show that none of
these variables did significantly affect employees’ attitudes towards smart system adoption
and acceptance. On this theme, four variables – technological readiness, training, managerial
support and incentives – were incorporated into the model. Results also reveal that training
and incentives significantly affected employees’ attitudes towards smart system adoption and
acceptance.
Four personal factors – perceived usefulness, personal innovativeness, prior experience and
enjoyment of innovation – were incorporated into the model because they had been found to
influence employees’ attitudes towards smart system adoption and usage. The findings of this
164
study reveal that all of these variables were statistically significant. Six outcome variables –
cost effectiveness, organizational efficiency, loyalty to the organization, enhanced service
quality, reputational development and better relationships with customers – were
incorporated into the model. Results confirm that all of these variables do significantly affect
attitudes towards smart system adoption and acceptance. Finally, demographics variables
were tested to establish whether they have any impact on attitudes towards smart system
adoption. Results indicate demographic characteristics had no significant effect.
The next chapter forms the conclusion of this thesis, and comments on the findings of the
study, research implications, limitations and possible areas for future studies to cover.
165
CHAPTER SIX
DATA ANALYSIS AND DISCUSSION: STRUCTURAL
EQUATION MODELING
6.1 Introduction
This chapter analyzed the data using structural equation modeling. A confirmatory factor
analysis (CFA) is performed to validate the proposed research model ‘Smart System
Adoption’ in the measurement model and structural model. As Hair et al. (2016) stated that
no valid conclusions exists without valid measurement. After the omission irrelevant items,
the hypotheses are tested in the structural model. In terms of measurement model, CFA can
accomplished on a single construct or all the constructs at a time concurrently (Cheng, 2001).
In this section, CFA is run individually for both existing scale to ensure the individual
measurement model. Following, the specific individual measurement model of each
constructs is run together for first order model before proceeding to the structural model
analysis.
6.1.1 Political Drivers
In terms of modification indices (MI) analysis, CFA findings identified that the three-factor
measurement model fits the data very well after the three iterations. In the first iteration,
several criteria of model fit index, namely CFI, GFI and AGFI achieved the accepted level
but not the required threshold point. In this measurement model of ‘political drivers’, item
sup2 and item sta2 are deleted for their lower factor loading of less than 0.60. After deleting
the items, the model fit of the second iteration is better than the first iteration. In addition,
based on the standard residual value, three items are deleted reg1, sta3 and sta4, as the
standard residual covariance is greater than 2.50. Now, the following model fit indices are
achieved and good in the third iteration: CMIN/df= 2.699 (less than 3, significant p at 0.05),
RMSEA= 0.069, CFI= 0.970, GFI= 0.952 and AGFI= 0.917 (Table 6.1).

166
Table 6.1: Goodness-of-fit measures of political drivers
Model fit Iteration 1
(Values)
Iteration 2
(Deleted sup2,
sta2)
Iteration 3
(Deleted reg1,
sta3, sta4)
P-value>0.05 0.000* 0.000* 0.000*
CMIN/df<3.0 2.134 2.378 2.699
RMSEA<0.08 0.083 0.048 0.069
CFI>0.90 0.925 0.952 0.970
GFI>0.90 0.892 0.932 0.952
AGFI>0.90 0.889 0.913 0.917
Note: *Significant at 0.01 level, CMIN/df= minimum discrepancy, RMSEA= Root means
square error of approximation, CFI= Comparative fit index, GFI= Goodness of fit index,
AGFI= Adjusted goodness of fit index.
Table 6.2 shows the regression weights of the measurement model of political drivers. Byrne
(2001) suggested that uniimensionality is further confirmed when all items presented positive
directions and were statistically significant at 0.001. In this study, all items are significantly
related to their latent variables as summarized in Table 6.2.
Table 6.2: Political drivers Regression Weights: (Group number 1 - Default model)
Relationship Estimate S.E. C.R. P
Support5 <--- Gsu 1.000
Support3 <--- Gsu 1.123 0.079 14.147 ***
Support2 <--- Gsu 1.204 0.081 14.843 ***
Support1 <--- Gsu 1.198 0.085 14.103 ***
Strategy5 <--- Gst 1.000
Strategy1 <--- Gst 0.936 0.075 12.551 ***
Regulations5 <--- Gre 1.000
Regulations4 <--- Gre 1.029 0.080 12.882 ***
Regulations3 <--- Gre 0.985 0.078 12.707 ***
Regulations2 <--- Gre 0.888 0.074 11.998 ***

167
Note: *** (Regression weight of the prediction between the items is significantly different
from zero at the 0.001 level (two-tailed). Gsu= Government Support, Gst= Government
Strategy, Gre= Government Regulations, SE= Standard error, CR= Critical ratio.
In terms of reliability, discriminant and convergent validity, Table 6.3 indicates that the
composite reliability of three political drivers dimensions are above the cut-off point (greater
than 0.60) and ranged from 0.655 to 0.872. As well, all the average variance extracted values
are greater than 0.50 with the exception of the dimension of government strategy. However, it
is retained for further analysis because the factor loadings of the items are above 0.50. In this
study, AVE is above 0.50 and CR is 0.60 which reflect convergent validity and discriminant
validity.
Table 6.3: Political drivers CR and AVE
Items SRW SMC Average Variance
Extracted (AVE)
Composite
Reliability (CR)
Government Support 0.631 0.872
Support1 0.804 0.647
Support2 0.852 0.726
Support3 0.807 0.651
Support5 0.708 0.501
Government Strategy 0.487 0.655
Strategy1 0.702 0.492
Strategy5 0.694 0.481
Government Regulations 0.528 0.817
Regulations2 0.700 0.490
Regulations3 0.745 0.555
Regulations4 0.757 0.573
Regulations5 0.704 0.496
Note: SRW (Standard regression weight), SMC (Squared multiple correlations).

168
Figure 6.1 illustrates the first order individual measurement model of political drivers. In this
model, the goodness-of-fit index shows that all measurement criteria (chi-
square/df=86.368/32, normed chi-square= 2.699, root means square error approximation=
0.069, comparative fit index= 0.970, goodness of-fit-index= 0.952 and adjusted goodness-of-
fit-index= 0.917) achieved the required level after the third iteration. The Government
strategy dimension consist of only two items these being sta1 and sta5. It is, however,
retained since both items are significant (Hair et al., 2016).
Figure 6.1: Political drivers: 1st order measurement model after 3nd iteration
Note: Gsu= Government Support, Gst= Government Strategy, Gre= Government
Regulations, SE= Standard error, CR= Critical ratio. CMIN/df= minimum discrepancy,
RMSEA= Root means square error of approximation, CFI= Comparative fit index, GFI=
Goodness-of-fit-index, AGFI= Adjusted goodness-of-fit-index.

169
6.1.2 Social Infleunce
According to modification indices (MI), the model fit of the first iteration is CIMN/df=
7.043, significant p-value at 0.05 level, RMSEA= 0.130, CFI= 0.783, GFI= 0.805, AGFI=
0.73, which do not achieve the required level. Thus, the items net3 and val1 are deleted
because the factor loading (standard regression weight) is less than 0.60. The model fit of the
second iteration is improved after respecification: CIMN/DF= 04.608, RMSEA= 0.089, CFI=
0.902, GFI= 0.902, AFGI= 0.910. Additionally, inf1, val3 and net1 are deleted as the
standardized residual covariance is greater than 2.50. The third iteration demonstrated
excellent goodness-of-fit measurement model fit as follows: CIMN/df= 0.2.532, significant
p-value at 0.05, RMSEA= 0.2.532, CFI= 0.066, FGI= 0.954, AGFI= 0.921 (see Table 6.4 and
Figure 6.2).
Table 6.4: Goodness-of-fit measures of social influence
Model fit Iteration 1
(Values)
Iteration 2
(Deleted net3,
val1)
Iteration 3
(Deleted inf1,
val3, net1)
P-value>0.05 0.000* 0.000* 0.000*
CMIN/df<3.0 7.043 4.608 2.532
RMSEA<0.08 0.130 0.089 0.066
CFI>0.90 0.783 0.930 0.963
GFI>0.90 0.805 0.902 0.954
AGFI>0.90 0.731 0.910 0.921
Note: *Significant at the 0.01 level, CMIN/df= minimum discrepancy, RMSEA= Root means
square error of approximation, CFI= Comparative fit index, GFI= Goodness-of-fit index,
AGFI= Adjusted goodness-of-fit index.
Table 6.5 indicates that the regression weight of all the items presented positive directions
and are statistically significant at 0.001. Apart from the excellent goodness-of-fit index, this
identifies the unidimensionality of the construct.
Table 6.5: Regression Weights of social influence: (Group number 1 - Default model)
Relationship Estimate S.E. C.R. P
Values5 <--- Cva 1.000
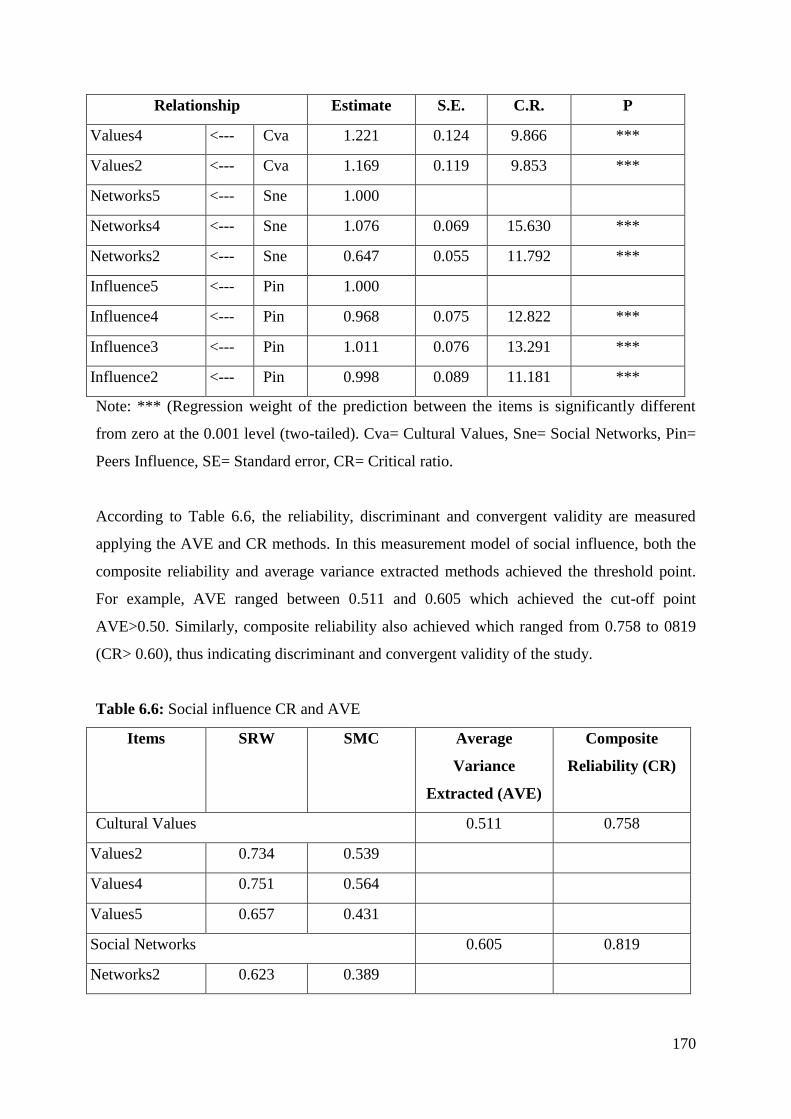
170
Relationship Estimate S.E. C.R. P
Values4 <--- Cva 1.221 0.124 9.866 ***
Values2 <--- Cva 1.169 0.119 9.853 ***
Networks5 <--- Sne 1.000
Networks4 <--- Sne 1.076 0.069 15.630 ***
Networks2 <--- Sne 0.647 0.055 11.792 ***
Influence5 <--- Pin 1.000
Influence4 <--- Pin 0.968 0.075 12.822 ***
Influence3 <--- Pin 1.011 0.076 13.291 ***
Influence2 <--- Pin 0.998 0.089 11.181 ***
Note: *** (Regression weight of the prediction between the items is significantly different
from zero at the 0.001 level (two-tailed). Cva= Cultural Values, Sne= Social Networks, Pin=
Peers Influence, SE= Standard error, CR= Critical ratio.
According to Table 6.6, the reliability, discriminant and convergent validity are measured
applying the AVE and CR methods. In this measurement model of social influence, both the
composite reliability and average variance extracted methods achieved the threshold point.
For example, AVE ranged between 0.511 and 0.605 which achieved the cut-off point
AVE>0.50. Similarly, composite reliability also achieved which ranged from 0.758 to 0819
(CR> 0.60), thus indicating discriminant and convergent validity of the study.
Table 6.6: Social influence CR and AVE
Items SRW SMC Average
Variance
Extracted (AVE)
Composite
Reliability (CR)
Cultural Values 0.511 0.758
Values2 0.734 0.539
Values4 0.751 0.564
Values5 0.657 0.431
Social Networks 0.605 0.819
Networks2 0.623 0.389

171
Items SRW SMC Average
Variance
Extracted (AVE)
Composite
Reliability (CR)
Cultural Values 0.511 0.758
Networks4 0.855 0.731
Networks5 0.835 0.698
Peers Influence 0.520 0.812
Influence2 0.631 0.398
Influence3 0.752 0.565
Influence4 0.723 0.523
Influence5 0.771 0.594
Note: SRW (Standard regression weight), SMC (Squared multiple correlations).
According to Figure 6.2, the goodness-of-fit index is excellent after the third iteration of the
social influence measurement model. The mode fit for chi-square/df= 2.552, root means
square error of approximation (RMSEA)= 0.066 (threshold point <0.08), composite
reliability (CFI)= 0.963 (cut-off point > 0.90), Goodness-of-fit index (GFI)= 0.954 (threshold
point greater than 0.90) and adjusted goodness-of-fit index (AGFI)= 0.921 (cut-off point
greater than 0.90) which all indicated that criteria of fix index were achieved in the model.

172
Figure 6.2: Social influence: 1st order measurement model after 3nd iteration
Note: Cva= Cultural Values, Sne= Social Networks, Pin= Peers Influence. CMIN/df=
minimum discrepancy, RMSEA= Root means square error of approximation, CFI=
Comparative fit index, GFI= Goodness-of-fit index, AGFI= Adjusted goodness-of-fit index.
6.1.3 Technological Orientation
Technological orientation consists of four dimensions (e.g. technology readiness, training,
managerial support, incentives) and it goes through three iterations before the model fit. The
regression weights of the measurement model are above 0.70. The model fit for the first
iteration does not achieve all of the criteria. Thus, the items man2 and tra2 are deleted as the
factor loading is greater than 0.50. The model fit for the second iteration is better after the
first iteration, for example, CIMN/df= 1.918, significant p-value at 0.05 level, RMSEA=
0.047, CFI= 0.987, GFI= 0.934, AGFI= 0.920. The items in1, rea3 and man1 are deleted
because the standard residual covariance value is greater than 2.50. Now, the model fit is

173
excellent after the second iteration: CIMN/DF= 04.419, RMSEA= 0.034, CFI= 0.990, GFI=
0.965, AGFI= 0.946 (Table 6.7).
Table 6.7: Goodness-of-fit measures of technological orientation
Model fit Iteration 1
(Values)
Iteration 2
(Deleted man3,
tra2, in2, rea1)
Iteration 3
(Deleted in1, rea3,
man1)
P-value>0.05 0.000* 0.000* 0.000*
CMIN/df<3.0 2.017 1.918 1.419
RMSEA<0.08 0.053 0.047 0.034
CFI>0.90 0.905 0.987 0.990
GFI>0.90 0.894 0.934 0.965
AGFI>0.90 0.890 0.920 0.946
Note: *Significant at 0.01 level, CMIN/df= minimum discrepancy, RMSEA= Root means
square error of approximation, CFI= Comparative fit index, GFI= Goodness-of-fit index,
AGFI= Adjusted goodness-of-fit index.
Table 6.8 presents the factor leading of all the items as presenting positive directions and are
statistically significant at 0.001. This implies that all items are significantly associated with
their latent variables as hypothesized in this study. In addition to the excellent goodness-of-fit
index, this confirms the unidimensionality of the construct.
Table 6.8: Regression Weights of technological orientation: (Group number 1 - Default
model)
Relationship Estimate S.E. C.R. P
Readiness5 <--- Tre 1.000
Readiness4 <--- Tre 1.091 .072 15.084 ***
Readiness2 <--- Tre 1.067 .074 14.415 ***
Training5 <--- Tra 1.000
Training4 <--- Tra .979 .062 15.805 ***
Training3 <--- Tra 1.026 .061 16.873 ***
Training1 <--- Tra .900 .057 15.883 ***
Managerial5 <--- Msu 1.000

174
Relationship Estimate S.E. C.R. P
Managerial4 <--- Msu .934 .063 14.810 ***
Managerial2 <--- Msu .955 .063 15.270 ***
Incentives3 <--- Inc 1.000
Incentives4 <--- Inc .914 .072 12.725 ***
Incentives5 <--- Inc .983 .071 13.903 ***
Note: *** (Regression weight of the prediction between the items is significantly different
from zero at the 0.001 level (two-tailed). Tre= Technology Readiness, Tra= Training, Msu=
Managerial Support, Inc= Incentives, SE= Standard error, CR= Critical ratio.
In terms of reliability, discriminant and convergent validity of the measurement model
‘technological orientation’, the composite reliability (CR) of the construct ranged from 0.809
to 0.869, which is higher than the threshold point 0.60. The standard regression weight of the
items is above 0.70 indicating that convergent validity was achieved. According to Hair et al.
(2016), the factor loading should be above 0.50. The evidence for discriminant validity is
established as the average variance extracted (AVE) method ranged from 0.587 to 0.624. Hair
et al. (2013) stated that AVE should be greater than 0.60 if discriminant validity is to be
achieved.
Table 6.9: Technological orientation AVE and CR
Items SRW SMC Average Variance
Extracted (AVE)
Composite
Reliability (CR)
Technology Readiness 0.612 0.826
Readiness2 0.780 0.609
Readiness4 0.816 0.666
Readiness5 0.750 0.562
Training 0.624 0.869
Training1 0.772 0.597
Training3 0.809 0.655
Training4 0.769 0.592
Training5 0.809 0.654
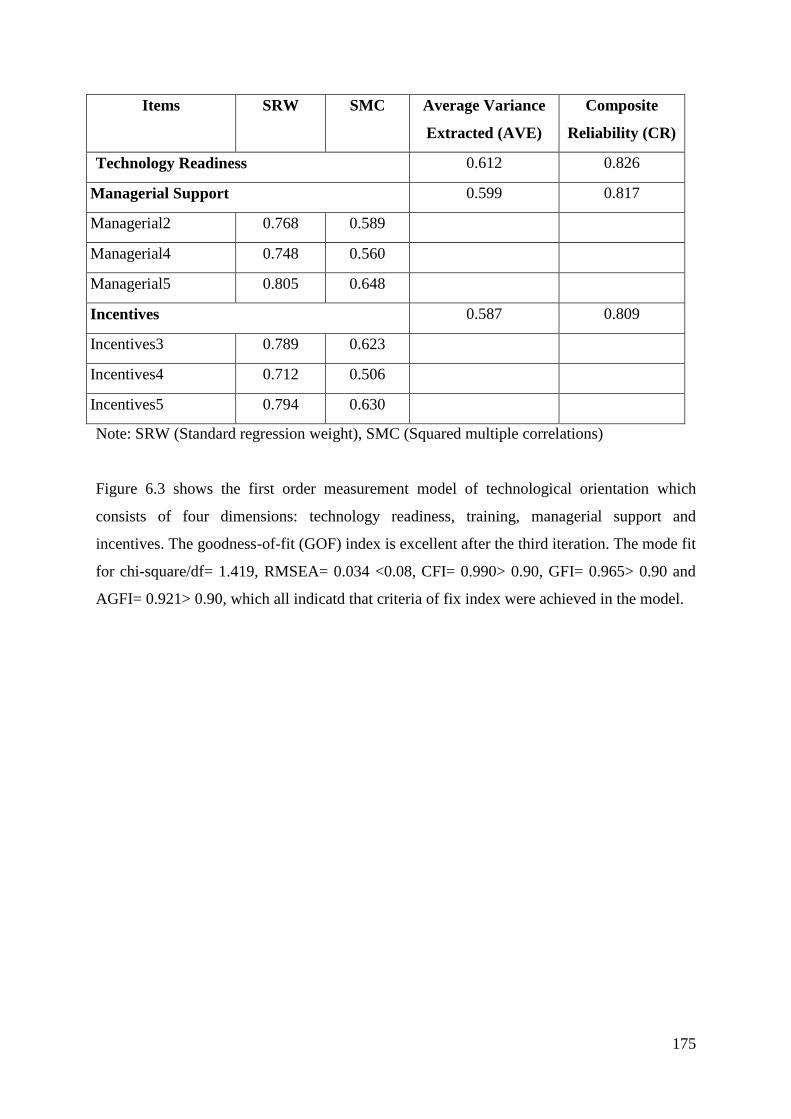
175
Items SRW SMC Average Variance
Extracted (AVE)
Composite
Reliability (CR)
Technology Readiness 0.612 0.826
Managerial Support 0.599 0.817
Managerial2 0.768 0.589
Managerial4 0.748 0.560
Managerial5 0.805 0.648
Incentives 0.587 0.809
Incentives3 0.789 0.623
Incentives4 0.712 0.506
Incentives5 0.794 0.630
Note: SRW (Standard regression weight), SMC (Squared multiple correlations)
Figure 6.3 shows the first order measurement model of technological orientation which
consists of four dimensions: technology readiness, training, managerial support and
incentives. The goodness-of-fit (GOF) index is excellent after the third iteration. The mode fit
for chi-square/df= 1.419, RMSEA= 0.034 <0.08, CFI= 0.990> 0.90, GFI= 0.965> 0.90 and
AGFI= 0.921> 0.90, which all indicatd that criteria of fix index were achieved in the model.
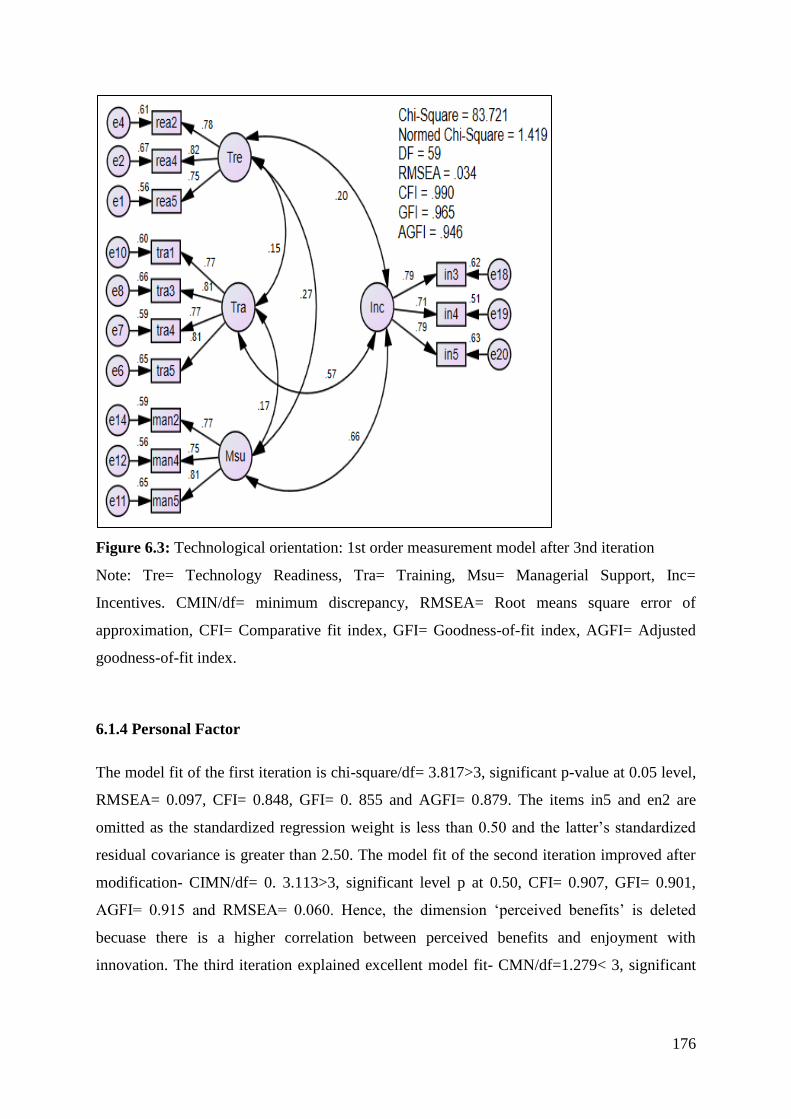
176
Figure 6.3: Technological orientation: 1st order measurement model after 3nd iteration
Note: Tre= Technology Readiness, Tra= Training, Msu= Managerial Support, Inc=
Incentives. CMIN/df= minimum discrepancy, RMSEA= Root means square error of
approximation, CFI= Comparative fit index, GFI= Goodness-of-fit index, AGFI= Adjusted
goodness-of-fit index.
6.1.4 Personal Factor
The model fit of the first iteration is chi-square/df= 3.817>3, significant p-value at 0.05 level,
RMSEA= 0.097, CFI= 0.848, GFI= 0. 855 and AGFI= 0.879. The items in5 and en2 are
omitted as the standardized regression weight is less than 0.50 and the latter’s standardized
residual covariance is greater than 2.50. The model fit of the second iteration improved after
modification- CIMN/df= 0. 3.113>3, significant level p at 0.50, CFI= 0.907, GFI= 0.901,
AGFI= 0.915 and RMSEA= 0.060. Hence, the dimension ‘perceived benefits’ is deleted
becuase there is a higher correlation between perceived benefits and enjoyment with
innovation. The third iteration explained excellent model fit- CMN/df=1.279< 3, significant

177
p-value at 0.05, RMSEA= 0.028< 0.08, CFI= 0.991> 0.90, GFI= 0.967> 0.90 and AGFI=
0.952> 0.90 (see Table 6.10).
Table 6.10: Goodness-of-fit measures of personal factor
Model fit Iteration 1
(Values)
Iteration 2
(Deleted in5,
en2)
Iteration 2
(Deleted the dimension
PB (Perceived Benefits)
P-value>0.05 0.000* 0.000* 0.000*
CMIN/df<3.0 3.817 3.113 1.279
RMSEA<0.08 0.097 0.060 0.028
CFI>0.90 0.848 0.907 0.991
GFI>0.90 0.855 0.901 0.967
AGFI>0.90 0.879 0.915 0.952
Note: *Significant at 0.01 level, CMIN/df= minimum discrepancy, RMSEA= Root means
square error of approximation, CFI= Comparative fit index, GFI= Goodness-of-fit index,
AGFI= Adjusted goodness-of-fit index.
Table 6.11 demonstrates the regression weights of all the items present positive directions
and are statistically significant at 0.01. In addition, with excellent goodness-of-fit index, this
indicates the unidimensionality of the constructs.
Table 6.11: Regression Weights of Personal Factors (Group number 1 - Default model)
Relationship Esti
mate
S.E. C.R. P
Innovativeness4 <-
--
Pin 0.890 .078 11.414 ***
Innovativeness3 <-
--
Pin 1.039 .079 13.197 ***
Innovativeness2 <-
--
Pin 1.000
Innovativeness1 <-
--
Pin 1.040 .080 12.959 ***
Experience5 <-
--
Pe
x
1.000
Experience4 <- Pe 1.099 .097 11.388 ***
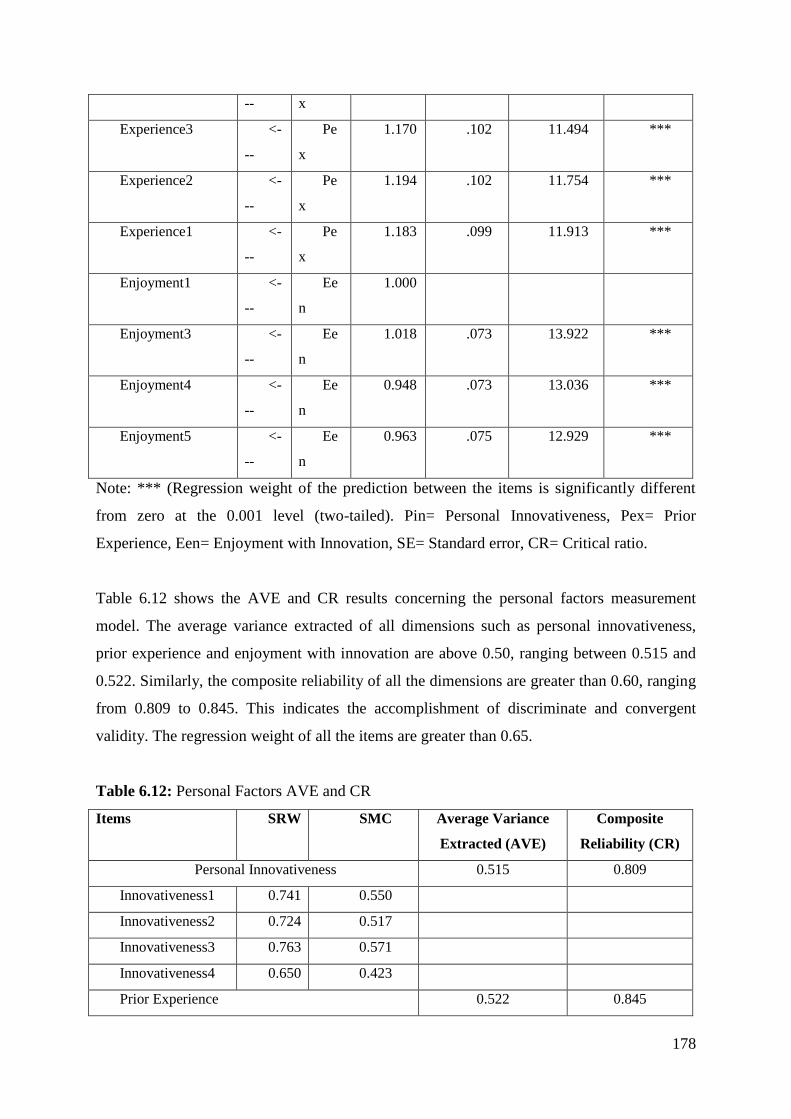
178
-- x
Experience3 <-
--
Pe
x
1.170 .102 11.494 ***
Experience2 <-
--
Pe
x
1.194 .102 11.754 ***
Experience1 <-
--
Pe
x
1.183 .099 11.913 ***
Enjoyment1 <-
--
Ee
n
1.000
Enjoyment3 <-
--
Ee
n
1.018 .073 13.922 ***
Enjoyment4 <-
--
Ee
n
0.948 .073 13.036 ***
Enjoyment5 <-
--
Ee
n
0.963 .075 12.929 ***
Note: *** (Regression weight of the prediction between the items is significantly different
from zero at the 0.001 level (two-tailed). Pin= Personal Innovativeness, Pex= Prior
Experience, Een= Enjoyment with Innovation, SE= Standard error, CR= Critical ratio.
Table 6.12 shows the AVE and CR results concerning the personal factors measurement
model. The average variance extracted of all dimensions such as personal innovativeness,
prior experience and enjoyment with innovation are above 0.50, ranging between 0.515 and
0.522. Similarly, the composite reliability of all the dimensions are greater than 0.60, ranging
from 0.809 to 0.845. This indicates the accomplishment of discriminate and convergent
validity. The regression weight of all the items are greater than 0.65.
Table 6.12: Personal Factors AVE and CR
Items SRW SMC Average Variance
Extracted (AVE)
Composite
Reliability (CR)
Personal Innovativeness 0.515 0.809
Innovativeness1 0.741 0.550
Innovativeness2 0.724 0.517
Innovativeness3 0.763 0.571
Innovativeness4 0.650 0.423
Prior Experience 0.522 0.845

179
Experience1 0.762 0.585
Experience2 0.751 0.564
Experience3 0.729 0.532
Experience4 0.721 0.520
Experience5 0.660 0.435
Enjoyment with Innovation 0.544 0.827
Enjoyment1 0.745 0.514
Enjoyment3 0.772 0.523
Enjoyment4 0.728 0.596
Enjoyment5 0.717 0.543
Note: SRW (Standard regression weight), SMC (Squared multiple correlations)
Figure 6.4 demonstrates that the first order measurement model of personal factors achieved
the excellent goodness-of-fit indices. The model initially consists of four dimensions, but
perceived benefits is deleted because there is a higher correlation between two dimensions.
After modification the model consists of three dimensions, this being personal
innovativeness, prior experience and enjoyment with innovation. The GOF index is excellent
after the third iteration. The mode fit for chi-square/df= 1.279 RMSEA= 0.028, CFI= 0.991,
GFI= 0.967 and AGFI= 0.952.

180
Figure 6.4: Personal factors: 1st order measurement model after 2nd iteration
Note: Pin= Personal Innovativeness, Pex= Prior Experience, Een= Enjoyment with
Innovation. CMIN/df= minimum discrepancy, RMSEA= Root means square error of
approximation, CFI= Comparative fit index, GFI= Goodness-of-fit index, AGFI= Adjusted
goodness-of-fit index.
6.1.5 Attitudes towards Smart Systems
The model that measures attitude towards smart systems consists of five items and it goes
through two dimensions before a model fit is carried out with a significant p value. The
regression weight of the items is above 0.70 in the first iteration and with a modification
index value of 47.21. Thus, e1 (at4) and e4 (at5) are covariate. The model fit appears to be
excellent in the second iteration; the fit statistics revealed that CIMN/df= 2.565, significant p
at 0.05, RMSEA= 0.066< 0.08, CFI= 0.992> 0.90, GFI= 0.989> 0.90 and AGFI= 0.957>
0.90 (Table 6.13).

181
Table 6.13: Goodness-of-fit measures of attitudes towards smart systems
Model fit Iteration 1
(Values)
Iteration 2
(Cov e1 & e4)
P-value>0.05 0.000* 0.000*
CMIN/df<3.0 3.561 2.565
RMSEA<0.08 0.085 0.066
CFI>0.90 0.984 0.992
GFI>0.90 0.980 0.989
AGFI>0.90 0.940 0.957
Note: *Significant at 0.01 level, CMIN/df= minimum discrepancy, RMSEA= Root means
square error of approximation, CFI= Comparative fit index, GFI= Goodness-of-fit index,
AGFI= Adjusted goodness-of-fit index.
Acording to Byrne (2001), unidimensionality is further confirmed when all items present
positive directions and is statistically significant at 0.001. In this study, this suggests that all
items are significantly associated with their respective latent variables as hypothesized (refer
to Table 6.14 below).
Table 6.14: Regression Weights of attitudes towards smart systems: (Group number 1 -
Default model)
Relationship Estimate S.E. C.R. P
Attitude4 <--- Atm 1.000
Attitude3 <--- Atm 1.027 .073 13.989 ***
Attitude2 <--- Atm .997 .073 13.620 ***
Attitude5 <--- Atm .927 .064 14.535 ***
Attitude1 <--- Atm .967 .074 13.062 ***
Note: *** (Regression weight of the prediction between the items is significantly different
from zero at the 0.001 level (two-tailed). Atm= Attitudes towards smart systems, SE=
Standard error, CR= Critical ratio.
Table 6.15 shows the measurement model of attitudes towards smart systems. In this model,
the AVE and CR methods are applied for measuring convergent and discriminant validity.
The convergent validity is achieved since all the factor loadings are greater than 0.65, thus,
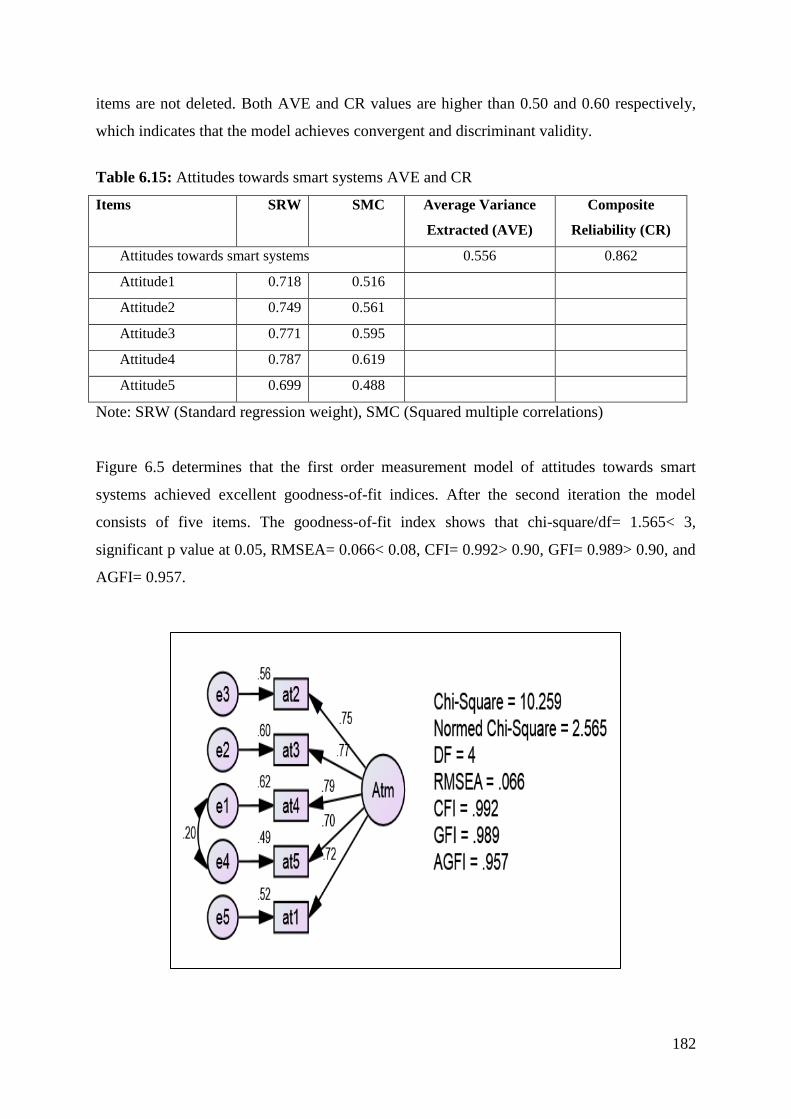
182
items are not deleted. Both AVE and CR values are higher than 0.50 and 0.60 respectively,
which indicates that the model achieves convergent and discriminant validity.
Table 6.15: Attitudes towards smart systems AVE and CR
Items SRW SMC Average Variance
Extracted (AVE)
Composite
Reliability (CR)
Attitudes towards smart systems 0.556 0.862
Attitude1 0.718 0.516
Attitude2 0.749 0.561
Attitude3 0.771 0.595
Attitude4 0.787 0.619
Attitude5 0.699 0.488
Note: SRW (Standard regression weight), SMC (Squared multiple correlations)
Figure 6.5 determines that the first order measurement model of attitudes towards smart
systems achieved excellent goodness-of-fit indices. After the second iteration the model
consists of five items. The goodness-of-fit index shows that chi-square/df= 1.565< 3,
significant p value at 0.05, RMSEA= 0.066< 0.08, CFI= 0.992> 0.90, GFI= 0.989> 0.90, and
AGFI= 0.957.
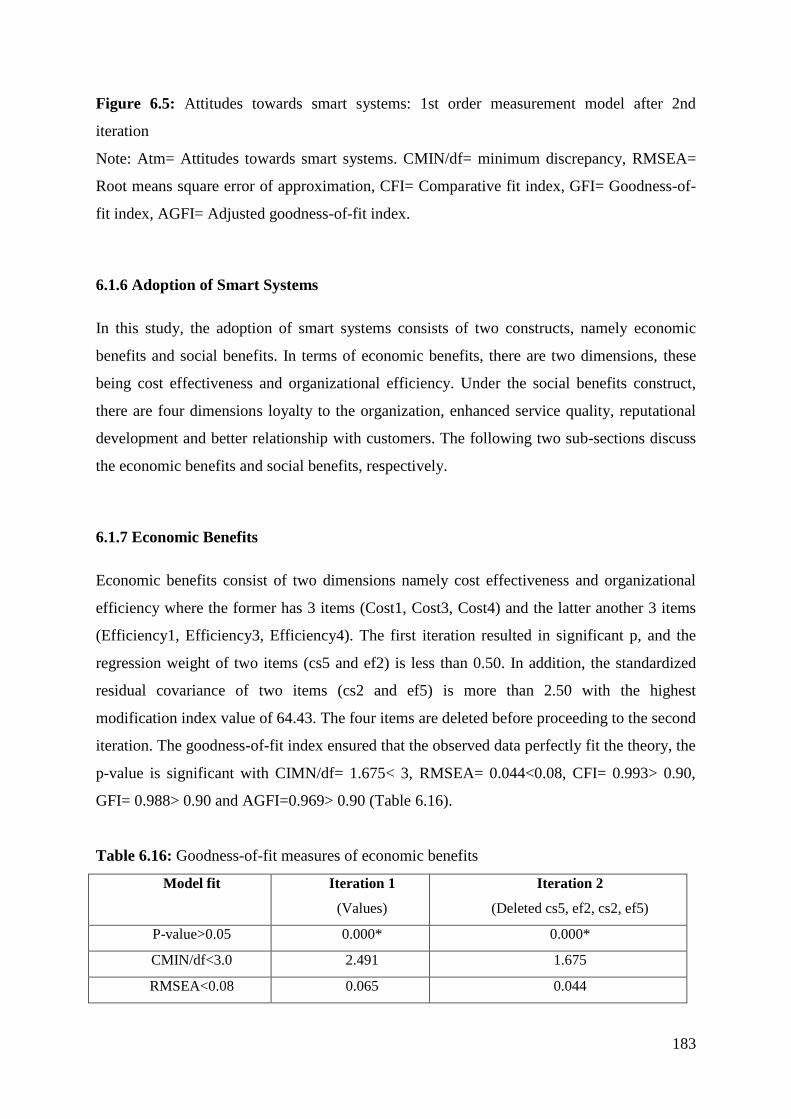
183
Figure 6.5: Attitudes towards smart systems: 1st order measurement model after 2nd
iteration
Note: Atm= Attitudes towards smart systems. CMIN/df= minimum discrepancy, RMSEA=
Root means square error of approximation, CFI= Comparative fit index, GFI= Goodness-of-
fit index, AGFI= Adjusted goodness-of-fit index.
6.1.6 Adoption of Smart Systems
In this study, the adoption of smart systems consists of two constructs, namely economic
benefits and social benefits. In terms of economic benefits, there are two dimensions, these
being cost effectiveness and organizational efficiency. Under the social benefits construct,
there are four dimensions loyalty to the organization, enhanced service quality, reputational
development and better relationship with customers. The following two sub-sections discuss
the economic benefits and social benefits, respectively.
6.1.7 Economic Benefits
Economic benefits consist of two dimensions namely cost effectiveness and organizational
efficiency where the former has 3 items (Cost1, Cost3, Cost4) and the latter another 3 items
(Efficiency1, Efficiency3, Efficiency4). The first iteration resulted in significant p, and the
regression weight of two items (cs5 and ef2) is less than 0.50. In addition, the standardized
residual covariance of two items (cs2 and ef5) is more than 2.50 with the highest
modification index value of 64.43. The four items are deleted before proceeding to the second
iteration. The goodness-of-fit index ensured that the observed data perfectly fit the theory, the
p-value is significant with CIMN/df= 1.675< 3, RMSEA= 0.044<0.08, CFI= 0.993> 0.90,
GFI= 0.988> 0.90 and AGFI=0.969> 0.90 (Table 6.16).
Table 6.16: Goodness-of-fit measures of economic benefits
Model fit Iteration 1
(Values)
Iteration 2
(Deleted cs5, ef2, cs2, ef5)
P-value>0.05 0.000* 0.000*
CMIN/df<3.0 2.491 1.675
RMSEA<0.08 0.065 0.044
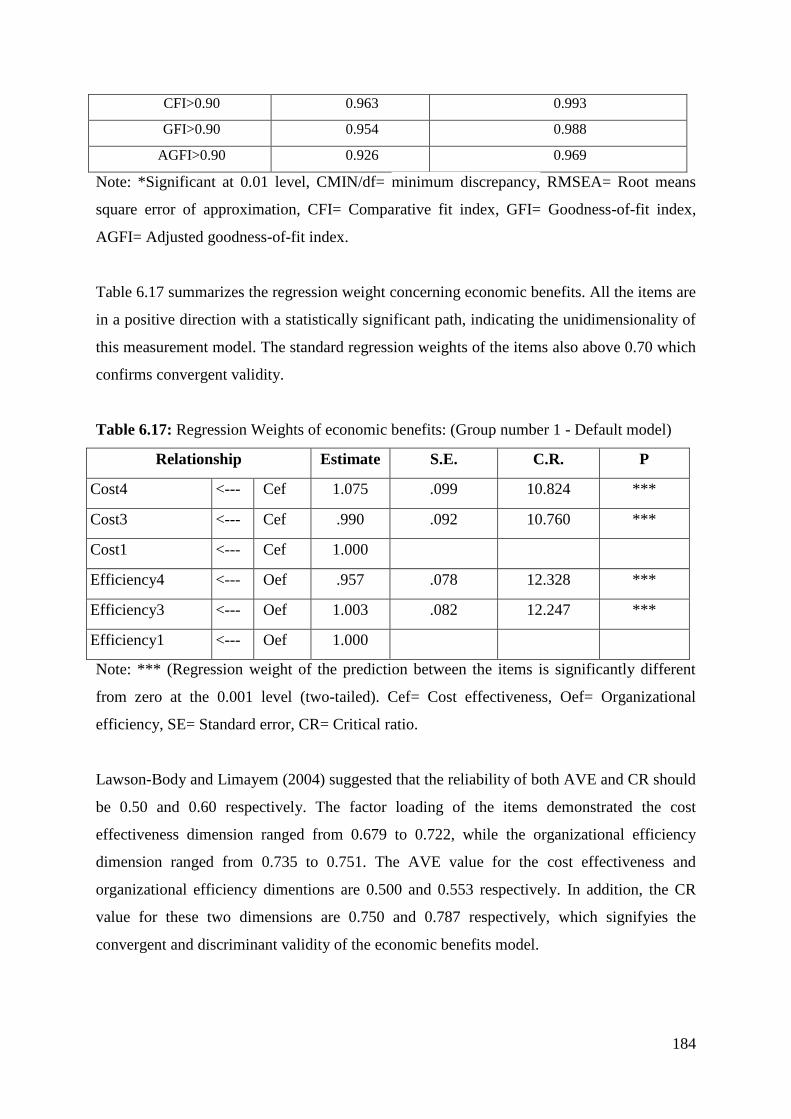
184
CFI>0.90 0.963 0.993
GFI>0.90 0.954 0.988
AGFI>0.90 0.926 0.969
Note: *Significant at 0.01 level, CMIN/df= minimum discrepancy, RMSEA= Root means
square error of approximation, CFI= Comparative fit index, GFI= Goodness-of-fit index,
AGFI= Adjusted goodness-of-fit index.
Table 6.17 summarizes the regression weight concerning economic benefits. All the items are
in a positive direction with a statistically significant path, indicating the unidimensionality of
this measurement model. The standard regression weights of the items also above 0.70 which
confirms convergent validity.
Table 6.17: Regression Weights of economic benefits: (Group number 1 - Default model)
Relationship Estimate S.E. C.R. P
Cost4 <--- Cef 1.075 .099 10.824 ***
Cost3 <--- Cef .990 .092 10.760 ***
Cost1 <--- Cef 1.000
Efficiency4 <--- Oef .957 .078 12.328 ***
Efficiency3 <--- Oef 1.003 .082 12.247 ***
Efficiency1 <--- Oef 1.000
Note: *** (Regression weight of the prediction between the items is significantly different
from zero at the 0.001 level (two-tailed). Cef= Cost effectiveness, Oef= Organizational
efficiency, SE= Standard error, CR= Critical ratio.
Lawson-Body and Limayem (2004) suggested that the reliability of both AVE and CR should
be 0.50 and 0.60 respectively. The factor loading of the items demonstrated the cost
effectiveness dimension ranged from 0.679 to 0.722, while the organizational efficiency
dimension ranged from 0.735 to 0.751. The AVE value for the cost effectiveness and
organizational efficiency dimentions are 0.500 and 0.553 respectively. In addition, the CR
value for these two dimensions are 0.750 and 0.787 respectively, which signifyies the
convergent and discriminant validity of the economic benefits model.
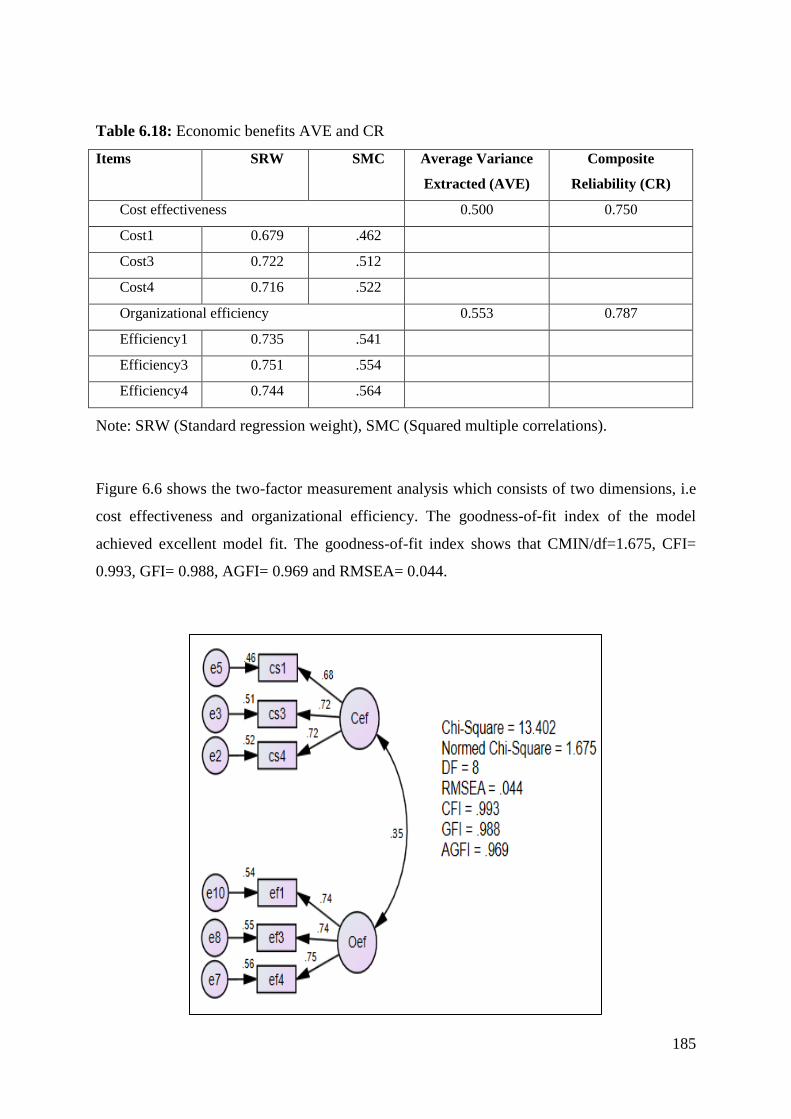
185
Table 6.18: Economic benefits AVE and CR
Items SRW SMC Average Variance
Extracted (AVE)
Composite
Reliability (CR)
Cost effectiveness 0.500 0.750
Cost1 0.679 .462
Cost3 0.722 .512
Cost4 0.716 .522
Organizational efficiency 0.553 0.787
Efficiency1 0.735 .541
Efficiency3 0.751 .554
Efficiency4 0.744 .564
Note: SRW (Standard regression weight), SMC (Squared multiple correlations).
Figure 6.6 shows the two-factor measurement analysis which consists of two dimensions, i.e
cost effectiveness and organizational efficiency. The goodness-of-fit index of the model
achieved excellent model fit. The goodness-of-fit index shows that CMIN/df=1.675, CFI=
0.993, GFI= 0.988, AGFI= 0.969 and RMSEA= 0.044.

186
Figure 6.6: Personal factors: 1st order measurement model after 2nd iteration
Note: Cef= Cost effectiveness, Oef= Organizational efficiency. CMIN/df= minimum
discrepancy, RMSEA= Root means square error of approximation, CFI= Comparative fit
index, GFI= Goodness-of-fit index, AGFI= Adjusted goodness-of-fit index.
6.1.8 Social Benefits
The fit index for the initial model is below thw acceptable threshold particularly for the value
of CIMN/df, RMSEA, GFI and AGFI. The items re4, lo5 and qa2 are omitted as the standard
regression weight is below 0.50. The second iteration implied a better model fit- CIMN/df=
3.548, significant p at 0.05, RMSEA= 0.087, CFI= 0.922, GFI= 0.915 and AGFI= 0.896. In
addition, the items lo3 and rel4 are also deleted as the standardized residual covariance is
above 2.50. The model fit is improved after re-specification- CIMN/df= 2.540, significant p
at 0.05, CFI=0.932, GFI= 0.926, AGFI= 0.909, and RMSEA= 0.077. Here, the dimension
known as ‘better relationships with customers’ because there is a higher correlation between
loyalty to the organization and better relationship with customers. Next, the model fit is
excellent after modification- CIMN/df= 2.240< 3, significant p at 0.05, RMSEA= 0.069,
CFI=0.962, GFI= 0.956, AGFI= 0.959 and RMSEA= 0.069.
Table 6.19: Goodness-of-fit measures of social benefits
Model fit Iteration
1
(Values)
Iteration 2
(Deleted
re4, lo5, qa2)
Iteration
3
(Deleted
in1, lo3, rel4)
Iteration 4
(Deleted the
dimension of better
relationship with
customers)
P-value>0.05 0.000* 0.000* 0.000* 0.000*
CMIN/df<3.0 4.730 3.548 2.540 2.701
RMSEA<0.08 0.096 0.087 0.077 0.069
CFI>0.90 0.901 0.922 0.932 0.964
GFI>0.90 0.891 0.915 0.926 0.947
AGFI>0.90 0.860 0.896 0.909 0.914
Note: *Significant at 0.01 level, CMIN/df= minimum discrepancy, RMSEA= Root means
square error of approximation, CFI= Comparative fit index, GFI= Goodness-of-fit index,
AGFI= Adjusted goodness-of-fit index.

187
Table 6.20 shows the regression weights of the model measuring social benefits. The results
demonstrate that all the items are positive with significant path directions. This implies that
the unidimensionality of this model is confirmed. Additionally, all items load significantly at
p< 0.001 and substantively onto their respective variables with standardized factor loading
being greater than 0.60. This provides evidence of convergent validity.
Table 6.20: Regression Weights of social benefits: (Group number 1 - Default model)
Relationship Estimate S.E. C.R. P
Loyalty4 <--- Lth .861 .078 11.083 ***
Loyalty2 <--- Lth 1.000
Loyalty1 <--- Lth .989 .072 13.705 ***
Quality5 <--- Esq 1.000
Quality4 <--- Esq 1.082 .076 14.322 ***
Quality3 <--- Esq 1.043 .072 14.498 ***
Quality1 <--- Esq .915 .071 12.842 ***
Reputational5 <--- Rde 1.000
Reputational3 <--- Rde 1.102 .076 14.494 ***
Reputational2 <--- Rde 1.075 .078 13.863 ***
Reputational1 <--- Rde 1.000 .077 12.911 ***
Note: *** (Regression weight of the prediction between the items is significantly different
from zero at the 0.001 level (two-tailed). Lth= Loyalty to the organization, Esq= Enhanced
service quality, Rde= Reputational development, SE= Standard error, CR= Critical ratio.
The composite reliability of the dimensions ranges from 0.753 to 0.839 which means it is
above 0.60 (Hair et al., 2016). Similarly, the average variance extracted value for the
measurement model ranges from 0.506 to 0.565, which implies that the model achieves
discriminant and convergent validity.
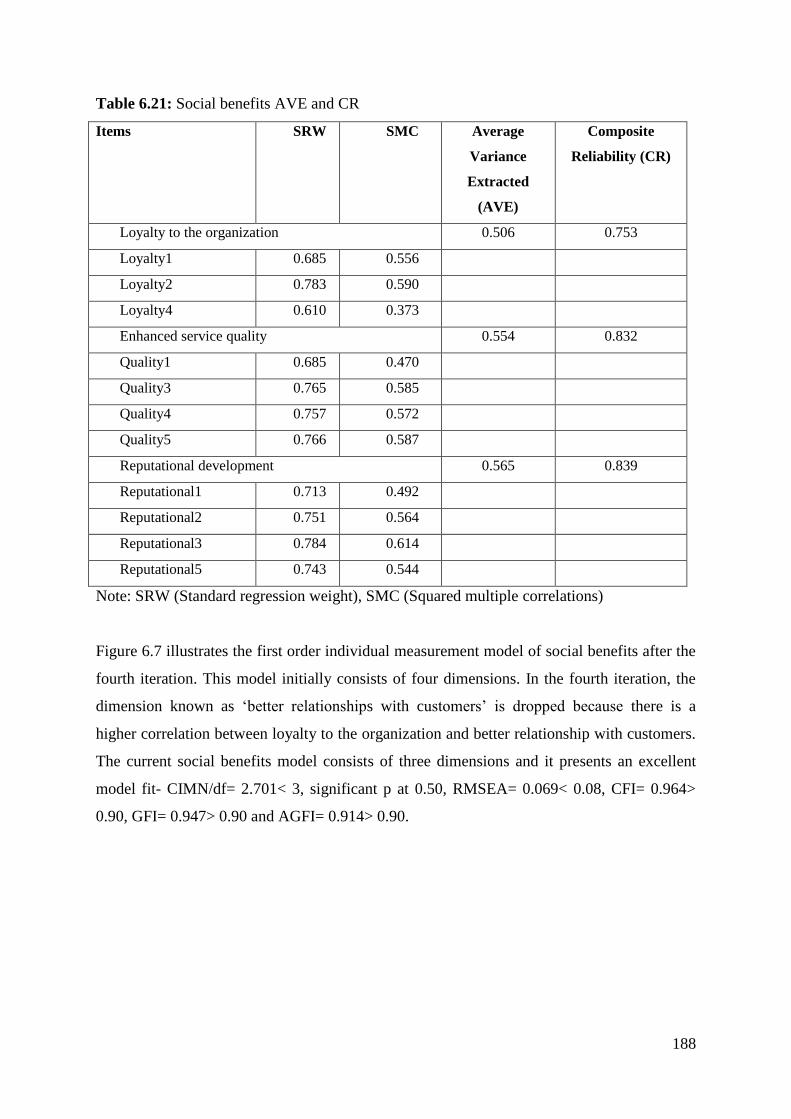
188
Table 6.21: Social benefits AVE and CR
Items SRW SMC Average
Variance
Extracted
(AVE)
Composite
Reliability (CR)
Loyalty to the organization 0.506 0.753
Loyalty1 0.685 0.556
Loyalty2 0.783 0.590
Loyalty4 0.610 0.373
Enhanced service quality 0.554 0.832
Quality1 0.685 0.470
Quality3 0.765 0.585
Quality4 0.757 0.572
Quality5 0.766 0.587
Reputational development 0.565 0.839
Reputational1 0.713 0.492
Reputational2 0.751 0.564
Reputational3 0.784 0.614
Reputational5 0.743 0.544
Note: SRW (Standard regression weight), SMC (Squared multiple correlations)
Figure 6.7 illustrates the first order individual measurement model of social benefits after the
fourth iteration. This model initially consists of four dimensions. In the fourth iteration, the
dimension known as ‘better relationships with customers’ is dropped because there is a
higher correlation between loyalty to the organization and better relationship with customers.
The current social benefits model consists of three dimensions and it presents an excellent
model fit- CIMN/df= 2.701< 3, significant p at 0.50, RMSEA= 0.069< 0.08, CFI= 0.964>
0.90, GFI= 0.947> 0.90 and AGFI= 0.914> 0.90.
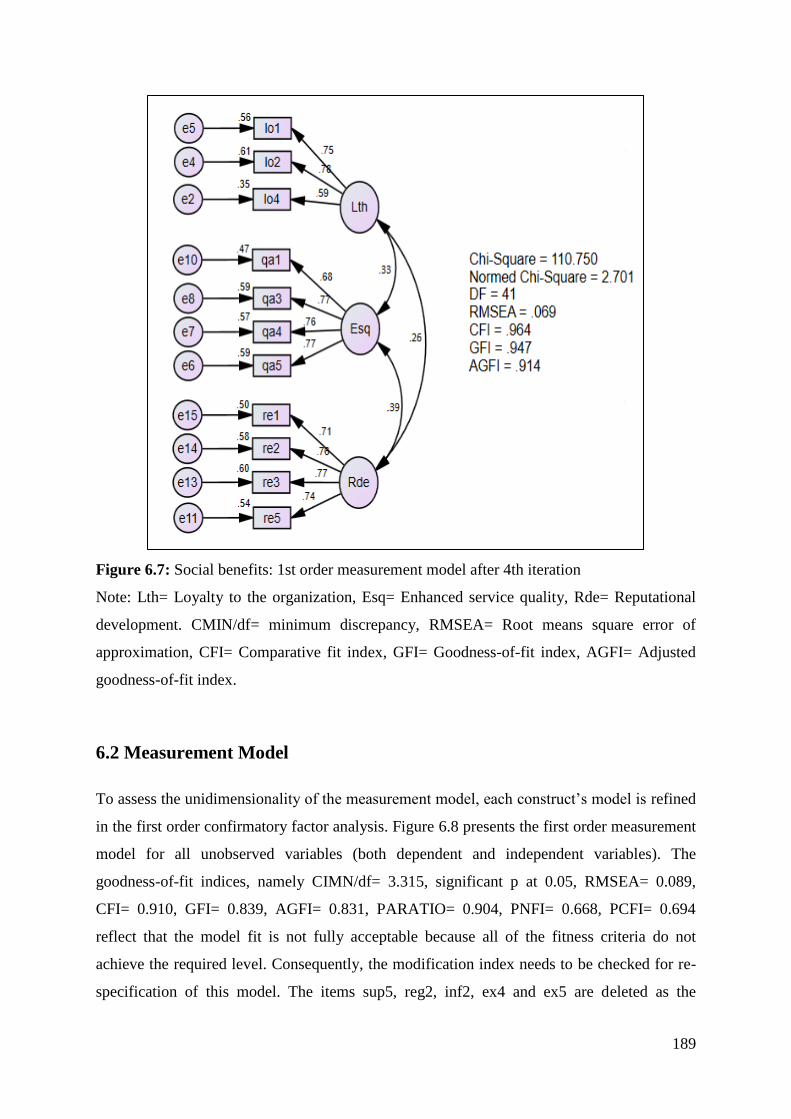
189
Figure 6.7: Social benefits: 1st order measurement model after 4th iteration
Note: Lth= Loyalty to the organization, Esq= Enhanced service quality, Rde= Reputational
development. CMIN/df= minimum discrepancy, RMSEA= Root means square error of
approximation, CFI= Comparative fit index, GFI= Goodness-of-fit index, AGFI= Adjusted
goodness-of-fit index.
6.2 Measurement Model
To assess the unidimensionality of the measurement model, each construct’s model is refined
in the first order confirmatory factor analysis. Figure 6.8 presents the first order measurement
model for all unobserved variables (both dependent and independent variables). The
goodness-of-fit indices, namely CIMN/df= 3.315, significant p at 0.05, RMSEA= 0.089,
CFI= 0.910, GFI= 0.839, AGFI= 0.831, PARATIO= 0.904, PNFI= 0.668, PCFI= 0.694
reflect that the model fit is not fully acceptable because all of the fitness criteria do not
achieve the required level. Consequently, the modification index needs to be checked for re-
specification of this model. The items sup5, reg2, inf2, ex4 and ex5 are deleted as the
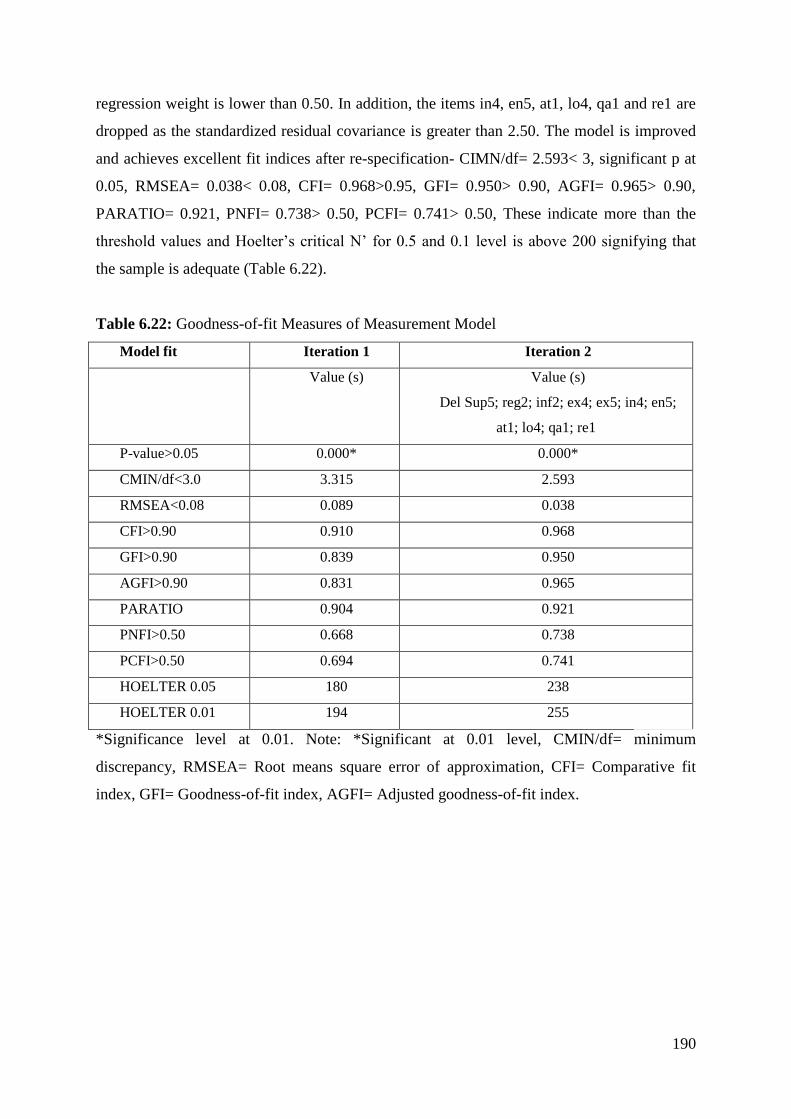
190
regression weight is lower than 0.50. In addition, the items in4, en5, at1, lo4, qa1 and re1 are
dropped as the standardized residual covariance is greater than 2.50. The model is improved
and achieves excellent fit indices after re-specification- CIMN/df= 2.593< 3, significant p at
0.05, RMSEA= 0.038< 0.08, CFI= 0.968>0.95, GFI= 0.950> 0.90, AGFI= 0.965> 0.90,
PARATIO= 0.921, PNFI= 0.738> 0.50, PCFI= 0.741> 0.50, These indicate more than the
threshold values and Hoelter’s critical N’ for 0.5 and 0.1 level is above 200 signifying that
the sample is adequate (Table 6.22).
Table 6.22: Goodness-of-fit Measures of Measurement Model
Model fit Iteration 1 Iteration 2
Value (s) Value (s)
Del Sup5; reg2; inf2; ex4; ex5; in4; en5;
at1; lo4; qa1; re1
P-value>0.05 0.000* 0.000*
CMIN/df<3.0 3.315 2.593
RMSEA<0.08 0.089 0.038
CFI>0.90 0.910 0.968
GFI>0.90 0.839 0.950
AGFI>0.90 0.831 0.965
PARATIO 0.904 0.921
PNFI>0.50 0.668 0.738
PCFI>0.50 0.694 0.741
HOELTER 0.05 180 238
HOELTER 0.01 194 255
*Significance level at 0.01. Note: *Significant at 0.01 level, CMIN/df= minimum
discrepancy, RMSEA= Root means square error of approximation, CFI= Comparative fit
index, GFI= Goodness-of-fit index, AGFI= Adjusted goodness-of-fit index.
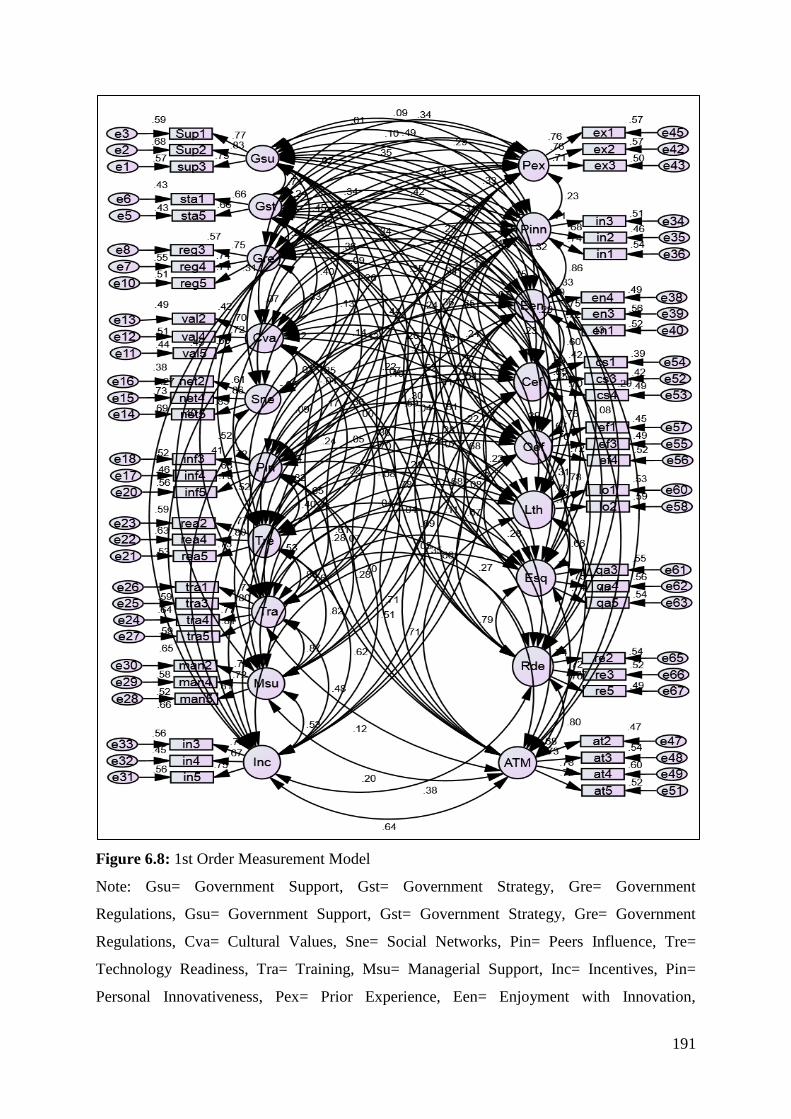
191
Figure 6.8: 1st Order Measurement Model
Note: Gsu= Government Support, Gst= Government Strategy, Gre= Government
Regulations, Gsu= Government Support, Gst= Government Strategy, Gre= Government
Regulations, Cva= Cultural Values, Sne= Social Networks, Pin= Peers Influence, Tre=
Technology Readiness, Tra= Training, Msu= Managerial Support, Inc= Incentives, Pin=
Personal Innovativeness, Pex= Prior Experience, Een= Enjoyment with Innovation,
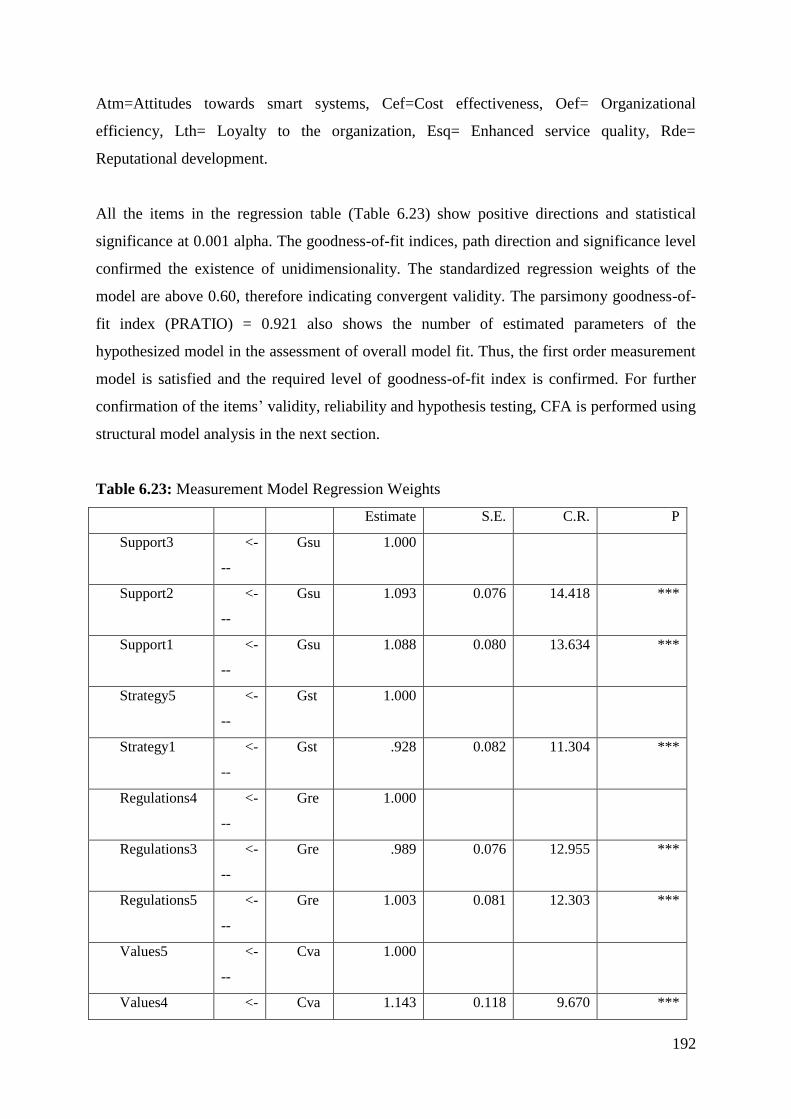
192
Atm=Attitudes towards smart systems, Cef=Cost effectiveness, Oef= Organizational
efficiency, Lth= Loyalty to the organization, Esq= Enhanced service quality, Rde=
Reputational development.
All the items in the regression table (Table 6.23) show positive directions and statistical
significance at 0.001 alpha. The goodness-of-fit indices, path direction and significance level
confirmed the existence of unidimensionality. The standardized regression weights of the
model are above 0.60, therefore indicating convergent validity. The parsimony goodness-of-
fit index (PRATIO) = 0.921 also shows the number of estimated parameters of the
hypothesized model in the assessment of overall model fit. Thus, the first order measurement
model is satisfied and the required level of goodness-of-fit index is confirmed. For further
confirmation of the items’ validity, reliability and hypothesis testing, CFA is performed using
structural model analysis in the next section.
Table 6.23: Measurement Model Regression Weights
Estimate S.E. C.R. P
Support3 <-
--
Gsu 1.000
Support2 <-
--
Gsu 1.093 0.076 14.418 ***
Support1 <-
--
Gsu 1.088 0.080 13.634 ***
Strategy5 <-
--
Gst 1.000
Strategy1 <-
--
Gst .928 0.082 11.304 ***
Regulations4 <-
--
Gre 1.000
Regulations3 <-
--
Gre .989 0.076 12.955 ***
Regulations5 <-
--
Gre 1.003 0.081 12.303 ***
Values5 <-
--
Cva 1.000
Values4 <- Cva 1.143 0.118 9.670 ***
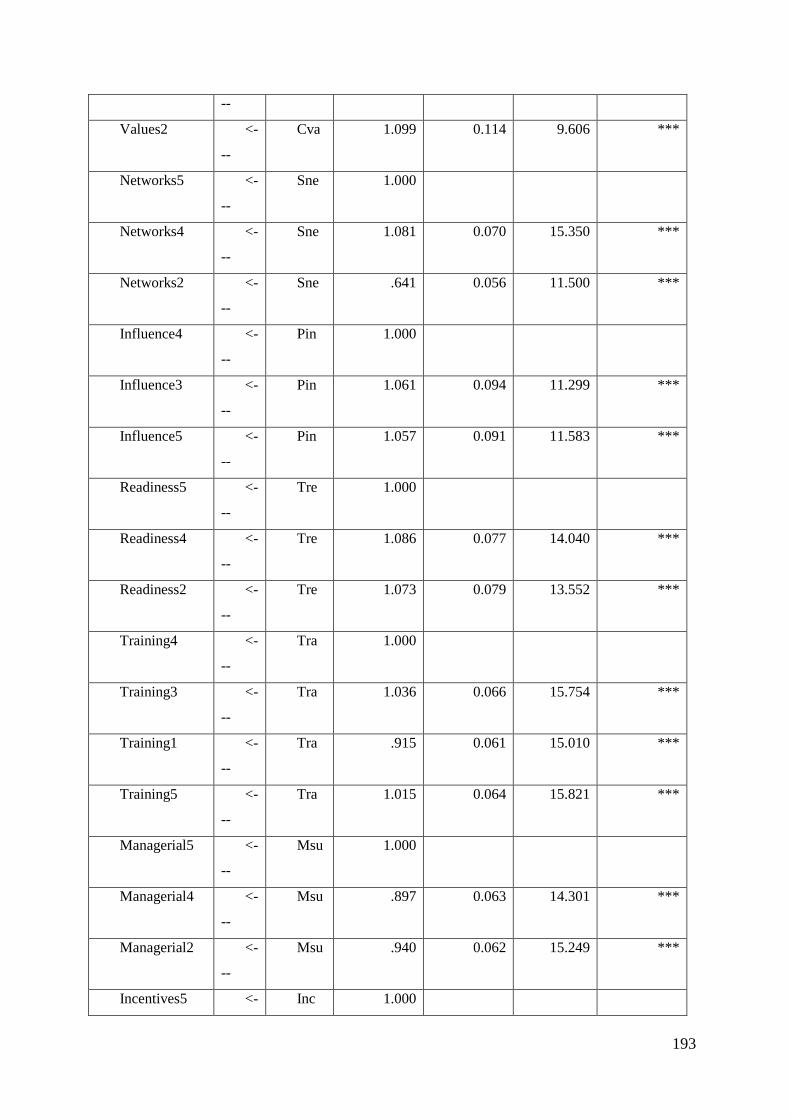
193
--
Values2 <-
--
Cva 1.099 0.114 9.606 ***
Networks5 <-
--
Sne 1.000
Networks4 <-
--
Sne 1.081 0.070 15.350 ***
Networks2 <-
--
Sne .641 0.056 11.500 ***
Influence4 <-
--
Pin 1.000
Influence3 <-
--
Pin 1.061 0.094 11.299 ***
Influence5 <-
--
Pin 1.057 0.091 11.583 ***
Readiness5 <-
--
Tre 1.000
Readiness4 <-
--
Tre 1.086 0.077 14.040 ***
Readiness2 <-
--
Tre 1.073 0.079 13.552 ***
Training4 <-
--
Tra 1.000
Training3 <-
--
Tra 1.036 0.066 15.754 ***
Training1 <-
--
Tra .915 0.061 15.010 ***
Training5 <-
--
Tra 1.015 0.064 15.821 ***
Managerial5 <-
--
Msu 1.000
Managerial4 <-
--
Msu .897 0.063 14.301 ***
Managerial2 <-
--
Msu .940 0.062 15.249 ***
Incentives5 <- Inc 1.000
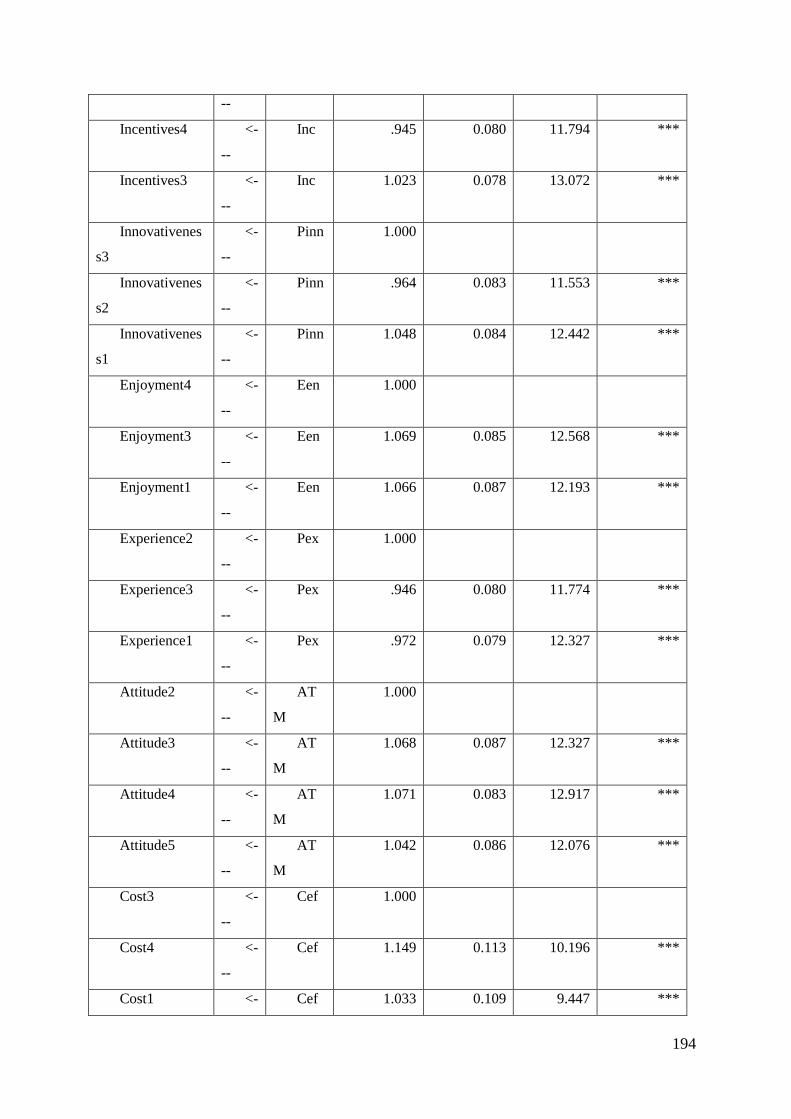
194
--
Incentives4 <-
--
Inc .945 0.080 11.794 ***
Incentives3 <-
--
Inc 1.023 0.078 13.072 ***
Innovativenes
s3
<-
--
Pinn 1.000
Innovativenes
s2
<-
--
Pinn .964 0.083 11.553 ***
Innovativenes
s1
<-
--
Pinn 1.048 0.084 12.442 ***
Enjoyment4 <-
--
Een 1.000
Enjoyment3 <-
--
Een 1.069 0.085 12.568 ***
Enjoyment1 <-
--
Een 1.066 0.087 12.193 ***
Experience2 <-
--
Pex 1.000
Experience3 <-
--
Pex .946 0.080 11.774 ***
Experience1 <-
--
Pex .972 0.079 12.327 ***
Attitude2 <-
--
AT
M
1.000
Attitude3 <-
--
AT
M
1.068 0.087 12.327 ***
Attitude4 <-
--
AT
M
1.071 0.083 12.917 ***
Attitude5 <-
--
AT
M
1.042 0.086 12.076 ***
Cost3 <-
--
Cef 1.000
Cost4 <-
--
Cef 1.149 0.113 10.196 ***
Cost1 <- Cef 1.033 0.109 9.447 ***
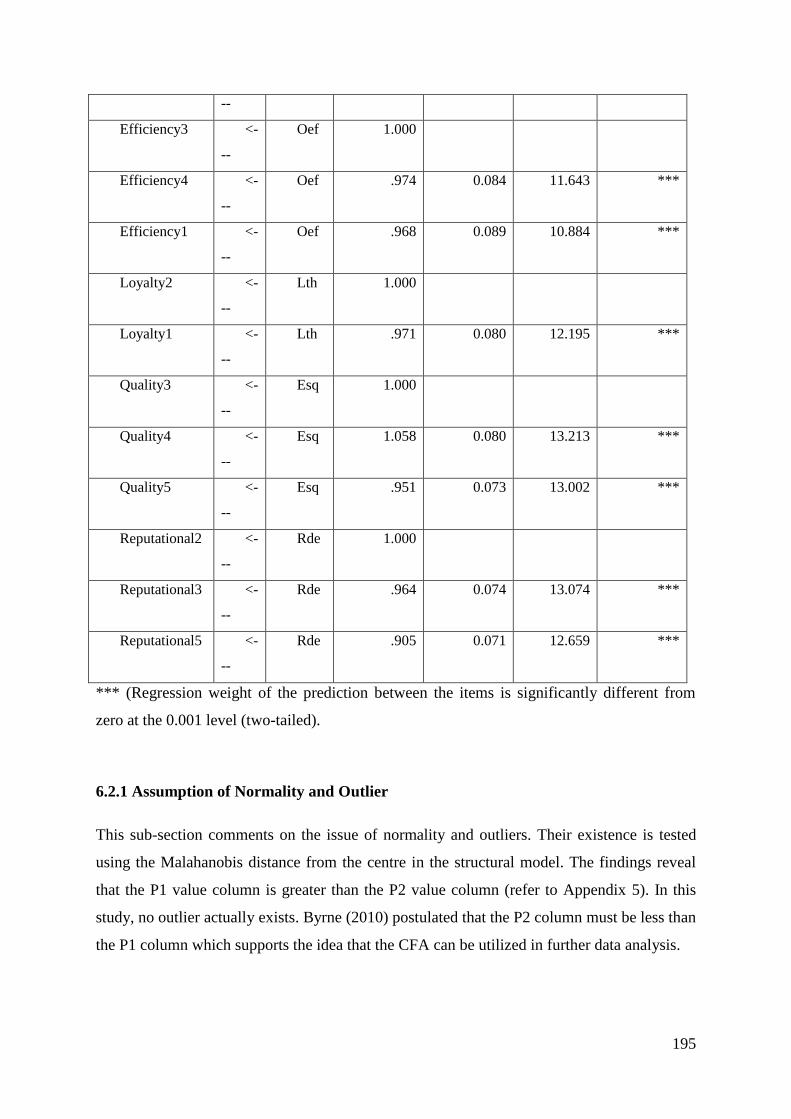
195
--
Efficiency3 <-
--
Oef 1.000
Efficiency4 <-
--
Oef .974 0.084 11.643 ***
Efficiency1 <-
--
Oef .968 0.089 10.884 ***
Loyalty2 <-
--
Lth 1.000
Loyalty1 <-
--
Lth .971 0.080 12.195 ***
Quality3 <-
--
Esq 1.000
Quality4 <-
--
Esq 1.058 0.080 13.213 ***
Quality5 <-
--
Esq .951 0.073 13.002 ***
Reputational2 <-
--
Rde 1.000
Reputational3 <-
--
Rde .964 0.074 13.074 ***
Reputational5 <-
--
Rde .905 0.071 12.659 ***
*** (Regression weight of the prediction between the items is significantly different from
zero at the 0.001 level (two-tailed).
6.2.1 Assumption of Normality and Outlier
This sub-section comments on the issue of normality and outliers. Their existence is tested
using the Malahanobis distance from the centre in the structural model. The findings reveal
that the P1 value column is greater than the P2 value column (refer to Appendix 5). In this
study, no outlier actually exists. Byrne (2010) postulated that the P2 column must be less than
the P1 column which supports the idea that the CFA can be utilized in further data analysis.

196
6.2.2 Discriminant Validity
Table 6.24 shows the correlations among the variables. Discriminant validity can be achieved
if the correlation among the constructs is less than 0.85. Byrne (2010) postulated that if the
value of the correlation between two the variables exceeded 0.85, then discriminant validity
could not be attained. To measure the discriminant validity, this study examines the
measurement model by linking all the independent and dependent variables together to
examine whether the variables are highly correlated. If the discriminant validity is not
attained, it needs to drop one of the two constructs for further analysis. Hence, all variables
are less than the cut-off point of < 0.85, indicating the discriminant validity of the
measurement model was achieved.
Table 6.24: Correlations (Group number 1 - Default model)
Correlations Estim
ate
Government Support <-
->
Government Strategy .743
Government Support <-
->
Government Regulations .445
Government Support <-
->
Cultural Values .359
Government Support <-
->
Social Networks .256
Government Support <-
->
Peers Influence .444
Government Support <-
->
Technology Readiness .222
Government Support <-
->
Training .112
Government Support <-
->
Managerial Support .221
Government Support <-
->
Incentives .216
Government Support <-
->
Attitudes towards smart systems .285
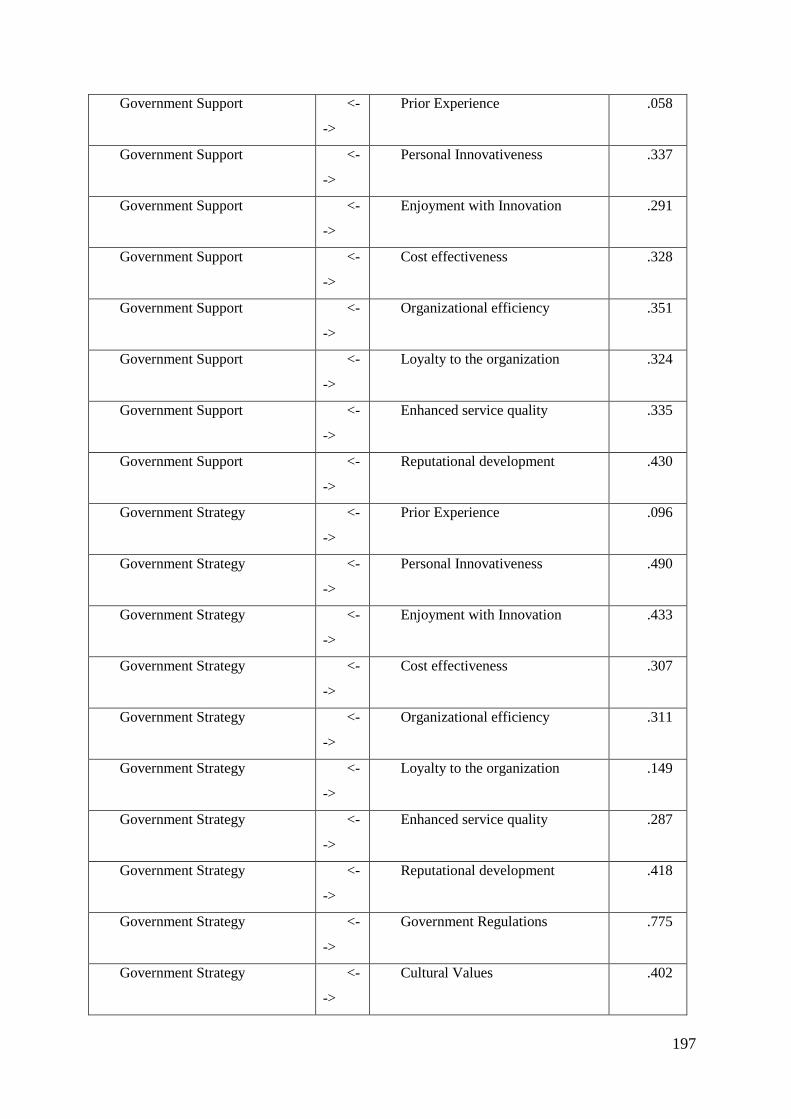
197
Government Support <-
->
Prior Experience .058
Government Support <-
->
Personal Innovativeness .337
Government Support <-
->
Enjoyment with Innovation .291
Government Support <-
->
Cost effectiveness .328
Government Support <-
->
Organizational efficiency .351
Government Support <-
->
Loyalty to the organization .324
Government Support <-
->
Enhanced service quality .335
Government Support <-
->
Reputational development .430
Government Strategy <-
->
Prior Experience .096
Government Strategy <-
->
Personal Innovativeness .490
Government Strategy <-
->
Enjoyment with Innovation .433
Government Strategy <-
->
Cost effectiveness .307
Government Strategy <-
->
Organizational efficiency .311
Government Strategy <-
->
Loyalty to the organization .149
Government Strategy <-
->
Enhanced service quality .287
Government Strategy <-
->
Reputational development .418
Government Strategy <-
->
Government Regulations .775
Government Strategy <-
->
Cultural Values .402

198
Government Strategy <-
->
Social Networks .127
Government Strategy <-
->
Peers Influence .135
Government Strategy <-
->
Technology Readiness .068
Government Strategy <-
->
Training .040
Government Strategy <-
->
Managerial Support .069
Government Strategy <-
->
Incentives .081
Government Strategy <-
->
Attitudes towards smart systems .077
Government Regulations <-
->
Prior Experience .007
Government Regulations <-
->
Personal Innovativeness .349
Government Regulations <-
->
Enjoyment with Innovation .418
Government Regulations <-
->
Cost effectiveness .225
Government Regulations <-
->
Organizational efficiency .139
Government Regulations <-
->
Loyalty to the organization .072
Government Regulations <-
->
Enhanced service quality .228
Government Regulations <-
->
Reputational development .351
Government Regulations <-
->
Prior Experience .019
Government Regulations <-
->
Cultural Values .326
Cultural Values <-
->
Personal Innovativeness .337
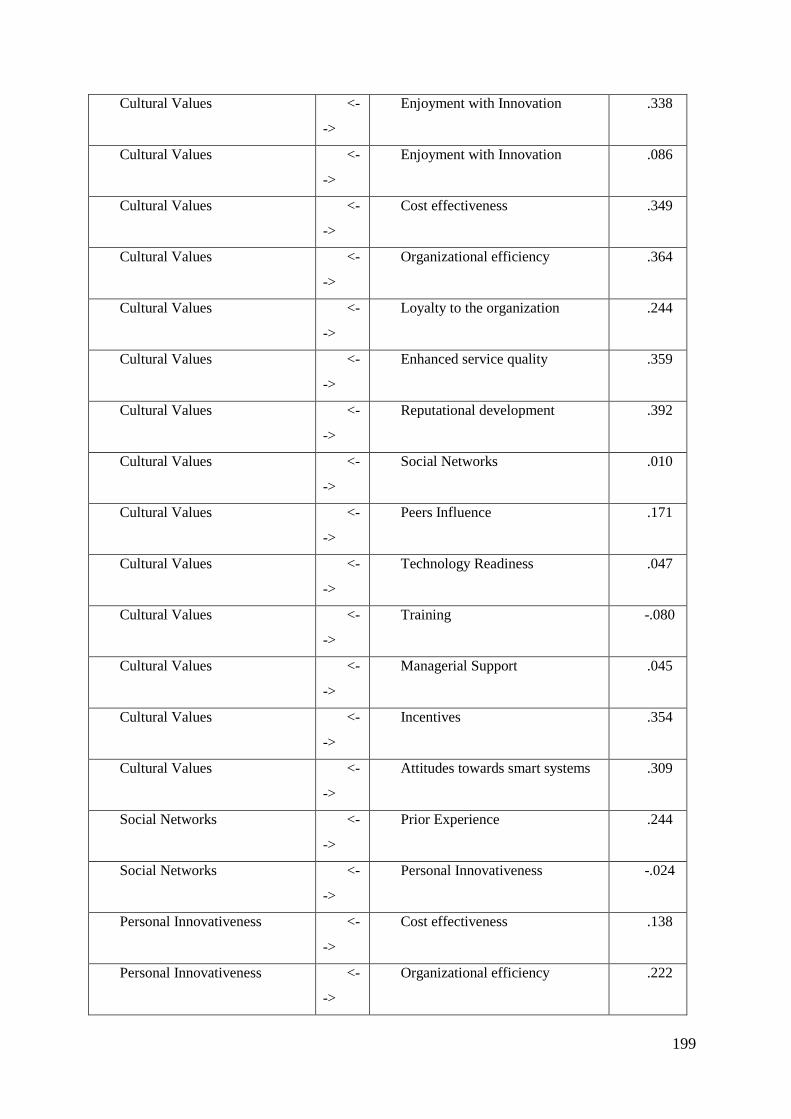
199
Cultural Values <-
->
Enjoyment with Innovation .338
Cultural Values <-
->
Enjoyment with Innovation .086
Cultural Values <-
->
Cost effectiveness .349
Cultural Values <-
->
Organizational efficiency .364
Cultural Values <-
->
Loyalty to the organization .244
Cultural Values <-
->
Enhanced service quality .359
Cultural Values <-
->
Reputational development .392
Cultural Values <-
->
Social Networks .010
Cultural Values <-
->
Peers Influence .171
Cultural Values <-
->
Technology Readiness .047
Cultural Values <-
->
Training -.080
Cultural Values <-
->
Managerial Support .045
Cultural Values <-
->
Incentives .354
Cultural Values <-
->
Attitudes towards smart systems .309
Social Networks <-
->
Prior Experience .244
Social Networks <-
->
Personal Innovativeness -.024
Personal Innovativeness <-
->
Cost effectiveness .138
Personal Innovativeness <-
->
Organizational efficiency .222
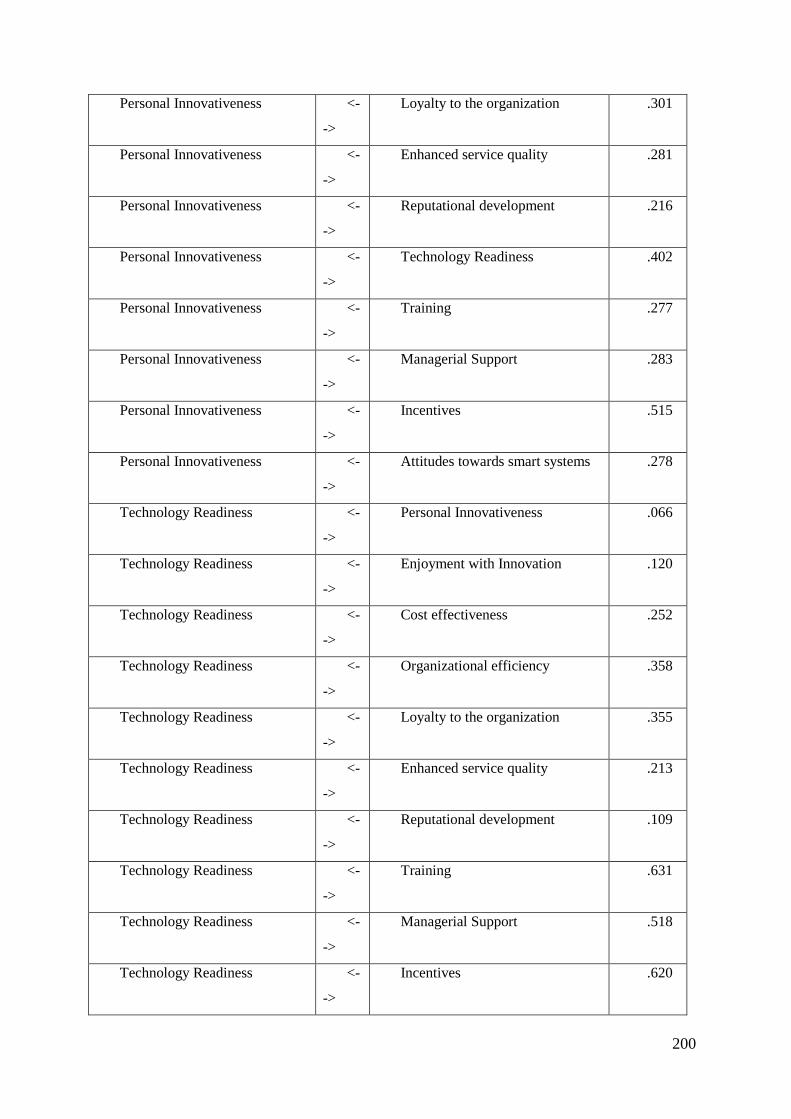
200
Personal Innovativeness <-
->
Loyalty to the organization .301
Personal Innovativeness <-
->
Enhanced service quality .281
Personal Innovativeness <-
->
Reputational development .216
Personal Innovativeness <-
->
Technology Readiness .402
Personal Innovativeness <-
->
Training .277
Personal Innovativeness <-
->
Managerial Support .283
Personal Innovativeness <-
->
Incentives .515
Personal Innovativeness <-
->
Attitudes towards smart systems .278
Technology Readiness <-
->
Personal Innovativeness .066
Technology Readiness <-
->
Enjoyment with Innovation .120
Technology Readiness <-
->
Cost effectiveness .252
Technology Readiness <-
->
Organizational efficiency .358
Technology Readiness <-
->
Loyalty to the organization .355
Technology Readiness <-
->
Enhanced service quality .213
Technology Readiness <-
->
Reputational development .109
Technology Readiness <-
->
Training .631
Technology Readiness <-
->
Managerial Support .518
Technology Readiness <-
->
Incentives .620

201
Technology Readiness <-
->
Attitudes towards smart systems .270
Training <-
->
Prior Experience .419
Training <-
->
Enjoyment with Innovation -.049
Training <-
->
Cost effectiveness .092
Training <-
->
Organizational efficiency .241
Training <-
->
Loyalty to the organization .219
Training <-
->
Enhanced service quality .040
Training <-
->
Reputational development -.045
Training <-
->
Managerial Support .466
Training <-
->
Incentives .484
Training <-
->
Attitudes towards smart systems .120
Managerial Support <-
->
Prior Experience .494
Training <-
->
Peers Influence -.043
Managerial Support <-
->
Cost effectiveness .222
Managerial Support <-
->
Organizational efficiency .320
Managerial Support <-
->
Loyalty to the organization .274
Managerial Support <-
->
Enhanced service quality .068
Incentives <-
->
Reputational development .381
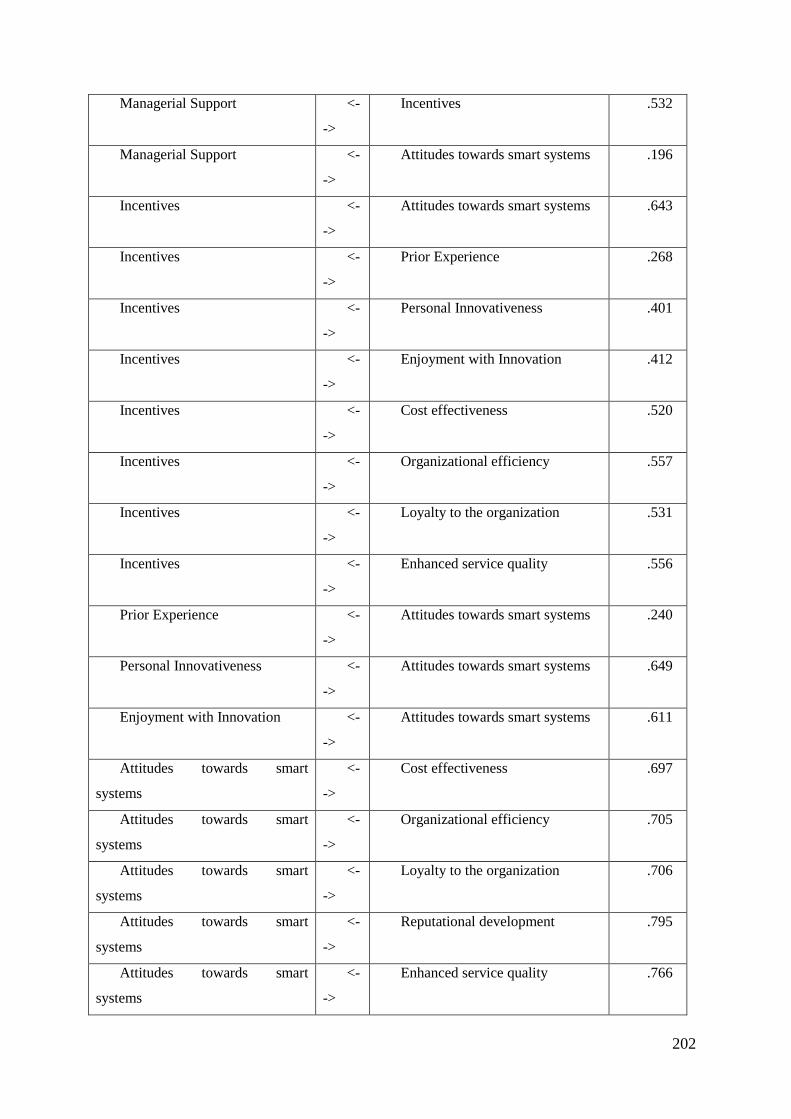
202
Managerial Support <-
->
Incentives .532
Managerial Support <-
->
Attitudes towards smart systems .196
Incentives <-
->
Attitudes towards smart systems .643
Incentives <-
->
Prior Experience .268
Incentives <-
->
Personal Innovativeness .401
Incentives <-
->
Enjoyment with Innovation .412
Incentives <-
->
Cost effectiveness .520
Incentives <-
->
Organizational efficiency .557
Incentives <-
->
Loyalty to the organization .531
Incentives <-
->
Enhanced service quality .556
Prior Experience <-
->
Attitudes towards smart systems .240
Personal Innovativeness <-
->
Attitudes towards smart systems .649
Enjoyment with Innovation <-
->
Attitudes towards smart systems .611
Attitudes towards smart
systems
<-
->
Cost effectiveness .697
Attitudes towards smart
systems
<-
->
Organizational efficiency .705
Attitudes towards smart
systems
<-
->
Loyalty to the organization .706
Attitudes towards smart
systems
<-
->
Reputational development .795
Attitudes towards smart
systems
<-
->
Enhanced service quality .766

203
Personal Innovativeness <-
->
Prior Experience .228
Personal Innovativeness <-
->
Enjoyment with Innovation .759
Enjoyment with Innovation <-
->
Cost effectiveness .603
Cost effectiveness <-
->
Organizational efficiency .756
Organizational efficiency <-
->
Loyalty to the organization .776
Loyalty to the organization <-
->
Enhanced service quality .661
Loyalty to the organization <-
->
Reputational development .753
Organizational efficiency <-
->
Reputational development .658
Enhanced service quality <-
->
Reputational development .794
Cost effectiveness <-
->
Reputational development .695
Enjoyment with Innovation <-
->
Reputational development .780
Personal Innovativeness <-
->
Reputational development .701
Prior Experience <-
->
Reputational development .005
Organizational efficiency <-
->
Enhanced service quality .670
Cost effectiveness <-
->
Enhanced service quality .679
Enjoyment with Innovation <-
->
Enhanced service quality .744
Personal Innovativeness <-
->
Enhanced service quality .586
Prior Experience <-
->
Enhanced service quality .071

204
Cost effectiveness <-
->
Loyalty to the organization .683
Enjoyment with Innovation <-
->
Loyalty to the organization .510
Personal Innovativeness <-
->
Loyalty to the organization .518
Prior Experience <-
->
Loyalty to the organization .201
Enjoyment with Innovation <-
->
Organizational efficiency .542
Personal Innovativeness <-
->
Organizational efficiency .587
Prior Experience <-
->
Organizational efficiency .243
Personal Innovativeness <-
->
Cost effectiveness .654
Prior Experience <-
->
Cost effectiveness .242
Social Networks <-
->
Peers influence .521
Technology Readiness <-
->
Prior Experience .314
6.2.3 Nomological Validity
Table 6.24 demonstrates the covariance of the measurement model. Nomological validity can
be measured by using the covariance method of measurement model. Nomological validity is
examined to define the relationship between one variable upon another variable in a
measurement theory. Nomological validity is a form of construct validity that needs a
comparison of two variables, which must be significant relationship (Hair et al. 2013). In this
study, the relationship estimates are tested to measure the nomological validity of the
measurement model. The findings indicates that all correlations are significant. Thus, a
nomological validity is attained for this study.
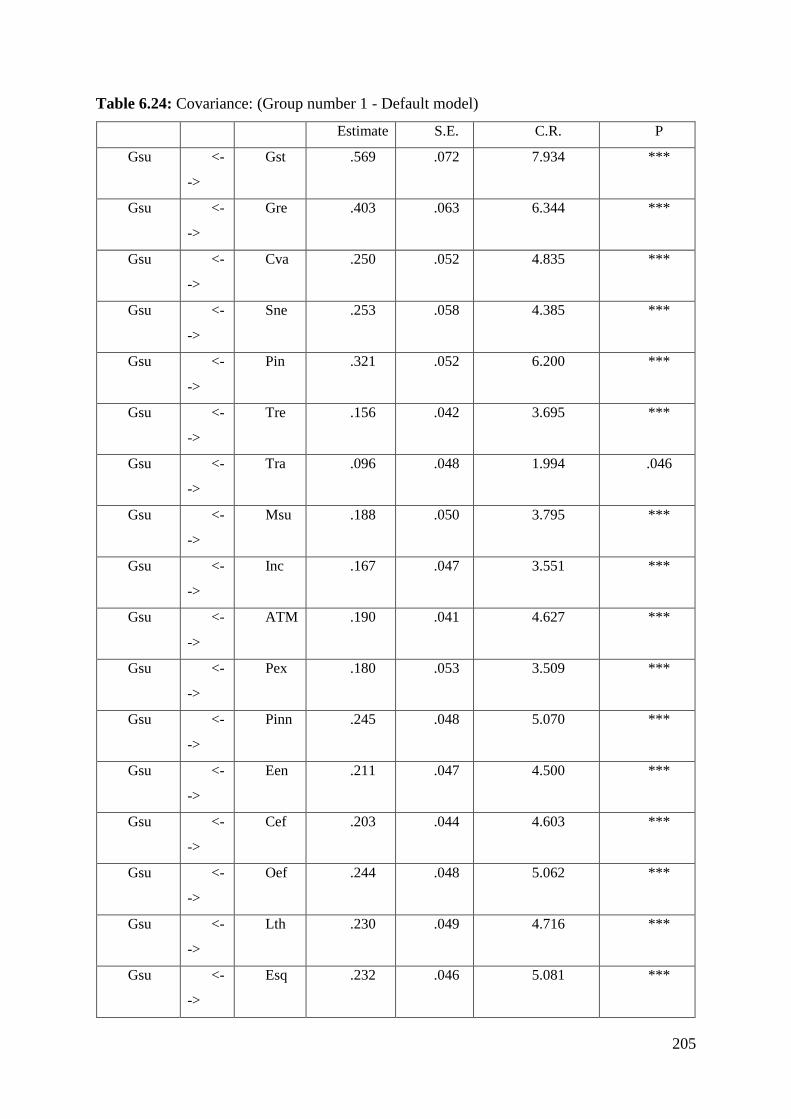
205
Table 6.24: Covariance: (Group number 1 - Default model)
Estimate S.E. C.R. P
Gsu <-
->
Gst .569 .072 7.934 ***
Gsu <-
->
Gre .403 .063 6.344 ***
Gsu <-
->
Cva .250 .052 4.835 ***
Gsu <-
->
Sne .253 .058 4.385 ***
Gsu <-
->
Pin .321 .052 6.200 ***
Gsu <-
->
Tre .156 .042 3.695 ***
Gsu <-
->
Tra .096 .048 1.994 .046
Gsu <-
->
Msu .188 .050 3.795 ***
Gsu <-
->
Inc .167 .047 3.551 ***
Gsu <-
->
ATM .190 .041 4.627 ***
Gsu <-
->
Pex .180 .053 3.509 ***
Gsu <-
->
Pinn .245 .048 5.070 ***
Gsu <-
->
Een .211 .047 4.500 ***
Gsu <-
->
Cef .203 .044 4.603 ***
Gsu <-
->
Oef .244 .048 5.062 ***
Gsu <-
->
Lth .230 .049 4.716 ***
Gsu <-
->
Esq .232 .046 5.081 ***
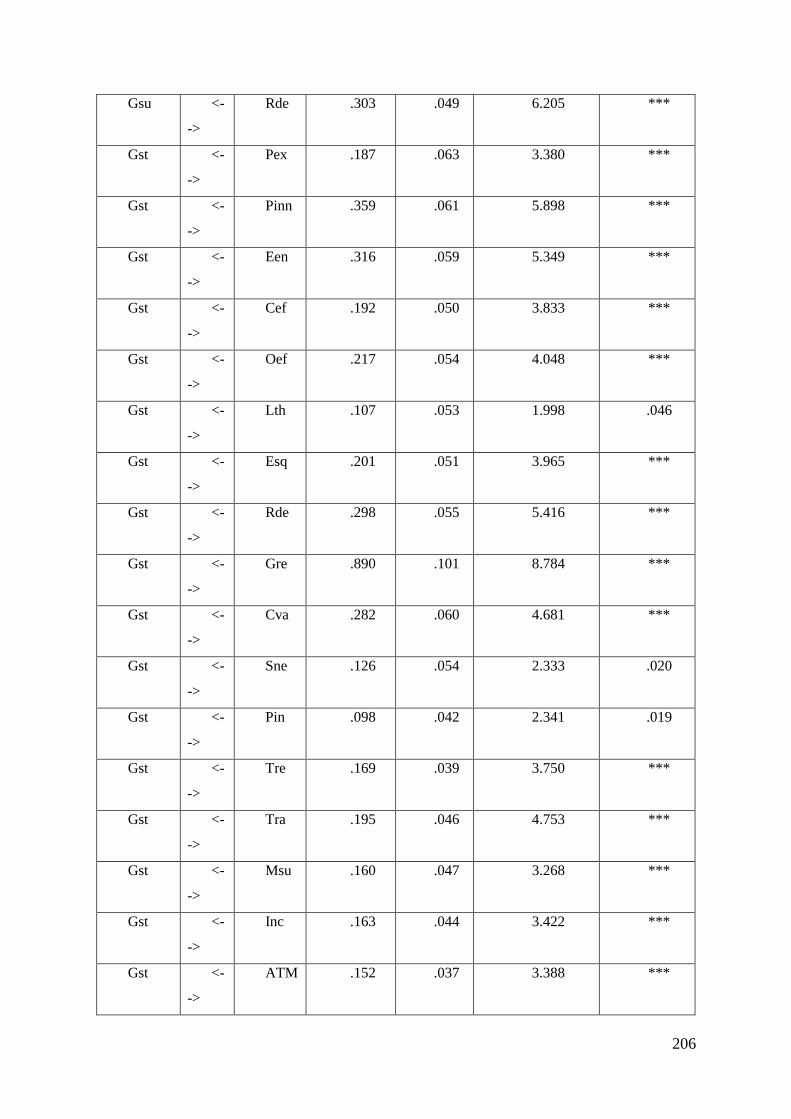
206
Gsu <-
->
Rde .303 .049 6.205 ***
Gst <-
->
Pex .187 .063 3.380 ***
Gst <-
->
Pinn .359 .061 5.898 ***
Gst <-
->
Een .316 .059 5.349 ***
Gst <-
->
Cef .192 .050 3.833 ***
Gst <-
->
Oef .217 .054 4.048 ***
Gst <-
->
Lth .107 .053 1.998 .046
Gst <-
->
Esq .201 .051 3.965 ***
Gst <-
->
Rde .298 .055 5.416 ***
Gst <-
->
Gre .890 .101 8.784 ***
Gst <-
->
Cva .282 .060 4.681 ***
Gst <-
->
Sne .126 .054 2.333 .020
Gst <-
->
Pin .098 .042 2.341 .019
Gst <-
->
Tre .169 .039 3.750 ***
Gst <-
->
Tra .195 .046 4.753 ***
Gst <-
->
Msu .160 .047 3.268 ***
Gst <-
->
Inc .163 .044 3.422 ***
Gst <-
->
ATM .152 .037 3.388 ***
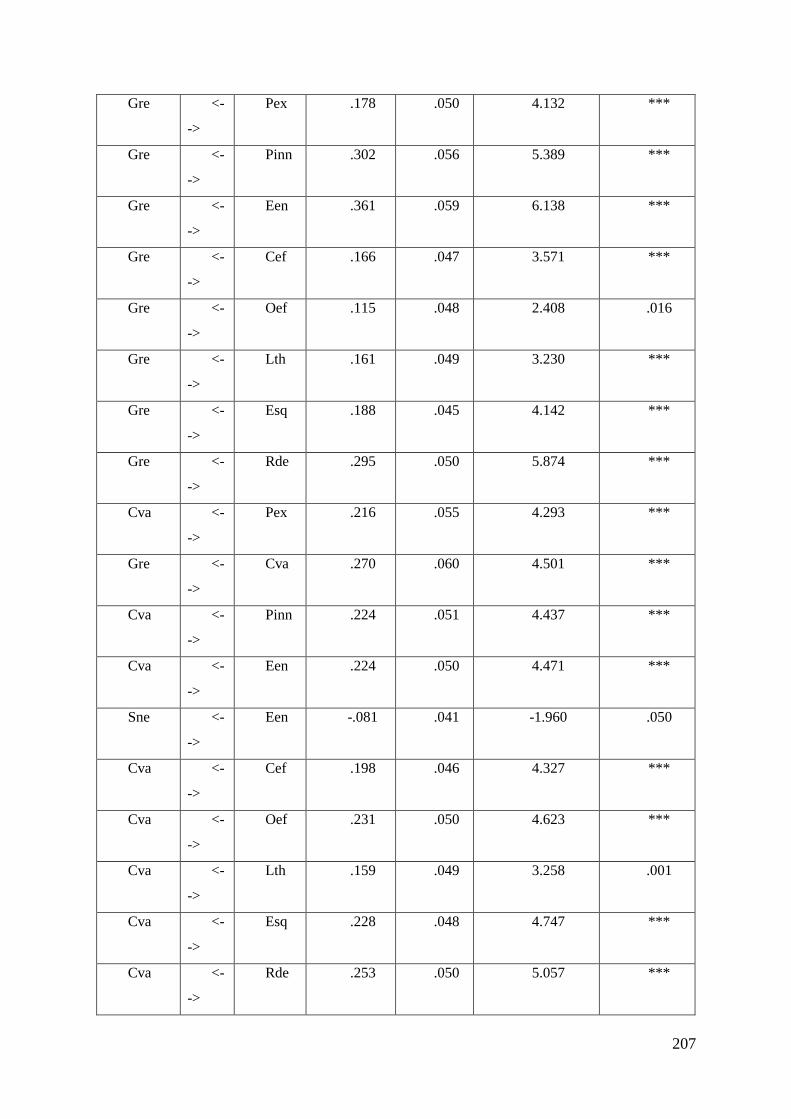
207
Gre <-
->
Pex .178 .050 4.132 ***
Gre <-
->
Pinn .302 .056 5.389 ***
Gre <-
->
Een .361 .059 6.138 ***
Gre <-
->
Cef .166 .047 3.571 ***
Gre <-
->
Oef .115 .048 2.408 .016
Gre <-
->
Lth .161 .049 3.230 ***
Gre <-
->
Esq .188 .045 4.142 ***
Gre <-
->
Rde .295 .050 5.874 ***
Cva <-
->
Pex .216 .055 4.293 ***
Gre <-
->
Cva .270 .060 4.501 ***
Cva <-
->
Pinn .224 .051 4.437 ***
Cva <-
->
Een .224 .050 4.471 ***
Sne <-
->
Een -.081 .041 -1.960 .050
Cva <-
->
Cef .198 .046 4.327 ***
Cva <-
->
Oef .231 .050 4.623 ***
Cva <-
->
Lth .159 .049 3.258 .001
Cva <-
->
Esq .228 .048 4.747 ***
Cva <-
->
Rde .253 .050 5.057 ***

208
Cva <-
->
Sne .209 .054 4.164 ***
Cva <-
->
Pin .113 .045 2.502 .012
Cva <-
->
Tre .230 .042 4.711 ***
Cva <-
->
Tra .263 .050 5.260 ***
Cva <-
->
Msu .235 .050 5.697 ***
Cva <-
->
Inc .250 .053 4.718 ***
Cva <-
->
ATM .188 .044 4.271 ***
Sne <-
->
Pex .287 .067 4.300 ***
Sne <-
->
Pinn .222 .044 5.502 ***
Pin <-
->
Cef .082 .034 2.367 .018
Pin <-
->
Oef .146 .039 3.709 ***
Pin <-
->
Lth .203 .043 4.719 ***
Pin <-
->
Esq .185 .037 4.950 ***
Pin <-
->
Rde .145 .035 4.141 ***
Pin <-
->
Tre .268 .046 5.810 ***
Pin <-
->
Tra .227 .050 4.573 ***
Pin <-
->
Msu .229 .049 4.671 ***
Pin <-
->
Inc .378 .054 7.011 ***

209
Pin <-
->
ATM .176 .036 4.952 ***
Tre <-
->
Pinn .144 .032 3.389 ***
Tre <-
->
Een .080 .032 2.552 .011
Tre <-
->
Cef .144 .039 3.703 ***
Tre <-
->
Oef .229 .045 5.130 ***
Tre <-
->
Lth .233 .045 5.149 ***
Tre <-
->
Esq .137 .039 3.518 ***
Tre <-
->
Rde .071 .032 2.235 .025
Tre <-
->
Tra .660 .073 9.004 ***
Tre <-
->
Msu .644 .071 9.093 ***
Tre <-
->
Inc .442 .058 7.643 ***
Tre <-
->
ATM .166 .038 4.419 ***
Tra <-
->
Pex .429 .071 6.032 ***
Tra <-
->
Een .240 .034 4.181 ***
Tra <-
->
Cef .165 .044 3.479 ***
Tra <-
->
Oef .189 .050 3.769 ***
Tra <-
->
Lth .177 .051 3.478 ***
Tra <-
->
Esq .231 .043 3.717 ***
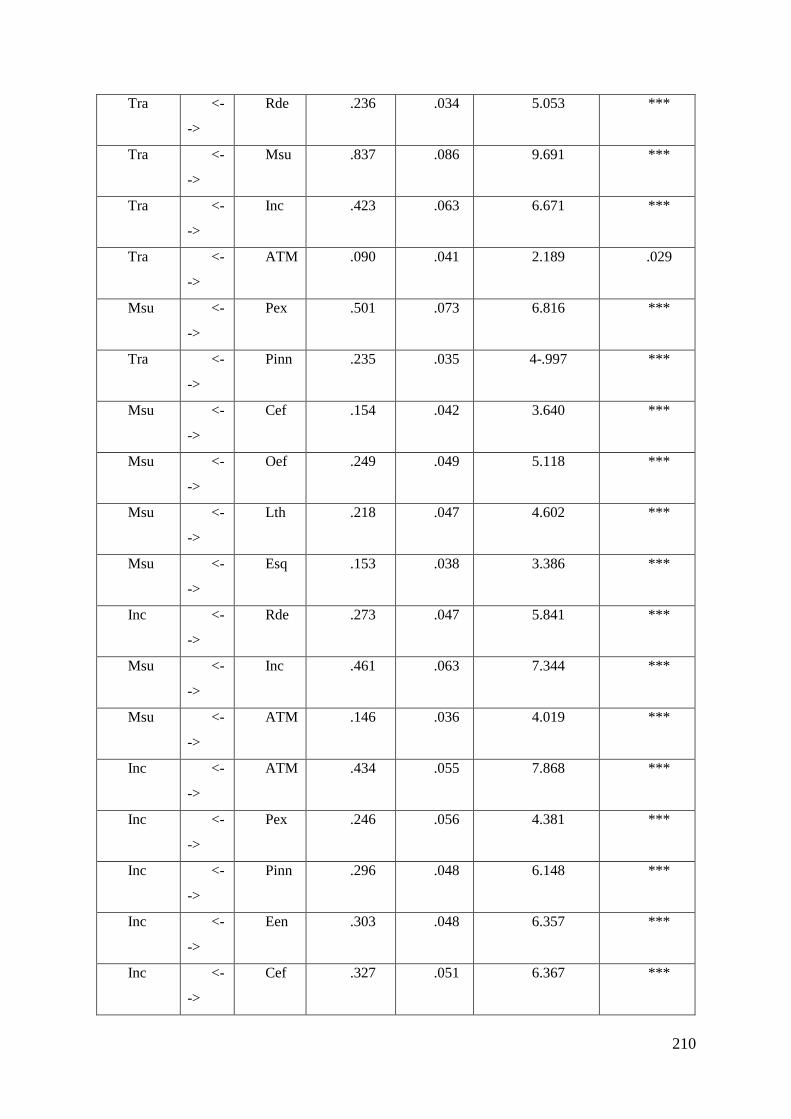
210
Tra <-
->
Rde .236 .034 5.053 ***
Tra <-
->
Msu .837 .086 9.691 ***
Tra <-
->
Inc .423 .063 6.671 ***
Tra <-
->
ATM .090 .041 2.189 .029
Msu <-
->
Pex .501 .073 6.816 ***
Tra <-
->
Pinn .235 .035 4-.997 ***
Msu <-
->
Cef .154 .042 3.640 ***
Msu <-
->
Oef .249 .049 5.118 ***
Msu <-
->
Lth .218 .047 4.602 ***
Msu <-
->
Esq .153 .038 3.386 ***
Inc <-
->
Rde .273 .047 5.841 ***
Msu <-
->
Inc .461 .063 7.344 ***
Msu <-
->
ATM .146 .036 4.019 ***
Inc <-
->
ATM .434 .055 7.868 ***
Inc <-
->
Pex .246 .056 4.381 ***
Inc <-
->
Pinn .296 .048 6.148 ***
Inc <-
->
Een .303 .048 6.357 ***
Inc <-
->
Cef .327 .051 6.367 ***
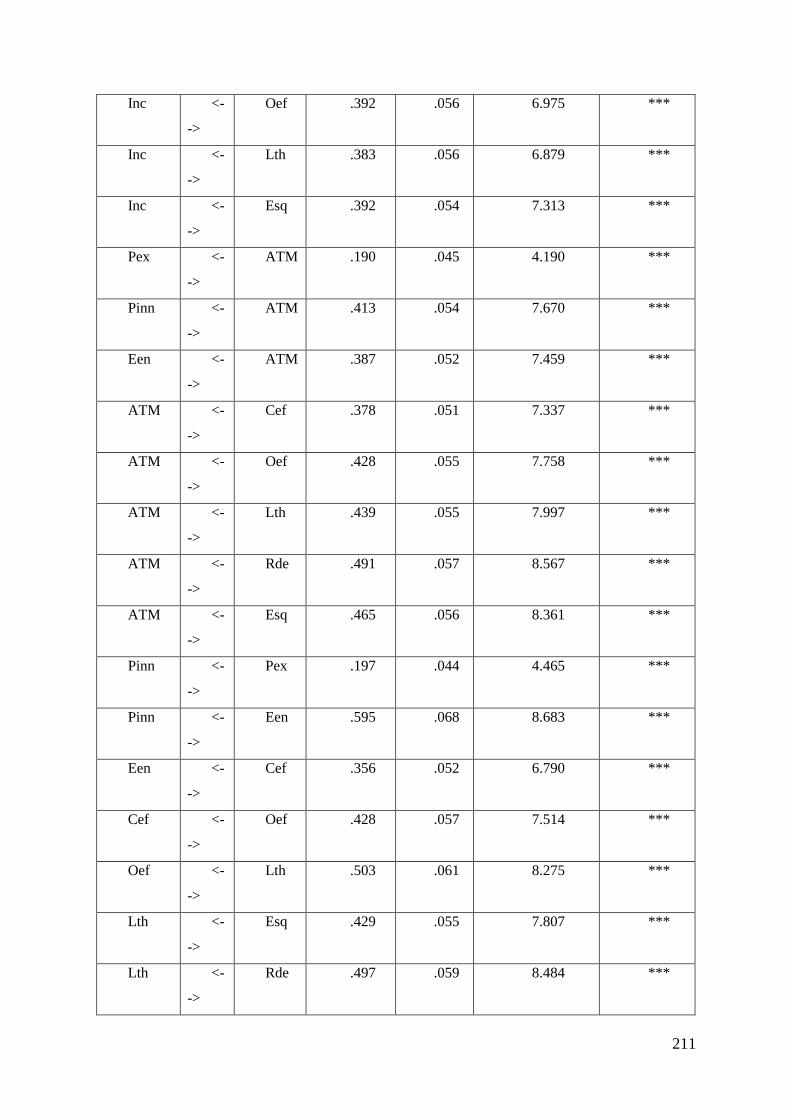
211
Inc <-
->
Oef .392 .056 6.975 ***
Inc <-
->
Lth .383 .056 6.879 ***
Inc <-
->
Esq .392 .054 7.313 ***
Pex <-
->
ATM .190 .045 4.190 ***
Pinn <-
->
ATM .413 .054 7.670 ***
Een <-
->
ATM .387 .052 7.459 ***
ATM <-
->
Cef .378 .051 7.337 ***
ATM <-
->
Oef .428 .055 7.758 ***
ATM <-
->
Lth .439 .055 7.997 ***
ATM <-
->
Rde .491 .057 8.567 ***
ATM <-
->
Esq .465 .056 8.361 ***
Pinn <-
->
Pex .197 .044 4.465 ***
Pinn <-
->
Een .595 .068 8.683 ***
Een <-
->
Cef .356 .052 6.790 ***
Cef <-
->
Oef .428 .057 7.514 ***
Oef <-
->
Lth .503 .061 8.275 ***
Lth <-
->
Esq .429 .055 7.807 ***
Lth <-
->
Rde .497 .059 8.484 ***
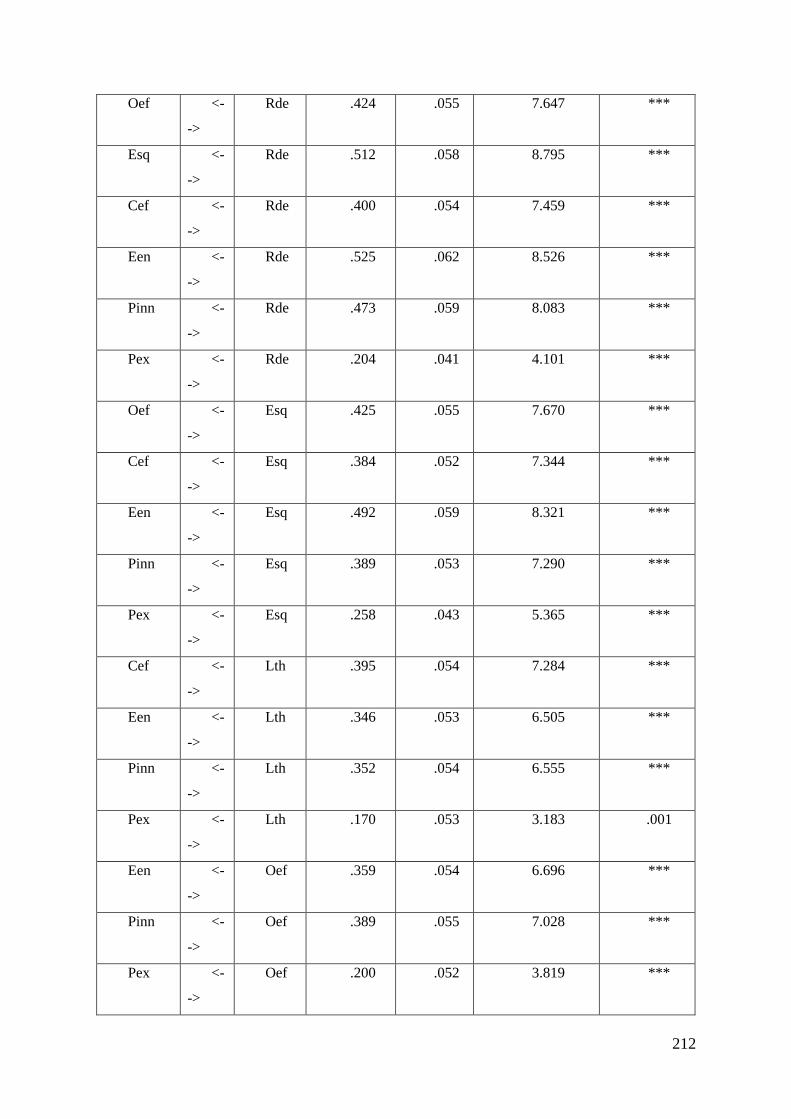
212
Oef <-
->
Rde .424 .055 7.647 ***
Esq <-
->
Rde .512 .058 8.795 ***
Cef <-
->
Rde .400 .054 7.459 ***
Een <-
->
Rde .525 .062 8.526 ***
Pinn <-
->
Rde .473 .059 8.083 ***
Pex <-
->
Rde .204 .041 4.101 ***
Oef <-
->
Esq .425 .055 7.670 ***
Cef <-
->
Esq .384 .052 7.344 ***
Een <-
->
Esq .492 .059 8.321 ***
Pinn <-
->
Esq .389 .053 7.290 ***
Pex <-
->
Esq .258 .043 5.365 ***
Cef <-
->
Lth .395 .054 7.284 ***
Een <-
->
Lth .346 .053 6.505 ***
Pinn <-
->
Lth .352 .054 6.555 ***
Pex <-
->
Lth .170 .053 3.183 .001
Een <-
->
Oef .359 .054 6.696 ***
Pinn <-
->
Oef .389 .055 7.028 ***
Pex <-
->
Oef .200 .052 3.819 ***

213
Pinn <-
->
Cef .387 .055 7.108 ***
Pex <-
->
Cef .178 .048 3.695 ***
Sne <-
->
Pin .490 .069 7.134 ***
Tre <-
->
Pex .262 .055 4.723 ***
Note: Note: Gsu= Government Support, Gst= Government Strategy, Gre= Government
Regulations, Gsu= Government Support, Gst= Government Strategy, Gre= Government
Regulations, Cva= Cultural Values, Sne= Social Networks, Pin= Peers Influence, Tre=
Technology Readiness, Tra= Training, Msu= Managerial Support, Inc= Incentives, Pin=
Personal Innovativeness, Pex= Prior Experience, Een= Enjoyment with Innovation,
Atm=Attitudes towards smart systems, Cef=Cost effectiveness, Oef= Organizational
efficiency, Lth= Loyalty to the organization, Esq= Enhanced service quality, Rde=
Reputational development.
6.2.4 Construct Reliability
Table 6.25 shows the confirmatory factor analysis of the measurement model. The average
variance extracted (AVE) and composite reliability (CR) are used to determine the
construct’s reliability. Hair et al. (2016) stated that to measure the construct’s reliability, the
value of composite reliability and average variance should be greater than 0.60 and 0.50
respectively. In this study, the AVE and CR values for all constructs did achieve the
threshold except the AVE value of the government strategy construct, while its CR value
achieved the required level. Hence, the AVE value of government strategy is very close to
0.50 and CR value is above 0.60, indicating the achievement of construct validity. Bourgeois
et al. (2011) accepted the threshold point of 0.40 for AVE.
As well, in this study, the CR value established a high level of consistency. The findings
revealed that the CR values were as follows: government support (0.826), government
strategy (0.603), government relations (0.781), cultural values (0.736), social networks
(0.815), peers influence (0.761), technological readiness (0.805), managerial support (0.809),
training (0.867), incentive (0.766), prior experience (0.787), personal innovativeness (0.753),

214
enjoyment with innovation, (0.766), cost effectiveness (0.696), organizational efficiency
(0.740), loyalty to the organization (0.715), enhanced service quality (0.786), reputational
development (0.763) and attitude towards smart system (0.819).
The findings also revealed that the AVE values were as follows: government support (0.613),
government relations (0.543), cultural values (0.502), social networks (0.600), peers
influence (0.516), technology readiness (0.584), managerial support (0.586), training (0.620),
incentive (0.522), prior experience (0.550), personal innovativeness (0.504), enjoyment with
innovation, (0.522), cost effectiveness (0.503), organizational efficiency (0.507), loyalty to
the organization (0.557), enhanced service quality (0.551), reputational development (0.518)
and attitude towards smart system (0.531). Both AVE and CR of training (AVE= 0.620, CR=
0.867) and social networks (AVE= 0.600, CR= 0.815) indicated the dimensions did attain the
highest level of validity.
Table 6.25: Results of Confirmatory Factor Analysis (CFA)
Code Items Load
ing
A
VE
CR
Government Support 0.
613
0.8
26
Sup1 Government encourages using smart systems. 0.768
Sup2 Government facilities are available to use smart
systems.
0.826
Sup3 Government promotes smart systems usage. 0.752
Government Strategy 0.472 0.603
Sta1 Government provides awareness of smart systems. 0.656
Sta2 Employment opportunities are higher for those who
use smart systems?
0.658
Government Regulations 0.543 0.781
Req3 Country’s legal system supports the adoption of smart
system.
0.755
Req4 Government regulations assist individuals to use
smart systems.
0.743
Req5 Government regulations are important for smart
systems adoption.
0.713
Cultural Values 0.502 0.736
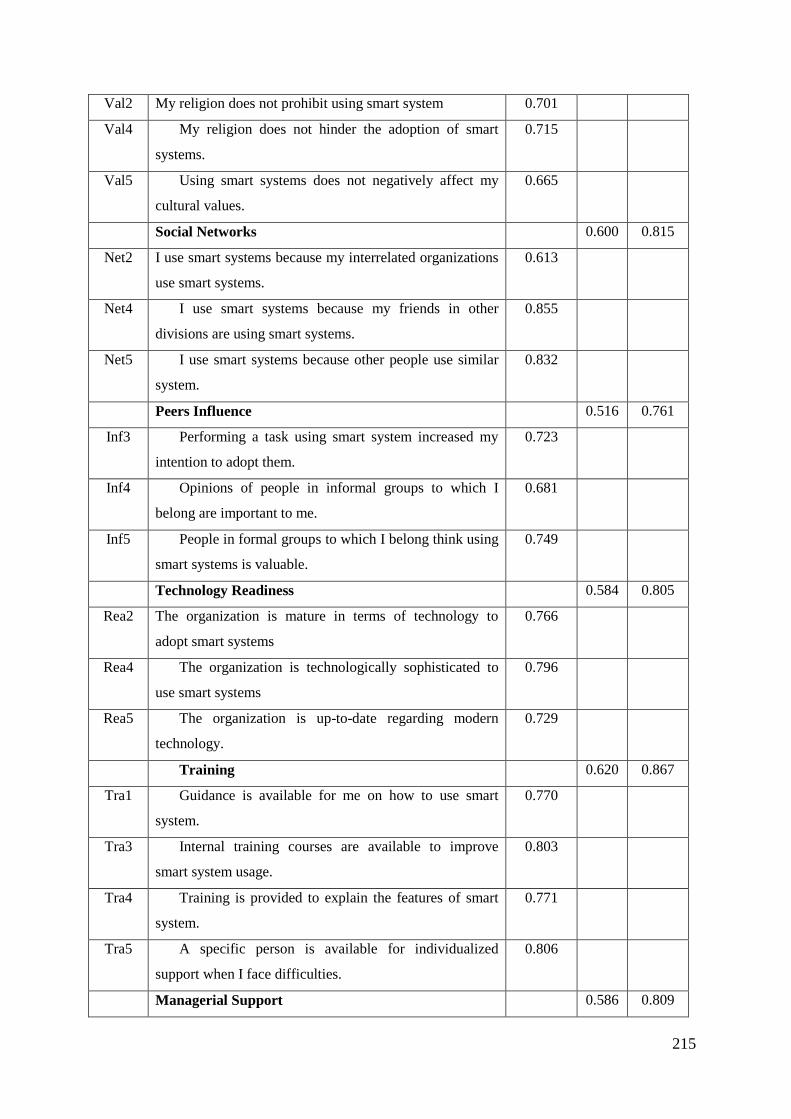
215
Val2 My religion does not prohibit using smart system 0.701
Val4 My religion does not hinder the adoption of smart
systems.
0.715
Val5 Using smart systems does not negatively affect my
cultural values.
0.665
Social Networks 0.600 0.815
Net2 I use smart systems because my interrelated organizations
use smart systems.
0.613
Net4 I use smart systems because my friends in other
divisions are using smart systems.
0.855
Net5 I use smart systems because other people use similar
system.
0.832
Peers Influence 0.516 0.761
Inf3 Performing a task using smart system increased my
intention to adopt them.
0.723
Inf4 Opinions of people in informal groups to which I
belong are important to me.
0.681
Inf5 People in formal groups to which I belong think using
smart systems is valuable.
0.749
Technology Readiness 0.584 0.805
Rea2 The organization is mature in terms of technology to
adopt smart systems
0.766
Rea4 The organization is technologically sophisticated to
use smart systems
0.796
Rea5 The organization is up-to-date regarding modern
technology.
0.729
Training 0.620 0.867
Tra1 Guidance is available for me on how to use smart
system.
0.770
Tra3 Internal training courses are available to improve
smart system usage.
0.803
Tra4 Training is provided to explain the features of smart
system.
0.771
Tra5 A specific person is available for individualized
support when I face difficulties.
0.806
Managerial Support 0.586 0.809
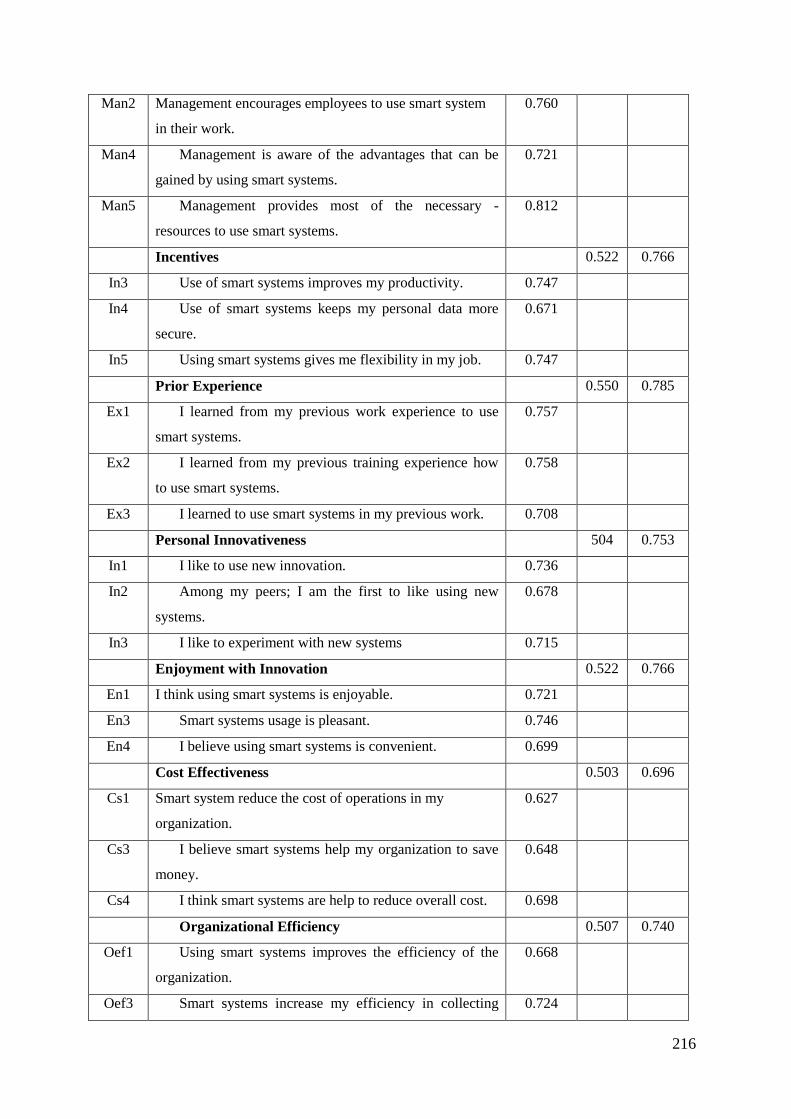
216
Man2 Management encourages employees to use smart system
in their work.
0.760
Man4 Management is aware of the advantages that can be
gained by using smart systems.
0.721
Man5 Management provides most of the necessary -
resources to use smart systems.
0.812
Incentives 0.522 0.766
In3 Use of smart systems improves my productivity. 0.747
In4 Use of smart systems keeps my personal data more
secure.
0.671
In5 Using smart systems gives me flexibility in my job. 0.747
Prior Experience 0.550 0.785
Ex1 I learned from my previous work experience to use
smart systems.
0.757
Ex2 I learned from my previous training experience how
to use smart systems.
0.758
Ex3 I learned to use smart systems in my previous work. 0.708
Personal Innovativeness 504 0.753
In1 I like to use new innovation. 0.736
In2 Among my peers; I am the first to like using new
systems.
0.678
In3 I like to experiment with new systems 0.715
Enjoyment with Innovation 0.522 0.766
En1 I think using smart systems is enjoyable. 0.721
En3 Smart systems usage is pleasant. 0.746
En4 I believe using smart systems is convenient. 0.699
Cost Effectiveness 0.503 0.696
Cs1 Smart system reduce the cost of operations in my
organization.
0.627
Cs3 I believe smart systems help my organization to save
money.
0.648
Cs4 I think smart systems are help to reduce overall cost. 0.698
Organizational Efficiency 0.507 0.740
Oef1 Using smart systems improves the efficiency of the
organization.
0.668
Oef3 Smart systems increase my efficiency in collecting 0.724

217
information.
Oef4 Smart systems enhance my efficiency by increasing
the level of interaction.
0.700
Loyalty to the Organization 0.557 0.715
Lo1 Adoption of smart systems helps meto become happy
with the organization.
0.725
Lo2 Smart systems adoption improves my satisfaction
with the organization.
0.767
Enhanced Service Quality 0.551 0.786
Qa3 Smart systems help me to easily access information. 0.742
Qa4 Smart systems provide me with quick service. 0.749
Qa5 Smart systems help me to do the work with less effort. 0.736
Reputational Development 0.518 0.763
Re2 Using smart systems improves the organization’
image. .737
Re3 Using smart systems helps to increase employees’
profile. .722
Re5 I believe using smart systems increases the
organization’s status. .699
Attitude towards Smart Systems 0.531 0.819
At2 Using smart systems is relevant to your job. .682
At3 Using smart systems is helpful. .735
At4 Using smart systems is practical. .776
At5 I like the idea of using smart systems. .718
6.3 Structural Model Analysis
6.3.1 Goodness-of-fit Test
Based on the structural model (refer to Figure 6.9), the causal relationship is determined as it
depicts the relationship between independent and dependent constructs. The proposed model
is validated by Confirmatory Factor Analysis (CFA) which is also applied to the structural
model for testing of hypotheses. The findings of the structural model show the reasonable
model fit in the first iteration- CIMN/df= 2.990, significant p at 0.05, RMSEA= 0.088, CFI=
0.902, GFI= 0.898, AGFI= 0.887, PNFI= 0.711 and PCFI= 0.735. The goodness-of-fit index

218
value is lower than the threshold with the exception of CIMN/df= 2.990< 3.0, RMSEA=
0.078< 0.08, CFI= 0.902> 0.90, PNiF= 0.711> 0.50, PCFI= 0.735> 0.50, HOELTER 0.05
and HOELTER 0.01 (see Table 6.26).
However, after the first iteration the model’s fit is excellent- CIMN/df= 0.1865<3.0,
significant p at 0.05, RMSEA= 0.065< 0.08, CFI= 0.953> 0.90, GFI= 0.967> 0.90, AGFI=
0.941> 0.90, PNFI= 0.711> 0.50, PCFI= 0.735> 0.50, HOELTER 0.05 and HOELTER 0.01.
PRATIO= 0.903 also shows the complexity of the hypothesized model in the assessment of
overall model fit. It can be concluded that the goodness-of-fit of the proposed model is
acceptable.
Table 6.26: Goodness-of-fit Measures of Structural Model
Model fit Iteration 1 Iteration 2
Value (s) Value (s)
Del net5; tra5; cs4; ef4; qa5; re3
P-value>0.05 0.000* 0.000*
CMIN/df<3.0 2.990 1.865
RMSEA<0.08 0.078 0.065
CFI>0.90 0.902 0.953
GFI>0.90 0.898 0.967
AGFI>0.90 0.887 0.941
PARATIO 0.813 0.903
PNFI>0.50 0.711 0.787
PCFI>0.50 0.735 0.808
HOELTER 0.05 189 262
HOELTER 0.01 199 275
Note: *Significant at 0.01 level, CMIN/df= minimum discrepancy, RMSEA= Root means
square error of approximation, CFI= Comparative fit index, GFI= Goodness-of-fit index,
AGFI= Adjusted goodness-of-fit index.
6.3.2 Path Analysis of Structural Model
Seven hypotheses (i.e H1, H2, H3, H4, H5, H6 and H7) are tested in this structural model
(Figure 6.9), and Table 6.27 demonstrates that all the hypotheses are supported. Political

219
drivers, social influence, technology orientation and personal factors explained 0.56% (R2) of
the association between these constructs and attitudes towards smart systems (Figure 6.9).
H1: There is a significant relationship between political drivers and attitudes towards
smart systems.
The path that connects political derivers yielded a coefficient value of 0.453 which is
significant at 0.001 (SE= 0.076; CR= 5.861). This indicates that political drivers is
statistically significant and combined with attitudes has a positive relationship towards smart
systems. Therefore, H1 is accepted.

220
Figure 6.9: Structural model for the adoption of smart systems
Note: ATSY= Attitudes towards smart systems, PD= Political drivers, SIN= Social influence,
TEO= Technology orientation, PF= Personal factors, ASS= Adoption of smart systems, EB=
Economic benefits, SB= Social benefits.
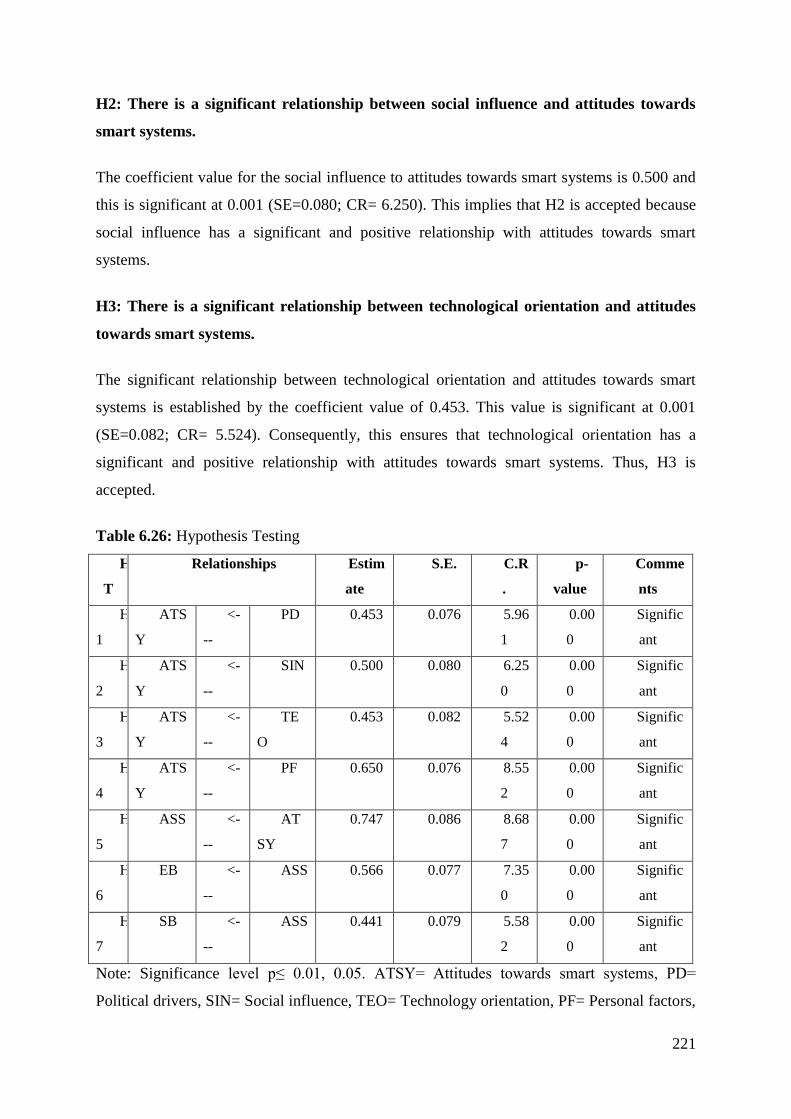
221
H2: There is a significant relationship between social influence and attitudes towards
smart systems.
The coefficient value for the social influence to attitudes towards smart systems is 0.500 and
this is significant at 0.001 (SE=0.080; CR= 6.250). This implies that H2 is accepted because
social influence has a significant and positive relationship with attitudes towards smart
systems.
H3: There is a significant relationship between technological orientation and attitudes
towards smart systems.
The significant relationship between technological orientation and attitudes towards smart
systems is established by the coefficient value of 0.453. This value is significant at 0.001
(SE=0.082; CR= 5.524). Consequently, this ensures that technological orientation has a
significant and positive relationship with attitudes towards smart systems. Thus, H3 is
accepted.
Table 6.26: Hypothesis Testing
H
T
Relationships Estim
ate
S.E. C.R
.
p-
value
Comme
nts
H
1
ATS
Y
<-
--
PD 0.453 0.076 5.96
1
0.00
0
Signific
ant
H
2
ATS
Y
<-
--
SIN 0.500 0.080 6.25
0
0.00
0
Signific
ant
H
3
ATS
Y
<-
--
TE
O
0.453 0.082 5.52
4
0.00
0
Signific
ant
H
4
ATS
Y
<-
--
PF 0.650 0.076 8.55
2
0.00
0
Signific
ant
H
5
ASS <-
--
AT
SY
0.747 0.086 8.68
7
0.00
0
Signific
ant
H
6
EB <-
--
ASS 0.566 0.077 7.35
0
0.00
0
Signific
ant
H
7
SB <-
--
ASS 0.441 0.079 5.58
2
0.00
0
Signific
ant
Note: Significance level p≤ 0.01, 0.05. ATSY= Attitudes towards smart systems, PD=
Political drivers, SIN= Social influence, TEO= Technology orientation, PF= Personal factors,

222
ASS= Adoption of smart systems, EB= Economic benefits, SB= Social benefits, HT=
Hypothesis, SE= Standard error, CR= Critical ratio.
H4: There is a significant relationship between personal factors and attitudes towards
smart systems.
The path that connects personal factors yielded a coefficient value 0.650 which is significant
at 0.001 (SE= 0.076; CR= 8.552). This shows that personal factor is statistically significant
and positive relationship with attitudes towards smart systems. Therefore, H4 is accepted.
H5: There is a significant relationship between attitudes towards smart systems and
adoption of smart systems.
The significant relationship between attitudes towards smart systems and adoption of smart
systems is established by the coefficient value of 0.747. This value is significant at 0.001
(SE=0.086; CR= 8.687). Accordingly, it can be stated that attitudes towards smart systems is
a significant determinant of adoption of smart systems. Here, H5 is accepted.
H6: There is a significant relationship between adoption of smart systems and economic
benefits.
The coefficient value for the adoption of smart systems to economic benefits is 0.566 and this
is significant at 0.001 (SE=0.077; CR= 7.350). This implies the adoption of smart systems
has a significant and positive relationship with economic benefits. Therefore, H6 is accepted.
H7: There is a significant relationship between adoption of smart systems and social
benefits.
The path that connects political derivers yielded a coefficient value of 0.441 which is
significant at 0.001 (SE= 0.079; CR= 5.582). This indicates that adoption of smart systems is
statistically significant and has a positive relationship with social benefits. Therefore, H7 is
accepted.

223
CHAPTER SEVEN
CONCLUSION AND IMPLICATIONS
7.1 Introduction
This thesis tested an enhanced conceptual model of smart system adoption – the FAHR, by
employees of three ministries in the United Arab Emirates (UAE). The proposed model was
explored and tested using a quantitative questionnaire survey method, completed by 357
employees in the Ministry of Foreign Affairs and International Cooperation, Ministry of
Economy and Ministry of Health. The findings were presented and discussed. This chapter
summarizes the research and presents conclusions, including the theoretical contribution and
implications for policy and practice. Research limitations and future directions for research
on this topic are also made.
7.2 Summary of the Research
Smart systems usage is becoming increasingly popular at both the individual and
organizational levels. Smart systems make substantial impacts on people’s lifestyles, as
shown by the integration of smart systems in the public and private sectors, such as in
healthcare, entertainment, communication and customer service. Smart systems technologies
are at the forefront of the innovation process; usage of smart systems has resulted in
economic growth, with the potential to revolutionize person–technology interaction. The
application of smart systems in a business organization can enhance its decision-making, its
effectiveness and the quality of its services.
Yet only limited research has been conducted on the determinants of smart system adoption,
particularly in the Middle East. There is a gap in the current literature in that we know
relatively little about the ways in which, or reasons why, individuals adopt smart systems and
the impacts of accepting and implementing smart systems. This study aims to help build
knowledge in the literature by developing a usable, comprehensive model of smart system
adoption for the Middle East, based on an examination of smart system adoption by
government employees in the UAE. Three objectives were proposed to make this possible:

224
1. Examine the factors influencing the adoption of smart systems in the UAE,
2. Evaluate the impact of smart systems on organizational performance in the UAE, and
3. Outline the economic and social benefits of smart systems in the UAE.
An extensive literature review was undertaken from which a theoretical construct was
proposed and a conceptual model developed. The study took into consideration the strengths
and limitations of other theoretical and conceptual models: the theory of reasoned action
(TRA) by Ajzen and Fishbein (1980); the technology acceptance model (TAM) by Davis
(1989); the unified theory of acceptance and use of technology (UTAUT) by Venkatesh et al.
(2003); the theory of planned behavior (TPB) by Ajzen (1985) and Ajzen (1987); the
diffusion of innovations (DOI) by Rogers (1962); the technology–organization–environment
(TOE) framework by Tornatzky and Fleischer (1990); the social construction of technology
(SCT) by Pinch and Bijker (1987); and the information systems success model (IS success
model) by DeLone and McLean (1992). The model developed in this study maintains the
basic structure of the TRA and TAM and incorporates elements from other models, with
several modifications. Furthermore, a few more factors found in various innovation adoption-
related studies were added to the model, as well as demographic variables, because they were
not present in the TAM, TRA or other theoretical models.
Data was collected from public sector employees of the UAE to test the relevance of the
proposed conceptual model and to obtain further insights into the factors that affect the
adoption and usage of smart systems. Statistical analysis of data was done using Statistical
Package for Social Sciences (SPSS) software. The study calculated frequency distribution
and percentages, and a series of cross-tabulations were performed. The study also conducted
correlation matrices, tests for reliability and analysis of variance (ANOVA). Finally, to test
the proposed model, multiple regression analysis was undertaken on the collected data. The
study’s model found that 65% of variance of the determinants affected people’s attitudes to
the adoption of smart systems. The impact of adopting smart systems in the UAE had
significant economic and social benefits. This quantitative study helps us to better
understand the factors that affect adoption and continuous usage of smart systems. The results
of this study also assisted in the validation of the proposed model.

225
Given some of the demographics of participants in the study, and by implication, employee
coverage in the UAE, (over 91% being between 20 and 49 years of age and 85% having a
minimum of undergraduate-degree), it is within expectations that almost 80% of employees
use smart systems for over 2 hours every week, with over 40% reporting spending over 5
hours per day. Such usage covers accessed features and applications in a variety of work, job
or personal situations. Strong, significant and positive links were established between the
dependent and independent variables concerning the adoption of smart systems and the
impacts on all six factors identified in the model (i.e. cost effectiveness, efficiency, loyalty to
the organization, quality of the service, reputation and relationships with customers).
Accordingly, interesting and impressive predictions were soundly demonstrated and
supported statistically. Explanations and links to variability in employees’ adoption of smart
systems to any one or more of the fourteen independent attitudinal factors in the study are
provided.
Summary of SEM Analysis
As per the above statistical analyses and findings, the SEM results disclose that all seven
hypotheses are statistically significant. Out of the four drivers (i.e. political drivers, social
influence, technological orientation and personal factors), personal factors is the most
important construct for attitudes towards smart systems, which is followed by social
influence, political drivers and technological orientation. The results of this study show that
personal factors exert a higher significant impact on attitudes towards smart systems. This
result demonstrate that perceived benefits, prior experience and enjoyment with innovation
are the most essential dimensions regarding personal factors in people’s attitudes towards
smart systems. However, personal innovativeness is not important for personal factors in
attitudes towards smart systems.
Another higher significant relationship with attitudes towards smart systems is social
influence. It implies that cultural values, social networks and peers influence are the
important social influence dimensions influencing attitudes towards smart systems. Also, it is
evident that political drivers have a significant relationship with attitudes towards smart
systems. The findings confirm that government support, government strategy and government
regulations are the most crucial dimensions of the construct of political drivers.
226
Technological orientation is also an important factor which has also a significant impact on
attitudes Indicated here is tha fact that technological readiness, training, managerial support
and incentives are the most critical dimensions for technological orientation in attitudes
towards smart systems.
The most interesting result exposed here is that attitudes towards smart systems are highly
significant with reference to adoption of smart systems. This finding indicates that such
adoption is attributed to attitudes towards smart systems by the political drivers, social
influence, technological orientation and personal factors. Furthermore, the adoption of smart
systems has a significant relationship with both of the economic benefits and social benefits.
This result shows that cost effectiveness and organizational efficiency are the important
components of economic benefits, which is attributed to the adoption of smart systems. In
terms of social benefits, the results reveal that better relationships with the customer do not
constitute an important dimension for social benefits. However, loyalty to the organization,
enhanced service quality and reputational development are the crucial dimensions for social
benefits, which attributes to the adoption of smart systems.
7.3 Conclusions and Implications for adoption of Innovation
The major theoretical contribution of this study is the development of a comprehensive model
of smart system adoption in the Middle East. This updated model is able to better predict the
decision to adopt technological innovation by individual employees, compared with other
theories such as TRA, TAM or UTAUT. The model developed here examines more variables
that affect individuals’ adoption of innovation, particularly smart systems. In addition, TRA,
which is a widely used model in this field of research, deals with the determinants of
consciously intended behaviors. However, the limitation of this theory is that it does not use
demographic and external variables. On the other hand, TAM included only two variables.
Research by Yi et al. (2006) and Thompson, Higgins and Howell (1991) suggest that this
model should incorporate variables related to both human and social processes. The updated
model developed in this research provides a new approach that will advance further research
in this field and provide a better understanding of individual employees’ acceptance of
technological innovations.

227
The findings show that the model in the study predicts significantly better the dependent
variables. Such conclusions are possible from the analyses and findings, which enable us to
confidently state that the model is significant in predicting dependent variables. Each
predictor’s independent contribution to the model can also be concluded from the findings.
For example, variables impacting on factors such as people’s perceptions of smart systems
are government support, training, incentives, perceived usefulness, personal innovativeness,
experience and enjoyment. The variables such as government strategy, government
regulations, cultural values, social network, peers’ influence, technological readiness and
managerial support, however do not have significant impact. Specifically, we see that as
variables such as government support increases, employee adoption of smart systems also
rises, with the corresponding impact on dependent measures such as effectiveness, efficiency,
loyalty, and enhanced service delivery. Similarly, the adoption and incentives to use smart
systems also increase and as the benefits increase, the usage level rises in areas such as
innovativeness, experience and enjoyment.
Interestingly, there are negative areas and relationships, such as training even though it does
have other positive associations with variables like perception. Factors such as government
strategy and government regulations, also do not significantly affect attitudes when it comes
to adoption of smart systems. Broadly, attitudinal factors, positively and significantly affect
employees’ adoption of smart systems; with things such as training and incentives being
important for motivating employees to adopt smart systems. Training helps individuals to
understand and learn about an innovation and its features and increases awareness of
potential applications.
Accordingly, an implication of this is that training should be considered and provided to
employees, basically as soon as their career or employment starts and during any
implementation of smart systems. This entails the allocation of sufficient resources and
conveying of personal benefits to employees, leading to a possible wider and deeper
acceptance, usage and adoption of new technology or systems. Actions as this convey to
employees that their organization is supportive of the adoption and use of innovation. A
consequence of which is likely to be employees developing favorable attitudes to such
innovation.

228
The central question of whether the adoption of smart systems leads to economic and social
benefits of working in the organizations is firmly established. The study revealed and it can
be concluded that all six variables – cost effectiveness, efficiency, loyalty to the organization,
quality of the service, reputation and relationships with customers are significantly and
positively impacted by adopting FAHR smart system in the UAE. This conclusion is further
strengthened by statistically checking assumptions on outliers or multicollinearity. We can
conclusively say that in the UAE, using smart systems reduces operational costs. Smart
systems usage also reduces manpower volume and numbers of employees, with the
corresponding savings to the organization. Timely organizational responses are also enabled
by smart systems in efficient ways to customers, thus helping create greater customer loyalty
from improved services. Excellence and quality is enhanced, which consequently positively
increases the reputation of the organization as a good, reliable and efficient institution. Other
benefits include the development of better and closer relationships with employees,
customers, leadership proactivity and inter-governmental agencies. Information, policies and
procedures can be communicated quickly and efficiently.
The research findings similarly have important implications for technology adoption and
management. Since government support is crucial in order for an organization to successfully
implement any new technology for its employees, a government needs to ensure that
adequate support is available to users of technology. The results of the study have
implications for various types of managers and practitioners who are responsible for
introducing and advancing new technologies in the workplace. This study’s findings will help
management to consider more carefully the effective adoption and usage of technological
innovations in government organizations. Management personnel are informed of the
importance of relevant factors such as financial support, incentives and training in driving
technology adoption and to reduce implementation-related costs.
A potential impact (and implication), particularly for scholarly pursuits and publications, is
the limitation of time over which the measurements were gathered. The impact could well be
different if these measurements were taken at various points in time. Such an effort would
show possible changes within the same employees as well as potential changes overtime with
the continued use of technologies as well the introduction of newer technologies.
Technological fatigue or otherwise will be understood better and acceptance by newer
employees will also be assessed and compared with employees who have been in the

229
workplace or organization longer. Since FAHR is a recent initiative, the long-term impacts of
smarts systems and their implication for factors such as effectiveness, efficiency, loyalty,
quality and customers etc will need to be assessed. This point addresses the possible
limitation in the present study concerning “years worked in the industry”. This is a potential
variable that could affect smart systems usage and acceptance.
The updated model is simple, clear and easy to understand. It consists of four groups of
variables – determinants, perception, adoption and outcomes. This model is more
comprehensive compared with other models such as TRA, TAM, UTAUT,etc. in explaining
technological innovation adoption. Furthermore, the model provides greater explanatory
power in practical contexts. On this theme, this study contains a comprehensive list of
political, social, technological, and personal factors concerning individuals’ acceptance of
smart systems. The study also includes outcome variables that make it possible to compare its
findings to traditional innovation acceptance research. The multivariate analysis shows that
14 independent variables accounted for 65% of the variance in people’s acceptance of smart
systems.
Findings show that government support is essential to encourage employees to adopt new
technology. Employees may delay their acceptance until the government provides enough
support, motivation and available funds. Once the government provides the necessary support
for adoption of a new system, there is no need to create any new strategy or regulations for
imposing the technology on its intended users. In the adoption of an innovation, social factors
such as cultural values, social networks and peers’ influence are not important. Social values
do not demonstrate any effect on employees’ workplace environment, particularly when
employing technology. Davis (1989) did not include social values or subjective norms
constructs in his TAM, because they were non-significant and the least understood aspects of
the TRA. However, analyses such as those involving correlation show that social factors have
a significant impact on employees’ attitudes towards smart system adoption.
The study indicates that training and incentives are important for motivating employees to
adopt smart systems. Training helps individuals to understand and learn about an innovation
and its features. Training and education programs should aim to increase people’s awareness
of the potential applications of smart systems, and their potential benefits. Training should be
provided for individual employees, especially during the early stages of implementation.

230
When employees perceive strong incentives from training, allocation of sufficient resources
and personal benefits, they are likely to embrace new technology. Unless employees
perceive that their organization is strongly behind the use of an innovation, they are unlikely
to develop favorable attitudes to it. An organization may help its employees develop a
positive perception of an innovation by allocating resources and providing incentives such as
recognition, autonomy and job security.
The findings indicated that perceived benefits have a strong effect on acceptance. There is a
positive relationship between usefulness and usage of a new system: employees adopt a
system when they see that it will give them value. To increase the acceptance level of smart
systems, government ministries should emphasize their benefits, advantages and features. In
fact, individual employees who are innovative will be more inclined to use the innovation,
and the ministry can utilize these innovative employees as important agents of change. This is
because they are likely to influence others and thereby create a positive perception of the
adoption of smart systems.
Results revealed that prior experience influences adoption behavior. Having prior knowledge
of and experience in a certain innovation helps employees to see themselves as capable and
knowledgeable in the workplace environment. Organizations that intend to introduce a new
technology should recognize employees’ expertise and knowledge, which will motivate
others and facilitate more decisions to accept the technology. Similarly, results show that
enjoyment of innovation plays an important role in fostering a positive perception and usage
behavior. Government ministries should emphasize not only the benefits of adopting an
innovation but also those features that allow individual employees to enjoy using that
innovation. Employees are influenced not only by extrinsic benefits but also intrinsic
outcomes, such as ‘fun’ elements in the system.
It is evident that adopting a smart system brings many positive benefits to an organization.
Using smart systems can reduce operational costs and complete a job in time and with more
energy. It also helps organizations to become more efficient and effective in providing
services to customers. Smart system adoption helps organizations to create loyal customers.
These outcomes ultimately increase organizational reputation in the provision of good,
reliable and efficient goods and services. Smart system adoption also helps government
231
ministries to establish better and closer relationships with their clients. Services can be
delivered quickly, effectively and efficiently to all relevant stakeholders.
When designing an implementation strategy for a new technology that employees will have
to use, management needs to keep in mind the role of governmental, technological, personal,
cultural as well as social factors that can play a key role in making the implementation a
success. In recent times, organizations have been witnessing ongoing adjustments to rapidly
changing technologies in their operations and service departments. It is therefore important to
continuously monitor the driving forces shaping the innovation adoption process.
7.4 Contribution to Knowledge and Theory
The study has contributed to knowledge and theory by:
1. Developed a coherent model of technology adoption
2. Focused on an unexplored area of research
3. Combined two multivariate statistical techniques
1. Development of a coherent model.
This study has contributed to the knowledge and development of a theory that focused on
multiple sets of factors of technology adoption into a coherent structure. Previously, most
theories used only a few variables to test the model. Research (Frambach & Schillewaert,
2002; Schepers & Wetzels, 2007; Yi, Jackson, Park, & Probst, 2006; Venkatesh & Davis,
2000; Oostrom, Linden, Born & Molen, 2013) suggested that there should be a coherent
model examining adoption of technological innovation. This model includes an extensive list
of factors affecting employees in their decisions to adopt a new technological system. The
updated model was tested to find its relevance and significance in the adoption of smart
systems. This research contributes to broadening our theoretical understanding of the
technology adoption context. The theoretical model developed in this study will also be
useful for advancing future research in the relevant area.

232
2. Focused on an unexplored area of research.
Although there are studies in the areas of technology adoption in developed nations, the
drivers of adoption and research on individual employees’ adoption of technological
innovation remain limited in developing country contexts, for example the Middle East (Al
Khouri, 2012). There is a lacuna in the current literature indicating a lack of adequate
knowledge of the factors affecting adoption of technological innovation in developing
countries (Balta-Ozkan, Davidson, Bicket, & Whitmarsh, 2013). This research fills that gap
and addressed the issues accordingly. It was timely and important to examine the factors that
affect individual employees’ decision about adoption of technological innovation in the
workplace context in a developing nation. The research used sophisticated statistical analysis
to reveal a better understanding of the factors affecting and determining individual
employees’ acceptance of technological innovation in the context of a region which was
rarely the focus of past research. The survey respondents were actual users of the technology
and employees in three ministries in the UAE, a rapidly growing economy in the Middle
East.
3. Combination of two sophisticated statistical techniques.
This research has made contribution to methodology in that two sophisticated statistical
techniques, namely Structural Equation Modeling (SEM) and Multiple Regression Analysis
(MRA) are combined to ensure a robustness of the analyses around the propositions
examined in this thesis.
7.5 Limitations of the Study
Like any other study, this thesis is also not free from limitations. The study has several
limitations. Firstly, it was conducted in only three government ministries in the United Arab
Emirates (UAE). The same research carried out in another setting might generate a different
set of results since determinants could vary according to organizational, cultural and socio-
economic context. Such studies could be directed towards broadening the scope of the
research by collecting data from a number of organizations representing the various
ministries in the UAE. The research could be based on a larger sample drawn from all the
ministries in the UAE to increase the generalizability of the findings.
233
This study does not analyze any moderating factors affecting the users’ perception toward
smart systems adoption and usage. Demographics profiles of the employees could have
indirect impact on their perception and practice of technological innovation in the UAE
context. This research could be enriched by including users’ demographic information such
as gender, age, income and education level. It is proposed that future studies can include
demographic variable to identify if personal characteristics have any impact on the perception
and acceptance behavior on technological innovation in the organizational context. The thesis
might have ignored some other moderating factors related to the considered variables. The
research could also incorporate other moderating effects such as organizational size, age and
structure as these can influence employees’ attitudes toward and acceptance of innovation.
Due to the time constraint, this study did not employ a qualitative research approach. In order
to further test the model, the researcher could use qualitative approach to provide a deeper
insight into innovation adaptation and usage level. The qualitative nature of information
could enrich our understanding of the factors affecting the adoption of technological
innovation. The study also could be extended to other industry settings such as the
manufacturing or service sector to broaden our understanding of the adoption of smart system
and its usage level. Using a larger data set and collect from a wide range of industries across
borders could provide better insight into the area investigated in this study. The research was
conducted only one country, i.e. the UAE. It could be a possibility to conduct similar research
in other Gulf countries such as Saudi Arabia, Bahrain or Oman, either in the same or different
organizational settings.
Limitations may also exist in the comparative analysis between the private and the public
sector organizations. Such comparative study could enrich the analysis and findings of this
research. The study has focused on a specific technological innovation at a point in time.
Studies could focus on more advanced technologies to provide greater insights into the
changing face of technology in workplace settings. As for practical constraints, this study was
cross-sectional in that all measurements were taken at a single point in time. A limitation,
particularly for scholarly pursuits and publications, is that of time over which the
measurements were gathered. Possibly, a greater and better assessment, leading to stronger
conclusive basis for generalizations is possible, if such a study were conducted and
measurements taken over longer periods. However, the study empirically tested a model
234
based on established theories and the existing literature; hence, the methods and approach in
this research constitute a logical extension of prior research. Therefore, the factors and
relationships examined in this study were deemed appropriate.
7.6 Future Directions for Research
The following general recommendations for future research are made:
A structural research model, based on the hypotheses tested is proposed for future research
efforts. The present study used regression analysis to test the model developed in this thesis.
Generally, there are various techniques to test a model and regression analysis is one of the
most widely accepted techniques. Accordingly, future studies should consider using a
structural model. Related to this, analyses in the future may need to test the indicator
reliability of the measurement items using a Structural Equation Modeling (SEM) technique
or covariance-based (CB) structural equation model. Research could therefore consider using
confirmatory factor analysis (CFA) for the above purposes and for deeper analysis. The
present study used exploratory factor analysis (EFA) since the study undertakes exploratory
research. A CFA could be used if SEM techniques are adopted in future research. Another
possible option is to use Partial Least Squares (PLS).
A test for the presence of heterogeneity in the dataset is possible in further research on this
topic. As indicated above, in both CB-SEM and PLS-SEM models, one can test for the
presence of heterogeneity. As suggested in the literature, (Wetzels, Odekerken-Schröder, &
Van Oppen, 2009), using PLS path modeling to assess hierarchical construct models is
suggested in testing for heterogeneity
This study raises some possibilities for researchers undertaking future work in innovation
adoption. The study examined 14 determinants and six outcome variables, but not all of the
variables would be equally important in any specific context. Future analyses could
incorporate more factors affecting individuals’ attitudes towards smart system adoption. For
example, future research could use a longitudinal study to explain similar issues and
investigate the causal effects of multiple factors and their relationships over time. A cross-
cultural study on the topic may help us to understand the perceptual differences and unique

235
idiosyncratic factors that characterize Middle Eastern countries. Future studies could also
address the differences in smart system adoption between developed and developing
countries. Similarly, future research approaches and methodologies could consider and
incorporate using a highly detailed qualitative research approach.
The respondents who took part in this study were people who use smart systems. Further
research should be conducted on those who do not use smart systems regularly. The focus
here could be on identifying the cultural, ethnic, lifestyle and psychological determinants that
are relevant to people’s smart system usage and adoption.
The results of this study are generalizable to other organizational situations that have similar
characteristics, scope and context. However, further research is needed to broaden and
confirm the results and implications of the study. This is particularly so for scholarly pursuits
and publications, where stronger, greater and better assessment, leading to generalizations
that are based on solid evidence, will be made if such a study were conducted and
measurements taken over longer periods. In addition,the model developed in this research
could be tested in other public and private sector institutions, such as the manufacturing,
telecommunications, hospitality, healthcare sectors, etc.It would also be possible to conduct
this research in other countries with either the same or different business settings. This may
generate more insights into different organizational or cultural contexts. Finally, the model
developed in this study could be applied to many contexts concerning technology acceptance
and usage. Future studies would benefit from using this model to identify important research
areas in the areas of technology and innovation management.

236

237
REFERENCES
Aaker, J. L, Benet-Martínez, V., & Garolera, J. (2001). Consumption symbols as carriers of
culture: A study of Japanese and Spanish brand personality constructs. Journal of
Personality and Social Psychology, 81(3), 492–508.
Abbas, R. (2014). Customer experience is everything! Retrieved October 28, 2016 from
http://www.customerservice.ae/rta-completes-real-time-passenger-information-
screens-project.
Abramovici, M. (2015). Smart products. In CIRP Encyclopedia of Production Engineering
(1–5). Berlin: Springer.
Abras, S., Ploix, S., Pesty, S., & Jacomino, M. (2007). A multi-agent design for a home
automation system dedicated to power management. In Proceedings of the Fourth
Conference on Artificial Intelligence Innovations and Applications, Athens, Greece,
19–21.
Adams, D. A., Nelson, R. R., & Todd, P. A. (1992). Perceived usefulness, ease of use, and
usage of information technology: A replication. MIS Quarterly, 16(2), 227–247.
Agius, C. R. (2012). Intelligent infusion technologies: Integration of a smart system to
enhance patient care. Journal of Infusion Nursing, 35(6), 364–368.
Ajjan, A., & Hartshorne, R. (2008). Investigating faculty decisions to adopt Web 2.0
technologies: Theory adoption of enterprise resource planning. Computers in
Industry, 59(6), 548–564.
Ajzen, I. (1991). The theory of planned behavior. Organizational Behavior and Human
Decision Processes, 50(2), 179–211.
Ajzen, I. (2011). The theory of planned behaviour: Reactions and reflections. Psychology &
Health, 26(9), 1113–1127.
238
Ajzen, I., & Fishbein, M. (1980). Understanding attitudes and predicting social behavior.
Englewood Cliffs, New Jersey: Prentice-Hall.
Akcin, M., Kaygusuz, A., Karabiber, A., Alagoz, S., Alagoz, B. B., & Keles, C. (2016,
April). Opportunities for energy efficiency in smart cities. In Proceedings of the Smart
Grid Congress and Fair (ICSG), 2016 4th International Istanbul, Turkey, pp. 1-5.
IEEE.
Akhras, G. (2000). Smart materials and smart systems for the future. Canadian Military
Journal, 1(3), 26–32.
Akkucuk, U. (2014). Handbook of research on developing sustainable value in economics,
finance, and marketing. USA: IGI Global.
Akturan, U., & Tezcan, N. (2012). Mobile banking adoption of the youth market: Perceptions
and intentions. Marketing Intelligence & Planning, 30(4), 444–459.
Alahakoon, D., & Yu, X. (2016). Smart electricity meter data intelligence for future energy
systems: A survey. IEEE Transactions on Industrial Informatics, 12(1), 425–436.
Alam, S, S., Yunus, M., & Jani, M. (2011). An empirical study of factors affecting
electronic commerce adoption among SMEs in Malaysia. Journal of Business
Economics and Management, 12(2), 375–399.
AlAwadhi, S., & Morris, A. (2008). The use of the UTAUT model in the adoption of e-
government services in Kuwait. In Proceedings of the 41st Annual Hawaii
International Conference on System Sciences, USA, 219–219. IEEE.
Al-Awadhi, A. (2013, June 18). The UAE's Smart Government Initiative. Retrieved October
19, 2016 from
http://www.ecssr.ac.ae/ECSSR/print/ft.jsp?lang=en&ftId=/FeatureTopic/Abdullah_Al
Awadhi/FeatureTopic_1695.xml.
239
Alawadhi, S., Aldama-Nalda, A., Chourabi, H., Gil-Garcia, J. R., Leung, S., Mellouli, S. &
Walker, S. (2012). Building Understanding of Smart City Initiatives. In: Scholl H.J.,
Janssen M., Wimmer M.A., Moe C.E., Flak L.S. (Eds) Electronic Government.
EGOV 2012. Lecture Notes in Computer Science, vol 7443. Springer, Berlin,
Heidelberg
Albesher, A. S., & Stone, R. T. (2016). Current state of m-government research: Identifying
future research opportunities. International Journal of Electronic Governance, 8(2),
119–139.
Aldunate, R., & Nussbaum, M. (2013). Teacher adoption of technology. Computers in
Human Behavior, 29(3), 519–524.
Alfaki, I., & Ahmed, A. (2013). Technological readiness in the United Arab Emirates
towards global competitiveness. World Journal of Entrepreneurship,
Management and Sustainable Development, 9(1), 4–13.
Al-Gahtani, S., & King. M. (1999) Attitudes, satisfaction and usage: Factors contributing to
each in the acceptance of information technology. Behaviour & Information
Technology, 18(4), 277–297.
Algazar, M. M., EL-halim, H. A., & Salem, M. E. E. K. (2012). Maximum power point
tracking using fuzzy logic control. International Journal of Electrical Power &
Energy Systems, 39(1), 21–28.
Alghamdi, I. A., Goodwin, R., & Rampersad, G. (2011). E-government readiness assessment
for government organizations in developing countries. Computer and Information
Science, 4(3), 3–17.
Al-Jabri, I. M., & Sohail, M. S. (2012). Mobile banking adoption: Application of diffusion of
innovation theory. Journal of Electronic Commerce Research, 13(4), 379–391.
240
Al-Jenaibi, B. (2016). Upgrading society with smart government: The use of smart services
among federal offices of the UAE. International Journal of Information Systems and
Social Change (IJISSC), 7(4), 20–51.
Al-Khouri, A. M. (2011). An innovative approach for e-government
transformation. International Journal of Managing Value and Supply Chains, 2(1),
22–43.
Al-Khouri, A. M. (2012a). Emerging markets and digital economy: Building trust in the
virtual world. International Journal of Innovation in the Digital Economy, 3(2), 57–
69.
Al-Khouri, A.M. (2012b). PKI in government digital identity management systems. The
European Journal of ePractice, 14, 4–21.
Alomari, M., Woods, P., & Sandhu, K. (2012). Predictors for e-government adoption in
Jordan: Deployment of an empirical evaluation based on a citizen-centric
approach. Information Technology & People, 25(2), 207–234.
Alshawi, S., Missi, F., & Irani, Z. (2011). Organisational, technical and data quality factors in
CRM adoption: SMEs perspective. Industrial Marketing Management, 40(3), 376–
383.
Althammer, E., Schoitsch, E., Sonneck, G., Eriksson, H., & Vinter, J. (2008, July). Modular
certification support—the DECOS concept of generic safety cases. In Proceedings of
the 2008 6th IEEE International Conference on Industrial Informatics, Korea, 258–
263. IEEE.
Amine, L. S., & Cavusgil, S. T. (1986). Demand estimation in a developing country
environment: Difficulties, techniques and examples. Journal of the Market Research
Society, 28(1), 43–65.
Anandarajan, M., Igbaria, M., & Anakwe, U. P. (2000). Technology acceptance in banking
industries information. Technology and People, 13(4), 298–312.
241
Ancillotti, E., Bruno, R., & Conti, M. (2013). The role of communication systems in smart
grids: Architectures, technical solutions and research challenges. Computer
Communications, 36(17), 1665–1697.
Anderson, D., Zhao, C., Hauser, C., Venkatasubramanian, V., Bakken, D., & Bose, A.
(2012). Intelligent design: Real-time simulation for smart grid control and
communications design. IEEE Power and Energy Magazine, 10(1), 49–57.
Anderson, D. R., Sweeney, D. J., Williams, T. A., Camm, J. D., & Cochran, J. J. (2015). An
introduction to management science: Quantitative approaches to decision making
(13th ed.). USA: Cengage Learning.
Andrić, I., Gomes, N., Pina, A., Ferrão, P., Fournier, J., Lacarrière, B., & Le Corre, O.
(2016). Modeling the long-term effect of climate change on building heat demand:
Case study on a district level. Energy and Buildings, 126, 77–93.
Antón, C., Camarero, C., & Rodríguez, J. (2013). Usefulness, enjoyment, and self-image
congruence: The adoption of e-book readers. Psychology and Marketing, 30(4), 372–
384.
Arabian Business. (2016, October 3). Dubai RTA's Nol cards used 3.4bn times since 2009.
Retrieved October 19, 2016 from http://www.arabianbusiness.com/dubai-rta-s-nol-
cards-used-3-4bn-times-since-2009--647537.html.
Arabnia, H., Chang, H. B., & Shon, T. (2011). IT convergence and services. USA: Springer.
Atkinson, R. D., & McKay, A. S. (2007). Digital prosperity: Understanding the economic
benefits of the information technology revolution. The Information Technology and
Innovation Foundation Report, March 2007.
Ayed Mouelhi, R. B. (2009). Impact of the adoption of information and communication
technologies on firm efficiency in the Tunisian manufacturing sector. Economic
Modelling, 26(5), 961–967.
242
Azar, E., & Menassa, C. (2011). An agent-based approach to model the effect of occupants’
energy use characteristics in commercial buildings. In Proceedings of the American
Society of Civil Engineers (ASCE), USA, 536–543.
Badri, M. A, & Alshare, K. (2008). A path analytic model and measurement of the business
value of e-government: An international perspective. International Journal of
Information Management, 28(6), 524–535.
Baker, R. K., & White, K. M. (2010). Predicting adolescents’ use of social networking sites
from an extended theory of planned behaviour perspective. Computers in Human
Behavior, 26(6), 1591–1597.
Balaras, C. A., Kontoyiannidis, S., Dascalaki, E. G., & Droutsa, K. G. (2013). Intelligent
services for building information modeling-assessing variable input weather data for
building simulations. Open Construction and Building Technology Journal, 7, 138–
145.
Baldwin, J., & Lin, Z. (2002). Impediments to advanced technology adoption for Canadian
manufacturers. Research Policy, 31(1), 1–18.
Ballantine, J., Bonner, M. Jevy, M., Martin, A., & Powell, P. (1996). The 3-D model of
information systems success: The search for the dependent variable continues.
Information Resources Management Journal, 9(4), 5–14.
Balogh, A., Pataricza, A., & Polgár, B. (2007). Dependable Embedded Components and
Systems (DECOS). Retrieved September 23, 2016 from
https://inf.mit.bme.hu/en/research/projects/dependable-embedded-components-and-
systems-decos.
Balta-Ozkan, N., Davidson, R., Bicket, M., & Whitmarsh, L. (2013a). The development of
smart homes market in the UK. Energy, 60, 361–372.

243
Balta-Ozkan, N., Davidson, R., Bicket, M., & Whitmarsh, L. (2013b). Social barriers to the
adoption of smart homes. Energy Policy, 63, 363–374.
Bandiera, O., & Rasul I. (2006). Social networks and technology adoption in northern
Mozambique. The Economic Journal, 116(514), 869–902
Barbosa, J., Leitão, P., Adam, E., & Trentesaux, D. (2013). Self-organized holonic multi-
agent manufacturing system: The behavioural perspective. In Proceedings of the 2013
IEEE International Conference on Systems, Man, and Cybernetics, UK, pp. 3829-
3834. IEEE.
Barbosa, J., Leitão, P., Adam, E., & Trentesaux, D. (2015a). Dynamic self-organization in
holonic multi-agent manufacturing systems: The ADACOR evolution. Computers in
Industry, 66, 99–111.
Barbosa, J., Leitão, P., Adam, E., & Trentesaux, D. (2015b). Behavioural validation of the
ADACOR2 self-organized holonic multi-agent manufacturing system. In Proceedings
of the International Conference on Industrial Applications of Holonic and Multi-
Agent Systems, Czech Republic, pp. 59–70. Springer International Publishing.
Bear, H. L., Owen, G., Harvey, R., & Theobald, B. J. (2014). Some observations on computer
lip-reading: Moving from the dream to the reality. In SPIE Security Defense.
International Society for Optics and Photonics.
Behrend, T. S., Wiebe, E. N., London, J. E., & Johnson, E. C. (2011). Cloud computing
adoption and usage in community colleges. Behaviour & Information
Technology, 30(2), 231–240.
Beloglazov, A., & Buyya, R. (2010). Energy efficient allocation of virtual machines in cloud
data centers. In Proceedings of the 2010 10th IEEE/ACM International Conference on
Cluster, Cloud and Grid Computing (CCGrid), Australia, 577–578. IEEE.
Bethany, B. (2015, April 28). EU to introduce eCall alert device for car crashes. Retrieved
September 24, 2016 from http://www.bbc.com/news/technology-32495058.

244
Bhatnagar, A., & Ghose, S. (2004). A latent class segmentation analysis of e-shoppers.
Journal of Business Research, 57(7), 758–767.
Bhattacherjee, A., & Barfar, A. (2011). Information technology continuance research:
Current state and future directions. Asia Pacific Journal of Information
Systems, 21(2), 1–18.
Biemer, P. P., & Lyberg, L. E. (2003). Introduction to survey quality (Vol. 335). USA: John
Wiley & Sons.
Boehmer, J., Jung, Y., & Wash, R. (2015). e-Commerce recommender systems. In The
International Encyclopedia of Digital Communication and Society. John Wiley &
Sons, 1–8.
Bourgeois, S., Prater, E., & Slinkman, C. (2011). The Impact of Information Technology
Across Small, Medium, and Large Hospitals. In New Technologies for Advancing
Healthcare and Clinical Practices (pp. 347-361). IGI Global.
Bowden, R., Cox, S., Harvey, R., Lan, Y., Ong, E. J., Owen, G., & Theobald, B. J. (2013).
Recent developments in automated lip-reading. In Proceedings of the SPIE Security+
Defence Germany, 89010J–89010J, International Society for Optics and Photonics.
Braga, R. T. V., Junior, O. T., Branco, K. R. C., Neris, L. D. O., & Lee, J. (2012). Adapting a
software product line engineering process for certifying safety critical embedded
systems. In Proceedings of the International Conference on Computer Safety,
Reliability, and Security, Germany, 352–363. Springer.
Brown, I., Cajee, Z., Davies, D., & Stroebel, S. (2003). Cell phone banking: Predictors of
adoption in South Africa—an exploratory study. International Journal of Information
Management, 23(5), 381–394.
245
Brown, S., & Venkatesh, V. (2005). Model of adoption of technology in households: A
baseline model test and extension incorporating household life cycle. MIS Quarterly,
29(3), 399–426.
Bughin, J., Chui, M., & Manyika, J. (2010). Clouds, big data, and smart assets: Ten tech-
enabled business trends to watch. McKinsey Quarterly, 56(1), 75–86.
Byrne, B. M. (2010). Structural equation modelling with AMOS: Basic concepts,
applications, and programming (2nd
ed.). New York: Routledge.
Carayon, P., Hundt, A. S., & Wetterneck, T. B. (2010). Nurses’ acceptance of Smart IV
pump technology. International Journal of Medical Informatics, 79(6), 401–411.
Casino, F. (2015). Recommender systems with privacy for context-aware services. In 2nd
URV Doctoral Workshop in Computer Science and Mathematics (p. 67). Publicacions
Universitat Rovira I Virgili.
Catarinucci, L., De Donno, D., Mainetti, L., Palano, L., Patrono, L., Stefanizzi, M. L., &
Tarricone, L. (2015). An IoT-aware architecture for smart healthcare systems. IEEE
Internet of Things Journal, 2(6), 515–526.
Chan, T. Y. (2012). Mobile customer relationship management: Factors affecting consumer
mobile technology adoption within the hotel industry. Studies by Undergraduate
Researchers at Guelph, 5(2), 44–50.
Chang, M., & Cheung, W. (2001). Determinants of the intention to use Internet/WWW at
work: A confirmatory study. Information & Management, 39(1), 1–14.
Chatti, M. A., Jarke, M., & Frosch-Wilke, D. (2007). The future of e-learning: A shift to
knowledge networking and social software. International Journal of Knowledge and
Learning, 3(4/5), 404–420.
Chaudhuri, S., Dayal, U., & Narasayya, V. (2011). An overview of business intelligence
technology. Communications of the ACM, 54(8), 88–98.
246
Chen, H., Chiang, R. H., & Storey, V. C. (2012). Business intelligence and analytics: From
big data to big impact. MIS Quarterly, 36(4), 1165–1188.
Chen, M. Y., & Lughofer, E. D. (2013). Smart space technology innovations. Library Hi
Tech, 31(2), 197–200.
Cheng, E. (2001). SEM being more effective than multiple regression in parsimonious
model testing for management development research. Journal of Management
Development, 20 (7), 650-667.
Cheung, R., & Vogel, D. (2013). Predicting user acceptance of collaborative technologies:
An extension of the technology acceptance model for e-learning. Computers &
Education, 63, 160–175.
Cho, H. (2011). Theoretical intersections among social influences, beliefs, and intentions in
the context of 3G mobile services in Singapore: Decomposing perceived critical mass
and subjective norms. Journal of Communication, 61(2), 283–306.
Cho, Y., Hwang, J., & Lee, D. (2012). Identification of effective opinion leaders in the
diffusion of technological innovation: A social network approach. Technological
Forecasting and Social Change, 79(1), 97–106.
Chourabi, H., Nam, T., Walker, S., Gil-Garcia, J. R., Mellouli, S., Nahon, K. & Scholl, H. J.
(2012, January). Understanding smart cities: An integrative framework.
In Proceedings of the 2012 45th Hawaii International Conference on System Science
(HICSS), USA, 2289–2297. IEEE.
Ciampa, M. (2013). Security awareness: Applying practical security in your world. USA:
Southern Western Cengage Learning.
Ciampa, M., & Revels, M. (2012). Introduction to healthcare information technology. USA:
Southern Western Cengage Learning.
247
Conner, M., & Armitage, C. J. (1998). Extending the theory of planned behavior: A review
and avenues for further research. Journal of Applied Social Psychology, 28(15),
1429–1464.
Creswell, J. (1994). Research design: Qualitative and quantitative approaches. Thousand
Oaks, California: Sage Publications.
Čudanov, M., & Jaško, O. (2012). Adoption of information and communication technologies
and dominant management orientation in organisations. Behaviour & Information
Technology, 31(5), 509–523.
Cyr, D., Hassanein, K., Head, M., & Ivanov, A. (2007). The role of social presence in
establishing loyalty in e-service environments. Interacting with Computers, 19(1), 43–
56.
Damanpour, F. (1996). Organizational complexity and innovation: Developing and testing
multiple contingency models. Management Science, 42(5), 693–716.
Davcev, D., Stojkoska, B., Kalajdziski, S., & Trivodaliev, K. (2008). Project Based Learning
of Embedded Systems. 2nd WSEAS International Conference on Circuits, Systems,
Signal and Telecommunications (CISST'08) Acapulco, Mexico, January 25–27, pp.
120–125.
Davenport, T. H. (2013). Process innovation: Reengineering work through information
technology. USA: Harvard Business Press.
Davis, F. (1989). Perceived usefulness, perceived ease of use and user acceptance of
information technology. MIS Quarterly, 13(3), 319–340.
Davis, F., Bagozzi, R., & Warshaw, P. (1989). User acceptance of computer technology: A
comparison of two theoretical models. Management Science, 35(8), 982–1003.
248
Dedrick, J., Venkatesh, M., Stanton, J. M., Zheng, Y., & Ramnarine-Rieks, A. (2015).
Adoption of smart grid technologies by electric utilities: Factors influencing
organizational innovation in a regulated environment. Electronic Markets, 25(1), 17–
29.
Della Porta, D. (2014). Methodological practices in social movement research. USA: Oxford
University Press.
DeLone, W., & McLean, E. (2004). Measuring e-commerce success: Applying the DeLone
and McLean information systems success model. International Journal of Electronic
Commerce, 9(1), 31–47.
DeLone, W. H., & McLean, E. R. (1992). Information systems success: The quest for the
dependent variable. Information Systems Research, 3(1), 60–95.
DeLone, W. H., & McLean, E. R. (2003). The Delone and Mclean model of information
systems success: A ten-year update. Journal of Management Information Systems,
19(4), 9–30.
De Meo, P., Quattrone, G., & Rosaci, D.. (2012). Bilateral semantic negotiation: A
decentralized approach to ontology enrichment in open multi-agent systems.
International Journal of Data Mining, Modelling and Management, 4(1), 1–38.
Demirkan, H. (2013). A smart healthcare systems framework. IT Professional, 15(5), 38–45.
Dielman, T. (2005). Applied regression analysis: A second course in business and economic
statistics. Pacific Grove, California: Thomson Learning.
Dokic, J., Müller, B., & Meyer, G. (2015). European roadmap smart systems for automated
driving. European Technology Platform on Smart Systems Integration. Berlin:
EPOSS.
Dounis, A. I. (2010). Artificial intelligence for energy conservation in buildings. Advanced
Building Energy Research, 4(1), 267–299.

249
Du (2016, March 23). Smart Dubai announces the Smart Dubai platform with strategic
partner, Du. Retrieved October 19, 2016 from http://www.du.ae/about-us/media-
centre/newsdetail/2016/03/23/smart-dubai-announces-the-smart-dubai-platform-with-
strategic-partner-du.
Dubai Silicon Oasis Authority (2014). Smart: Getting smarter. Retrieved October, 2016 from
https://www.dsoa.ae/en/news/saaed-signs-a-memorandum-of-understanding-with-
dubai-silicon-oasis-authority/.
Duffy, V. G. (2012). Advances in human aspects of healthcare. USA: CRC Press.
Dwivedi, N., & Bruggink, D. (2016). The United Arab Emirates payment market and its
specifics: An interview with Nimish Dwivedi. Journal of Payments Strategy &
Systems, 9(4), 213–219.
Earl, M. J., & Feeney, D. F. (2012). How to be a CEO for the information age. Sloan
Management Review, 41(2), 11–23.
Edberg, M. (2013). Essentials of health behavior. USA: Jones & Bartlett Publishers.
Eftekhari, M., Marjanovic, L., & Angelov, P. P. (2003). Design and performance of a rule
based controller in a naturally ventilated room. Computers and Industrial
Engineering, 51(3), 299–326.
Elliott, K., Meng, G., & Hall, M. (2012). The influence of technology readiness on the
evaluation of self-service technology attributes and resulting attitude toward
technology usage. Services Marketing Quarterly, 33(4), 311–329.
Elsheikh, Y., & Azzeh, M. (2014). What facilitates the delivery of citizen-centric e-
government services in developing countries: Model development and validation
through structural equation modeling. International Journal of Computer Science,
6(1), 77–98.

250
ElSherif, H. M., Alomari, K. M., & Alkatheeri, A. (2016). Mobile government services
satisfaction and usage analysis: UAE government smart services case study.
International Journal of Computer Science and Mobile Computing, 5(3), 291–302.
El-Tawab, S., Abuelela, M., & Gongjun, Y. (2009). Real-time weather notification system
using intelligent vehicles and smart sensors. In Proceedings of the 2009 IEEE 6th
International Conference on Mobile Adhoc and Sensor Systems, China, 627–632.
IEEE.
Eoma, S., Choi, N., & Sung, W. (2016). The use of smart work in government: Empirical
analysis of Korean experiences. Government Information Quarterly, 33(3), 562–571.
Escobar-Rodriguez, T., & Monge-Lozano, P. (2012). The acceptance of Moodle technology
by business administration students. Computers & Education 58(4), 1085–1093.
European Commission (2014). Smart system integration community. Digital agenda for
Europe. Retrieved April 14, 2014 from http://ec.europa.eu/digital-
agenda/en/communities/smart-system-integration-community.
Evans, C. (1979). The mighty micro: The impact of the micro-chip revolution. London:
Coronet.
Faisal, M. N., & Talib, F. (2016). E-government to m-government: A study in a developing
economy. International Journal of Mobile Communications, 14(6), 568–592.
Fanning, K., & Centers, D. P. (2013). Intelligent business process management: Hype or
reality? Journal of Corporate Accounting & Finance, 24(5), 9–14.
Fishbein, M., & Ajzen, I. (1974). Attitudes towards objects as predictors of single and
multiple behavioral criteria. Psychological Review, 81(1), 59–74.
Frambach, R., & Schillewaert, N. (2002). Organizational innovation adoption: A multi-level
framework of determinants and opportunities for future research. Journal of Business
Research, 55(2), 163–176.
251
Friedman, A., Berkovsky, S., & Kaafar, M. A. (2016). A differential privacy framework for
matrix factorization recommender systems. User Modeling and User-Adapted
Interaction, 26(5), 425–458.
Fritsch, S. (2011). Technology and global affairs. International Studies Perspectives, 12(1),
27–45.
Gabler, F., Roscher, F., Ralf, D., Otto, A., Ziesche, S., Ihle, M., & Vogt, H. (2016). Materials
and technologies to enable high temperature stable MEMS and electronics for smart
systems used in harsh environments. In Proceedings of the 2016 China Semiconductor
Technology International Conference (CSTIC), China, 1–4. IEEE.
Gago, E. J., Muneer, T., Knez, M., & Köster, H. (2015). Natural light controls and guides in
buildings. Energy saving for electrical lighting, reduction of cooling load. Renewable
and Sustainable Energy Reviews, 41, 1–13.
Gandhi, B. M. K., & Rao, M. K. (2016). A prototype for IoT based car parking management
system for smart cities. Indian Journal of Science and Technology, 9(17), 1–6.
Garruzzo, S., Quattrone, G., & Rosaci, D. (2011). Improving agent interoperability via the
automatic enrichment of multi-category ontologies, Web Intelligence and Agent
Systems, 9(4), 291–318.
Garruzzo, S., Rosaci, D., & Sarne, G. M. (2006). MAST: An agent framework to support
B2C e-commerce. In Proceedings of the 7th WOA 2006 Workshop From Objects to
Agents, Catania, Italy, , 76-82. Europe: CEUR-WS.
Ghazal, M., Ali, S., Haneefa, F., & Sweleh, A. (2016). Towards smart wearable real-time
airport luggage tracking. In Proceedings of the 2016 International Conference on
Industrial Informatics and Computer Systems (CIICS), United Arab Emirates, 1–6.
IEEE.
252
Ghobakhloo, M., Hong, T. S., Sabouri, M. S., & Zulkifli, N. (2012). Strategies for successful
information technology adoption in small and medium-sized
enterprises. Information, 3(1), 36–67.
Gill, J., & Johnson, P. (2010). Research methods for managers. UK: Sage.
Gravetter, F., & Forzano, L. A. (2011). Research methods for the behavioral sciences. USA:
Southern Cengage Learning.
Gray, D. E. (2013). Doing research in the real world. UK: Sage.
Gulf News. (2016a). Dubai to launch smart app for 2,000 government services. Retrieved
October 18, 2016 from http://gulfnews.com/news/uae/government/dubai-to-launch-
smart-app-for-2-000-government-services-1.1625556.
Gulf News. (2016b). Smart system to ensure safety of five-gallon water bottles in Dubai.
Retrieved October 19, 2016 from http://gulfnews.com/news/uae/health/smart-system-
to-ensure-safety-of-five-gallon-water-bottles-in-dubai-1.1883423.
Gulf News. (2016c). All Dubai government jobs in one app. Retrieved October 19, 2016 from
http://gulfnews.com/news/uae/government/all-dubai-government-jobs-in-one-app-
1.1499911.
Gupta, V., Kumar, R., Mishra, R. G., Semwal, A., & Siwach, S. (2017). Design and
Optimization of Luggage Tracking System on Airport. In Proceedings of International
Conference on Intelligent Communication, Control and Devices, Singapore, 833–838.
Springer Singapore.
Guy, I. (2015). Social recommender systems. In Recommender systems handbook (pp. 511–
543). US: Springer.
Hackler, D & Saxton, G. D. (2007). The strategic use of information technology by nonprofit
organizations: Increasing capacity and untapped potential. Public Administration
Review, 67(3), 474–487.
253
Hage, J. (1980). Theories of organizations: Forms, process and transformation. New York:
John Wiley & Sons.
Hair, J., Anderson, R., Tatham, R., & Black, W. (1998). Multivariate data analysis. Upper
Saddle River, New Jersey: Prentice Hall.
Hair, J. F., Black, W. C., Babin, B. J., & Anderson, R. E. (2010). Multivariate Data Analysis:
A Global Perspective (7th
ed.). Upper Saddle River: Pearson Prentice-Hall.
Hair, J. F., Hult, G. T. M., Ringle, C., & Sarstedt, M. (2016). A primer on partial least
squares structural equation modeling (PLS-SEM). Thousand Oaks, California: Sage
Publications.
Hair, J. F., Ringle, C. M., & Sarstedt, M. (2011). PLS-SEM: Indeed a Silver Bullet. The
Journal of Marketing Theory and Practice, 19(2), 139–152.
Hair, J. F., Ringle, C. M., & Sarstedt, M. (2013). Editorial-partial least squares structural
equation modeling: Rigorous applications, better results and higher acceptance. Long
Range Planning, 46(1-2), 1-12.
Hair, J. F., Sarstedt, M., Hopkins, L., & G. Kuppelwieser, V. (2014). Partial least squares
structural equation modeling (PLS-SEM) An emerging tool in business
research. European Business Review, 26(2), 106-121.
Hall, C. M., & Page, S. J. (2014). The geography of tourism and recreation: Environment,
place and space (4th ed.). USA: Routledge.
Han, D. M., & Lim, J. H. (2010). Design and implementation of smart home energy
management systems based on zigbee. IEEE Transactions on Consumer
Electronics, 56(3), 1417–1425.
Haque, M. M., Chin, H. C., & Debnath, A. K. (2013). Sustainable, safe, smart: Three key
elements of Singapore’s evolving transport policies. Transport Policy, 27, 20–31.
254
Harbor Research (2013). Emergence of smart systems: Analysing market opportunities.
Retrieved from: http://harborresearch.com/wp-content/Retrived on August 2013,
Harbor-Research_IoT-Market-Opps-Paper_2013.pdf
Harmon, R. R., Corno, F., & Castro-Leon, E. G. (2015). Smart systems. IT Professional,
17(6), 14–17.
Henning, F. (2016). A theoretical framework on the determinants of organisational adoption
of interoperability standards in government information networks. Government
Information Quarterly, in press.
Herzner, W., Huber, B., Gyorgy, C., & Balogh, A. M. (2006). The DECOS tool-chain-model-
based development of distributed embedded safety critical real-time systems, ERCIM
News, 67, 22–24.
Hoelter, J. W. (1983). The analysis of covariance structures goodness-of-fit
indices. Sociological Methods & Research, 11(3), 325–344.
Holsapple, C., & Singh, M. (2000). Toward a unified view of electronic commerce, electronic
business, and collaborative commerce: A knowledge management approach.
Knowledge and Process Management, 7(3), 151–164.
Hosn, D. A. (2010, May 24). New electronic smart system proves successful. Retrieved
October 19, 2016 from https://www.pressreader.com/.
Hsu, C., & Lin, J. (2016). An empirical examination of consumer adoption of Internet of
Things services. Computers in Human Behavior, 62 (3), 516–527.
Hu, P. J., Chau, P. Y. K., Liu Sheng, O. R., & Tam, K. Y. (1999). Examining the technology
acceptance model using physician acceptance of telemedicine technology. Journal of
Management Information Systems, 16(2), 91–112.
Huntsville, A. (2013, March 13). New Zealand Police equips 6,000 frontline officers with
intergraph mobile technology. Retrieved October 13, 2016 from
255
http://www.hexagonsafetyinfrastructure.com/news-releases/new-zealand-police-
equips-6000-frontline-officers-with-intergraph-mobile-technology.
Igbaria, M., Guimaraes, T., & Davis, G. B. (1995). Testing the determinants of
microcomputer usage via a structural equation model. Journal of Management
Information Systems, 11(4), 87–114.
Igbaria, M., Parasuraman, S., & Baroudi, J. (1996). A motivational model of microcomputer
usage. Journal of Management Information Systems, 13(1), 127–143.
Igbaria, M., N. Zinatelli, P. Cragg, & Cavaye, A. (1997). Personal computing acceptance
factors in small firms: A structural equation model. MIS Quarterly, 21(3). 279–305.
Ippolito, M. G., Sanseverino, E. R., & Zizzo, G. (2014). Impact of building automation
control systems and technical building management systems on the energy
performance class of residential buildings: An Italian case study. Energy and
Buildings, 69, 33–40.
Isik, M. (2004). Incentives for technology adoption under environmental policy uncertainty:
Implications for green payment programs. Environmental and Resource Economics
27(3), 247–263.
Jaffar, A., ElKhatib, H., Hesson, M., & Radaideh, M. D. (2007). A proposed strategic
alignment of IS/IT with supply-chain management for UAE dates industry. Business
Process Management Journal, 13(2), 247–262.
Janssens, P., Pipeleers, G., & Swevers, J. (2013). A data-driven constrained norm-optimal
iterative learning control framework for LTI systems. IEEE Transactions on Control
Systems Technology, 21(2), 546–551.
Jara, A. J., Parra, M. C., & Skarmeta, A. F. (2014). Participative marketing: Extending social
media marketing through the identification and interaction capabilities from the
Internet of things. Personal and Ubiquitous Computing, 18(4), 997–1011.

256
Jennex, M., & Olfman, L. (2002). Organizational memory/knowledge effects on productivity:
a longitudinal study. In Proceedings of the Thirty-Fifth Hawaii International
Conference on System Sciences, USA, 1029-1038). IEEE Computer Society Press.
Joham, C.,Talukder.,M. and Aseeri,M.(2004). Innovation through self-organization lens.
Journal of Computer Science, 10(12), 2374-2382.
Jonker, J., & Pennink, B. (2010). The essence of research methodology: A concise guide for
master and PhD students in management science. USA: Springer Science & Business
Media.
Juuso, E. K. (2004). Integration of intelligent systems in development of smart adaptive
systems. International Journal of Approximate Reasoning, 35(3), 307–337.
Kantola, J., & Karwowski, W. (2012). Knowledge service engineering handbook. USA: CRC
Press.
Karthika, L., & Sumathi, A. C. (2012). Automatic discovery and recognition of activities in
smart environment. International Journal of Modern Engineering Research, 1(2),
353–358.
Kaur, K., & Rani, R. (2013). Modeling and querying data in NoSQL databases. In
Proceedings of the IEEE International Conference on Big Data, USA, 1–7. IEEE.
Kaur, K., & Rani, R. (2015a). A smart polyglot solution for big data in healthcare. IT
Professional, 17(6), 48–55.
Kaur, K., & Rani, R. (2015b). Managing data in healthcare information systems: Many
models, one solution. Computer, 48(3), 52–59.
Kaur, K., & Rani, R. (2016). Multi-model persistent solution for healthcare big data. Journal
of Medical Imaging and Health Informatics, 6(4), 937–947.

257
Kautonen, T., Tornikoski, E. T., & Kibler, E. (2011). Entrepreneurial intentions in the third
age: The impact of perceived age norms. Small Business Economics, 37(2), 219–234.
Kelly, J., & Hamm, S. (2013). Smart machines: IBM’s Watson and the era of cognitive
computing. USA: Columbia University School Publishing.
Kensek, K., & Noble, D. (2014). Building information modeling: BIM in current and future
practice. USA: John Wiley & Sons.
Kerr, S., & Newell, R. G. (2003). Policy-induced technology adoption: Evidence from the
U.S. lead phasedown. Journal of Industrial Economics 51(3), 317–343.
Khaleej Times. (2015a, August 3). Abu Dhabi introduces smart system to rescue traffic
accident victims. Retrieved October 18, 2016 from
http://www.khaleejtimes.com/nation/transport/abu-dhabi-introduces-smart-system-to-
rescue-traffic-accident-victims.
Khaleej Times. (2015b, August 9). DEWA’s Green Charger initiative accelerates Dubai's
transformation into Smartest City. Retrieved October 19, 2016 from
http://www.khaleejtimes.com/nation/dubai/dewas-green-charger-initiative-accelerates.
Khan, R. H., and Khan, J. Y. (2013). A comprehensive review of the application
characteristics and traffic requirements of a smart grid communications
network. Computer Networks, 57(3), 825–845.
Khan, S. N. (2011). Strengthening the curriculum of information systems program. Review of
Business Information Systems, 15(3), 23–34.
Khandwalla, P. (1970). Environment and the organization structure of firms. Montreal:
McGill University.
Kim, J. S., & Oh, R. D. (2016). The development of target-oriented real-time smart tracking
system to distinguish objects. International Journal of Multimedia and Ubiquitous
Engineering, 11(6), 73–84.

258
Kim, K. J., Lim, C. H., Lee, D. H., Lee, J., Hong, Y. S., & Park, K. (2012). A concept
generation support system for product-service system development. Service Science,
4(4), 349–364.
Kiyohide, H., & Saleem, A. (2014). Policy perspective analysis of technology adoption in
industries. International Journal of Smart Home, 8(1), 103–112.
Knijnenburg, B. P., Willemsen, M. C., Gantner, Z., Soncu, H., & Newell, C. (2012).
Explaining the user experience of recommender systems. User Modeling and User-
Adapted Interaction, 22(4–5), 441–504.
Kobetski, A., & Axelsson, J. (2012). Federated robust embedded systems: Concepts and
challenges. Swedish Institute of Computer Science.
Komninos, N., Pallot, M., & Schaffers, H. (2013). Special issue on smart cities and the future
internet in Europe. Journal of the Knowledge Economy, 4(2), 119–134.
Konana, P., & Balasubramanian, S. (2005). The social-economic-psychological (SEP) model
of technology adoption and usage: An application to online investing. Decision
Support Systems, 39(3), 505–524.
Koohang, A. A. (1989). A study of attitudes toward computers: Anxiety, confidence, liking,
and perception of usefulness. Journal of Research on Computing in Education, 22(2),
137–150.
Kopetz H. (2006) On the Fault Hypothesis for a Safety-Critical Real-Time System. In: Broy
M., Krüger I.H., Meisinger M. (eds) Automotive Software – Connected Services in
Mobile Networks. ASWSD 2004. Lecture Notes in Computer Science, vol 4147.
Springer, Berlin, Heidelberg.
Kortuem, G., Kawsar, F., Fitton, D., & Sundramoorthy, V. (2010). Smart objects as building
blocks for the internet of things. Internet Computing, IEEE, 14(1), 44–51.
259
Kristen, E., & Althammer, E. (2015). FlexRay Robustness Testing Contributing to
Automated Safety Certification. In Proceedings of the International Conference on
Computer Safety, Reliability, and Security, Netherlands, 201–211. Springer
International Publishing.
Kulkarni, U., Ravindran, S., & Freeze, R. (2006). A knowledge management success model:
Theoretical development and empirical validation. Journal of Management
Information Systems 23(3), 309–347.
Kumar, V., Chattaraman, V., Neghina, C., Skiera, B., Aksoy, L., Buoye, A. & Henseler, J.
(2013). Data-driven services marketing in a connected world. Journal of Service
Management, 24(3), 330–352.
Kumar, V., Mukerji, B., Butt, I., & Persaud, A. (2007). Factors for successful e-government
adoption: A conceptual framework. The Electronic Journal of e-Government, 5(1),
63–76.
Lai, H. M., & Chen, C. P. (2011). Factors influencing secondary school teachers’ adoption of
teaching blogs. Computers & Education, 56(4), 948–960.
Lam, T., Cho, V., & Qu, H. (2007). A study of hotel employee behavioral intentions towards
adoption of information technology. International Journal of Hospitality
Management, 26(1), 49–65.
Land Department. (2016). Smart applications. Retrieved October 19, 2016 from
http://www.dubailand.gov.ae/English/services/SmartApplications/Pages/default.aspx.
Lee, C. P., Chang, K., & Berry, F. S. (2011). Testing the development and diffusion of
e‐government and e‐democracy: A global perspective. Public Administration
Review, 71(3), 444–454.
Lee, J. (2010). Conflict resolution in multi-agent based intelligent environments. Building
Environment, 45(3), 574–585.

260
Lee, J., Kim, H. J., & Ahn, M. J. (2011). The willingness of e-Government service adoption
by business users: The role of offline service quality and trust in
technology. Government Information Quarterly, 28(2), 222–230.
Lee, J. H., Phaal, R., & Lee, S. H. (2013). An integrated service-device-technology roadmap
for smart city development. Technological Forecasting and Social Change, 80(2),
286–306.
Lee, W., Castellanos, C., & Choi, H. S. C. (2012). The effect of technology readiness on
customers’ attitudes toward self-service technology and its adoption: The empirical
study of US airline self-service check-in kiosks. Journal of Travel & Tourism
Marketing, 29(8), 731–743.
Lee, Y. H., Hsieh, Y. C., & Hsu, C. N. (2011). Adding innovation diffusion theory to the
technology acceptance model: Supporting employees’ intentions to use e-learning
systems. Educational Technology & Society, 14(4), 124–137.
Lerouge, C., Newton, S., & Blanton, J. (2005). Exploring the systems analyst skill set:
Perceptions, preferences, age, and gender. Journal of Computer Information Systems,
45(3), 12–23.
Lewis, W., Agarwal, R., & Sambamurthy, V. (2003). Sources of influence of beliefs about
information technology use: An empirical study of knowledge workers. MIS
Quarterly, 27(4), 657–678.
Li, K. F. (2013). Smart home technology for telemedicine and emergency management.
Journal of Ambient Intelligence and Humanized Computing, 4(5), 535–546.
Liljander, V., Gillberg, F., Gummerus, J., & van Riel, A. (2006). Technology readiness and
the evaluation and adoption of self-service technologies. Journal of Retailing and
Consumer Services, 13(3), 177–191.
Lin, C. H., Shih, H. Y., & Sher, P. J. (2007). Integrating technology readiness into technology
acceptance: The TRAM model. Psychology and Marketing, 24(7), 641–657.

261
Lin, F., Fofanah, S. S., & Liang, D. (2011). Assessing citizen adoption of e-Government
initiatives in Gambia: A validation of the technology acceptance model in information
systems success. Government Information Quarterly, 28(2), 271–279.
Lin, H. F. (2011). An empirical investigation of mobile banking adoption: The effect of
innovation attributes and knowledge-based trust. International Journal of Information
Management, 31(3), 252–260.
Lin, J. S. C., & Chang, H. C. (2011). The role of technology readiness in self-service
technology acceptance. Managing Service Quality, 21(4), 424–444.
Liserre, M., Sauter, T., & Hung John, Y. (2010). Future energy systems: Integrating
renewable energy sources into the smart power grid through industrial
electronics. IEEE Industrial Electronics Magazine, 4(1), 18–37.
Low, C., Chen, Y., & Wu, M. (2011). Understanding the determinants of cloud computing
adoption. Industrial Management & Data Systems, 111(7), 1006–1023.
Lü, L., Medo, M., Yeung, C. H., Zhang, Y. C., Zhang, Z. K., & Zhou, T. (2012).
Recommender systems. Physics Reports, 519(1), 1–49.
Luken, R., & Van Rompaey, F. (2008). Drivers for and barriers to environmentally sound
technology adoption by manufacturing plants in nine developing countries. Journal of
Cleaner Production 16(1), S67–S77.
Lund, H. (2014). Renewable energy systems: a smart energy systems approach to the choice
and modeling of 100% renewable solutions (2nd ed). USA: Academic Press.
Lund, H., Werner, S., Wiltshire, R., Svendsen, S., Thorsen, J. E., Hvelplund, F., &
Mathiesen, B. V. (2014). 4th Generation District Heating (4GDH): Integrating smart
thermal grids into future sustainable energy systems. Energy, 68, 1–11.

262
Luxton, D. D., McCann, R. A., Bush, N. E., Mishkind, M. C., & Reger, G. M. (2011).
mHealth for mental health: Integrating smartphone technology in behavioral
healthcare. Professional Psychology: Research and Practice, 42(6), 505.
Maglio, P. P., Kwan, S. J., & Spohrer, J. (2015). Toward a research agenda for human-
centered service system innovation. (Commentary) Service Science, 7(1), 1–10.
Maglio, P. P., & Lim, C.H. (2016). Innovation and big data in smart service systems. Journal
of Innovation Management, 4(1), 11–21.
Maglio, P. P., Vargo, S. L., Caswell, N., & Spohrer, J. (2009). The service system is the basic
abstraction of service science. Information Systems and e-business Management, 7(4),
395–406.
Marais, H. C. (1988). Basic concepts in the methodology of the social sciences (Vol. 4).
USA: HSRC Press.
Marco, J., & Hooper, J. M. (2016). Defining a representative vibration durability test for
electric vehicle (EV) rechargeable energy storage systems (RESS). In Proceedings of
the Electric Vehicle Symposium (EVS 29), Montréal, Québec, 1–12.
Mařík, V., Schirrmann, A., Trentesaux, D., & Vrba, P. (2015). Industrial Applications of
Holonic and Multi-Agent Systems. In Proceedings of the7th International Conference,
HoloMAS Spain, Vol. 9266, Springer.
Martínez, D. R. S., Gracia, T. J. H., Muñoz, E. M., & García, A. C. (2017). Smart cities’
challenge: How to improve coordination in the supply chain. In Sustainable Smart
Cities (pp. 129–142). Switzerland: Springer International Publishing.
Maxwell, A. (2012). Technological advancements in methods of training with reference to
online training: Impact and issues for organizations. Networks, 5(1), 35–57.
McLuhan, M., & Watson, W. (1970). From cliché to archetype. New York: The Viking
Press.

263
Medina-Borja, A. (2015). Smart things as service providers: A call for convergence of
disciplines to build a research agenda for the service systems of the future (Editorial).
Service Science, 7(1), ii–v.
Meridou, D. T., Kapsalis, A. P., Papadopoulou, M. E. C., Karamanis, E. G., Patrikakis, C. Z.,
Venieris, I. S., & Kaklamani, D. T. I. (2015). An ontology-based smart production
management system. IT Professional, 17(6), 36–46.
Milliou, C., & Petrakis, E. (2011). Timing of technology adoption and product market
competition. International Journal of Industrial Organization, 29(5), 513–523.
Mitra, S., & Chaya, A. K. (1996). Analyzing cost-effectiveness of organizations: The impact
of information technology spending. Journal of Management Information Systems,
13(2), 29–57.
Molla, A., & Licker, P. (2001) E-commerce systems success: An attempt to extend and
respecify the DeLone and McLean model of IS success. Journal of Electronic
Commerce Research, 2(4), 131–141.
Moore, G., & Benbasat, I. (1996). Integrating diffusion of innovations and Theory of
Reasoned Action models to predict utilization of information technology by end-
users. In K. Kautz & J. Pries-Heje (Eds.), Diffusion and Adoption of Information
Technology (pp. 132-146). London: Chapman and Hall.
Morris, J. (2006). Smart or super smart?. IT Now, 48(6), 14–15.
Musfeldt, R. L., Adkisson, B. D., & Kean, B. (2016). Systems and methods for identifying
devices by a trusted service manager. U.S. Patent No. 9,331,996. Washington, DC:
U.S. Patent and Trademark Office.
Nakashima, H., Aghajan, H., & Augusto, J. C. (Eds.). (2009). Handbook of ambient
intelligence and smart environments. USA: Springer Science & Business Media.

264
Nam, T., and Pardo, T. A. (2011). Conceptualizing smart city with dimensions of technology,
people, and institutions. In Proceedings of the 12th Annual International Digital
Government Research Conference: Digital Government Innovation in Challenging
Times, USA, 282–291. ACM.
Nasri, W., & Charfeddine, L. (2012). Factors affecting the adoption of Internet banking in
Tunisia: An integration theory of acceptance model and theory of planned
behavior. The Journal of High Technology Management Research, 23(1), 1–14.
Ngai, E. W. T., Chau, D. C. K., Poon, J. K. L., Chan, A. Y. M., Chan, B. C. M., & Wu, W.
W. S. (2012). Implementing an RFID-based manufacturing process management
system: Lessons learned and success factors. Journal of Engineering and Technology
Management, 29(1), 112–130.
Oliveira, T., Thomas, M., Baptista, G., & Campos, F. (2016). Mobile payment:
Understanding the determinants of customer adoption and intention to recommend the
technology. Computers in Human Behavior, 61, 404–414.
O'Neill, S. A., McClean, S. I., Donnelly, M. D., Nugent, C. D., Galway, L., Cleland, I., and
Craig, D. (2014). Development of a technology adoption and usage prediction rool for
assistive technology for people with dementia. Interacting with Computers, 26(2),
169–176.
Ooi, K. B., Sim, J. J., Yew, K. T., & Lin, B. (2011). Exploring factors influencing
consumers’ behavioral intention to adopt broadband in Malaysia. Computers in
Human Behavior, 27(3), 1168–1178.
Oostrom, J., Linden, D., Born, M., & Molen, H. (2013). New technology in personnel
selection: How recruiter characteristics affect the adoption of new selection
technology. Computers in Human Behavior, 29(6), 2404-2415.
Ortiz‐de‐Mandojana, N., & Bansal, P. (2015). The long‐term benefits of organizational
resilience through sustainable business practices. Strategic Management Journal,
37(8), 1615–1631.
265
Ota, H., Emaminejad, S., Gao, Y., Zhao, A., Wu, E., Challa, S., ... & Gao, W. (2016).
Application of 3D printing for smart objects with embedded electronic sensors and
systems. Advanced Materials Technologies, 1(1), 1–8.
Ozaki, R. (2011). Adopting sustainable innovation: What makes consumers sign up to green
electricity? Business Strategy and the Environment, 20(1), 1–17.
Ozer, M. (2000). Information technology and new product development: Opportunities and
pitfalls. Industrial Marketing Management, 29(5), 387–396.
Paetz, A., Dütschke, E. & Fichtner, W. (2012). Smart homes as a means to sustainable energy
consumption: A study of consumer perceptions. Journal of Consumer Policy, 35(1),
23–41.
Page, T. (2014). Application-based mobile devices in design education. International Journal
of Mobile Learning and Organisation, 8(2), 96–111.
Palopoli, L., Rosaci, D., & Sarnè, G. M. (2013). Introducing specialization in e-commerce
recommender systems. Concurrent Engineering, 21(3), 1–10.
Pantano, E., & Viassone, M. (2014). Demand pull and technology push perspective in
technology-based innovations for the points of sale: The retailers evaluation. Journal
of Retailing and Consumers Services, 21(1), 43–47.
Papadimitratos, P., De La Fortelle, A., Evenssen, K., Brignolo, R., & Cosenza, S. (2009).
Vehicular communication systems: Enabling technologies, applications, and future
outlook on intelligent transportation. IEEE Communications Magazine, 47(11), 84–
95.
Papatheocharous, E., Axelsson, J., & Andersson, J. (2013). Issues and challenges in
ecosystems for federated embedded systems. In Proceedings of the First International
Workshop on Software Engineering for Systems-of-Systems, France, 21–24. ACM.

266
Papp, R. (2001). Strategic information technology: Opportunities for competitive advantage.
USA: Idea Group Publishing.
Park, J., Koh, T., Huh, J. H., Kim, T., Lee, J., Kang, J., ... & Park, Y. (2015). Design of the
Real-Time Mobile Push System for Implementation of the Shipboard Smart Working.
In Proceedings of the Advances in Computer Science and Ubiquitous Computing,
Philippines, 541–548. Springer Singapore.
Park, W. J., Woo, S., & Lee, S. (2014). Identification of applications of mobile devices to
improve airport BHS maintenance. KSCE Journal of Civil Engineering, 18(5), 1207–
1212.
Patti, E., Ronzino, A., Osello, A., Verda, V., Acquaviva, A., & Macii, E. (2015). District
information modeling and energy management. IT Professional, 17(6), 28–34.
Peansupap, V., & Walker, D. (2005). Exploratory factors influencing information and
communication technology diffusion and adoption within Australian construction
organizations: A micro analysis. Construction Innovation, 5(3), 135–157.
Pentikousis, K., Agüero, R., & Timm-Gie, A. (2014). Advances on smart object management.
Mobile Networks and Applications, 19(1), 1–3.
Peslak, A., Ceccucci, W., & Sendall, P. (2012). An empirical study of social networking
behavior using theory of reasoned action. Journal of Information Systems Applied
Research, 5(3), 12–23.
Pfliegl, R. (2006). Coopers: Co-operative networks for intelligent road safety. In Proceedings
of the TRA-Transport Research Arena Europe 2006 on Greener, Safer and Smarter
Road Transport for Europe, Sweden.
Polese, F., Tommasetti, A., Vesci, M., Carrubbo, L., & Troisi, O. (2016). Decision-Making in
Smart Service Systems: A Viable Systems Approach Contribution to Service Science
Advances. In Proceedings of the International Conference on Exploring Services
Science, Romania, 3–14. Springer International Publishing.
267
Polit, D. F., & Beck, C. T. (2008). Nursing research: Generating and assessing evidence for
nursing practice. USA: Lippincott Williams & Wilkins.
Porter, C., & Donthu, N. (2006). Using the technology acceptance model to explain how
attitudes determine Internet usage: The role of perceived access barriers and
demographics. Journal of Business Research, 59(9), 999–1007.
Porter, M. E., & Heppelmann, J. E. (2014). How smart, connected products are transforming
competition. Harvard Business Review, November, 1–23.
Prabhu, B., Mathew, A. I., Kumar, M. R., & Sophia, S. (2015). Cluster integrated self
forming wireless sensor based system for intrusion detection and perimeter defense
applications. International Journal of Computer Science and Business
Informatics, 15(3), 70–83.
Putzer, J. G., & Park, Y. (2010). The effects of innovation factors on smart phone adoption
among nurses in community hospitals. Research Perspectives in Health Informatics,
7(1b), 12.
Qi, B., Bai, H., Li, B., Dong, C., & He, W. (2015). The research on user interface information
interaction technology application in smart home. In Proceedings of the 2015 4th
International Conference on Computer Science and Network Technology (ICCSNT),
China, 1165–1168. IEEE.
Rahmani, A. M., Thanigaivelan, N. K., Gia, T. N., Granados, J., Negash, B., Liljeberg, P., &
Tenhunen, H. (2015, January). Smart e-health gateway: Bringing intelligence to
internet-of-things based ubiquitous healthcare systems. In Proceedings of the 2015
12th Annual IEEE Consumer Communications and Networking Conference (CCNC),
USA, 826–834. IEEE.
Ramchum, S. D., Vytelingum, P., Rogers, A., & Jennings, N. (2011). Agent-based control for
the decentralized demand side management in the smart grid. Autonomous Agents
Multi-agent System, 1, 5–12.
268
Ramchurn, S. D., Vytelingum, P., Rogers, A., & Jennings, N. R. (2012). Putting the ‘smarts’
into the smart grid: A grand challenge for artificial intelligence. Communications of
the ACM, 55(4), 86–97.
Rania, S., Meredith, L., & Justin, D. (2013). Factors influencing decision support system
acceptance. Retrieved October 23, 2016 from www.elsevier.com/locate/dss, 953–961.
Rannenberg, K., Royer, D., & Deuker, A. (2009). The future of identity in the information
society: Challenges and opportunities. UK: Springer.
Reeder, B., Meyer, E., Lazar, A., Chaudhuri, S., Thompson, H. J., & Demiris, G. (2013).
Framing the evidence for health smart homes and home-based consumer health
technologies as a public health intervention for independent aging: A systematic
review. International Journal of Medical Informatics, 82(7), 565–579.
Ritchie, B., & Brindley, C. (2005). ICT adoption by SMEs: Implications for relationships and
management. New Technology, Work and Employment, 20(3), 205–217.
Robins, K. & Webster, F. (1989). The technical fix: Education, computers and industry.
London: Macmillan.
Roche, S., Nabian, N., Kloeckl, K., & Ratti, C. (2012). Are ‘smart cities’ smart enough?
In Proceedings of the Global Geospatial Conference, Canada, 215–235.
Rodrigues, G., Sarabdeen, J., & Balasubramanian, S. (2016). Factors that influence consumer
adoption of e-government services in the UAE: A UTAUT model
perspective. Journal of Internet Commerce, 15(1), 18–39.
Rogers, E. M. (1995). Diffusion of innovations (4th ed.). New York: The Free Press.
Rogers, E. (2003). Diffusion of innovations (5th ed.). New York: The Free Press.

269
Rosaci, D., & Sarne, G. (2012). A multi-agent recommender system for supporting device
adaptivity in e-commerce. Journal of Intelligent Information Systems, 38(2), 393–418.
Roy, S., Balaji, M. and Sadeque, S. (2017). Constituents and consequences of smart customer
experience in retailing. Technological Forecasting and Social Change. In press
Rudall, B. H., & Mann, C. J. H. (2007). Smart systems and environments. Kybernetes,
36(3/4), 456–464.
Rylatt, R. M., Snape, J. R., Allen, P., Ardestani, B. M., Boait, P., Boggasch, E., & Pakka, V.
(2015). Exploring smart grid possibilities: A complex systems modelling
approach. Smart Grid, 1(1), 1–15.
Salehan, M., & Negahban, A. (2013). Social networking on smartphones: When mobile
phones become addictive. Computers in Human Behavior, 29(6), 2632–2639.
Sanders, D., Clarke, H. D., Stewart, M. C., & Whiteley, P. (2007). Does mode matter for
modeling political choice? Evidence from the 2005 British Election Study. Political
Analysis, 15(3), 257–285.
Santos, J., Doz, Y., & Williamson, P. (2013). Is your innovation process global MIT? Sloan
Management Review, 45(4), 31–37.
Scardamalia, M., & Bereiter, C. (2014). Smart technology for self-organizing
processes. Smart Learning Environments, 1(1), 1–13.
Scerri, P, Pynadath, D. V, & Tambe, M. (2002). Towards adjustable autonomy for the real
world. Journal of Artificial Intelligent Research, 17(1), 171–228.
Schafer, J.B., Konstan, J.A., & Riedl, J. (2001). E-commerce recommendation applications
Data Mining and Knowledge Discovery, 5(1–2), 115–153.

270
Schepers, J., & Wetzels, M. (2007). A meta-analysis of the technology acceptance model:
Investigating subjective norm and moderation effects. Information & Management,
44(1), 90-103.
Schoitsch, E. (2006, October). EPoSS - New European Technology Platform on Smart
Systems Integration. Retrieved September 22, 2016 from http://ercim-
news.ercim.eu/en67/events/eposs-new-european-technology-platform-on-smart-
systems-integration.
Schoitsch, E., Althammer, E., Eriksson, H., Vinter, J., Gönczy, L., Pataricza, A., & Csertan,
G. (2006). Validation and Certification of Safety-Critical Embedded Systems–The
DECOS Test Bench. In Proceedings of the International Conference on Computer
Safety, Reliability, and Security, Poland, 372–385. Berlin, Heidelberg: Springer.
Schoitsch, E., & Kubinger, W. (2006). Autonomous systems – safety critical embedded
systems and intelligence. Retrieved September 24, 2016 from http://ercim-
news.ercim.eu/en67/special-theme-embedded-intelligence/autonomous-systems-
safety-critical-embedded-systems-and-intelligence.
Schoistsch, E., & Skavhaug, A. (2006). Embedded intelligence. ECRI News, 67, 14–15.
Scott, A. (2015). High occupancy boosts Dubai Silicon Oasis Authority profit. Retrieved
October 17, 2016 from http://www.thenational.ae/business/economy/high-occupancy-
boosts-dubai-silicon-oasis-authority-profit.
Sechilariu, M., Wang, B., & Locment, F. (2013). Building integrated photovoltaic system
with energy storage and smart grid communication. IEEE Transactions on Industrial
Electronics, 60(4), 1607–1618.
Secundo, G., Passiante, G., Matos, F., & do Rosário Cabrita, M. (2015). Intellectual Capital
in Academic Entrepreneurship: Moving Beyond Measurement. In Proceedings of the
European Conference on Knowledge Management, Italy, 684–691. Academic
Conferences International Limited.

271
Seddon, P. (1997). A respecification and extension of the DeLone and McLean model of IS
success. Information Systems Research, 8(3), 240–253.
Seddon, P., & Kiew, M. Y. (1996). A partial test and development of DeLone and McLean’s
model of IS success. Australian Journal of Information Systems, 4(1), 90–109.
Selwyn, N. (1997). Students’ attitudes toward computers: Validation of a computer attitude
scale for 16–19 education. Computers & Education, 28(1), 35–41.
Shahid, S. A., Taha, F. K., Ismail, S., Dakheel, A., & Abdelfattah, M. (2011). Turning
Adversity into an Advantage for Food Security Through Improving Soil Quality and
Providing Production Systems for Marginal Saline Lands: ICBA Perspectives and
Approach. In Sustainable Agricultural Development (pp. 43–67). Netherlands:
Springer.
Shaikh, A. A., & Karjaluoto, H. (2016). On some misconceptions concerning digital banking
and alternative delivery channels. International Journal of E-Business
Research, 12(3), 1–16.
Shaikh, P. H., Nor, N. B. M., Nallagownden, P., Elamvazuthi, I., & Ibrahim, T. (2014). A
review on optimized control systems for building energy and comfort management of
smart sustainable buildings. Renewable and Sustainable Energy Reviews, 34, 409–
429.
Shen, G. (2015). Users’ adoption of mobile applications: Product type and message framing’s
moderating effect. Journal of Business Research, 68(11), 2317–2321.
Sherif, K., Zmud, R., & Browne, G. (2006). Managing peer-to-peer conflicts in disruptive
information technology innovations: The case of software reuse. MIS Quarterly,
30(2), 339–356.
Shi, F., Ghedira, C., & Marini, J. L. (2015). Context adaptation for smart recommender
systems, IT Professional, 17(6), 18–26.
272
Shin, D. H., Hwang, Y., & Choo, H. (2013). Smart TV: Are they really smart in interacting
with people? Understanding the interactivity of Korean Smart TV. Behaviour &
Information Technology, 32(2), 156–172.
Shinde, S., Bhagwat, S., Pharate, S., Paymode, V., & Scholar, U. G. (2016). Prediction of
parking availability in car parks using sensors and IOT: SPS. International Journal of
Engineering Science, 6(4), 4751–4756.
Shuhaiber, A. (2016). Factors influencing consumer trust in mobile payments in the United
Arab Emirates (Doctoral dissertation). Victoria University of Wellington, Wellington.
Simmonds, D. M., & Bhattacherjee, A. (2015). Smart systems, smarter living: An empirical
study of the building. Automation System in Organizations, Paper 3, 1–13.
Smart Dubai. (2016). Dubai Silicon Oasis Authority reduces costs And Co2 emissions with
smart waste management system. Retrieved October 19, 2016 from
http://www.smartdubai.ae/partner_story_0524.php.
Soares, N., Costa, J. J., Gaspar, A. R., & Santos, P. (2013). Review of passive PCM latent
heat thermal energy storage systems towards buildings’ energy efficiency. Energy and
Buildings, 59, 82–103.
Soh, C. K., Yang, Y., & Bhalla, S. (2012). Smart materials in structural health monitoring,
control and biomechanics. USA: Springer.
Spaargaren, G. (2011). Theories of practices: Agency, technology, and culture. Exploring the
relevance of practice theories for the governance of sustainable consumption practices
in the new world order. Global Environmental Change, 21(3), 813–822.
Spohrer, J., & Maglio, P. P. (2010). Toward a science of service systems: Value and symbols.
In P. P. Maglio, C. A. Kieliszewski & J. C. Spohrer (Eds.), Handbook of service
science (pp. 157–194). New York: Springer.

273
Srinivasan, G., Priya, S., & Sun, N. (2015). Composite magnetoelectrics: Materials,
structures, and applications. UK: Elsevier.
Starbuck, W. H. (1976). Organizations and their environments. Chicago: Rand McNally.
Strasser, T., Andrén, F., Kathan, J., Cecati, C., Buccella, C., Siano, P., ... & Mařík, V. (2015).
A review of architectures and concepts for intelligence in future electric energy
systems. IEEE Transactions on Industrial Electronics, 62(4), 2424–2438.
Street, R. A., Ng, T. N., Schwartz, D. E., Whiting, G. L., Lu, J. P., Bringans, R. D., & Veres,
J. (2015). From printed transistors to printed smart systems. Proceedings of the
IEEE, 103(4), 607–618.
Suri, T. (2011). Selection and comparative advantage in technology adoption.
Econometrica, 79(1), 159–209.
Tabachnick, B. G., & Fidell, L. S. (1996). Using multivariate statistics. New York: Harper
Collins.
Taherdoost, H., Sahibuddin, S., Namayandeh, M., Jalaliyoon, N., Kalantari, A., & Chaeikar,
S. S. (2012). Smart card adoption model: Social and ethical
perspectives. International Journal of Research & Reviews in Computer Science, 3(4),
1792–1796.
Talukder, M. (2011). Development of an enhanced model of innovation adoption by
individual employees. Journal of Asia Pacific Business, 12(4), 316–339.
Talukder, M. (2014). Managing innovation adoption: From innovation to implementation.
USA: Gower Publishing, Ltd.
Talukder, M., Harris, H. and Mapunda, G. (2008). Adoption of innovations by
individuals within organizations: An Australian study. Asia Pacific Management
Review, 13(2), 463-480.

274
Tan, M., & Teo, T. S. H. (2000). Factors influencing the adoption of internet banking.
Journal of the Association for Information Systems, 1, 1–42.
Taqqali, W. M., & Abdulaziz, N. (2010). Smart grid and demand response technology. In
Proceedings of the 2010 Energy Conference and Exhibition (EnergyCon), Bahrain,
710–715. IEEE.
Telecommunications Regulatory Authority. (2013). Road Map: mGovernment.
Telecommunications Regulatory Authority (TRA), Abu Dhabi, United Arab Emirates
(UAE), 1–83.
Telematics News. (2015, March 11). Bosch launches new sensor for eCall, navi and
telematics. Retrieved 23 September, 2016 from
http://telematicsnews.info/2015/03/11/bosch-launches-new-sensor-for-ecall-navi-and-
telematics_m6111/
Thierauf, R. J. (2001). Effective business intelligence systems. USA: Greenwood Publishing
Group.
Thiraput, P. (2013). Smartphones in the workplace: Changing organizational behavior,
transforming the future. LUX: a Journal of Transdisciplinary Writing and Research
from Claremont Graduate University, 3(1), 1–10.
Thompson, J. D. (1967). Organizations in action. New York: McGraw-Hill.
Thompson, R., Higgins, C., & Howell, J. (1991). Personal computing: Toward a conceptual
model of utilization. MIS Quarterly, 15(1), 125-143.
Tilli, M., Motooka, T., Airaksinen, V. M., Franssila, S., Paulasto-Krockel, M., & Lindroos,
V. (Eds.). (2015). Handbook of silicon based MEMS materials and technologies, (2nd
ed.). USA: William Andrew.
Timm, I. J., Woelk, P. O., Knirsch, P., Tönshoff, H. K., & Herzog, O. (2016). Flexible mass
customisation: Managing its information logistics using adaptive cooperative multi-
275
agent systems. In: Pawar, K.S.; Muffatto, M. (Eds.): Logistics and the Digital
Economy. Proceedings of the 6th International Symposium on Logistics, Salzburg,
Austria, pp. 227-232.
Toellner, J. (2014). Mobile services in retail and their influence on customer satisfaction.
Hamburg, Germany: Diplomica Publishing.
Tornatzky, L. G., & Fleischer, M. (1990). The process of technology innovation. Lexington:
Lexington Books.
TRIP. (2010). Co-operative networks for intelligent road safety. Retrieved September 22,
2016 from http://www.transport-research.info/project/co-operative-networks-
intelligent-road-safety.
Tucker, J. A., & Grimley, D. M. (2011). Public health tools for practicing psychologists.
USA: Hogrefe.
UAEinteract. (2015, October 23). Du joins hands with Dubai Film to launch Dubai360
virtual reality app At Gitex Technology Week 2015. Retrieved October 19, 2016 from
http://www.uaeinteract.com/docs/du_joins_hands_with_Dubai_Film_to_launch_Duba
i360_Virtual_Reality_App_at_GITEX_Technology_Week_2015/71845.htm.
UAEinteract. (2016, January 31). Infrastructural Development – Smart Cities. Retrieved
October 19, 2016 from http://www.uaeinteract.com/news/default3.asp?ID=478.
Udo, G. & Guimaraes, T. (1994). Improving organization absorption of emerging
technologies: A socio-technical approach. In Information Technology and
Organizations (pp. 3–30). USA: IGI Publishing Hershey.
Venkatesh, V., & Bala, H. (2008). Technology acceptance model 3 and a research agenda on
interventions. Decision Sciences 39(2), 273–315.

276
Venkatesh, V., & Brown, S. (2001). A longitudinal investigation of personal computers in
homes: Adoption determinants and emerging challenges. MIS Quarterly, 25(1), 71–
102.
Venkatesh, V., & Davis, F. (2000). A theoretical extension of the technology acceptance
model: Four longitudinal field studies. Management Science, 46(2), 186–204.
Venkatesh, V., Morris, M., & Ackerman, P. (2000). A longitudinal field investigation of
gender differences in individual technology adoption decision-making processes.
Organizational Behavior and Human Decision Processes, 83(1), 33–60.
Venkatesh, V., Morris, M. G., Davis, G. B., & Davis, F. D. (2003). User acceptance of
information technology: Toward a unified view. MIS Quarterly, 27(3), 425–478.
Venkatesh, V., Sykes, T. A., & Zhang, X. (2011). ‘Just what the doctor ordered’: A revised
UTAUT for EMR system adoption and use by doctors. In Proceedings of the 2011
44th Hawaii International Conference on System Sciences (HICSS), USA, 1–10.
IEEE.
Venkatesh, V., Thong, J. Y., & Xu, X. (2012). Consumer acceptance and use of information
technology: Extending the unified theory of acceptance and use of technology. MIS
Quarterly, 36(1), 157–178.
Verbong, G. P., Beemsterboer, S., & Sengers, F. (2013). Smart grids or smart users?
Involving users in developing a low carbon electricity economy. Energy Policy, 52,
117–125.
Verma, S., Kumari, S., Arteimi, M., Deiri, A., & Kumar, R. (2012). Challenges in developing
citizen-centric e-governance in Libya. International Arab Journal of e-Technology,
2(3), 152–160.
Vibhute, A. D., & Gawali, B. W. (2013). Analysis and modeling of agricultural land use
using remote sensing and geographic information system: A review. International
Journal of Engineering Research and Applications, 3(3), 81–91.

277
Vojdani, A. (2008). Smart integration. IEEE Power and Energy Magazine, 6(6), 71–79.
Vu, K. M. (2011). ICT as a source of economic growth in the information age: Empirical
evidence from the 1996–2005 period. Telecommunications Policy, 35(4), 357–372.
Wagner, A., Speiser, S., & Harth, A. (2010, November). Semantic Web Technologies for a
Smart Energy Grid: Requirements and Challenges. In Proceedings of the 2010
International Conference on Posters & Demonstrations Track, China, 33–36. CEUR-
WS. Org.
WAM. (2015, March 16). Smart systems to inspect labourers’ accommodation in Dubai.
Retrieved October 19, 2016 from
https://www.wam.ae/en/news/emirates/1395277991048.html.
Wang, G., Li, R., Carranza, E. J. M., Zhang, S., Yan, C., Zhu, Y., ... & Ma, Z. (2015). 3D
geological modeling for prediction of subsurface Mo targets in the Luanchuan district,
China. Ore Geology Reviews, 71, 592–610.
Wang, K. S. (2015). Method and system for avoidance of parking violations. U.S. Patent
Application No. 14/832,584.
Wang, Y., Li, H., Li, C., & Zhang, D. (2016). Factors affecting hotels’ adoption of mobile
reservation systems: A technology-organization-environment framework. Tourism
Management, 53, 163–172.
Ward, J., & Peppard, J. (2016). The strategic management of information systems: Building a
digital strategy, (4th ed.). UK: John Wiley & Sons.
Wei, K., Huang, J., & Fu, S. (2007). A survey of e-commerce recommender systems. In
Proceedings of 13th international conference on service systems and service
management (ICSSSM ’07), China, 1–5. Washington, DC: IEEE.
278
Weichhart, G., Molina, A., Chen, D., Whitman, L. E., & Vernadat, F. (2016). Challenges and
current developments for sensing, smart and sustainable enterprise
systems. Computers in Industry, 79, 34–46.
Weihrich, H., & Koontz, H. (2005). Management: A global perspective. Singapore: McGraw-
Hill.
Wen, G., Duan, Z., Yu, W., & Chen, G. (2013). Consensus of multi‐agent systems with
nonlinear dynamics and sampled‐data information: A delayed‐input
approach. International Journal of Robust and Nonlinear Control, 23(6), 602–619.
Westphal, J., Gulati, R., & Shortell, S. (1997). Customization or conformity? An institutional
and network perspective on the content and consequences of TQM adoption.
Administrative Science Quarterly, 42(2), 366–394.
Wetcher-Hendricks, D. (2011). Analyzing quantitative data: An introduction for social
researchers. USA: John Wiley & Sons.
Wetzels, M., Odekerken-Schröder, G., & Van Oppen, C. 2009; Guidelines and Empirical
illustration. MIS Quarterly, 177-195).
Wewalaarachchi, B. J., Shivanan, H., & Gunasingham, H. (2016). Integration platform to
enable operational intelligence and user journeys for smart cities and the internet of
things. U.S. Patent Application 15/044, 269.
Wilhelm, R., Kästner, D., Florian Martin, S. A., & Herter, J. (2013). Advanced course
development of safety-critical embedded systems. Retrieved September 23, 2016 from
http://www.rw.cdl.uni-saarland.de/teaching/dses12/.
Worden, K. Bullough, W. A., Haywood, J. (2003). Smart Technologies. Singapore: World
Scientific Publishing Co.
Wu, I. L., Li, J. Y., & Fu, C. Y. (2011). The adoption of mobile healthcare by hospital’s
professionals: An integrative perspective. Decision Support Systems, 51(3), 587–596.
279
Wu, J. H., & Wang, Y. M. (2006). Measuring KMS success: A respecification of the DeLone
and McLean model. Information & Management, 43(6), 728–739.
Wuenderlich, N. V., Heinonen, K., Ostrom, A. L., Patricio, L., Sousa, R., Voss, C., &
Lemmink, J. G. (2015). “Futurizing” smart service: implications for service
researchers and managers. Journal of Services Marketing, 29(6/7), 442–447.
Xiao, L. & Ma, X.L. (2014). The influence of government intervention on logistics enterprise
adoption of information technology. Journal of Digital Information Management,
12(1), 8–17.
Xu, J., & Zhang, R. (2016). Cooperative energy trading in CoMP systems powered by smart
grids. IEEE Transactions on Vehicular Technology, 65(4), 2142–2153.
Xu, R., Frey, R., Fleisch, E., & Ilic, A. (2016). Understanding the impact of personality traits
on mobile app Adoption: Insights from a large-scale field study. Computers in Human
Behavior, 62, 244–256.
Xu, X. (2012). From cloud computing to cloud manufacturing. Robotics and Computer-
integrated Manufacturing, 28(1), 75–86.
Yagi, S., Watanabe, T., & Nagayama, K. (2015). Transportation demand management in the
historical area of Istanbul: A pilot project of smart parking system. Journal of the
Eastern Asia Society for Transportation Studies, 11, 169–188.
Yang, S., Lu, Y., Gupta, S., Cao, Y., & Zhang, R. (2012). Mobile payment services adoption
across time: An empirical study of the effects of behavioral beliefs, social influences,
and personal traits. Computers in Human Behavior, 28(1), 129–142.
Yeh, K. C., Chen, R. S., & Chen, C. C. (2011). Intelligent service-integrated platform based
on the RFID technology and software agent system. Expert Systems with
Applications, 38(4), 3058–3068.

280
Yi, M., Jackson, J., Park, J., & Probst, J. (2006). Understanding information technology
acceptance by individual professionals: Toward an integrative view. Information &
Management, 43(3), 350–363.
Yoon, H. S., & Occeña, L. U. I. S. (2014). Impacts of customers’ perceptions on internet
banking use with a smart phone. Journal of Computer Information Systems, 54(3), 1–
9.
Yoon, S., & Cho, E. (2016). Convergence adoption model (CAM) in the context of a smart
car service. Computers in Human Behavior 60, 500–507.
Yousafzai, S. Y., Foxall, G. R., & Pallister, J. G. (2010). Explaining internet banking
behavior: Theory of reasoned action, theory of planned behavior, or technology
acceptance model? Journal of Applied Social Psychology, 40(5), 1172–1202.
Yu, C. S. (2012). Factors affecting individuals to adopt mobile banking: Empirical evidence
from the UTAUT model. Journal of Electronic Commerce Research, 13(2), 104–121.
Yu, E., Hong, A., & Hwang, J. (2016). A socio-technical analysis of factors affecting the
adoption of smart TV in Korea. Computers in Human Behavior, 61, 89–102.
Zeng, J., Wu, J., Jun-feng, L., Gao, L. M., & Li, M. (2008, November). An agent-based
approach to renewable energy management in eco-building. In Proceedings of the
2008 IEEE International Conference on Sustainable Energy Technologies, Singapore,
46–50.
Zhang, J. (2009). Exploring drivers in the adoption of mobile commerce in China. The
Journal of the American Academy of Business, 15(1), 2009, 64–69.
Zhang, T., & Nuttall, W. J. (2011). Evaluating government’s policies on promoting smart
metering diffusion in retail electricity markets via agent-based
simulation. Journal of Product Innovation Management, 28(2), 169–186.

281
Zhou, B., Li, W., Chan, K. W., Cao, Y., Kuang, Y., Liu, X., & Wang, X. (2016). Smart home
energy management systems: Concept, configurations, and scheduling
strategies. Renewable and Sustainable Energy Reviews, 61, 30–40.
Zhou, T., Lu, Y. B., & Wang, B. (2010). Integrating TTF and UTAUT to explain mobile
banking user adoption. Computers in Human Behavior, 26(4), 760–767.
Zhu, K., & Kraemer, K (2005). Post-adoption variations in usage and value of e-business by
organizations: Cross-country evidence from the retail industry. Information Systems
Research 16(1), 61–84.
Ziefle, M., & Wilkowska, W. (2010, March). Technology acceptability for medical
assistance. In Pervasive Computing Technologies for Healthcare (PervasiveHealth).
In Proceedings of the 2010 4th International Conference on Pervasive Computing
Technologies for Healthcare, Germany, 22-25 March 2010, 1-9.
Zomerdijk, L. G., & Voss, C. A. (2010). Service design for experience-centric services.
Journal of Service Research, 13(1), 67–82.
Zorn, T. E., Flanagin, A. J., & Shoham, M. D. (2011). Institutional and noninstitutional
influences on information and communication technology adoption and use among
nonprofit organizations. Human Communication Research, 37(1), 1–33.

282

283
APPENDICES

284

285
APPENDIX 1
PARTICIPANT INFORMATION FORM
Project Title
Adoption of Smart System and Its Impact on Organizational Performance in the United Arab
Emirates.
Researcher Chair of the Supervisory Panel
Sultan Alyammahi
PhD student, Management Information
Systems
Faculty of Business, Government & Law
University of Canberra
ACT 2601, Australia
Dr. Majharul Talukder
Assistant Professor
Faculty of Business, Government & Law
University of Canberra
ACT 2601, Australia
Project Aim
This research aims to investigate the adoption of smart system and its impact on the
performance of the organization in the United Arab Emirates. Although many studies have
already been conducted on technology adoption in developed nations, only a few have been
done on the Middle East (particularly in the UAE) with reference to smart systems.
Therefore, this study will address a significant gap in the literature by examining the effects
of external, organizational and individual factors on smart system adoption in the UAE and
its impact on organizational performance in terms of efficiency and enhanced service quality.
The study will ask questions about the Federal Authority for Government Human Resources
(FAHR) smart systems that are used by federal government employees.
Benefits of the Project
This study aims to theoretically construct an integrated model for smart system adoption and
its impact of organizational performance. The research has theoretical as well as practical
implications. The research will benefits managers and organizations to develop policies for

286
the adoption and usage of smart systems in the UAE. Notably, no study has addressed these
factors in the context of the UAE. Therefore, this research will make a significant
contribution in terms of understanding what are the key factors influencing the adoption of
smart systems in the UAE and how it can economically and socially benefit that country’s
government and public and private sectors.
General Outline of the Project
The researcher will investigate the determinants of the adoption of smart system in the UAE
and its impact of organizational performance in term of efficiency and enhanced service
quality. The research is planning to collate data from the Ministry of Foreign Affairs in the
UAE an using online survey questionnaire.
Participant Involvement
Please be informed that the individual responses to this study are strictly protected and
confidential. This study will not reveal the identity of those who have responded. The survey
questionnaire should take about 10 to 15 minutes to complete. Please note that you are under
no obligation to participate in this research and you are free to withdraw at any stage without
prejudice.
Participation in the research is completely voluntary and participant may, without any
penalty, decline to take part or withdraw at any time without providing an explanation, or
refuse to answer a question.
Please be assured that all the data collected from participants will be stored securely and only
accessed by the researcher. Great care will be taken to ensure that any reports of the data do
not identify any individual or their circumstances.
Confidentiality
We guarantee confidentiality and will ensure there is no access to your data. Data will be kept
in a locked office in the University of Canberra Australia. The data will be a password
protected file only accessible by the researcher. It will be stored for 5 years, and after that
will be destroyed.

287
Anonymity
Please note that participants’ responses to this study are strictly confidential and protected.
This study will not reveal the identity of those who have responded. Please be assured that all
reports of the research will contain no information that can identify any individual and all
information will be kept in the strictest confidence.
Data Storage
The information collected will be stored securely on a password protected computer
throughout the project and then stored at the University of Canberra for the required five year
period after which it will be destroyed according to university protocols.
Ethics Committee Clearance
The project has been approved by the Human Research Ethics Committee of the University
(HREC…….).

288
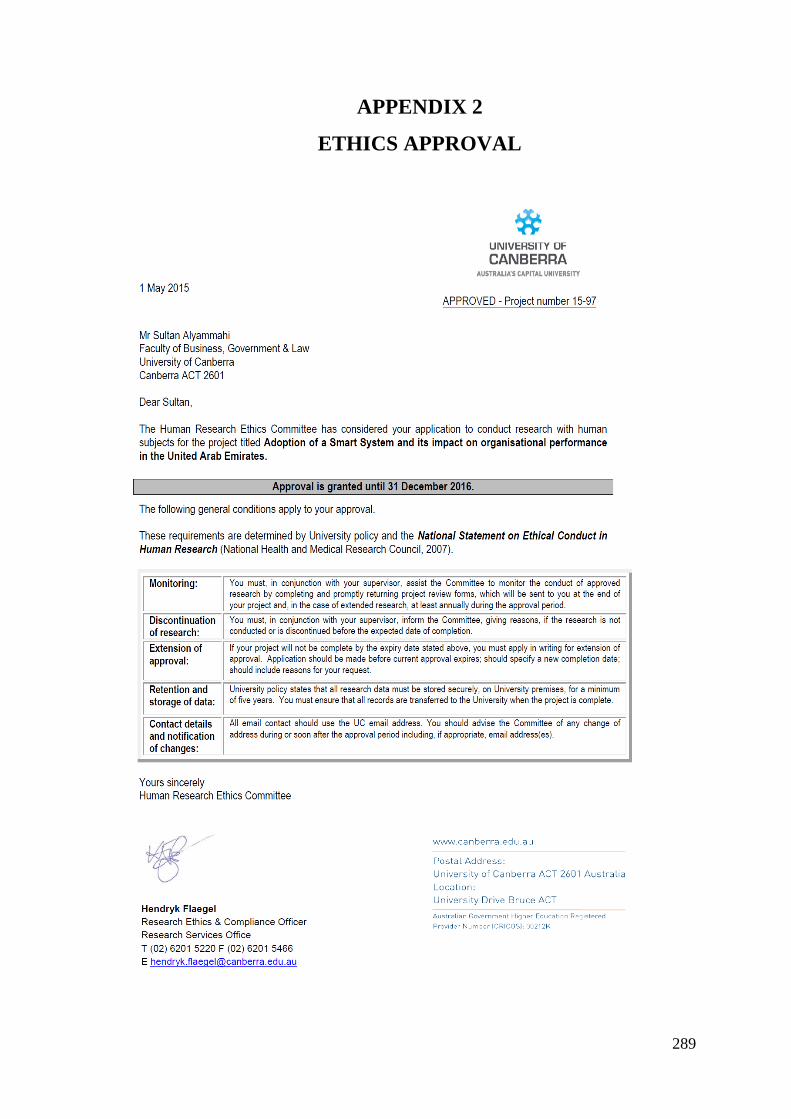
289
APPENDIX 2
ETHICS APPROVAL

290

291
APPENDIX 3
SURVEY QUESTIONNAIRE
Faculty of Business, Government & Law, University of Canberra
Adoption of Smart System and Its Impact on Organizational Performance in the United Arab
Emirates.
(Note: Smart System indicated here is the process within Federal Authority for Government
Human Resources (FAHR) allowing services to be provided for use on innovative
technologies, particularly, smart phones, and to be used by federal employees)
Demographics (please tick the appropriate choice)
1. Your gender? (a) Male (b) Female
2. To which are age group do you belong? (a) 20-29 (b) 30-39 (c) 40-49 (d) 50-59
(e) 60 and above
3. What is your highest academic qualification? (a) Primary (b) HSC (c) Bachelor (d)
Master’s degree (e) PhD
4. Your position? (a) General employee (b) Mid-level manager (c) Top-level manager
5. Which organization do you belong to?
(a) Ministry of Foreign Affairs (b) Ministry of Health (c) Ministry of Economy
Usage Level:
1. On average, how much time do you spend per week using smart system for job-related
work?
(a) Less than 1 hour, (b) 1-2 hours, (c) 2-3 hours, (d) 3-4 hours, (e) More than 4 hours
2. On average, how frequently do you use the smart system for job-related work?
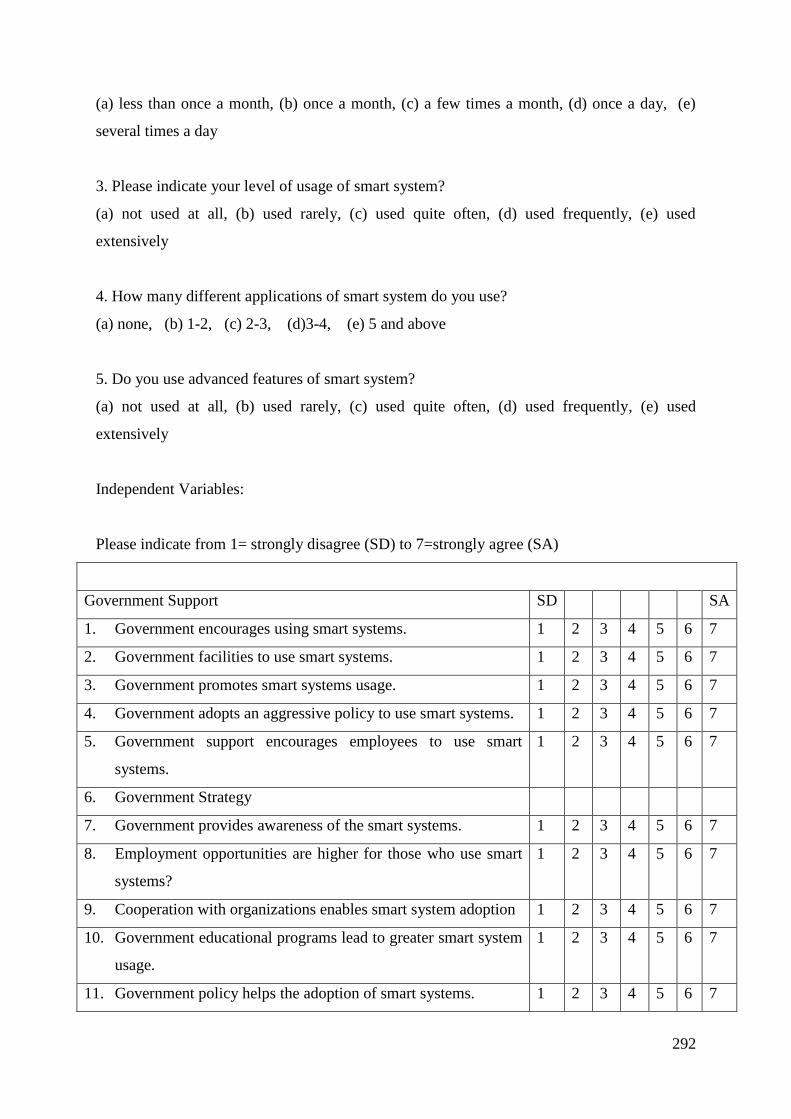
292
(a) less than once a month, (b) once a month, (c) a few times a month, (d) once a day, (e)
several times a day
3. Please indicate your level of usage of smart system?
(a) not used at all, (b) used rarely, (c) used quite often, (d) used frequently, (e) used
extensively
4. How many different applications of smart system do you use?
(a) none, (b) 1-2, (c) 2-3, (d)3-4, (e) 5 and above
5. Do you use advanced features of smart system?
(a) not used at all, (b) used rarely, (c) used quite often, (d) used frequently, (e) used
extensively
Independent Variables:
Please indicate from 1= strongly disagree (SD) to 7=strongly agree (SA)
Government Support SD SA
1. Government encourages using smart systems. 1 2 3 4 5 6 7
2. Government facilities to use smart systems. 1 2 3 4 5 6 7
3. Government promotes smart systems usage. 1 2 3 4 5 6 7
4. Government adopts an aggressive policy to use smart systems. 1 2 3 4 5 6 7
5. Government support encourages employees to use smart
systems.
1 2 3 4 5 6 7
6. Government Strategy
7. Government provides awareness of the smart systems. 1 2 3 4 5 6 7
8. Employment opportunities are higher for those who use smart
systems?
1 2 3 4 5 6 7
9. Cooperation with organizations enables smart system adoption 1 2 3 4 5 6 7
10. Government educational programs lead to greater smart system
usage.
1 2 3 4 5 6 7
11. Government policy helps the adoption of smart systems. 1 2 3 4 5 6 7
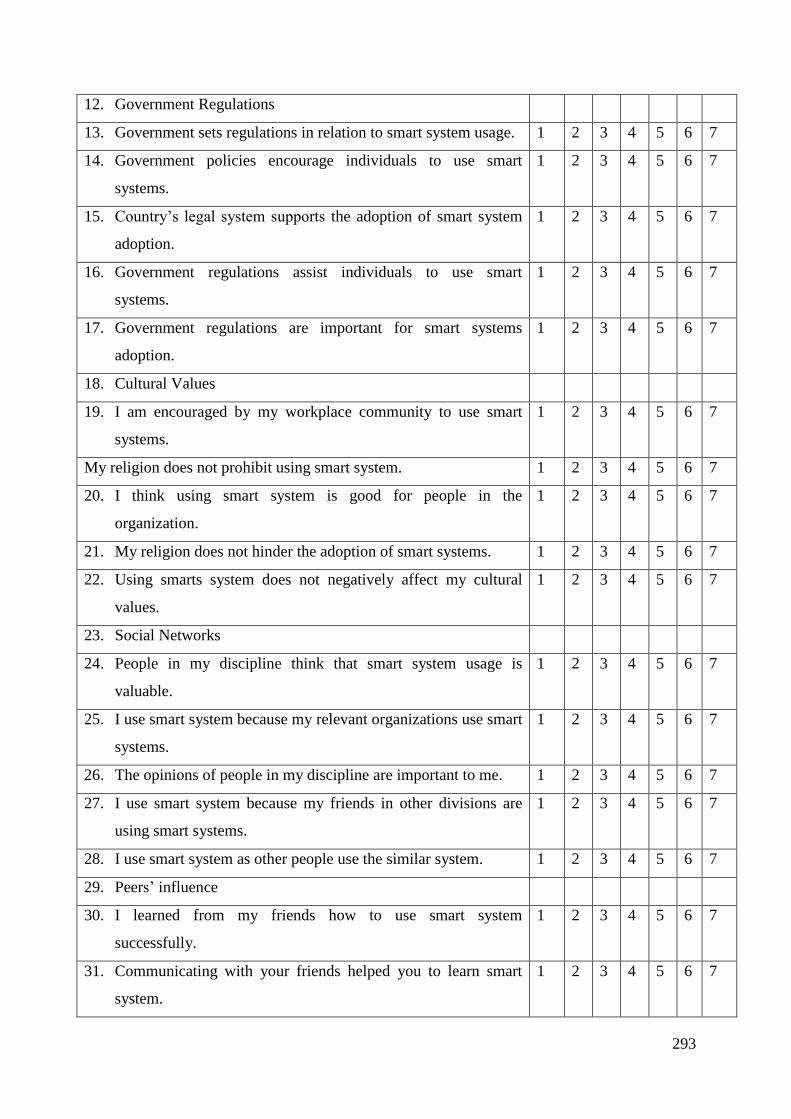
293
12. Government Regulations
13. Government sets regulations in relation to smart system usage. 1 2 3 4 5 6 7
14. Government policies encourage individuals to use smart
systems.
1 2 3 4 5 6 7
15. Country’s legal system supports the adoption of smart system
adoption.
1 2 3 4 5 6 7
16. Government regulations assist individuals to use smart
systems.
1 2 3 4 5 6 7
17. Government regulations are important for smart systems
adoption.
1 2 3 4 5 6 7
18. Cultural Values
19. I am encouraged by my workplace community to use smart
systems.
1 2 3 4 5 6 7
My religion does not prohibit using smart system. 1 2 3 4 5 6 7
20. I think using smart system is good for people in the
organization.
1 2 3 4 5 6 7
21. My religion does not hinder the adoption of smart systems. 1 2 3 4 5 6 7
22. Using smarts system does not negatively affect my cultural
values.
1 2 3 4 5 6 7
23. Social Networks
24. People in my discipline think that smart system usage is
valuable.
1 2 3 4 5 6 7
25. I use smart system because my relevant organizations use smart
systems.
1 2 3 4 5 6 7
26. The opinions of people in my discipline are important to me. 1 2 3 4 5 6 7
27. I use smart system because my friends in other divisions are
using smart systems.
1 2 3 4 5 6 7
28. I use smart system as other people use the similar system. 1 2 3 4 5 6 7
29. Peers’ influence
30. I learned from my friends how to use smart system
successfully.
1 2 3 4 5 6 7
31. Communicating with your friends helped you to learn smart
system.
1 2 3 4 5 6 7

294
32. Performing a task using smart system increased my intention to
adopt it.
1 2 3 4 5 6 7
33. Opinions of the people in informal groups to which I belong
are important to me.
1 2 3 4 5 6 7
34. People in formal group to which I belong think using smart
system is valuable.
1 2 3 4 5 6 7
35. Technological Readiness?
36. My organization is ready to use smart system 1 2 3 4 5 6 7
37. The organization is mature in terms of technology to adopt
smart system.
1 2 3 4 5 6 7
38. Organization has updated technology to use smart system. 1 2 3 4 5 6 7
39. The organization is technologically sophisticated to use smart
system.
1 2 3 4 5 6 7
40. The organization is up-to-date regarding modern technology. 1 2 3 4 5 6 7
41. Training
42. Guidance is available for me on how to use smart system. 1 2 3 4 5 6 7
43. Specialized instructions concerning smart system usage are
available for me.
1 2 3 4 5 6 7
44. Internal training courses are available to improve smart system
usage.
1 2 3 4 5 6 7
45. Training is provided to explain the features of smart system. 1 2 3 4 5 6 7
46. A specific person is available for individualized support when I
face difficulties.
1 2 3 4 5 6 7
47. Managerial Support
48. Management is keen to see that employees are using smart
system.
1 2 3 4 5 6 7
49. Management encourages employees to use smart system in
their work.
1 2 3 4 5 6 7
50. Management provides various support to the smart system
adoption.
1 2 3 4 5 6 7
51. Management is aware of the advantages that can be gained
using smart system.
1 2 3 4 5 6 7
52. Management provides most of the necessary - resources to use 1 2 3 4 5 6 7

295
smart system.
53. Incentives
54. Smart system helps me to save time in my work. 1 2 3 4 5 6 7
55. Smart system helps me to accomplish tasks more quickly. 1 2 3 4 5 6 7
56. Use of smart system improves my productivity. 1 2 3 4 5 6 7
57. Use of smart system keeps my personal data more secure. 1 2 3 4 5 6 7
58. Using smart systems gives me flexibility in my job. 1 2 3 4 5 6 7
59. Perceived Benefits
60. Smart system usage improves my performance. 1 2 3 4 5 6 7
61. Using smart systems makes it easier for me to perform my
duties.
1 2 3 4 5 6 7
62. Smart system usage increases my quality of work. 1 2 3 4 5 6 7
63. Smart system enables me to quickly finish my work. 1 2 3 4 5 6 7
64. Smart system increases my effectiveness in doing work. 1 2 3 4 5 6 7
65. Personal Innovativeness
66. I like to use new innovation. 1 2 3 4 5 6 7
67. Among my peers, I am the first who is likely to use a new
system?
1 2 3 4 5 6 7
68. I like to experiment with a new system 1 2 3 4 5 6 7
69. I am enthusiastic to learn about new technology. 1 2 3 4 5 6 7
70. I learned more about smart system by my own initiative. 1 2 3 4 5 6 7
71. Prior Experience
72. I learned from my previous work experience to sue smart
system.
1 2 3 4 5 6 7
73. I learned from my previous training experience how to use
smart system.
1 2 3 4 5 6 7
74. I have learned to use smart system in my previous Job. 1 2 3 4 5 6 7
75. I learned from previous experience with similar technology. 1 2 3 4 5 6 7
76. I am already familiar with a similar system. 1 2 3 4 5 6 7
77. Enjoyment with Innovation
78. I think using smart system is enjoyable. 1 2 3 4 5 6 7
79. You feel comfortable using smart system. 1 2 3 4 5 6 7

296
80. I believe usage of smart system is interesting. 1 2 3 4 5 6 7
81. Smart system usage is pleasant. 1 2 3 4 5 6 7
82. I believe using smart system is convenient. 1 2 3 4 5 6 7
83. Cost Effectiveness
84. Smart system reduces cost of operations in my organization. 1 2 3 4 5 6 7
85. Smart system provides cost efficiency to my organization. 1 2 3 4 5 6 7
86. I believe smart system helps my organization to save money. 1 2 3 4 5 6 7
87. I think smart system helps to reduce overall costs. 1 2 3 4 5 6 7
88. Organization is better now at saving money. 1 2 3 4 5 6 7
89. Organizational Efficiency.
90. Using smart system improves the efficiency of the organization. 1 2 3 4 5 6 7
91. Smart system’s usage enables me to work more efficiently. 1 2 3 4 5 6 7
92. Smart system increases my efficiency in collecting information. 1 2 3 4 5 6 7
93. Smart system enhances my efficiency by increasing the level of
interaction.
1 2 3 4 5 6 7
94. Smart system enables you to increase efficiency to solve
problems.
1 2 3 4 5 6 7
95. Loyalty to the Organization.
96. Adoption of smart system helps me to become happy with the
organization.
1 2 3 4 5 6 7
97. Smart system adoption improves my satisfaction with the
organization.
1 2 3 4 5 6 7
98. Smart system adoption makes me to become loyal to the
organization.
1 2 3 4 5 6 7
99. Smart system makes me want to continue working with the
organization.
1 2 3 4 5 6 7
100. I want to be with this organization due to using smart system 1 2 3 4 5 6 7
101. Enhanced Service Quality.
102. Smart system provides convenience of completing tasks. 1 2 3 4 5 6 7
103. Smart system enables me to save time and effort. 1 2 3 4 5 6 7
104. Smart system helps me to easily access information. 1 2 3 4 5 6 7
105. Smart system provides me with quick service. 1 2 3 4 5 6 7
106. Smart system helps me to do the work with less effort. 1 2 3 4 5 6 7

297
107.Reputational Development
108.Smart system adoption increases the organization’s reputation. 1 2 3 4 5 6 7
109.Using smart system improves the organization’ image. 1 2 3 4 5 6 7
110.Using smart system helps to increase employees’ profile. 1 2 3 4 5 6 7
111. People consider this organization as technologically up-to-date. 1 2 3 4 5 6 7
112. I believe using smart system increases organizational status. 1 2 3 4 5 6 7
113. Better Relationships with Customers
114. Smart system helps me to have close contact with customers. 1 2 3 4 5 6 7
115. Smart system helps me to have good communication with
customers.
1 2 3 4 5 6 7
116. Smart system helps me to develop good understanding with
customers.
1 2 3 4 5 6 7
117. Smart system enables you to develop strong relationships with
customers.
1 2 3 4 5 6 7
118. Attitude towards Smart System.
119. Using smart systems are important to your job. 1 2 3 4 5 6 7
120. Using smart systems is relevant to your job. 1 2 3 4 5 6 7
121. Using smart system is helpful. 1 2 3 4 5 6 7
122. Using smart system is practical. 1 2 3 4 5 6 7
123. I like the idea of using smart system. 1 2 3 4 5 6 7
Please write your email address below if you wish to receive the results of this survey.
Email:……………………………………………………………………….…………………..
Thank You very much for your cooperation.

298

299
APPENDIX 4
VALIDITY AND RELIABILITY OF THE STUDY
Reliability
Reliability Statistics
Cronbach's Alpha N of Items
.854 5
Item Statistics
Mean Std. Deviation N
Sup1 5.6723 1.37867 357
Sup2 5.4846 1.30810 357
sup3 5.5126 1.28866 357
sup4 5.0140 1.54423 357
sup5 5.3081 1.30697 357
Item-Total Statistics
Scale Mean if
Item Deleted
Scale Variance if
Item Deleted
Corrected Item-
Total Correlation
Cronbach's
Alpha if Item
Deleted
Sup1 21.3193 18.920 .730 .807
Sup2 21.5070 18.981 .779 .796
sup3 21.4790 19.441 .746 .805
sup4 21.9776 19.988 .522 .868
sup5 21.6835 20.762 .597 .842
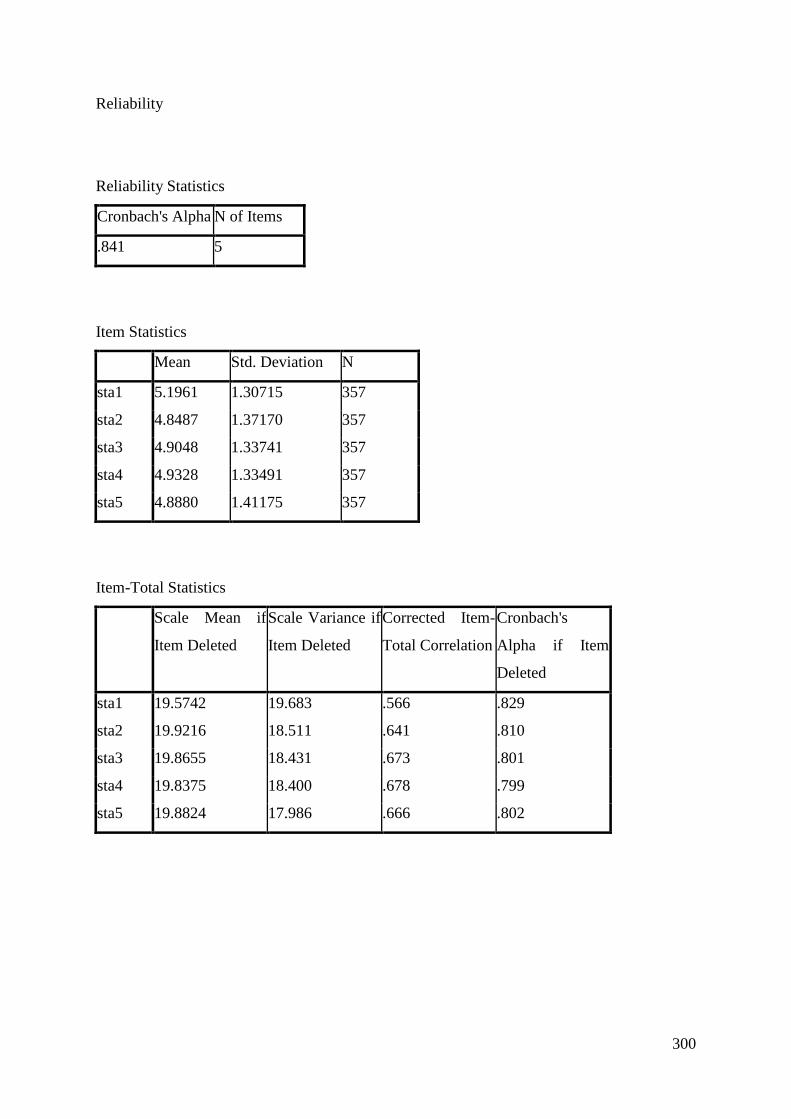
300
Reliability
Reliability Statistics
Cronbach's Alpha N of Items
.841 5
Item Statistics
Mean Std. Deviation N
sta1 5.1961 1.30715 357
sta2 4.8487 1.37170 357
sta3 4.9048 1.33741 357
sta4 4.9328 1.33491 357
sta5 4.8880 1.41175 357
Item-Total Statistics
Scale Mean if
Item Deleted
Scale Variance if
Item Deleted
Corrected Item-
Total Correlation
Cronbach's
Alpha if Item
Deleted
sta1 19.5742 19.683 .566 .829
sta2 19.9216 18.511 .641 .810
sta3 19.8655 18.431 .673 .801
sta4 19.8375 18.400 .678 .799
sta5 19.8824 17.986 .666 .802

301
Reliability
Reliability Statistics
Cronbach's Alpha N of Items
.839 5
Item Statistics
Mean Std. Deviation N
reg1 4.6891 1.38662 357
reg2 5.0672 1.30727 357
reg3 5.0196 1.36248 357
reg4 4.9384 1.40089 357
reg5 5.0952 1.46376 357
Item-Total Statistics
Scale Mean if
Item Deleted
Scale Variance if
Item Deleted
Corrected Item-
Total Correlation
Cronbach's
Alpha if Item
Deleted
reg1 20.1204 19.730 .609 .815
reg2 19.7423 19.995 .638 .808
reg3 19.7899 19.335 .665 .800
reg4 19.8711 18.826 .689 .793
reg5 19.7143 19.188 .611 .816

302
Reliability
Reliability Statistics
Cronbach's Alpha N of Items
.779 5
Item Statistics
Mean Std. Deviation. N
val1 5.0644 1.33400 357
val2 5.7059 1.28967 357
val3 5.5714 1.23095 357
val4 5.4734 1.31649 357
val5 5.4398 1.23383 357
Item-Total Statistics
Scale Mean if
Item Deleted
Scale Variance if
Item Deleted
Corrected Item-
Total Correlation
Cronbach's
Alpha if Item
Deleted
val1 22.1905 15.093 .477 .765
val2 21.5490 14.411 .587 .727
val3 21.6835 15.279 .522 .749
val4 21.7815 14.272 .585 .728
val5 21.8151 14.617 .602 .723

303
Reliability
Reliability Statistics
Cronbach's Alpha N of Items
.803 5
Item Statistics
Mean Std. Deviation N
net1 5.1877 1.19506 357
net2 4.9580 1.19499 357
net3 4.8880 1.22877 357
net4 4.6751 1.44982 357
net5 4.9188 1.37865 357
Item-Total Statistics
Scale Mean if
Item Deleted
Scale Variance if
Item Deleted
Corrected Item-
Total Correlation
Cronbach's
Alpha if Item
Deleted
net1 19.4398 18.213 .369 .825
net2 19.6695 15.975 .629 .754
net3 19.7395 15.828 .621 .756
net4 19.9524 13.956 .679 .735
net5 19.7087 14.623 .653 .744

304
Reliability
Reliability Statistics
Cronbach's Alpha N of Items
.839 5
Item Statistics
Mean Std. Deviation N
inf1 4.3389 1.47449 357
inf2 4.9216 1.49888 357
inf3 5.3669 1.27302 357
inf4 5.1765 1.26744 357
inf5 5.3669 1.22810 357
Item-Total Statistics
Scale Mean if
Item Deleted
Scale Variance if
Item Deleted
Corrected Item-
Total Correlation
Cronbach's
Alpha if Item
Deleted
inf1 20.8319 17.663 .648 .806
inf2 20.2493 16.969 .701 .790
inf3 19.8039 19.074 .646 .807
inf4 19.9944 19.427 .612 .815
inf5 19.8039 19.641 .618 .814

305
Reliability
Reliability Statistics
Cronbach's Alpha N of Items
.887 5
Item Statistics
Mean Std. Deviation N
rea1 5.2661 1.30009 357
rea2 5.3333 1.17001 357
rea3 5.4174 1.17895 357
rea4 5.3333 1.14329 357
rea5 5.1513 1.14145 357
Item-Total Statistics
Scale Mean if
Item Deleted
Scale Variance if
Item Deleted
Corrected Item-
Total Correlation
Cronbach's
Alpha if Item
Deleted
rea1 21.2353 15.293 .719 .865
rea2 21.1681 15.562 .797 .846
rea3 21.0840 16.060 .724 .863
rea4 21.1681 16.292 .725 .863
rea5 21.3501 16.723 .671 .874

306
Reliability
Reliability Statistics
Cronbach's Alpha N of Items
.897 5
Item Statistics
Mean Std. Deviation N
tra1 4.9048 1.18127 357
tra2 4.8039 1.20658 357
tra3 4.7255 1.28419 357
tra4 4.9076 1.28949 357
tra5 4.9356 1.25367 357
Item-Total Statistics
Scale Mean if
Item Deleted
Scale Variance if
Item Deleted
Corrected Item-
Total Correlation
Cronbach's
Alpha if Item
Deleted
tra1 19.3725 18.594 .729 .879
tra2 19.4734 18.037 .773 .869
tra3 19.5518 17.495 .770 .870
tra4 19.3697 17.801 .731 .879
tra5 19.3417 18.051 .731 .878

307
Reliability
Reliability Statistics
Cronbach's Alpha N of Items
.884 5
Item Statistics
Mean Std. Deviation N
man1 5.3277 1.23463 357
man2 5.3137 1.23259 357
man3 5.1345 1.24244 357
man4 5.2885 1.23762 357
man5 5.1737 1.23073 357
Item-Total Statistics
Scale Mean if
Item Deleted
Scale Variance if
Item Deleted
Corrected Item-
Total Correlation
Cronbach's
Alpha if Item
Deleted
man1 20.9104 17.267 .708 .862
man2 20.9244 17.278 .709 .861
man3 21.1036 17.020 .731 .856
man4 20.9496 16.969 .741 .854
man5 21.0644 17.274 .711 .861

308
Reliability
Reliability Statistics
Cronbach's Alpha N of Items
.890 5
Item Statistics
Mean Std. Deviation N
in1 5.4314 1.24473 357
in2 5.4230 1.28860 357
in3 5.3950 1.31255 357
in4 5.0840 1.32974 357
in5 5.4706 1.28183 357
Item-Total Statistics
Scale Mean if
Item Deleted
Scale Variance if
Item Deleted
Corrected Item-
Total Correlation
Cronbach's
Alpha if Item
Deleted
in1 21.3725 18.880 .788 .854
in2 21.3810 18.905 .748 .862
in3 21.4090 18.905 .729 .866
in4 21.7199 19.331 .671 .880
in5 21.3333 19.172 .725 .867

309
Reliability
Reliability Statistics
Cronbach's Alpha N of Items
.882 5
Item Statistics
Mean Std. Deviation N
be1 5.2689 1.23637 357
be2 5.2465 1.22510 357
be3 5.2661 1.26504 357
be4 5.2941 1.23402 357
be5 5.2185 1.31645 357
Item-Total Statistics
Scale Mean if
Item Deleted
Scale Variance if
Item Deleted
Corrected Item-
Total Correlation
Cronbach's
Alpha if Item
Deleted
be1 21.0252 17.839 .709 .858
be2 21.0476 17.501 .758 .847
be3 21.0280 17.432 .733 .853
be4 21.0000 18.264 .663 .869
be5 21.0756 17.177 .721 .856

310
Reliability
Reliability Statistics
Cronbach's Alpha N of Items
.823 5
Item Statistics
Mean Std. Deviation N
in1 5.3473 1.25076 357
in2 5.3277 1.23917 357
in3 5.3417 1.22510 357
in4 5.4034 1.22005 357
in5 5.4146 1.19060 357
Item-Total Statistics
Scale Mean if
Item Deleted
Scale Variance if
Item Deleted
Corrected Item-
Total Correlation
Cronbach's
Alpha if Item
Deleted
in1 21.4874 14.206 .656 .776
in2 21.5070 14.470 .631 .783
in3 21.4930 14.256 .670 .772
in4 21.4314 15.010 .578 .799
in5 21.4202 15.441 .545 .808

311
Reliability
Reliability Statistics
Cronbach's Alpha N of Items
.847 5
Item Statistics
Mean Std. Deviation N
ex1 5.0644 1.37137 357
ex2 5.1541 1.40877 357
ex3 5.0840 1.42162 357
ex4 5.2157 1.35165 357
ex5 5.0616 1.34357 357
Item-Total Statistics
Scale Mean if
Item Deleted
Scale Variance if
Item Deleted
Corrected Item-
Total Correlation
Cronbach's
Alpha if Item
Deleted
ex1 20.5154 19.385 .682 .808
ex2 20.4258 19.105 .683 .808
ex3 20.4958 19.183 .666 .812
ex4 20.3641 19.738 .660 .814
ex5 20.5182 20.599 .582 .834

312
Reliability
Reliability Statistics
Cronbach's Alpha N of Items
.830 5
Item Statistics
Mean Std. Deviation N
en1 5.3754 1.27388 357
en2 5.4734 1.14533 357
en3 5.4818 1.23744 357
en4 5.3501 1.23073 357
en5 5.3053 1.26060 357
Item-Total Statistics
Scale Mean if
Item Deleted
Scale Variance if
Item Deleted
Corrected Item-
Total Correlation
Cronbach's
Alpha if Item
Deleted
en1 21.6106 14.424 .668 .784
en2 21.5126 16.464 .510 .827
en3 21.5042 14.638 .670 .783
en4 21.6359 14.873 .645 .791
en5 21.6807 14.712 .642 .791

313
Reliability
Reliability Statistics
Cronbach's Alpha N of Items
.815 5
Item Statistics
Mean Std. Deviation N
cs1 5.3137 1.23941 357
cs2 5.3361 1.16559 357
cs3 5.3529 1.16543 357
cs4 5.3333 1.25346 357
cs5 5.3165 1.24209 357
Item-Total Statistics
Scale Mean if
Item Deleted
Scale Variance if
Item Deleted
Corrected Item-
Total Correlation
Cronbach's
Alpha if Item
Deleted
cs1 21.3389 13.556 .664 .760
cs2 21.3165 14.582 .586 .784
cs3 21.2997 14.503 .596 .781
cs4 21.3193 13.982 .598 .781
cs5 21.3361 14.207 .577 .787

314
Reliability
Reliability Statistics
Cronbach's Alpha N of Items
.835 5
Item Statistics
Mean Std. Deviation N
ef1 5.4006 1.23129 357
ef2 5.3697 1.16503 357
ef3 5.3613 1.22059 357
ef4 5.2661 1.15355 357
ef5 5.3165 1.14071 357
Item-Total Statistics
Scale Mean if
Item Deleted
Scale Variance if
Item Deleted
Corrected Item-
Total Correlation
Cronbach's
Alpha if Item
Deleted
ef1 21.3137 13.868 .618 .807
ef2 21.3445 14.491 .587 .815
ef3 21.3529 13.729 .645 .799
ef4 21.4482 13.709 .704 .782
ef5 21.3978 14.358 .624 .805

315
Reliability
Reliability Statistics
Cronbach's Alpha N of Items
.830 5
Item Statistics
Mean Std. Deviation N
lo1 5.3445 1.16675 357
lo2 5.3165 1.14562 357
lo3 5.2073 1.24144 357
lo4 5.2745 1.24194 357
lo5 5.1541 1.37445 357
Item-Total Statistics
Scale Mean if
Item Deleted
Scale Variance if
Item Deleted
Corrected Item-
Total Correlation
Cronbach's
Alpha if Item
Deleted
lo1 20.9524 15.989 .577 .809
lo2 20.9804 15.716 .628 .796
lo3 21.0896 15.059 .636 .793
lo4 21.0224 14.792 .670 .783
lo5 21.1429 14.286 .631 .796
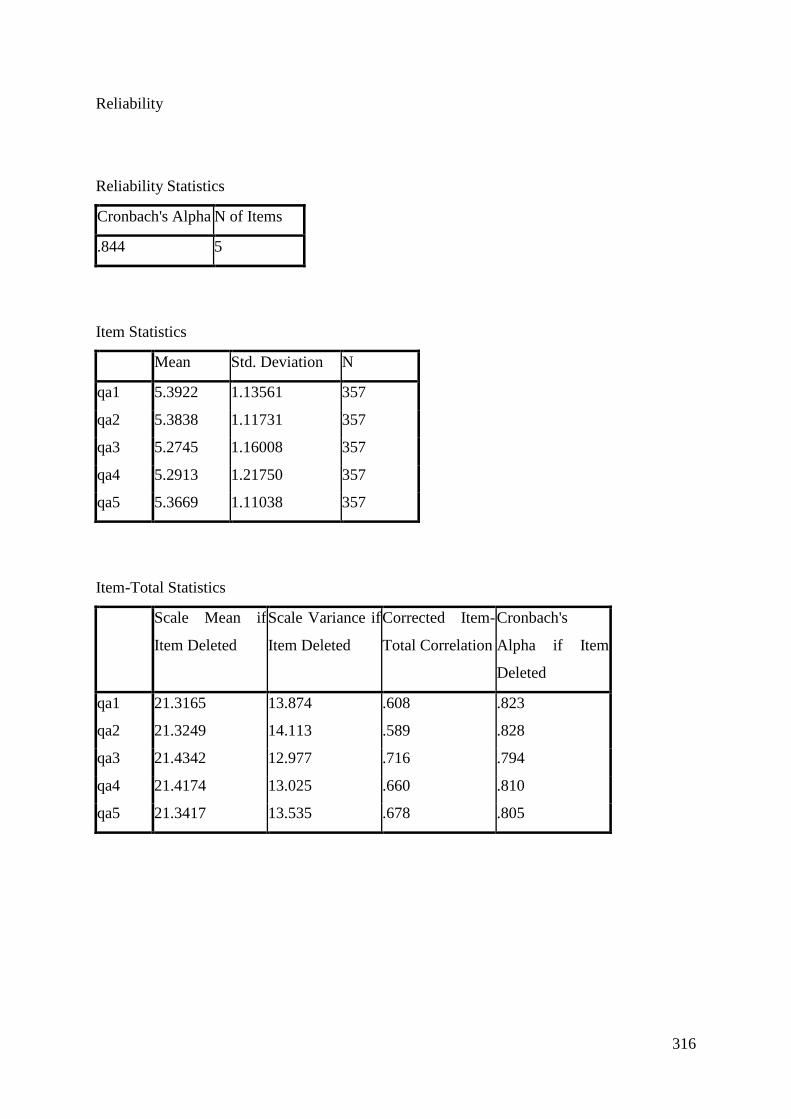
316
Reliability
Reliability Statistics
Cronbach's Alpha N of Items
.844 5
Item Statistics
Mean Std. Deviation N
qa1 5.3922 1.13561 357
qa2 5.3838 1.11731 357
qa3 5.2745 1.16008 357
qa4 5.2913 1.21750 357
qa5 5.3669 1.11038 357
Item-Total Statistics
Scale Mean if
Item Deleted
Scale Variance if
Item Deleted
Corrected Item-
Total Correlation
Cronbach's
Alpha if Item
Deleted
qa1 21.3165 13.874 .608 .823
qa2 21.3249 14.113 .589 .828
qa3 21.4342 12.977 .716 .794
qa4 21.4174 13.025 .660 .810
qa5 21.3417 13.535 .678 .805

317
Reliability
Reliability Statistics
Cronbach's Alpha N of Items
.844 5
Item Statistics
Mean Std. Deviation N
re1 5.6499 1.17945 357
re2 5.3782 1.18505 357
re3 5.2549 1.16335 357
re4 5.3109 1.26590 357
re5 5.4398 1.12174 357
Item-Total Statistics
Scale Mean if
Item Deleted
Scale Variance if
Item Deleted
Corrected Item-
Total Correlation
Cronbach's
Alpha if Item
Deleted
re1 21.3838 14.484 .636 .816
re2 21.6555 14.238 .665 .808
re3 21.7787 14.212 .687 .803
re4 21.7227 14.375 .585 .832
re5 21.5938 14.467 .687 .803

318
Reliability
Reliability Statistics
Cronbach's Alpha N of Items
.580 5
Item Statistics
Mean Std. Deviation N
rel1 5.2717 1.27271 357
rel2 5.2381 1.23247 357
rel3 5.2241 1.26765 357
rel4 5.4426 3.89687 357
rel5 5.2717 1.27050 357
Item-Total Statistics
Scale Mean if
Item Deleted
Scale Variance if
Item Deleted
Corrected Item-
Total Correlation
Cronbach's
Alpha if Item
Deleted
rel1 21.1765 31.326 .509 .485
rel2 21.2101 31.515 .518 .486
rel3 21.2241 31.427 .504 .487
rel4 21.0056 17.281 .239 .843
rel5 21.1765 30.606 .568 .465

319
Reliability
Reliability Statistics
Cronbach's Alpha N of Items
.865 5
Item Statistics
Mean Std. Deviation N
at1 5.5154 1.19358 357
at2 5.3165 1.17945 357
at3 5.4174 1.17895 357
at4 5.3754 1.12642 357
at5 5.6975 1.17479 357
Item-Total Statistics
Scale Mean if
Item Deleted
Scale Variance if
Item Deleted
Corrected Item-
Total Correlation
Cronbach's
Alpha if Item
Deleted
at1 21.8067 14.831 .655 .845
at2 22.0056 14.742 .679 .839
at3 21.9048 14.637 .693 .836
at4 21.9468 14.635 .740 .824
at5 21.6246 14.853 .668 .842

320
Reliability
Reliability Statistics
Cronbach's Alpha N of Items
.851 5
Item Statistics
Mean Std. Deviation N
Time 3.6275 1.42751 357
Frequency 3.8964 1.29732 357
Usage 3.7059 1.11188 357
Features 3.1204 1.07293 357
Application 3.2745 1.17212 357
Item-Total Statistics
Scale Mean if
Item Deleted
Scale Variance if
Item Deleted
Corrected Item-
Total Correlation
Cronbach's
Alpha if Item
Deleted
Time 13.9972 14.317 .654 .826
Frequency 13.7283 15.069 .662 .820
Usage 13.9188 15.698 .736 .803
Features 14.5042 16.279 .692 .815
Application 14.3501 16.380 .597 .836
Scale Statistics
Mean Variance Std. Deviation N of Items
17.6246 23.421 4.83947 5
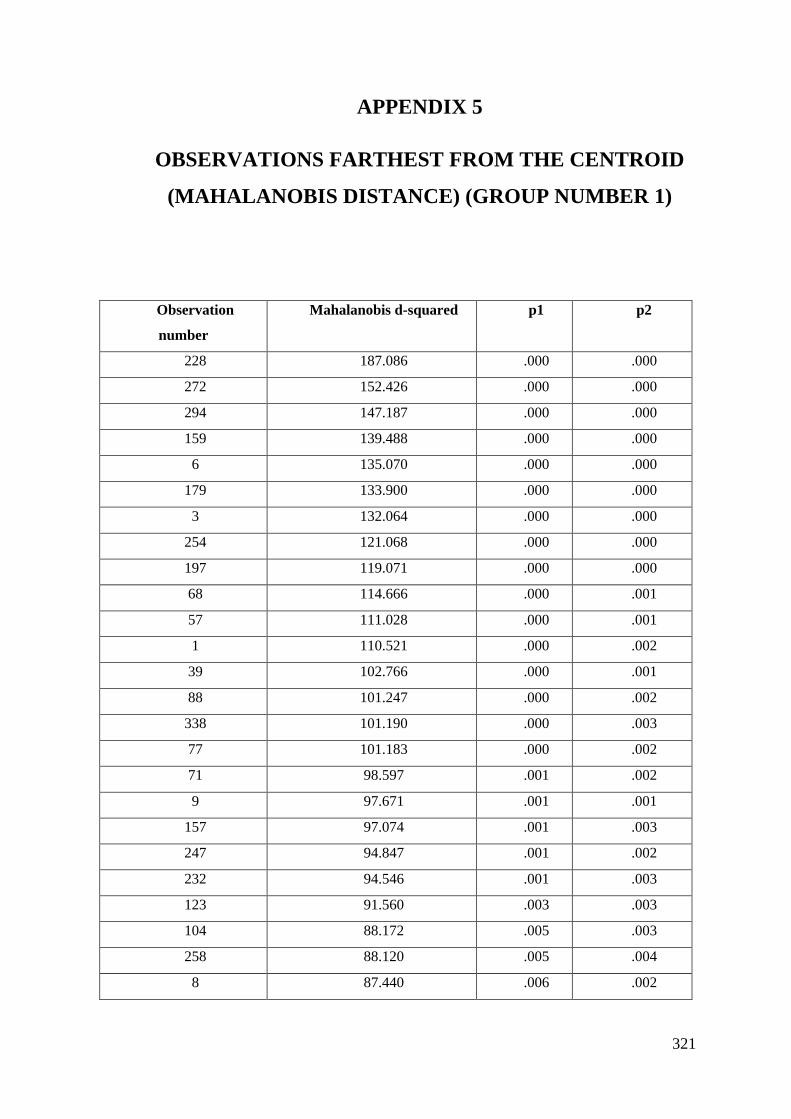
321
APPENDIX 5
OBSERVATIONS FARTHEST FROM THE CENTROID
(MAHALANOBIS DISTANCE) (GROUP NUMBER 1)
Observation
number
Mahalanobis d-squared p1 p2
228 187.086 .000 .000
272 152.426 .000 .000
294 147.187 .000 .000
159 139.488 .000 .000
6 135.070 .000 .000
179 133.900 .000 .000
3 132.064 .000 .000
254 121.068 .000 .000
197 119.071 .000 .000
68 114.666 .000 .001
57 111.028 .000 .001
1 110.521 .000 .002
39 102.766 .000 .001
88 101.247 .000 .002
338 101.190 .000 .003
77 101.183 .000 .002
71 98.597 .001 .002
9 97.671 .001 .001
157 97.074 .001 .003
247 94.847 .001 .002
232 94.546 .001 .003
123 91.560 .003 .003
104 88.172 .005 .003
258 88.120 .005 .004
8 87.440 .006 .002
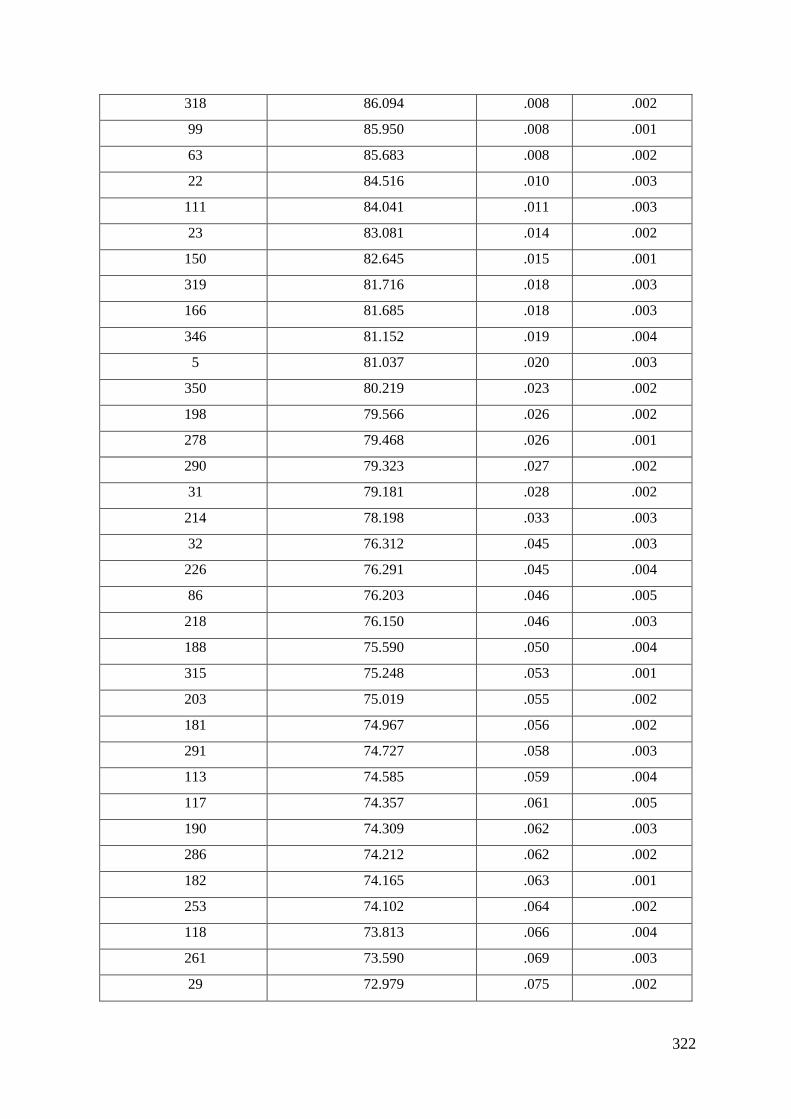
322
318 86.094 .008 .002
99 85.950 .008 .001
63 85.683 .008 .002
22 84.516 .010 .003
111 84.041 .011 .003
23 83.081 .014 .002
150 82.645 .015 .001
319 81.716 .018 .003
166 81.685 .018 .003
346 81.152 .019 .004
5 81.037 .020 .003
350 80.219 .023 .002
198 79.566 .026 .002
278 79.468 .026 .001
290 79.323 .027 .002
31 79.181 .028 .002
214 78.198 .033 .003
32 76.312 .045 .003
226 76.291 .045 .004
86 76.203 .046 .005
218 76.150 .046 .003
188 75.590 .050 .004
315 75.248 .053 .001
203 75.019 .055 .002
181 74.967 .056 .002
291 74.727 .058 .003
113 74.585 .059 .004
117 74.357 .061 .005
190 74.309 .062 .003
286 74.212 .062 .002
182 74.165 .063 .001
253 74.102 .064 .002
118 73.813 .066 .004
261 73.590 .069 .003
29 72.979 .075 .002

323
125 72.679 .079 .001
221 72.659 .079 .002
292 72.633 .079 .002
351 72.611 .080 .001
205 72.556 .080 .001
55 72.359 .083 .003
293 72.227 .084 .004
13 71.842 .089 .001
132 71.804 .090 .001
284 71.562 .093 .002
279 71.422 .095 .002
155 71.294 .096 .001
127 70.885 .102 .001
201 70.882 .102 .001
281 70.794 .104 .002
282 70.580 .107 .002
15 70.248 .112 .003
322 70.237 .112 .002
225 69.632 .122 .004
116 69.575 .123 .003
89 69.465 .124 .003
342 69.252 .128 .002
73 69.164 .130 .004
271 69.025 .132 .001
101 68.593 .140 .001
134 68.542 .141 .002
283 68.489 .142 .003
213 68.404 .143 .001
112 68.342 .144 .000
222 68.160 .148 .001
178 67.982 .151 .001
216 67.693 .157 .001
51 67.493 .161 .002
122 67.362 .164 .002
62 67.215 .167 .003
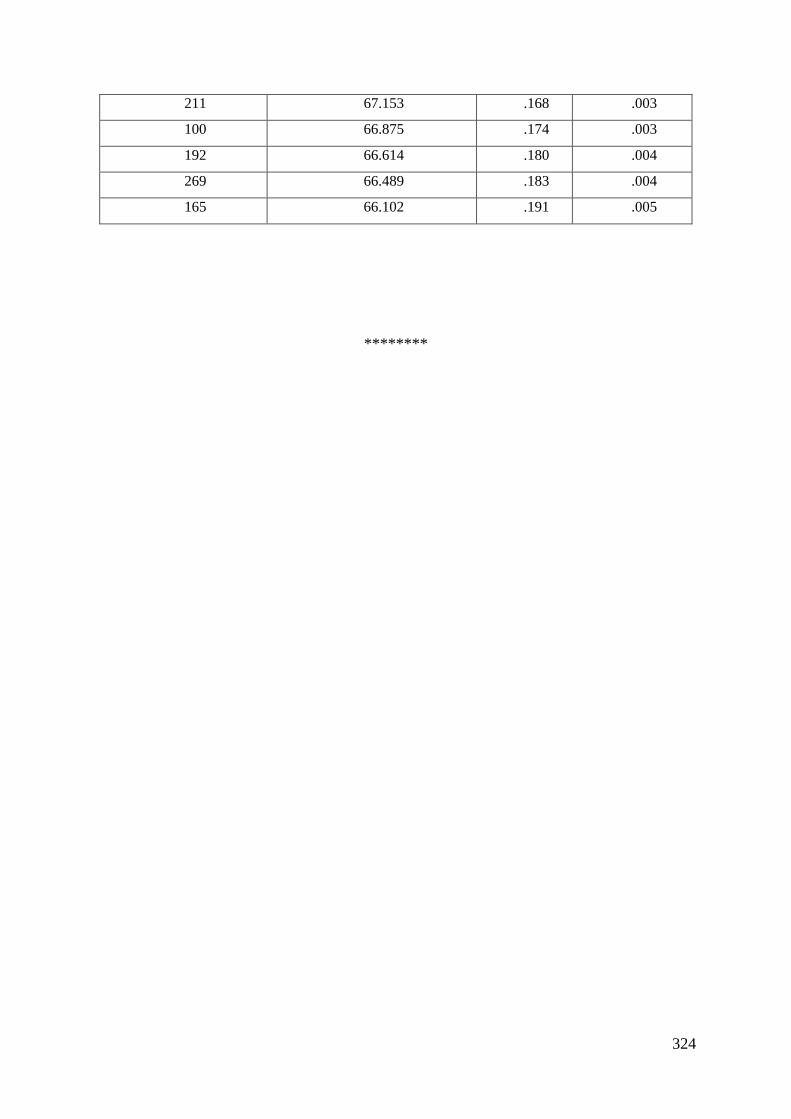
324
211 67.153 .168 .003
100 66.875 .174 .003
192 66.614 .180 .004
269 66.489 .183 .004
165 66.102 .191 .005
********