university of derby an integrative approach...
TRANSCRIPT

An integrative approach to style analysis of folk dance melodieswith classification using inductive learning
Item type Thesis or dissertation
Authors Carter, Jennifer
Publisher University of Derby
Downloaded 1-Jul-2018 11:17:24
Link to item http://hdl.handle.net/10545/621840
UNIVERSITY OF DERBY
AN INTEGRATIVE APPROACH TO STYLE ANALYSIS OF FOLK DANCE
MELODIES WITH CLASSIFICATION USING INDUCTIVE
LEARNING
Jennifer Carter
Doctor of Philosophy 2004

IMAGING SERVICES NORTH Boston Spa, Wetherby
West Yorkshire, LS23 7BQ
www.bl.uk
FIGURE 2.1 PAGE 14
FIGURE 2.2 PAGE 15
FIGURE 2.3 PAGE 18
FIGURE 3.1 PAGE 47
FIGURE 4.1 PAGE 93
FIGURE 5.1 PAGE 100
FIGURE 5.2 PAGE 108
FIGURE 5.4 PAGE 112
APPENDICES Ai, A2, A3 A4 AND El
NOT DIGITISED BY REQUEST OF THE UNIVERSITY

IMAGING SERVICES NORTH Boston Spa, Wetherby
West Yorkshire, LS23 7BQ
www.bl.uk
BLANK PAGE IN ORIGINAL

Chapter 1 Introduction 1
1.1 Background 1
1.2 Aims 2
1.3 Contribution to Knowledge 3
1.4 Structure 3
Chapter 2 Music Analysis 7
2.1 Introduction 7
2.2 Overview of Approaches to Music Analysis 8
2.3 Cognitive Approaches to Music Analysis 11
2.4 Use of Analysis in Computer Music Applications and 19 Research
2.5 Applications to Genres Other Than Western Art Music 23
2.6 Folk Music and Folk Music Analysis 27
2.6.1 Definitions of Folk Music 27
2.6.2 A Cross-cultural View of Folk Music 28
2.6.3 ViolinlFiddle Music 32
2.6.4 Approaches to the Analysis of Fiddle Music, 35 with Particular Reference to Statistical Methods
2.7 Summary 37
Chapter 3 Preliminary Experiments on Analysis of Fiddle Music 39
3.1 General Introduction 39
3.2 Analysis of Folk Dance Melodies Using GTIM, 40 Experiment 1
3.2.1 Introduction 40
3.2.2 Generative Theory of Tonal Music (GTTM) 41
3.2.3 Quinlan's Algorithm for Inductive Learning 42
3.2.4 - Method for Experiment 1 43
3.2.5 Results for experiment 1 48
111

3.2.6 Method for Experiment 2, Using Human 50 Listeners
3.2.7 Results for Experiment 2 51
3.2.8 Discussion of Results for Both Experiments 51
3.2.9 Conclusion of Experiments 1 and 2 53
3.3 Analysis of Fiddle Melodies Using the Statistical Method 54 of O'Canainn, Experiment 3
3.3.1 Introduction 54
3.3.2 O'Canainn's Method of analysis 55
3.3.3 Experimental Method 55
3.3.4 Summarised Results for Experiment 3 56
3.3.5 Discussion 57
3.3.6 Comparison with Experiments 1 and 2 (Section 3.2) 58
3.3.7 Conclusion 59
3.4 The Implication Realisation (IR) Model Applied to Folk 60 Dance Melodies, Experiment 4
3.4.1 Introduction 60
3.4.2 The Implication (IR) Realisation Model 61
3.4.3 Method for Experiment 4 63
3.4.4 Results for Experiment 4 65
3.4.5 Discussion of Results and Conclusion 66
3.5 General Discussion of Preliminary Experiments 66
Chapter 4 68
4.1 Introduction 68
4.2 Experiment to remove ambiguities in GTIM analysis 68
4.2.1 Motivation for the experiments 68
4.2.2 Method 69
4.2.3 Results 71
4.2.4 Discussion and Conclusion 73
4.3 Analysis of Melodies Using GTTM 75
4.3.1 Method 75
4.3.2 Results and Discussion 77
IV
4.4 Analysis of Melodies Using the IR model 78
4.4.1 Method 78
4.4.2 Results and Discussion 78
4.5 Comparison of Approaches to Inductive Learning 84
4.5.1 Background to Inductive Learning 84
4.5.2 Overview of the ID3 Family of Algorithms 86
4.5.3 Results and Discussion Using CART 87
4.5.4 Classification Using a Neural Network 90
4.5.5 Formal Comparison of Classifiers 92
4.6 Proposal for an Integrated Analysis Method 96
Chapter 5 Music Representation and Processing on Computer 98
5.1 Introduction 98
5.2 Approaches to Representation 98
5.2.1 Systems that Employ Waveform Representation 99
5.2.2 Score Based Representations 102
5.2.3 Grammar Based Representations 103
5.2.4 Abstract Representations 103
5.2.5 The CHARM Specification 105
5.2.6 The Humdrum Toolkit and Kern Code Representation III 5.3 Automated Analysis - Traditional Versus AI Approach 117
5.3.1 Introduction 117
5.3.2 Declarati ve Versus Procedural Languages 117
5.3.3 Proposed Approach to Programming for an 120 Automated Analysis Tool
5.4 Conclusion 120
Chapter 6 Discussion 122
6.1 Introduction 122
6.2 Review of the Aims 124
6.3 Conclusion 129
v

Chapter 7 Conclusions and Further Work 131
7.1 Overview 131
7.2 Contributions to Knowledge 134
7.3 Further Work 135
7.3.1 Further Investigation of Order of Preference of GPRs 135
7.3.2 Representation and Implementation of an Automatic 136 Analysis Tool
7.3.3 Capture of Musical Data 136
7.4 In Conclusion 136
References 138
List of Figures and Tables
Figure 1.1 An overview of the content of thesis, showing the 4 relationships between the elements of the work
Figure 2.1 Rule 3b: Change in articulation. (a) Segmentation according 14 to the rule. (b) Postponed segmentation. (Deliege, 1987, 331)
Figure 2.2 Rule 3d: Change in Length. (a) Segmentation according to 15 the rule. (b) Postponed segmentation. (Deliege, 1987,331)
Figure 2.3 Examples of continuation notes that fulfil or deny each 18 implicative principle. (Thompson et al. 1998,6)
Table 2.1 Succession rules of the SPEAC abstractions (Cope, 1991, 22 37)
Figure 3.1 Analysis of an Irish Reel The Pleasures of Home' (Krassen, 47 1976) showing the metrical structure, and the lower level of grouping structure
Table 3.1 Table to show results from cross-validation trials from See5. 65
Figure 4.1 A Confusion Matrix 93
Figure 4.2 ROC graph showing three classifiers with 'American' as 94 positive and 'Irish' as negative
Figure 4.3 ROC graph showing three classifiers with 'Irish' as positive 95 and 'American' as negative
VI

Table 4.1 Table to show results from cross-validation trials from SeeS. 80
Table 4.2 Table to show results from cross-validation trials from SeeS. 80
Table 4.3 Tendencies for fulfilment or denial of intervals taken from 81 Irish and American melodies according to the IR model.
Table 4.4 Summary of results of the classification resulting from 87 GTTM analysis of melodies with all available attributes, using SeeS and CART.
Table 4.5 Summary of results of the classification resulting from 88 GTTM analysis of melodies with all available attributes except metrical_deviations, using SeeS and CART.
Table 4.6 Table to show classifications of melodies using GTTM 91 analysis and a neural network tool.
Table 4.7 Table to compare classification results using GTTM 91 analysis and with three different classification tools: CART, SeeS, and Joone (neural network)
Figure 5.1 Two dimensions for comparison of music representation 96 systems. (Wiggins et al. 1993, 32)
Figure 5.2 An extract from the Pleasures of Home, O'Neill's Music of 104 Ireland, Krassen (1976)
Figure 5.3 Entity Relationship diagram for CHARM representation of 106 folk dance melodies.
Figure 5.4 An extract from the Pleasures of Home, O'Neill's Music of 108 Ireland, Krassen (1976)
Table 5.1 Representation of the whole of the musical extract shown in 109 Fig. 5.4 written in the Kern notation.
Table 5.2 Table to show how the CHARM representation of Figure 111 5.4 (first eight notes including the acciaccatura) can be defined using Humdrum syntax.
Table 5.3 Table to show how the CHARM constituent representing the 112 slurred group of notes in Figure 5.4 can be defined as a series of events using Humdrum syntax.
Figure 6.1 Diagrammatic overview of experiments and proposals 119 reported in previous Chapters
Vll

APPENDICES
Appendix A Analysed Melodies 2
Appendix Al Melodies from O'Neill's Music of Ireland, Krassen, 1976 2
Appendix A2 Melodies for analysis from Fiddle Case Tunebook, Philips, 18 1989
Appendix A3 Appendix A3 - Irish melodies for analysis from The 34 Fiddler's Fakebook, Brody, 1978
Appendix A4 American melodies for validation from Brody, 1983 50
Appendix B Test Data 66
Appendix Bl Test Data for GTTM analysis 66
Appendix B2 Test data for IR model analysis 68
Appendix B3 Data resulting from analysis of melodies according to 71 Q'Canainn
Appendix C Form used in experiment with human listeners, reported in 72 Chapter 3
Appendix D Form for writing data during from IR analysis 74
Appendix E Experiment to find order of preference of GPRs 75
Appendix El Fragments of melodies played to listeners in experiment to 75 determine order of preference of group boundaries where there are conflicts
Appendix E2 Summary of results for experiment to determine order of 76 preference of group boundaries where there are conflicts
Appendix F Examples of detailed results from classification software 77
Appendix Fl Example of output using See5 with GTTM 77
Appendix F2 Example of output using See5 with IR model analysis 79
Appendix F3 Example of output using See5 with Q'Canainn analysis 81
Appendix G Skeleton tables derived from Entity Relationship diagram in 83 Chapter 5
Appendix H Confusion Matrices for Classification Using See5, CART 84 and Joone
V1l1

Preface
The work in this thesis has been undertaken entirely by the author, Jenny Carter.
Jenny Carter
IX

Abstract
This thesis investigates the issue of the application of cognitive analysis techniques
for Western art music to folk dance melodies for violin, with a view to enabling the
development of a computer tool that can aid in the identification and exploration of
the stylistic characteristics of the origin of the melodies. The following questions are
addressed: Can cognitive music analysis techniques for Western art music be applied
successfully to folk dance melodies for violin? Is it possible to define an integrative
analysis approach in this context drawing from existing approaches? To what extent
can decision tree induction aid in the classification and interpretation of the analysis
results? How might the musical data for analysis be represented on computer? What is
the best approach to program development for an automated music analysis tool in
this context?
A series of experiments using samples of American and Irish melodies are presented
that verify the use, in this context, of the cognitive analysis approaches of Lerdahl and
lackendoff and Narmour. Statistical approaches have also been investigated, since
research has shown that such methods can reflect the way in which listeners mentally
organise the music that they hear. To enable the analysis to be carried out in an
algorithmic way, an experiment using human subjects to further the work of Lerdahl
and lackendoff was required. An integrative analysis approach has been identified
that can be carried out in an algorithmic way therefore lending itself to future
implementation on computer.
In order to interpret the results of the analysis process, a decision tree induction tool
(SeeS) based on Quinlan's CS algorithm was employed. SeeS was able to classify the
melodies based on the attributes derived from the analysis. The decision trees and
rules derived by the tool enabled the identification of features of the melodies that
pertain to their origins, thus enabling a deeper understanding of the stylistic variations
of the melodies.
A further experiment indicated that the cognitive analysis approaches and subsequent
classification with SeeS compares favourably with the classification abilities of
human subjects after a small amount of training in the musical context.
x

Further inductive learning techniques (decision tree induction using Friedman's
CART, and neural networks) have been applied to the problem of classification and
interpretation of the analysis results, and although the neural network classified the
musical samples with greater accuracy (illustrated using ROC analysis), decision tree
induction has been shown to be a more appropriate method in this context.
Approaches to music representation and subsequent program development have been
investigated, reSUlting in a proposal for future computer implementation of a music
analysis tool using the Humdrum toolkit as a means of representation, and a
declarative language for the program development.
Xl

Acknowledgments
I would like to thank Martin Brown, Barry Eaglestone and Richard Hodges for their
continued support throughout this work as my supervisors.
I would also like to thank my Heads of Department (past and present) for supporting
me with time, encouragement, and conference funding. They are Bob John, Pete
Messer and David Knibb.
Finally, special thanks to Paul Wilson for generous and excellent skills as proof reader
and sounding board, and to Alex Wilson for the neat and time consuming
reproduction of Appendix A.
This work is dedicated to William Carter, my dad.
xu

CHAPTER 1 - Introduction
1.1 Background
This chapter introduces the PhD thesis, and also gives an account of the approach
taken to the research. The aims and contributions to knowledge are identified in
Sections 1.2 and 1.3, and the structure of the thesis is presented in Section 1.4.
The work is about identifying and interpreting the difference in styles of music. This
is a very broad area and so the focus has been on music of particular interest to the
author - that of western violin (or fiddle) melodies, and in particular those from
Ireland and America. It is an interesting area because it is not just about comparing
two types of melodies from different origins, but it also enables us to discover
something about how melodies develop and evol ve as the people who play them
travel and migrate. There was considerable movement of people from Ireland to
America particularly during the potato famines and as a result of this there are many
communities descending from Irish immigrants in America. Settlements were made
in various parts of America and the music of those groups of people lived on and is
still played today. However there are noticeable changes to many of the melodies, in
particular in the Southern regions of America where the African influence is greater;
here many of the tunes have evolved in such a way that they now include such
features as syncopation, different approaches to slurring, different contours in the
musical surface and so on. As a fiddle player it is possible to notice these differences
(sometimes unconsciously) and to incorporate them into ones own playing when
aiming to sound more 'American' or more 'Irish', and of course a music theorist
might well be able to give more specific and accurate interpretations of the
differences and similarities. In order to study musical features of this nature fully, it
would be beneficial to have a computer system to carry out the analysis and to aid in
the understanding or interpretation of the different groupings of melodies according to
their origins. This became the motivation for the study presented in this thesis.
In order to develop such a system a number of areas need to be investigated. The first
is to find or develop a suitable approach to music analysis. Music analysis is used
extensively by musicologists and there are well tested existing techniques available
Chapter 1 - Introduction 1
for this purpose. In general such techniques are developed for work with Western art
music though there have been studies to investigate their effectiveness when applied
to other types of music. Some of these studies have looked at oral folk music and
some other areas such as jazz. However, none have attempted to combine analysis
approaches and none have applied them to instrumental folk dance music.
Other issues raised by a study of this nature are possible approaches to the
interpretation of the analysis results, representation of the musical information on
computer and approaches to program development. The following section therefore
lists the aims of the study as means of addressing these issues.
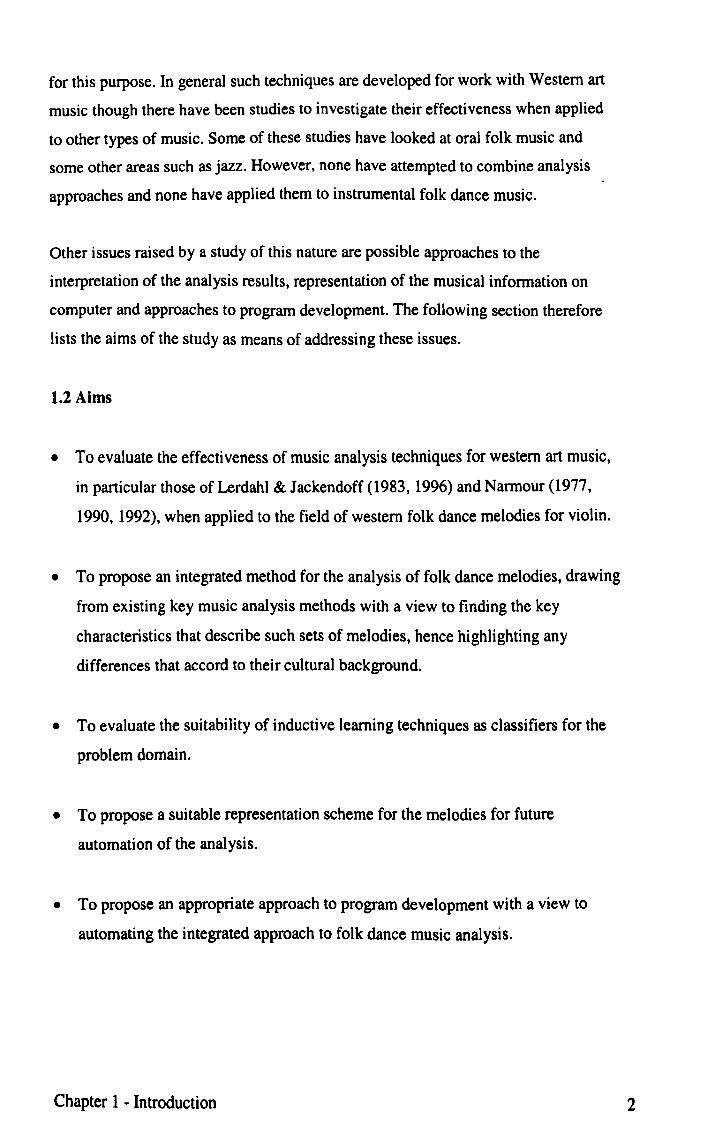
1.2 Aims
• To evaluate the effectiveness of music analysis techniques for western art music,
in particular those of Lerdahl & lackendoff (1983, 1996) and Narmour (1977,
1990, 1992), when applied to the field of western folk dance melodies for violin.
• To propose an integrated method for the analysis of folk dance melodies, drawing
from existing key music analysis methods with a view to finding the key
characteristics that describe such sets of melodies, hence highlighting any
differences that accord to their cultural background.
• To evaluate the suitability of inductive learning techniques as classifiers for the
problem domain.
• To propose a suitable representation scheme for the melodies for future
automation of the analysis.
• To propose an appropriate approach to program development with a view to
automating the integrated approach to folk dance music analysiS.
Chapter 1 - Introduction 2
1.3 Contribution to knowledge
The novel elements proposed for this work are identified below:
• An integrative application of existing music analysis techniques designed for
Western art music in the context of folk dance music for violin.
• Verification of the ability for human listeners to classify folk dance melodies
to a similar level of accuracy as that resulting from the analysis and
classification using existing music analysis techniques and decision tree
induction software.
• Further development of Lerdahl and lackendoffs order of preference for
grouping preference rules when applied to folk dance melodies for violin.
• Application of decision tree induction as an approach to classification and also
as an appropriate method for interpretation of the analysis results in the
context of folk dance melodies for violin.
• An indication of how certain types of ornamentation might be represented
using the CHARM framework for music representation, and a demonstration
of how representations in the CHARM framework might be translated into
Kern Code (part of the Humdrum syntax).
1.4 Structure
The work undertaken as part of this work is explorative in nature, and therefore the
methodology has taken the form of a 'road map'. This means that in attempting to
meet the aims of the project a flexible approach was taken enabling ideas to develop,
and additional experiments to be undertaken that were not previously anticipated.
Specific examples of this occurring are identified in the thesis.
The following paragraphs describe the structure of the thesis and an overview diagram
of the Chapters and how they relate to each other is provided in Fig 1.1.
Chapter 1 - Introduction 3

Chapter 1 -Introduction
Chapter 2 -~--.j Review of literature
on music analysis & folk music
experimental work
Determines nature of first experiments Chapter 3 -
Preliminary experiments
Order of preference rules determined. Revisit preliminary experiment
Chapter4- -Further experiments. Proposal of nte!7attve
analysis method. Comparison of Induc .
learning tools Requirement for computer tool Identified
Chapter 5 - Music representatbn on
computer. Approaches to program development.
Chapter 7 -Chapter 6 - I------r Conclusions &
General discussion further work
Figure 1.1 An overview of the content of thesis, showing the relationships between
the elements of the work
Chapter 2 investigates existing analysis methods, and looks at their reported
applications. The later sections of the Chapter focus on folk dance music and
discusses in more detail how this has evolved, with particular reference to the dance
melodies of Ireland and America.
Chapter 3 describes preliminary experiments that were carried out in order to test the
effectiveness of existing music analysis techniques on Irish and American dance
melodies for violin. The experiments used two well tested methods of analysis, the
Generative Theory of Tonal Music (GTTM) of Lerdahl and lackendoff and the
Implication Realisation Model (IR model) of Narmour, and a more general statistical
method. In all cases inductive learning software was used to aid in the interpretation
of the results. The software was able to identify the distinguishing features that the
music analysis made apparent. A further experiment involved human listeners. This
was carried out in order to determine if the human listeners, after listening to a sample
Chapter 1 - Introduction 4

of the melodies as training data, could classify a further sample as being either Irish or
American (giving their reasons) with a similar level of accuracy to the formal music
analysis and subsequent classification using inductive learning software. The
preliminary experiment using GTIM were revisited on completion of the first
experiment described in Chapter 4.
Chapter 4 develops the work from Chapter 3, initially presenting an experiment that
determines the order of preference of listeners where there are conflicts in the
potential group boundaries. The text of Lerdahl and Jackendoff goes some of the way
to providing the order of preference but is not complete. Only a small number of
conflicts occurred that could not be resolved according to Lerdahl and lackendoffs
text, but if the analysis is to be carried out in a fully algorithmic way then a method of
handling such conflicts is required. Lerdahl and Jackendoff indicate that researchers
interested in developing computer related tools might want to find ways of
quantifying the rules in order resolve conflicts. They state that this is not their
intention however and they therefore prefer to report adequate information concerning
the order of preference for most situations, and to leave any further decisions relating
to this to the judgement of the analyst. The experiment therefore furthers the work of
Lerdahl and Jackendoff in this respect and is valid in the context of Western folk
dance music for violin. On completion of this experiment, the preliminary work using
GTTM analysis in Chapter 3 was revisited and the results revised in order to
accommodate the new information about the order of preference.
The next part of Chapter 4 reports further analyses according to Lerdahl and
Jackendoff and to Narmour using larger samples of musical data. This part of the
Chapter concludes by proposing an integrated approach to analysis in the context of
folk dance melodies for violin based on the results of the experiments.
In the preliminary experiments inductive learning software was used to aid the
classification and subsequent interpretation of the results, but there are other methods
available for tasks such as these. The concluding part of Chapter 4 explores the
suitability of other approaches to this, in particular comparing a neural network
approach with that of inductive learning.
Chapter 1 - Introduction 5
Having detennined the integrative analysis approach, the next stage in the
development of a computerised system is to decide how the music is to be
represented. Representation is an important part of any computer system and it is
important to use the most appropriate method for the subsequent processing. This
point is supported by the following statement from Huron (1992, 10) ''The essential
point is that in order to represent something, its properties must be interpreted
according to some proposed utility". Chapter 5 examines the approaches to music
representation on computer and concludes with a proposal for representing the
musical data. The practical implementation of this system is not within the scope of
this project, however Chapter 5 concludes with a discussion of approaches to program
development and identifies the most appropriate method for the development of the
analysis tool.
Chapter 6 provides a general discussion of the findings of project and the approach
taken, and Chapter 7 concludes and makes recommendations for further work.
Chapter 1 - Introduction 6
CHAPTER 2 - Music Analysis
2.1 Introduction
In this chapter the historical development and the contemporary approaches and
applications of music analysis are reviewed. The early sections give an overview of
music analysis, beginning with a historical background that addresses the reasons why
musicologists find this a useful process. Analysis has become more structured (as
opposed to textual) as time has progressed, and there is added drive for developments
of this nature now that the computer is proving to be a useful tool for a variety of
musical projects.
Musicologists have been carrying out music analysis for many years though the
structured approaches only started to appear early in the twentieth century. Music
analysis continues to be a fundamental part of music study; but why do musicologists
do this, and what can the analysis of a piece of music tell them? There are many
answers to these questions. For example, the analysis of a piece of music can give a
greater insight into the ideas underlying a composer's work, it can also aid other
composers in their search for new ideas or developments of their own, or it can aid the
study of music ethnicity, and so on. Nicholas Cook (1987, 1) observes that music
analysis is about " ... the practical process of examining pieces of music in order to
discover, or decide how they work"; and Dunsby (1988, 4) that "the main aim of the
analyst is, [to achieve] through study, the enhanced understanding and enjoyment of
particular compositions". In a later work, Cook (1998) discusses the role of music as a
means of cross-cultural communication, commenting that we listen to music of other
cultures and subcultures to gain insight into them and not just to experience pleasing
sounds. He concludes by observing: " .. Music has unique powers as an agent of
ideology. We need to understand its workings, its charms, both to protect ourselves
against them and, paradoxically, to enjoy them to the full" (Cook, 1998, 132). It could
be argued that music analysis enables a greater understanding and therefore greater
enjoyment of a piece of music. Listening to music can be a passive activity, for
instance the music regularly heard in supermarkets or other public places is often
received in a passive way. While attending a live musical concert or listening to some
chosen music at home the listener is often more involved in the listening process, and
Chapter 2 - Music Analysis 7

may be analysing what is heard to some extent in a personal way. Formal analysis
techniques enable this to be taken further, by providing ways of finding out more
about the music, in a rigorous way. Approaches to music analysis have primarily been
devised for work with Western art music, and often rely on scored notation, though
often the analysis recognises performance features such as phrasing, accentuation, etc.
as well as note pitches and lengths.
The following sections of this Chapter review the most important approaches to music
analysis, focussing on those of Lerdahl and lackendoff (1983) and Narmour (1977,
1990, 1992). This is followed by a discussion of applications of such analysis
techniques to music other than Western art music. In order to do this though it is
necessary to have a general discussion of the subject of folk music, in particular fiddle
tunes of the type studied in this work. Section 2.6 therefore addresses the folk music
genre, initially by looking at attempts to define the term and then by discussing the
way that folk music has evolved and moved geographically as people migrate. The
geographical movement of dance melodies for violin originating in Ireland are the
focus here. Projects involving the analysis of folk music are discussed in some detail.
Section 2.7 summarises the Chapter and outlines the proposal for some preliminary
experiments, which are detailed in Chapter 3.
2.2 Overview of approaches to music analysis
Approaches to music analysis have developed substantially during the last century.
This section gives a historical background to these developments, focusing on the
more recent approaches.
There are a number of ways of carrying out music analysis, and the main purpose of
such methods has traditionally been the analysis of Western art music. Analysis has
taken various forms; the work of Donald Tovey (1875-1940) for example, consisted
of extensive written analyses of many classical works. Although his work was and
still is important, its narrative style limits the ways in which it could be developed,
and in particular it does not provide a transferable method of analysis that can be used
on pieces of music other than those for which it is written. Tovey himself would not
Chapter 2 - Music Analysis 8

see this as a limitation; his discussion on the integrity of music, Tovey (1941), seeks
to highlight the differences between science and art, drawing particular attention to
the ideas of intuition and aesthetics as elements of the artistic process that must be
absent from that of science. Such a view might well be valid, and is no doubt held by
a significant number of people, however, from the scientists' point of view, if art is
beyond the scope of their domain of study, they would first have to prove it to be so
before excluding it.
Tovey wrote for the ordinary listener and concert goer, and in fact his work became
very popular and was much more widely known. However his style of analysis is still
viewed as limited, and although it aims to be exhaustive, it could be also described as
incoherent in many ways, and unrecognisable as a particular theory. This is because it
is made up of a series of essays describing pieces of music in Tovey's own words for
potential listeners. Such an approach is not repeatable or testable and it doesn't
provide a method with which new analysts could continue to work.
Heinrich Schenker (1868-1935), probably one of the most influential theorists in the
field of musicology, devised a method for music analysis that takes an approach
similar to that of Chomsky in the study of language (1968). The extent of the
similarities and the differences are discussed extensively in The Musical Mind
(Sloboda, 1985), this section also addresses them briefly.
Schenker's method was devised for the analysis of Western tonal music or more
specifically Western art music, and it aims to consider the abilitieslknowledge of the
experienced listener in its approach. Both Schenker and Chomsky are interested in the
surface and deep structures of music and sentences respectively. Surface structure in
linguistics is the sequence of words as it is spoken and in music would be the musical
sequence of notes. Deep structure in linguistics refers to the underlying meaning of a
sentence (which could be verbalised using many different surface structures). This is
illustrated by Sloboda, (1985) with the sentences 'John phoned up Mary' and 'John
phoned Mary up' which have the same meaning (i.e. deep structure) but different
surface structure. Schenkerian analysis proposes that most pieces of music can be
reduced to a deep structure, referred to as the Ursatz, and that there are in fact very
few of these. It is in the lengthening of the Ursatz that the composer is able to express
Chapter 2 - Music Analysis 9

elements of meaning and mood in a piece of music (rather than the deep structure in
itself) and hence the analogy with linguistics breaks down here. The deep structure
found by the reduction of a piece of music does not contain the meaning of the music
whereas, as illustrated above, Chomsky's deep structures of sentences do contain the
meaning, and the different surfaces illustrate the different ways that such meaning can
be expressed.
Linguists aim to produce a set of rules that generates all acceptable sentences of a
language. Schenker did not derive a set of rules that enable only good or acceptable
music to be generated from an Ursatz, and hence it can be said that his approach is
analytical rather than generative.
The term 'generative' does need some clarification however as we see it used with
respect to music theories later in the text and this could be considered to conflict with
the statement in the previous sentence. "A generative linguistic theory attempts to
characterise what a human being knows when they know how to speak a language",
Lerdahl and lackendoff (1983). A generative grammar doesn't provide an algorithm
for the manufacture of sentences rather it is a means of describing some set in a
formal way. The formal system of rules, known as a grammar, that models
unconscious knowledge, is said to describe (or generate) the possible sentences in a
language. Hence 'generative' can be used in relation to theories of music since by the
process of analysis we hope to describe the characteristics of the musical surface.
Schenker's work is not as formally expressed as that of Chomsky which makes it
difficult to apply in general to music other than the mainstream classical works for
which it was intended. However it is nevertheless a significant contributor to the field
and was the first to move towards greater formalisation of the process. As such
Schenker has provided a foundation for more recent approaches to music analysis,
inspiring a number of variations and developments by other musicologists in more
recent years. The most significant theory that draws on the ideas of both Schenker and
Chomsky is that of Lerdahl and lackendoff (1983), known as a Generative Theory of
Tonal Music. This is described more fully in the next subsection.
Chapter 2 - Music Analysis 10
2.3 Cognitive approaches to music analysis
This section examines the two most prominent theories developed over the last two
decades. The first is Lerdahl and lackendoff's Generative Theory of Tonal Music
(1983, 1996), and the second Narmour's Implication Realisation Model (1977, 1990,
1992). The two theories have different foundations and as a result offer different
views on the approach to cognitive music analysis. In some senses they can be seen to
contradict each other but a more useful interpretation is to view them as being
complementary .
Lerdahl and Jackendoff developed a method of music analysis based on a cognitive
theory; it draws from Schenkerian theory and is fully described in A Generative
Theory o/Tonal Music (1983). This work will be referred to as GTTM henceforth.
The work was partially inspired by Leonard Bernstein's Harvard Lectures (1973),
where the search for a musical grammar that would "explicate human capacity",
(Lerdahl et aI., 1996, ix) was suggested. In the development of their grammar, they
aim to adopt a similar approach to that of Chomsky (and hence linguistics), and
therefore the theory is concerned with the assignment and examination of musical
hierarchies within the elements of the music being studied. However, they state that
the main parallel between their work and that of Chomsky is that both have
psychological concerns and both theories are of a formal nature. They comment that
other applications of linguistic theory to music have failed due to too literal a
translation. The purpose of GTTM is to analyse existing tonal pieces rather than to
generate more music. "Lerdahl and Jackendoff are mainly interested in the analysis of
existing pieces and the ability of the music grammar to assign proper structures to any
tonal piece." (Robbie and Smaill, 1995, 92),
GTTM has not only become widely used in the musicology community, but has also
formed the basis of a number of works in computer based music analysis and
composition. Although it bears some relation to the work of Schenker, it has greater
structure and is therefore more appropriate for scientific application. A key feature of
the method is that it aims to include at least some of the intuitions of the listener. It is
described by DeBellis (1999, 56) as " .. an important contribution to cognitive science
in the field of music cognition". A fuller description of GTTM follows.
Chapter 2 - Music Analysis 11

GTIM proposes four hierarchical intuitions and these are:
1. Grouping structure - models the way in which a listener intuitively divides a
piece of music into moti ves, phrases, and sections. The structure of these
groups is hierarchical.
2. Metrical structure - identifying strong and weak beats in a metrical context
3. Time span reduction - hierarchy of importance of pitches with respect to
grouping and metrical structure.
4. Prolongation reduction - assigns hierarchy to pitches expressing harmonic and
melodic tension and relaxation, continuity and progression.
There are two main rule types for each of these intuitions. These are described below.
1. Well formedness rules - these establish the formal structure for each of the
hierarchical intuitions, i.e. they define the possible interpretations. Some
examples of well-formedness rules associated with grouping structures are: the
end of a group must not overlap with the beginning of the next; there must not
be any 'spare' notes left between the end of one group and the beginning of
another; and there are others. They provide a framework within which the
preference rules can be applied.
2. Preference rules - these determine which of the structures that are formally
possible (within the well-formedness rules), correspond to the intuitions of a
listener, i.e. which of the possible interpretations are most likely to be selected
by the listener. In complex music there may be ambiguity about which rules to
apply as it is possible for them to conflict. If this happens it is necessary to
decide on an approach to resolve the conflict. Ambiguities are to be expected
in music and should be acknowledged where they affect the application of the
preference rules.
Further details of the rules are provided in Chapter 3. where a series of preliminary
experiments are presented.
Chapter 2 - Music Analysis 12

GTIM is described as " .. one of the best known attempts at a structural description of
tonal music" (Robbie and Smaill, 1995,91) and for this reason there is a tendency to
use GTIM particularly where the analysis is to be performed by a computer and
quantifiable information is required. It has been applied to a number of musical
research problems, as well as being tested in a variety of ways by researchers in the
field. Horowitz (1995, 103) describes GTIM as significant because "it attempts to
detail aspects of musical comprehension which are recognised as being matters of
common sense, but which have not been explicitly enumerated previously." In the
same work he describes how he used the theory as the basis for the analysis required
in his computer based Jazz Improvisation System, discussed further in Section 2.5.
Experiments have been carried out by researchers other than the original authors to
determine how well the GTTM rules correspond to expert/non-expert listener
perceptions of music. One frequently cited experimental verification was carried out
by Deliege in 1987. Deliege reports two experiments in which the grouping behaviour
of two categories of subjects, musicians and non-musicians, are compared. The
experiments aim to explore the extent of the validity of the lower level (or local level)
Grouping Preference Rules (GPRs) of GTTM. More specifically they aim to provide
answers to the following four questions: "Can some of the rule definitions be
ambiguously interpreted?", "Do the existing rules cover all the situations that occur in
the development of music listening?", "If the theory effectively affects the
experienced listener, the question is: to what extent does musical training modify the
mechanisms of grouping?", and "Would some rules more than others make it easier to
constitute groups, and could we imagine some dimensions to be more powerful, that
is, to bear greater weight in the formation of groups?", (Deliege, 1987, 331-332). Her
findings show the rules to be valid in that the percentages of subjects' responses to
questions corresponded to the rules at a 5% level of significance. The non-musicians
had slightly poorer performances when listening to repertoire music sequences (as
opposed to simple melodic sequences designed to illustrate/include possible conflicts
of rules), but in general there was little difference between the results for both groups
of listeners. Two of the GPRs didn't hold as well, though the author predicted this.
These were GPR3d and 3c - the change in length rule and the change in articulation
rule. These are apparent where a boundary is predicted between two notes if they are
Chapter 2 - Music Analysis 13

the middle pair of a group of four notes the first pair being of equal length, the second
pair being of equal length (GPR3d); or the first pair being articulated as (for example)
legato and the second pair staccato (GPR3c). Deliege found that the grouping
boundary was often delayed to being between the third and fourth note rather than the
second and third, this happened where the second pair were longer than the first, or
where the second pair were staccato and the first legato. The reason given by Oeliege
for predicting this is that the slur/rest rule (GPR2a) could be said to be apparent in the
first case above and the attack point rule (GPR2b) could be said to be apparent in the
second case above, both at the delayed positions. This is illustrated in the example
below but can be seen to be not entirely true. The slur/rest rule states that given four
notes n 1, n2, n3, n4 a group boundary will be heard between n2 and n3 if the gap
between the end of n2 and the onset of n3 is greater than between n 1 and n2, and that
between n3 and n4. In the Figure 2.1 below the gap between n2 and n3 would not be
greater than that between n3 and n4.
Figure 2.1 Rule 3b: Change in articulation. (a) Segmentation according to the rule.
(b) Postponed segmentation. (Deliege, 1987, 331)
Similarly the attack point rule states that a group boundary is heard between n2 and n3
if the time between the start of each is greater than that between nl and n2, and n3 and
n4. Again, this is not true for the gap between n3 and n4 in figure 2.2 below.
However, the arguments for the prediction of this occurrence may be flawed but the
experimental data in the article does support the fact that many listeners did hear the
group boundaries in these delayed positions. The term Oeliege has given to this is
'postponed segmentation' .
Chapter 2 - Music Analysis 14

Figure 2.2 Rule 3d: Change in Length. (a) Segmentation according to the rule. (b)
Postponed segmentation. (Deliege. 1987. 331)
The idea of postponed segmentation could suggest a modification of GPR3c and
GPR3d but Lerdahl and lackendofrs later publications do not include such a
modification. Tests carried out by Palmer and Krumhansl (1987) show that all of the
phrase boundaries predicted by the preference rules of GTIM correspond well to
reports from listeners. These experiments were carried out using musical stimulii
derived from a Bach fugue, and hence the context was not as broad as that of Deliege.
Deliege also reports the result of an experiment that enable a possible 'relative
salience' of the rules to be provided. In this experiment subjects were required to
listen to short musical sequences that had possible group boundaries close together
and the purpose of the experiment was to find out which was the most salient of the
two in each case, enabling an overall relative salience to be reported (as a numerical
value) on the completion of all of the tests. The results did not reflect the relative
salience (or preference) as suggested by Lerdahl and lackendoff (theirs is reported
textually with no numerical values associated.) This could suggest that any work
requiring information about the relative salience should not rely fully on either of
these, but rather on experimental results from further experiments conducted in the
context of that work. The experiment described at the beginning of Chapter 4 aims to
further the order of salience of preference of the rules given by Lerdahl and
Jackendoff in the context of folk dance melodies.
Chapter 2 - Music Analysis 15
The idea that the theory is modelling the listening of the 'experienced listener' is a
difficult one to work with as Hantz (1985, 191) observes ''The question of whose
listening is being modelled by the theory is one of its weaknesses". The term is meant
to mean anyone that has experience of listening in a particular idiom, but there could
be variations between amounts of experience in certain idioms that cause slightly
different approaches to listening. This is supported by the differences (though only
slight) between non-musicians and musicians in the results of the experiments carried
out by Deliege described above. The experiment in Chapter 4 to further the order of
preference proposed by Lerdahl and Jackendoff used subjects who all had a minimum
of two years musical experience.
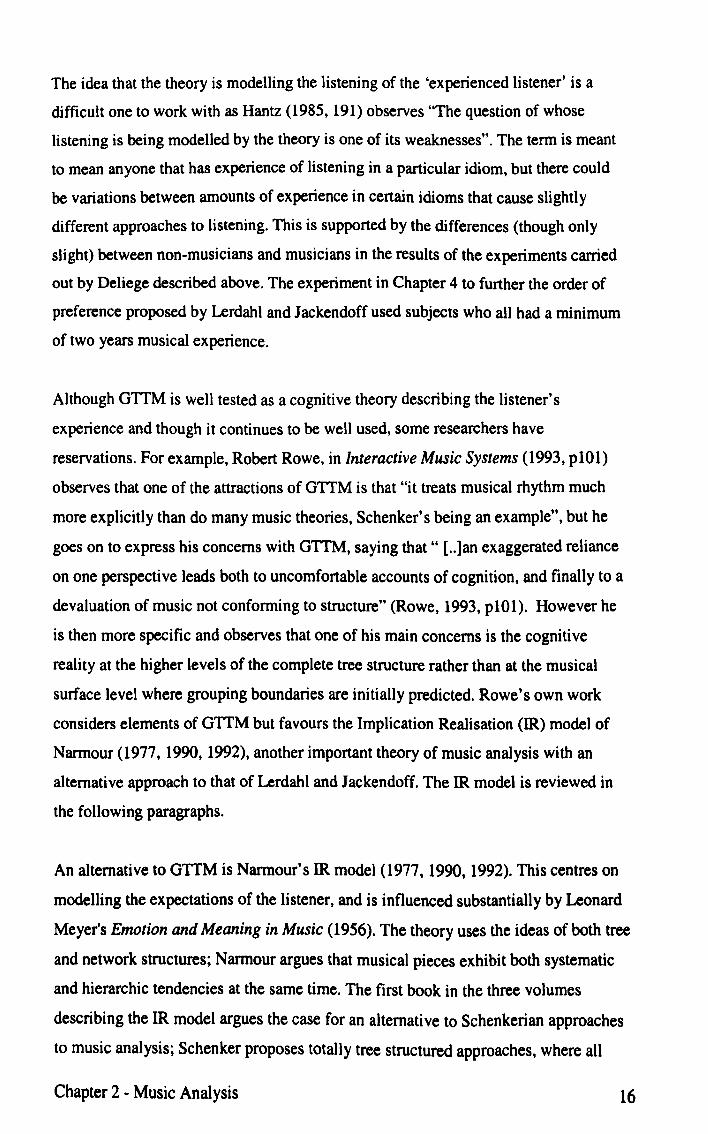
Although GTIM is well tested as a cognitive theory describing the listener's
experience and though it continues to be well used, some researchers have
reservations. For example, Robert Rowe, in Interactive Music Systems (1993, pl0l)
observes that one of the attractions of GTIM is that "it treats musical rhythm much
more explicitly than do many music theories, Schenker's being an example", but he
goes on to express his concerns with GTIM, saying that" [ .. lan exaggerated reliance
on one perspective leads both to uncomfortable accounts of cognition, and finally to a
devaluation of music not conforming to structure" (Rowe, 1993, plOl). However he
is then more specific and observes that one of his main concerns is the cognitive
reality at the higher levels of the complete tree structure rather than at the musical
surface level where grouping boundaries are initially predicted. Rowe's own work
considers elements of GTIM but favours the Implication Realisation (IR) model of
Narmour (1977, 1990, 1992), another important theory of music analysis with an
alternative approach to that of Lerdahl and Jackendoff. The IR model is reviewed in
the following paragraphs.
An alternative to GTIM is Narmour's IR model (1977, 1990, 1992). This centres on
modelling the expectations of the listener, and is influenced substantially by Leonard
Meyer's Emotion and Meaning in Music (1956). The theory uses the ideas of both tree
and network structures; Narmour argues that musical pieces exhibit both systematic
and hierarchic tendencies at the same time. The first book in the three volumes
describing the IR model argues the case for an alternative to Schenkerian approaches
to music analysis; Schenker proposes totally tree structured approaches, where all
Chapter 2 - Music Analysis 16

analyses lead to the definition of a deep structure or Ursatz. Nannour sees this as
fallible because it is possible to arrive at more than one Ursatz for most pieces of
music, yet the tree structure would only allow the definition of one. He therefore
believes that a network structure is a better model since it allows more complex
relationships to be acknowledged, and also because it does not rely on deep structures
at all, but is more concerned with the detailed surface of the music. He observes that
this is taking a bottom up view of musical structures. The theory is developed further
in two later works The Analysis and Cognition of Basic Melodic Structures (1990),
and The Analysis and Cognition of Melodic Complexity (1992), where he asks, and
aims to address the question "What are the specific note to note principles by which
listeners perceive, structure and comprehend the vast world of melody?" (1990,3).
Nannour's model is based on the idea that listeners form expectations of how
melodies might continue as they are listening to them. These expectations are
presumed to be due to a combination of both innate and learned factors, and they arise
when an 'implicative interval' is evident, so particularly when a melodic interval is
perceived as being incomplete, or not 'closed'. Narmour states that such implications
result from five perceptual predispositions: registral direction, intervallic difference,
registral return, proximity, and closure; and the first two of these form the core of the
IR model. Although the IR model is very complex, there have been a number of
attempts to simplify the work and to find the core principles that it represents. The
work of Schellenberg (1996, 1997) and that of Cuddy and Lunney (1995) indicates
that the IR model may well be "over-specified and more complex than necessary"
(Schellenberg, 1997, 295), and as a result Schellenberg (1996) presented a revised
model and argued based on experimental evidence that the results using the revised
method were more reliable than using the original IR model.
The insert below illustrates the five implicative principles of Narmour. They show
whether or not the implicative interval created by the first two tones is fulfilled or
denied by the subsequent tone according to each principle. The IR model describes
them in terms of large and small intervals where a small interval is a fourth or less,
and a large interval a fifth or more. A description of each follows the illustration.
Chapter 2 - Music Analysis 17

Figure 2.3 Examples of continuation notes that fulfil or deny each implicative
principle. (Thompson et al. 1998, 6)
1. Registral direction: a small implicative interval implies a subsequent pitch
movement in the same direction (i.e. if the pitch of the second tone was higher than
the first, then the continuation tone should be higher than the second tone of the
implicative interval). A large interval implies a subsequent pitch movement in a
different or lateral direction.
2. Intervallic difference: a small interval implies a subsequent interval of a similar
size (+/- 3 semi tones) if the pitch movement is in the same direction, or within +/- 2
semi tones for a change in direction. A large interval implies a relatively smaller
interval.
Chapter 2 - Music Analysis 18

3. Registral return: any interval implies a pitch that is near to (within 2 semi tones) or
in unison with the first note of the implicative interval.
4. Proximity: any interval implies a subsequent note that is near to (within a perfect
fourth) of the second note of the implicative interval.
5. Closure: the implication of closure is increased by any interval that is followed by a
subsequent change in registral direction, and a movement from a larger to a smaller
interval.
Narmour's model has been used for various musical analysis projects, some of which
are detailed in later sections. It is a well tested approach that can be said to
complement GITM and as such has also been used in conjunction with GITM for
certain research projects. An important and on-going example of this is the work of
Gerhard Widmer and his research group in Vienna, who are investigating the potential
of Machine Learning in music research with particular emphasis on the phenomenon
of musical expression. Widmer (1998) shows how he is using both GITM and the IR
model as means for providing learning algorithms with background knowledge about
musical structure and also the possible relation of such knowledge to expressive
perfonnance. He comments that such work will also provide more empirical evidence
for or against the relevance of such theories and will therefore be useful to the
Musicology community as well as Machine Learning. The apparent success of this
work provides support for an Integrated approach to music analysis using elements of
both of the theories.
2.4 Use of Analysis in Computer Music Applications and Research
The use of computers in music research has increased in recent years. There are two
main reasons for this, one being that they can be a useful aid due to their fast
processing capabilities and the other that they provide a range of possibilities for
generating musical data. Faster processing capabilities enables the application of
analysis to larger volumes of data and also the combination of techniques for more
complex approaches. There are a significant number of works that illustrate ways of
Chapter 2 - Music Analysis 19

analysing music using a computer. The approaches to analysis are usually derived
from, or are computer implementations of, existing analysis theories and techniques,
in particular those described in the previous section. The following paragraphs
examine well known computer music systems, focusing on the analysis methods
chosen by the researchers.
Probably the most well known system is EMI (Experiments in Musical Intelligence)
developed by David Cope and completed in 1991. The system is able to analyse
pieces of music and then generate further compositions in a similar style. It is a
complete system in itself and although there are criticisms of elements of Cope's
approach to its development, its completeness alone has helped to make it one of the
most significant developments in the field. A composer and lecturer at California
University, Cope developed EMI after suffering 'composers block' himself. EMI is
written in LISP and is able to analyse the style of a minimum of two pieces of music,
and can then go on to generate a new piece with a similar style. The system is very
successful, producing pieces of music that sound convincingly like the composer in
question. Its capabilities extend beyond the Western classical domain having, amongst
other things, successfully generated a piece that resembles a Scott Joplin Rag.
Before defining his approach to music analysis, Cope explores concepts and
parameters of style in his book Computers and Musical Style (1991). The Oxford
Encyclopaedic English Dictionary (OED) defines it as "the distinctive manner of a
person or school or period, especially in relation to painting, architecture, furniture,
dress etc." 1991, 1439). Cope gives a definition of style from Dickinson (1965, 3):
"Style is the reflection of the individual essence of a work of art which gives it its
identity. The identity is the result of a distinctive emphasis among the components."
Cope also refers to Meyer's definition of style (1989, 3), stating that this is not very
helpful either: " Style is a replication or patterning, whether in human behaviour or in
the artefacts produced by human behaviour, that results from a series of choices made
within some set of constraints". Cope recognises that these definitions are useful when
it comes to understanding the concept of style but observes that they are vague and
almost useless for the purposes of processes such as coding, and points out that for a
programmer to be able to model style in any way, slhe must find a means of
quantifying it. The term is vague however as can be seen from the Dictionary
Chapter 2 - Music Analysis 20

definition given above and it is therefore necessary to refine the meaning for
particular research purposes in order to be clear about the motivation and justification
for any work carried out. Cope gives his own definition of style as being: ''The
identifiable characteristics of a composer's music which are recognisably similar from
one work to another", Cope, (1991, 30). These characteristics include pitch, duration,
timbre, dynamics, nuance, and more. Cope states that when put together, they
constitute grammars which can be perceived at many levels. This too is a limited
definition of a complex term. The perceived style of a piece of music can be changed
significantly by the performance for example; it doesn't just depend on the notated
score. Scored music can include substantial amounts of performance information (i.e.
to do with phrasing, articulation, dynamics and so on) so it can provide a reasonably
detailed description of a piece of music. For the purposes of the work described in this
thesis a definition of style derivative of the dictionary definition will be used: 'the
distinctive manner or identifiable commonality of melodies'. The term genre is often
used interchangeably with style. The dictionary definition of this is "a kind or style,
esp. of art or literature" (OED, 1991,587). Bohlman, 1988 uses this term to refer to
subsets of folk music such as lyric folk song or the blues. The term idiom is also used
in similar contexts, but usually for broader groupings. Within this work, idiom is used
to refer to broad (and slightly fuzzy) groupings such as folk music or art music; genre
for subgroups such as folk dance melodies and style for collections within a genre that
exhibit commonalities.
Cope derives the music analysis method used in EMI partly from the ideas of
Schenker and to a limited extent GTTM; he calls his method the SPEAC system,
where SPEAC is an acronym for the following:
S. Statement notes exist 'as is'
P. Preparation statements can be prefaced or
lengthened
E. Extension see immediately above
A. Antecedent causes an implication & require
resolution
C. Consequent usually same chords as S. but
results from A.
Chapter 2 - Music Analysis 21

Each sequence of notes is categorised into one of these five types, and a database of
these phrases is built. The idea of a 'musical signature' is created by looking for sets
of intervals that appear more than once in a composer's work. The system uses a type
of grammar known as an Augmented Transition Network (A TN) to enable the
SPEAC symbols to combine and generate musical structures, he refers to this as a
reverse Schenker approach, as at this stage the process is compositional rather than
analytic. ATNs are standard tools for speech processing and have been used in the
development of speech processing systems; as a result they have become a standard
tool for computational linguistics. ATNs involve the definition of a set of 'succession
rules' that determine the order of symbols, and in Cope's system they are defined as
shown in the table below.
CURRENT CAN BE
FOLLOWED BY
S P,E,A
P S,A,C
E S,P,A,C
A E,C
C S,P,E,A
Table 2.1 Succession rules a/the SPEAC abstractions (Cope. 1991.37)
Cope's work is undoubtedly successful, the music generated by EMI is usually very
easily identifiable as being in the style of Mozart or Bach, for example. As a result of
this success EM! has attracted a lot of attention in this field of work. However, there a
number of criticisms, some of which are identified here. Rowe, for example, thinks
that Cope's work is interesting as it implements "a proven method for finding
significant sequences" Rowe, (1993,240), but he doesn't believe (as he says Cope
does) that it finds a fundamental element of a composer's style.
Chapter 2 - Music Analysis 22

Brush et. al. (1993, 81) questions elements of the work: "Cope's SPEAC grammar is
intriguing but how effective is it as a syntactic model of music and what are the
alternatives?" Berger et. al. (1995, 347), find it "far less substantial than the days
when his [Cope's] music spoke for itself' - here they are referring to his work as a
composer. They believe that using the library of patterns is a superficial way in which
to mimic a style and that the products are "either structurally unpredictable (at best) or
structurally banal." Putnam (1997, 102) describes it as an "[ .. ] important work, which
calls into question the methodologies traditionally used by music theorists. Like any
new and important paradigm, it will take years to take root. In the meantime, David
Cope has established a landmark in music theory".
Cope's work remains significant despite the criticisms raised. The main reason for this
is that it is one of the few works that is complete in itself. EMI starts with complete
pieces of music of selected styles, analyses them in order to find the 'musical
signatures', then generates a new piece of music using that infonnation. It gives
recognisable results that at least on the surface show significant similarities to the
style/s it is attempting to reproduce. Although there are questions raised about the
work in the reviews, and many musicologists consider that the approach glosses over
important musical concerns, it still remains an important work because of its
completeness; and is still considered to be a good illustration of the potential there is
for work with computer analysis and creation of music.
Further works in which music analysis is required as part of a computer based system
are discussed in the following section in combination with the more general
discussion of analysis of musical genres other than Western art music.
2.5 Applications to genres other than Western art music
The theories discussed so far were all developed for the analysis of Western tonal
("meaning particular observance of a single tonic key as the basis of composition",
Kennedy, 1996, 741) art music, however some key works have shown how such
theories can be adapted for other purposes. An illustrative example of this is Rowe's
Chapter 2 - Music Analysis 23

'Interactive Music Systems' (1993), where he uses ideas mainly from Nannour's
(1977, 1990, 1992) work to develop a system that is able to improvise interactively
with a human musician in the domains of improvisational and of atonal (i.e. not in any
key) music.
Rowe describes the development of an Interactive Music System, known as Cypher.
Cypher incorporates three modules: a listener, a performer, and a critic. The system is
particularly important in the area of performance-based analysis (as opposed to score
based). He discusses the contrast between what he calls listening, and analysis based
on the reading of musical scores. He points out how a listener has to listen to music
(i.e. analyse it) in real time, and must process this information as it arrives (as
opposed to the analyst who can access any part of the score randomly). His approach
to analysis for the listening element of Cypher is based on this - analysing the musical
data (in MIDI fonnat) in the order in which it is received. The analysis results in a
representation of events that are hierarchical in nature and hence have some
resemblance to both Schenkerian and GTTM analysis. However, the representation
also places emphasis on network relationships between events as proposed by
Nannour (1977) and Meyer (1956). Rowe does not claim that the analysis is strictly
representative of the best elements of these theories, or that the analysis process
simulates the workings of the human mind; he states that the currently available
theories on the nature of thought processes remain unproven. He observes, however,
that he has aimed to capture enough musicianship within the program to enable
Cypher to implement what he takes to be "a method with plausible relations to human
music processing" (1993, 96). His main aim in developing Cypher was to achieve his
primary goal and this was to develop a computer program that could listen to music.
Having 'listened' to the music Cypher is able in real time to generate a musical
response. The listener classifies features in the input and also classifies how they
behave over time. Messages as a result of the listener's analysis are sent to the player
and Cypher reacts to these messages by the execution of algorithmic techniques that
produce the musical output. Thus, in a perfonnance, the system is able to perfonn live
improvisation with other musicians. The generated output is also passed through the
'critic' which analyses and then improves the output. Cypher therefore has two
listeners, one for the MIDI input data and one for its own output. Both listeners
Chapter 2 - Music Analysis 24
maintain their own histories which can then be used for generation of further output.
Features of the analysis include - speed, density, dynamics and rhythm.
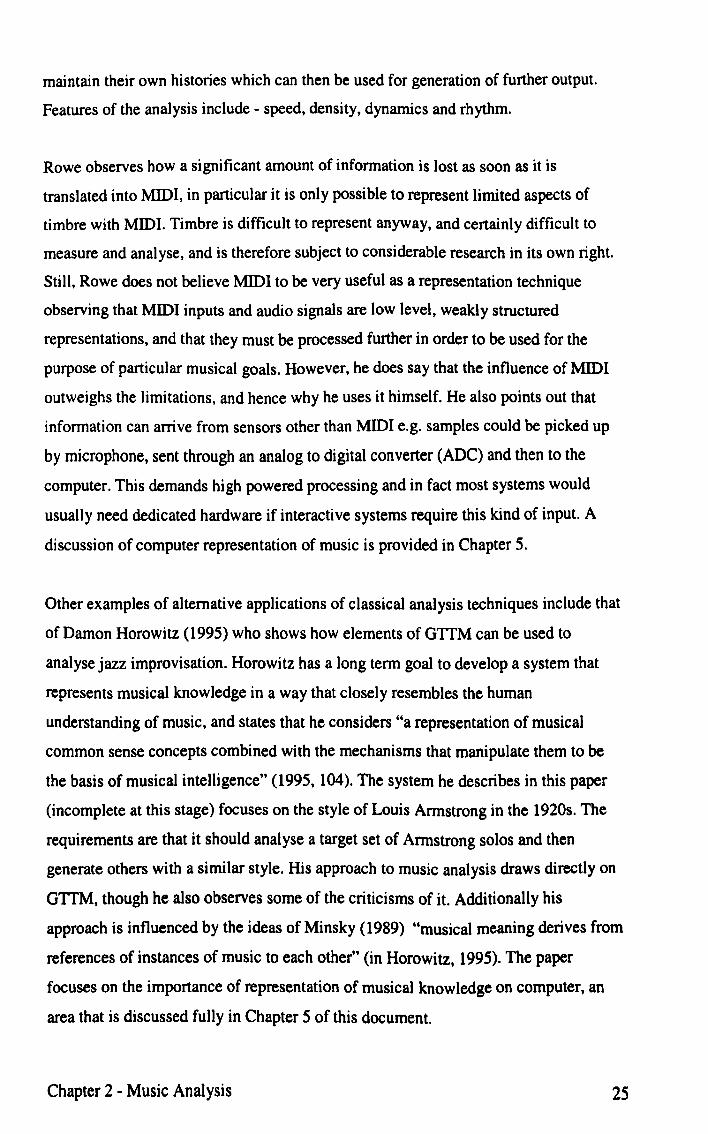
Rowe observes how a significant amount of information is lost as soon as it is
translated into MIDI, in particular it is only possible to represent limited aspects of
timbre with MIDI. Timbre is difficult to represent anyway, and certainly difficult to
measure and analyse, and is therefore subject to considerable research in its own right.
Still, Rowe does not believe MIDI to be very useful as a representation technique
observing that MIDI inputs and audio signals are low level, weakly structured
representations, and that they must be processed further in order to be used for the
purpose of particular musical goals. However, he does say that the influence of MIDI
outweighs the limitations, and hence why he uses it himself. He also points out that
information can arrive from sensors other than MIDI e.g. samples could be picked up
by microphone, sent through an analog to digital converter (ADC) and then to the
computer. This demands high powered processing and in fact most systems would
usually need dedicated hardware if interactive systems require this kind of input. A
discussion of computer representation of music is provided in Chapter 5.
Other examples of alternative applications of classical analysis techniques include that
of Damon Horowitz (1995) who shows how elements of GTTM can be used to
analyse jazz improvisation. Horowitz has a long term goal to develop a system that
represents musical knowledge in a way that closely resembles the human
understanding of music, and states that he considers "a representation of musical
common sense concepts combined with the mechanisms that manipulate them to be
the basis of musical intelligence" (1995, 104). The system he describes in this paper
(incomplete at this stage) focuses on the style of Louis Armstrong in the 1920s. The
requirements are that it should analyse a target set of Armstrong solos and then
generate others with a similar style. His approach to music analysis draws directly on
GTTM, though he also observes some of the criticisms of it. Additionally his
approach is influenced by the ideas of Minsky (1989) "musical meaning derives from
references of instances of music to each other" (in Horowitz, 1995). The paper
focuses on the importance of representation of musical knowledge on computer, an
area that is discussed fully in Chapter 5 of this document.
Chapter 2 - Music Analysis 25

The suitability of GTTM for the analysis of pop music has also been considered
(Bolswijk, 1999). She observes how the theory appears to work well with classical
tonal music, and that analyses of such music are reported to give a reasonable account
of the listeners understanding of that musical genre but comments on the difficulties
posed when applying such an analysis technique to pop music: "some pieces exhibit a
kind of grouping structure or harmonic language to which the GTTM rules are
unsuited". She goes on to discuss the analysis of a particular piece 'Happiness is a
Warm Gun' by the Beatles, as a way of suggesting appropriate adaptations to
elements of GTTM when applied to the domain of pop music. Unfortunately this
work was only published as a conference abstract and so there is not enough detail to
assess whether or not its findings might aid the folk dance melody analysis of this
study.
Another example of the application of GTTM to a different genre of music is
described (Sennan et. at. 2000), where the suitability of GITM's grouping preference
rules (GPRs) is considered for the analysis of unaccompanied melodies from non
Western cultures. In order to do this a 'rule program' was developed enabling the
musical infonnation to be encoded as input. The results showed which of the GPRs
were 'fired' for each piece of music. Although the authors found some success in the
application of this approach, they found that there were limitations since they had
needed to encode the music using Western tonal music (WTM) notation, and it was
difficult to do this without losing a significant amount of musical infonnation from
music that is not nonnally encoded in this way. As a result they have started work on
a system that takes real sound as input and is then able to indicate in the output where
the GPRs are fired; the system is known as a Music Tracker. The scored music that
Sennan et. at. worked with on their preliminary experiments did not contain any
perfonnance infonnation, therefore nothing about phrasing, articulation, dynamics
and so on. There is a wealth of music that does contain such infonnation and such
features are recognised by GTTM. It would appear that the use of scored music was
not explored fully here before switching to the use of real sound as input. The
preliminary study undertaken by Sennan et al. indicates that the "application of
grouping rules specified in tenns of the discrete pitch events drawn from music
notation, fails to capture all perceptually significant aspects of melodic structure that
may arise from different musical systems" (1999, 10). They are suggesting then that
Chapter 2 - Music Analysis 26
the study indicates that WTM coding is not enough for working with non-Western
music in the context within which they worked and also that GTIM is not enough
even when applied without WTM coding of the same music. This provides support for
the argument that an integrated approach to analysis is appropriate for certain genres
of music.
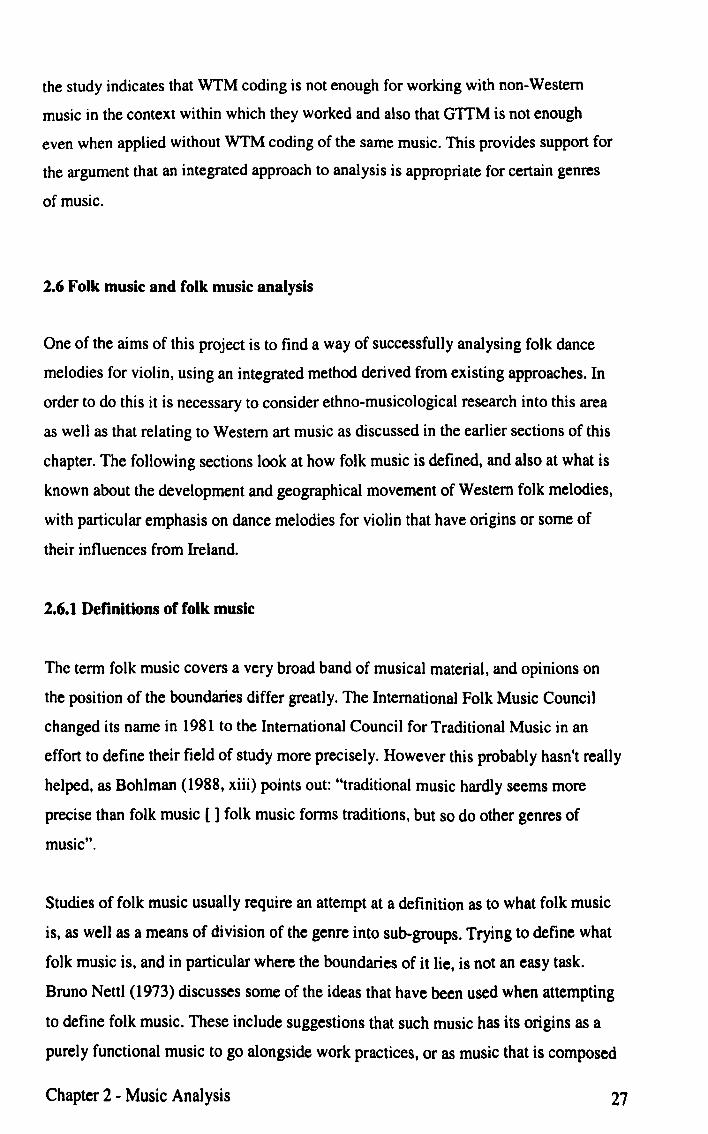
2.6 Folk music and folk music analysis
One of the aims of this project is to find a way of successfully analysing folk dance
melodies for violin, using an integrated method derived from existing approaches. In
order to do this it is necessary to consider ethno-musicological research into this area
as well as that relating to Western art music as discussed in the earlier sections of this
chapter. The following sections look at how folk music is defined, and also at what is
known about the development and geographical movement of Western folk melodies,
with particular emphasis on dance melodies for violin that have origins or some of
their influences from Ireland.
2.6.1 Definitions of folk music
The term folk music covers a very broad band of musical material, and opinions on
the position of the boundaries differ greatly. The International Folk Music Council
changed its name in 1981 to the International Council for Traditional Music in an
effort to define their field of study more precisely. However this probably hasn't really
helped, as Bohlman (1988, xiii) points out: "traditional music hardly seems more
precise than folk music [ ] folk music forms traditions, but so do other genres of
music".
Studies of folk music usually require an attempt at a definition as to what folk music
is, as well as a means of division of the genre into sub-groups. Trying to define what
folk music is, and in particular where the boundaries of it lie, is not an easy task.
Bruno Nettl (1973) discusses some of the ideas that have been used when attempting
to define folk music. These include suggestions that such music has its origins as a
purely functional music to go alongside work practices, or as music that is composed
Chapter 2 - Music Analysis 27

by anonymous composers, or music that is not really composed by an individual but is
more of a group effort. Nettl argues that there are elements of truth in all of these, but
none of them are suitable as a sole definition. For instance, folk music has been found,
historically, to be used as entertainment in village life as well as accompanying work;
many composers of folk music are anonymous but this doesn't really define it, it is
more the result of melodies and songs being developed and passed on from their
origins in such a way (often orally) that the original creator is no longer associated
with it. Nettl also points out that communal creation of songs has been found to be
rare, and that most songs are, in fact, created by individuals. As the tunes are passed
on from person to person, they are developed and adapted, especially as until recently,
very little folk music was written down (if ever), and this is likely to be how the idea
of group creation or composition came about.
We frequently hear discussions about the authenticity of folk music, but the way in
which folk songs are devised and continue to evolve by being passed from person to
person and group to group makes it very difficult and in some cases impossible to
determine at what stage a particular music can be classed as authentic (and the when it
became unauthentic). The very nature of folk music is that it is not strictly defined and
that its creators allow it to change and develop. This is an important point to consider
when addressing the stylistic features of folk music from different cultures.
2.6.2 A cross-cultural view of folk music and the movement of melodies from
Ireland
It is possible for listeners with relatively low experience to recognise styles of folk
music as being from a particular country or region or cultural group, and those with
greater experience more so. However, it is also possible to discern similarities in
styles of folk music from apparently quite different sources. This is not surprising, as
for many years people have moved around the world and usually take their musical
ideas along with them, as Netll (1973, 7) observes "No culture can claim a body of
music as its own without admitting that it shares many characteristics and probably
many compositions with neighbouring cultures. But we must also assume that some
of the essential and distinctive qualities of a culture somehow find their way into its
music". He goes on to propose that "if we plotted the characteristics of the folk music
Chapter 2 - Music Analysis 28

of each people - the characteristics of its scales, its melodic movement, its rhythm,
and so on - and if we fed this infonnation nation by nation into a computer and
examined the results statistically, we would probably find that no two peoples have
identical styles of music" (Nettl, 1973, 8).
In fact, Lomax et. al. (1968) carried out a study of this nature. He used characteristics
that enabled him to derive a characteristics profile, known as the Cantometric Coding
Book, of the songs from many musical cultures. The Cantometric system was an
attempt to represent "a set of perceptive categories that the ordinary listener can apply
to the classification of his musical experience" (Lomax, 1968, pxi). There are 37
parameters identified in the Cantometric Coding Book and these were applied to
samples of songs from 233 cultures. The parameters are not derived using fonnal
music analysis techniques, they include such things as ratings for amount of
embellishment, vibrato, nasalization, 'wordiness', 'raspiness' and so on, though more
typical measures such as volume and tempo are also included. This work was based
on a substantial amount of field work; Lomax is well known as a folk music archivist
and collector, he travelled the world recording music directly from the people who
made it. After coding the musical samples, computer aided statistical analyses were
carried out, and although he found correlations between certain types of music and
cultural styles, he also found each to be unique.
Lomax continued with this work, and went on to develop a prototype for the 'Global
Jukebox'. a multimedia computer system that "surveys the relationship between
dance. song, and human history" (www.alan-lomax.com). Although there was
substantial initial interest from software developers and vendors when the Global
Jukebox was first prototyped, Lomax was disappointed when this interest lapsed
resulting in the tool not being completed. It remains incomplete and is currently used
mainly as a research tool by other musicologists and ethnomusicologists. Lomax died
recently but work is on-going with the project. His work is important to
ethnomusicologists in a number of ways, there are many publications of songs from
various cultures (though this led to some criticisms, in particular in the New York
Times, about such issues as Lomax having his name attached to the authorship of the
music even though he only collected it and did not write it), and the Global Jukebox is
very good as an encyclopaedia of musical and dance cultures. However the decisions
Chapter 2 - Music Analysis 29
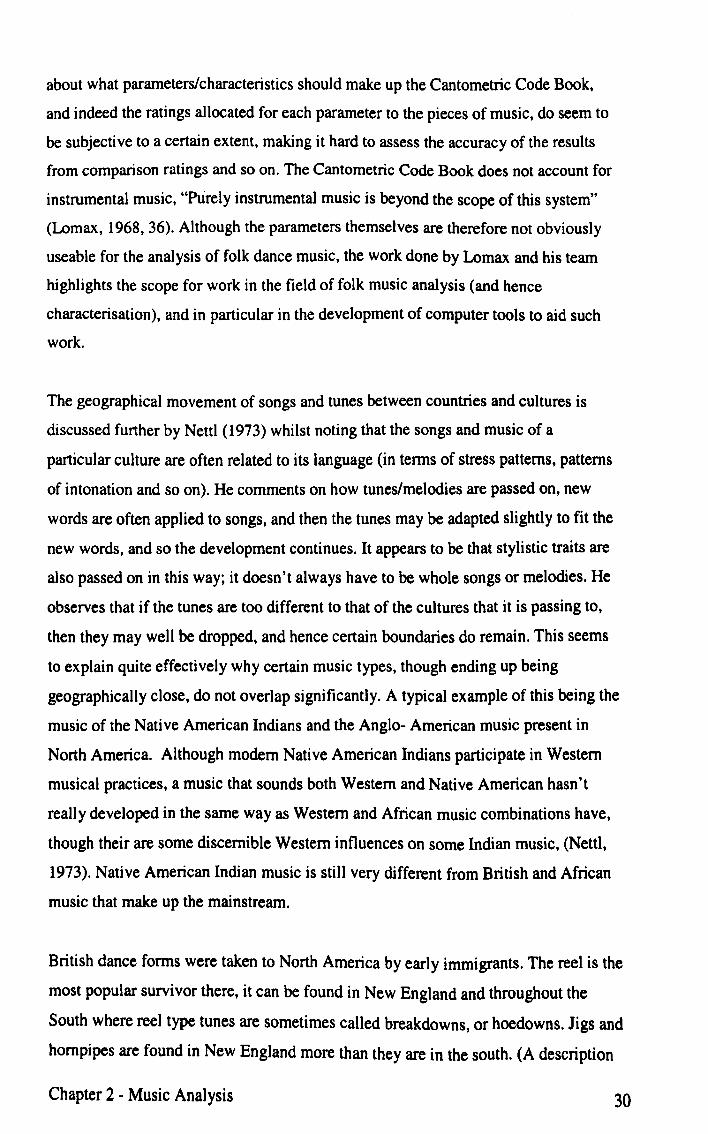
about what parameters/characteristics should make up the Cantometric Code Book,
and indeed the ratings allocated for each parameter to the pieces of music, do seem to
be subjective to a certain extent, making it hard to assess the accuracy of the results
from comparison ratings and so on. The Cantometric Code Book does not account for
instrumental music, "Purely instrumental music is beyond the scope of this system"
(Lomax, 1968, 36). Although the parameters themselves are therefore not obviously
useable for the analysis of folk dance music, the work done by Lomax and his team
highlights the scope for work in the field of folk music analysis (and hence
characterisation), and in particular in the development of computer tools to aid such
work.
The geographical movement of songs and tunes between countries and cultures is
discussed further by Nettl (1973) whilst noting that the songs and music of a
particular culture are often related to its language (in tenns of stress patterns, patterns
of intonation and so on). He comments on how tunes/melodies are passed on, new
words are often applied to songs, and then the tunes may be adapted slightly to fit the
new words, and so the development continues. It appears to be that stylistic traits are
also passed on in this way; it doesn't always have to be whole songs or melodies. He
observes that if the tunes are too different to that of the cultures that it is passing to,
then they may well be dropped, and hence certain boundaries do remain. This seems
to explain quite effectively why certain music types, though ending up being
geographically close, do not overlap significantly. A typical example of this being the
music of the Native American Indians and the Anglo- American music present in
North America. Although modern Native American Indians participate in Western
musical practices, a music that sounds both Western and Native American hasn't
really developed in the same way as Western and African music combinations have,
though their are some discernible Western influences on some Indian music, (Nettl,
1973). Native American Indian music is still very different from British and African
music that make up the mainstream.
British dance forms were taken to North America by early immigrants. The reel is the
most popular survivor there, it can be found in New England and throughout the
South where reel type tunes are sometimes called breakdowns, or hoedowns. Jigs and
hornpipes are found in New England more than they are in the south. (A description
Chapter 2 - Music Analysis 30

of these types of dance melodies follows later in this section.) America itself
contributed to the dance repertoire with, for example, marching tunes from the civil
war. American fiddlers developed a syncopated style of playing reels that are not
evident in the equivalent British melodies, a likely explanation for this is the influence
of African music, as Africans were brought to America with the slave trade.
The British, Spanish and French all colonised during the sixteenth, seventeenth, and
eighteenth centuries. The British were the most successful colonisers in North
America and hence their music became dominant, though it is still possible to hear
some French and Spanish influences. French influences are found in particular in
Canada and North New England, also there is a pocket in Louisiana. The Spanish
influence is prevalent in the Southwest. The Slave trade brought Africans to the South
and North of North America hence there is an important musical influence that can be
seen in the very different rhythms for example. Many other cultures have contributed
to North America in various ways and all have their influence on the folk music; the
Amish, for example, have a style that may have come from their ancient homelands in
Germany, but might also be a result of their isolation; their musical style is very
unlike anything else. The new songs that the Amish sing, though, have been
influenced by other styles, showing just how hard it is to avoid such developments.
(Carlin, 1987)
Instrumental music is often used for the purpose of dance but can also be simply for
listening purposes, certainly today much folk dance music has become listening
music. Typically Western folk dance music consists of three or four main styles. A
common form is the reel. These are in common or 4:4 time and are of unknown origin
though they are believed to be from the Celts. Both Scotland and Ireland claim the
reel as theirs, and both have developed tunes in this fonn. The hornpipe is an ancient
English fonn also in common time, however hornpipes used to be in 3:2 until about
1760 (Breathnach, 1971). The structure is similar to a reel but it is played more
deliberately and with quite strong accents on the first and third beats of the bar.
Another typical dance type and one of the oldest from these islands, is the jig. This is
usually in compound duple (or 6:8) time, though it can be in compound triple (9:8) or
compound quadruple (12:8), and according to Breathnach is now thought to be of
British origin, although at one time it was thought to be from Italy since it is believed
Chapter 2 - Music Analysis 31

that the word 'jig' derives from Italian. However research seems to show that it was
present in England before Italian music became popular in the British Isles. The
majority of Irish jigs were actually written in Ireland by pipers and fiddlers in the
eighteenth and nineteenth centuries (Breathnach, 1971), despite the origin of the style
being England. A popular ancient Scottish dance is the Strathspey, from the valley of
the River Spey, this is in common time like the reel, but has a more moderate tempo
and many dotted rhythms.
In the nineteenth century the popularity of mainland European tunes increased, for
example the waltz (triple or 3:4 time), the polka (moderately fast, double time), and
mazurka (round dance in triple time). Most of these originate from Eastern Europe
and have influenced classical as well as folk music.
In general there is a blurring between folk music and the more sophisticated art music
in America and Europe. This is mainly due to the ideas from each influencing the
other. The music of cities and the music of villages cannot be completely insulated
from each other and therefore cannot be completely independent. The distinction is
more of a gradual one because of this. Familiar examples of classical composers that
have been significantly influenced by folk music are Bela Bartok, who travelled
around Hungary and Romania gathering tunes and ideas from local musicians and
then went on to compose music that made use of these styles; and Vaughan Williams
who collected and made use of English traditional folk melodies in many of his
compositions.
2.6.3 Violinlfiddle music
The fiddle or violin was introduced as a medieval bowed instrument and it came to
Britain from Europe. The instrument known as the classical violin is also used for folk
music. English folk fiddlers tend to play in an unornamented way and there are few
virtuoso players around. In Ireland however, the fiddle is one of the most widely
played folk instruments, in the past most houses had one, and as a result we see a
number of virtuosos and styles that are highly ornate. Irish fiddle playing was
influenced substantially by Michael Coleman (1891-1945) who emigrated from
Ireland to the United States early in the twentieth century. His style spread more
Chapter 2 - Music Analysis 32

widely than others since he made many recordings on 78 r.p.m. discs. Similarly a well
known Scot, 1. Scott Skinner (1843-1927) influenced the Scottish style with his
compositions and recordings. The people who set about documenting or recording
music also made an impact as there were fewer of them doing this than in present
times. Francis O'Neill is a prime example, he became Chief of Police in Chicago after
emigrating there in the late nineteenth century, and he worked hard to keep Irish
traditional music alive by publishing a number of collections of Irish dance music. His
collection called 'The Music of Ireland' (1903) has become a standard collection.
There was much movement of dance melodies and songs between Scotland and
Ireland, the common Gaelic language helping to maintain the cultural ties. Bards,
dance masters, and musicians travelled between Scotland and Ireland sharing their
crafts. After the highland clearances when many Scots moved to Cape Bretton Island
in Canada, the music lived on, and the well known jigs and reels of Cape Bretton are
also still known and played in Ireland. Most of the tunes were written for fiddle
though the pipes (both Scottish and Irish Uileann) were also used for dance music and
had tunes composed for them too.
Tunes, songs and style influences were also taken by the large number of Irish and
Scots-Irish emigrants to North America. The Scots-Irish, (originally Scots who moved
to Ulster in the late fifteenth and early sixteenth centuries, fleeing bad harvests and
religious strife, and who then had to leave Ulster as leases expired and rents rose)
made a big impact musically around the Appalachian regions, and the music evolved
into a style known as Appalachian Old Time, which in tum influenced much country,
blue-grass and even rock and roll music. (O'hAllmhurain, 1998). The people of the
South coast of Ireland tended to move to the Newfoundland area, mainly as a result of
working with fishing companies. In the South of North America, the focus has been
on playing reels, jigs and strathspeys, and to a lesser extent, the originally Eastern
European polkas and waltzes.
The fiddle was imported to America from Britain, and initially fiddlers there played
British tunes in British styles. As time moved on, the style changed, and new tunes
were written, with fiddlers developing a stronger sense of rhythm. There is much
emphasis placed on the bowing styles, and although the melodies have become
Chapter 2 - Music Analysis 33
simpler in construction, the rhythms and the style of playing have become more
complex. The use of syncopation, emphasising the off-beat, has been borrowed from
African musicians.
Since fiddle playing became so important in Ireland, significant style differences
developed between different areas or regions within the country. There are 32
counties in Ireland and most of them have their own variations in style, though
uniformity is developing due to the enormous availability of recordings, (O'Riada,
1982). Some of the counties have quite distinctive styles and these are better known,
and are well documented and recorded. The most significant or most pr:ominent of
these styles are outlined briefly in the following paragraph.
The county Donegal has a loose fiddle style, where the dexterity of bowing is
important. About 75% of the notes are played with separate bows, and loud tones are
used, this gives a tendency for a more evenly spaced rhythm, with an equal
distribution of notes, and as a result there is less emphasis on phrasing. The Sligo
style (and that performed by Michael Coleman) uses more slurring of the bow (Le.
where a sequence of notes are joined together in one bow stroke) and there is a lighter
accentuation on rhythm, and often more ornamentation. This style is more flamboyant
that the Donegal style. The overall sensation for the listener is that the music is fluid,
rapid, and flowing. The Clare style is similar to that of Sligo, though it has a more
pronounced rhythmic accent, and not quite as much slurring. Other Counties or
regions have less pronounced variations and will not be discussed here. Having
discussed the variations in fiddle (or violin) styles within Ireland it is necessary to
observe however that the commonest style is still that of Sligo, mainly due to the early
influences of Michael Coleman. Sligo bowing and ornamentation are now played
widely in the West and South of Ireland and it is this style that is the one we most
frequently hear when listening to Irish fiddlers. It is therefore the Sligo fiddle style
and derivatives of it that features most prominently in the experiments described in
Chapters 3 and 4.
It is generally felt that Irish music is best played by individuals to make the most of
such style differences, and that group playing should be avoided for that reason.
However group playing is a popular pass-time for many of today's fiddlers and that is
Chapter 2 - Music Anal ysis 34
how many choose to learn new tunes, and style traits, although there is also much
recorded and scored music available as sources of musical information.
The variations in style that can be observed as a result of the sharing of music, the
migration of musicians, and the influences of other styles and cultures, suggests that
the study of folk dance music could benefit from a formal musical analysis, in order to
help those interested to find out more about stylistic features associated with the
variations of the musical styles within the genre. A possible approach to this is to use
existing analysis techniques, most of which were developed with a view to analysing
Western art music. Earlier sections in this chapter have shown how these techniques
have been used effectively with other genres of music, and in the next section some
analyses of folk music (mainly statistical) have been discussed. Chapter 3 describes
some preliminary experiments that were carried out using existing analysis techniques
to compare the stylistic characteristics and differences in folk dance tunes for fiddle,
using tunes taken from an Irish collection, and also from an old time southern (North
America) collection.
2.6.4 Approaches to the analysis of folk music, with particular reference to
statistical approaches
There are examples of some quite simple analyses of folk tunes that have shown
interesting results. For example Tomas 0 Canainn (1978) gives an analysis method
for Irish music that shows that in Irish dance tunes there is a tendency to 'concentrate
on only a few notes of the available scale, and to return to these again and again
throughout the tune'. His method is based on the idea of note frequency; he allocates a
point to each note every time it appears, additional points are allocated to notes based
on their positions in the bar, and so on. He found that the most important notes
resulting from this analysis were not necessarily the same as those that would result
from a more formal analysis of key signature for example and as such that the tunes
examined could be said to have complex tonality. Tunes such as these are often modal
which means based on a scale system that dates back to at least the eighth century and
was associated with church music. A study carried out using O'Canainn's approach to
analysis by Carter et. aI., 2000a, on a series of fiddle tunes (15 Irish and 15 American)
Chapter 2 - Music Analysis 35
found that this approach to analysis highlighted a limited number of features that were
particular to one or other of the styles. This study is discussed more extensively in
chapter 4.
O'Canainn's work has some similarity with the work of Sen & Haihong (1992) on
scale tone functions. Here the authors observe that the scalar materials involved in the
structure of Chinese folk melodies can be broken into three types: framework tones,
supporting tones, and embellishing tones, and they developed a computer system to
carry out an analysis based on this. The results of their analysis highlighted some
regional variations in the melodies.
Eric Foxley (2001) developed a system to store and analyse folk melodies. The
analysis is statistical using the ideas of note pitch distribution, distribution of intervals
between successive notes, and distribution of successive pairs of intervals between
notes. He used cluster analysis techniques and multidimensional scaling and this
allowed the determination of ethnic similarities between the tunes. Again, this
statistical method showed a degree of success in the study of the cultural origins of
folk music, but can only be limited due to the lack of performance information
included in the representation of the music, and hence omitted from the analysis. The
music representation system used is based on DARMS (Erickson, 1977) which is an
ASCII format. DARMS is discussed as a music representation approach in Chapter 5.
Although methods such as those of 0 Canainn, Foxley and Sen and Haihong, are
largely statistical and do not claim to represent listeners intuitions (as does GTTM
discussed in the earlier sections of this chapter), they can still provide valid
information about the stylistic characteristics of the tunes. Additionally, some
parallels with the mechanisms used in these methods can be drawn with methods such
as GTTM and the IR model. For example, in 0 Canainn's model, an extra point is
given for a pitch that falls after an interval of a fifth or more; in GTTM, a large
interval can be a reason for choosing a group boundary, and in the IR model the size
of the implicative and realised intervals is important when applying the five principles
described earlier. There is also evidence to suggest (Eerola et al. 2001, Jarvinen et al.
1999, Krumhansl, 1999) that statistical analyses can provide adequate information to
enable the classification of musical styles according to their perceptual similarities.
Chapter 2 - Music Analysis 36
The most recent of these studies (reported by Eerola et a1.) achieved only moderate
success by comparison to the earlier studies and he concluded that statistical measures
can therefore capture "only a few basic aspects of the structures which portray
common salient dimensions to which listeners pay attention whilst categorising
melodies" (2001, 6). However he observes that his sample size was small compared to
those of other studies and additionally that the melodies he used may have been too
long. The study by Jarvinen et a1. was particularly successful; listeners were able to
classify ten styles based on the distributions of tones and intervals. The findings of
Krumhansl (1999) and Oram and Cuddy (1995) also indicate that it would be
appropriate to incorporate statistical features into an integrated method of musical
analysis, and therefore an experiment is reported in Chapter 3 using a statistical
method devised by O'Canainn (1978) to analyse Irish dance melodies.
Another important work centred on folk music is that of Sundberg and Lindblom
(1976). They developed a grammar for the generation of eight bar melodies in the
style of Alice Tegner, a Swedish folk tune composer. The grammar is based on a
linguistic approach and its hierarchical nature is similar to that of GTTM, though it
was developed at an earlier date. Of course the outcome of applying the method is
different to GTTM as it is designed to actually generate melodies, whereas GTTM is
generative in the sense that it aims to specify a structural description of a tonal piece
of music. Listeners were unable to tell the difference between the generated tunes and
those composed by Tegner. Sloboda (1985) points out that although this is not a
rigorous proof, it "demonstrates that music with a definite style can be generated from
a small set of completely definite grammatical rules"; which in tum demonstrates that
a comprehensive set of rules could be used to describe the stylistic features of a set of
tunes.
2.7 Summary
The findings of the research for this Chapter show that there is substantial availability
of well tested approaches to music analysis in general. and also that there is a great
deal of interest in folk music. Although there have been attempts to perform analyses
on the folk genre, the bulk of the work has been aimed at the oral tradition (i.e. songs)
rather than dance melodies, and some of those have been very specific in terms of the
Chapter 2 - Music Analysis 37

domain. Some (e.g. Lomax) have been very general both in terms of the domain and
the approach. There are few approaches to folk dance music analysis that use the
formal methods that have proved popular with works on Western art music (such as
Lerdahl and lackendoff, Narmour). Using folk dance melodies from Ireland (which
are in general written for fiddle or to a lesser extent Uileann pipes) and also from the
Southern North American States (the tunes of which are likely relations of Irish
melodies), some preliminary experiments were carried out to determine the
effectiveness of existing analysis techniques when applied to this particular domain of
folk dance music, as means of finding a set of stylistic discriminators for the sets of
melodies. These experiments are described in detail in the following Chapter.
Chapter 2 - Music Analysis 38

CHAPTER 3 - Preliminary Experiments on Analysis of Fiddle Melodies
3.1 General Introduction
This chapter gives details of a series of experiments that were carried out on a selection
of thirty folk dance melodies for violin. The investigation focused on western folk dance
melodies for violin. for which there is a large amount of scored music available. The
same melodies were used for each of the experiments and were all 16 bars long and in
common time. Half of the tunes were Irish. and taken from '0' Neill's Music of Ireland'
(Miles Krassen, 1976); the other half were American and taken from 'Fiddle Case Tune
Book: Old Time Southern' (Stacey Philips, 1989). Both sources are written for the fiddle
and include typical performance information (slurring/phrasing, ornamentation) i.e.
including information about how the music should be played in order to emphasise the
style, though both sources acknowledge that individual performers may choose to vary
the way that they playa particular tune. Philips observes that the indications of
performance style in terms of slurs and phrasings written into the scores in her book can
form the basis of an authentic style and that this information has been gathered from the
performers. However there is no discussion of how this was achieved and without this it
cannot be guaranteed that this is a true reflection of typical performance styles. Krassen,
though still not providing a methodology for the addition of performance information,
gives a fuller explanation of how the slurring, ornamentations and so on were arrived at.
The collection is that of O'Neill, an Irish emigrant who settled in Chicago, Illinois.
O'Neill's work is recognised as a true collection of the most widely played Irish dance
melodies, but the original work had very little in terms of the performance information
included. When Krassen revised the work he drew on the experience of a number of well
known fiddle players in order to add the ornamentations and the phrasings or slurring.
The majority of the fiddle players he worked with adhere to the Sligo style of fiddling
(See Chapter 2) and this is in fact the most common style to be found in the South and
West of Ireland and the style that we hear most frequently when listening to Irish dance
melodies for violin.
Chapter 3 - Preliminary Experiments on Analysis of Fiddle Melodies 39
In order to analyse these melodies, three of the analysis techniques discussed in Chapter 3
have been applied, and additionally a group of human listeners were asked to listen to and
classify a sample of the same melodies, given some training. Each of the analysis
approaches enabled a number of attributes to be derived and these were tested for their
effectiveness as means of classifying the melodies according to their cultural origin, thus
enabling stylistic characteristics to be determined within this domain. Classification was
carried out using QUinlan's C5 algorithm (Quinlan, 1998) for inductive learning. In order
to use this algorithm a number of attributes must be identified as input for the
classification process and therefore the attributes derived from the analyses could be used
for this purpose.
Section 3.2 describes an experiment in which the grouping and metrical components of
GTTM are used as the analysis mechanism. A further experiment is then described in
which a group of human listeners are played a sample of the tunes, told the class of each
(Irish or American) and are then played the remainder of the tunes and asked to classify
them giving their reasons. The results of this experiment are then compared with the
previous sections where GTTM was used. Section 3.3 describes an experiment in which
the same melodies are analysed using the statistical method of O'Cannain; the results are
compared with those of the previous experiments. Section 3.4 describes an experiment in
which the melodies are analysed using Narmour's Implication-Realisation model, and the
results are again compared with the previous experiments. The purpose of these
preliminary experiments is to verify the approaches to analysis in this context. If the
results are meaningful, the analysis of the melodies will be repeated with larger samples
drawn from wider sources.
3.2 Analysis of Folk Dance Melodies using GTTM, Experiment 1
3.2.1 Introduction
The experiment described in this section addresses the style analysis of Irish and
American folk melodies for fiddle, using GTTM. The hypothesis is that GITM can be
Chapter 3 - Preliminary Experiments on Analysis of Fiddle Melodies 40
used to analyse dance melodies for violin, deriving a set of characteristics that could then
be used to classify the melodies on the basis of their style. As a preliminary study,
suitable attributes have been obtained by using the metrical and grouping components of
GTIM. The analysis was carried out using musical scores that include performance
information (such as indications of slurs and ornamentation).
On completion of the analysis process, classification of the melodies was carried out
using Quinlan's C5 algorithm (Quinlan, 1998). The results of this experiment were then
compared with results from a further experiment, in which a group of human listeners
were played the same set of melodies (18 as training data, and 12 as test data) and were
then asked to classify the test melodies as either Irish or American, giving their reasons
for doing so.
The aim was to find out the effectiveness of GTTM as an analysis tool in this context,
and to compare the level of success of the classification based on the derived
characteristics, with those made by the human listeners.
The results of the experiments showed that GTTM did provide enough information for
correct classification of the melodies (86.6% classified correctly) and that the results
were comparable to those from the experiment with human listeners. It was also found
that some of the characteristics on which the classifications were derived appeared to
have similarities with the reasons given by some of the human users for their
classifications.
3.2.2 Generative Theory of Tonal Music (GTTM)
With GTTM, scored notation is necessary but because there is also room for more
features to be included in the representation such as slurring, phrasing, ornamentation,
attack and so on, the style of the performance can be analysed in a more detailed way
than with a score containing only pitch and duration information. The scores used for the
Chapter 3 - Preliminary Experiments on Analysis of Fiddle Melodies 41

study in this experiment all had information about slurring and ornamentation, and these
influenced the results of the analysis to varying extents.
GTIM has been used as a successful analysis mechanism by other researchers. For
example, Horowitz (1995) used it as a major contributor for his computer model to
analyse and generate improvisational jazz solos (See Chapter 2, Section 2.5). The system
illustrates the capabilities of GITM when applied to a domain other than western art
music. Widmer (1998, 273) uses elements of GTTM and also Narmour's Implication
Realisation (IR) model as means of providing a learning algorithm with "general
background knowledge about musical structure and its possible relation to expressive
performance". The purpose of the work is to investigate the potential of machine learning
when applied to the domain of expressive music performance.
This experiment therefore aims to show the effectiveness of the grouping and metrical
preference rules from GTTM, as means of identifying the discriminatory stylistic features
of two sets of western dance melodies for violin. The melodies were represented in WTM
notation but with additional performance information included (slurring or phrasing,
ornamentation and articulation.) The results of the analysis were interpreted using See5, a
software tool for decision tree induction developed by Quinlan (1993). Quinlan's
approach to inductive learning is introduced in the next section, and is discussed in
greater depth in Chapter 5.
3.2.3 Quinlan's Algorithms for Inductive Learning
Quinlan's work on 103, C4.5 and more recently C5 has made a substantial contribution to
machine learning. The process of induction allows a set of examples to be used in order
to create a decision tree, which can also be represented as a rule set. The algorithm
achieves this by discovering and analysing patterns found in sets of data. The data
presented to the algorithm for classification purposes must have the following
characteristics:
Chapter 3 - Preliminary Experiments on Analysis of Fiddle Melodies 42

• There must be a fixed collection of attributes that describe the object or case, and
these may have either discrete or numeric values.
• The classes must be pre-defined as this is supervised learning.
• Each case must belong to one class or another, and there should be substantially
more cases than there are classes.
• There must be enough data for patterns to be established. The amount required
varies depending on the complexity of the classification task (Quinlan, 1993).
The algorithm needs to have a training set in order to build the decision tree (also known
as a classifier). It is then able to make classification predictions on further data sets based
on the tree it has already built. There are a number of ways of using the software to give
more accurate predictions without increasing the available number of cases. One of these
is known as cross-validation trials. This option uses the complete set of cases, and from
this takes a number of different samples as training sets. It builds a new tree each time,
uses it as a classifier and gives a measure of the success of that tree as a classifier. At the
end it presents summary information and the average success rate for all of the trials. This
means that every case is used at some time both as training data and as sample data for
classification (Quinlan, 1998). The software will also derive a set of rules from the
decision tree and these are generally easier for the user to interpret.
3.2.4 Method for Experiment 1
The preliminary study described here uses the metrical and lower level grouping
components of GTTM to analyse two sets of 16 bar fiddle melodies, in common time.
The elements of GTTM enable a set of attributes to be derived that could contribute to the
characterisation of the melodies. The GTTM analysis enables a value for each attribute to
be derived for each melody, i.e. which lower level Grouping Preference Rules (GPRs)
and which Metrical Preference Rules (MPRs) were invoked by the musical information.
In order to determine which attributes characterise the sets of melodies effectively, the
software known as See 5 (an implementation of Quinlan's C5 algorithm for Windows)
Chapter 3 - Preliminary Experiments on Analysis of Fiddle Melodies 43

was used. It provides statistics that indicate the accuracy of the classifications made, as
well as allowing the user to establish which of the given attributes were key to the
classification process.
For this study, a total of thirty melodies (fifteen American, fifteen Irish) were analysed. It
was noted during the analysis phase that certain rules were required frequently; others not
at all, details of this can be seen in the results section.
The well-formedness rules were all used as a framework for carrying out the analysis,
and then the grouping and metrical preference rules (GPRs and MPRs) were applied
within this framework. A brief outline of the GPRs used follows:
Lower level preference rules:
1. Strongly avoid groups containing a single event and in general the smaller the
group the less preferable it is.
2a. Consider four notes, n 1, n2, n3, n4; n2 to n3 is heard as a boundary if the interval
of time before the end of n2 to the beginning of n3 is greater than that between n 1
and n2, and that between n2 and n3. (i.e. if there is a slur ending/beginning, or a
rest).
2b. Consider four notes, n 1, n2, n3, n4. n2 to n3 is heard as a boundary if the attack
point between n2 and n3 is greater than that between the other pairs (i.e. if n2 is a
longer note).
3. Consider four notes as in 2a and 2b above, but hear a boundary in terms of:
a. Register (Le. the pitch gap between two notes is greater at a boundary).
b. Changes in dynamics
c. Changes in articulation
d. First two notes are of equal length, but are different to second two notes
which are also equal.
Chapter 3 - Preliminary Experiments on Analysis of Fiddle Melodies 44
Higher level preference rules:
4. Where the effects picked out by GPRs 2 and 3 are relatively more pronounced, a
larger level group boundary may be placed.
5. Prefer grouping analyses that most closely approach the ideal subdivision of
groups into 2 parts of equal length.
6. Where two or more segments of the music can be construed as parallel, they
preferably fonn parallel parts of groups.
The lower level preference rules (sometimes referred to as local level rules) are
concerned directly with the musical surface. The higher level rules re-enforce the lower
level rules but at a higher hierarchical level. The experiments reported in this thesis are
concerned with the surface level of the music and therefore use the lower level preference
rules.
On carrying out the analysis of the melodies it was found that the metrical structures were
identical for each, as a result it was not necessary to note infonnation about the MPRs.
Metrical structure did become important though where there was a certain kind of
deviation from the metrical structure. This is explained in the following paragraph.
Metrical structure introduces the idea of the tactus. This is "the level of beats that is
conducted and with which one most naturally coordinates foot-tapping and dance steps"
(Lerdahl & Jackendoff, 1983, 71). Additionally the tactus should not be too far away
from the smallest metrical level and should be continuous throughout the piece and the
speed of it is often somewhere between 40 and 160 beats per minute (thought to be
related to human pulse level). For all of the melodies in this analysis the tactus level was
at the quarter note; any levels smaller than the tactus are referred to as the sub-tactus level
in OITM. The tactus level must also consist of equally spaced beats so for many of these
melodies attempting to set the tactus at the eighth note level for example would create a
problem where there are triplets of eighth notes. Eighth note triplets can be written in as a
sub-tactus event where the tactus is at the quarter note level and for the purposes of this
Chapter 3 - Preliminary Experiments on Analysis of Fiddle Melodies 45

work these have been referred to as deviations from the metrical structure. In addition to
triplets, handled by GTIM specifically in the way described above, many of the melodies
feature ornamentations such as grace notes, turns and so on. GTIM does not specifically
deal with these: "these extra metrical events are fast relative to the tactus. Intuition
suggests they are exempt from the MWFRs [metrical well-fonnedness rules]" (l..erdahl
and lackendoff, 1983, 72). These ornaments were therefore not used in the analysis
according to GTIM, though in the proposed integrated analysis method they can be
identified by the statistical components.
An example of an analysis of an Irish melody is shown in Figure 3.1. (A full set of all
thirty melodies are provided in Appendices Al and A2.) The dots indicate the metrical
structure. The groupings are indicated by the brackets beneath the stave, and the grouping
preference rules (GPRs) causing a particular group boundary are indicated in pencil on
the score for each of the melodies. An 'X' indicates where GPRl caused the suppression
of a group boundary. Suppression of a boundary occurred where the potential boundaries
implied a group of only one or two notes. When this arose, the group boundary least
likely to be preferred by a listener was suppressed. The likely preference of listeners for
one boundary over another was taken from the order of preference suggested by Lerdahl
and lackendoff (1983). Occasionally the infonnation provided by them was not enough
to account for all of the observed conflicts and a further experiment to detennine
preferences when such conflicts occurred was required. This issue, along with the further
experiment is discussed in Chapter 4, Section 4.2. On completion of the experiment
described in Section 4.2 this preliminary experiment was revisited and the results reflect
any changes due to this.
Chapter 3 - Preliminary Experiments on Analysis of Fiddle Melodies 46

The Pleasures of Home
Fig 3.1 Analysis of an Irish Reel 'The Pleasures of Home' (Krassen, 1976) showing the
metrical structure, and the lower level of grouping structure
The set of attributes that therefore described the music in terms of the GTIM analysis
were as follows:
GPR 1: continuous.
GPR2a: continuous.
GPR2b: continuous.
GPR3a: continuous.
GPR3b: continuous.
GPR3c: continuous.
GPR3d: continuous.
mecdeviations: continuous.
Chapter 3 - Preliminary Experiments on Analysis of Fiddle Melodies 47

The above represent each of the lower level grouping preference rules and the number of
metrical deviations (caused by triplets). The word 'continuous' after each shows the type
of data that is given as a value for the attributes i.e. numerical and of any value on a
continuous scale. Note, only the lower level preference rules were used. The higher level
preference rules reinforce certain group boundaries to form higher level groupings, but it
is important to concentrate on the lower level groupings initially as these relate more
directly to specific musical features.
The attributes were used to form a data set for use with SeeS. Not all of the available
preference rules were invoked (GPR 3b was never used) during the analysis but all of the
rules were left in as attributes for completeness. There are a number of ways in which the
data can be divided into training data and test data. As the sample of data was fairly small
(thirty melodies), the experiment was initially carried out using cross-validation trials.
This means that a number of decision trees are built using different combinations of the
melodies as training and test data. The results from each are then automatically
amalgamated to give an overall measure of the success of the classification. A later trial
was carried out using exactly the same melodies (twelve as test data, eighteen as training
data) but this time they were played to the human listeners in Experiment 2.
3.2.5 Results for Experiment 1
The classification process identified two important attributes that differentiated one set of
melodies from the other. These were:
• Number of deviations from the metrical structure (in the form of triplets) was
greater for the Irish melodies.
• The number of times GPR 1 was invoked due to a conflict in potential boundaries
was greater for the American melodies
The classifiers (trees) were all small, since certain attributes were clearly the most
important, and also because the number of cases was relatively small. 12115 cases for
Chapter 3 - Preliminary Experiments on Analysis of Fiddle Melodies 48

both Irish and American melodies were classified correctly using these trees.
See5 indicates the number of training cases associated with each leaf on a decision tree,
and can also generate rule sets. It provides a value for the predicted accuracy of any
further classifications made using that rule. E.g. in the simple rule below, it predicts an
accuracy of 92.9% were it to classify any further melodies using that rule. The rule read
as "If the number of metrical deviations is greater than 2 then the class is Irish".
Rule 1:
mecdeviations > 2
-> class irish [0.929]
It is possible to pass the data through See5 ignoring certain attributes. This can be useful
when there is a need to find out more about the differences between the classes rather
than just classify them as effectively as possible. The data was passed through SeeS
again, this time ignoring the metrical deviations attribute. The classification was slightly
better for the American tunes, this time 12115 melodies were classified correctly as being
Irish, and 13/15 were classified correctly as American. This time the attributes
contributing to the classification were the incidence of GPRl, GPR3c and GPR3d.
• The number of times GPR 1 was invoked due to a conflict in potential boundaries
was greater for the American melodies
• The number of changes in articulation due to the onset or ending of slurs was
greater in the American melodies, causing GPR3c to be invoked more frequently.
• The incidence of GPR3d was greater in the Irish melodies. This is the change in
length rule and was invoked mainly at the start or end of a series of triplets
preceded by or followed by a series of eighth notes. Although GPR3d was
invoked in both Irish and American melodies for other kinds of change in length
(for example, two eighth notes followed by two quarter notes).
The classification of the melodies after analysis using the grouping preference rules (and
Chapter 3 - Preliminary Experiments on Analysis of Fiddle Melodies 49
limited metrical infonnation) was therefore successful, and the nature of SeeS meant that
it was possible to look at the reasons for the classifications, and hence learn more about
the music. The following section describes an experiment in which a group of human
listeners listen to the same set of melodies and are asked to classify a selection of them
after being presented with some as training data.
3.2.6 Method for Experiment 2, using Human Listeners
GTTM aims to represent the intuitions of the listener "who is experienced in a musical
idiom" (Lerdahl & Jackendoff, 1983). This is a fairly general description and is intended
to refer to the musical culture with which a listener is familiar, in this case western tonal
music. A listener with greater familiarity with folk music would still be classed as an
experienced listener in the same way as a listener who rarely hears that type of music,
thus the category is very broad. Due to this it was felt appropriate to carry out a similar
classification experiment on the sets of melodies, but this time using human subjects.
The subjects were a group of fifteen Computing students from De Montfort University,
UK. The experiment took about fifty minutes to complete. The students were all in a
quiet class room where they were initially asked to complete a short questionnaire (see
Appendix C) that provided information about their musical backgrounds and interests.
They were then played a recording of 18 of the violin melodies as training data and told
the classification (Irish or American) of each. Whilst listening to these they were asked to
write down anything that they felt characterised the melodies as either Irish or American.
A further twelve melodies were then played in a random order as test data and the
students asked to classify them as either American or Irish, and to try to give a reason
where possible. The melodies were played exactly as written (with slurs and
ornamentations as given in the scores), so that information was as close as possible to that
used in the Experiment 1.
Chapter 3 - Preliminary Experiments on Analysis of Fiddle Melodies 50

3.2.7 Results for Experiment 2
The students all had similar backgrounds: some had limited musical training (recorder at
school for example), one student played an instrument, all listened to western popular
music but none of them listened specifically to folk music (except for familiarity with
music for shows such as River Dance that features Irish dance melodies). The results for
this experiment showed a high degree of success in terms of classifying the melodies.
Only one student classified as little as 6/12 melodies correctly, and all of the others
scored higher than this (mean score 8.7 out of 12 which is an accuracy of 72.5%, if the
subjects had selected their answers randomly the expected percentage of correct
responses would be 50). The results using GTTM analysis and See5 gave an accuracy of
80% (and 83.3% when the metrical deviations attribute was ignored) when used for
classifying the melodies. The reasons given for the classifications (as well as the noted
characterising features) also seemed to fit with some of the attributes derived from the
GTTM analysis; these included such observations as the Irish melodies had more 'flow',
'consistent rhythm'; the American melodies had more long notes, more 'changes in
notes'. There were also more general observations such as the American melodies had a
more 'country & western' or a 'cowboy' feel to them.
3.2.8 Discussion of Results for both Experiments
The results for Experiment 1 were successful as even a limited analysis has highlighted
differences between the two types of melodies. Cross validation in general enables a
better set of results to be achieved, though a further construction of a classifier that used
18 melodies as training data (the same 18 as the students listened to as training data) and
12 as test data in order to make a more valid comparison with the results of Experiment 2
still classified the melodies with a similar degree of success (83.3% of the test data
classified correctly). The classifications were based on an attribute that featured
prominently in the cross-validation trials, the number of deviations from the metrical
structure. A bigger data set is likely to have given a larger and therefore more complex
tree, and of course more attributes from a broader analysis approach would be beneficial.
Chapter 3 - Preliminary Experiments on Analysis of Fiddle Melodies 51

These issues will be addressed now that this preliminary study has shown that the
approach yields positive results.
To achieve a comprehensive analysis of sets of melodies. the identification of many more
key features is necessary. For example. although grouping preference rule 3c is invoked
more frequently in the American melodies (due to a change in articulation with the onset
or ending of a slur). a more specific feature relating to this is the beat in the bar where the
slur begins. This is often the fourth and eighth quaver in the bar in American fiddle
melodies. but more often falls on a strong beat in Irish melodies. The current analysis
does not give emphasis to this.
The actual construction of the melodies in terms of notes. specific types of
ornamentation. use of inflection and so on, have also been overlooked. Some of these
features could be recognised by the remaining elements of GTTM (such as time span
reduction and prolongation reduction not considered in this work). but other methods of
analysis must also be considered if complete sets of characteristics are to be achieved.
Experiments focusing on alternative analysis methods are described in sections 3.3 and
3.4
The results for experiment 2 showed that after listening to the training data. and noting
down any features that seemed to characterise the given styles. all but one student was
able to classify more than half of the melodies correctly. The proportion of correct
classifications was not as high as when using GTTM and SeeS, but nevertheless was an
interesting and significant result (an accuracy of 72.5% whereas the expected correct
responses if the classifications had been guessed would be 50%).
The students could be classified as experienced listeners in the domain as they were all
familiar with western tonal music by virtue of having lived in this culture for all or most
of their lives. (and GTTM aims to represent the intuitions of experienced listeners).
Additionally. about half of them had played an instrument for at least a short period of
time. and most of them stated that they frequently listened to current popular music. None
Chapter 3 - Preliminary Experiments on Analysis of Fiddle Melodies 52

of them had a specific interest in western folk music, though their responses to the
questions showed that they had heard it in films or via other broadcasting means, and
were able to describe features that they had learned to associate with certain styles of
music (e.g. 'cowboy music'). They all appeared to make use of the training melodies, and
had written notes during the experiment explaining what they had heard in order to aid
them with the classification of the test melodies.
3.2.9 Conclusion for Experiments 1 and 2
A particularly interesting feature of studying the styles of melodies like these is the way
in which they have travelled and developed. Many of these melodies that sound
stylistically either Irish or American, may well have travelled (mainly from Ireland to
America) in their lifetimes, and will have been adapted and developed as this has taken
place. Their current versions give them a particular style; this can be due to the approach
to performance or to the development of structure and rhythms which may incorporate
features of other music prevalent in a region, (e.g. American melodies feature
syncopation, generally thought to be from African and Jazz influences). GTIM, as a
formal approach to analysis appears to pick out some of these features this enabling the
successful classifications in experiment 1.
As an initial study the approach described has proved to be successful and it shows that
there is scope for further work with musical data in this context. The results show that
analysis techniques aimed at Western art music can be used with certain types of folk
music in order to highlight characteristics of the style of that music, and that the
classifications made can be similar to those made by human listeners. However it is clear
that to achieve the level of characteristic information required, a broader approach to
analysis is necessary, and this should draw from a number of existing techniques in order
to form an effective integrated method. The evidence suggests that Inductive Learning
appears is an effective way of finding the most important characteristics of the musical
styles.
Chapter 3 - Preliminary Experiments on Analysis of Fiddle Melodies 53

The next section describes an experiment in which a statistical analysis method is used to
analyse the same selection of melodies.
3.3 Analysis of Fiddle Melodies using the Statistical method of Tomas O'Cannaln,
Experiment 3.
3.3.1 Introduction
This section addresses the area of style classification of folk melodies using a statistical
analysis technique, that of Thomas O'Canainn (1978). O'Canainn is well known for his
work on the study of Irish music and is also a practitioner having previously held the title
of 'All Ireland Uillean Piper'. His approach to the analysis of Irish tunes is not well
tested and is derived from a more discursive account of the music, however as a method
aimed at this genre of music specifically it makes it of relevance to this study and worthy
of testing on the sets of tunes. His approach has some similarity with the work of Sen &
Haihong (1992) on scale tone functions cited in Chapter 2; where the authors observe that
the scalar materials involved in the structure of Chinese folk melodies can be broken into
framework tones, supporting and embellishing tones. Their results show that most of the
folk melodies have two tones that appear to be the most important (referred to as
framework tones), but some have three, and these all appear to be from a particular
region.
For this experiment, the same set of thirty sixteen bar melodies were used. fifteen of
which were American and the other fifteen Irish, as described in 3.1. O'Canainn's analysis
was carried out on all of the melodies enabling a set of ten attributes for each melody to
be derived.
The attributes derived from this analysis process were similarly passed through Quinlan's
See5 algorithm to enable identification of the key characteristics of the melodies, with
respect to cultural background. The results were compared with the first experiment
described in section 3.2, where the Same melodies were analysed using the lower level
Chapter 3 - Preliminary Experiments on Analysis of Fiddle Melodies 54
GPRs (and to a limited extent MPRs) of GTIM.
3.3.2 O'Canainn's Method of Analysis
This is an example of a fairly simple analysis process designed for work with folk
melodies and is based on the idea of note frequency. O'Canainn applied the method to a
number of melodies, showing that in Irish dance tunes there is a tendency to concentrate
on only a few notes within the scale, and to return frequently to these notes throughout
the tune. The method requires the allocation of points to notes for the reasons indicated
below:
• each occurrence of a note
• any note falling on a strong beat
• the highest note on its first appearance
• the lowest note on its first appearance
• any note proceeded to by an interval greater than a fifth
• the first stressed note
• a long note (relative to the modal note length in the melody)
O'Canainn's own analyses showed that the most important notes resulting from this
analysis were not necessarily the same as those that would result from a more fonnal
analysis of key signature. For example, the notes with the maximum and second
maximum frequency of points were not necessarily the tonic and the dominant as might
be expected, and hence he concluded that the tunes examined had a complex tonality.
3.3.3 Experimental Method
Each of the thirty melodies was analysed according to the rules outlined in section 3.2.
The number of points for each note in every melody was then used to derive a series of
attributes that describe features of the melody. The attributes were derived as follows:
Chapter 3 - Preliminary Experiments on Analysis of Fiddle Melodies 55

• The note with the highest number of points
• The note with second highest number of points
• The note with the lowest number of points
• The note on which the first stressed note falls
• Percentage of points allocated to the key signature tonic
• Percentage of points allocated to the key signature dominant
• Mean number of points per note
• Standard deviation of points for each note
• Percentage of points allocated for a long note
• Percentage of points allocated for a large interval (fifth or more)
Values for the first four attributes were described using the standard naming for notes of
a diatonic scale (Le. tonic, supertonic, medient, subdominant, dominant. submedient,
leading note). The remaining attributes all had numeric (and continuous) values.
The results of this analysis were then used as input for the See5 decision tree induction
software. Tests were carried out using cross validation trials since the data set was small
and rule sets were generated for all trials.
3.3.4 Summarised Results for Experiment 3
The results were positive in that they showed that the melodies could be classified
according to cultural background using the attributes from the analysis (76.6% classified
correctly), however only one attribute stood out as being useful as a classifier for the
melodies, and this was the mean number of long notes (higher for American tunes). If
this attribute was ignored the classification was quite poor based on the remaining
attributes, although some weaker characteristics could be picked out. The results are
discussed further in the following section.
Chapter 3 - Preliminary Experiments on Analysis of Fiddle Melodies 56
3.3.5 Discussion
The most important characteristic was the number of points allocated due to the note
being longer than the average (modal) length. This is not surprising, since an examination
of the scores shows that the Irish melodies are often a stream of notes of equal length,
with longer notes appearing mainly at the end of a section. Many of the American
melodies however have more variation in the rhythm.
This could also account for the variation in the mean number of points per note (higher
for Irish though not used for classification by See5 in the first set of cross-validation
trials), since the note frequency will be greater if there are less long notes. Using the
mean as an attribute is probably not so helpful in retrospect since it could be hiding more
significant features.
As described in experiment 1, it is possible to pass the data through See5 ignoring certain
attributes, when seeking to uncover more about the differences between the classes rather
than just classify them as effectively as possible. The data was therefore passed though
See5 with the attribute 'percentage of points allocated for a long note' set to 'ignore'. The
resulting classification was poor (8/15 Irish melodies classified correctly, 9115 American
melodies classified correctly which is an overall rate of 56.7%) but the trees enable
certain tendencies to be observed.
The American tunes tended to have slightly more points on the key signature tonic and
dominant than the Irish tunes. According to Q'Canainn this would imply a less complex
tonality and he defines this as being where the melodies do not move to the tonic and
dominant as frequently as expected, instead they move to less important tones in the tonal
hierarchy for the given key signature.
The standard deviation of points per note appeared in some trees as a weak means of
classification, but these were relatively few and resulted in a high proportion of errors
when used to classify. Nevertheless this suggests further study of the range and
Chapter 3 - Preliminary Experiments on Analysis of Fiddle Melodies 57

distribution of notes within a melody. The occurrences of notes within its specific octave
could also add more value to this.
A number of trees attached limited importance to the second maximum number of points
awarded, (supertonic, subdominant, leading note for Irish melodies; tonic, medient,
submedient for American melodies). The expected result for this would be the dominant
as this is the second most important tone in the tonal hierarchy. This therefore shows an
interesting feature but it is not specific enough as it stands to be very useful. There was
no pattern to the note for which the maximum points were awarded, although for all of
the tunes there was a tendency for this not to be the tonic (which would be the expected
result), and this tendency was greater for the Irish melodies.
3.3.6 Comparison with experiments 1 and 2 (Section 3.2)
The earlier study of the same melodies using the GTTM (Section 3.2 and Carter et al.
1999) showed that it was possible to classify the tunes successfully according to the
positioning of group boundaries and consideration of metrical information. The analysis
was carried out using the well-formedness and preference rules. The analysis using
O'Canainn's method gives reasonably good results in terms of correct classifications,
however only one attribute caused this with a high degree of success, and if this one was
ignored classification was poor. Some of the rules in GTIM overlap with the reasons for
awarding points in O'Canainn's method, for example, a group boundary is created in
GTTM for large intervals, and for long notes; in O'Canainn's method points are allocated
for intervals greater than a fifth, and also for long notes.
The key features identified by GTIM were as follows: deviations from metrical structure
(caused by frequent occurrence of triplets in Irish tunes); and group boundaries due to the
greater frequency of changes in articulation and occurrence of longer notes in American
tunes.
Chapter 3 - Preliminary Experiments on Analysis of Fiddle Melodies 58

O'Canainn's method identified the most important feature as one that was weakly
identified by GTIM i.e. the more frequent occurrence of long notes in American tunes.
GTIM would not pick these out every time because the long notes in the American tunes
appear in batches close together and GPR! in GTIM states that small groups must be
avoided, thus long notes did not necessarily cause a new group boundary every time.
Occurrence of larger intervals appeared to happen to a similar degree in both types of
analysis illustrating an overlap. The different levels of complexity in tonality identified
by O'Canainn's method were not apparent in the results of the analysis using GTIM.
Although methods such as O'Cannain's are largely statistical, and do not claim to
represent listeners intuitions (as does GTIM), they can still provide valid information
about the stylistic characteristics of the melodies. Additionally, some parallels with the
mechanisms used in these methods can be drawn with methods such as GTIM; for
example, in 0 Canainn's model, an extra point is given for a pitch that falls after an
interval of a fifth or more; in GTIM, a large interval can be a reason for choosing a
group boundary (GPR3a). Also there is evidence to suggest (Eerola et a1. 2001, Jarvinen
et a1. 1999, Krumhansl et al. 1999) that statistical analyses can provide adequate
information to enable the classification of musical styles according to their perceptual
similarities.
3.3.7 Conclusion
The analysis method described has proved to be useful as a means of classifying the
melodies but in a very limited way. It does add some information to the previous study
using GTIM, though the results are not as specific. The results were successful in that
the analysis enabled the classification of the melodies, however only a few features were
drawn out as being important, and the aim is to achieve an analysis method that provides
a full description of the melodies. Rather than providing a useful means of analysis in
itself, O'Canainn's method as accounted in this experiment has helped to illustrate that
there is a place for statistical analysis approaches and that they may well both
complement and overlap the cognitive approaches to analysis. Further work is required to
Chapter 3 - Preliminary Experiments on Analysis of Fiddle Melodies 59
derive an integrated method that fully describes the styles in tenns of their perceptual
similarities. The conclusion to be drawn from this then is that statistical methods in
general can provide useful infonnation about music and that such infonnation may also
correlate with the way that human listeners perceive the music. O'Canainn's statistical
method was helpful in only a limited way in the preliminary experiment and hence in
order to propose an integrated method of analysis a more comprehensive statistically
based method might be more infonnative. Such a method does already exist and has been
implemented as part of a computerised tool kit known as the Humdrum Toolkit (Huron,
1999). Humdrum is discussed fully in Chapter 5.
The next section looks at the possible contribution of an alternative well tested cognitive
approach to analysis, that of Eugene Nannour, and then Chapter 4 describes a repeat of
some of these studies with a larger sample of melodies collected from wider sources.
3.4 The Implication Realisation (IR) Model Applied to Folk Dance Melodies,
Experiment 4
3.4.1 Introduction
This section addresses the area of style classification of folk melodies using the
Implication Realisation (IR) Model of Nannour (1977, 1990, 1992). The same set of
thirty sixteen bar melodies were used for the study, fifteen of which were American and
the other fifteen Irish, as described in 4.2. The IR analysis was carried out on all of the
melodies enabling a set of seven attributes for each melody to be derived.
In order to detennine which attributes characterise the sets of melodies effectively
Quinlan's See5 (1998), was used as described in section 3.2. The results are compared
with the experiments described in Sections 3.2 and 3.3.
Chapter 3 - Preliminary Experiments on Analysis of Fiddle Melodies , 60

3.4.2 The Implication Realisation (lR) Model
Narmour's model is based on the idea that listeners form expectancies about how a
melody will continue as they are listening to it. Such expectancies are thought to derive
from both innate and learned factors, (Schellenberg, 1996). Meyer (1956) proposed that
emotion and affect may be increased when musical events conflict with a listener's
expectation. Narmour extended this idea which resulted in a formal description of
melodic implications and formed the basis of the IR model. The model includes a set of
Implicative Principles, described below. The descriptions are adapted from Thompson
and Stainton (1998). Each description refers to the interval between two consecutive
tones (the implicative interval) and the possible subsequent or continuation tones that the
interval in question might cause a listener to expect.
1. Registral Direction: Small intervals (a perfect fourth or less) imply subsequent pitch
movement in the same registral direction. Large intervals (a perfect fifth or more) imply a
subsequent pitch movement in the opposite direction.
2. Intervallic Difference: Small intervals imply a subsequent interval that is similar in size
(+/- 3 semitones if registral direction continues, +/- 2 semi tones if registral direction
changes), whereas large intervals imply a subsequent interval that is relatively smaller.
3. Registral Return: An interval of any size may be followed by a return to a pitch that is
near (within 2 semi-tones) or in unison with the first note in the interval.
4. Proximity: An interval of any size implies a subsequent note within a perfect fourth of
the second note of the interval.
5. Melodic Closure: Closure is increased by two aspects of pitch pattern: a change in
registral direction, and movement from a larger to a smaller interval.
Thompson and Stainton (1998) used these principles to analyse over 13 ()()() continuation
Chapter 3 - Preliminary Experiments on Analysis of Fiddle Melodies 61

notes from a sample of 513 bohemian folk song melodies. This is a development of an
earlier study by Thompson (1997) where smaller samples were used. The musical
samples were available from a database known as the Essen database (Schaffrath, 1995).
This database is available for research purposes though it does not contain instrumental
music, focussing only on folk songs. The intervals they picked were classed as either
strongly implicative or closural (i.e. not implicative). They used the Humdrum toolkit
(Huron, 1995) to identify the intervals that were to be classed as either implicative or
closural, and based this identification on the following:
1. "intervals are defined as implicative if the subsequent tone moved to a weaker
metric position, decreased in tonal stability, decreased or stayed the same in
duration" (Thompson and Stainton, 1998);
2. "intervals are defined as cIosural if the subsequent note moved to a stronger
metric position, increased in tonal stability, increased or did not change in
duration" (Thompson and Stainton, 1998).
Similar means of determining intervals as being implicative for subsequent analysis
according to the IR model were employed by Krumhansl (1995) and are described here in
an email exchange with her (2002):
"The fragments [in the experiment carried out by Krumhansl in 1995] ended with one of
the chosen implicative intervals that met the following criteria: 1) the second tone of the
implicative interval could not be longer than the first tone, 2) the second tone had to be
lower than the first tone in the tonal hierarchy of the key of the fragment, 3) the second
tone had to be on a metrically weaker beat than the first tone, 4) the second tone could
not occur in the last or second-to-Iast position of a phrase, and 5) the second tone had to
be 16 to 21 tones from the beginning of a phrase. The first four criteria ensured that the
last two tones of each fragment were unclosed and truly implicative. The fifth criterion
ensured that all fragments would be approximately equal in length. Of course, how
implicative/closed something is, is a matter of degree."
Chapter 3 - Preliminary Experiments on Analysis of Fiddle Melodies 62

Krumhansl's study of 1995 compared fulfilment or denial of expectancies as predicted by
the IR model with a rating from listeners of how well a continuation note followed a
melodic stimulus. The study supported the set of principles. Similarly Thompson and
Stainton (1998) found support for the principles whilst Schellenberg (1996) supports the
model in general, but he argues that it is over specified and can be reduced to a two factor
model. The two factors he reduces the IR model to are "registral direction-revised and
registral return-revised" (1996; 113) and he summarises "the two factor model proposes
that tone-to-tone expectancies are determined primarily by proximity; upcoming tones in
a melody are expected to be proximate to tones heard previously. When listeners hear
successive tones that are non-proximate (relatively distant in pitch), they expect the next
tone to fill in the gap" (1996, 113). For the experiments in this study however the original
five principles of Narmour were used for the analysis of the selected intervals.
3.4.3 Method for Experiment 4
The experiment used the same thirty melodies as in the experiments described earlier in
this chapter. It was decided initially to take two implicative intervals from each melody
and to analyse these according to the IR model. This would enable a set of characteristics
to be determined for each interval which could then be passed through the SeeS software
to investigate if it was possible to classify the intervals as being from either an Irish or an
American melody. In order to analyse them using the IR model it was necessary first of
all to determine which intervals to use, and for this the first four of Krumhansl's criteria
as described in the previous section were used and the fifth criterion was altered slightly.
The fifth criterion (that the second tone had to be 16 to 21 tones from the beginning of a
phrase) was varied as follows. Two possible intervals were chosen for each melody. All
of the melodies are written as two eight bar sections (often referred to by musicians as
section A and section B) and the fragments of music from which the implicative intervals
were to be taken were the first three bars in Section A and the first three bars in Section
B. The first interval in the third bar was to be used in each case. When the first interval in
the third bar was unsuitable as an implicative interval (based on Krumhansl, previous
section), then the next suitable interval after it was used instead. This was noted and used
Chapter 3 - Preliminary Experiments on Analysis of Fiddle Melodies 63

as an attribute titled 'position'. The chosen intervals were marked on the scores with a
pencilled rectangle around the two notes. An example of this can be seen in Figure 4.1
(earlier in this Chapter), and a full set of all of the melodies is provided in Appendices Al
and A2.
The attributes or characteristics that could be derived from this analysis are shown below
and in each case the possible values that the attribute could take are given.
interval_size: s,L. (i.e. small or large)
registral_direction: y, n. (y if fulfilled, n if denied)
intervallic_difference: y, n.
registral_retum: y, n.
proximity: y, n.
closure: y, n.
position: 1, 1.5,2,3,4,b4_1 ,b4_2.
Attributes 2 to 6 represent the five implicative principles of Narmour, and it should be
noted that the sixth attribute, regarding closure, was only classed as 'yes' when both
elements of closure as described by Thompson and Stainton (see previous section) were
satisfied. The seventh attribute 'position' was given a set of allowed values. These can be
interpreted as follows: '1' refers to the first quarter beat in the third bar, '2', to the second
and so on, '1.5 refers to the third eighth beat in the third bar (i.e. falling between' 1 ' and
'2') and b4_1 and b4_2 refer to the first and second quarter beats in the fourth bar
respectively. If any other positions had been noted in the analysis then these would also
have been included in the list of allowed values.
The analysis was therefore of sixty intervals, thirty from Irish melodies and thirty from
American melodies. The attribute values for each interval were passed through See5 and
the results are described in the following section.
Chapter 3 - Preliminary Experiments on Analysis of Fiddle Melodies 64
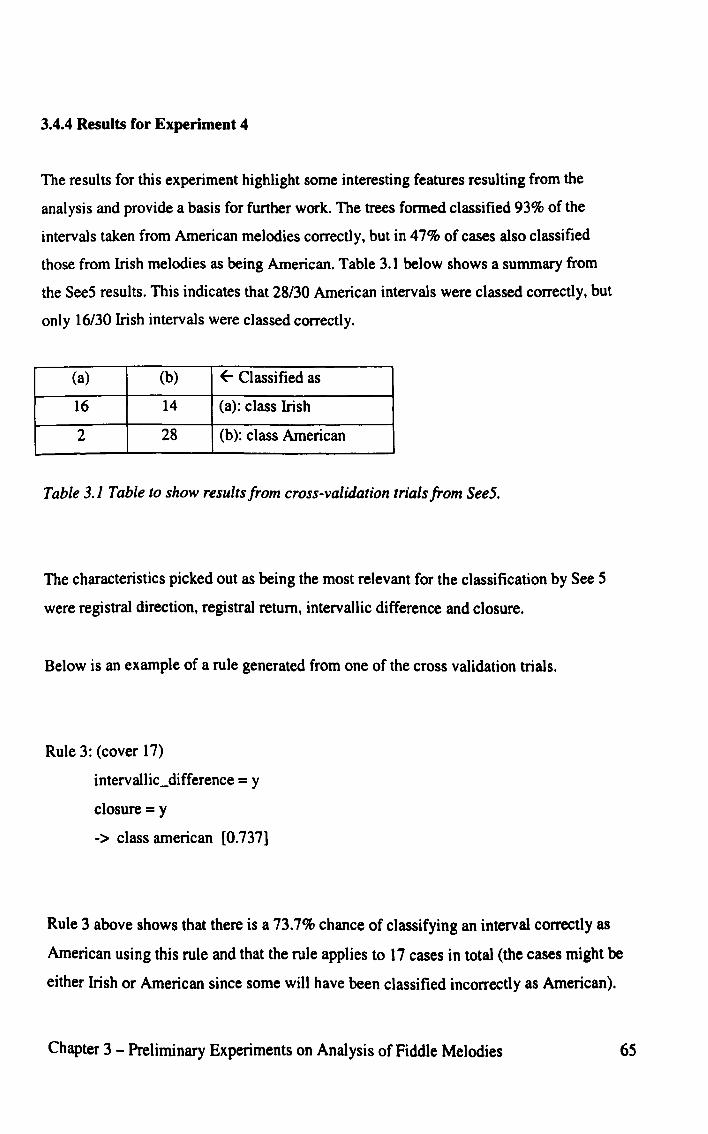
3.4.4 Results for Experiment 4
The results for this experiment highlight some interesting features resulting from the
analysis and provide a basis for further work. The trees formed classified 93% of the
intervals taken from American melodies correctly, but in 47% of cases also classified
those from Irish melodies as being American. Table 3.1 below shows a summary from
the SeeS results. This indicates that 28/30 American intervals were classed correctly. but
only 16/30 Irish intervals were classed correctly.
(a) (b) ~ Classified as
16 14 (a): class Irish
2 28 (b): class American
Table 3.1 Table to show results from cross-validation trials from See5.
The characteristics picked out as being the most relevant for the classification by See S
were registral direction, registral return, intervallic difference and closure.
Below is an example of a rule generated from one of the cross validation trials.
Rule 3 : (cover 17)
intervallic_difference = y
closure = y
-> class american [0.737]
Rule 3 above shows that there is a 73.7% chance of classifying an interval correctly as
American using this rule and that the rule applies to 17 cases in total (the cases might be
either Irish or American since some will have been classified incorrectly as American).
Chapter 3 - Preliminary Experiments on Analysis of Fiddle Melodies 65
The Irish implicative intervals tended to be fulfilled with respect to registral direction and
registral return and unfulfilled with respect to intervallic difference. The American
intervals tended to be fulfilled with respect to intervallic difference and closure.
3.4.5 Discussion of Results and Conclusion
The most important discriminators have been identified as registral direction, registral
return, intervallic difference and closure. The experiment shows that some of the
characteristics identified by the IR model can be used to discriminate between the origins
of the melodies but that some cannot; but what does it mean if, for example, some
intervals are more likely to be fulfilled with respect to registral direction, or closure etc?
It is possible to trace back to the interval on the scored music for each case that satisfies a
particular rule, to enable an interpretation of what these rules mean in terms of the music.
For this preliminary experiment this process was not carried out. The reason for this is
that the main purpose of this preliminary experiment is to investigate the potential of the
IR model in the context of folk dance melodies using a small sample. The results show
that it does highlight differences between the two types of melodies examined and that
further experiments with larger samples would be worthwhile. The further experiments
are described in Chapter 4.
The following section examines the results of this experiment in the light of those
described in Sections 3.2 and 3.3.
3.5 General Discussion of Preliminary Experiments
The results of experiment 1 showed that GTTM analysis enabled a series of
characteristics to be derived for each melody and that there were commonalities between
the Irish and American melodies with respect to some of the attributes, and differences
with respect to others. These results were shown to have similarities with the ways in
which human listeners classed the melodies after a period of training. Experiment 3
Chapter 3 - Preliminary Experiments on Analysis of Fiddle Melodies 66

which used a statistical approach also enabled successful classification according to some
of the attributes, and some of the attributes identified by this approach had similarities
with those identified by GTTM. Experiment 4 has given a different set of attributes, and
some of these enabled the identification of differences between the origins of the
melodies.
In general then, it seems that the approaches to analysis do complement each other and
that they can each tell us something useful about the characteristics of the melodies.
Some of them overlap in terms of what they identify as important characteristics but this
is not a problem, in fact it is interesting in its own right as it tells us more about how the
different approaches relate to each other. Chapter 6 gives an account of a proposed
integrative approach to analysis. The suggested approach combines the features of the
techniques employed in these experiments.
One of the problems of such experiments is the time factor. A great deal of time is taken
in analysing the melodies manually, and then preparing the results of the musical analysis
for classification and hence interpretation with See5 (or some other classification or
statistical process). This leads to a requirement for an automatic (or computer) tool as a
way of speeding up the music analysis process. In order to develop such an aid however,
it is necessary to consider the most appropriate way in which to approach this,
particularly with respect to representation of the musical data on computer. Chapter 5
considers the issue of music representation.
Chapter 4 describes further experiments in which a larger sample of melodies are
analysed according to GTIM and the IR model. The new melodies are not analysed
according to O'Canainn's method since the conclusion earlier observed that results with
this method were poor and not as informative as GTIM and the IR model. Also there are
other statistical methods already available that could be used, in particular the statistical
facilities of the Humdrum toolkit (Huron, 1995).
Chapter 3 - Preliminary Experiments on Analysis of Fiddle Melodies 67
CHAPTER 4 - Further Experiments
4.1 Introduction
This Chapter describes three further experiments and a discussion of inductive
learning techniques. The first (Section 4.2) was designed to remove certain
ambiguities that occur when applying GTTM analysis to folk dance tunes. The second
(Section 4.3) describes the analysis of 60 folk dance melodies for violin using GTTM,
and the third (Section 4.4) describes the analysis of the same melodies using the IR
model. The results are discussed in Sections 4.3.2 and 4.4.2 respectively. All of the
experiments so far have used SeeS where classification was required. Section 4.S
discusses classification techniques; in particular an alternative decision tree induction
tool known as CART (Friedman, 1977) and more generally the potential of neural
networks as classifiers for this type of problem. The Chapter concludes by proposing
a integrated approach for the analysis of the folk dance melodies for violin.
4.2 Experiment to Remove Ambiguities in GTTM Analysis
4.2.1 Motivation for the Experiment
It was observed in the preliminary experiment (Chapter 3) that when analysing
melodies using GTTM, certain conflicts were apparent. Carrying out GTIM analysis
on a piece of music can require decisions to be made by the analyst from time to time.
The usual reason for this, is that GPR 1 states that small groups should not be
preferred, yet occasionally there are potential group boundaries that would result in a
small group (of one or two notes for example). On occasions like this it is necessary to
decide which of the group boundaries is likely to be preferred by a typical listener.
Lerdahl and lackendoff give some advice about this indicating that in general the
order of preference would be GPR2a, GPR3b, GPR2b, then GPRs 3a, 3c and 3d but
they do not give a preferred order for these last three. They also do not give
weightings to these and suggest that it could be an area for further research
particularly for potential computer applications, though they do not believe this to be
necessary for their own work, preferring to leave room for the intuitions of the
analyst. Oeliege (1987) carried out experimental research to establish an order of
Chapter 4 - Further Experiments 68

salience for the rules (see Chapter 2) and found that there are different orders for
musicians (two years experience of musical training or more) and non-musicians. The
order of salience of the rules for musicians was slightly different to that of the non
musicians and there were some differences between her results and the order
suggested by Lerdahl and lackendoff. Later publications by Lerdahl and lackendoff
(1996) and Lerdahl(200 1) have not included any changes as a result of the work by
Deliege. Since the investigations into the Irish and American melodies are intended to
be based on GTTM as it is described by Lerdahl and lackendoff, the order of likely
preference of the rules where there is conflict was taken from their work rather than
that of Deliege. Where there was potential for further conflict a decision had to be
taken, and for this reason the experiment described in this section was carried out.
Having already completed the analysis of 30 melodies using GTTM it was observed
that occasionally there were conflicts as described above when applying the GPRs. An
experiment was therefore devised to find out the preferred groupings assigned by
listeners when hearing such conflicts in short musical sequences taken from or
designed to be similar to the American and Irish melodies. The results of this
experiment enabled the conflicts to be resolved both in the preliminary analysis using
GTTM and also in the analysis of the additional 30 used in the experiment described
in Section 4.3. Preliminary work on these showed similar conflicts arising.
4.2.2 Method
The experiment included conflicts that had been observed to happen in the set of 60
melodies and that could not be resolved by using the order of preference suggested by
Lerdahl and lackendoff. Future work could include a full test of all possible conflicts
in this context. The possible conflicts that needed to be tested are those listed below.
• GPR2b against GPRs 3c and 3a
• GPR2b against GPRs 3d and 3a
• GPR2b against GPRs 3d and 3c
Although GPR2b is preferred above GPR3c and above GPR3a, some potential group
Chapter 4 - Further Experiments 69

boundaries might be due to more than one GPR. This poses the question 'do rules
such as GPR3c and GPR3a when both apparent at a potential boundary override the
preference for GPR2b?' . Hence the above tests needed to be carried out. There is only
a limited way in which to compare GPRs 3d and 3c together or GPRs 3d and 3a
against GPR2b. This is because it is not possible to have GPR3d occurring either one
or two notes before GPR2b due to the patterns of notes required by the definitions of
the rules, nor is it possible for GPR3d to occur one note after GPR2b. It is possible for
GPR3d to occur 2 notes after GPR2b and so this conflict was tested. GPR3b was not
required in any of the analyses and so was not tested in any way. However, Lerdahl
and lackendoff did not give an order of preference for GPRs 3a, 3c and 3d, yet these
did cause potential conflicts and so each of the following pairs were also tested.
• GPR3d against GPR3c
• GPR3a against GPR3c
• GPR3a against GPR3d
Short sequences of tunes were either taken directly or adapted from the melodies in
order to have ten sequences of notes that exhibited each of the above conflicts. The
reason for the adaptations was that in some cases there were not any suitable
examples of the conflict in question and in others there may have been further non
conflicting group boundaries in the sequence of notes as well as the two under
conflict, and it was therefore necessary to remove these for the purposes of the
experiment. All of the sequences were six to eight quarter beats in length. There were
two examples for each possible conflict and the order of the conflicting rules was
reversed for each, i.e. there was a sequence that firstly had a potential group boundary
due to GPR3d followed by a potential boundary due to GPR3c; then there was another
sequence that firstly had a potential boundary due to GPR3c followed by a potential
boundary due to GPR3d. The sequences were recorded by the author on a violin and
played to the subjects (A score representation of the fragments can be found in
Appendix EI). A pilot study showed that it was necessary to play the sequences once
at a slower pace than the natural speed to enable the listeners to be able to describe
where they thought the boundary was. The subjects were allowed to listen to the
sequences as many times as they felt necessary to make a decision (it was decided to
Chapter 4 - Further Experiments 70
do this because the pilot study showed it necessary and in the Deliege (1987)
experiment the subjects were allowed to do this.) Ten subjects were played the
sequences and instructions to the subjects were given verbally and were as follows:
• You will be played 10 short excerpts from folk dance melodies. Each one will
be played initially three times and one of these occasions it will be at a slightly
slower pace. Your task is to say if you think you would naturally divide the
sequence of notes into groups or segments and if so to describe to me where
the most prominent place for the group boundary is in your opinion. Although
the sequences are only played initially three times, you can listen to them as
many times as you like before making a decision. '
The subjects all had some musical experience (either as trained or self taught
instrumentalists). They described where they felt the group boundary should be and
this was noted by the author. along with any additional comments volunteered.
4.2.3 Results
The results are presented in the table in Appendix E2 and are summarised below.
(i.) GPR3a conflicting with GPR3c. Both examples with conflicts between these two
rules resulted in a preference for GPR3c. 5110 subjects picked GPR3c in the first
example where 3c caused the second potential boundary. None picked GPR3a in this
example. 4/10 picked a point that was on the bar line and that also represented a place
where repetition of the first four notes took place. This could point to the influence of
parallelism. GTTM recognises parallelism but as a higher level grouping (not at the
local level). Second level groupings re-enforce lower group boundaries. At the point
where parallelism is evident in the excerpts. there are no lower level group boundaries
and hence there would be no higher level boundaries either. This could suggest a
variation in the implementation of GTTM at the lower level when applied to these
types of tunes where group boundaries due to parallelism are identified at the lower
level. This experiment was not designed to test for this however so this observation
can be used as a reason to propose further experiments and will be discussed more
fully in Chapter 7 on future work.
Chapter 4 - Further Experiments 71

(ii.) GPR2b conflicting with both GPR3c and GPR3a. The majority of subjects picked
GPR2b as the group boundary regardless of the order. Though in the example where
GPRs 3a/3c were after GPR2b, 4/10 people picked GPRs 3a/3c (6/10 picked GPR2b).
This could be to do with the order, but it could also be that there is a preference for
group boundaries at a later point or nearer to the middle in short excerpts such as
those used in these examples.
(iii.) GPR2b conflicting with GPRs3c/3d and 3a/3d. The majority of subjects picked
GPR2b (7/10 and 8110) respectively. In both of these examples GPR2b was the first
potential boundary. The order may therefore not be particularly significant but, a
tendency to listen for a boundary somewhere near the middle of the excerpt is still
possible.
(iv.) GPR3a against GPR3d. For these two the order did appear to be significant.
Where GPR 3a was first, 4110 picked GPR3d and only 1110 picked GPR3a. Where
GPR3d was first 7/10 picked 3a and only 2110 3d. In both cases some subjects picked
group boundaries where GTTM did not predict any.
(v.) GPR3c against GPR3d. Where GPR3d was the first potential boundary, 5/10
picked 3d and 3/10 picked GPR3c. Where GPR 3d was first 4/10 subjects picked
GPR3c and only 1110 picked GPR3d. The second highest preference here was 'after 5
notes' which is one note after the position of the potential boundary GPR3d. This
shows some similarities with the findings of Deliege (1987) described in Chapter 2.
Her experimental results showed a preference for a postponed segmentation (by one
note) when GPR3d is evident and the second pair of notes surrounding the potential
group boundary according to GTIM are each longer than the first pair. Again there is
potential here for further investigation and this is discussed further in Chapter 7 on
future work.
These results enable an order of preference to be derived where conflicts are likely to
occur and used in addition to the order of preference as suggested by Lerdahl and
Jackendoff, it is possible to eliminate the ambiguities when analysing the melodies.
Chapter 4 - Further Experiments 72

These results indicate that where there is a conflict of potential boundaries:
• GPR3c is preferable to GPR3a regardless of the order in which they occur.
• Where the order of occurrence is GPR3d then GPR3c, GPR3c is preferable to
GPR3d.
• Where the order of occurrence is GPR3c then GPR3d, GPR3d is preferable to
GPR3c.
• Where the order of occurrence is GPR3a then GPR3d, GPR3d is preferable to
GPR3a.
• Where the order of occurrence is GPR3d then GPR3a, GPR3a is preferable to
GPR3d.
• GPR2b is preferable to any combination of pairs of GPR3a, GPR3c and
GPR3d.
Lerdahl and lackendoff (1983) provide the following infonnation:
• GPR2a has the highest preference, followed by GPR3b, then GPR2b, and then
GPRs 3a, 3c and 3d.
In addition to the above, it was taken that any group boundary implied by two out of
3a, 3c and 3d, would be of a higher preference to a conflicting boundary with only
one of these boundaries.
4.2.4 Discussion and Conclusion
Lerdahl and lackendoff give a general order of preference for the lower level GPRs
where there is conflict but the preliminary experiments showed that this does not
account for all possible conflicts. The experiment described in the previous section
showed that there was a pattern to the preferences of listeners in the context of the
dance melodies for those conflicts not covered in Lerdahl and Jackendoffs text. The
results of this experiment therefore enabled the GTIM analysis described in Section
4.3 to be carried out in an algorithmic way, and as indicated in Chapter 3, the
preliminary experiments were revisited in order to apply the preferences to the
Chapter 4 - Further Experiments 73

observed conflicts in those melodies.
Although usable patterns were observed in the results there were also,other
observations that suggest potential for further study in this area. For example, it was
observed that a small number of the subjects chose the postponed groupings as found
by Deliege (described in Chapter 2), and two subjects raised this after the experiment,
observing that they had had difficulty choosing between what they saw as two
potential boundaries. This suggests potential for future experiments of the same nature
as those of Deliege (i.e. to find an overall order of salience for the GPRs with an
emphasis on testing preferences for postponed groupings) but in the context of folk
dance melodies. There is also evidence to suggest (again comments from two subjects
after the experiment) that the influence of parallelism on the choice of group
boundaries could cause conflicts in grouping preferences at the surface level. GPR6
(where a sequence of notes is heard to be the same as or close to another either at the
start or end of a group, known as parallelism) is a higher grouping preference rule in
GTTM which means it would be chosen to re-enforce existing lower level group
boundaries. However the occasions where the two subjects felt there could be a group
boundary due to what they described as repetition were at places in the music where
there were no potential group boundaries according to the other low level GPRs. This
might suggest that parallelism in this context could be investigated as a lower level
preference rule rather than a higher level preference rule as indicated by Lerdahl and
lackendoff. Further experiments to investigate this are proposed in Chapter 7 on
future work.
The next section describes the analysis of sixty melodies for violin using GTIM.
Where there were conflicts regarding potential boundaries, the likely preference of a
listener was decided according to the order of preference as defined by Lerdahl and
lackendoff (see above), and where this was not enough to resolve the ambiguities, the
likely preference was decided according to the result of the experiment described
earlier in this Section.
Chapter 4 - Further Experiments 74
4.3 Analysis of Melodies Using GTTM
4.3.1 Method
For this experiment a further thirty melodies were selected to add to those used in the
preliminary experiment described in Chapter 3. These needed to be taken from wider
sources to ensure that the differences in characteristics identified in the preliminary
experiments were not just due to the sources. There are many sources of tunes
available and in order to get a truly representative sample they need to be selected
using an appropriate methodology. Brody (1983) in the Fiddler's Fakebook has done
just this, and this book was therefore chosen as the source of the additional thirty
melodies. Brody wanted to compile a book of the most important and interesting
fiddle tunes for his pupils. In order to do this he catalogued a large number of tunes by
title and did a tally to find out which had been recorded most often as a way of
determining the foundation material for inclusion on the book. He then added to this
those pieces that he knew to be performed frequently though not necessarily recorded.
He listened to recordings of the tunes to find the most popular ways of playing them
(in terms of the notes, ornamentation and bowing) and transcribed them according to
his findings. This procedure took him four years to complete with the aid of a number
of people and can therefore be regarded as the most realistic compilation possible for
the purposes of these experiments.
The preliminary study used Irish reels and American Old Time melodies and hence
those chosen from Brody's book are also either Irish reels or American Old Time (or
Blue Grass). Old Time and Blue Grass melodies are derivative of Irish reels and it is
therefore interesting to study how the American melodies have changed since being
taken there by Irish emigrants. The tunes are all 16 bars long and usually have repeats.
When the analysis was carried out the repeats were ignored and only the second time
bars used in order to keep them all the same length. In one or two cases the melodies
were shorter (for example a four bar section A, and an eight bar section B), in these
cases the analysis was carried out still using the second time bar, but scaling the
number of attributes up to make it equivalent to a sixteen bar melody.
The melodies were photocopied from the sources and all sixty of these can be found
Chapter 4 - Further Experiments 75

in Appendix 1. The procedure for carrying out the analysis according to the lower
level grouping preference rules of GTTM was as follows. The score for each tune was
examined and all of the potential group boundaries were marked in pencil. It was then
necessary to look for conflicts of boundaries, since GPRI does not allow for small
groups. This is described as meaning no groups with only one note and probably none
with two notes. For the purposes of this experiment it was decided not to allow groups
of either one or two notes, but three or more would be allowed. Where conflicts were
observed between potential group boundaries within one or two notes of each other,
one of the boundaries would be crossed out according to the order of preference
determined in Section 4.2.3. The conflicts were marked with a cross in pencil on the
scores. Where two notes were played simultaneously (a double stop) the upper note
was taken. For each of the melodies the potential boundaries due to each GPR were
totalled and noted on the same sheet. Similarly the crosses (indicating GPRI being
invoked) were totalled. For incidences of GPR3a ( a larger pitch gap between notes n2
and n3 than that between n 1 and n2 and between n3 and n4, in a sequence of notes n 1,
n2, n3, n4.) a decision was taken to only count intervals between n3 and n4 that were
a perfect fourth or more (5 semitones). The reason for this was that counting smaller
intervals would result in a very large number of potential boundaries due to GPR3a in
these melodies, which would in tum result in a large number of incidences of GPRI
due to conflicts, all of which would lead to an analysis more removed from the kind
GTTM aims for. Finally, the number of occurrences of triplets was counted and noted.
The metrical structure was not indicated on the sheets as it is possible to see by eye
that it would be the same for all of the melodies (as in the preliminary experiments),
only the occurrence of triplets indicating a deviation from the metrical structure was
noted.
The attributes that were derived from this analysis were passed through the decision
tree induction software, SeeS (Quinlan, 1998) as discussed in Chapter 3. The data was
analysed with SeeS using cross-validation trials (10 trials as used in the preliminary
experiments). The new data was first tested on its own to compare the results using
the initial set of melodies with those from the new source. The two sets of data were
then combined enabling a total of sixty cases to be used in the cross validation trials.
Chapter 4 - Further Experiments 76

4.3.2 Results and discussion
The data resulting from the analysis of the melodies taken from Brody enabled 14115
American tunes to be classified correctly and 9115 Irish tunes to be classified correctly
after cross validation trials with ten folds. This is higher for the American tunes, but
lower for the Irish tunes than in the preliminary experiments described in Chapter 3.
The primary reason for classification of the melodies was still metrical deviations, but
with the new data, there was greater use of other GPRs in order to classify the
information. The results can be summarised as shown below.
Tendencies for Irish melodies:
• Higher number of metrical deviations (due to incidence of triplets)
• Higher number of occasions where GPR3d was invoked (related to triplets, see
results of Experiment 1 in Chapter 3).
• Lower incidence of GPR1, meaning that there were fewer conflicts of
potential group boundaries.
Tendencies for American melodies
• Higher number of occasions where GPR2b was required caused by more
variation in the rhythm.
• Higher number of occasions where GPR3a was required caused by the
tendency for larger pitch gaps between consecutive notes.
• Number of occasions where GPR3c (change in articulation caused by onset or
completion of a slur) was greater than 5 or less than or equal to 9 for American
melodies.
Although there were some differences between the reasons for classification of the
two sets of data, there were also substantial similarities and it could still be beneficial
to combine the results to give a larger dataset for use with See5. The results of the
cross validation trials with the full set of 60 melodies are summarised below:
With ten folds 70% of the melodies were classified correctly (22130 classed correctly
as Irish, 21130 classed correctly as American), and with twenty folds 77% were
Chapter 4 - Further Experiments 77

classified correctly (23/30 for both Irish and American). The reasons can be
summarised in the same way as those above for the melodies taken from Brody.
In conclusion, the analysis of the sixty melodies according to the grouping preference
rules of GTTM (and limited information resulting from the application of metrical
preference rules) does provide enough information about the two types of melodies to
enable classification to take place. Classification of the analysis results using SeeS is
transparent, enabling the reasons and hence specific musical features of the two
classes of melodies to be identified. Section 4.4 describes the analysis of the same
sixty melodies using the IR model.
4.4 Analysis of Melodies using the IR model
4.4.1 Method
The thirty melodies taken from Brody (1983) were analysed using the IR model in the
same way as in the preliminary experiment described in Section 3.4. Photocopies of
the scores from the preliminary sources and from Brody (available in Appendix Al -
A4) were used to identify suitable implicative intervals. The interval was to be
selected as detailed in Section 3.4.2 (i.e. the first interval of the third bar in sections A
and B of each melody, and where this interval did not meet the criteria for being
implicative according Krumhansl's criteria (1995), then the next suitable interval was
taken). The intervals used are marked on the score with a pencilled rectangle around
them. Each interval and its continuation note (i.e. the note immediately after the
second note of the interval) were checked for either fulfilment or denial against each
of the five implicative principles of the IR model (described more fully in Section
3.4). The results for each interval were noted as either y or n (yes or no) on a result
sheet (an example of a blank result sheet can be found in Appendix D). The
information could then be written into a text file for potential classification with SeeS.
The same attribute names were used as in the experiment in Section 3.4 and these
were as shown below (taken from Section 3.4).
Chapter 4 - Further Experiments 78

interval_size: s,L. (i.e. small or large)
registral_direction: y, n. (y if fulfilled, n if denied)
intervallic_difference: y, n.
registral_retum: y, n.
proximity: y, n.
closure: y, n.
position: 1,1.5,2,3,4,b4_1,b4_2.
As described in Chapter 3, attributes 2 to 6 represent the five implicative principles of
Narmour, and it should be noted that the sixth attribute, regarding closure, was only
classed as 'yes' when both elements of closure as described by Thompson and
Stainton (1998) were satisfied. The seventh attribute 'position' was given a set of
allowed values. These can be interpreted as follows: '1' refers to the first quarter beat
in the third bar, '2', to the second and so on, '1.5 refers to the third eighth beat in the
third bar (i.e. falling between' l' and '2') and b4_1 and b4_2 refer to the first and
second quarter beats in the fourth bar respectively. If any other positions had been
noted in the analysis then these would also have been included in the list of allowed
values.
Although there were some differences in the proportions of intervals classified as
either Irish or American, the reasons were generally the same as for the preliminary
experiment. This meant that it was a reasonable decision to amalgamate the two sets
of data to give a bigger sample (SeeS is more efficient with bigger samples). The data
was therefore amalgamated and passed through SeeS again, using the same set of
attributes as described above.
4.4.2 Results and Discussion
The results for the preliminary experiment described in Section 3.4.5 showed that
analysis according to the IR model enabled classification of the intervals from
American melodies successfully (93% classified correctly), but the classification of
those from Irish melodies was poor (only 53% classified correctly). When the second
set of intervals from the new melodies (taken from Brody, 1983) were analysed, this
gave better results.
Chapter 4 - Further Experiments 79

(a) (b) ~ Classified as
19 11 (a): class irish
10 20 (b): class american
Table 4.1 Table to show results/rom cross-validation trials from See5.
Approximately 66% of each was classified correctly using See5 with cross validation
trials (10 folds).
The main reasons for the classifications were generally the same as in the preliminary
experiment in Chapter 2. The Irish implicative intervals tended to be fulfilled with
respect to registral direction and registral return and denied with respect to intervallic
difference. The American intervals tended to be fulfilled with respect to intervallic
difference and closure. However in addition to this it was noted that there was a
higher tendency for intervals from the Irish melodies to be fulfilled with respect to
pitch proximity and a tendency for the intervals from American intervals to be denied
with respect to this. Also, most of the intervals from American melodies were at the
first choice of position (Le. the fist interval in the third bar) whereas a higher number
were at later position for the Irish intervals.
For the amalgamated results, the classification was as follows:
(a) (b) ~ Classified as
34 26 (a): class irish
14 46 (b): class american
Table 4.2 Table to show results from cross-validation trials from SeeS.
This means that 57% of the intervals from the Irish melodies were classified correctly,
and 77% of the intervals from American melodies were classified correctly. The
reasons were the same as described above (using melodies from Brody, 1983).
Chapter 4 - Further Experiments 80

What do these results mean in terms of musical features? With the GTIM analysis,
the results of the classification process with SeeS were relatively easy to interpret; for
example a higher incidence of GPR2b means that there are more long notes relative to
surrounding notes, the a higher incidence of GPR3a means that there are more larger
intervals, and so on. With the IR model it is not so easy to translate the results back
into musical features. What does is mean in terms of the musical surface, if an interval
is fulfilled with respect to intervallic difference or registral return? An additional
feature of SeeS enables the results to be tracked back to their source in the original
data; this feature is known as cross referencing. It allows the user to look at a list of all
the rules against all of the cases. The cases have an indicator against them to show
whether or not they were classified correctly. Clicking on any case shows which rule
was used to classify it, and clicking on any Rule shows which cases were classified
(correctly or incorrectly) using that rule. The cases are all numbered and as along as
the original scores of the melodies used for the analysis process are also numbered it
is possible to relate back to the intervals concerned.
The table below gives a summary of the tendencies of both types of melody in terms
of fulfilment and denial with respect to each of the five bottom-up principles of the IR
model. It is interesting to note that all five principles featured in the classifications.
Position is included in the table as this featured as a characterising attribute in the
classifications but interval size did not feature and is therefore not included.
American Melodies Irish Melodies
Registral Direction Denied Fulfilled
Reglstral Return Denied Fulfilled
Intervallic Difference Fulfilled Denied
Pitch Proximity Denied Fulfilled
Closure Fulfilled Denied
Position First interval in bar three Later position in third or
fourth bar
Table 4.3 Tendencies for fulfilment or denial of intervals taken from Irish and
Chapter 4 - Further Experiments 81
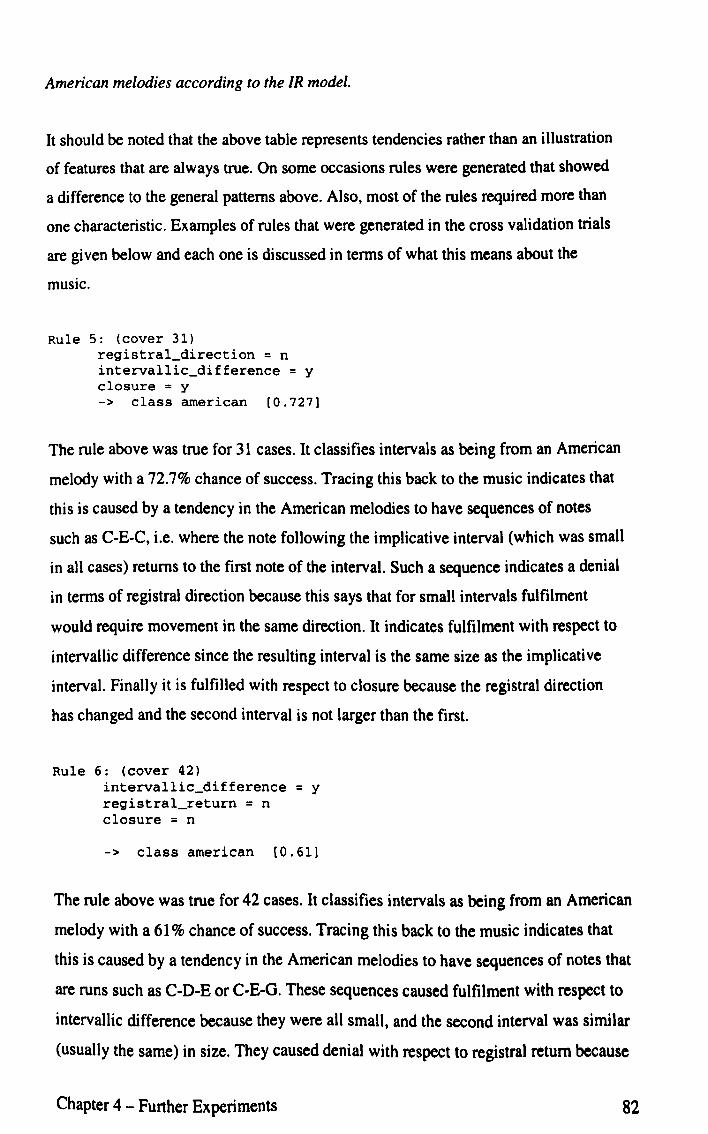
American melodies according to the IR model.
It should be noted that the above table represents tendencies rather than an illustration
of features that are always true. On some occasions rules were generated that showed
a difference to the general patterns above. Also. most of the rules required more than
one characteristic. Examples of rules that were generated in the cross validation trials
are given below and each one is discussed in terms of what this means about the
music.
Rule 5: (cover 31) registral_direction = n intervallic_difference = y closure :: y -> class american [0.727]
The rule above was true for 31 cases. It classifies intervals as being from an American
melody with a 72.7% chance of success. Tracing this back to the music indicates that
this is caused by a tendency in the American melodies to have sequences of notes
such as C-E-C. i.e. where the note following the implicative interval (which was small
in all cases) returns to the first note of the interval. Such a sequence indicates a denial
in terms of registral direction because this says that for small intervals fulfilment
would require movement in the same direction. It indicates fulfilment with respect to
intervallic difference since the resulting interval is the same size as the implicative
interval. Finally it is fulfilled with respect to closure because the registral direction
has changed and the second interval is not larger than the first.
Rule 6: (cover 42) intervallic_difference = y registral_return = n closure = n
-> class american [0.61)
The rule above was true for 42 cases. It classifies intervals as being from an American
melody with a 61 % chance of success. Tracing this back to the music indicates that
this is caused by a tendency in the American melodies to have sequences of notes that
are runs such as C-D-E or C-E-G. These sequences caused fulfilment with respect to
intervallic difference because they were all small. and the second interval was similar
(usually the same) in size. They caused denial with respect to registral return because
Chapter 4 - Further Experiments 82

the third note does not show a return to the first note of the implicative interval (or to
a note within two semi tones of the first note). They caused denial with respect to
closure because of failing to have a change in registral direction, this shows a
difference in the general tendency for fulfilment with respect to closure in American
melodies as indicated in the table above.
Rule 4: (cover 23) intervallic_difference = n -> class irish [0.727)
The rule above was true for 23 cases. It classifies intervals as being from an Irish
melody with a 72% chance of success. Tracing this back to the music indicates that
this is caused by a tendency in the Irish melodies to have sequences of notes where
the realized tone is more likely to be the same as the 2nd tone in the implicative
interval e.g. G-E-E, E-C-C. Such a sequence of notes fails with respect to intervallic
difference because for a small interval (which they all were) intervallic difference
requires the interval created by the continuation note to be either the same size or
within +/- two semi tones of the implicative interval where the registral direction
changes. In the note sequences such as those above the registral direction has changed
to lateral and the second interval is zero semi tones in size compared to the size of the
implicative interval (three and four semi tones respectively for the examples given
above).
Rule 1: (cover 14) registral_return = y closure = n -> class irish [0.875)
The rule above was true for 14 cases (one of which was wrongly classified as
American). It classifies intervals as being from an Irish melody with an 87.5% chance
of success. Tracing this back to the music indicates that this is caused by three
tendencies in the Irish melodies. The highest number of cases classified as Irish (7/13)
was sequences of notes that were all the same e.g. C-C-C or E-E-E and so on. Such
sequences of notes show fulfilment with respect to registral return because the
continuation tone is in unison with the first note of the implicative interval, and denial
with respect to closure because there is no change in registral direction (the movement
Chapter 4 - Further Experiments 83

between the three tones is lateral - lateral}. Another type of interval that satisfied this
rule were where the implicative interval consisted of two notes of the same pitch, and
the continuation tone was a movement of just one or two semi tones, e.g. G-G-F, F-F
E (3/13). These intervals are fulfilled with respect to registral return because the
continuation tone is still within one or two semi tones of the first tone of the
implicative interval. They fail with respect to closure because although they have a
change in registral direction (required for closure) the second interval is larger than
the first. Finally a further 3/13 of the intervals were of a pattern where the implicative
interval was either a third or a fourth and the subsequent interval was two semitones
larger (hence failing with respect to closure but still being fulfilled with respect to
registral return) e.g. E-G-D, A-F-B.
Some of the examples of rules above are referring to small numbers of intervals, but it
is the combination of these with the rules that refer to larger numbers of intervals that
enable SeeS to classify a large proportion of the intervals overall successfully. The
interpretations of the rules, allowed by the facility for cross referencing with See5,
enables patterns in the two types of melodies to be identified. It would be more useful
for building a profile of the melodies to be able to do this for all implicative intervals
rather than just two for each melody. This would be far too time consuming to be
carried out manually and therefore suggests that a computer analysis tool to carry out
the task would be helpful. This raises more issues, in particular that of representation.
The representation of music on computer has been the focus of much research and a
discussion of the possible approaches that might suit the requirements for this work is
presented in Chapter 5. The next section examines alternative approaches to inductive
learning techniques for classification and compares them to See5.
4.5 Comparison of Approaches to Inductive Learning
4.5.1 Background to Inductive Learning
Inductive learning techniques come under the broader umbrella of machine learning.
Machine learning is an important part of Artificial Intelligence (AI). Humans learn
from their mistakes but in contrast programs always work in the same way; if there is
an error in the code that causes a mistake to occur then that mistake will be repeated
Chapter 4 - Further Experiments 84
every time that part of the code is executed. In order to build 'intelligence' into our
programs we need them to be able to learn from their mistakes and adapt. Programs
that learn enable more complex tasks to be carried out.
There have been a number of different approaches to machine learning:
1. Rote learning: e.g. Samuels' checkers program uses the idea of data caching,
which involves searching a game tree, storing the computed values and then re
using these for later moves. Further work has been done to improve the storage
and access by indexing. This process results in the speeding up of the performance
the more games are played. (Rich and Knight, 1991)
2. Learning by taking advice: the program needs to be able to take vague advice and
turn generalised instructions into rules.
3. Learning from problem solving: again Samuel's checkers program exhibits this by
using the idea of coefficient adjustment to improve performance.
4. Inductive Learning: Inductive learning enables theories to be derived from a
series of facts. Examples of approaches to this are Winston's learning program,
version spaces, decision trees and neural networks. Inductive learning is
particularly good for classification purposes.
S. Genetic learning: these are searching techniques based on the principles of natural selection and natural genetics.
The two machine learning techniques that are the most effective for classification
problems are decision tree induction and neural networks. These have been shown to
give comparable results (Dawson et al. 2(00) when used in certain domains. The two
approaches work in quite different ways and one of the drawbacks of the neural
network approach is that it is difficult to see how the classification was made since it
is a black box method, whereas with decision trees it is possible to learn a lot more
about the application area by studying the results of how the classification was made.
The following sections discuss each of these in tum and show how the classification
of the melodies using SeeS compares with other approaches.
Chapter 4 - Further Experiments 85

4.5.2 Overview of the ID3 Family of Algorithms for Indudive Learning
The most well known algorithm for decision tree induction is Quinlan's 103, and the
most recent version of this is known as C5. This has been implemented as a tool that
builds decision trees automatically given positive and negative instances of a concept,
the current version being the previously discussed See5. 103 starts by choosing a
random subset of training examples and this subset is known as the window. It then
builds a tree that correctly classifies all examples in the window. It then tests the tree
on the training examples outside the window and if all of the examples are classified
correctly the algorithm halts, otherwise it adds a number of training examples to the
window and the process repeats. In order to do this the algorithm calculates the
entropy and from that the information gain for each attribute. Entropy can be defined
as a measure of disorder in a closed system and more specifically it is a measure of
the impurity in a collection of training examples when used in the context of
classification tasks. Information gain is defined by Mitchell (1997, 57) as "a measure
of the effectiveness of an attribute in classifying the training data [and] is simply the
expected reduction in entropy caused by partitioning the examples according to this
attribute". The information gain for each attribute is calculated by subtracting the
entropy for each attribute from the total entropy for the system. The attribute with the
highest information gain is chosen as the root node of the decision tree, the process is
repeated using the remaining attributes in order to build each subsequent layer in the
tree.
103 was originally designed for use with attributes that had discrete values. The
subsequent version (C4.S) was a radical improvement on this since it allowed
attributes to have continuous values. CS (the software tool version is known as SeeS)
was an improvement in the sense that it enabled the decision trees to be built much
more quickly than earlier versions and as a result is the most frequently used tool of
this nature. Another popular data mining tool that builds decision trees is CART
(Friedman, 1977). This tool is also based on ID3. The next section gives a brief
overview of CART and compares the results of this when used with data from the
experiments in Sections 4.3 and 4.4 with those using SeeS.
Chapter 4 - Further Experiments 86

4.5.3 Results and Discussion Using CART
The data from the analysis of the melodies according to GITM was passed through
the CART data mining tool for classification purposes. The software builds decision
trees based on the data and also provides output in the form of rules. The results in the
discussion below are from cross validation trials with ten folds, both using entropy as
the basis for building the trees.
On passing the GTTM data through CART a tree with only three nodes and hence two
rules was built. The rules were If metrical_deviations> 2.S then class = Irish, and If
metrical_deviations <= 2.S then class = American. CART only used one attribute to
perform the classification and this enabled 63.33% of the Irish melodies to be
classified correctly and 83.33% of the American melodies to be classified correctly,
which is 73.33% accuracy overall (see table 4.4 below).
Using all attributes
American melodies Irish melodies Overall accuracy of
classified correctly classified correctly classifications
CART 25/30 = 83.33% 19/30 = 63.33% 73.33%
SeeS 24/30= 80% 20/30 = 66.67% 73.33%
Table 4.4 Summary o/results o/the classification resulting from G1TM analysis 0/ melodies with all available attributes, using See5 and CART.
This is good in terms of the classification but it only provides information about one
of the attributes. However, classification is not the main purpose of this activity; the
main purpose here is to make use of the classifications to enable further interpretation
of the data and to relate this back to features of the music. The reason that such a
small tree was produced is that CART shows a final pruned tree as the main result.
This can be grown to show a full summary tree of the cross validation trials. The
grown tree had four leaf nodes and used other GPRs in order to classify the melodies.
The classification accuracy overall was lower however (20/30 for the American
Chapter 4 - Further Experiments 87

melodies, 23/30 for the Irish melodies which is 71.67 overall).
Pruning is used in decision tree induction software to prevent over-fitting of the trees.
Both CART and SeeS use a post-pruning approach (rather than pre-pruning) because
this approach tends to give better trees although it is computationally more costly. In
SeeS pruning is done by growing the decision tree, converting this into rules (one for
every path leading to a leaf node), pruning each rule by removing any rule antecedents
whose removal does not reduce its estimated accuracy, sorting the pruned rules by
their estimated accuracy and then using the rules in this order for subsequent
classifications (Mitchell, 1997). The pruning method used by CART is based on a two
stage algorithm called error complexity. The method of pruning in SeeS is such that it
results in the inclusion of more information than CART offers about the attributes and
the extent to which they are stylistic discriminators.
In order to find out if CART could provide more information about the melodies, the
data was passed through the software again, this time with the metrical_deviations
attribute de-selected as one to be considered in the classification. This time a bigger
tree with five nodes and six leaf nodes was produced. 73.33% of the American
melodies were classified correctly and 83.33% of the Irish melodies were classified
correctly (78.33% overall). See table 4.S below for a summary of these results.
Ignoring the metrical_deviations attribute
American melodies Irish melodies Overall accuracy of
classified correctly classified correctly classifications
CART 22130 = 73.33% 2S/30 = 83.33% 78.33%
SeeS 21130 = 70% 24/30 = 80% 75%
Table 4.5 Summary of results of the classification resulting from G1TM analysis of
melodies with all available attributes except metricaCdeviations, using See5 and
CART.
This time information relating to the GPRs of GTIM was used to enable the
classifications. The summary tree was of the maximum size here so it could not be
Chapter 4 - Further Experiments 88

grown further. In order to compare the results the data was passed through SeeS in the
same way. The tables below show how the results for the CART and SeeS compare.
Note that the results reported here for SeeS are different from those reported in
Section 4.2. This illustrates how different windows of attribute values are chosen each
time when using cross-validation trials, so that although the results are similar each
time, there is variation in the final output.
In table 4.4 SeeS classifies the data with a slightly greater accuracy and in table 4.5
CART classifies with slightly greater accuracy. These differences are not really
significant since repeated runs of both of the software tools give slightly different
results each time using the same data, for the reason explained above. Classification
using all of the attributes was less informative with CART unless the tree was grown,
since the resulting tree used only one of the attributes even though others are
important as classifiers. SeeS used more of the attributes for classification when all of
the attributes were used, though metricaLdeviations was used for the root node
indicating that this attribute had the highest information gain. Some of the generated
rules were almost the same with both tools. For example one of the rules generated by
SeeS said If metricaLdeviations > 2 then the class is Irish and if metrical_deviations
<=2 then the class is American, which is very close to the only rule produced by
CART when the metrical_deviations attribute was included. The difference is that the
boundary in SeeS was given as 2 and that with CART is given as 2.5. This difference
is to do with the way the algorithm has been implemented in the tool in order to deal
with continuous data. Since CART is based on 103 which only dealt with discrete
data, the approaches have diversified slightly. All boundaries in CART rules are at the
half way mark between whole numbers, whereas those in See5 are at whole numbers.
Continuous variables in both See5 and CART are handled by dynamically partitioning
continuous attributes values into discrete intervals.
Overall then there was little difference in terms of the classification between using
CART and See5. Slightly better information about which attributes are important in
the classification was provided by See5 and this was always the case however many
times the data was passed through the software. However, this can be overcome by
ignOring certain attributes as a way of finding out more about the others. Either
Chapter 4 - Further Experiments 89

system would be suitable as a classifier for data such as that available from the music
analysis experiments, but SeeS would be a better choice where further interpretation
of the results is required. For example, SeeS has the facility for cross referencing rules
to cases, and cases to rules, so that in this context the actual examples that caused a
rule to be generated can be examined. When carrying out the analysis according to the
IR model this was essential in order to establish what the analysis results meant in
terms of the musical surface.
SeeS is also very easy to use yet it provides very good facilities such as easy viewing
of all of the decision trees built when using cross-validation trials (CART does allow
for this, but all except the summary tree are not formatted in a very readable way).
The next section describes the neural network approach to inductive learning. A brief
background to neural networks is given, followed by results and a discussion of
classification trials of the GTIM analysis data using a neural network tool.
4.5.4 Classification Using a Neural Network
Neural networks are the result of investigations that involve using mathematical
formulations to model nervous system operations and they are used to learn patterns
and relationships in data. They can be given training data which is used to produce an
understanding of the factors involved in the problem and this can then be called upon
to provide predictions on test data. The neural network approach uses programs that
operate in a way that is loosely based on that of the animal brain. Such artificial neural
networks are said to learn from examples and their knowledge is stored in
representations that are distributed across a set of weights. In order to learn the
relationships in the data, algorithms are used. Neural networks are very good at
finding the inter-relationships between data and can handle situations where there is a
non-linear relationship between the explanatory factors and the outcome. However,
the results are not transparent in the same was as they are when using algorithms such
as CS. This means that it would be almost impossible to trace the reasoning back to
the musical surface when classifying the dance melodies as in the previous
experiment. Despite this it is still useful from a computer science point of view to find
out how well a neural network might compare as a classifier with the decision tree
Chapter 4 - Further Experiments 90

induction approach seen earlier. To this end the data from the GTIM analysis was
passed through a neural network using software known as Joone (Java Object
Oriented Neural Engine).
Preliminary experiments in which different epochs from 500 - 10000 were tried, as
were different transfer functions (sigmoid and logarithmic) and different numbers of
hidden nodes (10 - 20). The preliminary trials showed that the best classification was
achieved when a sigmoid function with 1000 epochs and 10 hidden nodes with a
learning rate of 0.7 and momentum of 0.6.
The results are summarised in table 4.6 below
Class \ Predicted American Irish
American 25 5
Irish 8 22
Table 4.6 Table to show classifications of melodies using GITM analysis and a
neural network tool.
Table 4.7 below shows how these classification results compare to those from CART
and SeeS.
American melodies Irish melodies Overall accuracy of
classified correctly classified correctly classifications
CART 25/30 = 83.33% 19/30 = 63.33% 73.33%
SeeS 24/30= 80% 20/30 = 66.67% 73.33%
Joone 25/30 = 83.33% 22130 = 73.33% 78.33%
Table 4.7 Table to compare classification results using GITM analysis and with
three different classification tools: CART, See5, and Joone (neural network)
Overall then 83.33% of the American melodies were classified correctly and 73.33%
of the Irish melodies were classified correctly hence 78.33% of the classifications
were correct overall. Comparing this to the results with SeeS shows that the overall
Chapter 4 - Further Experiments 91

percentage of correct classifications is slightly better (73.33% with See5) and that the
distribution between percentage of correct American and correct Irish classifications
are similar. Overall then the classification using the neural network tool is better,
however the reasons for the classifications can be examined when using SeeS or
CART but with the neural network approach we only have the final results to
consider. The mechanism is a black box approach. It can therefore be concluded that
neural networks are not well suited to problems of this particular nature where reason
for the classifications need to be known. However, the experiment shows that in this
context, and where classification is the main purpose (without further interpretation of
the reasoning) then neural networks are likely to be a good solution. Also it suggests
that musical data of this nature can provide a suitable context for experimental work
with neural networks.
4.5.5 Formal Comparison of Classifiers
The discussion in sections 4.S.3 and 4.5.4 examined the results of classification of the
melodies using three methods of classification, namely SeeS, CART and a Neural
Network (Joone). The comparison took into consideration the results in terms of
accuracy of classification, and the information available about the reasons for the
classification.
A more formal way of comparing the approaches in terms of the accuracy of
classification is possible using Receiver Operating Characteristics (ROC) analysis.
ROC graphs are used widely in medical decision making but more recently have been
adopted by researchers in the areas of Machine Learning and Data Mining. A ROC
graph can be plotted that gives a visual summary of the relative suitability of
classification approaches according to the accuracy of their results from a given set of
test data.
In order to plot a basic ROC graph for classifications that have two possible classes, it
is necessary to calculate values known as True Positive (TP) rate and False Positive
(FP) rate. The TP rate is plotted on the Y axis and FP rate on the X axis. The first step
Chapter 4 - Further Experiments 92

towards this requires the construction of a confusion matrix (or a contingency table) in
the form shown in Fig 4.1 below (Fawcett, 2(03).
Figure 4.1 A Confusion Matrix.
The labels Y and N are used for the class predictions produced by the classification
mechanism (this enables distinction between the actual classifications which are
labelled as 'Pos' and 'Neg').
TP is the number of positive instances correctly classified as positive; FP is the
number of negative instances classified a positive; FN is the number of positive
instances classified as negative; and TN is the number of negative instances correctly
classified as negative.
TP rate = TPI Total Positives
FP rate = FPI Total Negatives
Chapter 4 - Further Experiments 93
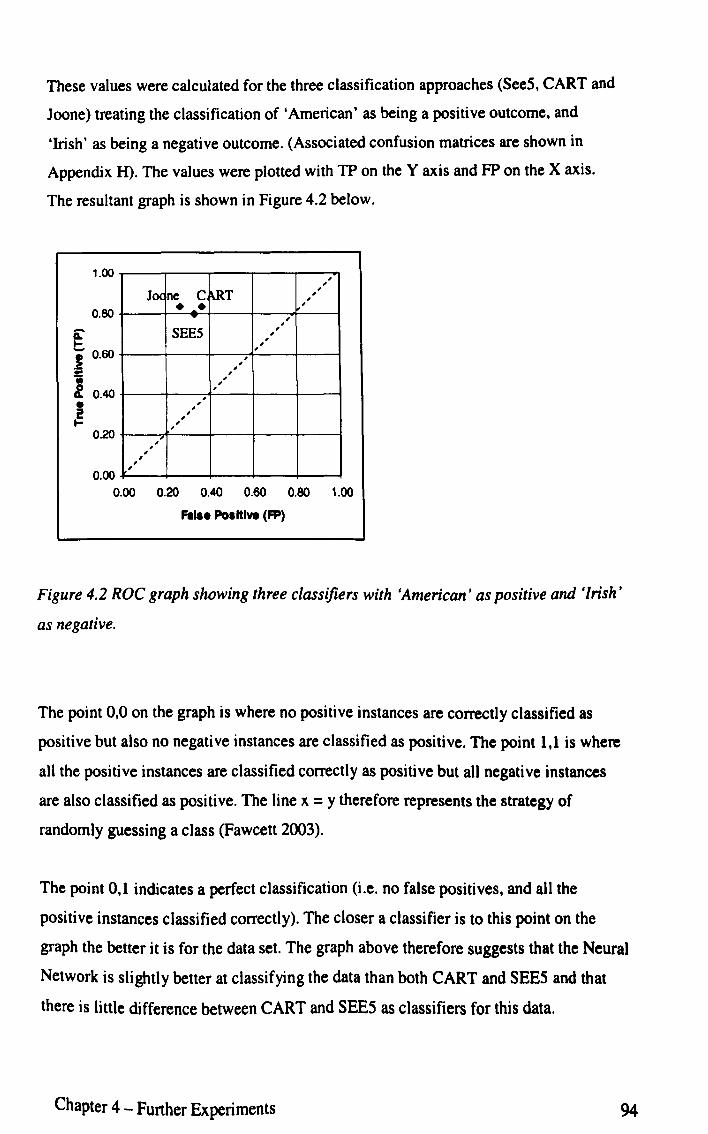
These values were calculated for the three classification approaches (See5, CART and
Joone) treating the classification of 'American' as being a positive outcome, and
'Irish' as being a negative outcome. (Associated confusion matrices are shown in
Appendix H). The values were plotted with TP on the Y axis and FP on the X axis.
The resultant graph is shown in Figure 4.2 below.
1.00 , , Joe C '.RT
, ne , , • • ,
~ , 0.80 , SEES
, , , , , , , , , , , ,
, , , , , , , 0.20
" , , , , , 0.00
0.00 0.20 0.40 0.60 0.80 1.00
r:. ... Positive (FP)
Figure 4.2 ROC graph showing three classifiers with 'American' as positive and 'Irish'
as negative.
The point 0,0 on the graph is where no positive instances are correctly classified as
positive but also no negative instances are classified as positive. The point 1,1 is where
all the positive instances are classified correctly as positive but all negative instances
are also classified as positive. The line x = y therefore represents the strategy of
randomly guessing a class (Fawcett 2003).
The point 0,1 indicates a perfect classification (Le. no false positives, and all the
positive instances classified correctly). The closer a classifier is to this point on the
graph the better it is for the data set. The graph above therefore suggests that the Neural
Network is slightly better at classifying the data than both CART and SEES and that
there is little difference between CART and SEES as classifiers for this data.
Chapter 4 - Further Experiments 94

Figure 4.3 below plots the same results for the three classifiers but this time treats
'Irish' as being the positive outcome and' American' as being negative. The effect of
this is to reflect the points on the graph about the line y + x = 1. This still indicates that
Joone is slightly better than SEES and CART.
1.00 , , , , , ,
J<X¥1 c , , ,
O.SO ,
SEES , • ,
, CART , , , , , ,
, , , , , , , 0.20 , , , , , , , 0.00
0.00 0.20 0.40 0.60 0.80 1.00
Fals. Posltlv. (FP)
Figure 4.3 ROC graph showing three classifiers with 'Irish' as positive and 'American'
as negative.
As discussed in 4.5.4 the Neural Network has the disadvantage of not being transparent
in terms of how the classifications were arrived at; however transparency in Neural
Network classifications is receiving attention in the research community and this is
likely to improve in the future. For the purposes of this work, it is helpful to use the
Neural Network approach as an indicator of the classification accuracy achievable
based on the given characteristics, but SEES is the most useful in determining which
characteristics are important in the classification process.
Chapter 4 - Further Experiments 95

4.6 Proposal for an Integrated Analysis Method
The experiments using GTIM lower level grouping preference rules (and limited
metrical information) and the five bottom up principles of the lR model have shown that
it is possible to derive attributes that enable folk dance melodies for violin to be
classified successfully according to their cultural origin. Moreover, the method of
classification chosen (See5) enables information about differences in the surface level
of the music to be examined. The experiments have shown that GTIM analysis and
analysis according to the lR model pick out different surface features that can be used to
classify the melodies and therefore complement each other. It is therefore proposed that
an integrated method consisting of both of these approaches be used as a way of
maximising the information about the music that can be gained from a formal analysis
method. The statistical method tested in the preliminary experiments (Chapter 3) only
had limited value and was therefore not followed up. However there is enough evidence
to suggest that statistical methods can provide additional information (Eerola et a1.
2001, Jarvinen et al. 1999, Krumhansl et a1. 1999) and that their results can also tell us
something about how listeners perceive music. It would be therefore be beneficial to
include or make available some kind of statistical analysis in the proposed integrated
approach. Statistical methods could also be used as a way of recognising certain kinds
of ornamentation that both GITM and the IR model do not. For example acciaccaturas
are defined as having no length and so could not be classed so easily as metrical
deviations in the same way as the written in triplets are (though these are really
ornamentation as well). Statistical methods of counting the number of ornaments and
the types and positions in the score would be a suitable way of handling these. There are
statistical methods available as part of existing implemented tools (the Humdrum
toolkit) and these will be discussed briefly as 'ready made' additions to the integrated
analysis approach in Chapter 5 on the representation of music.
One of the problems observed whilst carrying out the GITM and IR model analysis was
the time required. It is therefore hoped to automate the means of carrying out the
analysis for future experiments and in order to do this approaches to the representation
of music must be considered and additionally approaches to the programming style that
would best suit the development of such an application. In particular the use of
Artificial Intelligence (AI) programming will be considered. The next chapter examines
Chapter 4 - Further Experiments 96

some of the approaches to music representation on computer and at possible approaches
to program development with particular emphasis on AI based methods. It concludes
with a recommendation for the most appropriate way to represent Western folk
melodies such as those used for the experiments described in this chapter in order to
analyse them effectively using an integrated analysis approach, along with the most
appropriate way in which such a system should be implemented.
Chapter 4 - Further Experiments 97

CHAPTER 5 - Music Representation and Processing on Computer
5.1 Introduction
In order to use a computer for work with music it is necessary to abstract the musical
information into a computational form and hence a suitable method of representation
needs to be chosen. Dannenberg (1993, 20) observes "Computers allow (and require)
a formal approach to the study of music representation. Computer programs demand
that every detail of a representation be precisely specified, and the resulting precision
allows experimentation and testing of new representations". The representation of
music should ideally allow the researcher to view the data at different levels of
abstraction to suit their specific purposes. Wiggins et al. (2000, 8) on representation
suggest that "A good compromise, then, is a representation with an explicit, but not
too restrictive, musical surface, within which the widest possible range of data can be
represented" and this was their aim in the development of CHARM, a framework for
the representation of music. The idea of a musical surface is taken from lackendoff
(1987, 217), where it is defined as "the lowest level of representation that has musical
significance". An important factor in choosing a representation system is the purpose
for which the information is to be used; as observed by Wiggins et a1. (1993,33) "One
feature of music representation [ .. ) is the importance of musical viewpoints - the
ability to represent the same musical objects in many different ways for different
purposes".
This chapter firstly considers the different approaches to representation and reviews
examples of their implementation in existing systems and then considers the relative
merits of declarative and procedural programming approaches as a way of processing
the represented information. The chapter concludes with recommendations for an
appropriate approach to the representation and subsequent processing of western folk
dance melodies for violin.
5.2 Approaches to Representation
This section gi ves an overview of the most common approaches to music
representation. Such approaches can be loosely categorized and span a wide range.
Chapter 5 - Music Representation and Processing on Computer 98

For example, a waveform can be used to represent a particular performance very
accurately, though analysing the wave form at specific levels of abstraction may be
difficult. Another possible approach to representation would be one based on the
musical score notation that many musicians rely on to share work. Scores allow
analysis at various levels of abstraction (as described in chapter 3) yet they can omit
key information about the performance. It is also possible to represent musical
information using general purpose representation systems e.g. programming
languages, both third generation and object-oriented; declarative and procedural.
There are implementations of representation systems in all of these categories and it is
possible to show the relative merits of each with respect to their possible applications.
However the main focus here is within the context of representations that are suitable
for the integrated analysis method proposed in Chapter 4.
S.2.1 Systems that Employ Waveform Representation
A waveform enables the representation of a performance completely, with all
elements of expression included. However it is hard to abstract the information at
different structural levels for purposes such as analysis. Wiggins et al. (1993) provide
a useful framework for the evaluation of music representation systems generally.
Their evaluations are measured along two dimensions: those of 'structural generality' ,
and 'expressive completeness'. where expressive completeness refers to "the range of
raw musical data that can be expressed" and structural generality to "the range of
high-level structures that can be represented and manipulated" (Wiggins et al.. 1993.
31). The waveform representation. according to their assessment has maximum
expressive completeness but minimum structural generality. Fig 5.1 shows the
classification by Wiggins et al. of a number of well known representation systems
along these two dimensions. They believe that it is useful to evaluate the suitability of
a representation system for a particular task by relating the task and system to these
two dimensions.
Chapter 5 - Music Representation and ProceSSing on Computer 99
Figure 5.1 Two dimensions/or comparison o/music representation systems. (Wiggins
et al. 1993, 32)
Despite the problems with wave fonn representations, some researchers believe it is
the best way to handle musical data for certain circumstances. For example, Sennan et
a1. (2000) report a comparative study based on segmentation of unaccompanied folk
songs from four different regions (Ireland, China, Germany. Chippewa North
American Indian). Their work showed that using the scored notation for Western
tonal music (WTM) and applying Lerdahl and Jackendofrs grouping preference rules
(GPRs) enabled them to achieve an analysis of the songs by observing which of the
GPRs were fired and how frequently. They compared the results of this to those of
DeJiege (1987) one of the key works that tests GTIM compared to human listeners
(discussed more fully in Chapter 3). They found some similarities in the results in that
the rules were fired in similar proportions, however there were some differences; for
example the rest rule (GPR2a) - one that is considered particularly important as a
chunking cue - was mainly absent from the European songs. On analysis of their
results it was apparent that the melodies that were the most distant from WTM were
analysed least successfully by GTIM. This was mainly due to such features as singers
using large amounts of vibrato. note bending, timing variations and so on. and these
Chapter 5 - Music Representation and Processing on Computer 100

are generally omitted from (or are very difficult to encode using) WTM notation. This
experiment hence led to further work on the development of a system known as
MusicTracker to take the raw sound and analyse it from this form. MusicTracker
reads a 'wav' file and the signal is expressed in an array which is split into frames of
about 20 milliseconds. For each frame the system computes values for pitch, timbre,
and perceptual dynamics (loudness). (Timbre or tone colour in particular is difficult to
measure and to define, though it is an important feature of heard music. Dowling
(1986, 63) spends some time discussing it but observes more generally that timbre is
multidimensional and that it describes "those psychological properties of sounds that
make them quantitatively distinguishable from each other even if they should have the
same pitch and loudness.") When MusicTracker is applied to a fragment of music it is
possible to graphically represent the incidence of the indicators. The small example
used showed that timbre and loudness caused more rules to be fired than pitch
variation and this appeared to match with the author's Own views of how the fragment
would be segmented on listening.
They therefore argue that WTM notation (and hence GTIM) cannot give as true an
account of the grouping as perceived by a human listener. Many examples of WTM
notation include information about how the performance should be carried out
however, including information about dynamics, articulation, phrasing and to some
extent timbre. The experiment described by Serman et al. compares the most basic
form of WTM notation, with no added performance information at all. It could be
argued that performance information added to WTM scores is only the performance
view of the person who transcribed the music to WTM, but unless a large number of
live performances are recorded and analysed, then the same argument also applies to
raw musical data, in that the recordings only represent the performance view of the
particular performer. MusicTracker is in the early stages of development and does
provide a way of analysing music that doesn't lend itself to WTM notation easily.
Some categories of folk music are more suited to WTM notation however, and are
readily available in that form with performance information included, western folk
dance music for violin being such an example. Although wave form analysis can be a
useful and realistic way of representing music, it also has significant disadvantages.
The main one being, that it is difficult to use tested analysis methods that require
alternative representations, and related to this is the problem of abstraction at different
Chapter 5 - Music Representation and Processing On Computer 101

structural levels in order to draw comparisons (e.g. note level, measure level, phrase
level, and so on.) Certain applications might not require either of these features and
for these wave form analysis would be more appropriate.
5.2.2 Score Based Representations
Since many analysis techniques depend on the use of WTM notation, some systems
that require the analysis of music rely on a representation system that allows the
music to be coded in this way. One such example is the DARMS system (Erickson,
1977). DARMS allows a western score to be translated directly to ASCD code and the
score is seen as a collection of symbols without any individual meaning. Since this is
a direct mapping form score to computer it falls in the same place as a score on the
classification diagram of Wiggins et al. (Fig 5.1). This approach to representation has
been used in various research projects. One of them being that of Foxley (2001) as
reported in Chapter 3 for the storage and statistical analysis of English folk melodies.
DARMS was really developed as a way of typing music easily into a computer for
subsequent printing purposes and is valued as such, but because it provided a way of
getting musical data into the computer it has also been used for analysis purposes and
as such has received probably unfair criticism. DARMS can therefore be described as
an early example of a simple approach to representation that has been used more
widely than its originators intended with varying degrees of success.
There are more general criticisms of systems that are based solely on scored notation,
in particular Balaban (1996, 98) observes that it is not possible to denote "real-world
music" with a simple graphical representation. Other systems rely on scores to an
extent but take the representation further by assigning hierarchies to the musical
structures, and also include or depend upon the inclusion of additional information
that indicate performance features such as phrasing, dynamics, articulation and so on.
Approaches such as this are often grammar-based and are discussed further in the next
section.
Chapter 5 - Music Representation and Processing on Computer 102

5.2.3 Grammar Based Representations
The idea of a grammar is that structures can be described in term of their subparts.
thus forming a hierarchy of structures. "A grammar for a class of structures may be
used to generate those structures. to check if a given structure falls within the class
described, or just the description alone; the structure itself is purely declarative",
(Wiggins et al. 1993,37). Such approaches would score well in terms of structural
generality (one of the dimensions suggested by Wiggins et al.) since it allows
abstraction at the different levels in the hierarchy. It would also be possible for a
grammar representation to score well in terms of expressive completeness, depending
on how it was defined. The grammar itself is not a representation system for computer
implementation but computer implementations can be designed to represent music
grammars where required. Lerdahl and lackendoff (1983. 1996) give a detailed
description of their grammar (GTTM, see chapter 3). and there have been a number of
implementations on computer that use this approach as a means of analysis and hence
the representation method has had to be able to handle the musical information in this
form. Examples of computer analysis systems that use GITM have already been
discussed in chapter 3, though the given examples exhibit different approaches when
mapping the grammar to the computer. For example. Robbie and Smaill (1995)
developed a music analysis tool for computer based on the grouping component of
GTIM; the implementation was written in Prolog. but the approach to representation
was based on the CHARM framework of Wiggins et.al.1989. Harris et. al. 1991,
Smaill et. al. 1993a. 1993b which uses abstract data types as the basis of
representation. CHARM is independent of any programming language and is
discussed further in section 5.2.4 and 5.2.5. Horowitz (1995) applies GTTM analysis
to a jazz improvisation system (written in C++), in which he uses an approach to
representation that is based on a hierarchy of frames.
5.2.4 Abstract Representations
An approach to representation that scores highly in both of the dimensions identified
by Wiggins et al. is SmOKe (Small music Object Kernal) devised by Pope (1992),
Smallmusic (1992). This is a specification for what a music representation scheme
should be rather than a representation in itself. The specification is wide-ranging in
Chapter 5 - Music Representation and Processing on Computer 103

that it requires the representation of timbre in various forms, it maps descriptions of
instruments onto synthesizers and so on; it therefore has a high level of complexity
overall though the core of the music representation approach can be compared with
other representation systems. The specification is Object-Oriented in structure and is
implementation language independent. SmOKe requires that music is represented as a
series of events, where events consist of a list of properties (typical properties being
pitch, loudness, duration etc.). Events are grouped into event lists which can be seen
as events themselves, hence forming a hierarchical structure with a flexibility in terms
of the groupings that allows arbitrary nesting of structures, which adds to the
structural generality of the system. SmOKe also provides abstractions for certain
types of music structures (e.g., trills, chords) but Wiggins et al. argue that this could
restrict the structural generality in a way that a more general specification (e.g. in
logic terms) would not do. They attempt to overcome this when they propose the
CHARM framework described in the following paragraphs.
The CHARM (Common Hierarchical Abstract Representation for Music) framework
(Wiggins et.al.1989, Harris et. al. 1991, Smaill et. al. 1993a, 1993b) scores highly
along both of the previously mentioned dimensions (structural generality and
expressive completeness). This system is a specification for how a music
representation should be designed and what mathematical properties it should have.
How the specification is implemented depends on the host language (it is not
programming language specific) and what properties of the music are of interest. It
enables a very flexible approach in terms of both input data - which can range from
simple score information to performance information - and subsequent data
manipulation. The intention then in specifying CHARM is to provide a framework
that enables a wide range of possible representations, and the idea is defined in terms
of abstract data types. The basic level of representation considered in CHARM is at
note-like events thus corresponding to Jackendofrs musical surface, (Jackendoff
1987) however Wiggins et al. (2000) want researchers using the CHARM framework
to be able to consider groupings of these events, and groupings of groupings and so
on, depending on what the criteria of interest are. The basic representation allows for
pitch, time, duration, amplitude and (a later addition) timbre. Different researchers
may want to refer to any of these dimensions in different ways i.e. one way may want
Chapter 5 - Music Representation and Processing on Computer 104

to measure pitch in terms of hertz, another in terms of WTM-type notes, with pitch
gaps measured in semitones and so on. An abstract framework should allow for this.
There have been successful implementations using CHARM as the basis for
representation. The previously mentioned work of Robbie and Smaill (1995) show
how CHARM can be used to represent musical data in the development of a tool to
enable analysis of musical information based on the Grouping Preference rules of
Lerdahl and lackendoff. This implementation was written in Prolog, a declarative
language. Wiggins and Smaill (1993) discuss the differences between procedural and
declarative languages as means of implementing representations. They do not see
object oriented languages as providing an alternative to declarative languages, but as
an alternative style that can be implemented in any of the existing forms of
programming, depending on the purpose. In fact, the majority of implementations of
CHARM have been written in Prolog.
The approach taken to representation using CHARM is the most general of all those
discussed in the previous sections and therefore suits many different purposes. For
this reason consideration is given to how CHARM might be used as the basis for
representation of folk melodies for violin with a view to analysing them using the
integrated method described in Chapter 4. The following section briefly describes the
CHARM specification and illustrates how it can be used to represent a fragment of a
violin melody.
S.2.S The CHARM Specification
Harris et al. (1991) describe the CHARM representation framework as consisting of
events and constituents. In order to achieve this representation they define abstract
data types to represent pitch, time, amplitude and (though not discussed further in the
1991 work) timbre. Since they are interested not only in instances of time but also in
durations, and not only pitches but also pitch intervals, etc. they also define functions
to enable computations. These can be illustrated using time and duration. The
functions add"y and sub"y are defined where x and y can be either t or d and where t
stands for time and d for duration. Hence there are four functions:
Chapter 5 - Music Representation and Processing on Computer 105

Ad~: Duration x Duration --+ Duration
Addoo: Time x Duration --+ Time
Subtt: Time x Time --+ Duration
Subdd: Duration x Duration --+ Duration
(Harris et a1. 1991, 6)
Similar functions are defined for pitch and pitch interval, amplitude and relative
amplitude, by renaming the properties in the description for time and duration.
Events in the music are given a unique identifier, and each has a number of elements
associated with it, e.g.
(E05, (F,#,2),1I4,1I2,1O)
This could be representing a musical event with given identifier EOS, the event is a
pitch of F# in the 2nd octave, with a start time of 1,4 of a crotchet beat from the
beginning, a duration of 1h (i.e. an eighth note or a quaver) and an amplitude of 10
decibels. Every musical event in a piece of music can be encoded in this way, and the
elements of the events can vary depending on the requirements for the representation.
A piece of music would therefore consist of a large collection of such events.
Harris et a1. use constituents for the grouping of events and also other constituents.
They define a constituent as a pair of the form (PropertieslDefinition, Particles) where
"Properties/Definition allows logical specification of the relationships between the
Particles of this constituent in terms of membership of certain classes, which may be
defined externally by the user [and] Particles is the set of the events and sub
constituents making up this constituent." (Harris et a1. 1991,8). An example
representation of a constituent is given below.
Constituent( col, collection(O, 34*dotted_minim+crotchet), syrinx, (eOOO,
eOO1, ... e181, e182]).
Smaill et a1. (1993, 9)
Chapter 5 - Music Representation and Processing on Computer 106

The first field is the unique identifier (in this case ·col'). The second field shows the
structural type of the constituent, so it is a collection, with a start time and a finish
time. The third field is a musical type representing the role of the constituent and in
this case it is simply the name of the piece of music 'Syrinx'. The fourth field is a set
of identifiers that names the events that make up the constituents - these are therefore
the particles of the constituent. A 'collection' doesn't say much about the constituent,
and a more meaningful type here would be a 'stream' which indicates that the events
are ordered. Stream constituents are therefore especially useful for representing
monophonic melodies. Smain et al. point out how it is possible and often desirable to
represent the same piece of musical data using different types of constituents to
provide multiple views. Constituents can also be used to represent groupings such as
motifs e.g.
constituent (col, stream(O, minim), motif(mtfl),[eOl,e02,e03,e04,eOS,e06]).
This time the 'musical type' field (third field) shows that the phrase is a motif, with a
unique identifier 'mtfl '. The length of the motif is a minim and it contains six events
that occur in the order listed. It would also be possible to use constituents to represent
chords (Le. as a group of events) and other features such as triplets or ornamentations
which are features of the violin melodies under consideration in this study. Smaill et
al. suggest future work on the representation of chords might be beneficial in order to
represent them as orthogonal to streams rather than simply as col1ections of events in
a constituent.
The example below illustrates how CHARM could be used to represent a fragment of
musical data from one of the violin melodies used in this study. The representation
should contain all of the information available in the original scored data (i.e.
including the performance information) in order that it may be analysed using the
integrated method derived in Chapter 4. The first eight notes are listed as events
(representation of the acciaccatura or grace note is incomplete at this stage).
Chapter 5 - Music Representation and Processing on Computer 107

Fig 5.2 An extract from the Pleasures of Home, O'Neill's Music of Ireland, Krassen
(1976)
Event (eoo, (d,nat,4),0,l/8)
Event (eOl, (c,nat,4),1I8,l/8)
Event (e02, (b,flat,4), 114, l/8)
Event (e03, (g,nat,4),3/8,1/8)
Event (e04, (a,nat,4), ? see below)
Event (e05, (g,nat,4),1I2,lIl2)
Event (eOO, (f,#,4),7112,1I12)
Event (e07, (g,nat,4),213,1112
The events listed above give infonnation about the sequence of notes up to the end of
the triplet. Each row in the list above gives an event label; a pitch followed by an
indicator of whether or not the note is sharp (#), flat or natural (nat); the octave
number (the octave starting from middle C to the C above is the fourth octave); the
onset time as a fraction of a whole note; and the duration as a fraction of a whole note.
The fifth note of the score is an acciaccatura. None of the documentation from
Wiggins, Smaill et. al. give an indication of how grace notes such as these might be
represented using the CHARM framework. However a way of handling this might be
to consider the acciaccatura as being durationless (they are defined as so by the
Associated Board of the Royal School of Music, 1958 and treated in this way by
Lerdahl and Jackendoff, 1983). This would mean that event 4 could be represented as
follows:
Event (e04, (a,nat,4), Y2, 0)
So the acciaccatura has an onset time of a half note measured from the start of the
piece of music and zero duration.
Chapter 5 - Music Representation and Processing on Computer 108

Information relating to bars, slurs and so on can be represented by constituents as
required. For example the group of slurred notes in the fragment above could be
represented by the following constituent:
Constituent (co 1 ,slurred_stream, [e03,e04,e05,eQ6,e07))
This indicates that there is a constituent with the label 'col' that consists of a slurred
stream of events as listed in the square brackets.
The CHARM framework certainly provides a valuable approach to representing
musical data. It is flexible enough to enable researchers to represent the information
they want to represent and to use their own terminology and so on. The way that the
information is represented enables translation into computer code very well and is
also language independent. Data notated as specified above would translate easily into
a Prolog database for example and also the object-oriented nature of the hierarchy of
events and constituents means that it could be encoded using an object-oriented
language with relative ease.
The diagram on the next page shows an Entity Relationship diagram to represent the
musical data required in terms of constituents for the folk dance melodies.
Chapter 5 - Music Representation and Processing on Computer 109

Constituent
mament Type
m
Fig 5.3 Entity Relationship diagramfor CHARM representation offolk dance
melodies.
This diagram show the constituents required for representation of the melodies. The
earlier experiments reported in Chapter 3 and 4 have determined that it is necessary to
know about the onset and completion of slurs, the pitch and duration of the notes, the
order of the notes, ornaments such as grace notes and so on. All of this information
could be contained in a database based on the above diagram. The bar groupings have
been included because these are relevant when applying metrical preference rules
from GTTM. For the melodies in the earlier experiment it was found that the metrical
rules and hence the metrical structure was identical for all melodies with the
exception of deviations from the metrical structure in the form of triplets, it might be
appropriate therefore to leave out the bar grouping constituent. though for
completeness and for use with a wider range of melodies it could become relevant
again. The constituent representing triplets could also be left out since triplets can be
identified amongst the events as being a sequence of three twelfth notes, however as
they are important in the GTIM analysis it is helpful to have them as a specific
Chapter 5 - Music Representation and Processing on Computer 110

constituent. One of the advantages of CHARM is that it enables multiple views and
different abstractions of pieces of music to be identified. The triplets constituent does
not introduce redundant data, it is simply flexing the data model to include groupings
of and labels for series of events. The above diagram would result in ten tables being
defined (skeleton tables are shown in Appendix G and some of them would be quite
large. For example the Event table would have a record for every note in every
melody. One of the advantages of translating the representation into a database is that
it would be possible to create a simple interface as a way of inputting the data, though
even this is still likely to be time consuming. A disadvantage of using CHARM and
the idea of constituents is that to some extent elements of analysis are being carried
out at the time of encoding by performing the abstractions (for example, there is extra
pre-processing taking place when representing the triplets as constituents having
already represented them as twelfth note events). It might be better therefore to have a
simpler representation scheme but one that enables all of the required features of the
data to be extracted automatically by the computer. The next section is concerned
with the Humdrum representation scheme and toolkit which aims to do this.
5.2.6 The Humdrum Toolkit and Kern Code Representation
A more recent development in musical representation that has also been implemented
and made available as a mUltipurpose tool is the Humdrum toolkit (Huron, 1994).
Humdrum itself is a syntax but the Humdrum toolkit is an application that enables a
number of approaches to representation (including user defined representations as
long as they are written in such a way that they conform to the syntax) to be
employed. "Humdrum is not a representation scheme in the conventional sense; rather
it embodies an unbounded class of representations" (Huron, 1997, 375). It is designed
to represent sequential and/or concurrent time dependent data in a table type format,
so that sequential events are represented vertically, and concurrent events
horizontally. Humdrum files are standard ASCII and the flexibility is such that one
file can represent a whole piece of music, or there may be a number of files of
different forms that represent different aspects of a piece. Since common usage of the
toolkit is likely to include Western tonal music, a representation scheme is included
that lends itself specifically to this task, this is known as the Kern code. Kern allows
for information about pitch, duration, articulation, ornamentation, timbre (in terms of
Chapter 5 - Music Representation and Processing on Computer 111
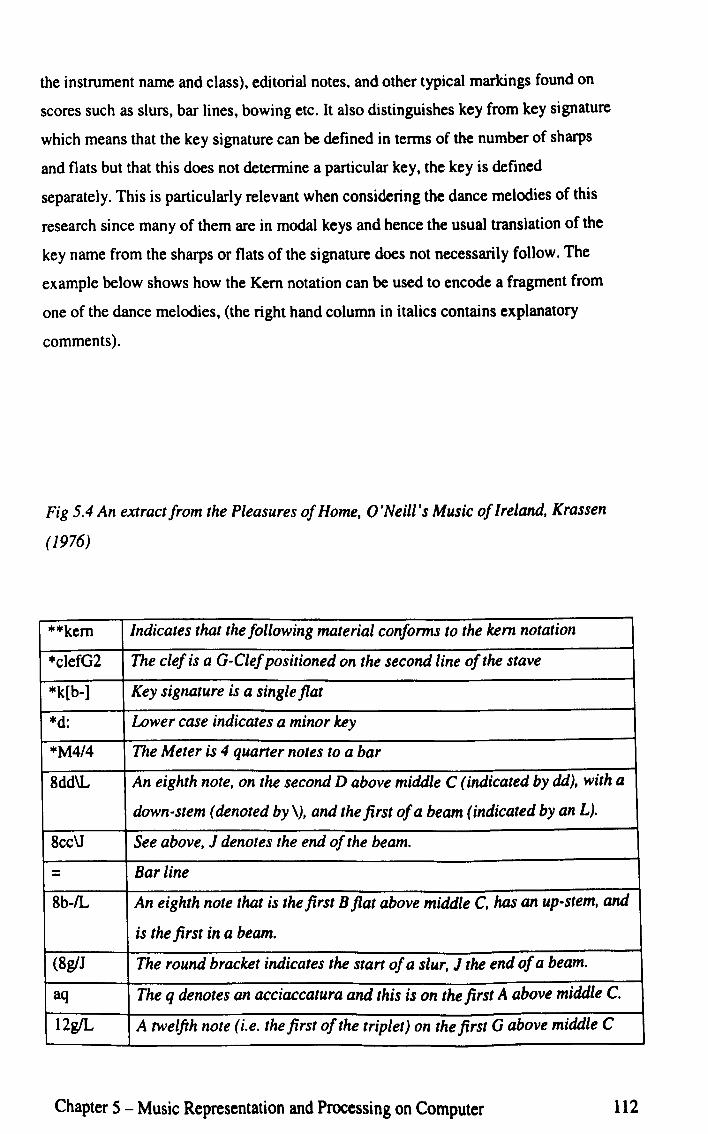
the instrument name and class), editorial notes, and other typical markings found on
scores such as slurs, bar lines, bowing etc. It also distinguishes key from key signature
which means that the key signature can be defined in terms of the number of sharps
and flats but that this does not determine a particular key, the key is defined
separately. This is particularly relevant when considering the dance melodies of this
research since many of them are in modal keys and hence the usual translation of the
key name from the sharps or flats of the signature does not necessarily follow. The
example below shows how the Kern notation can be used to encode a fragment from
one of the dance melodies, (the right hand column in italics contains explanatory
comments).
Fig 5.4 An extract from the Pleasures of Home, O'Neill's Music of Ireland, Krassen
( 1976)
...... kern Indicates that the following material conforms to the kern notation
*clefG2 The clef is a G-Clef positioned on the second line of the stave
*k[b-) Key signature is a single flat
*d: Lower case indicates a minor key
"'M4/4 The Meter is 4 quarter notes to a bar
8dd\L An eighth note, on the second D above middle C (indicated by dd), with a
down-stem (denoted by \), and the first of a beam (indicated by an L).
8cc\J See above, J denotes the end of the beam.
= Bar line
8h-1L An eighth note that is the first B flat above middle C, has an up-stem, and
is the first in a beam.
(8g1J The round bracket indicates the start of a slur, J the end of a beam.
aq The q denotes an acciaccatura and this is on the first A above middle C.
12gIL A twelfth note (i.e. the first of the triplet) on thefirst G above middle C
Chapter 5 - Music Representation and Processing on Computer 112

12f#! Second note of triplet on the first F# above middle C
12g1J) Third note of triplet on the first G above middle C, end of beam
8gIL Eighth note on first G above middle C, start of beam
8f! Etc.
8g1
8a1J
= Bar line
Table 5.1 Representation of the whole of the musical extract shown in Fig. 5.4 written
in the Kern notation.
The Kern representation supports all of the features required for the analysis of
melodies according to both GTIM and the IR model. As well as Kern, the Humdrum
toolkit has over twenty pre-specified representation schemes and in addition allows
researchers to define there own. Humdrum goes beyond being a specification by
providing a very flexible means of coding all kinds of music representations. As a
result it is becoming very popular and there are already as many as 10 ()()() substantial
pieces of music that have been coded using it, and over 6500 of these are available for
researchers to use. Representations in the Kern Code (or in other versions of
Humdrum syntax) are easily read by computer programs making it relatively straight
forward to identify the features required for analysis according to either GTIM or the
IR model. For example the round brackets indicating the onset (or completion) of
slurs would be used to identify incidences of GPR2a (where one slur ends and another
begins), or a change in articulation if the other relevant conditions are mel. Similarly
the interval sizes can be calculated from the pitch information, suitability of an
interval for IR analysis can be worked out by relating the pitches to the key and so on.
There are also some software tools available that will translate from other
representation formats into Humdrum, most interestingly one of them translates from
Schaffraths Essen Database (1997), (ESAC representation) which is a large database
of folk songs (currently there is no instrumental music in the Essen Database). The
translation tools are not part of the Humdrum toolkit and must be requested from the
Chapter 5 - Music Representation and Processing on Computer 113

originators. For many researchers, using Humdrum removes a large amount of pre
processing and coding.
Humdrum is a representation scheme that has been implemented as a toolkit. Some of
the tools are to enable researchers to code their data either using a prescribed scheme
such as Kern or using their own. Other tools (the toolkit currently consists of over
seventy tools) provide further processing facilities commonly required by researchers.
The kinds of questions that can be answered are illustrated below (quoted from
Huron's Humdrum web based user manual, 1994):
• In Urdu folk songs, how common is the so-called "melodic arch" -- where
phrases tend to ascend and then descend in pitch?
• What are the most common fret-board patterns in guitar riffs by Jimi Hendrix?
• Which of the Brandenburg Concertos contains the B-A-C-H motif?
• Which of two different English translations of Schubert lyrics best preserves
the vowel coloration of the original German?
• Did George Gershwin tend to use more syncopation in his later works?
• How do chord voicings in barbershop quartets differ from chord voicings in
other repertories?
These questions give an illustration of the breadth of the facilities offered by the
toolkit. Some of the tools are based on work by researchers other than Huron and his
team, one example is a tool based on the research by Krumhansl and Kessler (1982)
on tonal hierarchy and key estimation, referred to earlier in Chapter 3. The statistical
facilities of the toolkit are able to provide a range of additional information to support
the integrated analysis method for analysis of dance melodies proposed in Chapter 4.
The preliminary experiment using a statistical method devised by O'Canainn (1978)
(presented in Chapter 3) gave only limited information about the melodies. However,
statistical analysis methods have been shown more generally to produce useful
information that also bears some relation to how listeners hear music (Eerola et al.
2001, Jarvinen et al. 1999, Krumhansl et al. 1999). Having a choice of statistical
analysis tools available to use in addition to the proposed integrated analysis tool
would therefore add significantly to its value as an aid to music research. The
Chapter 5 - Music Representation and Processing on Computer 114
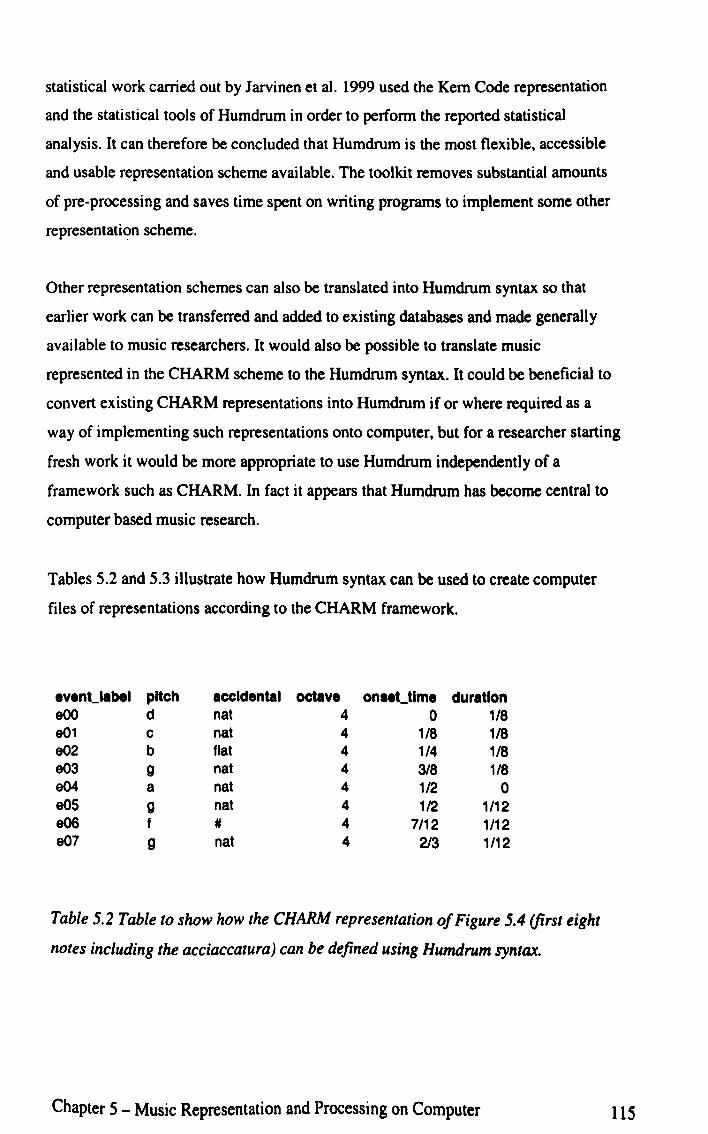
statistical work carried out by Jarvinen et a1. 1999 used the Kern Code representation
and the statistical tools of Humdrum in order to perform the reported statistical
analysis. It can therefore be concluded that Humdrum is the most flexible. accessible
and usable representation scheme available. The toolkit removes substantial amounts
of pre-processing and saves time spent on writing programs to implement some other
representation scheme.
Other representation schemes can also be translated into Humdrum syntax so that
earlier work can be transferred and added to existing databases and made generally
available to music researchers. It would also be possible to translate music
represented in the CHARM scheme to the Humdrum syntax. It could be beneficial to
convert existing CHARM representations into Humdrum if or where required as a
way of implementing such representations onto computer. but for a researcher starting
fresh work it would be more appropriate to use Humdrum independently of a
framework such as CHARM. In fact it appears that Humdrum has become central to
computer based music research.
Tables 5.2 and 5.3 illustrate how Humdrum syntax can be used to create computer
files of representations according to the CHARM framework.
evenelabel pitch accidental octave on"Ctlme duration eOO d nat 4 0 1/8 e01 c nat 4 1/8 1/8 e02 b flat 4 1/4 1/8 e03 9 nat 4 3/8 1/8 e04 a nat 4 1/2 0 e05 9 nat 4 1/2 1/12 e06 f # 4 7/12 1/12 e07 9 nat 4 2/3 1/12
Table 5.2 Table to show how the CHARM representation of Figure 5.4 (first eight
notes including the acciaccatura) can be defined using Humdrum syntax.
Chapter 5 - Music Representation and Processing on Computer 115

SlurrecLstream 803 804 805 e06 807
Table 5.3 Table to show how the CHARM constituent representing the slurred group
of notes in Figure 5.4 can be defined as a series of events using Humdrum symtax.
Translating in this way could be useful where existing CHARM representations
needed to be defined using Humdrum syntax for further processing. or where the
researcher needed to use Humdrum tools but also required a hierarchical
representation. Similarly for those researchers working with CHARM it is possible to
translate data from Humdrum syntax and more specifically from the Kern notation
into a format corresponding to the CHARM framework. An example of this is
described by Pearce (2002) in his implementation notes on representation; the
translation from Humdrum encoded music is carried out using a LISP program.
The abstract nature of CHARM makes it very flexible in term of processing musical
information. Almost any language could then be used to process the musical
information represented using the CHARM framework though it lends itself
particularly well to Prolog since the format of input to a Prolog database is very
similar to that of the definitions of events and constituents shown earlier in this
section .. However there is no available implementation of CHARM and therefore
every researcher would need to build his or her own tool in order to use it. which
constitutes a significant task. Humdrum on the other hand exists as a free tool and its
files. being in ASCII format. can be read easily by most programming languages. In
general then Humdrum is likely to suit the requirements of a large proportion of
computer music research and therefore there is a reduced need for a framework such
as CHARM unless the research work is focusing on the nature of the representation
rather than further analysis of the represented musical information. It is therefore
proposed that Humdrum would be the most appropriate representation scheme for the ,
folk dance melodies of this study.
Chapter 5 - Music Representation and Processing on Computer 116

The next section, considers the possible approaches to automating the analysis of the
melodies focussing on the debate around Artificial Intelligence approaches and the
more traditional approaches to programming.
5.3 Automated Analysis - Traditional Versus AI Approach
5.3.1 Introduction
This section addresses the issue of the implementation of an automatic music analysis
tool for folk dance melodies. The discussion focuses on the debate between the
relative merits of declarative (AI languages) and procedural (traditional) languages
with a view to proposing the most appropriate method for the development of an
automated music analysis tool for musical data encoded using the Kern Code which is
part of the Humdrum toolkit. Humdrum syntax of any kind is in ASCII format and
data encoded in ASCn code is accessible by both declarative and procedural
languages. Section 5.3.2 summarises the differences between declarative and
procedural languages.
5.3.2 Declarative Versus Procedural Languages
When using a procedural language (such as Pascal or C), the programmer has to
specify exactly how and what the program must do, this means that he/she is required
to be concerned at a very detailed level with the operation of the program. A
procedural language gives the computer a list of instructions to can)' out or a
procedure to follow. Declarative languages on the other hand enable the programmer
to be more removed from the way the data is processed and therefore to be able to
think in a more strategic way in order to solve a problem. Procedural information is
implicit and hard to use for other purposes, whereas declarative information enables
the information to be separated from its uses and therefore can be used for a number
of different purposes. In declarative languages (such as Prolog) the facts and rules are
declared statically and then information can be drawn out as required.
Prolog (the name comes from Programming in Logic) is probably the most common
declarati ve language. Facts and rules are stored in a database in Prolog and the
Chapter 5 - Music Representation and Processing on Computer 117

language has a search facility for accessing the database. With a procedural language
the search facility would have to be explicitly programmed by the programmer, and
hence programming in a declarative language such as Prolog can often be simpler and
quicker, this also makes it easier to construct prototypes. The Prolog programmer
needs to be concerned with procedure to some extent in the sense that it is important
to understand the order in which facts and rules are fired, but in general Prolog is not
considered to be procedurally oriented. Prolog is primarily concerned with the
manipulation of symbols (as opposed to the numerical methods of procedural
languages) where symbols can be anything from characters to words to sentences to
pictures. "It is precisely [the] ability of Prolog to process and manipulate symbols that
makes it such a powerful language and that stands it in direct contrast to many other
languages that focus more on numerical manipulations" (Schaffer and McGee, 1997,
27).
Declarative languages fall under the umbrella of Artificial Intelligence (AI) since the
approach to storing facts and rules, and the approach to searching for solutions to
problems from these are loosely based on what we know about the workings of the
human mind. Wiggins and Smaill (2000) observe that AI attracts both Intelligent
Systems Engineering researchers who are interested in its capabilities for solving
problems that require a human approach and at the other end of the spectrum,
researchers (such as Cognitive Scientists) that are interested in studying the brain and
the workings of the mind. They argue that the reason for choosing an AI approach is
that AI as a study and simulation of intelligent behaviour lends itself to problems that
require a more human approach; "While AI itself will never be able to solve these
problems [problems that require an intuitive approach] in general, its techniques are
often able to go further than the standard 'unintelligent' approaches" (Wiggins &
Smaill, 2000, 2). Researchers in AI do not necessarily fall into one or other of the
extremes mentioned above, in reality there is more of a spectrum of interests amongst
them and often the employment of AI techniques goes alongside an interest in the way
that a problem is solved as well as simply achieving the desired result. The nature of
music is such that it can be used as a basis for most types of AI research; it is an
intellectual activity that operates on many different levels and as such can be used by
Cognitive Scientists and Intelligent Systems Engineers as well as anyone who falls
between or across these categories. We therefore find that many researchers primarily
Chapter 5 - Music Representation and Processing on Computer 118

interested in music employ AI techniques, and similarly those that are primarily
interested in AI use music as a suitable application area with which to work on or try
out their theories.
The employment of AI techniques often goes alongside an interest in the way that a
problem is solved, as well as achieving a desired result. It is not surprising then that
the study of AI also overlaps with many other disciplines (such as psychology and
linguistics) as well as music. The value of taking an AI approach is multi-faceted; it
can enable us to achieve a better understanding (by simulation) of human intelligence
(Searle 1997, 1999); and conversely, attempting to automate human intelligence could
help us develop better machines (Cawsey, 1998). Balaban (1996, 97) in support of an
AI approach for music representation and processing states: "AI augments the
software engineering view with a connection to the real world. Problems attacked by
AI systems are rooted in the real world, and AI systems are description of such
problems." From a musical perspective, Robert Rowe (1995) illustrates the two fold
gains in AI/music research in the following two quotes:
'From the point of view of artificial intelligence research, such {AUmusicj
applications {he cites Cope 1991, Ebcioglu 1992, Barucha & Todd 1989J are
attractive because of music's rich capacity to support a wide variety of
models';
'From the point of view of computer music composition and performance.
artificial intelligence is of central importance because it directly addresses the
modelling of human cognition'.
Having considered the implications of both declarative and procedural approaches to
programming (under the broader umbrellas of AI and traditional approaches
respectively), the following section summarises by proposing a suitable approach for
the program development of the automated analysis tool.
Chapter 5 - Music Representation and Processing on Computer 119

5.3.3 Proposed Approach to Programming for an Automated Analysis Tool
Section 5.2 ended with the conclusion that the Humdrum toolkit is the best way
forward in tenns of representing musical infonnation and hence automating the
analysis process of the folk dance melodies. Section 5.3 has briefly discussed the
difference between declarative and procedural approaches to program development.
Although most programming languages could do the job of automating the integrated
analysis method proposed in Chapter 4 adequately, declarative languages such as
Prolog provide an approach to programming that enables the programmer to focus on
the problem to be solved in a more holistic way. In addition to this Prolog would
enable a prototype to be developed in a relatively short time, possibly implementing
only part of the integrated analysis method initially. The nature of Prolog is such that
the program can be extended in order to expand the analysis tool without interfering
with any of the earlier programming. It is therefore proposed that Prolog, as a well
known declarative language, would be the most appropriate means of implementing
the automatic analysis tool for the folk dance melodies and that these will be
represented prior to analysis in the Kern Code which is part of the Humdrum toolkit.
Statistical tools available with Humdrum will be used for statistical analysis where
required.
5.4 Conclusion
This Chapter has looked at the available possibilities for representation of musical
information and at approaches to processing such data after it has been suitably
represented. One of the most important considerations when deciding on a
representation system is the purpose for which the infonnation is being represented,
as observed by Huron (1992, 10) "One cannot meaningfully discuss the design of
representation schemes without some knowledge of how such a representation is
going to be used". Huron goes on to list twelve features of good representations,
amongst them are the following: consistent, context-free, explicit, extendable and
terse. Both Humdrum and CHARM are good examples of representation schemes
when examined against Huron's twelve criteria and in many ways both would suit the
requirements for the representation of the folk dance melodies of this study. The
CHARM system has substantial benefits because of its independence of language and
Chapter 5 - Music Representation and Processing on Computer 120

independence of types of data, but has not been developed into an available software
package and therefore the representation tool itself would need to be programmed
from scratch. Humdrum also fairs well against Huron's criteria (this is not surprising
since he is its creator) and has the additional benefit of being available as a software
tool, with a large number of supporting tools (including statistical tools useful for
additional analysis of the melodies). Humdrum syntax and in particular the Kern Code
notation is very simple to write. There are facilities for representing all musical
information, the researcher does not need to decide on what constituents to create or
represent as with CHARM, just what musical information to put in and what to leave
out. On balance then Humdrum is likely to be the best approach to representation of
the melodies.
Section 5.3 briefly discussed the relative merits of procedural and declarative
languages concluding in Section 5.3.3 that a declarative language offers the most
holistic and flexible approach to program development and therefore that developing
the tool in Prolog would be the most suitable approach. Another advantage of this is
that music research can aid in the development and verification of AI techniques and
hence there are likely to be benefits from the reverse point of view also.
Chapter 5 - Music Representation and Processing on Computer 121

CHAPTER 6 - Discussion
6.1 Introduction
The research presented in this thesis attempts to take a human perspective on the
formal analysis of folk dance melodies. Cognitive approaches to music analysis for
Western art music are applied in the context of folk dance music and an integrated
approach is suggested, with a long term view to developing a computer analysis tool.
There follows a discussion of the validity and value of this approach, observations on
new insights gained from the work are summarised in Chapter 7. In order to structure
this discussion it would be useful to revisit the specific aims of the research originally
presented in Chapter 1 and review the manner in which these have been addressed.
To aid the review a diagrammatic guide to the experimental work and follow-up
analysis is provided in Figure 6.1. (Each numbered box represents a discrete task in
numeric order of execution).
Chapter 6 - Discussion 122

Experiment with human
listeners 3
veri cation
Preliminary GTTM
Preliminary IR model analysis 5
Preliminary statistical analysis 4
Determine order of
Preference of GPRs 6
SeeS for classification
2
CART for classifi cati on
9
Neural Need for alternati ve network 10 statistical method classification
Further IR analysis
B
Further GTIM analysis
7
~!1t'~~:~)~!~TI~~~'~~~Pll::::::: Proposal for
Proposal for proposal for
Humdrum 11 I~ approach to representation computer 12 r-- program 13
representati on development
Fig. 6.1 Diagrammatic overview of experiments and proposals reported in previous Chapters
Chapter 6 - Discussion 123

6.2 Review of the Aims
Aim (1) To evaluate the effectiveness of music analysis techniques for Western
art music, in particular those of Lerdahl & lackendoff (1983, 1996)
and Narmour (1977, 1990, 1992), when applied to the field of Western
folk dance melodies for violin.
In order to meet Aim 1 (above), preliminary experiments were undertaken to analyse
thirty violin melodies according to the lower level grouping preference rules and
metrical preference rules of Lerdahl and lackendoffs GITM, Narmour's IR model,
and O'Canainn's statistical analysis method (boxes 1,4 and 5 in Fig. 6.1). Both the
GTTM analysis and IR model analysis revealed significant differences in the musical
styles, such that they could be classified using a decision tree induction tool with
classification accuracies of approximately 80% (GITM) and 73% (IR model) using
cross-validation trials. The results of these experiments were reported at the SMPC
(Society for Music Perception and Cognition) conference in 1999 (Carter et al. 1999)
and 2000 (Carter et a1. 2ooob) respectively.
The statistical analysis was not as successful however. Statistical analysis methods,
though quantitative in nature have been shown (Jarvinen et. a1. 1999, Eerola et. a1.
2001 and Krumhansl et al. 1999) to bear some relation to listeners' perceptions (see
Chapter 2 for further discussion of this). The statistical approaches taken by the above
researchers varied, though all of the reported work was undertaken with reference to
the statistical distribution of pitch, rhythm and intervals. A decision was therefore
taken to carry out the statistical analysis of the melodies (box 4) using an existing
method drawn from previous research. O'Canainn's method was selected as the
preliminary method since it was originally devised for work with the type of music
under investigation. The results of this experiment (Carter et a1. 2oooa) showed only
limited success (see Chapter 3) but this was enough to support the argument that
statistical methods could be beneficial to this research and that they are worthy of
further investigation as contributors to an integrative analysis approach. However they
did not validate further use of this particular method.
Chapter 6 - Discussion 124

The Implication Realisation (IR) model of Nannour (1977,1990, 1992), was
identified as a well tested cognitive based approach to music analysis, (box 5). This
method can be seen as being complementary to GTIM as it focuses on melodic
information rather than the more rhythmic focus of GTIM, though some argue that
they could be perceived as contradictory. The results of the GTTM and the IR model
analysis provided sets of attributes for each melody hence forming partial descriptions
of the musical features of that melody. The attributes were passed through SeeS which
resulted in successful classifications as reported previously and in both cases, most of
the attributes were used at some point as an aid to the classifications which meant that
the process was informative in terms of providing information about discriminatory
musical features. The cross referencing tool that is part of the SeeS software tool
meant that it was possible to trace derived rules back to the exact intervals on the
musical scores and hence to determine the musical features, patterns or contours that
featured more frequently in either the American or the Irish melodies. The successful
results of these experiments and the observation that the IR model analysis identified
different features to those identified by GTTM suggested that both of these methods
are informative as approaches to the analysis of folk dance music.
The results of the preliminary experiments showed that certain analysis methods for
Western art music are also suitable as analysis tools when exploring the
discriminatory features of Irish and American folk dance melodies for violin. The
preliminary experiments therefore enable Aim (1) to be met, and provide a basis for
further experimental work to determine an integrative analysis approach.
AIM (2) To derive an integrative method for the analysis of folk dance
melodies, drawing from existing key music analysis methods with a
view to finding the key characteristics that describe such sets of
melodies, hence highlighting any differences that accord to their
cultural background.
The sample of melodies in the preliminary experiments Was relatively small (fifteen
from each origin), but the results of the preliminary experiments prompted further
work using a larger sample of data and suggested a way forward as a way to meeting
Chapter 6 - Discussion 125
Aim (2). The preliminary experiments were therefore repeated; firstly using only the
new set of data (from Brody, 1983) in order to check that there was not too big a
discrepancy in the results due to the sources of infonnation being different (and
although there were some differences in the classification rates these were quite
small), and secondly using all sixty melodies, hence doubling the sample size.
O'Canainn's method was not repeated since the preliminary experiment showed it
deduced only limited infonnation about the music, but alternative statistical
approaches provided by the Humdrum toolkit were considered in Chapter 5.
The grouping preference rules of GTTM (plus the infonnation regarding metrical
deviations), combined with the analysis according to the bottom-up principles of
Nannour can be said to constitute an integrative approach to analysis in the context of
folk dance melodies. The two approaches complement each other in terms of what
they are able to reveal about the features of the melodies. From an analysis according
to both of these methods it is possible to identify significant information about the
differentiating features of the two styles of melodies. For example Narmour identifies
musical contours or surface patterns that appear more frequently in melodies from one
of the origins rather than the other; GTTM analysis identifies tendencies of the
melodies to have higher or lower frequencies of long notes, pitch jumps, slurring and
triplets. Hence a combination of these two approaches with the additional support of
statistical methods would satisfy Aim (2) of the work. The results of these
experiments were reported at the SMPC conference 2003 (Carter et aI, 2(03).
AIM (3) To evaluate the suitability of machine learning techniques as classifiers
for the problem domain.
The results of each analysis provided a series of attributes that describe certain
features of the music. In order to look for patterns in this data, classification software
was required (referred to earlier) and for this purpose SeeS (Quinlan, 1998) was
selected. The software was able to classify the melodies with a high degree of success
given the attributes derived from the analysis. The nature of the output (decision trees
and associated rules), and the facility to cross reference between rules and cases
meant that the results could be related to exact features of the music. This meant that
Chapter 6 - Discussion 126

the process of analysis and further interpretation of these results using SeeS enables
the researcher to find out more about the features of the melodies. and in particular
which features are special to each of their origins (either Ireland or America).
SeeS as an approach to classification has proved to be both efficient and informative
in this context. with a high level of transparency and therefore adopting SeeS as a tool
for interpretation of the analysis results goes some of the way to meeting Aim (3).
However. other decision tree induction software and other classification approaches
should be considered with a view to determining the most effective approach for the
task. In order to compare other tools with SeeS. data from the GTIM analysis were
used. The data was firstly passed through another well known software tool for
decision tree induction known as CART (Friedman. 1977) and secondly through a
neural network which is a different approach to classification within the domain of
machine learning (represented by boxes 9 and lOon Fig. 6.1). The results of the
classification using CART were similar to those of SeeS though the interface and
tools were not quite as suited to this particular task. The results of the classification
using the neural network were slightly better than with either SeeS or CART. but the
neural network approach is not transparent and therefore it is not possible to trace the
reasoning for the classifications back to the musical features. Neural networks are
often very good classifiers and if this is the main requirement of the activity then such
a solution may well be the best choice; but if it is important to know how and why the
software arrived at the classifications. decision tree induction is far more informative.
With software such as SeeS it is possible to trace every rule back to the cases that
caused the generation of that rule (this was not quite as easily done with CART.
though this is to do with the interface and the choice of facilities offered by the
software designers than the classification approach behind it). With a neural network
this process is not possible; the closest thing to achieving this kind of facility would
be to examine the final weights on the network and relate these to the attributes used
as the input. but it would be very difficult to translate back to the cases in this way
and the software is not designed with this activity in mind and therefore does not
provide any support for it.
Decision tree induction using SeeS was therefore observed to be the most suitable
approach for the interpretation of the music analysis results in this context.
Chapter 6 - Discussion 127

AIM (4) To propose a suitable representation scheme for the melodies for future
automation of the analysis.
The process of analysis according to the methods identified in this work is very time
consuming when performed manually and therefore proposals are made for the
development of an automated tool with which to carry out the analysis. In order to
automate the analysis process the issue of representation of the musical information
must be considered, and the proposal of an appropriate representation approach in this
context satisfies Aim (4). Approaches to music representation current in music
research are discussed in Chapter 5, enabling the selection of the Humdrum toolkit
(Huron, 1995) as the representation approach. This is a well documented and well
used system that is very flexible in terms of the type of data it can represent. It is
implemented as a free software toolkit which includes prescribed representation
syntaxes as well as the possibility for users to define their own; and in addition to this
there are a number of statistical analysis tools available that could therefore be used to
add more information to the integrative analysis method as required. The statistical
analysis reported by Jarvinen et a1. (1999) was performed using the Humdrum toolkit
and therefore supports this as an approach for the statistical analysis component of the
integrative analysis method.
There are already a number of pieces of music that are encoded in Humdrum syntax
available for researchers to use, and there are tools to enable pieces of music already
represented using earlier representation schemes to be translated into Humdrum files.
Currently the represented music available includes mainly art music and some folk
music but this is mainly folk song. The Essen database in particular has a very large
number of folk songs encoded in a form that is translatable to Humdrum and that have
been used extensively in previous research. The lack of instrumental folk music in this
collection is noticeable and encoding the music from these experiments could be a
way of starting an instrumental folk music collection to complement the Essen
database. Humdrum is rapidly becoming the most used representation scheme and is
substantially reducing the pre-processing tasks for many researchers.
Chapter 6 - Discussion 128

AIM 5:To propose an appropriate approach to program development for the
automation of folk dance music analysis.
The focus in attempting to meet Aim (5) was on the choice between an artificial
intelligence (AI) approach (Le. a declarative language such as Prolog) and a more
traditional approach (i.e. procedural languages). Although either type of language
could be used for the development of such a tool, there are more arguments (presented
more fully in Chapter 5) in favour of using an AI approach. These are mainly centred
on the flexibility that such an approach would provide by enabling a more holistic
view of the programming task which supports the explorative nature of this research.
Additionally, the interest in developing the field of AI is in itself a justification for
working with this approach, so that two-fold benefits can be observed. The
observations of Schaffer et al. (1997, 24) express this view successfully: "AI
continues to strive toward the laudatory goal of exploring the human mind. What is
left in its wake, however, is a technology that is finding increasingly practical use".
Music is undoubtedly a cognitive process and therefore provides a suitable basis for
AI research, whilst an AI approach to programming suits the imprecise nature of
music research to a greater extent than traditional approaches. It was therefore
proposed that the automated tool be programmed in a language such as Prolog.
6.3 Conclusion
In conclusion, the results of the reported experiments support the proposal for an
integrative analysis approach based on the lower level (or local level) grouping
preference rules (and to a limited extent the metrical preference rules) of GTIM and
the five bottom-up principles of Nannour's Implication Realisation Model. Analysis
according to this integrative method can derive characteristics that describe the
surface of the music and that enable discrimination between the styles. A suitable
approach to automating the analysis method would be to represent the musical
information using the Humdrum syntax and additionally to make use of statistical
tools available as part of the Humdrum toolkit. Statistical tools can provide more
information as required about other features of the music, for example, 'durationless'
Chapter 6 - Discussion 129
notes such as acciaccaturas, that are not identified by the other elements of the
integrated approach.
It is then proposed that a tool be developed using a declarative language such as
Prolog in order to analyse the represented musical information according to the
integrative method. The results of the analysis can be interpreted in order to find the
discriminatory stylistic characteristics of the musical surface using a decision tree
induction tool, SeeS.
The explorative approach taken to the research has meant that there were not too
many restrictions on the direction taken, and hence that additional experiments and
investigations previously not considered could be undertaken when the opportunities
arose. A more prescriptive approach to the work might have led to more definite
solutions and in a stricter time frame. but limiting the boundaries in this way might
have left fruitful avenues unexplored. The work has addressed the identified aims
successfully and has also created the potential for further related work.
Chapter 7 concludes by explaining how this work has contributed to knowledge and
makes recommendations for future related work
Chapter 6 - Discussion 130

CHAPTER 7 - Conclusions and Further Work
7.1 Overview
This thesis has addressed the issue of the application of analysis techniques for
Western art music to Western folk dance melodies for violin. with a view to enabling
the development of a computer tool that can aid in the identification and exploration
of the stylistic characteristics of the origin of the melodies. An integrative approach to
analysis that can be carried out in an algorithmic way is identified hence lending itself
to future implementation on computer.
A brief summary of the content of each Chapter is given in the following paragraphs.
Chapter 2 reviewed approaches to the analysis of Western tonal music and its
applications. The current most frequently cited and well tested approaches were
identified as being the Generative Theory of Tonal Music (GTIM). devised by
Lerdahl and Jackendoff. and the Implication Realisation (IR) model of Narmour.
These two approaches were developed by researchers with different views on
cognitive based music analysis and could be considered to be contradictory in nature
though it is becoming increasingly apparent that they are in fact complementary.
Evidence was also found that indicates statistical analysis methods provide more than
basic quantitative information and that the results of statistical analysis can to some
extent reflect the way that human listeners interpret music as they hear it. Chapter 2
also explores the context of folk music. emphasising the effects of geographical
movement on melodies as groups of people migrate. the focus here was on Irish
settlers in America.
Chapter 3 presents some preliminary experiments in which thirty folk dance melodies
(fifteen Irish and fifteen American) are analysed according to GTIM. the IR model.
and a statistical method devised by O'Canainn (1978). An experiment to compare the
classification of the melodies based on the results of such analysis with classification
by human listeners is also reported. These experiments showed that there is
significant potential in using methods such as GTIM and the IR model, and that their
Chapter 7 - Conclusions and Further Work 131

classification accuracies are comparable to those of human listeners. The statistical
method was less successful but there was enough evidence to suggest that alternative
statistical methods could be useful in terms of the type of supplementary information
they can provide, and as we see in Chapter 5 there are a number of statistical tools
available as part of the Humdrum toolkit.
Chapter 4 firstly presents an experiment with human listeners to determine the order
of preference of GPRs in this context and that therefore enables the GTTM analysis to
be carried out in an algorithmic way with a view to future automation. The
preliminary GTTM analysis was revisited after the completion of this experiment.
Further analyses with larger samples of melodies (a total of sixty melodies this time,
thirty from each of the two origins) were then carried out according to the grouping
(and to a limited extent the metrical) preference rules of GITM, and the IR model, in
order to ensure that the results held. The results showed that GTfM and the IR model
are able to identify features from the melodies that highlight differences in the styles
according to their origin. and that the features highlighted by each approach
complemented each other. It was therefore proposed that the lower level grouping
preference rules of GTTM and the IR model can be combined as an integrative
approach to the analysis of Western folk dance melodies for violin.
All of the analyses provided attributes associated with the melodies and for each
experiment these attributes were passed through the decision tree induction software
known as SeeS (Quinlan 1998) in order look for characterising patterns in the data.
The later part of Chapter 4 looks at alternative approaches to classification and
considers a software tool known as CART (Friedman, 1977) for decision tree
induction, and a neural network. It was found that the neural network was slightly
better as a classifier in this context, whilst CART and SeeS produced similar results.
However, the transparency of the decision tree induction approach makes it superior
to the neural network for this purpose.
Chapter S focuses on proposals for the future automation of the analysis process,
beginning by reviewing approaches to representation of music on computer. There is
much research on this subject and a number of representation schemes have been
devised. The two most suitable approaches for representation of the music in this
Chapter 7 - Conclusions and Further Work 132

work were found to be CHARM, a framework for music representation developed at
the University of Edinburgh and Humdrum developed at Ohio State University. On
balance Humdrum was selected as the best approach. The reasons for this include the
following: there is more recent work on Humdrum, it is well documented, and it is
implemented as a software toolkit with a large amount of flexibility in tenns of how it
is used. There are already a large number of pieces of music available encoded using
Humdrum syntax (over 6500 pieces of music) and there are translation tools to enable
music represented in older schemes to be transferred. Humdrum is becoming a fonnat
for a worldwide database of musical infonnation with which researchers can work. In
addition it provides a range of statistical analysis tools which could be used as
required to complement the proposed integrative analysis approach.
The later part of Chapter 5 considers approaches to the program development of an
automated analysis tool, given that the representation of the musical data would be
using the Humdrum syntax (the Kern Code). Arguments are presented in favour of an
artificial intelligence (AI) approach using a declarative language such as Prolog.
Chapter 6 reviews and discusses the work of the thesis indicating how it has enabled
the identified aims to be met. This can be summarised as follows:
• Music analysis techniques developed for Western art music have been applied
in the context of Western folk dance melodies for violin and it was found that
these methods are able to extract infonnation from the musical data in such a
way that classifications of the melodies according to their stylistic origin can
be made.
• An integrative analysis method has been proposed that is a combination of the
lower level grouping preference rules of GTIM, to a limited extent the
metrical preference rules of GTIM, and the five bottom-up principles of the
IR model.
• Decision tree induction has been identified as the most appropriate approach
for finding the stylistic features of the melodies amongst the data produced
from the analyses.
Chapter 7 - Conclusions and Further Work 133

• The Humdrum toolkit has been identified as the most appropriate approach to
representation of the musical information. and a declarative approach to
programming for the development of an automatic analysis tool has been
proposed.
7.2 Contributions to Knowledge
This work has contributed to knowledge as follows:
• Existing music analysis techniques for Western art music have been applied in
the context of folk dance music for violin. Evidence for this can be found in
the experiments described in Chapters 3 and 4.
• The ability for human listeners to classify music to a similar level of accuracy
as the analysis and classification process using GTIM and inductive learning
software has been verified in this context. The experiment to demonstrate this
is described in Chapter 3.
• Lerdahl and Jackendoffs order of preference for grouping preference rules has
been furthered in the context of folk dance melodies for violin. A method for
applying the grouping preference rules of GTIM algorithmically in this
context was derived from the results of an experiment to find preferences of
listeners where there are conflicts of potential boundaries. The experiment is
reported in Chapter 4.
• Decision tree induction has been applied as an approach to classification and
also as an appropriate method for interpretation of the analysis results in the
context of folk dance melodies for violin. Experimental work performing this
application is reported in Chapters 3 and 4, and a comparison of two decision
tree induction tools with a neural network approach is presented in Chapter 4.
• An indication of how certain types of ornamentation might be represented
using the CHARM framework for music representation, and a demonstration
of how representations in the CHARM framework might be translated into
Kern Code (part of the Humdrum syntax) have been presented in Chapter 5.
Chapter 7 - Conclusions and Further Work 134

There is currently no evidence for either of these in any of the associated
literature.
7.3 Further work
7.3.1 Further Investigation of Order of Preference of GPRs
When perfonning GTTM analysis potential conflicts between the local level
GPRs are observed. An order of preference of listeners for GPRs is given in the
text of Lerdahl and Jackendoff, but the infonnation was found to be incomplete
which would be a problem if computer implementation of the analysis was to be
undertaken. Previous researchers have handled this in different ways, Robbie and
Smaill (1995) for example implemented the grouping preference rules as a
computer tool but allowed users to interact with it where potential boundary
conflicts arose. The purpose of their tool was to teach the user about GTTM rather
than to produce an analysis for other reasons (such as stylistic classification).
Deliege (1987) canied out experiments to identify an order of preference of the
rules in the context of Western art music. For the experiments reported in this
thesis, the missing information in l..erdah and Jackendoffs text was added by
devising an experiment to find out the listeners' order of preference of the
remaining rules within the context of this music. This experiment (reported in
Chapter 4) supplied strong enough evidence to enable a general order of
preference to be derived, making it possible to revisit the preliminary experiment
and complete the analysis according to the lower level GPRs in an algorithmic
way. With more time, it would be a useful exercise to find out an order of
preference for all of the rules in this context and then compare this to the results of
Deliege.
The experiment raised other issues which suggested potential for further related
work. For example, two of the ten subjects described difficulty in making a
decision between two possible positions (the second being one note after the
potential boundary according to GTIM). This occurred in two of the examples
and in both cases it indicated support for the idea of postponed segmentation
Chapter 7 - Conclusions and Further Work 135

reported in a further experiment by Deliege (1987). The majority of subjects in the
experiment reported in this thesis did pick the boundary predicted by the grouping
preference rules, but the comments of some of the subjects combined with the
findings of Deliege, suggest further work in this area.
7.3.2 Representation and Implementation of an Analysis Tool
It would be useful to implement the proposed analysis tool in order to test the
analysis approach on larger samples of data and also on melodies from other
origins. For example there are dance melodies for violin that are of Swedish origin
and some that are French; these could be investigated using the same approach.
Encoding the melodies in the Kern Code of the Humdrum syntax could be the
beginning of a new database of instrumental melodies that are available for
researchers, in the same way as the Essen database provides a large dataset for
research into folk song.
7.3.3 Capture of Musical Data
Improved methods of capturing musical information (regardless of the required
representation format) are an important long term goal for many music
researchers. The facility to be able to play the music and for the representation to
recognise the features such as slurs, ornaments (as well as the note pitches and
lengths) and encode them correctly for further analysis would be a great
improvement and deserves further investigation.
7.4 In Conclusion
This thesis has identified the suitability of music analysis techniques for Western
art music for analysis of folk dance melodies for violin, and has shown that in this
context two key methods (those of Lerdahl and Jackendoff, and of Narmour) can
be combined to form an integrative approach.
Chapter 7 - Conclusions and Further Work 136

It has been shown that in this context human listeners can be trained to classify
melodies as either Irish or American with a similar level of accuracy to that of the
analysis and computer classification process. The reasons given for classification
appeared to be related to those identified by the analysis.
During the analysis using Lerdahl and lackendoffs analysis method, limitations
were identified in relation to handling certain conflicts in grouping preference
rules. An experiment to investigate a possible order of preference for the rules in
this context was undertaken and the results were conclusive, enabling the GTIM
analysis to be carried out in a fully algorithmic way.
The integrated analysis method could therefore be implemented as a computer
tool in the future, and the discussion and investigation presented in Chapter 5
resulted in the suggestion that the Humdrum representation method is adopted
along with a declarative approach to program development.
As a result, the thesis has satisfied the aims as identified in Chapter 1 and
represents an original contribution to knowledge in the interdisciplinary field of
computer aided music analysis.
Chapter 7 - Conclusions and Further Work 137

References
Associated Board of Royal school of Music, 1958. Rudiments and Theory of Music,
Associated Board Publications
Balaban, M. 1996. The Music Structures Approach to Knowledge Representation for
Music Processing, Computer Music Journal, 20(2), 96-111.
Balaban, M. 1992. Music structures: interleaving the temporal and hierarchical
aspects in music. In O. Laske, M.Balaban, and K. Ebcioglu, cds. 1992. Understanding
Music with AJ- Perspectives on Music Cognition. MIT Press, 110-139.
Barbar, K., Desainte-Catherine M., Miniussi, A. 1993. The Semantics of Music
Hierarchies, Computer Music Journal, 17(4),30-37.
Berger, J. 1995. Book Review: David Cope, Computers & Musical Style, Artificial
Intelligence, 79(2), 343-348.
Bernstein, L. 1976. The Unanswered Question: Six Talks at Harvard, Harvard
University Press.
Bohlman, P. 1988. The Study of Folk Music in the Modern World, Indiana.
Boswijk, M. 1999. On a Generative Theory of Pop Music. In Proceedings of Society
for Music Perception and Cognition 1999 Conference, 51, Northwestern University,
Illinois, USA.
Bratko, I. 1990. Prolog Programming for Artificial Intelligence, Addison-Wesley.
Breathnach, B. 1971. Folk Music and Dances of Ireland, Ossian.
Brody, 1983. The Fiddlers' Fakebook, Oak Publications.
138

Brush, R., Hauser, M., Spencer, G., Standish, J. 1993. Book Review, David Cope:
Computers & Musical Style, Computer Music Journal, 17(3),70-81.
Callear, D. 1994. Prolog Programming for Students, DP Publications.
Cambouropoulos, E.1995. A General Pitch Interval Representation: Theory &
Applications, In Proceedings of International Conference of Music and Artificial
Intelligence 1995, 75-90, Edinburgh University, UK.
Camilleri, L. 1992. Computational Theories of Music: Theoretical and Applicative
Issues, In Computer Representations in Music. Eds: Marsden, A. & Pople, A. 1992.
171-185, Academic Press.
Carter, J. Brown, M. Eaglestone, B. Hodges, R. 1999. Inductive Learning for Musical
Style Classification, In Proceedings of Society for Music Perception and Cognition,
conference 1995, 55, Northwestern University, Illinois, USA.
Carter, 1. Brown, M. Eaglestone, B. 2000a. Style Analysis for Folk Melodies, with
Classification using Inductive Learning. In Proceedings of us Joumees
d'lnformatiqe Musicale Conference 2000, 181-190, University of Bordeaux, France.
Carter, 1. Brown, M. Eaglestone, B. 2000b. An Analysis and Classification of Folk
Melodies, using a Hybrid Approach with Inductive Learning. In Proceedings of
Society for Music Perception and Cognition conference 2000, 167, University of
Toronto, Canada.
Carter, J. Brown, M. Eaglestone, B. 2001. A comparison of folk music analysis using
GTIM and human listeners. In Proceedings of Society for Music Perception and
Cognition conference 2001, 60-61, Queens University, Kingston, Ontario, Canada.
Carter, 1. Brown, M. Eaglestone, B. 2003. A comparison of folk music analysis using
The Implication-Realisation Model and GTIM. In Proceedings of Society for Music
Perception and Cognition conference 2003,50, University of Nevada, USA.
139
Cawsey, A. 1998. The Essence of Artificial Intelligence, Prentice-Hall.
Cook, N. 1987. A Guide to Music Analysis, Oxford University Press.
Cook, N. 1998. Music: A Very Short Introduction, Oxford University Press.
Cope, D.1991. Computers and Musical Style, Oxford University Press.
Cuddy, L. Lunney. C.A. 1995. Expectancies generated by melodic intervals:
percsptual judgments of melodic continuity. Perception and Psychophysics. 57(4).
451-462.
Dannenberg. R.B. 1993. Music Representation Issues. Techniques. and Systems.
Computer Music Journal. 17(3). 20-30.
Dawson. C.W. Brown. M. and Wilby. R. (2000) Inductive Learning Approaches to
Rainfall-Runoff Modelling. International Journal of Neural Systems. Elsevier
Science. 10(1).43 - 57
De Bellis 1999, Mental Representation and self-knowledge in Cognitive Music
Theory. In Proceedings of Society for Music Perception and Cognition. 56.
Northwestern University. I11inois. USA.
Dowling. W.J. & Harwood. D.L. 1986. Music Cognition. Academic Press.
Eaglestone. B. 1994. An Artistic Design System. In Proceedings ojSOFSEM 1994,
15-37. Association of Computing Machinery.
Eerola, T., Jllrvinen, T., Louhivuori, J., & Toiviainen, P. 2001. Statistical features and perceived similarity of folk melodies. Music Perception, 18(3),275-296.
Erickson, R.F. 1975. The DARMS projects: a status report, Computing and the Humanities, 9, 291-298.
Erickson, R. F. 1977. MUSICOMP 76 and the State of DARMS. College Music
Symposium, 90-101.
140

Fawcett, T. 2003. ROC Graphs: Notes and Practical Considerations for Data Mining
Researchers, In HP Laboratories Technical Reports 2003-4, HP Laboratories, CA.
Ford, N. 1989. Prolog Programming, Wiley.
Foxley, 2001. Web page, http://www.cs.nott.ac.ukl%7Eef/musiclindex.htm or via
http://www.joy-and-eric.org.ukl
Friedman, J.H. 1977. A recursive partitioning decision rule for non-parametric
classification, IEEE transactions on computers, 404-408.
Harris, M., Smaill, A., Wiggins, G. 1991. Representing Music Symbolically. In
Proceedings of IX Colloquio di Informatica Musicale, 55-69.
Hantz, E. 1985, Review of Generative Theory of Tonal Music, Music Theory
Spectrum, Vol 7, 190-202
Horowitz, D. 1995. Representing Musical Knowledge: Processing Melodies Lines in
a Jazz Improvisation System. In Proceedings of ICMA11995, 103-118, Edinburgh
University.
Huron, D. 1992. Design PrinCiples in Computer-based Music Representation. In
Computer Representation in Music. Eds: Marsden, A. & Pople, A. 1992, 5-39,
Academic Press.
Huron, 0.1994. Unix Toolsfor Music Research: The Humdrum Toolkit Reference
Manual. Menlo Park, CA: Centre for Computer Assisted Research in the Humanities.
Huron, D. 1997. Humdrum and Kern: selective feature encoding. In Beyond MIDI:
The Handbook of Musical Codes. Ed. Selfridge-Field, E. 1997,375-401, MIT Press,
Cambridge, Mass.
141
Jackendoff, R. 1987. Consciousness & the Computational Mind, MIT Press,
Cambridge, Mass.
Jarvinen, T. Toiviainen, P. Louhiviori, 1. 1999. Classification & Categorisation of
Musical Styles with Statistical Analysis and Self-Organising Maps, In Proceedings of
Artificial Intelligence & Simulation of Behaviour, 54-57. Edinburgh University.
Kennedy, 1996. Oxford Concise Dictionary of Music. Oxford University Press.
Krassen, M. 1976. O'Neill's Music of Ireland. Oak Publications.
Krumhansl, C. L. Kessler, E. 1982. Tracing the dynamic changes in perceived tonal
organization in a spatial representation of musical keys. Psychological Review.
1989(4).334-368.
Krumhansl, C. L. 1991. Music psychology: Tonal structures in perception
and memory. Annual Review of Psychology, 42,277-303.
Krumhansl. C. L. 1995. Music psychology and music theory: Problems and
prospects. Music Theory Spectrum, 17(1), 53-90.
Krumhansl. C. L. 2000. Rhythm and pitch in music cognition. Psychological
Bulletin, 126, 159-179.
Krumhansl. C. L .• Louhivuori. J .• Toiviainen. P., Jlkvinen, T., & Berola, T. 1999.
Melodic expectancy in Finnish Spiritual folk hymns: Convergence of behavioural,
statistical, and computational approaches. Music Perception 17, 151-196.
Krumhansl, C. L., Toivanen, P., Eerola, T., Toivianinen, P., Jl1rVinen, T., &
Louhivuori, J. 2000. Cross-cultural music cognition: Cognitive Methodology applied
to North Sami yoiks. Cognition, 75, 1-46.
Lerdahl, F & lackendoff, R.S. 1983, 1996. A Generative Theory of Tonal Music. MIT
Press. Cambridge, Mass.
142
Lerdahl, F. 2001. Tonal Pitch Space, Oxford University Press.
Lomax, A. 1968. Folk Song Style and Culture, Transaction Books.
Marsden, A. & Pople, A. 1992. Introduction: Music, Computers & Abstraction, In
Computer Representation in Music. Eds:Marsden, A. & Pople, A. 1992. 1-4,
Academic Press.
Meyer, L. 1956. Emotion and Meaning in Music, University of Chicago Press.
Meyer, L. 1989. Style and Music, University of Chicago Press.
Mitchell, T. 1997. Machine Learning, McGraw-Hill.
Narmour, E. 1977. Beyond Schenkerism: The Need for Alternatives in Music Analysis.
University of Chicago Press.
Narmour, E. 1990. The Analysis and Cognition of Basic Melodic Structures: The
Implication-Realisation Model. University of Chicago Press.
Narmour, E. 1992. The analysis and Cognition of Melodic Complexity, University of
Chicago Press.
Nettl, 1973. Folk and Traditional Music of the Western World, Prentice-Hall.
O'Canainn, T. 1978, 1993. Traditional Music in Ireland, Ossian.
O'hAllmhurain, O. 1998. A Pocket History of Irish Traditional Music, O'Brien.
O'Maiden, D. 1992. Representation of Music Scores for Analysis, In Computer
Representations in Music. Eds: Marsden ,A. & Pople,A. 1992.67-94, Academic Press.
143

Pachet, 1996. Representing Temporal Musical Objects and Reasoning in the musES
System, Journal of New Music Research 25(3), 253-73.
Palmer C. Krumhansl C. 1987. Independent temporal and pitch structures in
determination of musical phrases, Journal of Experimental Psychology, 13, 116-126.
Pearce, M. Wiggins, G. 2001. Towards a framework for the evaluation of machine
composition. In Proceedings of AISB'OI Symposium on AI and Creativity in Arts and
Science, ed. Wiggins, G. City University, London.
Phillips, S. 1989. Fiddle Case Tunebook: Old-Time Southern, Amsco Publications.
Pope, 1992. The Smallmusic Object Kemal: A music representation, description
language, and interchange format. In proceedings 0/ICMC1992, 106-109, CMA, San
Francisco, CA.
Putnam, K. 1997. David Cope EMI, Computer Music Journal, 21(3) 102-103.
Quinlan, J. R. 1993. C4.5: Programs/or Machine Learning, Morgan.
Quinlan, J.R. 1998. Is See5/C5 better than C4.5? http://www.rulequesl.com!see5-
comparison.html, Rulequest Research.
Raffman, D. 1993. Language, Music and Mind, MIT Press.
Rich, E. Knight, 1991. Artificial Intelligence, McGraw-Hill.
Roads, 1996. The Computer Music Tutorial, MIT Press.
Robbie, C. & Smaill, A. 1995. Implementing a Generative Grammar for Music,ln
Proceedings 0/ ICMAl1995, 91-102, Edinburgh University.
Rowe, R.1993.lnteractive Music Systems, MIT Press.
144

Rowe, R. 1995. Artificial Intelligence and Musical Interaction, In proceedings 0/ ICMAl1995, 3-11, Edinburgh University.
Schaffer, 1. McGee, D. 1997. Knowledge Based Programming/or Music Research,
A-R Editions.
Schaffrath, H. 1995. The Essen Folksong Collection in the Humdrum Kern/omrat,
D.Huron (ed.). Menlo Park, CA: Centre for Computer Assisted Research in the
Humanities.
Schaffrath, 1997. The Essen associative code: a code for folksong analysis. In Beyond
MIDI: The Handbook 0/ Musical Codes, Ed. E. Selfridge-Field, 1997, 344-359, MIT
Press, Cambridge, Mass.
Schellenberg, E.G. 1996. Expectancy in Melody: Test of the implication-realization
model, Cognition, 58, 75-125.
Schellenberg, E.G. 1997. Simplifying the implication-realization model, Music
Percetion, 14(3),295-318.
Selfridge-Field, 1997. DARMS, its dialect, and its uses, in Beyond MIDI: The
Handbook o/Musical Codes,. Ed. E. Selfridge-Field, 1997, 163-173, MIT Press,
Cambridge, MA.
Serman, M. Griffith, N. 2000. Computational modelling of segmentation processes in
unaccompanied melodies. In Proceedings o/ICMPC 2000, Keele University.
Sen,W. & Haihong, Z. 1992. Scale-Tone Functions & Melodic Structure in Chinese
Folk Music, In Computer Representations in Music. Eds: Marsden, A. & Pople, A.
111-120, Academic Press.
Sloboda, J. 1985. The musical mind: the cognitive psychology o/music, Oxford
University Press.
145

Smaill, A., Wiggins, G., Miranda, E. 1993a. Music Representation - between the
Musician and the Computer, Automatic Characterisation of Musical Style. In Music
Education: An AI Approach, Eds. M. Smith, G. Wiggins, A. Smaill. 157-170,
Springer Verlag.
Smaill, A.,Wiggins, G., Harris, M. 1993. Hierarchical Music Representation for
Composition and Analysis. Computing and the Humanities, 27, 7-17.
Smaill, A. Wiggins, G. Miranda, E.1993b. Music Representation - Between the
Musician and the Cmoputer, In Proceedings of World Conference on Al and
Education workshop on Music Education, Edinburgh.
Sundberg, J. Lindblom, B. 1976. Generative theories in language and music,
Cognition, 4, 99-122.
Tanguaine, A.1992. An Analytical Approach to Musical Perfonnance, In Computer
Representations in Music. Eds: Marsden, A. & Pople, A. 121-142, Acdemic Press.
Taube, H. 1993. Persistent score representation and score editing in common music,
Computer Music Journal, 17(4) 38-50.
Thompson. W.F., Cuddy. L.L. & Plaus, C. 1997. Expectancies generated by melodic
intervals: Evaluation of principles of melodic implication in a melody completion
task. Perception & Psychophysics, 59(7). 1069-1076.
Thompson. W.F. & Stainton, M. 1998. Expectancy in Bohemian folk song melodies:
Evaluation of implicative principles for Implicative and closural intervals. Music
Perception, 15(3).231-252.
Westhead. M. Smaill. A. 1993. Automatic Characterisation of Musical Style. In Music
Education: An Artificial Intelligence Approach, Eds: M. Smith. O. Wiggins, A.
Smaill, 1992157-170. Springer-Verlag.
146
Wiggins, G., Harris. M .• Smaill. A. 1989. Representing Music for Analysis and
Composition. VAl Research Paper No. 609, Edinburgh University.
Wiggins, G. Miranda. E. Smaill, A. Harris, M. 1993. A Framework for Evaluation of
Music Representation Schemes, Computer Music Journal, 1993. 17(3) 31-42.
Wiggins, G., Smaill. A. 2000, Musical Knowledge: What can Artificial Intelligence
bring to the Musician? In Readings in Music and Artificial Intelligence. Ed. Miranda
E. Harwood Academic Publishers.
147

APPENDICES
1

Appendix B - Test Data
Appendix Bl - Test Data for GTTM analysis
List of attributes and associated data types GPR 1: continuous. GPR2a: continuous. GPR2b: continuous. GPR3a: continuous. GPR3b: continuous. GPR3c: continuous. GPR3d: continuous. meCdeviations: continuous.
Attribute values. The data is presented in the order resulting from the analysis of melodies taken firstly from Philips, then Krassen, and then Brody.
7,0, 16,4,0,0,3,0,american. 7,2,8,2,0,10,0,0,american. 2,0,2,3,0,20,0,0,american. 19,0,8,1,0,17,0,0,american. 8,2,3,1,0,18,3,I,american. 8,0,9,5,0,7,0,0,american. 3,0,6,1,0,11,5,0,american. 0,3,1O,0,0,3,1,0,american. 8,0,4,1,0,17,3,0,american. 9,0,4,1,0,12,4,I,american. 4,0,4,2,0,19,1,0,american. 12,2,8,1 ,0, 17,0,0,american. 9,2,4,1,0,14,2,0,american. 22,0,6,1,0,21,1,0,american. 10, 1, 14,7,0,9,0,0,american. 3,0,9,2,0,8,3,3,irish. 2,0,8,1,0,6,0,0,irish. 2,0,5,3,0,6,5,3,irish. 2,0,2,2,0,8,2,1 ,irish. 0,0,4,1,0,6,12,II,irish. 1,0,5,1,0,6,4,3,irish. 2,0,11,5,0,4,7,7,irish. 3,0,4,4,0,4,7,7,irish. 2,0, 13,0,0,2,4,4,irish. 1,0,4, I ,0,5,7 ,4,irish. 2,0,3,3,0,14,5,3,irish. 2,0,0,4,0,6,16,10,irish. 8,0,5,4,0,7, 10,9 ,irish. 3,0,6,0,0,5,10,7,irish. 3,0,5,4,0,8,1O,7,irish.
Appendices 66
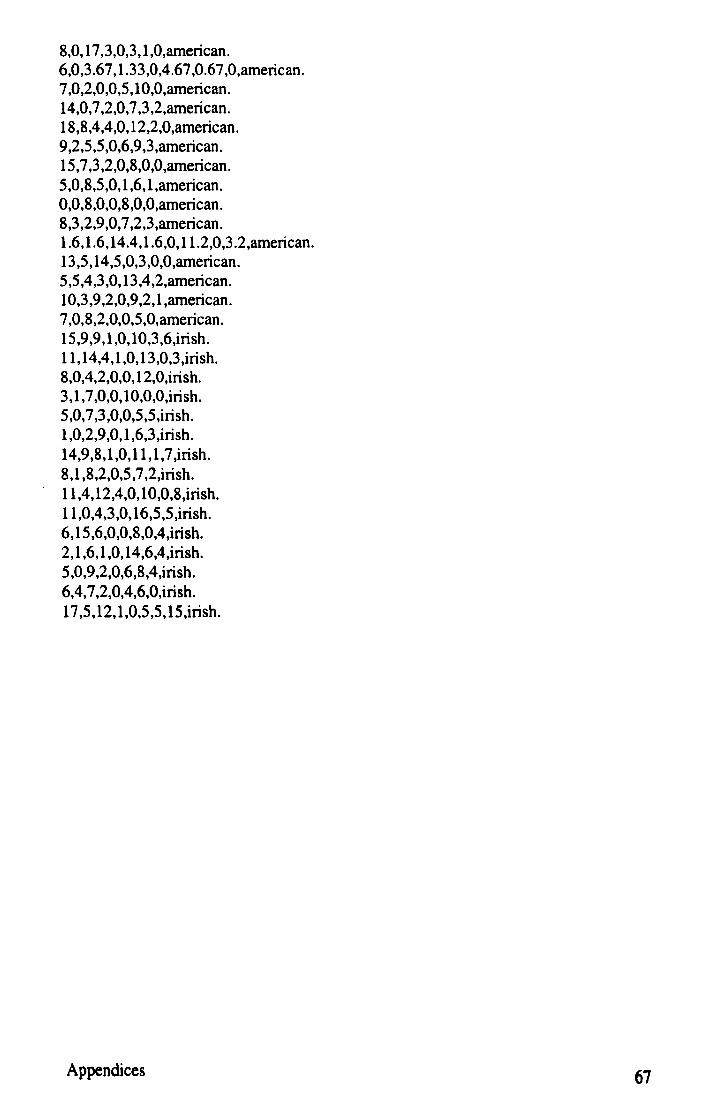
8,0, 17,3,0,3,1,0,american. 6,0,3.67,1.33,0,4.67,0.67,0,american. 7,0,2,0,0,5,10,0,american. 14,0,7,2,0,7,3,2,american. 18,8,4,4,0, 12,2,0,american. 9,2,5,5,0,6,9,3,american. 15,7,3,2,0,8,0,0,american. 5,0,8,5,0,1,6,I,american. 0,0,8,0,0,8,0,0,american. 8,3,2,9,0,7,2,3,american. 1.6,1.6,14.4,1.6,0,11.2,0,3.2,american. 13,5, 14,5,0,3,0,0,american. 5,5,4,3,0, 13,4,2,american. 1O,3,9,2,0,9,2,1,american. 7,0,8,2,0,0,5,0,american. 15,9,9,1,0,10,3,6,irish. 11,14,4,1,0,13,0,3,irish. 8,0,4,2,0,0, 12,0,irish. 3,1,7,0,0,10,0,0,irish. 5,0,7,3,0,0,5,5 ,irish. 1,0,2,9,0,1,6,3,irish. 14,9,8,1,0,11,1,7,irish. 8,1,8,2,0,5,7,2,irish. 11,4,12,4,0,10,0,8,irish. 11,0,4,3,0,16,5,5,irish. 6,15,6,0,0,8,0,4,irish. 2,1,6,1,0,14,6,4,irish. 5,0,9,2,0,6,8,4,irish. 6,4,7,2,0,4,6,0,irish. 17,5,12,1,0,5,5,15,irish.
Appendices 67
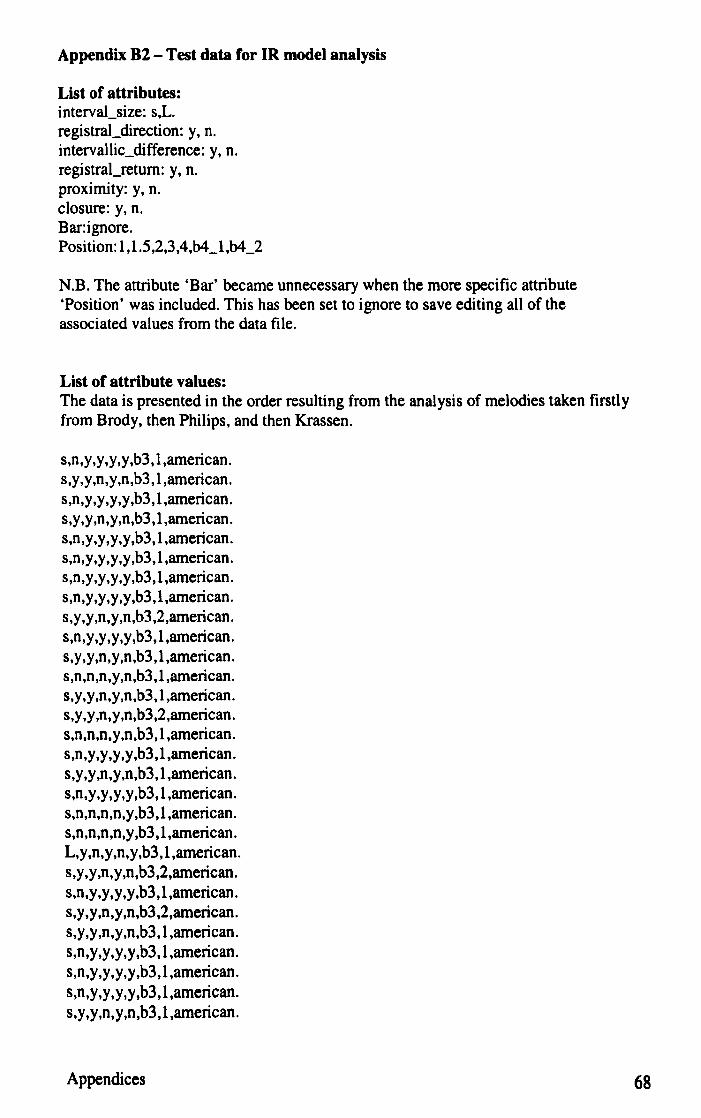
Appendix B2 - Test data for IR model analysis
List of attributes: intervaLsize: s,L. registral_direction: y, n. intervallic_difference: y, n. registral_retum: y, n. proximity: y, n. closure: y, n. Bar:ignore. Position: 1, 1.5,2,3,4,b4_1,b4_2
N.B. The attribute 'Bar' became unnecessary when the more specific attribute 'Position' was included. This has been set to ignore to save editing all of the associated values from the data file.
List of attribute values: The data is presented in the order resulting from the analysis of melodies taken firstly from Brody, then Philips, and then Krassen.
s,n,y,y,y,y,b3,1,american. s,y,y,n,y,n,b3,1,american. s,n,y,y,y,y,b3,1,american. s,y,y,n,y,n,b3,1,american. s,n,y,y,y,y,b3,1,american. s,n,y,y,y,y,b3,1,american. s,n,y,y,y,y,b3,1,american. s,n,y,y,y,y,b3,1,american. s,y,y ,n,y ,n,b3,2,american. s,n,y,y,y,y,b3,1,american. s,y,y,n,y,n,b3,l,american. s,n,n,n,y ,n,b3, 1 ,american. s,y,y,n,y,n,b3, 1 ,american. s,y,y,n,y,n,b3,2,american. s,n,n,n,y ,n,b3,l ,american. s,n,y,y,y,y,b3,1,american. s,y,y,n,y,n,b3,1,american. s,n,y,y,y,y,b3,1,american. s,n,n,n,n,y ,b3, 1 ,american. s,n,n,n,n,y ,b3, 1 ,american. L,y,n,y,n,y,b3,l,american. s,y ,y ,n,y ,n,b3,2,american. s,n,y,y,y,y,b3, 1 ,american. s,y,y,n,y,n,b3,2,american. s,y,y,n,y,n,b3,l,american. s,n,y,y,y,y,b3,1,american. s,n,y,y,y,y,b3,1,american. s,n,y,y,y,y,b3,1,american. s,y,y,n,y,n,b3,1,american.
Appendices 68
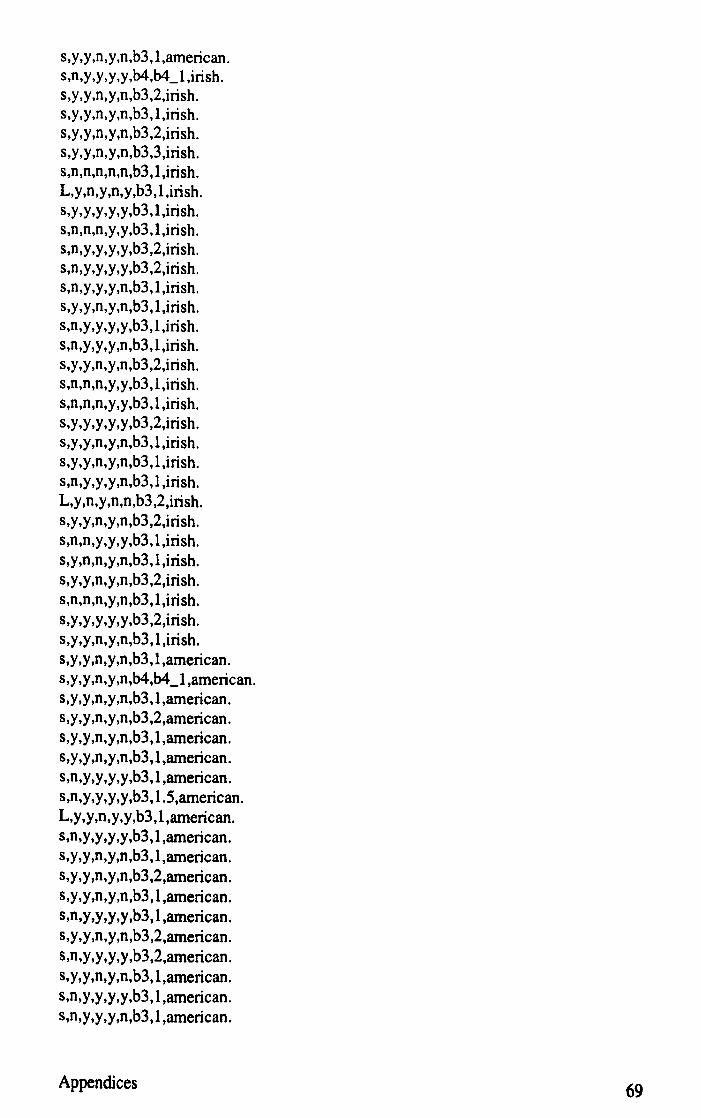
s,y,y,n,y,n,b3,1,american. s,n,y ,y ,y ,y ,b4,b4_1 ,irish. s,y ,y ,n,y,n,b3,2,irish. s,y ,y,n,y,n,b3, 1 ,irish. s,y ,y ,n,y ,n,b3,2,irish. s,y ,y ,n,y ,n,b3,3,irish. s,n,n,n,n,n,b3,1,irish. L,y,n,y,n,y,b3,I,irish. s,y,y,y,y,y,b3, I ,irish. s,n,n,n,y ,y ,b3, I ,irish. s,n,y ,y ,y ,y ,b3,2,irish. s,n,y ,y ,y ,y ,b3,2,irish. s,n,y ,y ,y ,n,b3, 1 ,irish. s,y ,y ,n,y ,n,b3, 1 ,irish. s,n,y,y,y,y,b3, 1 ,irish. s,n,y,y,y,n,b3, 1 ,irish. s,y ,y ,n,y,n,b3,2,irish. s,n,n,n,y,y ,b3, 1 ,irish. s,n,n,n,y,y ,b3, 1 ,irish. s,y ,y ,y ,y ,y ,b3,2,irish. s,y ,y ,n,y ,n,b3, 1 ,irish. s,y ,y ,n,y,n,b3, 1 ,irish. s,n,y,y,y,n,b3,1,irish. L,y ,n,y ,n,n,b3,2,irish. s,y ,y ,n,y ,n,b3,2,irish. s,n,n,y ,y ,y ,b3, 1 ,irish. s,y ,n,n,y ,n,b3, I ,irish. s,y ,y ,n,y ,n,b3,2,irish. s,n,n,n,y,n,b3, I ,irish. s,y ,y,y,y,y ,b3,2,irish. s,y ,y,n,y,n,b3, I ,irish. s,y,y,n,y,n,b3,1,american. s,y ,y ,n,y ,n,b4,b4_1 ,american. s,y,y,n,y,n,b3, 1 ,american. s,y ,y ,n,y ,n,b3,2,american. s,y,y,n,y,n,b3,I,american. s,y,y,n,y,n,b3, I ,american. s,n,y,y,y,y,b3,I,american. s,n,y,y,y,y,b3,1.5,american. L,y,y,n,y,y,b3,I,american. s,n,y,y,y ,y ,b3, I ,american. s,y,y,n,y,n,b3,I,american. s,y,y ,n,y ,n,b3,2,american. s,y,y,n,y,n,b3, I ,american. s,n,y,y,y,y,b3,I,american. s,y,y,n,y,n,b3,2,american. s,n,y,y,y,y,b3,2,american. s,y,y,n,y,n,b3,I,american. s,n,y,y,y,y,b3, 1 ,american. s,n,y,y,y,n,b3,I,american.
Appendices 69

s,n,y,y,y,y,b3,I,american. s,n,y,y,y,y,b3, I ,american. s,n,n,n,y,y ,b3, I ,american. s,n,y,y,y,y,b3,I,american. s,n,y,y,y,y,b3,1.5,american. s,y,y,n,y,n,b3,I,american. s,y,y,n,y,n,b3, I ,american. s,n,y ,y,y,y ,b4,b4_2,american. s,n,y,y,y,y,b3, I ,american. s,y,y,n,y,n,b3, I ,american. s,y, y ,n, y ,n ,b3, I ,american. s,n,n,n,y ,y ,b3, I,irish. s,y,y,y,y,n,b3,I,irish. s,y ,n,n,y ,n,b3,2,irish. s,n,y,y,y,y,b3,I,irish. s,y,y,n,y,n,b3,2,irish. s,y ,y,y ,y ,n,b3, I ,irish. s,y,y,n,y ,n,b3, I ,irish. s,n,n,n,y,y ,b3, I,irish. s,n,n,n,Y ,Y ,b3, I ,irish. s,n,n,n,Y ,y ,b3, I,irish. s,n,Y,Y,Y ,y,b3, I ,irish. s,y,y,y,y ,n,b3, I,irish. L,y ,n,n,Y ,Y ,b3, I ,irish. s,n,Y ,Y ,Y ,n,b3, I ,irish. s,y,y,y,y,n,b3,I,irish. s,Y,Y,n,y ,n,b3, I ,irish. s,n,Y ,Y ,Y ,Y ,b3,2,irish. s,Y,Y ,y,y ,n,b3, I ,irish. s,y,y,n,y,n,b3,I,irish. s,n,n,n,Y ,Y ,b3, I ,irish. s,n,n,n,n,n,b3, I ,irish. s,y,y,n,y,n,b3,2,irish. s,y,y,y,y,n,b3,I,irish. L,y,y,n,y,y,b3,I,irish. L,y,y,n,y,y,b3,1,irish. s,n,y,y,y,n,b3,I,irish. s,y,y,n,y,n,b3, I ,irish. s,y ,y,y,y,n,b3, I ,irish. s,y ,y ,n,y ,n,b3, I ,irish. s,n,y ,y ,y ,y ,b3,2,irish.
Appendices 70

Appendix 83 - Data resulting from analysis of melodies according to O'Canainn
List of attributes:
max points on:tonic,supert,med,subdom,dom,submed,LN. second max points on:tonic,supert,med,subdom,dom,submed,LN. min points on:tonic,supert,med,subdom,dom,submed,LN. proportion on Key Sig tonic: continuous. proportion on Key Sig Dominant: continuous. Mean:continuous. Standard Deviation:continuous. Proportion of points for long note:continuous. Proportion of points for large interval:continuous. First stressed note on: tonic,supert,med,subdom,dom,submed,LN.
List of attribute values:
tonic,med,submed,27.52,19.46,21.29,14.13,9.4,0,dom,american. med,dom,submed,18.79,20.81,19.57 ,13.48,11.7 ,O,tonic,american. med,tonic,LN ,27 .52,26.85,24.86,18.3 ,6.3,0,tonic,american. tonic,med,subdom,28.86,8.05,20.14,15.61,5.7,0,dom,american. dom,subdom,med,8. 72,28.19,22. 71,13.33,7 .5,0,dom,american. tonic,dom,submed,24.68,15.58,19.25,11.16,6.5,1.3,tonic,american. dom,tonic,subdom,21.48,30.87 ,24.29,11.64,7.1 ,O,dom,american. dom,tonic,subdom,24.83,21.48,21.57,13.1,7.3,0,tonic,american. tonic,submed,subdom,30.2,12.75,21.43,16.77,2.5,0,tonic,american. tonic,dom,subdom,32.89,23.49,22.86,14.48,10.7,0.7,dom,american. submed,tonic,subdom,20.75,18.24,22.71,13.81,8.2,1.9,tonic,american. tonic,med,submed,28.57, 16.67,21, 14.65,4.2,0,med,american. dom,submed,subdom,20,25.19, 19.29, 11.6,8.9,0,tonic,american. tonic,med,LN,25.32, 16.23,22, 10.66, 12.3,0.6,tonic,american. tonic,med,LN ,37.5,17.5,22.86,20.58, 12.5,0,med,american. tonic,supert,subdom,44.97 ,8.72,22.29 ,21.08,4.5,0,tonic,irish. dom,med,LN, 19.46,26.85,22, 14.22,S.8,0,tonic,irish. tonic,LN,subdom,28.86,IS.44,23.29,12.68,2.5,0,submed,irish. med,subdom,submed,20.13,16.11,23.71,14.72,3.6,0,med,irish. tonic,supert,med,25.47,9.94,20.13,13.61,1.9,1.2,subdom,irish. tonic,med,LN ,28.19,11.41 ,22.S7, 11.36,2.5,2.5,tonic,irish. dom,supert,med,11.18,2S.47,20.13,13.05,3.1,0,dom,irish. submed,LN,med, 12.75,17.45,22.57,11.67 ,3.8,4.4,subdom,irish. tonic,LN,subdom,30.87, 12.75,22.29, 12.05,8.3,0.6,tonic,iri sh. dom,submed,med,4.21 ,32.63,23.75,19.92,1.6,4.7 ,supert,irish. tonic,dom,LN ,26.86,20,25,15.08,3.4,1.7 ,tonic,irish. tonic,dom,supert,lS.89,18.54,18.88,8.74,5.9,0,submed,irish. dom,LN,subdom,36.26,14.29,26,23.04,1.1,6.6,tonic,irish. tonic,supert,submed,29.41,20.26,21.86,13.25,0.7,0,med,irish. tonic,supert,LN,27 .01,11.49,21.14,11.39, 1.4,0,tonic,irish.
Appendices 71

Appendix C - Form used in experiment with human listeners, reported in Chapter 3
Folk M usit Analysis Experiment
Plellse complete the following questions
Agel I S~X MtF
I low would you rate your familiarity with r"lk music?
very not f~l11iljlll' alienge fanuli:ar ---_!_-_ .. \I 1 2 j 4
I .--1--::-,-~~---,-I-:-:--,1 ~ 6 7 II !II 10
How would you rnte\thc fr"'luc:mcy of which you listen to music'?
nul much I o
Dverqte , I
5 (, ., ,
l\lol
I 8 9 10
Do you play, or have: you ever learned to playa musical inslrUmc:nt? YN
Ifycs. what is the instrumenl'? ____ ..
How JllllIly years did you playi have you played this jnstrum~l'? 0 \\!'hat are your two favourilt kind!; ur mu~ic? 1. 2. ___ _
What are your two lca5t favourite kinds ofmusie'! 1.__ 2. ___ _
While lislening to the: training tulles, jot down any features that yuu think ~cm to be specific to the named cultural u';gins.
fwures of American TUlles:
Appendices 72

F or each of the test tunes, indicate whieh cultural origin you think it might be associated with (either Irish or American) & try and say briefly why.
Appendices 73

APPENDIX D - Form for writing data during from IR analysis
Title: ...................... Origin: ............... .
SmalV Fulfilled w.r.t w.r.t. w.r.t. w.r.t. Large w.r.t intervallic registral proximity closure
registral difference return direction?
1st
Interval 2no
Interval
Title: ...................... Origin: ............... .
Small! Fulfilled w.r.t w.r.t. w.r.t. w.r.t. Large w.r.t intervallic registral proximity closure
registral difference return direction?
1st
Interval 2no
Interval
Title: ...................... Origin: ............... .
Small! Fulfilled w.r.t w.r.t. w.r.t. w.r.t. Large w.r.t intervallic registral proximity closure
registral difference return direction?
1 st
Interval 2no
Interval
Appendices 74

APPENDIX E2 - Summary of results for experiment to determine order of preference of group boundaries where there are conflicts
Subject 1 2 3 4 5 6 7 8 9 No~
Tune I After After 3c 3c 3c After After After 3c 3a then 3c 6 8 8 8 8
Tune 2 3c After 3c After 3c 3a 3c None After 3c then 3a 8 8 8
Tune 3 3c 3c 3c 2b 2b 3c 2b 2b 2b 2b then 3c/3a 3a 3a 3a 3a
Tune 4 2b After 2b 2b 2b 2b 2b 2b 2b 3c/3a then 2b 7
Tune 5 After None 3d 3d 3d After 3d After After 3a then 3d 5 5 6 6
Tune 6 After 3d 3a 3a 3a 3d 3a 3a 3a 3d then 3a 5
Tune 7 3c 3d 3c After After 3d 3d 3c 3d 3c then 3d 7 5
Tune 8 3c 3d None After After After 3c 3c 3c 3d then 3c 5 5 5
Tune 9 2b 2b 3c 2b 3c 2b 3c 2b 2b 2b then 3d 3d 3a
3c/3d Tune 10 3a 2b 2b 2b 2b 3a 2b 2b 2b
2b then 3d 3d
3a13d
Appendices
10 Results
3c 5 said 3c 4 said after 8 1 said after 6
3a 4 said 3c, 3 said after 8 2 said 3a 1 said None
2b 6 said 2b 4 said 3c/3a
2b 9 said2b 1 said after 7
3a 4 said 3d 2 said after 6 2 said after 5 1 said 3a 1 said none
3a 7 said 3a 2 said 3d 1 said after 5
3d 5 said 3d 3 said 3c 1 said after 7 1 said after 5
Afte 4 said r8 after3c
3 said after 5 1 said after 8 1 said none 1 said 3d
2b 7 said2b 3 said 3c/3d
2b 8 said2b 2 said 3a13d
76

APPENDIX F - Examples of detailed results from classification software
Appendix Fl - Example of output using SeeS with GTIM. Shows one fold, hence one tree and the associated rules. Followed by a summary of the output for all 10 folds.
SeeS INDUCTION SYSTEM [Release 1.09a] Mon Jul 28 10:34:11 2003
Options: Generating rules
Read 60 cases (8 attributes) from GTTM_3_revised.data
[ Fold 0
Decision tree:
met_deviations <= 2: american (30.0/5.0) met_deviations> 2: : ... GPR3a <= 4: irish (20.0)
GPR3a > 4: : ... GPR1 <= 5: irish (2.0)
GPR1 > 5: american (2.0)
Extracted rules:
Rule 1: (cover 20) GPR3a <= 4 met_deviations > -> class irish
Rule 2: (cover 14)
2 [0.955]
GPR1 <= 5 met_deviations > 2 -> class irish [0.938]
Rule 3: (cover 5) GPR1 > 5 GPR3a > 4 -> class american [0.857]
Rule 4: (cover 30) met_deviations <= 2 -> class american [0.813]
Default class: irish
Evaluation on hold-out data (6 cases):
Decision Tree Rules
Size Errors No Errors
4 2(33.3%) 4 2(33.3%)
Appendices
«
77

Sununary )
Fold Decision Tree Rules ---------------- ----------------
Size Errors No Errors
0 4.0 33.3% 4.0 33.3% 1 8.0 50.0% 6.0 50.0% 2 4.0 16.7% 4.0 16.7% 3 3.0 50.0% 3.0 50.0% 4 8.0 33.3% 5.0 16.7% 5 6.0 16.7% 6.0 16.7% 6 4.0 16.7% 4.0 16.7% 7 4.0 0.0% 4.0 0.0% 8 9.0 16.7% 8.0 16.7% 9 6.0 33.3% 6.0 33.3%
Mean 5.6 26.7% 5.0 25.0% SE 0.7 5.1% 0.5 5.1%
(a) (b) <-classified as
21 9 (a) : class irish 6 24 (b) : class american
Appendices 78

Appendix F2 - Example of output using SeeS with IR. model analysis. Shows one fold, hence one tree and the associated rules. Followed by a summary of the output for all 10 folds.
Decision tree:
intervallic_difference = n: irish (22.0/6.0) intervallic_difference = y: : ... closure = y:
: ... registral_direction = y: irish (5.0/1.0) registral_direction = n: american (29.0/7.0)
closure = n: : ... registral_return = y: irish (11.0)
registral_return = n: american (41.0/16.0)
Extracted rules:
Rule 1: (cover 12) registral_return = y closure = n -> class irish [0.929]
Rule 2: (cover 5) registral_direction = y intervallic_difference = y closure = y -> class irish [0.714]
Rule 3: (cover 22) intervallic_difference = n -> class irish [0.708]
Rule 4: (cover 29) registral_direction = n intervallic_difference = y closure = y
-> class american [0.742]
Rule 5: (cover 41) intervallic_difference = y registral_return = n closure = n -> class american [0.605]
Default class: irish
Evaluation on hold-out data (12 cases):
Decision Tree Rules
Size Errors No Errors
5 4(33.3%) 5 4(33.3%)
Summary ]
Fold Decision Tree Rules
Appendices
«
79

---------------- ----------------Size Errors No Errors
0 11. 0 50.0% 9.0 50.0% 1 5.0 33.3% 5.0 33.3% 2 12.0 16.7% 6.0 16.7% 3 12.0 50.0% 7.0 50.0% 4 10.0 41. 7% 6.0 41.7% 5 10.0 33.3% 9.0 33.3% 6 5.0 33.3% 5.0 33.3% 7 11. 0 25.0% 10.0 25.0% 8 13.0 25.0% 11. 0 25.0% 9 14.0 33.3% 12.0 33.3%
Mean 10.3 34.2% 8.0 34.2% SE 1.0 3.4% 0.8 3.4%
(a) (b) <-classified as
36 24 (a) : class irish 17 43 (b) : class american
Appendices 80
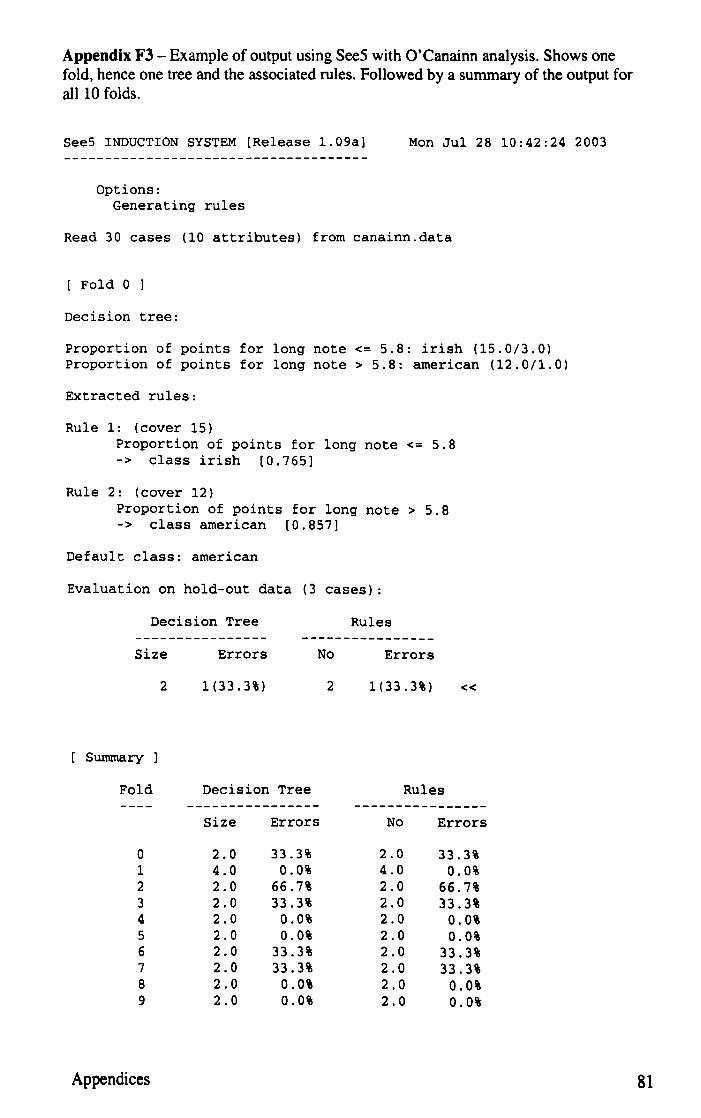
Appendix F3 - Example of output using SeeS with Q'Canainn analysis. Shows one fold, hence one tree and the associated rules. Followed by a summary of the output for all 10 folds.
See5 INDUCTION SYSTEM [Release 1.09a) Mon Jul 28 10:42:24 2003
Options: Generating rules
Read 30 cases (10 attributes) from canainn.data
[ Fold 0
Decision tree:
Proportion of points for long note <= 5.8: irish (15.0/3.0) Proportion of points for long note> 5.8: american (12.0/1.0)
Extracted rules:
Rule 1: (cover 15) Proportion of points for long note <= 5.8 -> class irish [0.765)
Rule 2: (cover 12) Proportion of points for long note> 5.8 -> class american [0.857)
Default class: american
Evaluation on hold-out data (3 cases):
Decision Tree Rules
Size Errors No Errors
2 1(33.3%) 2 1(33.3%) «
Summary )
Fold Decision Tree Rules ---------------- ----------------
Size Errors No Errors
0 2.0 33.3% 2.0 33.3% 1 4.0 0.0% 4.0 0.0% 2 2.0 66.7% 2.0 66.7% 3 2.0 33.3% 2.0 33.3% 4 2.0 0.0% 2.0 0.0% 5 2.0 0.0% 2.0 0.0% 6 2.0 33.3% 2.0 33.3% 7 2.0 33.3% 2.0 33.3% 8 2.0 0.0% 2.0 0.0% 9 2.0 0.0% 2.0 0.0%
Appendices 81

Mean 2.2 20.0% 2.2 20.0% SE 0.2 7.4% 0.2 7.4%
(a) (b) <-classified as
12 3 (a) : class irish 3 12 (b) : class american
Appendices 82
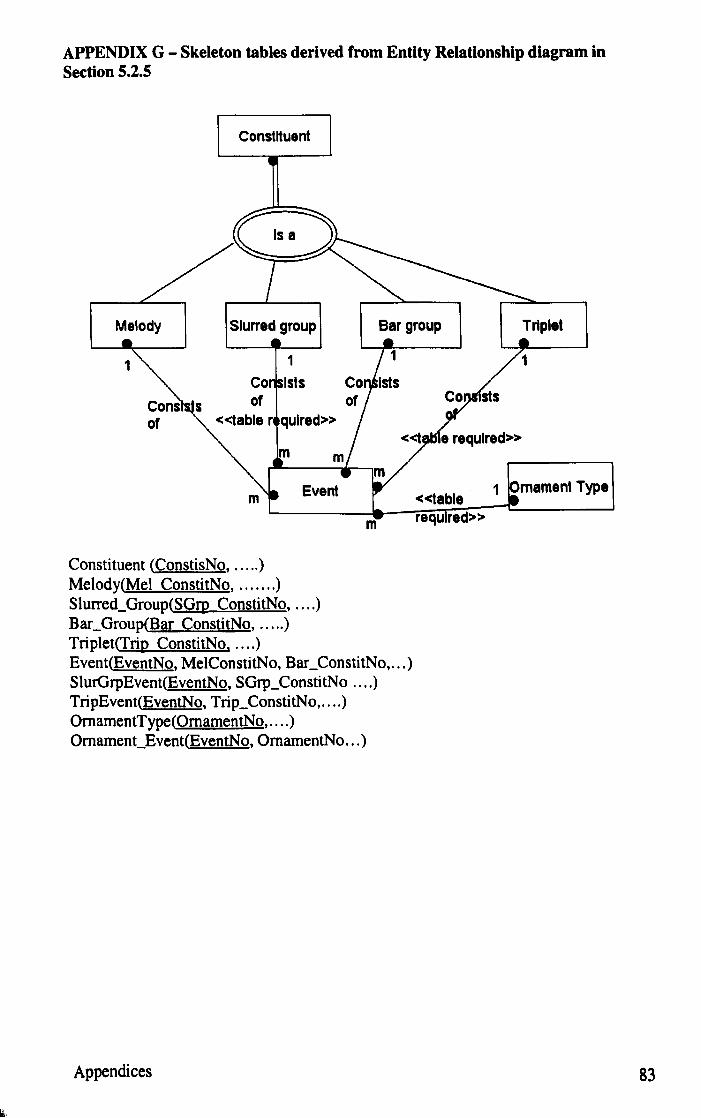
APPENDIX G - Skeleton tables derived from Entity Relationship diagram in Section 5.2.5
Constituent
•
Slurred group
1
Co Ists of
«table r qulred»
Constituent (ConstisNo, ..... ) Melody(Mel ConstitNo, ....... ) Slurred_Group(SGm ConstitNo, .... ) Bar_Group(Bar ConstitNo, ..... ) Triplet(Trip ConstitNo ..... )
m
Event(EventNo, MelConstitNo, BacConstitNo, ... ) SlurGrpEvent(EventNo, SGrp_ConstitNo .... ) TripEvent(EventNo, Trip_ConstitNo, .... ) OmamentType(OmamentNo, .... ) OmamencEvent(EventNo, OmamentNo ... )
Appendices
<<table 1 mament Type
required»
83

APPENDIX H - Confusion Matrices for Classification Using seeS, CART and Joone
In all cases TP = True Positives, FP = False Positives, FN = False Negatives, TN = True Negatives.
Matrices 1 -3 represent classifications where the classification 'American' was treated as positive, and the classification 'Irish' treated as negative.
1. Matrix for See5
TP FP
24 10
FN TN
6 20
2. Matrix for CART
TP FP
25 11
FN TN
5 19
3. Matrix for Joone
TP FP
25 8
FN TN
5 22
Matrices 4 - 6 represent classifications where the classification 'Irish' was treated as positive, and the classification 'American' treated as negative.
Appendices 84

4. Matrix for See5
TP FP
20 6
FN TN
10 24
5. Matrix for CART
TP FP
19 5
FN TN
11 25
6. Matrix for Joone
TP FP
22 5
FN TN
8 25
Appendices 85