university of florida 2005-2006 common data set a. …
TRANSCRIPT

University of Florida
2005-2006 Common Data Set
May 2006
A. GENERAL INFORMATION....................................................................................... 2 B. ENROLLMENT AND PERSISTENCE ...................................................................... 4 C. FIRST-TIME, FIRST-YEAR (FRESHMAN) ADMISSION .................................... 7 D. TRANSFER ADMISSION............................................................................................ 7 E. ACADEMIC OFFERINGS AND POLICIES ...........................................................16 F. STUDENT LIFE...........................................................................................................17 G. ANNUAL EXPENSES.................................................................................................20 H. FINANCIAL AID ........................................................................................................22 I. INSTRUCTIONAL FACULTY AND CLASS SIZE.................................................27 J. DEGREES CONFERRED...........................................................................................29

2
A. GENERAL INFORMATION CDS - A1. Address Information
University of Florida Gainesville, FL 32611 Phone: (352) 392-3261 http://www.ufl.edu/ Admissions Office: Phone: (352) 392-1365 201 Criser Hall Box 114000, Univ. of Florida Gainesville, FL 32611-4000 http://www.admissions.ufl.edu
Email Addresses: Freshman Admission: [email protected] Transfer Admission: [email protected] Graduate Admission: [email protected] Professional Admission (Med., Dental, Vet. Med., Law, Pharmacy): [email protected] Postbaccaulareate Admission: [email protected] Readmission (previous UF students): [email protected] Residency Information: [email protected] International Admission: [email protected]
University Catalogs: http://www.registrar.ufl.edu/academicinfohub.html World Wide Web application: http://www.admissions.ufl.edu/start.html Office for Student Financial Affairs P.O. Box 114025, 103 Criser Hall Gainesville, FL 32611-4025 http://www.sfa.ufl.edu/ Year Founded: 1853
CDS - A2. Source of institutional control:
Public CDS - A3. Classify your undergraduate institution:
Co-educational
CDS - A4. Academic year calendar:
Semester
CDS - A5. Degrees offered by your institution:
Bachelor’s (B.A. or B.S.) Master’s Specialist (Ed.S.) Engineer Doctoral (Ph.D., Ed.D.) First-professional (DMD, MD, DPH, DVM, JD)

3
Academic Structure
UF is one of the nation's top three universities in the number of majors offered on a single campus. It has 21 colleges and schools and over 100 interdisciplinary research centers, bureaus, and institutes. Almost 100 undergraduate degree programs are offered. The Graduate School coordinates more than 200 graduate programs. Professional degree programs include Dentistry, Medicine, Pharmacy, Veterinary Medicine, and Law.
Faculty
Faculty Honors: No. of Nobel Laureates 1 No. of Pulitzer Prize winners 2 No. members of National Academy of Sciences and/or Engineering, the Institute of Medicine, or their international counterparts
more than two dozen
No. Eminent Scholar Chairs 62 No. Fulbright Awards 8
Library Holdings The George A. Smathers Libraries, forming the largest information resource system in the state of Florida, reflect the riches found in the university's academic programs. The library system is comprised of two main libraries and thirteen branch libraries and reading rooms, all with fully computerized facilities. Library collections are accessed through the LUIS online system, which holds more than one million bibliographic records. The Libraries have available 61 computerized retrieval systems. See http://www.uflib.ufl.edu/ Computer Facilities Location of personal computers or terminals for general student use: Microcomputer labs, computer center, classrooms, libraries, student center, dormitories, modem dialup service, and a special office offering computer access for the disabled. Computer requirements for students: Access to and on-going use of a computer will be required for all students to complete their degree programs successfully. Effective Summer B 1998, the university expects each student entering the junior year, as well as each student new to the university, to acquire computer hardware and software appropriate to his/her degree program. Competency in basic use of a computer is a requirement for graduation. See http://www.circa.ufl.edu/computers/ Special Facilities on Campus The northeast corner of the campus is listed as an Historic District on the National Register of Historic Places. Notable UF facilities include: • Florida Museum of Natural History, among the nation's top 10 natural history museums • The Samuel P. Harn Museum of Art, one of the largest museums in the Southeast • The Center for Performing Arts, which attracts world-class symphony orchestras, Broadway plays, opera, and large-scale
ballet productions to Gainesville • The world's largest citrus research center • One of the nation's few self-contained intensive care hyperbaric chambers for treatment of near-drowning victims • A microkelvin laboratory capable of producing the coldest temperature in the universe • The second largest academic computing center in the South • A world-class bell carillon • 99-rank Anderson Memorial pipe organ • Engineering and Industrial Experiment Station • A federally-funded world-class brain institute • One public television, one public radio, and two commercial radio stations.

4
B. ENROLLMENT AND PERSISTENCE CDS - B1. Institutional Enrollment—Men and Women Provide numbers of students for each of the following categories as of the institution’s fall reporting date or as of October 15, 2005. References to corresponding data elements formerly collected by IPEDS on the Fall Enrollment Survey 1999 (Part A) or currently collected by the IPEDS Web-based Data Collection System are supplied below.
FULL-TIME PART-TIME Men
(IPEDS col. 15) Women
(IPEDS col. 16) IPEDS
line Men
(IPEDS col. 15) Women
(IPEDS col. 16) IPEDS
line Undergraduates
Degree-seeking, first-time freshmen
3,120 4,072
line 1 19 30 line 15
Other first-year, degree-seeking
408 392 line 2 17 12 line 16
All other degree-seeking
10,997 12,753 Lines 3-6
1,138 1,070 lines 17-20
Total degree-seeking 14,525 17,217 1,174 1,112
All other undergraduates enrolled in credit courses
90 118 line 7 171 205 line 21
Total undergraduates
14,615 17,335 line 8 1,345 1,317 line 22
First-professional
First-time, first-professional students
334 454 Line 9 61 95 line 23
All other first-professionals
1,178 1,487 Line 10 177 282 line 24
Total first-professional
1,512 1,941 238 377
Graduate
Degree-seeking, first-time
972 986 Line 11 142 171 line 25
All other degree-seeking
3,055 2,797 Line 12 1,119 1,000 line 26
All other graduates enrolled in credit courses
97 109 line 13 230 335 line 27
Total graduate 4,124 3,892 1,491 1,506
Total all undergraduates (IPEDS sum of lines 8 and 22, cols. 15 and 16): 34,612 Total all graduate and professional students (IPEDS sum of lines 14 and 28, cols. 15 and 16): 15,081 GRAND TOTAL ALL STUDENTS (IPEDS line 29, sum of cols. 15 and 16): 49,693

5
CDS - B2. Enrollment by Racial/Ethnic Category. Provide numbers of undergraduate students for each of the following categories as of the institution’s fall reporting date or as of October 15, 2005. References to corresponding data elements formerly collected by IPEDS on the Fall Enrollment Survey 1999 (Part A) or currently collected by the IPEDS Web-based Data Collection are supplied below.
Degree-seeking First-time, First year
Degree-seeking Undergraduates
(include first-time first-year)
Total Undergraduates
(both degree- and non- degree-seeking)
IPEDS sum of lines 1 and 15
IPEDS sum of lines 1-6 and
lines 15-20
Nonresident aliens IPEDS cols. 1-2
22 286 372
Black, non-Hispanic IPEDS cols. 3-4
705
3,008 3,036
American Indian or Alaskan Native IPEDS cols. 5-6
16 115 117
Asian or Pacific Islander IPEDS cols. 7-8
623 2,467 2,487
Hispanic IPEDS cols. 9-10
987 4,323 4,371
White, non-Hispanic IPEDS cols. 11-12
4,654 23,274 23,614
Race/ethnicity unknown IPEDS cols. 13-14
234 555 615
Total IPEDS cols. 15-16
7,241 34,028 34,612
Persistence
CDS - B3. Number of degrees awarded by your institution from July 1, 2004, to June 30, 2005.
Bachelor’s degrees 8,417 Master’s/Specialist degrees 2,958 Doctoral degrees 702 First professional degrees 963 Total 13,040
Graduation Rates The information in this section comes from the IPEDS Graduation Rate Survey (GRS). For complete instructions and definitions of data elements, see the IPEDS GRS instructions and glossary. For Bachelor’s or Equivalent Programs Report for the cohort of full-time first-time bachelor’s (or equivalent) degree-seeking undergraduate students who entered in fall 1999. Include in the cohort those who entered your institution during the summer term preceding fall 1999. CDS - B4. Initial 1999 cohort of first-time, full-time bachelor’s (or equivalent) degree-seeking undergraduate students;
total all students: 6092 (IPEDS GRS, Section II, Part A, line 10, sum of columns 15 and 16)

6
CDS - B5. Of the initial 1999 cohort, how many did not persist and did not graduate for the following reasons: deceased, permanently disabled, armed forces, foreign aid service of the federal government, or official church missions; total allowable exclusions: 27
(IPEDS GRS, Section II, Part C, line 45, sum of columns 15 and 16) CDS - B6. Final 1999 cohort, after adjusting for allowable exclusions: 6065 (Subtract question B5 from question B4) CDS - B7. Of the initial 1999 cohort, how many completed the program in four years or less (by August 31, 2003): 3191 (IPEDS GRS, Section II, Part A, line 19, sum of columns 15 and 16) CDS - B8. Of the initial 1999 cohort, how many completed the program in more than four years but in five years or less
(after August 31, 2003 and by August 31, 2004): 1371 (IPEDS GRS, Section II, Part A, line 20, sum of columns 15 and 16) CDS - B9. Of the initial 1999 cohort, how many completed the program in more than five years but in six years or less
(after August 31, 2004 and by August 31, 2005): 249 (IPEDS GRS, Section II, Part A, line 21, sum of columns 15 and 16) CDS - B10. Total graduating within six years (sum of questions B7, B8, and B9): 4811 (IPEDS GRS, Section II, Part A, line 18, sum of columns 15 and 16) CDS - B11. Six-year graduation rate for 1999 cohort (question B10 divided by question B6): 79% Retention Rates Report for the cohort of all full-time, first-time bachelor’s (or equivalent) degree-seeking undergraduate students who entered in fall 2004 (or the preceding summer term). The initial cohort may be adjusted for students who departed for the following reasons: deceased, permanently disabled, armed forces, foreign aid service of the federal government or official church missions. No other adjustments to the initial cohort should be made. CDS - B22. For the cohort of all full-time bachelor’s (or equivalent) degree-seeking undergraduate students who entered
your institution as freshmen in fall 2004 (or the preceding summer term), what percentage was enrolled at your institution as of the date your institution calculates it official enrollment in fall 2005? 94%
Five most popular undergraduate majors – 2004/2005: Business Admin. & Management (52.0201), Finance (52.0801), Psychology (42.0101), Political Science (45.1001), and English Language & Literature, General (23.0101). (Source: IPEDS 2004-05 Completions Degree Awarded by CIP)
Post-Graduation Activities of Graduating Seniors
Nearly three in five UF seniors have solid post-graduation plans - 36% have a definite job or are negotiating employment and 22% have been accepted into a graduate or professional degree program.
Only one in ten students say they do not have any plans to continue their education now or in the future. A majority of students (51%) indicate they will seek a master's degree, and nearly a third say they plan to obtain a Ph.D. (15%) or professional degree (15%). Three percent (3%) report they would like to receive some other type of degree, while 6% are unsure whether they want to pursue an advanced degree.

7
C. FIRST-TIME, FIRST-YEAR (FRESHMAN) ADMISSION
Applications for Fall 2005: CDS - C1. First-time, first-year (freshman) students: Provide the number of degree-seeking, first-time, first-year
students who applied, were admitted, and enrolled (full- or part-time) in fall 2005. Include early decision, early action, and students who began studies during summer in this cohort. Applicants should include only those students who fulfilled the requirements for consideration for admission (i.e., who completed actionable applications) and who have been notified of one of the following actions: admission, nonadmission, placement on waiting list, or application withdrawn (by applicant or institution). Admitted applicants should include wait-listed students who were subsequently offered admission.
Total first-time, first-year (freshman) men who applied 9,481 Total first-time, first-year (freshman) women who applied 11,670 Total first-time, first-year (freshman) men who were admitted 5,206 Total first-time, first-year (freshman) women who were admitted 6,894 Total full-time, first-time, first-year (freshman) men enrolled 3,120 Total part-time, first-time, first-year (freshman) men enrolled 19 Total full-time, first-time, first-year (freshman) women enrolled 4,072 Total part-time, first-time, first-year (freshman) women enrolled 30 Total first-time, first-year (freshman) enrolled 7,241
CDS - C2. Freshman wait-listed students (students who met admission requirements but whose final admission was
contingent on space availability) Do you have a policy of placing students on a waiting list? Yes: No: Admission Requirements CDS - C3. High school completion requirement
High school diploma is required and GED is accepted
CDS - C4. Does your institution require or recommend a general college preparatory program for degree-seeking students?
Required Recommended Neither required nor recommended

8
CDS - C5. Distribution of high school units required and/or recommended. Specify the distribution of academic high school course units required and/or recommended of all or most degree-seeking students using Carnegie units (one unit equals one year of study or its equivalent). If you use a different system for calculating units, please convert.
Units required
Total academic units 15
English 4 (3 courses must include substantial writing) Mathematics 3 (Algebra I, Formal Geometry, Algebra II) Science 3 Of these, units that must be lab 2 lab courses Foreign language 2 (in same language & must be sequential) Social studies 3 History 0 Academic electives 0 Other (specify) 0

9
Basis for Selection CDS - C6. Do you have an open admission policy, under which virtually all secondary school graduates or students with GED equivalency diplomas are admitted without regard to academic record, test scores, or other qualifications? If so, check which applies: We do not have an open admission policy. SAT and ACT Policies CDS - C8. Entrance exams
A. Does your institution make use of SAT Reasoning Test, ACT or SAT Subject Test scores in admission decisions for first-time, first-year, degree-seeking applicants? Yes No
If yes, place check marks in the appropriate boxes below to reflect your institution’s policies for use in admission for Fall 2007.
ADMISSION Require Recommend Require for
some Considered if
submitted Not used
SAT or ACT ACT only SAT only SAT and SAT Subject Tests SAT and SAT Subject Tests or ACT
SAT Subject Tests
B. If your institution will make use of the ACT in admission decisions for first-time, first-year, degree-seeking applicants for Fall 2007, please indicate which ONE of the following applies: X ACT with Writing component required ACT without Writing component recommended. ACT with or without Writing component accepted
C. Please indicate how your institution will use the SAT or ACT writing component; check all that apply:
For admission For placement For advising In place of an application essay As a validity check on the application essay No college policy as of now
D. In addition, does your institution use applicants’ test scores for placement or academic advising?
Yes No
E. Latest date by which SAT or ACT scores must be received for fall-term admission : January 17 for Fall 2006 Latest date by which SAT Subject Test scores must be received for fall-term admission: N/A
F. If necessary, use this space to clarify your test policies (e.g., if tests are recommended for some students, or if
tests are not required of some students): SAT II scores are used strictly for placement purposes, not for admission except for non-regionally accredited schools.
G. Please indicate which tests your institution uses for placement (e.g., state tests):
SAT ACT SAT Subject Tests AP CLEP Institutional Exam State Exam (specify):_______

10
Freshman Profile CDS - C9. Percent and number of first-time, first-year (freshman) students enrolled in fall 2005 who submitted
national standardized (SAT/ACT) test scores. Include all students who began studies during summer, international students/nonresident aliens, and students admitted under special arrangements.
Percent submitting SAT scores 77% Number submitting SAT scores 5,624 Percent submitting ACT scores 23% Number submitting ACT scores 1,678

11
25th percentile 75th percentile SAT I Verbal 570 670 SAT I Math 590 690 ACT Composite 25 29
Percent of first-time, first-year (freshman) students with scores in each range:
SAT I Verbal SAT I Math 700-800 16% 22% 600-699 49% 52% 500-599 30% 22% 400-499 5% 4% 300-399 0% 0% 200-299 0% 0%
ACT Composite 30-36 23% 24-29 60% 18-23 16% 12-17 1% 6-11 0% below 6 0%
CDS - C10. Percent of all degree-seeking, first-time, first-year (freshman) students who had high school class rank
within each of the following ranges (report information for those students from whom you collected high school rank information).
Percent in top 10th of high school graduating class 84.6% Percent in top quarter of high school graduating class 90% Percent in top half of high school graduating class 97% Percent in bottom half of high school graduating class 3%
Note: Florida public high school students graduating in the top 5% and completing the college preparatory curriculum are guaranteed admission to UF. Percent of total first-time, first-year (freshman) students who submitted high school class rank: 70 %
CDS - C11. Percentage of all enrolled, degree-seeking first-time, first-year (freshman) students who had high school
grade-point averages within each of the following ranges (using 4.0 scale); report information only for those students from whom you collected high school GPA
Percent who had GPA of 3.75 and higher 73% Percent who had GPA between 3.50 and 3.74 17% Percent who had GPA between 3.25 and 3.49 5% Percent who had GPA between 3.00 and 3.24 4% Percent who had GPA between 2.50 and 2.99 1% Percent who had GPA between 2.00 and 2.49 0% Percent who had GPA between 1.00 and 1.99 0% Percent who had GPA below 1.0 0%
CDS - C12. Average high school GPA of all degree-seeking first-time, first-year (freshman) students who submitted GPA: 3.7 - 4.2 (Middle 50%) Percent of total first-time, first-year (freshman) students who submitted high school GPA: 99.4%

12
Admission Policies CDS - C13. Application fee
Does your institution have an application fee? Yes No Amount of application fee $30 Can it be waived for applicants with financial need?
Yes No
If you have an application fee and an on-line application option, please indicate policy for students who apply on-line: Same fee: __X__
Free: _____
Reduced: _____
Can on-line application fee be waived for applicants with financial need? Yes/No
CDS - C14. Application closing date
Does your institution have an application closing date? Yes No Application closing date January 17 for Fall 2006
CDS - C15. Are first-time, first-year students accepted for terms other than the fall? Yes No CDS - C16. Notification to applicants of admission decision sent (fill in one only)
Reply Dates CDS - C17. Reply policy for admitted applicants (fill in one only)
Reply required by May 1 for Regular Decision Admits. Deadline for housing deposit (MMDD): Varies Amount of housing deposit: $200 Refundable if student does not enroll? ____Yes, in full _X_ Yes, in part ____No
CDS - C18. Deferred admission: Does your institution allow students to postpone enrollment after admission? Yes No CDS - C19. Early admission of high school students: Does your institution allow high school students to enroll as full-
time, first-time, first-year (freshman) students one year or more before high school graduation? Yes No CDS - C20. Common application: Will you accept the Common Application distributed by the National Association of
Secondary School Principals if submitted? Yes No
If “yes,” are supplemental forms required? Yes No Is your college a member of the Common Application Group? Yes No
Early Decision and Early Action Plans CDS - C21. Early decision: Does your institution offer an early decision plan (an admission plan that permits students to apply and be notified of an admission decision well in advance of the regular notification date and that asks students to commit to attending if accepted) for first-time, first-year (freshman) applicants for fall enrollment? Yes No

13
If “yes,” please complete the following:
First or only early decision plan closing date 10/1 First or only early decision plan notification date Early December
For the Fall 2005 entering class:
Number of early decision applications received by your institution 4,481 Number of applicants admitted under early decision plan 2,246 Please provide significant details about your early decision plan:
Early Decision Option for Freshman Applicants CDS - C22. Early action: Do you have a non-binding early action plan whereby students are notified of an admission decision well in advance of the regular notification date but do not have to commit to attending your college?
Yes No
If “yes,” please complete the following:
Early action closing date Early action notification date
Average age of entering freshmen: 18

14
D. TRANSFER ADMISSION Fall Applicants CDS - D1. Does your institution enroll transfer students? Yes No (If no, please skip to Section E) If yes, may transfer students earn advanced standing credit by transferring credits earned from course work completed at
other colleges/universities? Yes No CDS - D2. Provide the number of students who applied, were admitted, and enrolled as degree-seeking transfer students in
Fall 2005.
Applicants Admitted applicants Enrolled applicants Men 2,506 1,034 859 Women 2,950 1,114 915 Total 5,456 2,148 1,774
Application for Admission CDS - D3. Indicate terms for which transfers may enroll: Varies by department. CDS - D4. Must a transfer applicant have a minimum number of credits completed or else must apply as an entering freshman?
Freshman and sophomore level transfer eligibility is extremely limited and admission is selective. Students should try to complete their AA degrees or 60 semester hours before applying.
CDS - D5. Indicate all items required of transfer students to apply for admission:
Required of all
Recommended for all
Recommended for some
Required for some
Not required
High school transcript X College transcript(s) X Essay or personal statement X Interview Standardized test scores X Statement of good standing from prior institution(s)
X
CDS - D7. If a minimum college grade point average is required of transfer applicants, specify
(on a 4.0 scale): 2.00
CDS - D10. Does an open admission policy, if reported, apply to transfer students? We do not have open admissions. Transfer Credit Policies CDS - D17. Describe other transfer credit policies: See http://www.registrar.ufl.edu/currents/transfercredit.html

15
International Students
Admissions-International Students (See http://www.admissions.ufl.edu/intl/) Admissions Policies and Requirements TOEFL required: TOEFL required for applicants to upper division colleges. Minimum TOEFL score: 550 SAT or ACT required: Yes* * Required for all lower division applicants and College of Education applicants. Admissions Statistics No. of new undergraduate international students, Fall 2005:
Total applied 797 Total admitted 196 Total enrolled 59

16
E. ACADEMIC OFFERINGS AND POLICIES
CDS - E1. Special study options: Identify those programs available at your institution. Refer to definitions.
Accelerated program Honors program Cooperative (work-study) program Independent study Cross-registration Internships Distance learning Liberal arts/career combination Double major Student-designed major Dual enrollment Study abroad English as a Second Language Teacher certification program Exchange student program (domestic) Weekend college External degree program Other (specify):
Adult/Continuing Education, TV-delivered credit-bearing courses, Honors Program, & distance learning courses. Library Collections Report the number of holdings, 2002-03. CDS - E4. Books, serial backfiles, electronic documents, and government documents (titles) that are accessible through
the library’s catalog: 5,347,896 CDS - E5. Current serials subscriptions (paper, microform, electronic): 25,342 CDS - E6. Microforms (units): 7,193,442 CDS - E7. Audiovisual materials (units): 25,953 Degree Requirements for Undergraduates (See http://www.reg.ufl.edu/04-05-pdfcatalog/catalog.pdf) Index To Majors and Their Colleges & Schools (See http://www.reg.ufl.edu/04-05-pdfcatalog/introduction/major-index.pdf)

17
F. STUDENT LIFE
CDS - F1. Percentages of first-time, first-year (freshman) students and all degree-seeking undergraduates enrolled in fall 2005 who fit the following categories: (for first-time, first-year (freshman) students, included those who began in summer 2005)
First-time, first-year
(freshman) students Undergraduates
Percent who are from out of state (exclude internat’l/nonresident aliens) 7.2% 4.9% Percent of men who join fraternities 23% 14% Percent of women who join sororities 23% 15% Percent who live in college-owned, -operated, or -affiliated housing 74% 22% Percent who live off campus or commute 26% 78% Percent of students age 25 and older 0% 6.1% Average age of full-time students 18.3 21.0 Average age of all students (full- and part-time) 18.3 24.7
CDS - F2. Activities offered Identify those programs available at your institution.
Choral groups Marching band Student government Concert band Music ensembles Student newspaper Dance Musical theater Student-run film society Drama/theater Opera Symphony orchestra Jazz band Pep band Television station Literary magazine Radio station Yearbook
CDS - F3. ROTC (program offered in cooperation with Reserve Officers’ Training Corps) Army ROTC is offered:
On campus At cooperating institution (name):
Naval ROTC is offered On campus At cooperating institution (name):
Air Force ROTC is offered On campus At cooperating institution (name):
CDS - F4. Housing: Check all types of college-owned, -operated, or -affiliated housing available for undergraduates at your institution.
Coed dorms Special housing for disabled students Men’s dorms Special housing for international students Women’s dorms Fraternity/sorority housing Apartments for married students Cooperative housing Apartments for single students Other housing options (specify):
Honors Residential College at Hume Hall, International House at Weaver Hall, Career Exploration Community at Graham Hall, Wellness Communities at Springs and Beatty Towers, Faculty-in-Residence Program, First-Year Experience

18
Program, No-Visitation by Opposite Sex Floor available by request, East hall Engineering Community, Community Service Floor in Fletcher, Fine Arts Living Learning Community in Reid hall, Global Learning Community in Yulee. Campus Housing Policies (See http://www.housing.ufl.edu/) Housing assignments are made on a space-available basis and freshmen who apply early and respond to the Department of Housing and Residence Education in a timely manner will receive priority for campus housing. Due to heavy demand, the university cannot guarantee on-campus housing to all students. A limited number of spaces are reserved for transfer students; interested students should contact housing as soon as they are admitted. University-Operated Residence Halls
Total Capacity (Standard) 7,352 Single-sex residence halls (female only) None Co-ed residence halls 7,352 Percent of freshmen who live in campus housing 80% Percent of all undergraduates who live in campus housing 21%
Sororities and Fraternities
No. of sororities 26 Percent undergraduate women who live in sororities 25% No. of fraternities 36 Percent of undergraduate men who live in fraternities 30%
The Student Guide (See http://oss.ufl.edu/STG/) Career Planning & Placement Center (See http://www.crc.ufl.edu/) The Career Resource Center provides career planning, experiential learning, and employment services for all UF students and alumni: • individual career and vocational counseling, • seminars on career planning and job search skills and techniques, • a 2,000-volume career library and associated audiovisual area in which students can explore careers or research specific
companies, • CHOICES--an on-line career exploration system, • cooperative education programs, and • on-campus interviews each semester from regional and national employers. Student Groups (See http://www.dso.ufl.edu/studentguide/campusresources/studentactivities.html) No. of registered student groups on campus: Over 700 Types of groups available: Professional and honorary organizations, leadership societies, social, recreational, ethnic, religious, and special interest groups. Student Government: (See http://grove.ufl.edu/~sg/) Athletics & Recreation (See http://www.uaa.ufl.edu/) Intercollegiate Athletics Name of NCAA Division Div. I-A, Southeastern Conference (SEC) No. of intercollegiate sports on campus 18 (8 men's & 10 women's)

19
Athletic & Recreational Facilities on Campus Florida's athletic program serves as a focal point for the surrounding community and beyond, as more than four million fans have filed through the gates to attend UF sporting events over the past five years. Athletic facilities include the 90,000-seat Ben Hill Griffin Stadium at Florida Field; the Stephen C. O'Connell Center, which houses a 12,000-seat basketball arena, an indoor track, swimming pool and diving tank, and gymnastics area; a baseball stadium; varsity tennis stadium; an 18-hole championship golf course; and a track and field stadium. There are also two student recreation and fitness centers on campus. Activities offered include aerobics, martial arts, basketball, racquetball, softball, squash, strength conditioning, tennis, and/or volleyball.

20
G. ANNUAL EXPENSES Provide 2005-2006 academic year costs for the following categories that are applicable to your institution. Check here if your institution’s 2005-2006 academic year costs are not available at this time and provide the approximate date (i.e., month/day) when your institution’s final 2005-2006 academic year costs will be available: CDS - G1. Undergraduate full-time tuition, required fees, room and board List the typical tuition, required fees, and room and board for a full-time undergraduate student for the FULL 2005-2006
academic year. A full academic year refers to the period of time generally extending from September to June; usually equated to two semesters or trimesters, three quarters, or the period covered by a four-one-four plan. Required fees include only charges that all full-time students must pay that are not included in tuition (e.g., registration, health, or activity fees.) Do not include optional fees (e.g., parking, laboratory use).
2005-2006 FIRST-YEAR UNDERGRADUATES In-state (out-of-district): $3,093.60 $3,093.60 Out-of-state: $ 17,222.40 $ 17,222.40 NON-RESIDENT ALIENS:
$ 17,222.40 $ 17,222.40
REQUIRED FEES:
Included above Included above
ROOM AND BOARD: (on-campus)
$ 6,260 $ 6,260
ROOM ONLY: (on-campus)
$ 3,940 $ 3,940
BOARD ONLY: (on-campus meal plan)
$ 2,320 $ 2,320
CDS - G2. Number of credits per term a student can take for the stated full-time tuition: 15 credit hours (based on two semester academic year) CDS - G3. Do tuition and fees vary by year of study (e.g., sophomore, junior, senior)? Yes No CDS - G5. Provide the estimated expenses for a typical full-time undergraduate student:
2005-06 Residents
(on campus) Commuters (living at
home)
Commuters (not living at
home) off campus
Books & supplies: supplies:
$ 930
$ 930
$ 930 Room only: $ 3,940 $ 5,180
Board only: $ 2,320 $ 1,530
$ 2,320 Transportation: $ 400 $ 400 $ 400 Other expenses: $ 2,820 $ 2,820 $ 2,820

21
CDS - G6. Undergraduate per-credit-hour charges (tuition only):
2005-06 In-state (out-of-district):
$ 71.57
Out-of-state:
$ 521.08
NONRESIDENT ALIENS:
$ 521.08
22
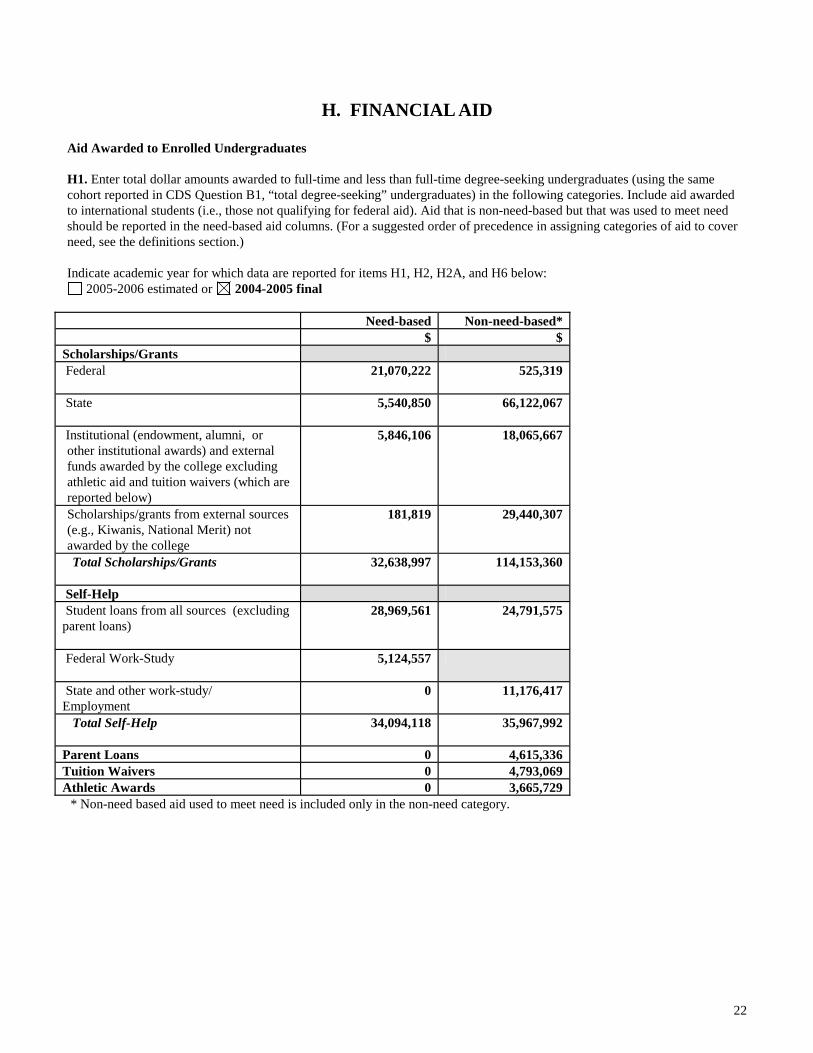
H. FINANCIAL AID
Aid Awarded to Enrolled Undergraduates H1. Enter total dollar amounts awarded to full-time and less than full-time degree-seeking undergraduates (using the same cohort reported in CDS Question B1, “total degree-seeking” undergraduates) in the following categories. Include aid awarded to international students (i.e., those not qualifying for federal aid). Aid that is non-need-based but that was used to meet need should be reported in the need-based aid columns. (For a suggested order of precedence in assigning categories of aid to cover need, see the definitions section.) Indicate academic year for which data are reported for items H1, H2, H2A, and H6 below:
2005-2006 estimated or 2004-2005 final
Need-based Non-need-based* $ $
Scholarships/Grants Federal
21,070,222 525,319
State
5,540,850 66,122,067
Institutional (endowment, alumni, or other institutional awards) and external funds awarded by the college excluding athletic aid and tuition waivers (which are reported below)
5,846,106 18,065,667
Scholarships/grants from external sources (e.g., Kiwanis, National Merit) not awarded by the college
181,819 29,440,307
Total Scholarships/Grants
32,638,997 114,153,360
Self-Help Student loans from all sources (excluding parent loans)
28,969,561 24,791,575
Federal Work-Study
5,124,557
State and other work-study/ Employment
0 11,176,417
Total Self-Help
34,094,118 35,967,992
Parent Loans 0 4,615,336 Tuition Waivers 0 4,793,069 Athletic Awards 0 3,665,729 * Non-need based aid used to meet need is included only in the non-need category.

23
Number of Enrolled Students Receiving Aid H2. List the number of degree-seeking full-time and less-than-full-time undergraduates who applied for and received financial aid. Aid that is non-need-based but that was used to meet need should be counted as need-based aid. Numbers should reflect the cohort receiving the dollars reported in H1. Note: In the chart below, students may be counted in more than one row, and full-time freshmen should also be counted as full-
time undergraduates.
Need-based Awards First-time Full-time Freshmen
Full-time Undergrad (includes freshmen)
Less than Full-time
Undergrad
a) Number of degree-seeking undergraduate students (CDS Item B1 if reporting on fall 2003 cohort)
6,741 33,129 Included in Full-time
b) Number of students in line a who were financial aid applicants (include applicants for all types of aid)
4,136 16,599 Included in Full-time
c) Number of students in line b who were determined to have financial need
2,568 13,107 Included in Full-time
d) Number of students in line c who received any financial aid 2,556 13,022 Included in Full-time
e) Number of students in line d who received any need-based gift aid
1,403 7,869 Included in Full-time
f) Number of students in line d who received any need-based self-help aid
1,223 8,167 Included in Full-time
g) Number of students in line d who received any non-need-based gift aid
2,386 9,519 Included in Full-time
h) Number of students in line d whose need was fully met (exclude PLUS loans, unsubsidized loans and private alternative loans).
913 3,988 Included in Full-time
i) On average, the percentage of need that was met of students who received any need-based aid. Exclude any resources that were awarded to replace EFC ( PLUS loans, unsubsidized loans and private alternative loans).
85.0% 84.6% Included in Full-time
j) The average financial aid package of those in line d. Exclude any resources that were awarded to replace EFC (PLUS loans, unsubsidized loans and private alternative loans).
9,763** 10,566** Included in Full-time
k) Average need-based gift award of those in line e 4,317 4,302 Included in Full-time
l) Average need-based self-help award (excluding PLUS loans, unsubsidized loans and private alternative loans) of those in line f
3,065 4,262 Included in Full-time
m) Average need-based loan (excluding PLUS loans, unsubsidized loans and private alternative loans) of those in line f who received a need-based loan.
2,792 4,116 Included in Full-time
H2A. Number of Enrolled Students Receiving Non-need-based Grants and Scholarships: List the number of degree-seeking full-time and less-than-full-time undergraduates who had no financial need and who received non-need-based gift aid. Numbers should reflect the cohort receiving the dollars reported in H1. ** Includes loans used to offset EFC. Note: In the chart below, students may be counted in more than one row, and full-time freshmen should also be counted as full-
time undergraduates.

24
First-time
Full-time Freshmen
Full-time Undergrad (includes freshmen)
Less than Full-time
Undergrad
n) Number of students in line a who had no financial need who received non-need-based gift aid (exclude those receiving athletic awards and tuition benefits)
3,812 16,447 Included in Full-time
o) Average dollar amount of non-need-based gift aid awarded to students in line n
5.065 4,261 Included in Full-time
p) Number of students in line a who received a non-need-based athletic grant or scholarship
108 486 Included in Full-time
q) Average dollar amount of non-need-based athletic grants and scholarships awarded to those in line p
7,832 10,975 Included in Full-time
H3. Which needs-analysis methodology does your institution use in awarding institutional aid?
Federal methodology (FM)
Institutional methodology (IM)
Both FM and IM
H4. Percent of 2004 undergraduate class who graduated between July 1, 2003 and June 30, 2004 have borrowed through any
loan programs (federal, state, subsidized, unsubsidized, private etc.; exclude parent loans). Include only students who borrowed while enrolled at your institution. 41%*.
H5. Average per-borrower cumulative undergraduate indebtedness of those in line H4; do not include money borrowed at other
institutions: $ 14,835* (* include loans at other institutions) Aid to Undergraduate Degree-seeking Nonresident Aliens (Note: Report numbers and dollar amounts for the same academic year checked in item H1.) H6. Indicate your institution’s policy regarding financial aid for undergraduate degree-seeking (nonresident alien):
Institutional need-based scholarship or grant aid is available Institutional non-need-based scholarship or grant aid is available Institutional scholarship and grant aid is not available
If college-administered financial aid is available for undergraduate degree-seeking nonresident aliens, provide the number of undergraduate degree-seeking nonresident aliens who received need- or non-need-based aid: ______ Average dollar amount awarded to undergraduate degree-seeking nonresident aliens: $ ______________ Total dollar amount of financial aid from all sources awarded to all undergraduate degree-seeking nonresident aliens: $______________

25
H7. Check off all financial aid forms (nonresident alien) first-year financial aid applicants must submit:
Institution’s own financial aid form CSS/Financial Aid PROFILE International Student’s Financial Aid Application International Student’s Certification of Finances Other: _______________________________________________________________
Process for First-Year/Freshman Students H8. Check off all financial aid forms domestic first-year (freshman) financial aid applicants must submit:
FAFSA Institution’s own financial aid form CSS/Financial Aid PROFILE State aid form Noncustodial PROFILE Business/Farm Supplement Other: _______________________________________________________________
CDS - H9. Indicate filing dates for first-year (freshman) students:
Priority date for receipt of required financial aid forms: 3/15 CDS - H10. Indicate notification dates for first-year (freshman) students:
Students notified on a rolling basis: yes If yes, starting date: 4/1 CDS - H11. Indicate reply dates:
Students must reply by (date): No required timeframe. Types of Aid Available
Please check off all types of aid available at your institution:
CDS - H12. Loans FEDERAL DIRECT STUDENT LOAN PROGRAM (DIRECT LOAN)
Direct Subsidized Stafford Loans Direct Unsubsidized Stafford Loans Direct PLUS Loans
FEDERAL FAMILY EDUCATION LOAN PROGRAM (FFEL) FFEL Subsidized Stafford Loans FFEL Unsubsidized Stafford Loans FFEL PLUS Loans

26
Federal Perkins Loans Federal Nursing Loans State Loans College/university loans from institutional funds Other (specify):
CDS - H13. Scholarships and Grants Need-based:
Federal Pell SEOG State scholarships/grants Private scholarships College/university gift aid from institutional funds United Negro College Fund Federal Nursing Scholarship Other (specify):
Non-need based (college-administered):
State Academic Creative arts/performance Special achievements/activities Special characteristics Athletic ROTC Other (specify):
CDS - H14. Check off criteria used in awarding institutional aid. Check all that apply. Non-need Need-based Non-need Need-based
Academics Leadership Alumni affiliation Minority status
Art Music/drama Athletics Religious affiliation
Job skills State/district residency ROTC ---------------

27
I. INSTRUCTIONAL FACULTY AND CLASS SIZE
CDS - I1. Please report number of instructional faculty members in each category for Fall 2005. Full time Part time Total Total number of instructional faculty 2,229 82 2,311 Total number who are members of minority groups
386 9 395
Total number who are women 670 29 699 Total number who are men 1,559 53 1,612 Total number who are non-resident aliens (international)
134 6 140
Total number with doctorate, first professional, or other terminal degree
1,910 59 1,969
Total number whose highest degree is a master’s but not a terminal master’s
158 11 169
Total number whose highest degree is a bachelor’s
13 4 17
Total number whose highest degree is unknown or other (Note: Items f, g, h, and i must sum up to item a.)
148
8 156
Total number in stand-alone graduate professional programs in which faculty teach virtually only graduate-level students
262
11 273
Total number whose highest degree is a Doctorate
1,735
50 1,785
CDS - I2. Student to Faculty Ratio Report the Fall 2005 ratio of full-time equivalent students (full-time plus 1/3 part time) to full-time equivalent instructional faculty (full time plus 1/3 part time). In the ratio calculations, exclude both faculty and students in stand-alone graduate or professional programs such as medicine, law, veterinary, dentistry, social work, business, or public health in which faculty teach virtually only graduate level students. Do not count undergraduate or graduate student teaching assistants as faculty. Fall 2005 Student to Faculty ratio: 21.4 to 1 (based on 42,659 students and 1,991 faculty). CDS - I3. Undergraduate Class Size In the table below, please use the following definitions to report information about the size of classes and class sections offered in the Fall 2005 term. Number of Class Sections with Undergraduates Enrolled. Undergraduate Class Size (provide numbers) 2-9 10-19 20-29 30-39 40-49 50-99 100+ Total
CLASS SECTIONS
377 885 691 393 233 359 285 3,223

28
2-9 10-19 20-29 30-39 40-49 50-99 100+ Total CLASS SUB- SECTIONS
103 540 421 309 24 18 20 1,435

29
J. DEGREES CONFERRED CDS – J1. Degrees conferred between July 1, 2004 and June 30, 2005 Reference: IPEDS Completions, Part A For each of the following discipline areas, provide the percentage of diplomas/certificates, associate, and bachelor’s degrees awarded. Category Diploma/
certificates Associate Bachelor’s CIP categories to
include here Agriculture 5.9% 1 Architecture 1.3% 4 Area and ethnic studies 0.1% 5 Biological/life sciences 3.3% 26 Business/marketing 19.4% 52 Communications/journalism 8.7% 9 Communication technologies 10 Computer and information sciences
1.1% 11
Construction trades 46 Education 2.7% 13 Engineering 10.2% 14 Engineering technologies 1.6% 15 English 3.1% 23 Foreign languages and literature 1.7% 16 Health professions and related sciences
7.0% 51
History 2.6% 54 Home economics and vocational home economics
0.7% 19
Interdisciplinary studies 1.1% 30 Law/legal studies 22 Liberal arts/general studies 24 Library science 25 Mathematics 0.8% 27 Mechanic and repair technologies 47 Military science and technologies 29 Natural resources/environmental science
1.1% 3
Parks and recreation 4.3% 31 Personal and miscellaneous services
12
Philosophy, religion, theology 0.7% 38 Physical sciences 1.2% 40 Precision production 48 Psychology 5.3% 42 Public administration and social services
44
Science technologies 41 Security and protective services 43 Social sciences 13.4% 45 Theology and religious vocations 39 Transportation and materials moving
49

30
Visual and performing arts 2.7% 50 Other TOTAL 100% 100% 100%