university of groningen faculty of economics and business
TRANSCRIPT

OPEN INNOVATION: EMPIRICAL EVIDENCE HOW INBOUND OPEN INNOVATION ACTIVITIES AFFECT THE INNOVATION BARRIERS -PERFORMANCE RELATIONSHIP.
University of Groningen Faculty of Economics and Business
Master Thesis MSc Business Administration - Strategic Innovation Management
June 19th, 2014
Word count: 9.347
Supervisor: Dr. John Qi Dong
By
Daniel Kroesen
Student number: s2248115
1
Abstract This longitudinal study aims to empirically investigate the moderating effects of open innovation on
the innovation barrier performance relationship. The investigated barriers are cost and knowledge
constraints. The investigated open innovation activities are collaboration and sourcing. I use the data
of the fourth and fifth Community Innovation Survey, which were conducted between 2002 and 2006.
Containing 215 industry observations, the sample represents 226.290 surveyed innovative firms
among 20 European countries and 41 industry sectors. I find that knowledge barriers hampering firms
innovation performance, and that they cannot be overcome by collaborating and sourcing. The reason
might be that firms need a strong knowledge base to create the needed absorptive capacity to identify,
assimilate, and exploit external knowledge. Regarding the cost barriers I find that being aware of
financial constraints has a positive effect on innovation performance. This effect cannot be
strengthened by collaborating, which might be caused by the collaboration accompanied coordination
costs. However, sourcing has a positive effect. This might be because sourcing supports development
processes by finding solutions to occurring problems, which leads to an enhancement in efficiency.
1. Introduction “Open Innovation” became one of the most studied topics in innovation literature within the last
decade. Chesbrough (2003a) claimed the term to emphasize the phenomenon that in today’s
environment of plentiful information and knowledge, companies cannot stay competitive based solely
on their own ideas and developments. They need to leverage external sources to stay innovative.
Building on observations from companies like Xerox PARC and IBM, the open innovation concept is
defined as the use of inbound and outbound information flows to enhance internal innovation
processes and create external paths to market (Chesbrough, Vanhaverbeke & West, 2006). In contrast
to previous literature on external knowledge sources and collaboration (e.g. Cohen & Levinthal, 1989;
Cohen & Levinthal, 1990; Hagedoorn & Duyster, 2002; Van Hippel, 1986; Hagedoorn, 1993; Katz &
Allen, 1982), open innovation emphasizes the importance of simultaneously managing and balancing
internal and external innovation activities (Van de Vrande, 2010). Prior literature has extensively
elaborated on what open innovation conceptually is (e.g. Chesbrough, 2003), on how it is
differentiated from other concepts (e.g. Chesbrough et al., 2006; Van de Vrande, 2010), which
concepts it encompasses, and how it is related to innovation performance (e.g. Laursen and Salter,
2006). However, until now it has not been empirically tested how it might help organizations to tackle
innovation barriers. Also the role of innovation barriers has not been conceptually investigated
intensively so far. Knowledge barriers find fragmented attention among multiple theoretical streams,
but have not been conceptualized into a single term. Cost barriers found a little more empirical
attention. However, survey based studies didn’t produce congruous results so far. Some found

2
negative performance relations (e.g. Savignac, 2006; Tiwari et al., 2007) other surprisingly positive
performance relations (Baldwin and Lin, 2002; Immarino et al., 2002).
The investigation of those concepts would also be highly important from a managerial perspective.
The underlying reason for this are environmental changes, which need to be anticipated: markets are
getting more dynamic due to globalization, resulting in highly competitive market places with shorter
product-life cycles and consequently shorter development cycles, while technology is getting more
complex. As consequence firms are increasingly exposed to innovation barriers due to cost and
knowledge shortages, hampering their attempts of holding pace with customer demand and needs
under competitive pressure. Therefore, the goal of this study is to discover whether means of inbound
open innovation can help firms to overcome knowledge and cost barriers towards their innovation
performance. More specifically: does inbound openness significantly moderate the innovation barrier
-performance relationship as shown in Figure 1? In order to test this moderation it has first to be
tested whether knowledge and cost barriers significantly hamper a firm’s innovation performance.
Furthermore it is interesting to see how collaboration and sourcing affect each of the barrier
performance relationships.
It is assumed that a lack of knowledge and cost hamper a firm’s innovation success. This is because
relatively weak knowledge makes it more difficult to explore new opportunities, which is the pathway
to innovation. A lack of financial means deters managers to venture large and risky investments. As a
result, firms, which are opposed to such situations, are threatened to inertia and overexploitation of
existing knowledge (Ahuja and Lampert, 2001). Overexploitation can harm a firm’s absorptive
capacity, the ability to identify, assimilate, and exploit new, diverse or distant knowledge, which is
indispensable for being innovative (e.g. Cohen and Levinthal, 1990; Vasudeva and Anand, 2011). To
tackle this problem and to overcome the overexploitation trap, inbound open innovation can help
stimulating internal R&D and a firm’s absorptive capacity by providing new knowledge and
opportunities. Collaboration, the joint development of new products or processes, helps transferring
knowledge, sharing costs and risks while sourcing offers insights into emerging technologies and
Figure 1 The Conceptual Model

3
markets as well as new qualified employees. Therefore, this study proposes that these inbound open
innovation activities help firms to deal with innovation barriers.
Data on innovative firms from the European Community Innovation Survey four and five has been
used to empirically test the model. The data has been collected over a period of four years (2002-
2006) and represents 226.290 firms among 41 industrial sectors and 20 countries. Therefore, the
results should be meaningful and significant from a theoretical and managerial perspective.
This report is structured in the following way: section 2 provides a review about the relevant
literature, section 3 continues with developing the theory and hypotheses, right before section 4
follows with describing the Community Innovation Survey, the extracted data, measurements and
statistical methods. The section closes with a detailed presentation of statistical quality measures.
Consecutively section 5 presents the statistical results. Finally, this report ends with section 6, which
discusses the findings and provides theoretical and managerial implications, the report’s limitations
and an outlook onto prospective studies.
2. Literature Review At the heart of the concept of openness lies the idea that enterprises cannot innovate effectively in
isolation (Dahlander & Gann, 2010). This is caused by the fact that a single company cannot employ
all smart people and have all possibly needed knowledge, which means that there are smart
individuals outside a company from whose expertise a company could benefit (Chesbrough, 2003b).
Based on these thoughts and some large enterprise observations, Chesbrough (2003a) coined the term
“Open Innovation”. His definition, which is the most commonly used one, states that open innovation
is “…the use of purposive inflows and outflows of knowledge to accelerate internal innovation, and
expand the markets for external use of innovation, respectively” (Chesbrough et al., 2006:2). The
process of knowledge inflows is called inbound open innovation, which describes outside-in activities
like collaborating and sourcing. The process of outflows is called outbound open innovation, which
means inside-out activities like selling and revealing.
Although prior research emphasized the importance to use external knowledge sources and pathways
(Cohen & Levinthal, 1989; Cohen & Levinthal, 1990; Hagedoorn & Duyster, 2002; Van Hippel,
1986; Hagedoorn, 1993; Katz & Allen, 1982) Chesbrough (2003a) claimed a paradigm shift from a
closed to an open innovation model. And in fact, the concept “Open Innovation” made some
important contributions to the literature. First of all, Chesbrough established a single term covering
different academic developments, which enables scholars to research in this direction (Huizingh,
2011). Secondly, the open innovation literature integrates the inbound and outbound knowledge flows
(Chesbrough, 20006). Thus, it emphasizes that some innovation activities contain both processes,

4
which additionally stresses the possibility that knowledge needs to be managed outside of
organizational boundaries (Lichtenthaler, 2008). Thirdly, open innovation literature displays the need
for simultaneously organized processes of internal and external knowledge management, to overcome
either-or decision making about whether a task should be performed internally or externally
(Chesbrough, 2003a). This firm-level view emphasizes the integrated and simultaneous exploration of
internal and external knowledge (Cohen & Levinthal, 1990). In conclusion, it can be stated that within
the closed model, external knowledge is more an addition to internal innovation, whereas the open
paradigm explicitly emphasizes a balanced role of internal and external innovation and knowledge
assimilation (Van de Vrande, 2010).
One important distinction has to be made towards open source methods for software development, as
it is often conflated with open innovation. Open source software (OSS) allows everyone to view and
modify the source code, as opposed to closed source software, which is protected by property rights
(Lessig, 1999). Therefore, the focus of OSS lies on value creation whereas the concept of open
innovation also intends value capturing (Chesbrough et al., 2006). Furthermore, it has to be stated that
the mentioned paradigm shift does not intend to create a binary classification in which it has to be
chosen between the open and closed concept, (Chesbrough, 2003a; Dahlander and Gann, 2010) but to
place these concepts on a continuum with varying degrees of openness (Chesbrough et al., 2006).
Also, the concept is not intended to be a substitution for internal R&D. This is because enterprises
need a certain level of competencies in areas related to their innovation partners, to be able to
assimilate or co-develop externally originated ideas (Brusoni, Prencipe and Pavitt, 2001; Granstrand,
Patel and Pavitt, 1997). This is also the idea behind Cohen’s and Levinthal’s (1989; 1990; 1994)
papers on absorptive capacity, what makes internal competencies and external linkages complements
instead of substitutes. Therefore, absorptive capacity is a highly important theoretical concept for this
research. It refers to the three fundamental learning dimensions: identifying, assimilating and
exploiting external knowledge (Cohen and Levinthal, 1989). It is of high importance for firms to build
and maintain their absorptive capacity, as it helps strengthening, complementing and re-orienting a
firm’s knowledge base (Lane et al., 2006). Absorptive capacity does not refer to becoming better at
what a firm already does, but learning something different (Lane et al., 2006). Therefore, two criteria
have to be met regarding the knowledge bases of knowledge transferring firms. First, the knowledge
bases should have certain similarities to enhance the mutual understanding. Second, in order to create
an advantage through the transfer, the knowledge needs to be somewhat different (Cohen and
Levinthal, 1990). This is in line with later findings of e.g. Sampson (2007), who found that a
moderate technological diversity between firms is most beneficial for their innovation performance,
and Vasudeva and Anand (2011), who found that a firm’s absorptive capacity peaks when the
transferred knowledge is either diverse (new but familiar) or distant (new and unfamiliar) but not both
simultaneously. From an environmental perspective, Cohen and Levinthal (1989; 1990) showed that

5
factors like technological opportunities, the industry demand, and low degrees of intellectual property
rights (IPR) increase R&D spending, which in turn enhances a firm’s absorptive capacity. These
findings demonstrate that a rich environment stimulates R&D and knowledge assimilation, which
then again makes a firm better in assimilating knowledge. This positive self-enhancing cycle shows
the importance of inbound openness. On the one hand it helps firms to get stimulated to create
something innovative, and on the other hand it helps to remain the firm’s potential to get stimulated in
the future, which is their absorptive capacity.
3. Theory Development 3.1 Innovation Barriers – Performance Relationship.
Becoming innovative requires enterprises to overcome certain barriers, as succeeding depends on how
well a firm copes with those challenges accompanied with innovation activities. These challenges
could be accessing sufficient financial means, skilled staff, or obtaining appropriate market and
customer insights (D’Este et al., 2012). These challenges can be classified based on two fundamental
resources necessarily required for being innovative: (1) certain information corridors, meaning the
individual knowledge stock of human beings, and (2) sufficient funds to invest into highly educated
people and to exploit discovered opportunities (Shane and Venkataraman, 2000; Hall, 2002).
Therefore, it can be stated that becoming innovative requires enterprises to overcome knowledge and
cost barriers. By investigating the impact of financial barriers on a firm’s innovation performance, this
research is in line with past empirical studies (Tourigny and Le, 2004; Savignac, 2006; Tiwari et al.
2007; Mancusi and Vezulli, 2010). Additionally, the role of knowledge barriers is considered which
has been conceptually ignored so far (D’este et al., 2012).
3.1.1 The Role of Knowledge Barriers
The idea that a competitive advantage is based on the information asymmetries among different
enterprises has a long tradition. It has first been emphasized by Schumpeter (1934), used by
knowledge-based-perspective scholars (Grant, 1996), and then been addressed by the entrepreneurial
literature (Shane and Venkataraman, 2000). It explains who benefits from opportunities, which means
that those who are exposed to a lack of certain information are more likely to be outperformed, or in
other words less likely to be those who innovate. A shortage of qualified or the right employees can
be expected to cause this lack of organizational knowledge and low innovativeness, since innovation
begins as creativity of imaginative people (Amabile et al. 1996). This shortage can take multiple
expressions. A lack of technical or market knowledge (Galia and Legros, 2004), and a lack of
cognitive properties for identifying appropriate opportunities among a firm’s employees (Rosenberg,
1994; Shane and Venkataraman, 2000; Galia and Legros, 2004) can lead to a mismatch of technical
possibilities and market opportunities (Freeman and Soete, 1997). Furthermore a lack of knowledge

6
diversity or distance can lead to a low level of absorptive capacity, overexploitation of existing
knowledge, and difficulties in finding cooperation partners (Cohen and Levinthal, 1990; Ahuja and
Lampert, 2001; Alvarez and Busenitz, 2001; Vasudeva and Anand, 2011). Therefore, the following
hypothesis has been formulated:
Hypothesis 1a: The degree of knowledge barriers, a firm is
exposed to, is negatively related to its innovation performance.
3.1.2 The Role of Cost Barriers
As most survey studies that investigate cost barriers for innovation, this study will focus on the
perceived magnitude of financial barriers. Among these survey studies the effect of financial barriers
on innovation is not as consistent as expected. Some studies report the expected deterrent effect of
financial constraints on innovation activities. For instance, Savignac (2006) found that companies
exposed to financial barriers were less likely to engage in innovation activities. Similar results, related
to R&D investments, were delivered by Tiwari et al. (2007). Other studies, for instance Baldwin and
Lin (2002), who studied a large Canadian manufacturing sample, or Immarino et al. (2009) using the
third Community Innovation Survey, found that innovation active firms more frequently report
innovation barriers. They provided the explanation that the more innovation active a company is, the
more obstacles it experiences, and the higher the perceived importance of these obstacles will be.
However, since this study exclusively investigates innovative enterprises, a negative effect is
expected.
Hypothesis 1b: The degree of cost barriers a firm is exposed to, is
negatively related to its innovation performance.
3.2 The Moderating Role of Inbound Openness.
3.2.1 The Moderating Role of Collaboration
Scholars spent relevant attention to the collaboration, R&D alliance, network and cooperation
literature for the last decades. It has been elaborated that firms benefit from collaborating by accessing
complementary capabilities, using scale effects, reducing time to market of new developments, and
lowering the costs and risks accompanied by those new developments (e.g., Powell, 1990; Mowery,
Oxley and Silverman, 1996; Sampson, 2007). All these benefits represent mutual learning
possibilities for collaborating firms. Collaborating helps enterprises to assimilate knowledge, which is
new to the firm or related to emerging technologies. Additionally, it has the potential to stimulate
internal R&D onto new pathways (Cassiman and Veugelers, 2006; Noseleit and de Faria, 2013). The
new knowledge and stimulated R&D can lead to an enhancement of absorptive capacities and
cognition capabilities. The former refers to the ability to identify, assimilate and exploit external
knowledge (Cohen and Levinthal, 1990). The latter refers to the ability of identifying valuable

7
resources and market opportunities (Marino, 1996; Denrell et al., 2004; Danneels, 2010). Therefore,
collaborating can increase a firm’s exploration capabilities, which describes the use of new
technological trajectories. Meaning that collaboration has the potential to help firms overcoming
knowledge barriers, as these affect a firm’s innovation performance mostly by lowering its
exploration performance, leading to overexploitation of existing knowledge (Ahuja and Lampert,
2001; Vasudeva and Anand, 2011). However, collaborating only can be beneficial if the collaboration
partners have a somewhat different knowledge base. Uzzi (1997) stated that the more embedded a
firm is in its network, the more its diversity towards its partners decreases by isomorphism. This
happens when firms do not pursue the creation of new and diverse collaborative ties with firms
outside their network. Sampson (2007) supports this and found that firms, which moderately differ
from each other, gain most from their collaborative R&D activities. Consequently, ignoring the need
for new stimuli and cooperation partners can have severe consequences. Non-cooperative firms,
which hesitate to exchange intellectual property, diminish their knowledge base and lose the
capability to create exchanging relationships – their absorptive capacity (Cohen and Levintahl 1990;
Koschatzky, 2001). This may lead to a vicious circle, ending with being outperformed. Therefore, it is
crucial to cooperate externally to enhance a firm’s knowledge base, its absorptive capacity and
innovativeness, which leads to following hypothesis:
Hypothesis 2a: Collaboration activities strengthen the negative
relationship between knowledge barriers and innovation performance.
Besides the stimulating effects collaboration activities have on the knowledge base of a firm, they
provide further potential associated with new joint developments. Even though collaborations bring
along coordination costs and the risk of misappropriation due to opportunistic behavior (Williamson,
1985; Mitchell et al., 2002), its benefits are expected to exceed its threats. This is due to appropriate
governance mechanisms. For instance, Hoetker and Mellewigt (2009) developed governance
mechanisms depending on the alliance asset type, knowledge-based vs property-based, to mitigate
potential threats of collaborating. The literature on collaborative activities is congruous regarding its
benefits and offers three substantial benefits. The first originates from the complementarity of the
firms’ assets. These complementary assets of alliance partners have the potential to create greater
rents than each of the collaborating firms would be able to obtain individually (Dyer, 1998).
Regarding innovation activities this could for instance mean finding pathways into new market
segments. Secondly economies of scale can dramatically lower developing and production costs
(Mariti and Smiley, 1983). And thirdly, risk sharing offers the potential to pursue disruptive
innovation, which may have been canceled otherwise (Mariti and Smiley, 1983). Therefore, it can be
concluded that those companies actively pursuing collaborative agreements will perform better with
respect to innovation activities.

8
Hypothesis 2b: Collaboration activities strengthen the negative
relationship between cost barriers and innovation performance.
3.2.2 The Moderating Role of Sourcing
Organizational knowledge sourcing deals with the assimilation of knowledge and technology from
external sources. It is different from collaboration in so far that it assimilates information from
external sources without joint developments. Conceptually it belongs to the organizational knowledge
transfer research stream, which refers to the process of exchanging, receiving, and being influenced
by external experiences and knowledge (Wijk et al., 2008). This process is essential for enterprises
due its importance for the development of new applications (Henderson and Cockburn, 1994; Kogut
and Zander, 1992). Prior studies support the positive effect knowledge transfers have on enterprise
performance (e.g. Steensma and Lyles, 2000). Research showed that firms, which have the capability
to learn from their market environment, are more likely to match their products with emerging market
demand (Day, 1994). The transfer of knowledge makes new product developments more likely, due to
the stimulation new knowledge has on the existing knowledge stock (Jansen et al., 2005). Enkel et al.
(2009) further contribute that a diverse set of sources is of high importance for innovation, as most
innovation come from recombined knowledge and technology. This shows the relevance of different
sources for knowledge assimilation, which is supported by studies showing the importance of the
science-industry link on the one hand, and the benefits of strong market oriented firm culture on the
other hand. For instance, Quinn (1986) found that all innovative enterprises studied by him showed
high degrees of market orientation. Conducting a three-wave-survey study between 1997 and 2005,
Kumar et al. (2011) even found that being market oriented has become a fail preventer opposed to
formerly being seen as a success provider, by having great impact on long and short term profits.
Regarding the science-industry link, it has been found that public research does not suggest new
product ideas, which just have to be picked up, but rather provide problem-solving solutions (Cohen
et al., 2002). More precisely, these sources can offer insights on emerging technologies and provide
students as potential employees leading to enhanced knowledge bases (Caloghirou et al., 2001). This
is in line with the findings of Nelson and Rosenberg (1994), who found that scientific research has
stimulating and enhancing effects on a firm’s internal R&D. Accordingly, prior studies suggest that
the transfer of knowledge due to multiple sources enhances a firm’s innovativeness by providing
information and knowledge on technology, markets, and by providing qualified employees. As a
consequence hypothesis 3 has been formulated.
Hypothesis 3a: Sourcing activities strengthen the negative relationship
between knowledge barriers and innovation performance.

9
Additionally scholars found that strong knowledge, which can be most effectively assimilated by
good sourcing, enhances R&D efficiency and the accuracy of reflecting market demand and needs
(Nelson, 1982). Mowery (1995) argues into the same direction stating that scientific research can
increase the development efficiency of technologies, which is supported by Cohen’s et al. (2002)
problem-solving argument mentioned earlier. Accordingly, it can be assumed that the efficiency
enhancing effect of good and diverse sourcing lowers the impact of cost-barriers towards a firm’s
innovation performance.
Hypothesis 3b: Sourcing activities strengthen the negative relationship
between cost barriers and innovation performance.
4. Methodology
4.1 Data Collection - The Community Innovation Survey
This research makes use of secondary data from The Community Innovation Survey 2004 (CIS4) and
2006 (CIS5), which was executed by Eurostat, the European statistical office, and its member states.
The general aim of the regularly conducted CIS is to obtain data regarding the innovativeness of
participating countries, enterprises and so on. Gathered information is used for academic research and
to compare the performance of the member countries by the European innovation index. The survey is
motivated by the European Union’s (EU) goal to raise growth rates and increase research investments
by making innovation topics core elements of EU policies. EU-wide methodological definitions of the
Oslo Manual were used to carry out the survey (OECD, 2005).
The process of sample selection started with a comparison of all Community Innovation Surveys
conducted so far. Until now seven Community Innovation Surveys have been conducted within the
period of 2000 and 2010. The CIS4 and CIS5 have been chosen for this analysis since all constructs to
be observed are covered by their questionnaires. In addition these two surveys show high similarity
regarding their methodology. The CIS3 covers the used constructs as well, but does not include all
measurement items, which led to its exclusion for this research. All remaining surveys do not
encompass the needed measurements items, leading to their exclusion. Launched in 2005, CIS4 was
conducted between 2002 and 2004 and includes data from all 25 EU members (as for 2004), Iceland,
Norway, Bulgaria and Romania. Launched in 2007, CIS5 was conducted within the period of 2004
and 2006 and includes data from all 25 EU members (as for 2006), Norway, Bulgaria, Rumania,
Croatia and Turkey. The surveyed industries were defined by NACE Rev 1.1, which is the statistical
classification of economic activities in the European Community (Eurostat, 2014). The target
population of each survey represents the total population of enterprises related to NACE market
activities “C-K” (European Commission, 2006a; European Commission, 2006b). Therefore, the
industry coverage includes (C) mining and quarrying, (D) manufacturing, (E) electricity, gas and
water supply, (F) construction, (G) wholesale and retail trade, (H) hotel and restaurants, (I) transport,

10
storage and communication, (J) financial intermediation, (K) real estate, renting and business
activities. These industry categories are sub-divided into sectors, which are used in this research to
increase the sample size. All observations made by the Eurostat innovation surveys represent
enterprises with more than ten employees (Eurostat, 2014). For this research only product and/or
process innovative enterprises, regardless of organizational or marketing innovations encompassing
abandoned and/or suspended innovations, are included in the sample. In other words, only innovation
active enterprises have been considered. Data extraction regarding the related constructs yielded data
on 48 different industry sectors across all nine NACE-industries and 29 countries for 2004 and 30
countries for 2006, with N = 2.832. Since the Eurostat database only provides aggregated data on
industry level, the extracted sample represents 352.425 enterprises for 2004 and 306.965 enterprises
for 2006. A careful data examination led to the exclusion of observations showing missing values on
some measurement items. This exclusion reduced the number of observed industry-sectors to 35
across now 18 countries for 2004. For 2006 the number of observed industry-sectors has been reduced
to 39 across 4 countries. However, all nine core industries defined by NACE are still covered by the
sample and by each year’s observations, with N = 215 in total. As shown in Table 1, these data
represent 168.303 enterprises for 2004 and 57.987 enterprises for 2006. Furthermore it can be seen
that the majority of the surveyed innovative enterprises, which suit the requirements of this research,
are located in Spain and that almost the half (49,6 %) of the enterprises belong to the manufacturing
industry as shown in Table 2. In summary, the sample can be described as covering most of the
Source: Eurostat, Community Innovation Survey 4 and 5
Table 1 Enterprise Distribution regarding Country of Origin

11
NACE industry sectors and a large proportion of the European economy by including 20 countries
and 226.290 observations among four years collected by two surveys.
4.2 Measures
4.2.1 Dependent Variable: Performance
The dependent variable in this research is innovation performance. It is measured as a second-order
hierarchical construct, consisting out of the two first order constructs “Product and Service Innovation
Effects” and “Process Innovation Effects”. The first is measured by three items and the second by
two, as can be seen in Figure 2. The respondents reported whether each effect was experienced as
high, medium or low. However, the available data only provides data on high innovation effects as the
percentage of all respondents for each observed country-sector combination as described in Table 3.
The mentioned measures have been chosen over other common measures like patenting and financial
Table 2 Enterprise Distribution regarding NACE Rev 1.1 Sector Classification
Source: Eurostat, Community Innovation Survey 4 and 5
12
measures because of several reasons. First, financial measures do not necessarily capture all
successful innovation efforts. Often innovations, especially disruptive innovations, show their
beneficial impact first on the long run, which might be not captured by a survey study. Patenting,
which is commonly used, is also often criticized, as the commercial importance of patents vary across
industries and technologies (Levin et al., 1987). It also only represents codified knowledge, which
means that it does not effectively measures intangible, uncodified knowledge. Whereas the use of
product/service and process related measures, like increased production flexibility or increased
product ranges, directly captures the benefits of innovation efforts.
4.2.2 Independent Variable: Barriers to Innovate
Cost and knowledge barriers are the two independent variables in this research. The first construct is
measured by three items, and the latter by four, as shown in Figure 2. Respondents had to indicate the
degree of importance of several hampering factors on a scale from high, over medium, and low, to
not-experienced. As with the dependent variable, the available data only provides high degrees,
measured as the percentage of all respondents for each country-sector combination as described in
Table 3.
4.2.3 Moderating Variable: Inbound Openness
The focus of this research is the concept of inbound openness. This concept refers to inbound oriented
open innovation activities. To measure this concept two themes are used: collaboration and sourcing.
The first, collaboration, is measured as a second order hierarchical construct, consisting out of the two
first order constructs cooperation and mainly-developed-by-others as shown in Figure 2. Surveyed
enterprises reported whether their product- or process-developments were created by themselves, in
cooperation, or mainly by others. The first-order construct cooperation refers to products and
processes, which were created together with other enterprises or institutions. “Mainly-developed-by-
others” only refers to products mainly developed by other enterprises or institutions, since the item
loading for “processes-mainly-developed-by-others” was statistically too low (below 0,40), which led
to the exclusion of this item (Hair, Ringle and Sarstedt, 2011).
The second moderator, Sourcing, is measured by the use of six items as shown in Figure 2. The
surveys collected data on nine items. However, three items exhibit loadings, which were statistically
too low, below 0.40, leading to their exclusion (Hair et al., 2011). The excluded sourcing items are
suppliers, clients, and conferences. The remaining items are listed in Table 3. The items are divided
into the two categories market and institutional sources, which were initially used as two first order
constructs in a hierarchical second order construct. However, the items of these two constructs
showed high cross-loadings with each other’s construct, which led to its merger to one construct.
Each of the items has been surveyed regarding their degree of importance, which was distinguished

13
into high, medium, low, and not-experienced. As with the independent and dependent variable, the
available data only provides high degree of importance, measured as the percentage of all respondents
for each country-sector combination.
All constructs are reflective, meaning that the causality is from construct to measure and that all
measurements are interchangeable and highly correlated. Therefore, the same results would be
expected by using different measures for the same constructs (Fornell and Bookstein, 1982).
Table 3 Measurement Overview
14
4.3 Statistical Method and Quality Criteria
4.3.1 Statistical Method
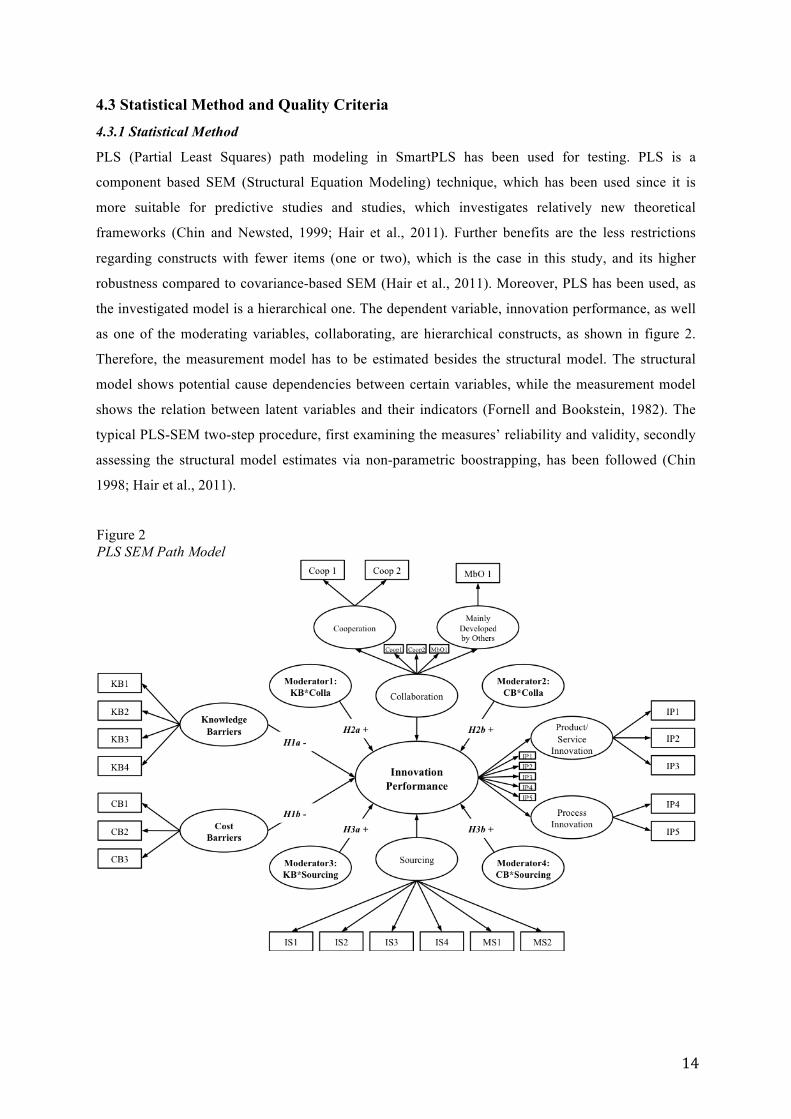
PLS (Partial Least Squares) path modeling in SmartPLS has been used for testing. PLS is a
component based SEM (Structural Equation Modeling) technique, which has been used since it is
more suitable for predictive studies and studies, which investigates relatively new theoretical
frameworks (Chin and Newsted, 1999; Hair et al., 2011). Further benefits are the less restrictions
regarding constructs with fewer items (one or two), which is the case in this study, and its higher
robustness compared to covariance-based SEM (Hair et al., 2011). Moreover, PLS has been used, as
the investigated model is a hierarchical one. The dependent variable, innovation performance, as well
as one of the moderating variables, collaborating, are hierarchical constructs, as shown in figure 2.
Therefore, the measurement model has to be estimated besides the structural model. The structural
model shows potential cause dependencies between certain variables, while the measurement model
shows the relation between latent variables and their indicators (Fornell and Bookstein, 1982). The
typical PLS-SEM two-step procedure, first examining the measures’ reliability and validity, secondly
assessing the structural model estimates via non-parametric boostrapping, has been followed (Chin
1998; Hair et al., 2011).
Figure 2 PLS SEM Path Model
15
4.3.2 Quality Criteria
Since a reflective measurement model has been used, as shown in Figure 2, reliability and validity
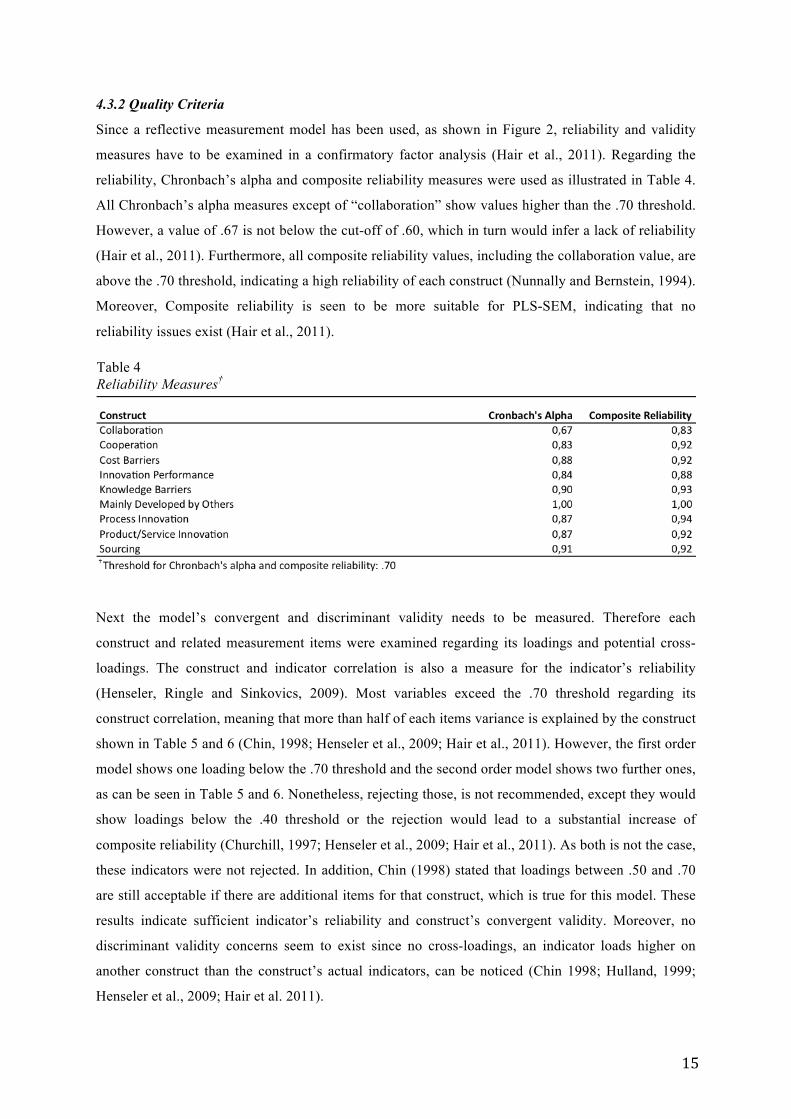
measures have to be examined in a confirmatory factor analysis (Hair et al., 2011). Regarding the
reliability, Chronbach’s alpha and composite reliability measures were used as illustrated in Table 4.
All Chronbach’s alpha measures except of “collaboration” show values higher than the .70 threshold.
However, a value of .67 is not below the cut-off of .60, which in turn would infer a lack of reliability
(Hair et al., 2011). Furthermore, all composite reliability values, including the collaboration value, are
above the .70 threshold, indicating a high reliability of each construct (Nunnally and Bernstein, 1994).
Moreover, Composite reliability is seen to be more suitable for PLS-SEM, indicating that no
reliability issues exist (Hair et al., 2011).
Next the model’s convergent and discriminant validity needs to be measured. Therefore each
construct and related measurement items were examined regarding its loadings and potential cross-
loadings. The construct and indicator correlation is also a measure for the indicator’s reliability
(Henseler, Ringle and Sinkovics, 2009). Most variables exceed the .70 threshold regarding its
construct correlation, meaning that more than half of each items variance is explained by the construct
shown in Table 5 and 6 (Chin, 1998; Henseler et al., 2009; Hair et al., 2011). However, the first order
model shows one loading below the .70 threshold and the second order model shows two further ones,
as can be seen in Table 5 and 6. Nonetheless, rejecting those, is not recommended, except they would
show loadings below the .40 threshold or the rejection would lead to a substantial increase of
composite reliability (Churchill, 1997; Henseler et al., 2009; Hair et al., 2011). As both is not the case,
these indicators were not rejected. In addition, Chin (1998) stated that loadings between .50 and .70
are still acceptable if there are additional items for that construct, which is true for this model. These
results indicate sufficient indicator’s reliability and construct’s convergent validity. Moreover, no
discriminant validity concerns seem to exist since no cross-loadings, an indicator loads higher on
another construct than the construct’s actual indicators, can be noticed (Chin 1998; Hulland, 1999;
Henseler et al., 2009; Hair et al. 2011).
Table 4 Reliability Measures†

16
To further assess the model’s convergent reliability, the composite reliability, and average variance
extracted (AVE) has been compared. As Table 7 shows, the composite reliability of each construct
exceeds the AVE of all measures indicating sufficient convergent reliability (Fornell and Larker,
1981). Furthermore, all AVE values exceed the cut-off of .50, proposed by Fornell and Larcker
(1981), meaning that each construct explains more than the half of its indicator’s variance, which
Table 5 First Order Construct Loadings†
Table 6 Second Order Construct Loadings†

17
additionally indicates sufficient convergent validity (Chin, 1998; Henseler et al., 2009; Hair et al.,
2011). Moreover, as shown in Table 7, the square-root of the AVE exceeds any construct correlation,
which is an additional support for discriminant validity, besides the cross-loading analysis (Chin,
1998; Fornell and Larcker, 1981; Hulland, 1999). All measures indicate sufficient construct and
indicator reliability as well as sufficient convergent and discriminant validity.
Finally, the model has to be tested for common method bias (CMB), which is the variance attributed
to the measurement method rather than to the model’s constructs represented by the measures
(Podsakoff, MacKenzie and Lee, 2003). Therefore, one of the mostly used tests has been applied,
Harman’s single factor test. The result shows that less than the majority (36.42 %) is explained by a
single factor, which means that CMB is unlikely an issue (Podsakoff et al., 2003). However, this
technique only assesses the extent to which CMB variance may be an issue, but does not statistically
control it (Podsakoff et al., 2003). To control for CMB the marker variable approach was applied
Table 7 Reliability and Validity Measures†
Table 8 Common Method Bias: Results Marker Variable Approach†

18
(Podsakoff et al., 2003). Therefore partial correlations are calculated and compared to the original
correlations to see whether original significant correlations remain significant, which was the case for
this model as shown in Table 8.
5. Results Table 9 shows the results of the bootstrapping with 1.000 replications, which was used to test the
hypotheses. Hypothesis 1a assumed a negative relationship between the level of knowledge barriers
enterprises experience and their innovation performance. The findings support the expectations and
show that there is overwhelming evidence (p = .001) to infer that a lack of knowledge has a strong
negative impact (β = -.419) on a company’s innovation performance. Cost barriers have been
predicted to be harmful for an enterprise’s innovation performance (H1b), as well. However, a strong
(β = .366) and highly significant (p = .001) positive relationship has been found, to infer that cost
barriers are beneficial. Hypothesis 2a predicted that collaboration intensity strengthens the negative
relationship between knowledge barriers and innovation performance, which is not supported due to
nonsignificant findings. The same has been found for hypothesis 2b, which assumed that
collaboration positively moderates the relationship between cost-barriers and innovation performance
and hypothesis 3a, predicting that sourcing intensity strengthens the knowledge barrier innovation
performance relationship. While a company’s sourcing intensity does not significantly affect the
influence of knowledge barriers, strong evidence (p = .05) has been found to infer that it strengthens
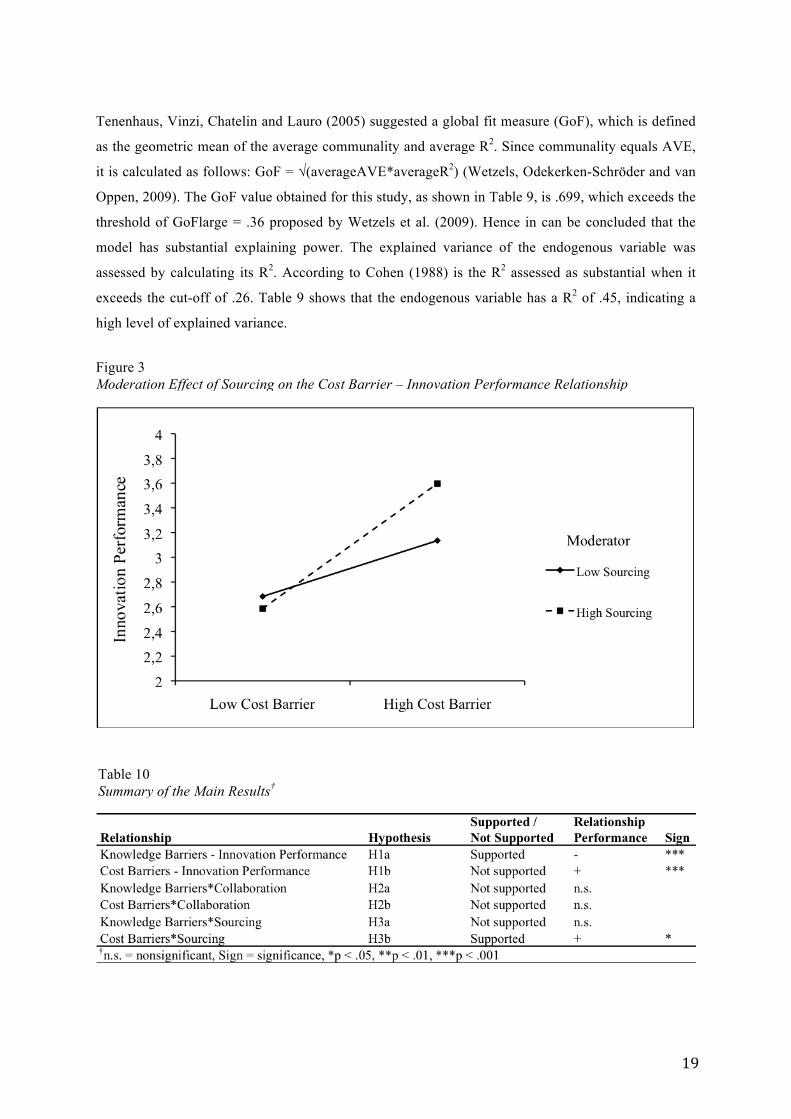
the relationship between cost barriers and innovation performance as shown in Figure 3. The results
are summarized in Table 10.
Table 9 Path Coefficients of the Structural Model†
19
Tenenhaus, Vinzi, Chatelin and Lauro (2005) suggested a global fit measure (GoF), which is defined
as the geometric mean of the average communality and average R2. Since communality equals AVE,
it is calculated as follows: GoF = √(averageAVE*averageR2) (Wetzels, Odekerken-Schröder and van
Oppen, 2009). The GoF value obtained for this study, as shown in Table 9, is .699, which exceeds the
threshold of GoFlarge = .36 proposed by Wetzels et al. (2009). Hence in can be concluded that the
model has substantial explaining power. The explained variance of the endogenous variable was
assessed by calculating its R2. According to Cohen (1988) is the R2 assessed as substantial when it
exceeds the cut-off of .26. Table 9 shows that the endogenous variable has a R2 of .45, indicating a
high level of explained variance.
Table 10 Summary of the Main Results†
Figure 3 Moderation Effect of Sourcing on the Cost Barrier – Innovation Performance Relationship

20
6. Discussion & Conclusion This research was undertaken to empirically investigate the impact of innovation barriers on a firm’s
innovation performance, and more importantly whether this proposed hampering effects could be
positively affected by open innovation activities. It was hypothesized that knowledge and cost barriers
will have harmful effects. For both, significant results have been found. However, of these two
hypotheses only H1a – hampering effects of knowledge barriers – holds true. This means that
knowledge barriers, which are conceptually under-investigated, have a negative, highly significant
effect on firms’ innovation performance. This result is in line with the vast amount of theories related
to the knowledge-based perspective. This result shows how important knowledge is nowadays, and
can best be summarized as follows: “An entrepreneur’s expanding knowledge base and absorptive
capacity becomes an entrepreneurial firm’s competitive advantage” (Alvarez and Busenitz, 2001, p.
766).
Surprisingly, cost barriers have been found to have highly significant positive effects on firm
innovation performance. This result is in line with the results of Baldwin and Lin (2002) and
Immarino et al. (2009), who found that innovative firms more frequently report innovation barriers
than non-innovative firms. This assumption has not been used for the related hypothesis, as only
innovative firms are included in the sample. However there are basically two possible explanations:
First, the one offered by Baldwin and Lin (2002) as well as Immariono et al. (2009), who claimed that
the fact that a survey with subjective measures was used to observe the presence of barriers biased the
results. Being aware of barriers could be a characteristic of successful innovation managers, whereas
being not aware of those could hamper the innovation process. The second explanation could be that
the cost barrier-performance relationship is mediated by efficiency. Meaning that the higher the cost
barrier, the more efficient a firm needs to be, the better the available resources are used, which is
finally leading to better innovation performance. Furthermore, it can be assumed that financial
constraints enhance managers’ market sensitivity, which has been found to have a positive
relationship with firm performance (e.g. Marino, 1996; Denrell et al., 2004; Danneels, 2011).
Collaborating has not been found to significantly moderate the relationships between cost/knowledge
barriers and innovation performance. Even though collaboration decreased the harmful effects of
knowledge barriers, the result was not significant. However, since a positive effect was observed, it
can be assumed that collaboration activities contribute to knowledge assimilation. One reason for the
nonsignificant results could be that firms, experiencing knowledge barriers, lack an appropriate
degree of absorptive capacity, leading to the inability of collaborating. This is consistent with the
findings of Danneels’ (2010) Smith Corona study, which shows that only firms possessing valuable
resources attract other firms to collaborate. Another reason for the nonsignificant effect on the
relationship between knowledge barriers and innovation performance could be the high coordination
costs accompanied with collaboration activities. This is because firms need to accomplish two

21
substantial goals for successfully collaborating: first they need to optimize the combination of their
resource, and secondly they need to find ways to lower the risk associated with opportunistic
behavior, which is common for knowledge based collaborations (Arrow, 1962; Mitchell et al., 2002;
Nickerson and Zenger, 2004; Hoetker and Mellewigt, 2009). Moreover, knowledge based
collaborations are difficult to pre-specify regarding their coordination, which leads to higher
coordination costs (Hoetker and Mellewigt, 2009). As for knowledge barriers, collaboration has
nonsignificant effects on the cost barriers innovation performance relationship. However, this is
interesting in so far that collaboration lowers the positive effect cost barriers have on innovation
performance. An explanation could be the coordination cost reasoning above, since an activity, which
increases costs, can unlikely help overcoming cost barriers.
Hypothesis 3a predicted that a firms sourcing intensity mitigates the hampering effects knowledge
barriers have. A positive effect has been observed, which is nonsignificant. This result can be
explained by the findings of Cohen et al. (2002), who stated that public research does not provide
ideas for innovative products or processes, but rather contributes problem-solving solutions. Hence,
sourcing can be seen as a knowledge-provider and inspiring mean towards internal R&D, which is the
origin of innovative ideas. However, sourcing does have a positive and highly significant moderating
effect on the positive relationship between cost barriers and innovation performance. Hence, sourcing
strengthens the positive effect cost barriers have. Also this can be explained by the findings of Cohen
et al. (2002), arguing that public research provides solutions rather than ideas, which can be related to
the efficiency of developments. Engineers and other employees face multiple problems during the
process of innovation development, which potentially lead to the project termination. The problem
solving function of sourcing lowers this negative effect. This result supports other previous findings
related to the enhancing effect of sourcing on internal R&D (Nelson, 1983; Mowery, 1995).
The results provide substantial managerial implications. The contrary effects of cost barriers on
innovation performance show that managers need to be aware of what deter them of being innovative.
Being aware of hampering factors and being sensitive could potentially be one key characteristic of
successful innovation managers. Furthermore, this study joins the vast amount of literature advocating
the importance of knowledge for firm performance. Even though collaboration shows nonsignificant
effects, managers should not neglect it. However, the discussion indicates that a proper internal R&D
department and an adequate knowledge stock is the basic condition for being innovative. If this is the
case, collaboration partners can be attracted and mutual benefits been captured. Finally, the results
show that firms should source intensively, as this has the potential to enhance the efficiency of
internal R&D and serve as a source of problem-solving solutions.
This research and its results are limited by several data related constraints. Overall, the
generalizability can be classified as high, as the data was collected among 20 European countries and

22
41 industrial sectors. However, a closer look shows that 50% of the sectors belong to the
manufacturing industry, whereas e.g. only 0.70% belong to the financial industry. Which means that
the results can only hardly be used to explain occurrences from the financial industry. Furthermore, it
needs to be stated that almost 60% of the collected data originated from the Spanish (41,70%) and
Italian (16,40%) economies, whereas the United Kingdom was not even included. Meaning that the
results cannot directly be implied on British enterprises. Another limitation is that for all measurement
items, except of those related to the construct “Sourcing”, only the results on high degrees were
available, since a use of micro data was not possible. Each of these items was originally measured by
four different degrees: high, medium, low, not experienced. Therefore, the use of micro data
potentially would have resulted in more specific results. Moreover it is important to mention that the
observations regarding experienced barriers is probably biased in so far that managers were able to
report that those barriers existed. The ability to mention innovation barriers shows that these
managers were already sensitized. Is this sensitivity a characteristic of innovative managers? This
would mean that those being not as innovative as the high performer were just not able to report that
they were actually experiencing innovation barriers.
Potential future studies could first of all contribute new insights by investigating the mentioned
limitations. For instance, as the majority of sectors belong to the manufacturing industry, future
studies could replicate this study by using only certain industries, for instance the financial industry.
Due to that, it could be investigated whether the results still hold true. In order to do so, those studies
should apply for the use of micro data in order to increase the sample size. The use of micro data
could also help future studies to investigate the effects by each degree (high, medium, low, not
experienced). Additionally, the model could be tested for each country or different clusters, like
Benelux or Eastern Europe vs Western Europe, to see whether differences exist. Regarding the
contrary cost barrier effect, scholars could investigate the effect of managerial sensitivity towards
potential barriers on innovation performance. Additionally, it could be tested whether efficiency
mediates the relationship between cost barriers and innovation performance.
References Ahuja, G., & Morris Lampert, C. (2001). Entrepreneurship in the large corporation: A longitudinal study of how established firms create breakthrough inventions. Strategic Management Journal, 22(6-7), 521-543. Alvarez, S. A., & Busenitz, L. W. (2001). The entrepreneurship of resource-based theory. Journal of management, 27(6), 755-775. Amabile, T. M., Conti, R., Coon, H., Lazenby, J., & Herron, M. (1996). Assessing the work environment for creativity. Academy of management journal, 39(5), 1154-1184.
23
Arrow, K. (1962). Economic welfare and the allocation of resources for invention. In The rate and direction of inventive activity: Economic and social factors (pp. 609-626). Nber. Baldwin, J., & Lin, Z. (2002). Impediments to advanced technology adoption for Canadian manufacturers. Research policy, 31(1), 1-18. Brusoni, S., Prencipe, A., & Pavitt, K. (2001). Knowledge specialization, organizational coupling, and the boundaries of the firm: why do firms know more than they make?. Administrative science quarterly, 46(4), 597-621. Bygrave, W. D. (1992). Venture Capital Returns in the 1980’s. The state of the art of entrepreneurship, 438-462. Caloghirou, Y., Tsakanikas, A., & Vonortas, N. S. (2001). University-industry cooperation in the context of the European framework programmes. The Journal of Technology Transfer, 26(1-2), 153-161. Cassiman, B., & Veugelers, R. (2006). In search of complementarity in innovation strategy: internal R&D and external knowledge acquisition. Management science, 52(1), 68-82. Chesbrough, H (2003a). Open Innovation: The New Imperative for Creating and Profiting from Technology. Boston, MA: Harvard Business School Press. Chesbrough, H (2003b). The era of open innovation. Sloan Management Review, 44(3), 35–41. Chesbrough, H. (2006). Open business models: How to thrive in the new innovation landscape. Boston: Harvard Business School Press. Chesbrough, H.W., West, J. and Vanhaverbeke, W. (2006). Open Innovation: Researching a New Paradigm. Oxford: Oxford University Press. Chin, W. W. (1998). The partial least squares approach to structural equation modeling. Modern methods for business research, 295(2), 295-336. Chin, W. W., & Newsted, P. R. (1999). Structural equation modeling analysis with small samples using partial least squares. Statistical strategies for small sample research, 1(1), 307-341. Cohen, J. (1988). Statistical power analysis for the behavioral sciences. Psychology Press. Cohen, W. M., & Levinthal, D. A. (1989). Innovation and learning: the two faces of R & D. The Economic Journal, 99(397), 569-596. Cohen, W.M. and Levinthal, D.A. (1990). Absorptive capacity: a new perspective on learning and innovation. Administrative Science Quarterly, 35(1), 128– 152. Cohen, W. M., & Levinthal, D. A. (1994). Fortune favors the prepared firm. Management Science, 40(2), 227-251. Cohen, W. M., Nelson, R. R., & Walsh, J. P. (2002). Links and impacts: the influence of public research on industrial R&D. Management science, 48(1), 1-23. Churchill Jr, G. A. (1979). A paradigm for developing better measures of marketing constructs. Journal of Marketing Research (JMR), 16(1).

24
Dahlander, L., & Gann, D. M. (2010). How open is innovation?. Research Policy, 39(6), 699-709. Day, G. S. (1994). The capabilities of market-driven organizations. Journal of marketing, 58(4). Denrell, J., Arvidsson, N., & Zander, U. (2004). Managing knowledge in the dark: An empirical study of the reliability of capability evaluations. Management science, 50(11), 1491-1503. D’Este, P., Iammarino, S., Savona, M., & von Tunzelmann, N. (2012). What hampers innovation? Revealed barriers versus deterring barriers. Research Policy, 41(2), 482-488. Dyer, J. H., & Singh, H. (1998). The relational view: cooperative strategy and sources of interorganizational competitive advantage. Academy of management review, 23(4), 660-679. Enkel, E., Gassmann, O., & Chesbrough, H. (2009). Open R&D and open innovation: exploring the phenomenon. R&d Management, 39(4), 311-316. European Commission, (2006a). Community Innovation Statistics. Oecd.org. Retrieved May 16, 2014, from http://www.oecd.org/science/inno/37489901.pdf European Commission, (2006b). The Community Innovation Survey 2006 Methodological recommendations. Statistik.at. Retreived May 16, 2014, from http://www.statistik.at/web_de/static/subdokumente/b_cis_bis_2004-06_eurostat_methodological_recommendations_cis_2006.pdf. Eurostat, (2014). Community Innovation Survey. eurostat.ec.europa.eu. Retrieved May 16, 2014, from http://epp.eurostat.ec.europa.eu/cache/ITY_SDDS/de/inn_esms.htm Fornell, C., & Bookstein, F. L. (1982). Two structural equation models: LISREL and PLS applied to consumer exit-voice theory. Journal of Marketing research, 440-452. Fornell, C., & Larcker, D. F. (1981). Evaluating structural equation models with unobservable variables and measurement error. Journal of Marketing Research (JMR), 18(1). Freeman, C., Soete, L., 1997. The Economics of Industrial Innovation, third ed. MIT Press, Cambridge. Frenkel, A. (2003). Barriers and Limitations in the Development of Industrial Innovation in the Region. European Planning Studies, 11(2), 115-137. Galia, F., & Legros, D. (2004). Complementarities between obstacles to innovation: evidence from France. Research policy, 33(8), 1185-1199. Gassmann, O., Enkel, E. and Chesbrough, H. (2010), The future of open innovation. R&D Management, 40: 213–221. Granstrand, O., Patel, P., & Pavitt, K. (1997). Multi-Technology Corporations: Why they have „distributed“ rather than „distinctive core“ competencies. California management review, 39(4). Hagedoorn, J. and Duysters, G. (2002). External sources of innovative capabilities: the preferences for strategic alliances or mergers and acquisitions. Journal of Management Studies, 39(2), 167–188. Hall, B. H. (2002). The financing of research and development. Oxford review of economic policy, 18(1), 35-51.

25
Hair, J. F., Ringle, C. M., & Sarstedt, M. (2011). PLS-SEM: Indeed a silver bullet. The Journal of Marketing Theory and Practice, 19(2), 139-152. Hausman, A. (2005). Innovativeness among small businesses: Theory and propositions for future research. Industrial Marketing Management, 34(8), 773-782. Henderson, R., & Cockburn, I. (1994). Measuring competence? Exploring firm effects in pharmaceutical research. Strategic management journal, 15(S1), 63-84. Henseler, J., Ringle, C. M., & Sinkovics, R. R. (2009). The use of partial least squares path modeling in international marketing. Advances in international marketing, 20(1), 277-319. Huizingh, E. K. (2011). Open innovation: State of the art and future perspectives. Technovation, 31(1), 2-9. Hulland, J. (1999). Use of partial least squares (PLS) in strategic management research: a review of four recent studies. Strategic management journal, 20(2), 195-204. Iammarino, S., Sanna-Randaccio, F., & Savona, M. (2009). The perception of obstacles to innovation. Foreign multinationals and domestic firms in Italy. Revue d'économie industrielle, (1), 75-104. Jansen, J. J., Van Den Bosch, F. A., & Volberda, H. W. (2005). Managing potential and realized absorptive capacity: how do organizational antecedents matter?. Academy of Management Journal, 48(6), 999-1015. Katz, R. & Allen, T. J. (1982). Investigating the Not Invented Here (NIH) syndrome: A look at the performance, tenure, and communication patterns of 50 R & D Project Groups. R&D Management, 12(1), 7-20. Kogut, B., & Zander, U. (1992). Knowledge of the firm, combinative capabilities, and the replication of technology. Organization science, 3(3), 383-397. Koschatzky, K. (2001). Networks in innovation research and innovation policy - an introduction. In Innovation Networks (pp. 3-23). Physica-Verlag HD. Kumar, V., Jones, E., Venkatesan, R., & Leone, R. P. (2011). Is market orientation a source of sustainable competitive advantage or simply the cost of competing?. Journal of Marketing, 75(1), 16-30. Lane, P. J., Koka, B. R., & Pathak, S. (2006). The reification of absorptive capacity: a critical review and rejuvenation of the construct. Academy of management review, 31(4), 833-863. Laursen, K., & Salter, A. (2006). Open for innovation: the role of openness in explaining innovation performance among UK manufacturing firms. Strategic management journal, 27(2), 131-150. Lessig, L. (1999). Code and other laws of cyberspace. Basic books. Lichtenthaler, U. (2008). Open innovation in practice: An analysis of strategic approaches to technology transactions. IEEE Transactions on Engineering Management, 55(1), 148–157. Mancusi, M. L., & Vezzulli, A. (2010, May). R&D, innovation and liquidity constraints. In CONCORD 2010 Conference, Sevilla, 3-4 March 2010.
26
Marino, K. E. (1996). Developing consensus on firm competencies and capabilities. The Academy of Management Executive, 10(3), 40-51. Mariti, P., & Smiley, R. H. (1983). Co-operative agreements and the organization of industry. The Journal of industrial economics, 437-451. Mitchell, W., Dussauge, P., & Garrette, B. (2002). Alliances with competitors: how to combine and protect key resources?. Creativity and innovation management, 11(3), 203-223. Mowery, D. C., Oxley, J. E., & Silverman, B. S. (1996). Strategic alliances and interfirm knowledge transfer. Strategic management journal, 17, 77-91. Nelson, R. R. (1982). The role of knowledge in R&D efficiency. The Quarterly Journal of Economics, 97(3), 453-470. Nickerson, J. A., & Zenger, T. R. (2004). A Knowledge-Based Theory of the Firm--The Problem-Solving Perspective. Organization Science, 15(6), 617-632. doi:10.1287/orsc.1040.0093 Noseleit, F., & de Faria, P. (2013). Complementarities of internal R&D and alliances with different partner types. Journal of Business Research, 66(10), 2000-2006. Nunnally, J. C. (1994). Bernstein: Psychometric theory, New York: McGraw-Hill OECD, (2005). Oslo Manual: Guideline for Collecting and Interpreting Innovation Data. Joint Publication of OECD and EUROSTAT, 3rd edition. Podsakoff, P. M., MacKenzie, S. B., Lee, J. Y., & Podsakoff, N. P. (2003). Common method biases in behavioral research: a critical review of the literature and recommended remedies. Journal of applied psychology, 88(5), 879. Powell, W. (1990). In BM Staw & LL Cummings (Eds.). Neither market nor hierarchy: network forms of organization. Research in organizational behavior, 12, 295-336. Quinn, J. B. (1985). Innovation and corporate strategy: Managed chaos. in Slater, S. F., & Narver, J. C. (2000). Intelligence generation and superior customer value. Journal of the Academy of Marketing Science, 28(1), 120-127. Rosenberg, N. 1994. Uncertainty and technological change. Conference on growth and development: The economics of the 21st century. Stanford, CA: Stanford University, Center for Economic Policy Research. Sampson, R. C. (2007). R&D alliances and firm performance: the impact of technological diversity and alliance organization on innovation. Academy of Management Journal, 50(2), 364-386. Savignac, F., 2006. The Impact of Financial Constraints on Innovation: Evidence from French Manufacturing Firms, Cahiers de la MSE 2006, 42, CNRS. Schumpeter, J. (1934). The theory of economic development Harvard University Press. Cambridge, MA. Shane, S., & Venkataraman, S. (2000). The promise of entrepreneurship as a field of research. Academy of management review, 25(1), 217-226.

27
Steensma, H. K., & Lyles, M. A. (2000). Explaining IJV survival in a transitional economy through social exchange and knowledge-based perspectives. Strategic Management Journal, 21(8), 831-851. Tenenhaus, M., Vinzi, V. E., Chatelin, Y. M., & Lauro, C. (2005). PLS path modeling. Computational statistics & data analysis, 48(1), 159-205. Tiwari, A.K., Mohnen, P., Palm, F.C., van der Loeff, S.S., (2007). Financial constraint and R&D investment: Evidence from CIS. United Nations University, Maastricht Economic and social Research and training centre on Innovation and Technology. Tourigny, D., & Le, C. D. (2004). Impediments to innovation faced by Canadian manufacturing firms. Economics of Innovation and New Technology, 13(3), 217-250. Uzzi, B. (1997). Social structure and competition in interfirm networks: The paradox of embeddedness. Administrative science quarterly, 35-67. Van De Vrande, V., Vanhaverbeke, W. and Gassmann, O. (2010). Broadening the scope of open innovation: past research, current state and future directions. International Journal of Technology Management, 52(3), 221-235. Van Wijk, R., Jansen, J. J., & Lyles, M. A. (2008). Inter- and Intra-Organizational Knowledge Transfer: A Meta-Analytic Review and Assessment of its Antecedents and Consequences. Journal of Management Studies, 45(4), 830-853. Vasudeva, G., & Anand, J. (2011). Unpacking absorptive capacity: A study of knowledge utilization from alliance portfolios. Academy of Management Journal, 54(3), 611-623. Von Hippel, E. (1986). Lead users: a source of novel product concepts. Management Science, 32(7), 791-805. Wetzels, M., Odekerken-Schröder, G., & Van Oppen, C. (2009). Using PLS Path Modeling for Assessing Hierarchical Construct Models: Guidelines and Empirical Illustration. Mis Quarterly, 33(1). Williamson, O. E. (1985). The economic intstitutions of capitalism. Simon and Schuster.