university of groningen gait control after stroke den ... · pdf filegait control after stroke...
TRANSCRIPT

University of Groningen
Gait control after strokeden Otter, Rob
IMPORTANT NOTE: You are advised to consult the publisher's version (publisher's PDF) if you wish to cite fromit. Please check the document version below.
Document VersionPublisher's PDF, also known as Version of record
Publication date:2005
Link to publication in University of Groningen/UMCG research database
Citation for published version (APA):Otter, A. R. D. (2005). Gait control after stroke: a neuromuscular approach to functional recovery s.n.
CopyrightOther than for strictly personal use, it is not permitted to download or to forward/distribute the text or part of it without the consent of theauthor(s) and/or copyright holder(s), unless the work is under an open content license (like Creative Commons).
Take-down policyIf you believe that this document breaches copyright please contact us providing details, and we will remove access to the work immediatelyand investigate your claim.
Downloaded from the University of Groningen/UMCG research database (Pure): http://www.rug.nl/research/portal. For technical reasons thenumber of authors shown on this cover page is limited to 10 maximum.
Download date: 25-05-2018
Gait control after stroke
Abnormalities in gait related muscle activity after stroke 60
Gait recovery is not associated with
changes in the temporal patterning of
muscle activity during treadmill walking
in patients with post stroke hemiparesis
Den Otter AR, Geurts ACH, Mulder Th, & Duysens J (in press)
Chapter 4
Gait control after stroke
Chapter 7 61
Abstract
The objective of this study was to establish whether functional recovery of gait in
patients with post-stroke hemiparesis coincides with changes in the temporal
patterning of lower extremity muscle activity and coactivity during treadmill walking.
Electromyographic (EMG) data from both legs, maximum walking speed, the amount
of swing phase asymmetry and clinical measures were obtained from a group of post-
acute patients with hemiparesis, as early as possible after admission in a rehabilitation
centre (mean time post stroke 35 days) and 1, 3, 6, and 10 weeks later, while all
patients participated in a regular rehabilitation program. EMG data from the first
assessment were compared to those obtained from a group of healthy controls to
identify abnormalities in the temporal patterning of muscle activity. Within subject
comparisons of patient data were made over time to investigate whether functional
gait recovery was accompanied by changes in the temporal patterns muscle (co-)
activity. EMG patterns during the first assessment showed a number of abnormalities
on the paretic side, namely abnormally long durations of activity in biceps femoris
(BF) during the single support (SS) phase and in gastrocnemius medialis (GM) during
the first double support phase (DS1). Furthermore, in both legs a prolongation of the
activity was seen in the rectus femoris (RF) during the SS phase. In addition, the
duration of BF-RF coactivation was longer on the paretic side than it was in controls.
Over time, the level of ambulatory independence, body mobility, and maximum
walking speed increased significantly, indicating that substantial improvements in gait
ability occurred. Despite these improvements, durations of muscle (co-) activity and
the level of swing phase asymmetry did not change during rehabilitation. More
specifically, timing abnormalities in muscle (co-)activity that were found during the
first assessment did not change significantly, indicating that these aberrations were not
an impediment for functional gait improvements.
The main conclusion is that normalization of the temporal patterning of gait related
muscle activity in the lower extremities is not a prerequisite for functional recovery of
gait in patients with post stroke hemiparesis. Apparently, physiological processes other
than improved temporal muscular coordination must be important determinants of
the restoration of ambulatory capacity after stroke.

Gait control after stroke
Neuromuscular patterning during gait recovery 62
Introduction
During human walking, the muscle activity of the lower extremities needs to be
well coordinated to provide support, dynamic balance, propulsion, and foot
clearance. These gait tasks are temporally coupled to particular phases of the gait
cycle and, as a result, the timing of lower extremity muscle activity during healthy
human walking follows characteristic patterns. After unilateral supratentorial stroke,
the neuromuscular control of walking may undergo radical changes which include
muscle weakness on the body side contralateral to the lesion, and often dramatic
changes in the temporal organisation of muscle activity. Several electromyographic
(EMG) studies have been conducted to obtain information on the patterning of
lower extremity muscle activity in hemiparetic gait. Despite large interindividual
differences among patients, some common timing abnormalities in muscle activity
patterns have been reported. Among these deviations are the premature activity of
the paretic calf muscles during the terminal swing and initial stance phase (Perry et
al. 1978; Lamontagne et al. 2001; Burridge et al. 2001), the prolonged stance activity
of hamstrings and quadriceps muscles on both the paretic (Hirschberg and
Nathanson, 1952; Peat et al., 1976; Knutson and Richards, 1979; Shiavi et al., 1987)
and the nonparetic side (Wortis et al., 1951; Shiavi et al., 1987), and the absence of
activity in the paretic ankle dorsiflexors during the late swing and early stance phase
(Burridge et al., 2001; Perry, 1993). These abnormalities in the patterning of lower
extremity muscle activity determine, to a substantial degree, the quality and the
functional limitations of the hemiparetic gait pattern. Therefore, the development
of effective treatment strategies for gait impairments following stroke requires
insight into these neuromuscular timing abnormalities, how they change over the
course of gait recovery, and how they can be modified.
Although alterations in the timing control of gait related muscle activity may
impair gait ability, and therefore forms a potential target for gait rehabilitation,
there is as yet little evidence available to show that gait recovery is indeed associated
with changes in muscle activation patterns during walking. To provide an empirical
basis for the development of gait training strategies, it is necessary to understand
which aspects of muscle control remain stable over the course of gait recovery, and
what aspects are susceptible to change. For this purpose, it does not suffice to
focus solely on the identification of abnormalities in muscle control using cross-
sectional measurements. It is also necessary to explore the changes on such
aberrations in a longitudinal study, where repeated measurements are made in the
same patients over the course of gait recovery. To our knowledge, only one EMG
Gait control after stroke
Chapter 4 63
study has been conducted that has addressed changes in muscle activity over the
course of recovery in patients with stroke. Shiavi and co-workers (1987) classified
12 patients according to the type of muscle synergy apparent in the EMG patterns
(cf. Knutson and Richards, 1979), and found that synergy patterns changed over a
period of approximately 1 year. However, identification of synergy patterns and
changes over time was made on the basis of visual inspection of the ensemble
averaged EMG patterns. Furthermore, because walking speed affects the amplitude
of muscle activity, and also the timing of activity of specific muscle groups (Hof et
al., 2002; den Otter et al., 2004), it is not clear whether differences in gait speed
between both assessments may have affected the results. A clearer view of recovery
related changes in muscle activity after stroke may arise when the identification of
abnormality and change is based on objective statistical criteria, and when the
influences of walking speed are ruled out.
Hence, the primary goal of the present study was to study changes in the
temporal structure of lower extremity muscle activity during the recovery of gait
ability in hemiparetic stroke patients, using objective statistical criteria and
controlling for walking speed. In addition to the analysis of the temporal patterning
of individual muscles, this study focuses on the assessment of patterns of
coactivity between antagonistic muscle pairs. Investigation of coactivation may
provide valuable information on neuromuscular coordination in hemiparetic gait,
because altered coactivation levels may be indicative of pathological muscle
synergies (Knutsson and Richards, 1979; Shiavi et al, 1987), or compensatory
coordinative strategies which may be different for the paretic and the nonparetic
side ( Lamontagne et al., 2000). Because gait recovery may be associated with the
development of more selective muscle control or with the emergence of
compensatory coactivation strategies, a secondary goal was to study the evolution
of muscle coactivity in patients with hemiparetic stroke during their regular, post-
acute rehabilitation.
Methods
Subjects
A convenience sample of 14 rehabilitation inpatients with stroke, who were
consecutively selected based on inclusion and exclusion criteria and their
willingness to cooperate, participated in this study (8 females, 6 males). The mean
age in this group was 54.7 yrs (sd=9.9; range 39 – 71 yrs). The mean time since
stroke onset at the time of inclusion was 35 days (sd= 7.69), and ranged from 23 to
Gait control after stroke
Neuromuscular patterning during gait recovery 64
52 days. All patients suffered an ischemic stroke; five of the patients had suffered a
infarction in their left hemisphere , whereas 9 patients had suffered an infarction in
their right hemisphere; To be included, patients were required to (1)-. have suffered
a first-ever supratentorial stroke (due to either haemorrhage or infarction), (2)-.
have been admitted to the rehabilitation centre with an aim of restoring
independent gait, and (3)-. have a Functional Ambulation Categories score of at
least 2 (Patient needs continuous or intermittent support of one person to help
with balance or coordination) or at the most 4 (Patient can walk independently on
level ground, but requires help on stairs, slopes or uneven surfaces). Exclusion
criteria were: (1) severe forms of aphasia or other cognitive problems that could
hinder communication or cooperation (2). severe affective or psychiatric
impairments; (3) visuospatial neglect, as indicated by abnormal scores on two or
more of the following tests: the line bisection test (Schenkenberg et al. 1980), the
letter cancellation task (Diller et al. 1974), the Bells test (Gauthier et al., 1989), and
the clock drawing test (Wilson et al., 1987); and (4) a history of orthopaedic or
neurological (other than stroke) disorders.
All patients underwent a clinical examination by an experienced physician,
providing data for lower limb motor selectivity, sensation modalities, and trunk
control (cf. de Haart et al., 2004). Lower limb motor selectivity was scored
according to the six motor stages as defined by Brunnstrom (1966). At the time of
inclusion, the Brunnstrom scores in the patient group ranged from 3 (increased
muscle tone with active movements mainly in rigid extension synergy) to 5 (muscle
tone normalization with some degree of selective muscle control). The lower limb
sensation modalities were assessed by testing position sense at the affected ankle
joint in 3 different positions of dorsi- and plantarflexor by mirroring with the
nonparetic ankle. In this test, the patient was supine, and the paretic leg was slightly
lifted by the physician. A score was recorded as 'impaired' if the patient had a
mirroring error greater than 1. In the group of 14 patients, 6 patients had impaired
sensation modalities at the time of inclusion. The patient's trunk control score was
determined by the sitting balance item of the Trunk Control Test (Wade, 1992).
Control was rated as 'impaired' if the patient was unable to stay up sitting on the
edge of a bed, feet off the ground, for 30 seconds. At the time of inclusion, 11 of
the 14 patients that participated in this study had impaired trunk control (see table 1
for individual patient characteristics).
All patients received between 5 and 7 sessions of physiotherapy per week.,
with an approximated duration of 30 minutes per session. In addition, all patients

Gait control after stroke
Chapter 4 65
received three 30 minute sessions of occupational therapy per week. These
individual therapies were augmented by small-group therapy for improving gross
motor skills. The group therapy occupied at least 60 minutes of each working day.
This motor rehabilitation was embedded in a more extensive, individualized
neurodevelopmental oriented rehabilitation program, in which much emphasis was
put on optimal use of the paretic body side.
Gait data of the patient group were compared with data obtained from 14
healthy controls. The control group consisted of 8 females and 6 males, with a
mean age of 42.8 years (sd=12.3). All control subjects did not suffer from any
neurological or orthopaedic disorder. All participants gave their written informed
consent before study entry. The study was approved by the regional medical-ethical
committee Arnhem-Nijmegen.
Procedure
Patients were assessed on 5 occasions during their rehabilitation process. The first
assessment took place as early as possible after admission. Subsequent assessments
took place 1, 3, 6, and 10 weeks after the first assessment. At each assessment,
scores were obtained for the Rivermead Mobility Index (RMI) (Collen et al. 1991)
and for the level of ambulatory independence using the Functional Ambulation
Categories (FAC) (Holden et al., 1984). In addition, the maximum walking speed
on a treadmill that could be maintained for 40 seconds was registered. Finally, at
each assessment, spatiotemporal gait parameters and electromyographic data were
obtained using instrumented gait analysis. All clinical tests were performed by the
primary investigators (RdO) or the patient's therapist, but the evaluator was the
same throughout the assessment, for each patient. All gait assessments were
performed by the primary investigator, assisted by one physiotherapist.
During gait analysis, subjects walked on a motor-driven treadmill (walking
surface 200 x 70 cm), for 40 seconds. During the first gait assessment, patients were
encouraged to walk at the maximum treadmill speed they could maintain for a
period of 40 seconds. During subsequent gait analyses (assessments 2 to 5), patients
were tested at the same speed in order to allow valid comparisons. Subsequently,
the treadmill speed was increased until the maximum speed was reached that could
be maintained for 40 seconds. This speed served as an indication of the level of
ambulatory skill at the time of the assessment. In the control group, half of the
subjects walked at a treadmill speed of 0.28 ms-1, and the other half walked at 0.56
ms-1, so that the mean gait speed in the control group (0.42 ms-1) matches the mean
Gait control after stroke
Neuromuscular patterning during gait recovery 66
gait speed in the patient group (0.37 ms-1) rather well. It is quite unlikely that this
minor difference in the mean gait speed between the two groups is a main
confounder in this study, especially in the light of other literature showing that
substantial differences (> 0.56 ms-1) in gait speed are required to induce differences
in timing characteristics in EMG (e.g. Hof et. al, 2002; den Otter et al., 2004).
When, at a particular assessment, a patient was still unable to walk independently
on the treadmill, this subject was allowed to receive occasional manual assistance by
one physiotherapist to maintain balance. Also, in case of sudden disturbances of
postural balance patients were allowed to grasp a rail in front of them. This was
done in order to enhance safety and to reduce the potential effects of fear which
may result in enhanced co-activation levels, (Maki, 1991; Adkin et al., 2000).
However, sustained contact with the rail was not tolerated. All patients wore a
harness to enhance safety, but no body weight support was supplied.
Data recording
EMG recordings were made using disposable surface electrodes (MediTrace ECG
1801 Pellet, (Ag/ AgCl)) with a 10-12 mm diameter and an interelectrode distance
of 24 mm (Graphics Controls, Buffalo NY, USA). Four lower extremity muscles
were recorded from both legs: biceps femoris (BF), rectus femoris (RF),
gastrocnemius medialis (MG), and tibialis anterior (TA). Electrode placement was
based on SENIAM recommendations (Freriks et al. 1999), according to which the
sensors were placed relative to specified anatomical landmarks. These specifications
enabled us to place the electrodes on identical skin locations throughout the series
of assessments. The EMG signals were checked for crosstalk by performing
standard muscle tests in a seated position.
The incoming electromyographic signals were fed to a K-lab SPA 20/8 pre-
amplifier with a common mode rejection ratio > 95 db and a noise level of < 1 µV
rms. Subsequently, signals were high pass filtered using a third order Butterworth
filter (- 3db point at 20 Hz), and low pass filtered by means of a second order
Butterworth filter (- 3db point at 500 Hz). The EMG signals were digitised at 2400
Hz and stored on a computer hard disk for offline processing. Light reflective
markers were attached to the heel of each foot, and 3-D displacements were
recorded by 5 infrared cameras (PRIMAS). These signals were then digitized at
100 Hz.
Gait control after stroke
Chapter 4 67
Data analysis
In order to determine the relative duration of muscle activity for different phases of
the gait cycle, EMG signals were dichotomized into periods of activity and in-
activity. During offline processing, EMG data were first high pass filtered at 10 Hz
(to attenuate movement artifacts), and full wave rectified and then low pass filtered
at 25 Hz. Next, all individual datapoints in the EMG linear envelopes were
partitioned into subsets of data using a k-means clustering algorithm. The goal of
k-means clustering is to find similarities between data points and to group these
data points according to their similarities (Mac Queen, 1967). By definition, periods
of muscle inactivity in the rectified and low pass filtered signal form a relatively
homogeneous subset of data, so that signals can be dichotomized by assuming that
data belonging to the cluster with the lowest mean value correspond with periods
of muscle inactivity, and data belonging to other clusters to periods of muscle
activity. For the data analyzed in this study, the number of clusters was set, a priori,
to 5. The method described here allows for detection of short, transient bursts of
muscle activity, and does not require the setting of a priori thresholds.
In order to assess the reliability of the results obtained from this detection
method, EMG data (BF, RF, TA, and GM of the right leg) were collected during
two separate trials in a group of 9 healthy young adults (five females, four males;
mean (S.D.) age 22.4 (2.35) years; height 1.81 (6.7) m; body mass 66.6 (7.84) kg)
during 40 seconds of treadmill walking at a speed of 0.83ms-1. For each individual
subject the difference in the duration of detected activity for DS1, SS, DS2, and SW
were calculated between both trials, and subsequently the median difference over
the group was calculated. In addition, Spearman’s correlation coefficient was
calculated for the group. The results are shown in table 2. The median percentage
difference between the two trials ranged from 1.2 % (BF during DS1) to 9.2% (BF
during DS2), indicating that the duration of activity was detected with good
reproducibility between trials. For the group, the correlation coefficients were
generally good to very good, ranging from 0.65 (BF during SS) to 1.00 (BF during
DS1).
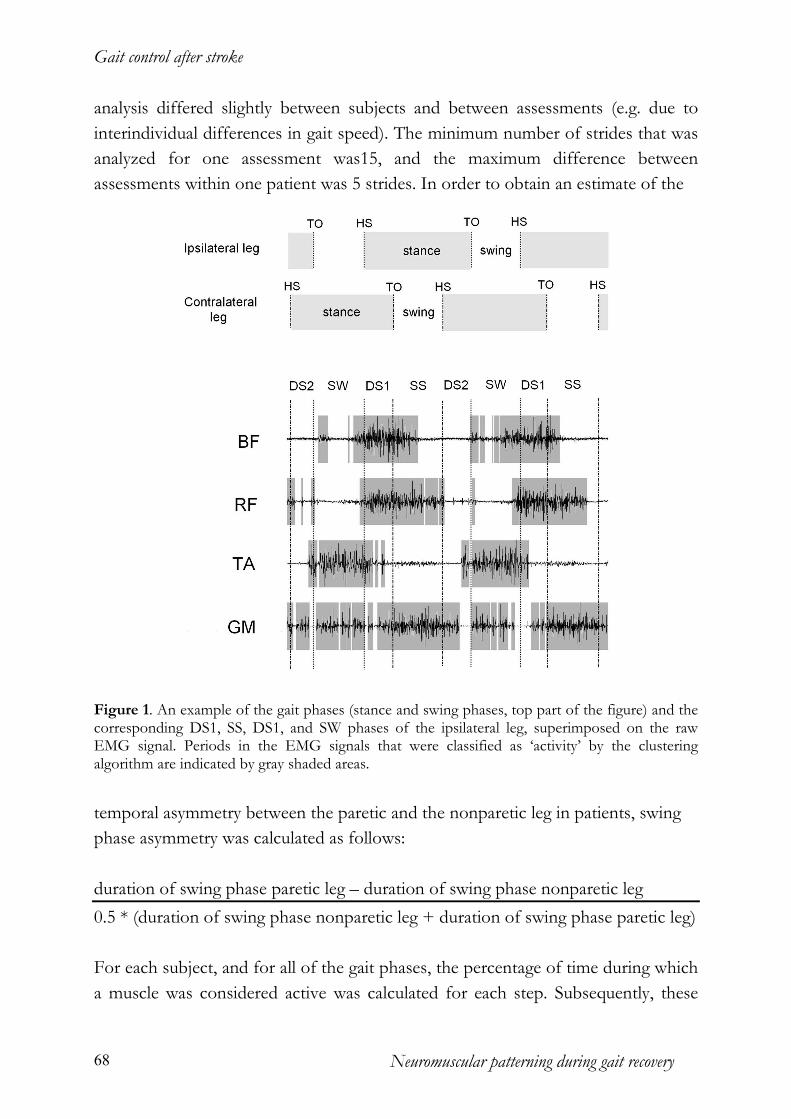
Speed distribution analysis of the heel marker data (Peham et al., 1999) was
used to determine heel strike and toe off for both legs. Based on this information,
the swing phase, the first and second double support phase, and the single support
phase, were determined for each leg (for an explanation of these gait phases, and an
example of the EMG data with the phases of muscle activity detected by the
clustering algorithm, see figure 1). The number of strides that were used for
Gait control after stroke
Neuromuscular patterning during gait recovery 68
analysis differed slightly between subjects and between assessments (e.g. due to
interindividual differences in gait speed). The minimum number of strides that was
analyzed for one assessment was15, and the maximum difference between
assessments within one patient was 5 strides. In order to obtain an estimate of the
Figure 1. An example of the gait phases (stance and swing phases, top part of the figure) and the corresponding DS1, SS, DS1, and SW phases of the ipsilateral leg, superimposed on the raw EMG signal. Periods in the EMG signals that were classified as ‘activity’ by the clustering algorithm are indicated by gray shaded areas.
temporal asymmetry between the paretic and the nonparetic leg in patients, swing
phase asymmetry was calculated as follows:
duration of swing phase paretic leg – duration of swing phase nonparetic leg
0.5 * (duration of swing phase nonparetic leg + duration of swing phase paretic leg)
For each subject, and for all of the gait phases, the percentage of time during which
a muscle was considered active was calculated for each step. Subsequently, these

Gait control after stroke
Chapter 4 69
percentages were averaged over all gait cycles, for each subject. Based on the
dichotomised signals, the relative amount of time that two muscles were
simultaneously active was calculated to obtain an estimate of the duration of
coactivation between these muscles. This way, the relative duration of coactivation
was calculated between BF and RF, and between TA and GM, for both legs. All
offline analyses of EMG signals and marker data were done using custom software
made in Matlab.
Statistical analysis
In order to identify abnormalities in the EMG patterns of the patients, the
durations of muscle activity and coactivity obtained on the first gait assessment
were compared to data obtained from the control group. A Wilcoxon rank-sum
ranks test was performed to test for differences between patients and controls.
Within the patient group, time related changes in RMI scores, FAC scores,
maximum walking speed, swing phase asymmetry and relative durations of muscle
activity and coactivity (within subjects factor TIME) were tested non-parametrically
with the Friedman test. In the case of a significant overall TIME effect, post hoc
analysis was performed to test for differences between particular assessments, using
a Wilcoxon matched pairs – signed ranks test. In this case, Bonferoni corrections
were made to maintain the familywise alpha level at .05.
Results
Subjects
All of the 14 patients were able to participate in at least 4 of the 5 assessments.
Four patients were unable to participate in the 5th and final assessment because they
were unwilling to return to the clinic after discharge. In addition, for 1 subject, gait
data of the final assessment were lost due to computer failure. In order to utilize as
much of the collected data as possible, and because data from the 5th assessment
may provide information on possible changes in EMG patterns that occur later
during recovery (> 6weeks), the data of the 4th and the 5th assessment were
averaged when data were available for all 5 assessments. In this way, clinical,
spatiotemporal, and electromyographic data could be compared between 4
moments in time, for all 14 patients. Data from the 5th assessment were included
because they may provide information on possible changes in EMG patterns later
during recovery (> 6weeks).
The mean time post stroke at the first assessment was 35 days (sd=7.7), 44

Gait control after stroke
Neuromuscular patterning during gait recovery 70
days (sd=7.0) at the second assessment, 60 days (sd=8.01) at the third assessment,
and 90 days (sd=9.4) at the fourth assessment.
Figure 2. Means and SDs of the patient group for the Rivermead Mobility Index (top left panel), the Functional Ambulation Categories (top right panel), asymmetry of swing-phase duration (bottom left panel), and maximum walking speed (bottom right panel) at all 4 assessments. (* = statistically significant at p < .05)
Clinical measures of mobility and ambulatory independence
The mean and standard deviations of the RMI scores at all 4 assessments are
depicted in the top left panel of figure 2. The RMI scores showed that the general
mobility of patients increased significantly over time (Chi2 (df=3)= 11.85; p<.05).
Post hoc comparisons between the different assessments revealed that significant
changes in RMI occurred between assessments 1 and 3 (Z=-2.30; p<.05), between
assessments 1 and 4 (Z=-2.23; p<.05), and between assessments 2 and 4 (Z=-1.98;
p<.05).
The mean FAC scores (+sd’s) are presented in the top right panel of figure
2, top right panel). The observed increases in ambulatory independence resulted in
a statistically significant time effect (Chi2 (df=3)=11.97; p<.05). Post hoc analysis
showed that FAC scores were significantly different between assessments 1 and 3
Gait control after stroke
Chapter 4 71
(Z=-2.00; p<.05), and that the scores at assessments 1 (mean=2.64; sd=0.93), 2
(mean=2.93; sd=0.92) and 3 (mean=3.29; sd=0.91) were all significantly different
from the FAC scores at assessment 4 (mean=3.64, sd=1.01; p<.05).
Spatiotemporal measures
The mean maximum walking speeds on the treadmill at all 4 assessments are
depicted in the bottom right panel of figure 2, and show a clear increase over time
(Chi2=41.19; p<.001). The mean walking speed for the patient group at the first
assessment was 0.37 ms-1 (sd=.31), and ranged from 0.11 to 1.06 ms-1. At the last
assessment, the mean maximum walking speed was 0.87 ms-1 (sd=0.41), with
individual speeds ranging from .28 to 1.44 ms-1.
At all 4 assessments, positive but relatively low degrees of swing-phase
asymmetry were found, indicating that the mean duration was longer on the paretic
side than on the nonparetic side. Statistical testing failed to show a time effect,
indicating that the asymmetry in swing phase duration was stable over the course of
time (Chi2(df=3)=1.06; n.s.).
Temporal characteristics of muscle activity at the first assessment
Figure 3 shows the mean percentage of the duration of activity at the first
assessment, for each muscle, and for each subphase of the gait cycle. In the BF of
the paretic leg, an increased duration of muscle activity was found during the SS
phase (73 %, sd=28%), when compared to controls (48%, sd=18%; Z=-2.67;
p<.05).
The mean relative duration of BF activity during the SS phase in the nonparetic leg
was also increased compared to controls (62.%, sd=23%), but this result did not
reach significance (Z=-1.84; P=.069). As was the case for BF, the percentage of RF
activity during the SS phase was higher in patients than in controls (58.%;
sd=33%), in the paretic (81%, sd=29%; Z=-2.76,p<.05) as well as in the nonparetic
leg (72.%, sd=31%. Z=-2.10, p<.05).
There were no statistically significant differences in TA activity between controls
and patients for any of the four gait phases, neither in the paretic nor in the
nonparetic leg. With respect to the paretic GM, the mean duration of activity
during the DS1 phase was 58% (sd=22%), which was significantly longer than in
controls (40%; sd=23%; Z=-2.068, p<.05)), indicating that in the paretic leg, GM
activity started earlier. A similar difference could not be observed in the nonparetic

Gait control after stroke
Neuromuscular patterning during gait recovery 72
Figure 3. Boxplots (containing the median value, the minimum and maximum value, and values for the first and third quartile) of the percentage of the gait cycle phase during which a muscle was active at the first assessment in patients and in control subjects; (DS1 = first double support phase, SS = single support phase, DS2 = second double support phase, SW = swing phase; BF = Biceps femoris, RF = Rectus femoris, TA = Tibialis anterior, GM = Gastrocnemius medialis). The mean walking speed in the control group was 0.42 ms-1
Figure 4. Boxplots (containing the median value, the minimum and maximum value, and values for the first and third quartile) of the percentage of the gait cycle phase during which two muscles were simultaneously active at the first assessment in patients and in control subjects (DS1 =first double support phase; SS= single support phase; DS2= second double support phase; SW=swing phase); (BF-RF= Biceps femoris – Rectus femoris; TA-GM= Tibialis anterior – Gastrocnemius medialis). The mean walking speed in the control group was 0.42 ms-1
Gait control after stroke
Chapter 4 73
leg where GM activity showed an average duration of 27% (sd=26%) of the DS1
phase.
Relative timing of muscle activity: coactivation patterns
The relative durations of muscle coactivity during hemiparetic walking at the first
assessment are depicted in figure 4. The amount of BF-RF coactivity during the SS
phase was substantially higher in the paretic leg of the patients (63.%, sd=34%)
than in the control group (31%, sd=21%) (Z=-2.34, p<.05). In the patients, as well
as in the control subjects, the overall levels of TA-GM coactivity were generally low
in both legs for all subphases of the gait cycle. There were no statistically significant
differences between the two groups.
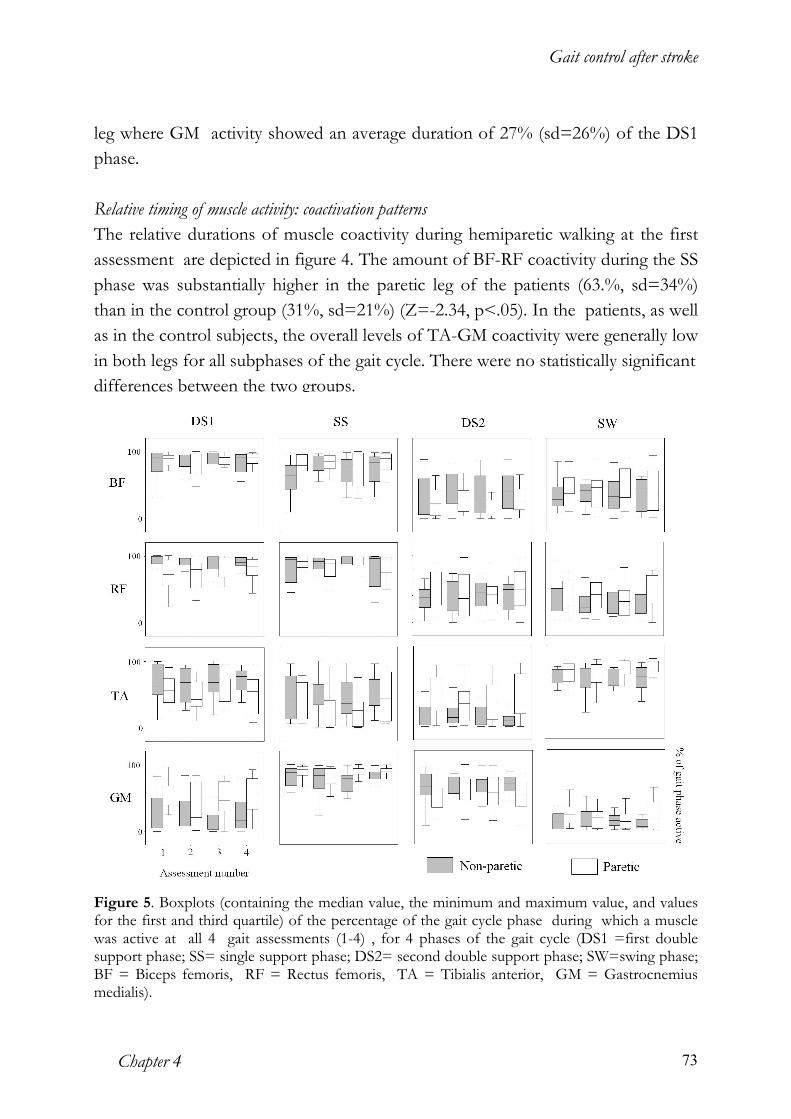
Figure 5. Boxplots (containing the median value, the minimum and maximum value, and values for the first and third quartile) of the percentage of the gait cycle phase during which a muscle was active at all 4 gait assessments (1-4) , for 4 phases of the gait cycle (DS1 =first double support phase; SS= single support phase; DS2= second double support phase; SW=swing phase; BF = Biceps femoris, RF = Rectus femoris, TA = Tibialis anterior, GM = Gastrocnemius medialis).

Gait control after stroke
Neuromuscular patterning during gait recovery 74
Patterns of muscle (co)activity during the course of gait recovery
Figure 5 shows the means and sd’s of the relative durations of the activity of the
BF, RF, TA and GM muscles in both the paretic and nonparetic leg at each of the 4
assessments, separately. For both legs, no statistically significant changes in the
relative duration of activity were found for any of the 4 muscles, in any of the 4 gait
phases that were studied.
The mean durations of agonist-antagonist coactivation in each of the 4 gait
phases at all 4 assessments are depicted in figure 6. In the paretic as well as in the
nonparetic leg, the durations of BF-RF and TA-GM coactivation did not change
over time for any of the 4 gait phases. These results suggest that no systematic
changes occurred in the duration of (co)activation between BF and RF, or between
TA and GM, despite substantial improvements in the ambulatory status of the
patient group.
Figure 6. Boxplots (containing the median value, the minimum and maximum value, and values for the first and third quartile) of the percentage of the gait cycle phase during which two muscles were simultaneously active at all 4 gait assessments (1-4), for 4 phases of the gait cycle (DS1 =first double support phase; SS= single support phase; DS2= second double support phase; SW=swing phase; BF-RF= Biceps femoris – Rectus femoris; TA-GM= Tibialis anterior – Gastrocnemius medialis).
Discussion
Asymmetry in swing phase duration
Over the course of time, patients did not show improvements in the temporal
asymmetry of the stepping pattern. Although the restoration of symmetry is one of
the key objectives in the gait re-education of hemiparetic patients (e.g. Davies,

Gait control after stroke
Chapter 4 75
1985), as of yet, empirical data have not been able to provide unequivocal evidence
for the assumption that promotion of symmetry actually leads to increased gait
ability. Although some association between temporal symmetry and overall gait
ability may exist (Brandstater et al. 1983), proof of a causal relationship between
these two variables has not been established yet. The present results indicate that
functional gait improvements may occur independent of temporal symmetrization,
confirming results from studies by Hesse et al. (1993) .
The apparent independence of gait recovery and symmetrization can be
understood by regarding symmetry as an emergent property of gait patterns
resulting from biomechanical and neurophysiological constraints, and locomotor
task demands. Following unilateral paresis, the temporal layout of the gait cycle
may be optimised differently to accommodate the altered biomechanical and
neurophysiological characteristics of the patient, which may result in different (i.e.
asymmetrical) motor solutions (cf. Latash and Anson, 1996).
Temporal patterning of muscle (co)activity in the upper leg
Prolongation of hamstrings and quadriceps activity of the paretic leg represents a
relatively common aberration in the temporal patterning of muscle activity in
hemiparetic gait, in the paretic leg (Hirschberg and Nathanson, 1952; Peat et al.,
1976; Knutson and Richards, 1979; Shiavi et al., 1987) as well as in the non-paretic
leg. (Wortis et al., 1951; Shiavi et al., 1987). It has been argued that the massive
coactivation of muscles during the stance phase of the paretic leg may be part of a
primitive extensor synergy associated with the defective central control of lower
extremity muscle activity following stroke (Brunnstrom, 1970; Perry, 1993).
However, similar patterns of synergistic activity in the upper leg have been found in
the gait of toddlers (Okamoto et al., 2003), patients with diabetic neuropathy
(Kwon et al, 2003), and in patients with spinal cord injury (Leroux et al, 1999),
suggesting that this abnormality represents a compensatory neuromuscular strategy
rather than a primary disorder in the temporal regulation of muscle activity. During
the stance phase, the BF serves primarily as a hip extensor, whereas the main
function of RF during this phase is to extend the knee (Winter, 1987). Concomitant
action of these muscles during the SS phase may increase the stiffness of the knee
and hip joint, when the leg rotates over the foot while supporting full body weight.
The compensatory coactivation of quadriceps and hamstrings muscles may be
related primarily to weakness of the calf muscles, since the ankle plantarflexors
have been found to supply the largest contribution to support during the SS phase
Gait control after stroke
Neuromuscular patterning during gait recovery 76
of normal gait (Kepple et al., 1997). Alternatively, increased BF- RF coactivity may
be used to hold the head-arm-trunk segment against gravitational forces in case of
forward postural lean (Olney and Richards, 1996).
Despite clear improvements in gait ability, the abnormal patterns of BF and
RF (co-) activity that were found during the first assessment did not change towards
normal. Interestingly, recent findings by Grasso et al. (2004) in spinal cord injured
persons, show that restoration of the ability to step was associated with the
development of prolonged BF and RF activity during the stance phase. Together
with the present data, these results suggest that prolonged quadriceps and hamstring
(co-) activation during stance does not form an impediment to gait recovery, but
instead may reflect a rather immediate compensatory mechanism that is part of the
recovery related reorganization of gait related muscle activity in neurologically
impaired persons.
Temporal patterning of muscle (co)activity in the lower leg
The premature activity of the paretic GM that was found during the DS1 phase
represents another characteristic timing abnormality in hemiparetic gait that has
been reported by several other authors (Perry et al, 1978; Knutson and Richards,
1979; Hesse et al., 1996). Although the premature activity of calf muscles is
generally associated with the presence of overactive stretch reflexes during gait, the
functional implications of this hypersensitivity are still a point of debate. Several
authors have questioned the contribution of spasticity to gait impairments (Berger
et al., 1984; Vattanasilp et al., 2000; Ada et al., 1998; Dietz, 2003), challenging the
clinical routine of reflex inhibition in mobility training after stroke. In line with this,
the present data do not provide evidence that reductions in premature calf muscle
activity are a prerequisite for functional gait recovery in post stroke hemiparesis.
Despite substantial improvements in gait ability, the mean duration of paretic GM
activity during DS1 did not change significantly over time.
General discussion
Two important questions arising from the present study is how functional
improvements are possible within abnormal neuromuscular timing patterns, and
why these patterns remain stable over the course of recovery. The finding that gait
ability tended towards normal by using abnormal muscular timing patterns are in
line with recent findings by Grasso et al (2004) in clinically complete spinal cord
injured persons. They found that the stepping patterns learned during step training

Gait control after stroke
Chapter 4 77
were kinematic equivalents of those found in healthy subjects, despite clear
differences in the patterning of leg muscle activity. Some aspects of the abnormal
timing patterns found in our study (e.g. the prolonged activity of quadriceps and
hamstring muscles) may be the result of a process in which neuromuscular control
is optimized differently in order to obtain the best possible locomotor output in the
light of impaired locomotor functioning. The present data further suggest that
these optimizations may include increased coactivation levels between agonist-
antagonist pairs, confirming earlier work by Lamontagne et al (2000) showing that
coactivation regulation of ankle plantarflexors and dorsiflexors may be used as an
adaptive mechanism in the lower leg. The present results provide a further clue that
synergistic activity of muscle pairs may promote rather than impede gait
performance, despite the clinical emphasis often put on the promotion of selective
muscle action (Davies, 1985).
How can we account for the stability of muscle activity patterns over the
course of functional gait recovery? Previous work on the muscular control of
walking indicates that, within gross muscular timing patterns, local variations in
force output (i.e. EMG amplitude) allow for sufficient flexibility to accommodate
changes in e.g. speed or leg loading. For instance, it has been shown that for many
muscles in the leg, substantial changes in gait speed can be realized by imposing
phase specific adjustments in the amplitude of muscle output upon relatively
invariant timing patterns (Hof et al., 2002; den Otter et al., 2004). Similarly, data are
available that suggest that the amount of leg loading during walking can be
decreased to a substantial degree (appr. 50%) without affecting the phasing of
muscle activity despite clear changes in its amplitude (Ivanenko et al., 2002). The
reason for this apparent robustness of neuromuscular timing characteristics in the
context of varying task demands may be that timing and amplitude of EMG bursts
during locomotion are possibly controlled differently. Whereas timing is mostly
determined by central pattern generators, the amplitude depends largely on reflex
loops (van de Crommert et al., 1998; Duysens et al., 2000; Dietz and Duysens,
2000).
Limitations of the study
A number of possible limitations must be taken into account with regard to the
present results. It must be noted that the present findings do not rule out that other
changes in neuromuscular control of the lower limbs may have occurred during gait
recovery. The recovery related changes in the walking speed of patients suggest that
Gait control after stroke
Neuromuscular patterning during gait recovery 78
increasingly higher levels of muscular force output became available during
recovery. Indeed, inspection of the EMG profiles recorded at these different
speeds show the modulation of amplitude normally associated with speed increases
(Hof et al., 2002; den Otter et al., 2004). Therefore, it may be argued that the
recovery related changes in lower extremity muscle activity are primarily related to
the potential force output of muscles, and that such increases in strength may be
expressed as changes in the amplitude of muscle activity within relatively stable
timing schemes. However, multi-session comparisons of EMG amplitude are
difficult because of possible variations in electrode placement, properties of the
skin tissue, and environmental conditions.
A clear limitation to this study is that the recording of EMG was restricted
to 4 leg muscles that are primarily involved in gait control in the sagittal plane.
Therefore, it cannot be ruled out that changes in the timing of activity occurred in
other (e.g. trunk) muscle groups. Also, because the assessments period covered a
period of approximately 60 days in the post-acute phase of stroke, it remains
unclear whether changes in the patterning of muscle activity as measured by surface
EMG might have occurred in the very early phases of recovery, or whether long
term changes in patterning would have occurred.
Because this study was conducted on a treadmill, generalisation to
overground walking is not straightforward. Previous studies have shown that the
maximum gait speed of hemiparetic subjects on the treadmill is significantly slower
and more symmetric than on a walkway (Hesse et al., 1999) and that spatiotemporal
aspects of gait can be reproduced with a greater stride to stride consistency (Harris-
Love, 2001). Despite these differences, there is as yet no clear evidence to show
that treadmill walking affects the temporal structure of gait related muscle activity,
suggesting that the present results may also be valid for overground walking. A
similar point can be made with regard to the gait speeds used in this study. Because
the maximum gait speed obtained during the first assessment was kept constant
over all assessments, the question can be raised whether the present results allow
generalization to other gait speeds. This is particularly true since the maximal
obtainable gait speed of patients changed over the course of recovery. However, a
longitudinal study on EMG patterns in which the maximal gait speed is used for
each evaluation would be strongly confounded by gait speed.
The control group was 12 years younger than the patients so that the
interpretation of the detected abnormalities is not entirely straightforward.
Although little is known about the effects of age on the temporal characteristics of

Gait control after stroke
Chapter 4 79
muscle activity patterns, the altered coordinative strategies associated with gait in
the elderly (DeVita and Hortobagyi, 2000) may result in changed temporal control
of gait related muscle activity. However, because the age difference between control
subjects and patients in the present study is relatively small we believe that the
detected abnormalities in the data of the first assessment do not represent an age
effect.
In this study, patients were allowed to hold on to a rail in case of sudden postural
disturbances. It is well known that light touch of the fingertips with static objects (a
so called ‘haptic cue’) simplifies postural control during quiet standing and walking
(e.g. Jeka and Lackner, 1994). In principle, systematic changes in the frequency of
handrail use may have biased our estimates of muscle (co-) activity over time.
However, because the handrail was used very incidentally, and because the
frequency of handrail use did not change systematically over time, we do not
believe that this invalidates the present results.
Conclusion
The results of this study show that aberrant muscle timing patterns may persist
even though gait improves considerably in the post-acute phase of stroke,
suggesting that normalization of the temporal patterning of lower extremity muscle
activity is not a prerequisite for functional gait recovery. Apparently, other
neuromuscular factors than gross temporal organization, e.g. force control, may be
more receptive to improvements induced by training or other interventions.
References
Adkin AL, Frank JS, Carpenter MG, and Peysar GW. Postural control is scaled to
level of postural threat. Gait Posture 2000; 12: 87-93.
Ada L, Vattanasilp W, O'Dwyer NJ, Crosbie J. Does spasticity contribute to
walking dysfunction after stroke? J Neurol Neurosurg Psychiatry 1998; 64:628-635.
Berger W, Horstmann G, Dietz V. Tension development and muscle activation in
the leg during gait in spastic hemiparesis: independence of muscle hypertonia
and exaggerated stretch reflexes. J Neurol Neurosurg Psychiatry 1984; 47:1029-
1033.
Brunnstrom S. Motor testing procedures in hemiplegia: based on sequential
recovery stages. Phys Ther 1966; 46: 357-375
Brunnstrom S. Movement therapy in hemiplegia: a neurophysiological approach. New York:
Harper and Row, 1970
Gait control after stroke
Neuromuscular patterning during gait recovery 80
Brandstater ME, de Bruin H, Gowland C, Clark BM. Hemiplegic gait: analysis of
temporal variables. Arch Phys Med Rehabil 1983; 64: 583-587.
Burridge JH, Wood DE, Taylor PN, McLellan DL. Indices to describe different
muscle activation patterns, identified during treadmill walking, in people with
spastic drop foot. Med Eng Phys 2001; 23: 427-434.
Collen FM, Wade DT, Robb GF, Bradshaw CM. The Rivermead Mobility Index: a
further development of the Rivermead Motor Assessment. Int Disabil Stud
1991; 13:50-54.
Davies PM. Steps to follow. New York: Springer Verlag, 1985
De Haart M, Geurts AC, Huidekoper SC, Fasotti L, van Limbeek J. Recovery of
standing balance in postacute stroke patients: a rehabilitation cohort study.
Arch Phys Med Rehabil. 2004; 85:886-895.
DeVita P, Hortobagyi T. Age causes a redistribution of joint torques and powers
during gait. J Appl Physiol. 2000;88:1804-1811.
Den Otter AR, Geurts ACH, Mulder T, Duysens J. Speed related changes in
muscle activity from normal to very slow speeds. Gait Posture 2004; 19: 270-
278
Dietz V, Duysens J. Significance of load receptor input during locomotion: a
review. Gait Posture 2000; 11:102-110.
Dietz V. Spastic movement disorder: what is the impact of research on clinical
practice? J Neurol Neurosurg Psychiatry. 2003;74:820-1.
Diller L, Ben-Hishay Y, Gertsman LJ, Goodkin R, Gordon W, Weinberg MS.
Studies on cognition and rehabilitation in hemiplegia. New York University Medical
Center: Rehabilitation Monograph n. 50, 1974
Duysens J, Clarac F, Cruse H. Load-regulating mechanisms in gait and posture:
comparative aspects. Physiol Rev 2000, 80:83-133.
Freriks B, Hermens H, Disselhorst-Klug C, Rau G. The recommendations for
sensor and sensor placement procedures for surface electromyography. In:
Hermens H (ed.) European recommendations for surface elctromyography. Enschede:
Roessingh Research and Development, 1999: 15 –53
Gauthier L, Dehaut F, Joanette Y. The Bell’s test: quantitative and qualitative for
visual neglect. Int J Clin Neuropsychol 1989; 11: 49-54
Grasso R, Ivanenko YP, Zago M, Molinari M, Scivoletto G, Castellano V, Macellari
V, Lacquaniti F. Distributed plasticity of locomotor pattern generators in
spinal cord injured patients. Brain 2004; 127:1019-1034.

Gait control after stroke
Chapter 4 81
Harris-Love ML, Forrester LW, Macko RF, Silver KH, Smith GV. Hemiparetic gait
parameters in overground versus treadmill walking. Neurorehabil Neural Repair.
2001;15:105-112.
Hesse S, Jahnke MT, Schreiner C, Mauritz KH. Gait symmetry and functional
walking performance in hemiparetic patients prior to and after a 4-week
rehabilitation programme Gait & Posture 1993; 1: 166-171
Hesse S, Krajnik J, Luecke D, Jahnke MT, Gregoric M, Mauritz KH. Ankle muscle
activity before and after botulinum toxin therapy for lower limb extensor
spasticity in chronic hemiparetic patients. Stroke 1996; 27: 455-460.
Hesse S, Konrad M, Uhlenbrock D. Treadmill walking with partial body weight
support versus floor walking in hemiparetic subjects. Arch Phys Med Rehabil.
1999 Apr;80(4):421-427.
Hirschberg G G, Nathanson M. electromyogrphic recording of muscular activity in
normal and spastic gaits. Arch Phys Med Rehabil 1952; 33: 217-225
Hof AL, Elzinga H, Grimmius W, Halbertsma JPK. Speed dependence of averaged
EMG profiles in walking. Gait Posture 2002; 16: 78-86
Holden MK, Gill KM, Magliozzi MR, Nathan J, Piehl-Baker L. Clinical gait
assessment in the neurologically impaired. Reliability and meaningfulness. Phys
Ther 1984; 64: 35-40
Ivanenko YP, Grasso R, Macellari V & Lacquaniti F. Control of foot trajectory in
human locomotion: role of ground contact forces in simulated reduced
gravity. J Neurophysiol 2002; 87: 3070–3089.
Jorgensen HS, Nakayama H, Raaschou HO, Olsen TS. Recovery of walking
function in stroke patients: The Copenhagen stroke study. Arch Phys Med
Rehabil 1995; 76: 27-32
Kepple TM, Lohmann Siegel K, Stanhope S.J. Relative contributions of the lower
extremity joint moments to forward progression and support during gait. Gait
Posture 1997; 6: 1-8.
Knutsson E, Richards C. Different types of disturbed motor control in gait of
hemiparetic patients. Brain 1979; 120: 405-430.
Kwon OY, Minor SD, Maluf KS, Mueller MJ. Comparison of muscle activity
during walking in subjects with and without diabetic neuropathy. Gait Posture
2003; 18:105-113.
Lamontagne A, Richards CL, Malouin F. Coactivation during gait as an adaptive
behavior after stroke. J Electromyogr Kinesiol 2000; 10: 407-415.
Gait control after stroke
Neuromuscular patterning during gait recovery 82
Lamontagne A, Malouin F, Richards CL. Locomotor-specific measure of spasticity
of plantarflexor muscles after stroke. Arch Phys Med Rehabil 2001; 82:1696-
1704.
Latash, ML, Anson, JG What are ‘normal movements’ in atypical populations?
Behavioral and Brain Sciences 1996; 19 (1): 55-106.
Leroux A, Fung J, Barbeau H. Adaptation of the walking pattern to uphill walking
in normal and spinal-cord injured subjects. Exp Brain Res 1999, 126: 359-368
Mac Queen, J. (1967). Some methods for classification and analysis of multivariate
observations. In Le Cam, L. M. and Neyman, J., editors, Proceedings of the Fifth
Berkeley Symposium on Mathematical Statistics and Probability, volume 1, pages 281-
297, Berkeley, Califonia. University of California Press.
Maki BE, Holliday PJ, and Topper AK. Fear of falling and postural performance in
the elderly. J Gerontol 1991, 46: M123-M131.
Okamoto T, Okamoto K, Andrew PD. Electromyographic developmental changes
in one individual from newborn stepping to mature walking. Gait Posture. 2003,
17:18-27
Olney SJ, Richards C (1996) Hemiparetic gait following stroke. Part I:
Characteristics. Gait Posture. 1996, 4: 136-148
Peat M, Dubo HIC, Winter DA, Quanbury AO, Steinke T, Grahame MC.
Electromyographic temporal analysis of gait: hemiplegic locomotion. Arch
Phys Med Rehabil 1976; 57: 421-425
Peham C, Scheidl M, Licka T. Limb locomotion -- speed distribution as a new
method for stance phase detection. J Biomech 1999;, 32: 1119-1124
Perry J, Waters RL, Perrin T. Electromyographic analysis of equinovarus following
stroke. Clin Orthop 1978; 131:47-53.
Perry J. Determinants of muscle function in the spastic lower extremity. Clin Orthop
1993; 288: 10-26
Schenkenberg T, Bradford DC, Ajax ET. Line bisection and unilateral visual
neglect in patients with neurologic impairment. Neurology 1980; 30, 509-517
Shiavi R, Bugle HJ, Limbird T. Electromyographic gait assessment, Part 2:
Preliminary assessment of hemiparetic synergy patterns. J Rehabil Res Dev
1987 ; 24: 24-30
Skilbeck CE, Wade DT, Hewer RL, Wood AV. Recovery after stroke. J Neurol
Neurosurg Psychiat 1983; 46: 5-8

Gait control after stroke
Chapter 4 83
Van de Crommert HW, Mulder T, Duysens J. Neural control of locomotion:
sensory control of the central pattern generator and its relation to treadmill
training. Gait Posture 1998; 7:251-263.
Vattanasilp W, Ada L, Crosbie J. Contribution of thixotropy, spasticity, and
contracture to ankle stiffness after stroke. J Neurol Neurosurg Psychiatry 2000; 69:
34-39.
Wade DT, Hewer RL. Functional abilities after stroke: measurement, natural
history and prognosis. J Neurol Neurosurg Psych 1987; 50: 177-182
Wade DT. Measurement in neurological rehabilitation. Oxford: Oxford Medical
publishers, 1992
Wilson B, Cockburn J, Halligan P. Behavioral Inattention Test. Titchfield, Fareham,
Hants, England: Thames valley Test Co.; Gaylford MI: National Rehabilitation
services, 1987
Winter DA. The biomechanics and motor control of human gait. Waterloo,
Ontario: University of Waterloo Press, 1987.
Wortis SB, Marks M, Hirschberg GG, Nathanson M. Gait analysis in hemiplegia.
Trans Am Neurol Assoc 1951; 76: 181-183