university of groningen sintering characteristics of nano
TRANSCRIPT

University of Groningen
Sintering characteristics of nano-ceramic coatingsPopma, Ronald Leo Wim
IMPORTANT NOTE: You are advised to consult the publisher's version (publisher's PDF) if you wish to cite fromit. Please check the document version below.
Document VersionPublisher's PDF, also known as Version of record
Publication date:2002
Link to publication in University of Groningen/UMCG research database
Citation for published version (APA):Popma, R. L. W. (2002). Sintering characteristics of nano-ceramic coatings. s.n.
CopyrightOther than for strictly personal use, it is not permitted to download or to forward/distribute the text or part of it without the consent of theauthor(s) and/or copyright holder(s), unless the work is under an open content license (like Creative Commons).
The publication may also be distributed here under the terms of Article 25fa of the Dutch Copyright Act, indicated by the “Taverne” license.More information can be found on the University of Groningen website: https://www.rug.nl/library/open-access/self-archiving-pure/taverne-amendment.
Take-down policyIf you believe that this document breaches copyright please contact us providing details, and we will remove access to the work immediatelyand investigate your claim.
Downloaded from the University of Groningen/UMCG research database (Pure): http://www.rug.nl/research/portal. For technical reasons thenumber of authors shown on this cover page is limited to 10 maximum.
Download date: 24-02-2022

97
5. 5. ZIRCONIA: CRYSTALLINE SINTERING
In this chapter the sintering behavior of zirconia sol-gels coatings deposited on fused
silica and steel is analyzd. It starts with the description of the experimental set-up for
both substrates and precursors (§ 5.2). Experimental results of furnace and laser
treatments are the subject of the next section. Attention is paid to the densification
behavior and the grain growth in the layer. Also, the different crystal phases observed
are addressed (§ 5.3) followed by a discussion of the differences between furnace and
laser sintering in § 5.4. We conclude with a formulation that predicts the grain size and
densification both for the initial fast sintering of the process, at all sintering
temperatures, and for the final slow sintering, only at the higher sintering temperatures
(§ 5.5).
5.1. INTRODUCTION
Applications of zirconia (ZrO2) have grown very fast and at present ZrO2
has become one of the most industrially important ceramic materials1. Thetraditional applications of ZrO2 and ZrO2 containing materials are foundrysands and flours, refractory ceramic and abrasives. Due to its high oxygenion conduction and high refractive index it is also used in a broad range ofnovel applications including catalysts, oxygen sensors, fuel cells andjewelry. Since the publication of the famous paper on ‘ceramic steel’transformation toughened zirconia by Garvie et al.2 zirconias have alsobeen utilized in many structural applications. Along with high strength andtoughness, zirconia also possesses adjustable hardness, wear resistance andthermal shock resistance. These properties have led to the use of zirconia-based components in a number of engineering applications such asautomobile engine parts, wire drawing dies and cutting tools. The lowthermal conductivity together with a relatively high coefficient of thermalexpansion makes zirconia a suitable material for thermal barrier coatingson metal components.

CHAPTER 5
98
At atmospheric pressure zirconia has three crystalline polymorphs, namelycubic, tetragonal and monoclinic. The stable phase at room temperatureand at atmospheric pressure of pure coarse-grained zirconia is monoclinicwhich transforms martensitically at 1170 °C to tetragonal and at 2370 °C toa cubic structure. The martensitic transformation from tetragonal tomonoclinic structure has great importance for mechanical applicationsbecause it forms the basis for transformation toughening.
5.2. EXPERIMENTAL
This investigation was focused on short and long sintering times in thefurnace, and with ESEM on sintering times shorter than 10 minutes, mainlyaimed at examining the first sintering phase. Experiments indicated that theprincipal changes in the sol-gel structure occurred within the first minutes.After this laser experiments were performed.
5.2.1. The substrates
The zirconia sol-gels were prepared from precursors, which reacted witheach other to form monodisperse zirconia particles of about 3 nm(consisting of zirconium hydroxide) that are suspended in an aqueous fluid(the sol-gels were provided by Merck-Germany). The layers of zirconia sol-gel were deposited on both polished fused silica substrates and stainlesssteel substrates, and the desired thickness was achieved by spin coating.After coating the samples were dried in air at ambient temperatures. Thespincoating rotational speeds were set to produce 350 nm green layers,because experiments indicated that this was the maximum layer thicknessfor a coating without cracks.
Zirconia sols were deposited onto polished fused silica samples of50x50x1.5 mm and on steel substrates. The coatings applied to the steelsubstrates appeared to crack much easier than the layers on fused silica,although the sinter process seems to be identical. Some cracks alreadyoccurred during the drying process. The cracking was found to be relatedto the surface roughness of the substrate. In Figure 5.1 plane view imagesare depicted of zirconia sol-gel layers deposited on different steelsubstrates. The sample with the highest roughness (the ground substrate)exhibits more cracks, whereas the least rough substrate (polished) showsonly a few cracks. These cracks are probably due to local stresses.

ZIRCONIA: CRYSTALLINE SINTERING
99
Figure 5.1: zirconia layerdeposited on a steel substratethat was a) ground: � =200 nmb) sand blasted: � = 1500 nmc) polished � = 50 nm.
5.2.2. Preparation of samples for furnace sintering
The fused silica samples covered with a dried zirconia sol-gel layer weredried for a few days at room temperature and were then put in a furnacewith an atmosphere of air. These specimens were isothermally sinteredunder normal air atmosphere with different sintering times ranging from 1minute up to 6 hours and at temperatures ranging from 150 °C to 1200 °C.Subsequently, the samples were cooled down to room temperature inambient air. The sintering variables were temperature and time, resultingin zirconia coatings with different particle sizes, layer thickness anddensities.
Because the green coating is very thin (approximately 350 nm), it will heatup so fast that the coating is almost instantly at the same temperature as thefurnace atmosphere (calculations predict within 2 microseconds).

CHAPTER 5
100
For temperatures higher than 1200 °C quartz becomes rather soft andsintering temperatures much higher than 1200 °C were not possible onquartz as a substrate.
To make layers with a larger thickness the zirconia sol was hydrothermallytreated (1 hour at 110 °C). The primary particles in the sol clog togetherforming clusters of 2 nm to 75 nm. As a result of the different size andproperties of the hydrothermally treated zirconia a green layer thickness of1 � m could be obtained without cracking. Also with hydrothermally treatedzirconia all tests were performed with quartz as a substrate. Both furnaceand laser sintering experiments with a large range of heat inputs wereperformed.
The samples were examined using ellipsometry, scanning electronmicroscopy, transmission electron microscopy and X-ray diffraction. Withthe use of an ellipsometer (VASE Ellipsometer at Philips PhysicalLaboratory-Eindhoven, a rotating analyzer type measuring the spectralrange between 185 and 1700 nm) layer thickness and density were studied.An SEM equipped with a special electromagnetic lens in order to obtainhigher resolution (Philips XL30-S FEG SEM) was used to study the layers(see Chapter 2). Grain size from plane view images and layer thicknessfrom cross section images were determined. A TEM (JEOL 4000 EX/II) wasused to obtain high resolution images so as to study the original sol-gelparticles and a TEM JEOL 2010 F was used for an analysis of the chemicalcomposition and sub-grain boundaries as well as the wetting of the zirconiaby the substrate at high temperatures.
For SEM preparation, the heat-treated samples were glued onto analuminum holder with silver paint and then coated with a thin Palladiumlayer to prevent sample charging. As a result, small islands can be seen atvery large magnifications, but because they are smaller than 5 nm, it is stillpossible to see the individual zirconia grains. All pictures in this chapterwere taken with the Philips XL30s SEM at an acceleration voltage of 3.0 kV,with a spot size of 2 or 3 and a working distance between 1 and 5 mm.
5.2.3. Ziroconia Sol-Gels
In Table 5.1 the possible phases of zirconia are listed. Five differentprecursors of zirconia were sintered and studied, see Table 5.2.

ZIRCONIA: CRYSTALLINE SINTERING
101
Table 5.1: Phases of zirconia with their dimensions, starting temperaturesdensities and Bragg reflections(CuK � -radiation).
Table 5.2: Five different precursors of zirconia sol-gel were used in thisproject.
Samplecode
ZrO2 precursor layer thickness (nm)
AH013 Hydrothermally treated for3 hours at 110 °C
300�15
AH015 Hydrothermally treated for3 hours at 130 °C
360�15
AH018 ZrO2 stabilized with NO3- 280
�15
AH025 ZrO2 original sol 1 220�15
AH026 Hydrothermally treated for3 hours at 140 °C
300�15
Liquida 5.31 5.12 5.1b 5.2125 5.1c 5.14 5.25 5.1
99.218h k l % 2 � % ��� % ���-1 1 1 100 28.1981 1 1 68 31.494 100 30.193 100 30.072 0 0 21 34.188 25 35.337 20.3 34.860 2 0 11 34.412
0 1170 2370 26805.56 6.1 5.7-5.9
Cubic
Start Temp [°C]density [g/cm3]
�
Monoclinic Tetragonal

CHAPTER 5
102
5.2.4. Sintering
Because a non-isothermal sintering process is different from isothermalsintering and the actual temperature influences the sintering results, it isvery important to assure that the temperature is correct and can be keptconstant. Therefore a chromel-alumel thermocouple was used to monitorthe temperature for calibrating, testing and selecting the furnaces. Sinteringexperiments at temperatures up to 1100 °C were done with a Hereausfurnace [K 1252-F max 1250 °C]. Fast sintering at these temperatures wascarried out in a cylindrical Hereaus furnace [TIK/R 11/12 max 1300 °C],while the experiments at 1200 °C and 1300 °C were executed in ThermolineHigh Temp Furnace [type 46100 max 1700 °C].
Two different samples were heated in the furnaces at two differenttemperatures: the samples with an initial particle size of 9.5 nm weresintered at 800 °C and 1200 °C, whereas the samples with an initial particlesize of 30 nm were sintered at 1000 °C and 1200 °C. These samples werefabricated from the original sol-gel by heating at a relatively lowtemperature, i.e. far lower than the sintering temperature, excludinginfluences on the investigated sintering behavior. It even diminishes theeffects of processes like aging and drying.
Inserting the samples in a furnace for short sintering times is a problem,because opening and closing the furnace caused a reduction of thetemperature of several tens of degrees up to about 60 °C at a sinteringtemperature of 1100 °C. It took several minutes to attain the originally settemperature (Figure 5.2). A higher temperature corresponded to a largerdrop in temperature and a longer time to restore. Because this would affectthe values and reliability of the results, especially those obtained after shortsintering times, another method of inserting the samples was necessary.

ZIRCONIA: CRYSTALLINE SINTERING
103
Figure 5.2: Temperature measured in furnace with a thermocouple. T droppedalmost 60 °, when it was opened to position a new sample.
Therefore a quartz rod was used having a cavity near the top for smallsamples. Through a small opening in the front or backside of the furnace,the rod was inserted in the furnace, which could maintain a nearly (± 5 °C)constant temperature in this way. After completion of the sintering time,the rod was pulled back out of the furnace and its top end including thesample was cooled by quenching in demineralized water at roomtemperature. In this way sintering temperature and time could becontrolled to a great extent.
It can be assumed that the ZrO2 is heated up so fast, that the time to reachthe furnace temperature for the whole cross section of the layer can beneglected. This has been confirmed by calculations with the model ofchapter 3.
5.2.5. Environmental SEM in-situ sintering preparation
To execute in-situ sintering experiments the previously described XL30environmental SEM with hot-stage was used (see Chapter 2). Varioussamples with different average particle sizes (14, 28, 46 and 75 nm) wereheated to several sintering temperatures (800, 1000 and 1200 °C) and times.Some of the experiments have been recorded by video. Cooling took place
10301040105010601070108010901100111011201130
4:55 4:58 5:00 5:03 5:06 5:09
time [h:min]
Tem
pera
ture
[°C
]

CHAPTER 5
104
inside the ESEM, until the pressure within the SEM allows opening of thedoor and the sample was cooled in air to room temperature. Before andafter the experiment micrographs were made by the XL30S SEM to compareand determine the influence of the sintering process.
Figure 5.3 illustrates the resolution of the ESEM at large magnificationswhile making use of the hot-stage. It is impossible to determine the averageparticle size reliably and changes in the sol-gel structure are practically notobservable. At higher sintering temperatures and for longer times imagingwas even worse, probably caused by the smoothing of the layer during thesintering process. Although the micrographs from the XL30s clearlyshowed changes in the structure of the zirconia coating, it was impossibleto observe the development in-situ with a great degree of precision.
An additional problem was the difficulty to focus continuously on the samelocation of the sample because of the drift caused by the extension of thezirconia layer during the in-situ experiments. The hot-stage has a maximumheating rate of 300 °C/min, but the standard setting for all measurementswas 5 °C/min to avoid any substantial drift. Other variables such asstigmatism and alignment also had to be adjusted continuously.
Figure 5.3: Typical image obtained from in-situ experiments of zirconiasintering, making use of the hot-stage.

ZIRCONIA: CRYSTALLINE SINTERING
105
5.2.6. X-ray diffraction measurements
X-ray equipment (Philips PW 1820 with a Cu anode) was used to determinecrystal phases in the layer. The X-ray diffractograms were recorded for boththe furnace treated and the laser treated samples. These diffractogramsshow several properties of the coatings. The sizes of the grains werecalculated with the Scherrer equation3:
(5.1)
where K is a factor ~0.9-1.0, � is the wavelength of the radiation used(1.54056 Ångstrom for CuK � ) and B the broadening of the profile. Thebroadening B has to be corrected for the instrumental broadening due toslit sizes and X-ray source characteristics. To measure the instrumentalbroadening, a reference diffractogram was recorded from a standardspecimen. This specimen should not show broadening of the line profiles.Therefore, the crystallite size should be larger than 1 � m and the grainsshould not be strained. As a standard specimen, a Fe3O4 sample was used.The APD program was used to calculate the Full Width at Half Maximum(FWHM) of the peaks. The instrumental broadening with this experimentalset-up was measured and calculated to be 0.098.
5.2.7. Mechanical properties testing preparations
Pre-sintered samples had to be cut into smaller sizes to fit into the ESEM.At first this was done by ultrasonically cutting pieces out of the samples orgrinding with a diamond grindstone. Afterwards the samples were rinsedwith demineralized water, ethanol or acetone. To check the results of thesemachining processes, pictures were taken by the XL30s SEM in order tocompare with unprepared original samples. To illustrate the results apicture of the unprepared sample and of the ground sample rinsed withwater are shown in Figure 5.4. All of the six combinations of preparingappeared to have the same effect on the zirconia coating: space has beendeveloped between the grains and the open porosity has increased.
cos B
KD
B
���

CHAPTER 5
106
Figure 5.4: The effect of grinding or cutting followed by rinsing bycomparison of an unprepared sample (a) and a grinded sample rinsed with
water (b).
The exposure of the coating to ultrasonic vibrations turned out to be thecause of the surface morphology. Figure 5.5 shows a representative part ofthe structure of a sample with an average grain size of 69 nm after havingbeen ultrasonically vibrated for 300 minutes. Large areas of the zirconiacoating have disappeared, leaving a pattern on the boundary betweencoating and quartz substrate. This pattern is due to quartz material, whichhas lifted between the zirconia grains during the sintering process.
Figure 5.5: The effect ofvibrating 300 minutes at
15 kHz (grain size 69nm).
The development of space between the grains under the influence ofultrasonic vibrations, as can be seen from Figure 5.4, implies that the bondsbetween the grains is not very strong and these were broken due to thevibrations. This suggests that at their boundaries the grains are not welladhered. Actually nano-crystalline materials have a very large grainboundary area which gives them special4. For instance, a nanophase

ZIRCONIA: CRYSTALLINE SINTERING
107
material with an average grain size of 5 nm has about 50% of its atomswithin the first two nearest-neighbor planes of a grain boundary, in whichsignificant atomic displacements from their normal lattice positions areexhibited. To fully understand the properties of nanophase materials alsoother structural features must be taken into account, such as pores, largerflaws, grain boundary junctions, and other crystal lattice defects.
Because ultrasonic cutting generated harmful vibrations we chose toscratch the back of the samples using a diamond tip and then break them.This had no influence on the microstructure of the coating and or itssintering behavior.
5.3. RESULTS
5.3.1. The dried coating
The non-sintered sol-gel coating consists of clustered agglomerates with anon-regular shape. Inter-agglomerate pores were difficult to visualize withthe SEM, but are evidently present. Inter-particle pores seemed to havedisappeared in the preliminary process of sample producing, or they aretoo small to be detected. The ZrO2 particles in the green layer were toosmall to be visible in the SEM. In the TEM (see Figure 5.6) the particlescould be made visible, but they were obviously affected by the electronbeam so that most particles crystallized almost immediately. That the greenparticles were amorphous was inferred from the X-ray diffractograms. Theparticles have a spherical shape with a radius of about 2 to 3 nm. Clustersof particles can also be found. These clusters easily form largerconglomerates, which indicates that the material is very reactive.
The clusters show a colloid-like behavior allowing for all colloid-influencing forces (e.g. electric, magnetic and electromagnetic fields can beused to manipulate the packing of the particles).

CHAPTER 5
108
Figure 5.6: TEM image of a zirconia sol-gelparticle. The bar in the picture represents 1 nm.
5.3.2. Results of furnace sintering
The decrease of the layer thickness due to the sintering process is thephenomenon that is most easily studied. In Figure 5.7 the layer thickness asmeasured on the pictures of the cross sections is plotted as a function of thesintering temperature, with a sintering time of 30 minutes for all samples.
Figure 5.7: Thickness of the zirconia layer as a function of sinteringtemperature. All samples were sintered for 30 minutes.
There was good agreement between the results obtained with the SEM andthose obtained by ellipsometry. Only at very low sintering temperatures
0
100
200
300
400
0 250 500 750 1000 1250 1500
temperature (°C)
laye
r th
ickn
ess
(nm
)
ZIRCONIA: CRYSTALLINE SINTERING
109
(less than 300 °C) there appeared to be a difference. At those temperaturesthe layer thickness values obtained with the ellipsometer were less thanhalf of those obtained with the SEM. The values obtained with SEM can beassumed to be correct and the differences with the ellipsometry results canbe explained by the high degree of porosity in the layer and the fact thatprobably still some hydroxyl groups are present. It is obvious that the layerwill shrink when heat is applied. In this study the layer shrinks from about350 nm to 100 nm (approximately 70%).
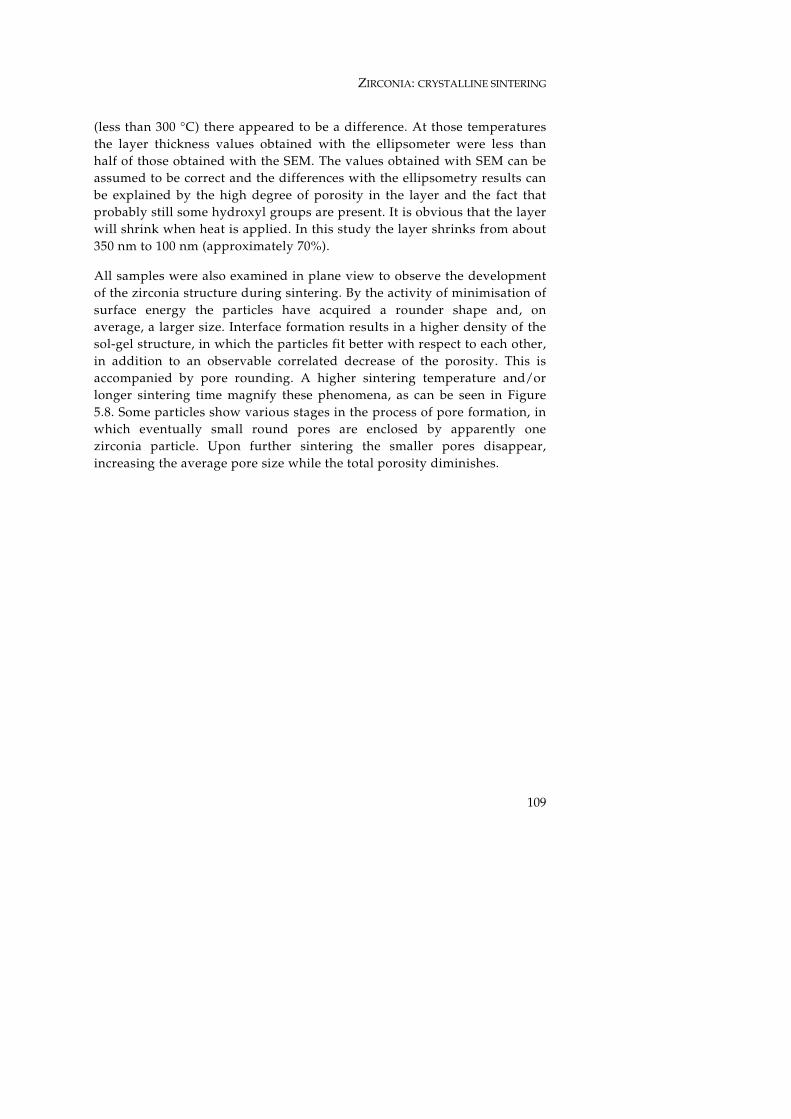
All samples were also examined in plane view to observe the developmentof the zirconia structure during sintering. By the activity of minimisation ofsurface energy the particles have acquired a rounder shape and, onaverage, a larger size. Interface formation results in a higher density of thesol-gel structure, in which the particles fit better with respect to each other,in addition to an observable correlated decrease of the porosity. This isaccompanied by pore rounding. A higher sintering temperature and/orlonger sintering time magnify these phenomena, as can be seen in Figure5.8. Some particles show various stages in the process of pore formation, inwhich eventually small round pores are enclosed by apparently onezirconia particle. Upon further sintering the smaller pores disappear,increasing the average pore size while the total porosity diminishes.

CHAPTER 5
110
Figure 5.8: Developing structure at increasing sintering times of zirconia sol-gel coating with an initial particle size. a: not-sintered b: 10 sec c: 30 sec d:
1.5 min e: 3.5 min f: 10 min g: 15 min h: sub grain structures of 9.5 nm,sintered at 1200 °C (a-g). Distinctive sub grain structures at higher
magnifications (h).
a b
c d
e f
g h
ZIRCONIA: CRYSTALLINE SINTERING
111
Figure 5.9: Zirconia sol-gel heat treatment with an initial average particlesize of 9.5 nm (a) and 30 nm (b, c, d) sintered at 800 °C (b), 1000 °C (c) and
1200 °C (d).
Open porosity is the situation, where pores are present in the top layer (seeFigure 5.9). However, when the layer is heated further, the open porosityalmost disappears, especially at higher sintering temperatures, and poresprimarily remain inside the coating or within the grains. It can be observedthat the layers heated below 1000 °C show a lot of open pores, but forhigher sintering temperatures almost all open pores disappear. So, if thereis any porosity it must be due to micro-pores within the grains, whichcannot be seen by SEM.
Related to the change in thickness of the coating is the change in density. InFigure 5.10 the density is plotted as a function of the sintering temperature.At a temperature of 1200 °C a completely densified zirconia layer isachieved. This can be observed with the SEM (Figure 5.13) and detected byellipsometry. It is clear that the density increases continuously with
a b
c d

CHAPTER 5
112
increasing temperature. The green layer density is very low, about 30%.The density values at low temperatures are obtained from SEM-images,assuming that the 1200 °C layer is completely dense and that all layers hadthe same green layer thickness (those obtained with ellipsometry are toohigh due to the high degree of porosity).
Figure 5.10: Density measured by ellipsometry and SEM as a function offurnace sintering temperature for 30 minutes sintering of zirconia sol-gel.The W stands where all physisorbed water is removed, the T indicates the
transformation from the monoclinic to the tetragonal phase.
50
70
90
110
0 200 400 600 800 1000 1200
Temperature (°C)
Den
sity
(%
)
W
T

ZIRCONIA: CRYSTALLINE SINTERING
113
Figure 5.11: Top view of a zirconia surface layer heated for 30 minutes at 300 °C.
Figure 5.12: Top view of a zirconia surface layer heated for 30 minutes at 800 °C.
Figure 5.13: Top view of a zirconia surface layer heated for 30 minutes at1200 °C.
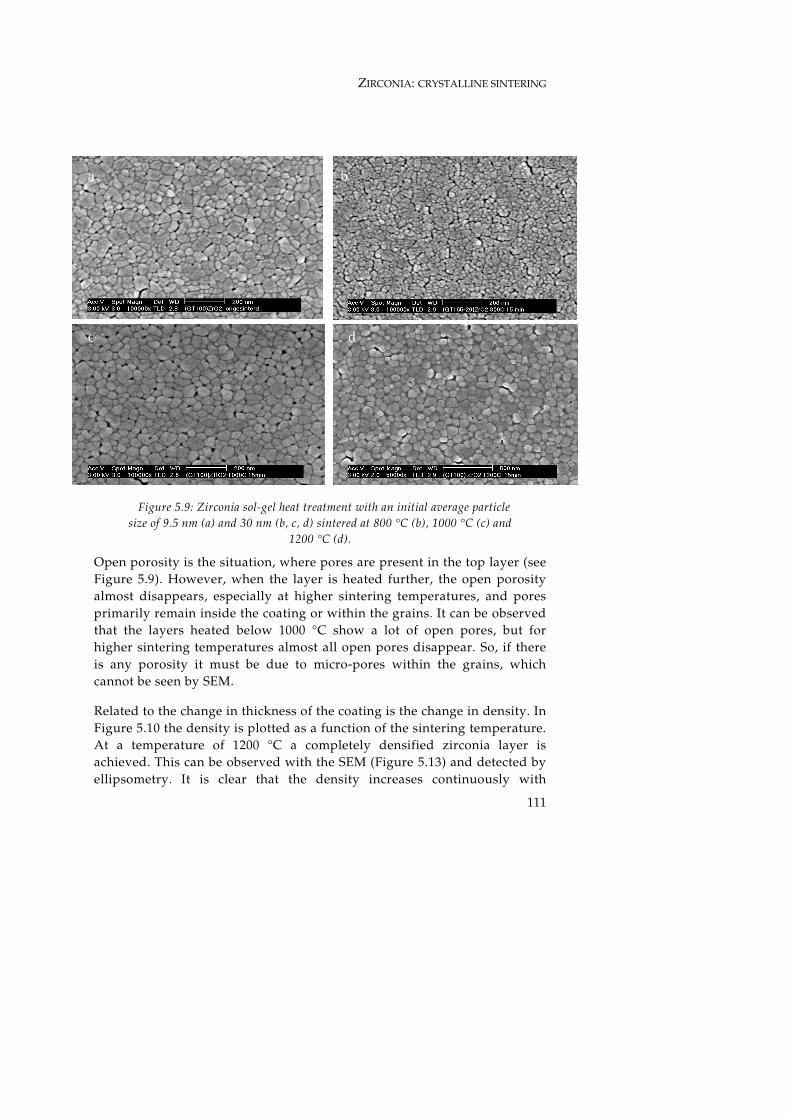
The grain size as a function of sintering time is displayed in Figure 5.14 fordifferent sintering temperatures. At the lowest temperatures (300 °C or
CHAPTER 5
114
less) no, or almost no grain growth took place (this can be seen in Figure5.11). XRD measurements showed that no crystal phases were present, evenat longer sintering times.
Figure 5.14: Grain size of zirconia surface layer as a function of the sinteringtime at various sintering temperatures.
When the sintering temperature gets higher (between 500 and 1000 °C) thecurves show two distinct regions. Instead of a continuous growth of thegrains, the grains seem to attain a certain size very quickly. The grain sizedepends on temperature. After that hardly any grain growth takes place asis depicted in Figure 5.14. In these samples the XRD measurements show amixed composition of tetragonal and monoclinic phases. This can beexplained by the fact that part of the grains are still very small, whichfavors the tetragonal phase instead of the monoclinic phase normally stableat room temperature 5. When the sintering temperature is even higher (1100and 1200 °C) there is an additional slow grain growth after the initial rapidgrowth (see Figure 5.13). In this case the XRD results show only themonoclinic phase for all samples.
Figure 5.10, in which the densification is plotted as a function of sinteringtemperature, shows that complete densification is possible. The structure inthe layer is demonstrated in Figure 5.15. A completely dense layer isobserved with a grain size of about 120 nm. The cross section shows thatthe thickness of the layer consists out of a single grain and is thus alsoabout 120 nm.
0
50
100
150
200
0 100 200 300 400
time (min)
grai
n si
ze (
nm)
T=300°C
T=800°C
T=1000°C
T=1100°C
T=1200°C

ZIRCONIA: CRYSTALLINE SINTERING
115
Figure 5.15: Furnace treated zirconia on quartz. a) top view 1200 °C/ 1 hour,b)cross section 1200 °C/ 1 hour.
Figure 5.7 shows an almost linear decrease of the layer thickness withtemperature, which can not be explained using only a single thermallyactivated process. Obviously, more than one process takes place, replacingthe previous one as the temperature increases. For amorphous ceramicsystems it is known that when heated three regions can be observed. At thelowest temperatures physically absorbed water will be removed, but theshrinkage is usually small. For silica this has only a small influence(approximately 0.5%), but in this case with even much smaller particles theinfluence is observed at very low temperatures. For temperatures to 150 °Ca value of approximately 15% is calculated. In the next regimes (toapproximately 500 °C) polymerization (both within and on the surface ofthe inorganic skeleton) and structural relaxation (an irreversible process inwhich the free energy decreases through reformation of grain boundaries)result in a large shrinkage. Finally at very high temperatures related to theglass transition temperature viscous sintering may yield satisfactory results(around 800 °C). This results in a very high densification rate, much higherthan the densification rate of crystalline materials.
The process seems to be quite similar when heat-treating with a laser. Withlow heat input no sintering takes place. The layer shrinks considerably toabout one third of the original thickness, but no grain growth is detected.At higher heat input the particles in the layer sinter, where the maximalattainable grain size is of the same order as the thickness of the layer due tothe directional dependence of the diffusion.
a b

CHAPTER 5
116
5.3.3. Results of hydrothermally treated ZrO2 precursors.
In order to make layers with a larger thickness the zirconia sol washydrothermally treated (1 hour at 110 °C). As a result the primary particlesin the sol grow from 2 nm to 75 nm. As a result of the different size andproperties of the hydrothermally treated zirconia a green layer thickness of1000 nm can be obtained without cracking. After sintering the layerthickness is still 400 to 500 nm thick, much thicker than the layer madefrom the original zirconia particles. In the case of crystallized particles thesintering will be much slower and the resulting layer will contain morepores. In the case of hydrothermally treated zirconia sol-gel (particle sizeranging from 15 to 70 nm), i.e. large particles, which are partly crystallized,cause an incomplete densification. When the particles are smaller and lesscrystallized the layer seems to become more densified than when usingcrystallized large particles (see Figure 5.16).
All tests on hydrothermally treated zirconia were also performed on quartzsubstrates. Both furnace and laser sintering experiments with a large rangeof heat inputs were performed. Figure 5.16 shows some typical structuresthat were obtained.
Figure 5.16: Laser treated ZrO2-sol on quartz a) 15 nm hydrothermallytreated zirconia sol-gel 1950 W, 75 mm/s, b) 70 nm hydrothermally treated
zirconia sol-gel 1950 W/ 0.94 mm/s.
From these observations it is concluded that the optimum in the productionof a completely densified zirconia layer is reached if a sol-gel existing ofsmall amorphous particles is used. As a result the original Merck and ISCsols are good candidates as well as the hydrothermally treated sol-gels,when treated on a low temperature.
ba

ZIRCONIA: CRYSTALLINE SINTERING
117
Figure 5.17: All sintering experiments on zirconia in a furnace where theresulting grain size is displayed versus sintering temperature. Larger grain
sizes result from longer sintering times.
5.3.4. In-situ results
The results of Figure 5.14 posed the question what the behavior of thezirconia would be when we keep the sintering time very short. To executethese short sintering experiments both a specially prepared furnace and thehot-stage in the XL30 environmental SEM were used. As was alreadydescribed in the experimental part of this chapter the longest heating timewas 15 minutes. Various samples with different starting particle sizes (14,28, 46 and 75 nm) were heated up to several sintering temperatures (800,1000 and 1200 °C) and several sintering times. Some of the experimentswere recorded by video. Before and after the experiment pictures weremade with the XL30s SEM. In Figure 5.18 the results of these short sinteringexperiments are shown. It is very clear that the microstructures werereproducible, even the difference in starting size only played a part duringthe first few minutes, after that the sintering temperature turned out to bethe main parameter to influence the resulting grain size.
020406080
100120140160180200
0 200 400 600 800 1000 1200
Temperature [°C]
Gra
insi
ze [
nm
]

CHAPTER 5
118
0
10
20
30
40
50
60
70
80
0 5 10 15 20
Sintering time (min)
Gra
in s
ize
(nm
)
initial size 9.5 nm, 1200 °C initial size 30 nm, 1200 °Cinitial size 30 nm, 1000 °C initial size 9.5 nm, 800 °C
Figure 5.18: Average particle size of the zirconia layer as a function of thesintering time at various sintering temperatures and initial sizes.
5.3.5. Laser sintering results
Of course sintering with a laser results in very short interaction times. InChapter 3 a model was developed in which the laser is allowed to heat boththe sol-gel layer and the substrate. Depending on the wavelength of thelaser beam, the coupling of the laser energy into the sol-gel coating couldbe neglected. When the layer is sufficiently small (about 0.2 � m) theabsorption of the laser energy in the substrate is more important. With this“frying pan” assumption, the results obtained with laser sintering werecomparable with the results obtained with furnace sintering. It turned outto make a complete dense layer, which was, like the furnace treated

ZIRCONIA: CRYSTALLINE SINTERING
119
zirconia coating, one grain thick. Also with the laser the maximalobtainable thickness was in the order of 100 to 150 nm.
Figure 5.19: Laser treated ZrO2-sol on quartz d0 = 300 nm a) 4000 W/ 1.88mm/s, b) 4000 W/ 0.94 mm/s, c) 4000 W/ 0.46 mm/s, d) 4000 W/ 0.46 mm/s.
With increasing heat input the layer changed from a situation, where onlydensification but no grain growth occurs towards a completely sinteredsample. Figure 5.19 shows SEM images of the laser treated samples. Theimages show some difference: but in all cases the zirconia coating showsdensification. An increase in the grain size with increasing heat input of thelaser can be found. In Figure 5.19a (cross section) a layer is visible which isnot very well attached to the substrate. It is also visible that the layer is anumber of grains thick. Figure 5.19b (cross section) shows the layer aftermedium heat input. Some grains have already grown to a larger size, butalso some grains are still rather small. Figure 5.19c and d (both crosssections and plane views) show the layer after high heat input. Thethickness of the layer and the grain size are about the same.
a b
dc

CHAPTER 5
120
The hydrothermally treated zirconia sol-gel gave different results. Thegreen layer could be made thicker without cracks appearing, but this layerwas much more open. Starting with a green layer of at least 1000 nm thesintered layer thickness was 500 ±50 nm and the layer was still very open.In Figure 5.20 some typical obtained laser sintered structures ofhydrothermally treated zirconia are shown.
Figure 5.20: Laser treated hydrothermally treated zirconia sol on quartz.a)Fluence 226 J/cm2, b) Fluence 226 J/cm2.
After the initial step the sinter process is dominated by diffusion, thus ahigher heat input of the laser did not change the structure of the layersignificantly. The process time was too short to densify the layercompletely.
In Figure 5.21a (cross section) the layer is shown after a low heat input.Almost no sintering has taken place and the particles are the original ones,due to hydrothermal treatment, clogged particles, i.e. only slightlyconnected to each other.
Figure 5.21 b and c (cross section and top view) the layer is shown after amedium heat input. The grains have grown considerably, but the pores inthe layer are still numerous and of considerable size.
Figure 5.21d (cross section) shows the layer after high heat input. The layershows very large grains, with pores included in one grain and it shows thatthe process can be well controlled. Thus when the heat input of the laser islow there is no sintering, but the layer reaches very quickly the maximumdensity. At intermediate heat input the grains in the layer grow, but thesize of the grains depends on the heat input. When the laser impact is highthe layer sinters completely to a layer, with a thickness of one grain only.
a b

ZIRCONIA: CRYSTALLINE SINTERING
121
Figure 5.21: Laser treated hydrothermally treated ZrO2-sol coating on quartz,d0 = 350 nm. a) 1275 W/ 225 J/cm2 b) 1900 W/ 680 J/cm2, c) 1900 W/680
J/cm2 d) 2250 W/ 800 J/cm2.
5.3.6. XRD results
Figure 5.22 shows the typical CuK � Bragg reflections of a monocliniczirconia at 2 � angles of 34.4 and 35.3 degrees. Due to the texture in thecoating the [111] planes are not visible in this direction. The higher thetemperature the higher the diffraction peaks in the noted angles, this showsthe increase of the grain sizes with temperature. As explained in § 5.2.6 viathe FWHM the grain size can be calculated. In Figure 5.23 the grain sizewas plotted against the fluence of a laser treatment. Several series ofsamples were made. One series had two constant speeds, one series aconstant power of the laser. Thus the same fluence but with different speedand power were comparable. With XRD measurements the differencebetween the same fluence samples can be analyzed.
a b
c d

CHAPTER 5
122
Figure 5.22: Diffractograms of a hydrothermally treated zirconia that wassintered from 800 up to 1300 °C for 30 minutes.
Figure 5.23: The grain size is calculated from the peak broadening in XRDmeasurements of a laser treated zirconia samples with a different fluence.
Figure 5.24 shows that a constant fluence is not always determining thegrain size of the resulting coating. But that speed has its specific influence.The constant power with variable speed seems to give very reliablesintering predictions. Constant fluence is not as precise but gives a goodapproximation. Low fluences are not reliable at high powers.
0
20
40
60
0 200 400 600 800 1000
Fluence [J/cm2]
Gra
insi
ze [
nm
]
P = 2400 W
v = 0.18 cm/s
v = 0.09 cm/s
30
30.8
5
31.7
32.5
5
33.4
34.2
5
35.1
800
1300
4000
5000
6000
7000
8000
9000
cou
nts
2 thetaTemperature [°C]
ZIRCONIA: CRYSTALLINE SINTERING
123
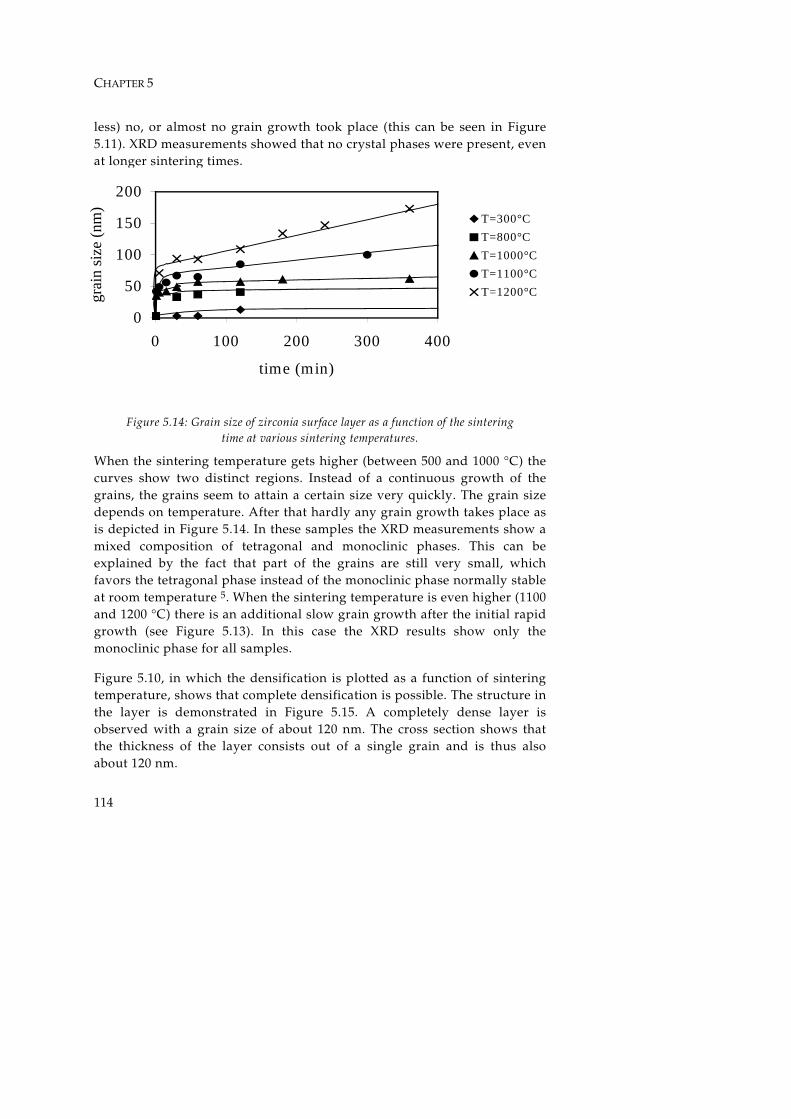
Figure 5.24: Grain sizes for furnace (top) and laser sintering versus furnacetemperature [°C] and laser fluence[J/cm2].
It is possible to formulate an equation by multiplying the fluence and theinteraction time with a factor to approach the sintering degree required.One problem is still present: the XRD-measured grain size is smaller thanobserved with the SEM. This may be due to different sensitivities withrespect to particle length.
5.3.7. TEM observations
In the SEM subgrain boundaries can be observed. In Figure 5.25 thecorresponding TEM pictures specially made for this purpose are shown.
0
10
20
30
40
50
60
0 200 400 600 800 1000
Flu en ce [J /cm 2]
gra
insi
ze [
nm
]
05
1015202530354045
700 900 1100 1300 1500
Tem p eratu re [°C]
gra
insi
ze [
nm
]

CHAPTER 5
124
Figure 5.25: Subgrain boundaries are visible in the larger grains.
Figure 5.26 TEM bright field images on the left show a porous layer with athickness of approx. 150 nm at 800 °C for half an hour, which densified
towards 100 nm at 1200 °C. SEM pictures at the right show surface topologyof the cross sections.
Substrate
Glue
Substrate
Glue

ZIRCONIA: CRYSTALLINE SINTERING
125
At 900 °C no interaction of the fused silica and the zirconia coating isobserved, while at 1200 °C there is a wetting of grain boundaries (seeFigure 5.26). The boundaries with high energy have a higher tendency to bewetted by the silica. Lattice image pictures in the top right of Figure 5.27show two geometrically (energetically) different boundaries where the cleardifference in wetting can be seen. At 800 °C the coating is not fully sintered,the carbon distribution shows the pores in Zirconia. The difference inintensity of the zirconia map alone would not be enough because it is alsoaffected by the local thickness of the sample.).
Figure 5.27: Elemental mapping was done by Energy Filtered TEM. Red -Silicon on L23 edge at 99 eV, blue - Zirconia on M45 edge at 130 eV, green -
Carbon on K edge at 284 eV.

CHAPTER 5
126
5.4. DISCUSSION
Amorphous materials sinter by viscous flow and crystalline materials sinterby diffusion. Consequently, the dynamic paths for the material and therelationship between the rate of transport and the driving force are quitedifferent6. However, very little information is available on the kinetics ofthin film sintering. It was shown previously that films densify faster thanbulk material, even though the film has lower surface area6. This is contraryto a well accepted model, which predicts that a film will sinter more slowlythan an unconstrained gel, since a film can shrink only in the directionperpendicular to the substrate7.
For amorphous systems it is known that upon heating three regions can beobserved8. At the lowest temperatures physically absorbed water will beremoved, but the shrinkage is only small7. This may be due to the linearstrain caused by changing of the surface energy8:
(5.2)
where � is the Poisson’s ratio, E the Young’s modulus, S the surface area, �the skeletal density and ��� the change in specific surface energy. For silicathis has only a small influence (approximately 0.5%)8, but with zirconia andits much smaller particles the influence is even observed at very lowtemperatures. For temperatures to 150 °C, values of � =0.2, E=15GPa,S=2x10⁶m2/g, � =1.31g/cm3 and ��� =0.001 J/m2 result in a value ofapproximately 15%. At higher temperatures continued desorption thatincrease surface energy should result in additional capillary strain of lessthan 1%, which represents a minor contribution to the shrinkage.
In the temperature range up to 500 °C, polymerization, both within and onthe surface of the inorganic skeleton, and structural relaxation, anirreversible process in which the free energy decreases through bondrestructuring or rearrangements result in a large shrinkage9. According toXRD graphs already some crystallization starts around temperatures of 600°C and at higher temperatures this is followed by grain growth and adensity increase towards 100 %.
Given a microstructural model, it is possible to relate the change in surfacearea to the overall change in dimensions. Frenkel10 suggested that the rateof densification could be found by equating the rate of change in surface
(1 )S
E
� ���� ��

ZIRCONIA: CRYSTALLINE SINTERING
127
energy to the rate of energy dissipation as was described in Chapter 4. Theviscosity of a material decreases, and the coupled shrinkage rate of thelayer increases upon increasing temperature. This results in a very highdensification rate, much higher than densification of crystalline materials.Because the values after 1 minute of sintering already show somecrystalline phases the viscous flow must have taken place earlier. At atemperature of 800 °C this leads to a value for the viscosity (using � is 0.3J/m2 )11 between 10-7 and 10-10 Pa.s, depending on the initial shrinkage rate.These values are rough estimates because of the lack of measurements withshorter sintering times, but the values are of the right order of magnitude(e.g. 10-7 Pa.s for silica at 800 °C 12). Also from silica it is known that theviscosity decreases as the hydroxyl content increases13, which could be ofimportance because the zirconia layer loses its hydroxyl groups during theprocess.
During the first part the zirconiumhydroxide is transformed tozirconiumoxide and water, and concurrently, the particles may growtogether to larger grains. This second part of the process is the growth ofthe crystalline grains. Crystallization within grains of the layer can beconcluded from XRD-measurements. The grain growth can be described by:
(5.3)
where Gt is the instantaneous grain size at time t, G0 the initial grain sizeand n a constant dependent on the agglomerate size, B a constant close tounity, D0 diffusivity and QGB activation energy for grain boundarydiffusion.
The constant n must be determined experimentally (theoreticallyconsiderations yield a value of 214). Fitting the equation to the measureddata can lead to the determination of n. Previous experiments4 have shownthat it usually lies between 2 and 4. With the use of this relation (with QGB
is 350 kJ, D0 is 4.85*10-5 m2/s13) the value for n can be calculated. This isdone for the second part of the 1100 °C and 1200 °C curves (at lowertemperatures the grain growth is too slow to be observed). The value for nis 2.3 and 2.1, respectively. These values agree reasonably with the theory,which predicts a value of 2 for very homogeneous materials.
A model was developed in which the laser is allowed to heat both the sol-gel layer and the substrate. One conclusion that can be made is that the
0 0 expn n GBt
QG G BD t
kT
� �� �
� �� �

CHAPTER 5
128
coupling of the laser into the sol-gel surface layer can be neglected whenthe layer is sufficiently small (about 0.2 � m).
5.4.1. Particle growth
The average grain size in the samples was determined by applying amethod known as the linear intercept method. It makes use of a line ofknown length L drawn over the surface of the samples. The average grainradius R is a direct measure from the number of intersections N of this linewith a grain boundary, according to
(5.4)
The systematic relative error /R R� made by the fact that the lines mostlystart and end within a grain is approximated by
(5.5)
To reduce the systematic error a number of N* lines have to be drawn overthe surface of the samples, each resulting in a particular value Ri and error�
Ri for the particle size. The most probable error or standard deviationR� in the average particle size is then given by
(5.6)
The grain sizes as a function of the temperature are plotted in Figure 5.14.Two regimes can be distinguished in the sintering process: the first inwhich particle growth takes place very fast and final sizes are reached, andthe second regime with slow growth, if occurring at all.
Reason for the growth to slow down after a certain sintering time cannot bethe arrival at a 100% density, which would stop the viscous flow.Measurements show that before and after the transition of the first to thesecond regime the density nearly has the same value. For both pre-sinteredstarting samples with an initial size of 9.5 nm and 30 nm, the densitydifference between before and after the transition respectively is just a fewpercent.
3
4
LR
N�
2
20.25R
R N
���
*
2 1/ 2
1*
[ ( ) ]N
ii
RR
N��
� �
�

ZIRCONIA: CRYSTALLINE SINTERING
129
The transition cannot be caused either by a changeover from theintermediate to the final sintering stage, because at least the samples withan initial particle size of 30 nm already have passed the intermediate stageduring the pre-sintering for their production.
Furthermore, transformation of tetragonal zirconia to the monoclinic phasecannot result in the transition, as can be observed from diffractionmeasurements. These measurements show that after 30 minutes sintering ata temperature of 800 °C, both phases coexist in comparable concentrations.So from this point of view there is no reason for the grain growth to slowdown that dramatically in the second regime of the sintering at 800 °C.Additionally, the starting sample with a size of 9.5 nm already hasundergone the t-m transformation before it has reached the second regime.Measurements in the next paragraph show that zirconia, sintered for 30minutes at 1000 °C, mainly has the monoclinic phase, while the averagegrain size is smaller than that of zirconia in the first regime sintered at 1200°C.
A possible explanation is to assign the first and second regime to fastamorphous particle growth by viscous flow and slow crystalline graingrowth by diffusion, respectively. The reason of the transition from the firstto the second sintering regime is probably the loss of hydroxyl groups inthe zirconia by condensation after which crystallization takes place.
However, the boundaries between different particles are not visible in thecase of a 100% dense amorphous material as can be seen in chapter 4.Brinker15 shows that in the first regime the boundaries are visible betweenthe particles in locally fully dense locations in the material.
The length of the first regime is of the order of a few minutes and appearsto be longer for higher sintering temperatures, but the dependence is notstrong. The length is independent of the initial particle size.
A faster particle growth in the first regime seems to be achievable by usinga smaller initial size and a higher sintering temperature. Nevertheless, theinitial size does not influence the final size. The final average particle size isaccording to the figure exclusively dependent on the sintering temperature,where a higher temperature results in a bigger average size.
The transition from the first to the second regime is not abrupt, whichindicates that in the zirconia layer not all the material undergoes the

CHAPTER 5
130
transformation simultaneously. Low concentrations of substrate ionsdiffusing into the film may influence the diffusion of ions in the filmconsiderably. The assumption that the second sintering regime correspondsto crystalline sintering can be verified by fitting the data in the theoreticalmodel of crystalline sintering in the final sintering stage, as described inChapter 2. For that purpose, the graphs of Figure 5.18 are plotted in Figure5.28, but for longer sintering times in the second regime and with the mostprobable errors in the grain size.
The slope of the 1100 °C line is (4.4 ±1.0)10-2 m3/s. Using equation (5.3)with n=3, the activation energy for grain boundary diffusion can becomputed: QGB = 395 kJ/mol. The slope of the 1200 °C line is (22.0 ± 1.5)10-2
m3/s and QGB = 404 kJ/mol, which agrees very well with the literaturevalue of Zr02: 300-400 kJ/mol 4. The constant B in equation(5.3) was taken 1but is not very important since it is outside of the exponent so it does notinfluence QGB much.
Figure 5.28: G3 versus sintering time(minutes) to verify the law for graingrowth.
For a sintering temperature of 1200 °C steady grain growth is observable,whereas for the lower temperatures the growth is too small or insignificantwithin one hour of sintering. The value of n can be calculated using relation(5.3) with QGB = 350 kJ, Do = 4.85·10-5 m2s-1, T = 1473 K, and B = 1. Gn(t) canbe described by a linear equation in t. The found value of n is 2.25 � 0.05,

ZIRCONIA: CRYSTALLINE SINTERING
131
This value agrees with theory, predicting a value of two for veryhomogeneous materials where grain growth is the result of grain boundarydiffusion. The second period can thus be explained by crystallization of thezirconia layer.
5.5. CONCLUSIONS
Ellipsometry can be used to calculate layer thickness and density in sol-gelderived zirconia layers, but only when the density is high enough and thematerial is free of hydroxyl groups. Constant power with variable laserbeam velocity gives very reliable sintering predictions. Constant fluence isnot as precise but allows a good approximation. Low fluences are notreliable at high powers.
Full density in sol-gel derived coatings can be obtained when applyingtemperatures higher than 1000 °C. The sintering of sol-gel coatings can bedivided into two parts: The initial part is governed by viscous sintering.The densification rate is very quick, resulting in an almost instantaneousgrowth of the grains. At the end of this first period most of the hydroxylgroups will be lost and crystallization has taken place. The second partexists of grain growth in the zirconia coating. This grain growth isgoverned by grain boundary diffusion.
5.6. REFERENCES:
1 T. Chraska, A. H. King, and C. C. Berndt, Materials science and engineering A286, 169-178 (2000).
2 R. C. Garvie, R. H. Hannink, and R. T. Pascoe, Nature 258, 703 (1975).3 B. D. Cullity, Elements of X-ray diffraction (Addison-Wesley, Reading, MA, 1978).4 A. S. Edelstein and R. E. C. Cammarata, Nanomaterials Synthesis, Properties and
Applications (Institute of Physics Publishing, Bristol, 1996).5 R. C. Garvie, Journal of Physical chemistry 69, 1238-1343 (1965).6 C. J. Brinker and S. P. Muhherjee, Thin Solid Films 77, 141-148 (1981).7 F. Orgaz and H. Rawson, Journal of Non-Crystalline Solids 82, 57-68 (1986).8 C. J. Brinker, G. W. Scherer, and E. P. Roth, Journal of Non-Crystalline Silids 72,
345-368 (1985).9 G. W. Scherer, Relaxation in Glasses and Composites (Wiley, New York, 1986).10 Y. T. Frenkel, J. Phys. USSR 9, 385-391 (1945).11 W. D. Kingery, Journal of the American Ceramic Society 42, 6-10 (1959).

CHAPTER 5
132
12 A. Napolitano, J. H. Simmons, D. H. Blackburn, and R. E. Chidester,J.Res.Natl.Bur.Stand 78A, 323-329 (1974).
13 G. Hetherington, K. H. Jack, and J. C. Kennedy, Physics and Chemistry ofGlasses 5, 130-136 (1964).
14 J. G. Byrne, Recrystallization and Grain Growth (Macmillan, 1965).15 C. J. Brinker and G. W. Scherer, Sol-Gel Science (Academic Press, 1990).
16 H.T. Rijnten, Zirconia, PhD thesis. (1971).
17 P.D.L. Mercera, Zirconia as a support for catalysts, PhD thesis. (1991).
18 M.M.R. Boutz, Nanostructured tetragonal zirconia ceramics, PhD thesis. (1993).
19 B. Kerkwijk, Wear and friction of nanostructured zirconia and alumina ceramics andcomposites, PhD thesis. (1999).
20 F.C.M. Woudenberg, Nanostructured oxide coatings via emulsion precipitation, PhDthesis. (2001).