university of groningen the restriction endonuclease
TRANSCRIPT
University of Groningen
The Restriction Endonuclease Cleavage Map of Rat Liver Mitochondrial DNABakker, H.; Holtrop, M.; Terpstra, P.
Published in:Biochimica et Biophysica Acta %28BBA%29 - Nucleic Acids and Protein Synthesis
DOI:10.1016/0005-2787(77)90214-3
IMPORTANT NOTE: You are advised to consult the publisher's version (publisher's PDF) if you wish to cite fromit. Please check the document version below.
Document VersionPublisher's PDF, also known as Version of record
Publication date:1977
Link to publication in University of Groningen/UMCG research database
Citation for published version (APA):Bakker, H., Holtrop, M., & Terpstra, P. (1977). The Restriction Endonuclease Cleavage Map of Rat LiverMitochondrial DNA. Biochimica et Biophysica Acta %28BBA%29 - Nucleic Acids and Protein Synthesis,474(1). https://doi.org/10.1016/0005-2787(77)90214-3
CopyrightOther than for strictly personal use, it is not permitted to download or to forward/distribute the text or part of it without the consent of theauthor(s) and/or copyright holder(s), unless the work is under an open content license (like Creative Commons).
The publication may also be distributed here under the terms of Article 25fa of the Dutch Copyright Act, indicated by the “Taverne” license.More information can be found on the University of Groningen website: https://www.rug.nl/library/open-access/self-archiving-pure/taverne-amendment.
Take-down policyIf you believe that this document breaches copyright please contact us providing details, and we will remove access to the work immediatelyand investigate your claim.
Downloaded from the University of Groningen/UMCG research database (Pure): http://www.rug.nl/research/portal. For technical reasons thenumber of authors shown on this cover page is limited to 10 maximum.
Download date: 01-04-2022

61
Biochimica et Biophysica Acta, 474 (1977) 61--68 © Elsevier/North-Holland Biomedical Press
BBA 98790
THE RESTRICTION ENDONUCLEASE CLEAVAGE MAP OF RAT LIVER MITOCHONDRIAL DNA
A.M. KROON, H. BAKKER, M. HOLTROP and P. TERPSTRA
Laboratory of Physiological Chemistry, State University, Groningen (The Netherlands)
(Received June 1st, 1976)
Mitochondrial DNA from rat liver contains six sites for cleavage by the restriction endonucleases Hind III and EcoRI. A large stretch of DNA, com- prising about 40% of the mitochondrial genome is not cleaved by either of the enzymes; eight cleavage sites are located on a DNA stretch of 35% of the genome length suggestive of an unequal distribution of the A • T basepalrs over the molecule. The number of Hind III and Eco R I fragments is much higher than reported for other mammalian mitochondrial DNAs up to now.
Introduct ion
Many of the initial observations with respect to mitochondrial nucleic acid and protein synthesis have been made using rat liver mitochondria as the exper- imental system [1]. With respect to mitochondrial DNA structure, replication and transcription, attention has recently been paid primarily to cultured mam- malian cells and information about the number of cleavage sites for the restric- t ion endonucleases stems mainly from studies with cells in tissue culture. In these studies it has been found that mtDNA from monkey-, mouse- and human cells is cleaved into one large fragment and one or two small fragments by the endonucleases Eco R I and Hind III [2,3]. This pattern of fragmentation by a single enzyme is not quite suitable for physical mapping of mitochondrial gene products by hybridization procedures since the resolution is limited while one fragment contains 80--90% of the genome length, so that double digestion should be indicated. Because of our interest in studying the biogenesis of mito- chondria in laboratory animals, we have treated rat liver mitochondrial DNA with the restriction endonucleases Eco R I and Hind III. I t is reported here that rat liver mitochondrial DNA contains six cleavage sites for either of the enzymes. The physical map of these fragments is presented.
62
Methods
Preparation of mitochondrial DNA from rat liver Male albino rats (Wistar strain) weighing about 120 g were used after fasting
overnight. Six livers were pooled, cut into small peices with scissors and homo- genized with a glass-teflon Potter Elvehjem homogenizer using 0.25 M sucrose as the medium. Mitochondria were prepared by differential centrifugation as described previously [4]. The final mitochondrial pellet was resuspended to a volume of 12 ml in a medium containing 50 mM Tris buffer, 10 mM NaCl and 10 mM EDTA, pH 7.5. The further procedure for treating the mitochondria and isolating the closed circular fraction of the mtDNA was exactly as described by Bogenhagen and Cl'ayton [5], except that the lower band of the CsC1/ethidium bromide density gradient was collected by suction into a plastic syringe after puncturing the centrifuge tube 1--2 mm below the band. These operations were performed under ultraviolet light to visualize clearly the DNA bands by their fluorescence emission. The DNA from 3 or 6 bands was com- bined, the ethidium bromide was removed by three successive extractions with an equal volume of isoamyl alcohol, the DNA solution was then diluted twice with 10 mM Tris/0.1 mM EDTA, pH 7.5 and the DNA precipitated in the cold with 2 vols. ethanol and 0.1 vol. of 1 M sodium acetate, pH 5.0. The DNA pre- cipitate was collected by centrifugation {30 min, 15 000 × g) and dissolved in a small volume of 10 mM Tris/0.1 mM EDTA. The yield from six livers was about 250 pg mtDNA with an 230 : 260 : 280 absorbance ratio close to 0.5 : 1.0 : 0.5.
Enzymatic fragmentation and gel electrophoresis of mitochondrial DNA from rat liver
The rat liver mitochondrial DNA was digested with the restriction endo- nucleases Eco R I and/or Hind III at 37°C for different times in a medium con- taining 10 mM Tris • HC1, 10 mM MgCl:, 150 mM NaC1 and 5 mM mercapto- ethanol; the final pH was 7.6. Eco 1~ I and Hind III were obtained from Miles Laboratories Ltd. The Eco R I was diluted 1 : 50 from a stock solution with 10 mM sodium phosphate buffer, pH 7.0, containing 7 mM mercaptoethanol, 1 mM EDTA, 200 mM NaCl and 0.2% (v/v) NP40 (=Nonidet). The reactions were stopped by adding 0.3 vol. of a 70% sucrose solution in 100 mM EDTA, pH 7.0.
Gel electrophoresis was performed using slabgels of 20 × 30 cm, consisting of a small sealing layer of 10% acrylamide, a layer of 8--10 cm of 3% acrylamide and a layer of about 20 cm of 0.7% agarose. The gels were dissolved in a medium containing 40 mM Tris/acetate buffer, pH 7.8, 20 mM sodium acetate and 2 mM EDTA. Electrophoresis was for 15 h at room temperature and 120 V in the same buffer. The further details, the handling and photography o f the slabgels were as described by Sanders et al. [6].
Results
Fig. 1 shows the fragment patterns of mtDNA from rat liver after fairly com- plete (Fig. 1A and C) and partial {Fig. 1B and D} digestion with the restriction

63
Fig. 1. S labge l e l e c t r o p h o r e s i s o f f r a g m e n t s o f m i t o c h o n d r i a i D N A f r o m r a t l iver. S a m p l e s o f 3 - - 5 ~g m i t o c h o n d r i a l D N A w e r e t r e a t e d w i t h v a r y i n g a m o u n t s o f r e s t r i c t i o n e n d o n u c l e a s e a t 37~C fo r d i f f e r e n t t i m e s a n d e l e c t x o p h o r e s e d o n a g a ~ o s e a c r y l a m i d e s iabgels . The de ta i l s are g iven in t he M e t h o d s s e c t i o n . R e p r e s e n t a t i v e p a t t e r n s f r o m o n e s l abge l w i t h 1 6 s lo t s are s h o w n . T h e p o s i t i o n s o f t h e b a n d s in t h e gels are f u r t h e r i n d i c a t e d b y the b a r s in t h e c o l u m n s n e x t t o t he p h o t o g r a p h s . The i n t e r r u p t e d l ines s h o w the p o s i t i o n s o f pa r t i a l s in A a n d C a n d o f e n d f r a g m e n t s in B a n d D. (A) " c o m p l e t e " d iges t o f E c o R I; (B) p a r t i a l d iges t o f E c o R I; (C) " c o m p l e t e " d iges t o f H i n d I n ; (D) p a r t i a l d iges t o f H i n d I I I ; (E) C o m p l e t e E c o R I d iges t o f N. crassa m i t o c h o n d r i a i D N A . T h e m o l e c u l a r we igh t s o f t h e f r a g m e n t s N c A t o N c K are 1 9 0 0 0 , 1 0 5 0 0 , 9 0 0 0 , 4 5 0 0 , 3 4 5 0 , 2 8 5 0 , 2 7 0 0 , 2 2 5 0 , 2 0 0 0 , 1 8 7 5 a n d 4 2 5 , r e spec t i ve ly . EP = p a r t i a l f r a g m e n t f r o m E c o R I d iges t ; H P = pa r t i a l f r a g m e n t f r o m H i n d n I d iges t .
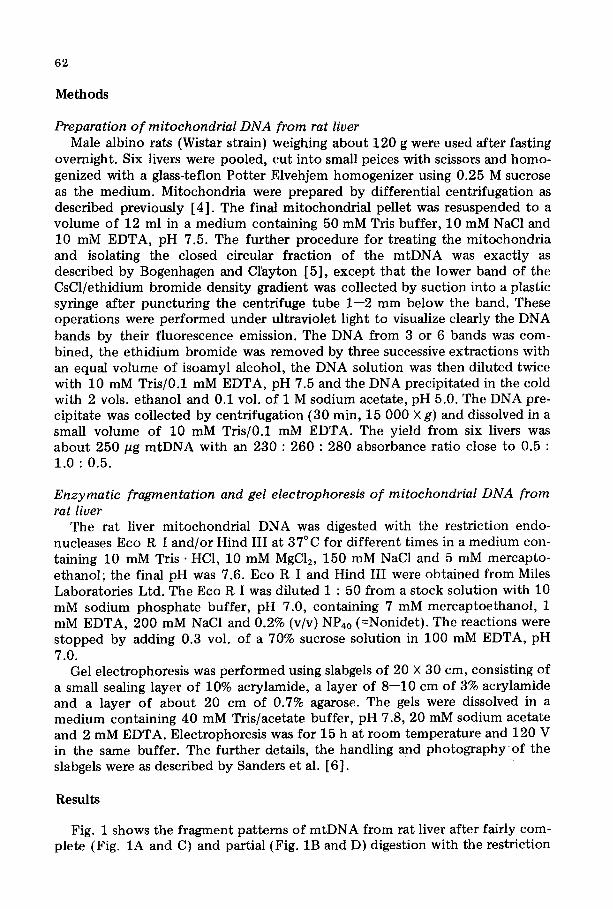
enzymes Eco R I (Fig. 1A and B) and Hind III (Fig. 1C and D). The patterns shown were obtained in the same experiment in which, unfortunately, diges- tion did not go to completion. In Fig. 2 three further gels and densi tometer tracings are shown to illustrate that in the complete digests six end-fragments can be detected in the Eco tt I digest and five in the Hind III digest. No double peaks are present in either case.
The Eco It. I fragments of Neurospora crassa mtDNA [7] and of~b 29 DNA [8] were used for calibration. The molecular weights of the different mtDNA fragments are given in Table I. The length of the Eco R I fragments A to E agrees well with the electron microscopical length measurements of Koike et al.
64
Fig. 2. Slabgel e l e c t r o p h o r e t o g r a m s and d e n s i t o m e t e r t rac ings of f r a g m e n t s of m i t o c h o n d r i a l D N A f r o m ra t liver. (A) Eco R I digest a nd t rac ing of ra t l iver m t D N A ; (B) Hind I I I digest and t r ac ing of r a t liver m t D N A ; (C) Eco R I digest and t r ac ing of Neurospora m t D N A . The a rows at the lef t ind ica te t h e pos i t ion of the t o p o f the gel; the a r rows a t the r ight ind ica te the pos i t ion of the b o u n d a r y b e t w e e n t h e agarose and p o l y a c r y l a m i d e gel layers . F o r f u r t h e r detai ls see t he legend to Fig. 1.
T A B L E I
L E N G T H O F T H E R E S T R I C T I O N E N Z Y M E F R A G M E N T S OF R A T - L I V E R M I T O C H O N D R I A L DNA
For e x p e r i m e n t a l detai ls see the Methods sec t ion .
F r a g m e n t L e n g t h of f r a g m e n t (nuc leo t ide pairs)
Eco R I Hind I I I
A 55O0 595O B 3 5 5 0 3 7 5 0 C 2 6 5 0 2300 D 1 8 0 0 1 9 0 0 E 650 800 F 400 150
E 1 4 5 5 0 1 4 8 5 0
65
[9]. These authors did not report data on the length of a fragment comparable to our Eco R I fragment F. The total length of the fragment is about 14 500 basepairs. This is in good agreement with the 10 × 106 molecular weight of mitochondrial DNA from rat liver [10]. It further excludes gross heterogeneity of the mitochondrial DNA. From Fig. 1B, it can be concluded from the double band between fragments C and D that the two small fragments present in the Eco R I digest must be adjacent to fragment D. Similarly it can be concluded at first glance that the second fragment present in the acrylamide-gel layer in Fig. 1D must be a partial fragment that gives rise to the formation of fragment E on fur ther digestion. The other fragment, F, is too small to be detected by the method used.
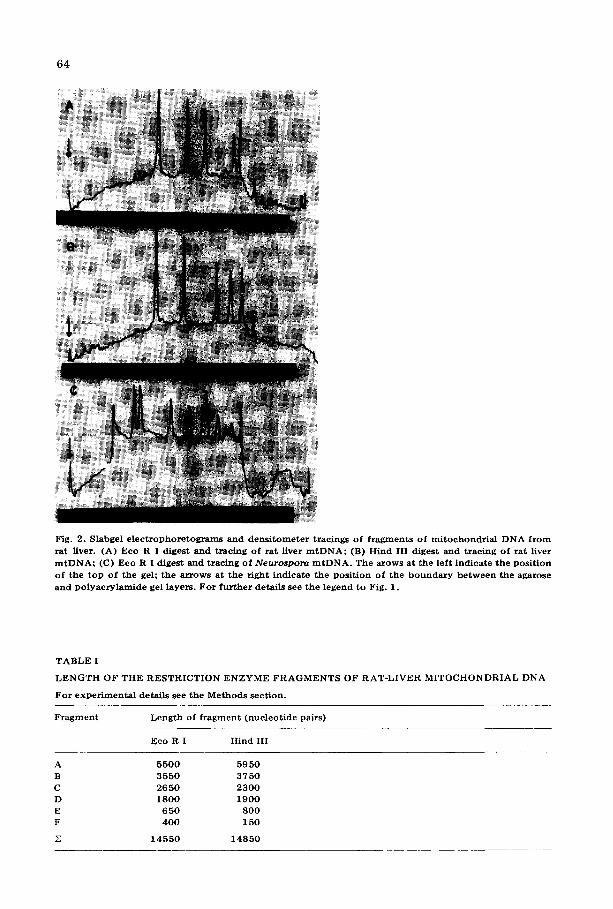
Of course we have considered the possibility that our enzymes were impure and that the higher number of fragments had to be attributed to contaminating endonucleolytic activity. This possibility was excluded by our observations that digestion of ~b 29 DNA and N. crassa mitochondrial DNA with Eco R I gave the expected number of fragments. Moreover, different batches of the enzymes gave exactly the same cleavage patterns. Finally we also prepared mouse liver mitochondrial DNA. We found the same cleavage pattern for this DNA as that previously reported for mouse L cells [2,3] (Fig. 3). Eco R I {Fig. 3B) gives one large and one small fragment, Hind III (Fig. 3C) one large and two small frag- ments. In the cross digest (Fig. 3A) five fragments could be detected.
The order of the fragments on the rat mitochondrial genome has been esti-
Fig . 3 . S labge l e l ec t roph or e s i s o f f ragments o f m i t o c h o n d r i a l D N A f r o m m o u s e liver. Mo use l iver m i t o - chondria l D N A w as prepared f r o m th e l ivers o f 1 5 a l b i n o m i c e by e x a c t l y the s a m e m e t h o d as descr ibed for s ix rat livers in t he M e t h o d s s e c t i o n . S am p le s o f ab ou t 3 ~g D N A were a n a l y z e d o n s labgels . (A) cross diges t o f E c o R I p lus H i n d III ( K 1 - - K S ) ; (B) c o m p l e t e digest o f Eco R I ( E l - - E 2 ) ; (C) c o m p l e t e digest o f H i n d III ( H 1 - - H 3 ) ; (D) C o m p l e t e E c o R I d iges t o f N. crassa m i t o c h o n d r i a l D N A ( N c A - - N c K ) .
66
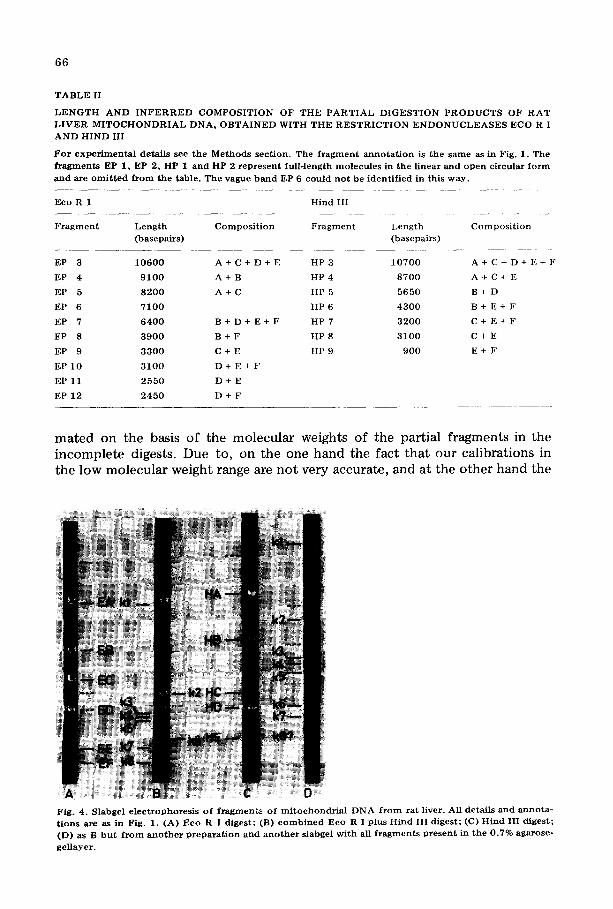
T A B L E I I
L E N G T H A N D I N F E R R E D C O M P O S I T I O N O F T H E P A R T I A L D I G E S T I O N P R O D U C T S O F R A T L I V E R M I T O C H O N D R I A L D N A , O B T A I N E D W I T H T H E R E S T R I C T I O N E N D O N U C L E A S E S ECO R I A N D H I N D I I I
F o r e x p e r i m e n t a l de ta i l s see t h e M e t h o d s sec t ion . The f r a g m e n t a n n o t a t i o n is t he s a m e as in Fig. 1. The f r a g m e n t s EP 1, EP 2, HP 1 a n d HP 2 r e p r e s e n t fu l l - length m o l e c u l e s in t he l inear and o p e n c i rcu la r f o r m
a n d axe o m i t t e d f r o m the table . T h e vague b a n d EP 6 cou ld n o t be i d e n t i f i e d in th i s w a y .
Eco R 1 Hind I I I
F r a g m e n t L e n g t h C o m p o s i t i o n F r a g m e n t L e n g t h C o m p o s i t i o n
(basepa i r s ) (basepa i r s )
EP 3 10600 A+ C+ D+ E HP 3 10700 A + C + D+ E+ F
EP 4 9100 A+ B HP 4 8700 A+ C + E
EP 5 8200 A + C HP 5 5650 B + D
EP 6 7100 -- HP 6 4300 B + E + F
EP 7 6 4 0 0 B + D + E + F HP 7 3 2 0 0 C + E + F
EP 8 3 9 0 0 B + F HP 8 3 1 0 0 C + E
EP 9 3 3 0 0 C + E HP 9 900 E + F
E P 1 0 3 1 0 0 D + E + F
EP 11 2 5 5 0 D + E
EP 12 2 4 5 0 D + F
mated on the basis of the molecular weights of the partial fragments in the incomplete digests. Due to, on the one hand the fact that our calibrations in the low molecular weight range are not very accurate, and at the other hand the
Fig . 4. S labgel e l e c t r o p h o r e s i s o f f r a g m e n t z o f m i t o c h o n d r i a i D N A f r o m ra t l iver . All de ta i l s and a n n o t a - t i ons &re as in Fig. 1. (A) Eco R I d iges t ; (B) c o m b i n e d Eco R I plus H i n d I I I d iges t ; (C) H i n d I I I d iges t ; (D) as B b u t f r o m a n o t h e r p r e p a r a t i o n and a n o t h e r s labgel w i t h all f r a g m e n t s p r e s e n t in t he 0 .7% ag&rose-
ge l layer .

67
difference of only about 400 basepairs between the Hind III fractions C and D, the order of the Hind III fragments could not be estimated unequivocally on this basis. Two possible arrangements were left: ADBFECA and ACBFEDA. For the Eco R I fragments the order of the fragments is ACEDFBA. Table II gives a summary of the data from different experiments that have led to the construction of the physical map of the fragments. Further, we looked for the fragment pattern of a double digest using both enzymes together. The results are shown in Fig. 4. Eight fragments could be detected. It can be concluded that the Hind I I I A and Eco R I A fragments are grossly overlapping. Fragments similar to the Hind III fragments C and E and the Eco R I fragments E and F were present in the cross digest. In a separate experiment we prepared the Eco R I fragments A--D and subsequently cleaved these isolated fragments with Hind III. The following results were obtained: Eco R I A was shortened slightly; Eco R I B gave rise to a fragment of the Hind III C-size and some smaller fragments since two partials could be detected; Eco R I C was cleaved into two almost equal parts. Also, Eco R I fragment D was cleaved, although only one fragment of about 1400 basepairs was recovered.
Discussion
From the data obtained in the different experiments shown above, we have constructed the physical map as illustrated in Fig. 5. The 12 restriction sites of the two enzymes used are divided unequally over t h e genome. 35% of the genome length is not cleaved at all, whereas eight cleavage points are located on a DNA stretch of 32% of the total DNA. Since both enzymes are specific for hexanucleotide pairs containing 4 A • T basepalrs, one might assume that the A • T basepairs are no t randomly distributed over the DNA molecule. This is in agreement with the electron microscopical observations with partially heat- denatured mitochondrial DNA from rat liver [11] and Drosophila melanogaster [12]. Also for lower eukaryotes unequal distribution of AT-basepairs has been reported [6,13,14].
jt Fig. 5. The phys ica l m a p of r a t l iver m i t o c h o n d r i a l D N A .
68
The manner in which rat liver mtDNA is cleaved into six fragments by either of the enzymes renders it more suitable than the animal mtDNAs described so far for further studies on the localization of mitochondrial transcription prod- ucts and other genetic markers such as the origin of replication and the recogni- tion sites for the various polymerases. However, it must be recognized that the small fragments are very difficult to prepare on a sufficient scale and may even be missed completely if inadequate methods for separation of the fragments are used. This is especially inconvenient in case small transcription products such as the mitochondrial tRNAs are to be localized on the mitochondrial genome.
Acknowledgements
These studies were supported in part by a grant from the Netherlands Foundation for Chemical Research (SON) with financial aid from the Nether- lands Organisation for the Advancement of Pure Research (ZWO). The authors wish to thank Professor Dr. F.J. Loomeijer for his interest and advice.
References
1 Kroon, A.M., Agsteribbe, E. and de V~ies, H. (1972) in The Mechanism of Protein Synthes i s and its Regulat ion (Bosch, L., ed.), pp. 539--582, North-Holland, Amsterdam
2 Robberson, D.L., Clayton, D.A. and Morrow, J.F. (1974) Proc. Natl. Acad.Sci. U.S. 71, 4447--4451 3 Brown, W.M. and Vinograd, J. (1974) Proc. Natl. Acad. Sci. U.S. 71, 4617--4621 4 Borst, P., Rut tenberg, G.J.C.M. and Kroon, A.M. (1967) Biochim. Biophys. Acta 149, 140--155 5 Bogenh~gen, D. and Clayton, D.A. (1974) J. Biol. Chem. 249, 7991--7995 6 Sanders, J.P.M., Borst, P. and Weijers, P.J. (1975) Mol. Gem Genet. 143, 53--64 7 Terpstra, P., Hol t rnp, M. and Kroon, A.M. (1976) in The Gentic Funct ion of Mitochondria l DNA
(Saccone , C. and Kroon, A.M., eds.), pp. 111--118, North-Holland, A m s t e r d a m 8 Streeck, R.E., Philippsen, P. and Zachau, H.G. (1974) Eur. J. Biochem. 45, 4 8 9 - 4 9 9 9 Koike, K.0 Kobayashi, M. and Tanaka, S. (1975) in DNA Synthesis and its Regulat ion (Goulian, M.
and Hanawalt , P., eds.), pp. 578--585, W.A. Ben|amen, Inc. 10 Borst, P., Annu. Rev. Biochem. (1972) 4 1 , 3 3 3 - - 3 7 6 11 Wolstenholme, D.R., Ki~chner , R.G. and Gross, N.J. (1972) J. Cell Biol. 53, 393~406 12 Peacock, W.J., Brutlag, D., Goldring, E., Appels, It., Hinton, C.W. and Lindsley, D.L. (1974) Cold
Spring Harbou~ Symp. Quant. Biol. 38 ,405 - - 416 13 Terpstra, P., Holtrop, M. and I~oon , A.M. (1975) 10th FEBS Meeting, Paris, Abstracts , 143 14 Bernard, U., Piihler, A. and Kiintzel, H. (1975) FEBS Lett . 60, 119--121