university of huddersfield repositoryeprints.hud.ac.uk/9051/1/mrsadegghianfinalthesis.pdf ·...
TRANSCRIPT
University of Huddersfield Repository
Sadeghian, Mohammad R
A Study of the Significance of Organisational Culture for the successful implementation and operation of Total Quality Management (TQM): A Comparative Study between Iran and the UK
Original Citation
Sadeghian, Mohammad R (2010) A Study of the Significance of Organisational Culture for the successful implementation and operation of Total Quality Management (TQM): A Comparative Study between Iran and the UK. Doctoral thesis, University of Huddersfield.
This version is available at http://eprints.hud.ac.uk/id/eprint/9051/
The University Repository is a digital collection of the research output of theUniversity, available on Open Access. Copyright and Moral Rights for the itemson this site are retained by the individual author and/or other copyright owners.Users may access full items free of charge; copies of full text items generallycan be reproduced, displayed or performed and given to third parties in anyformat or medium for personal research or study, educational or notforprofitpurposes without prior permission or charge, provided:
• The authors, title and full bibliographic details is credited in any copy;• A hyperlink and/or URL is included for the original metadata page; and• The content is not changed in any way.
For more information, including our policy and submission procedure, pleasecontact the Repository Team at: [email protected].
http://eprints.hud.ac.uk/
1
A Study of the Significance of Organisational Culture for the successful
implementation and operation of Total Quality Management (TQM):
A Comparative Study between Iran and the UK
Mohammad Reza Sadeghian
A Thesis submitted to the University of Huddersfield in partial
fulfilment of the requirements for the degree of Doctor of Philosophy
The University of Huddersfield
PhD
June 2010
2
Preface
After I graduated from Shekh Bahaei University in Iran, I decided to study abroad. I took
a one-year break and came to the UK. This choice was based on the respect which British
education has enjoyed over decades in Islamic Republic of Iran. I decided to embark on a
Master‟s programme, and having succeeded in it, I realised that I had the potential for
further research work and possibly an academic career. This brought me to the PhD
programme under the supervision of Dr. Ralph Rollins, Dr. Graham Worsdale, and
Professor David Smith at Huddersfield University.
3
Acknowledgments
The successful accomplishment of a project such as doctoral dissertation is not a personal
and individual task. It would have been almost impossible for me to overcome the
challenges of this project without the help, encouragement, support and motivation that I
received from these wonderful and supportive people. Indeed, this achievement is made
possible because of them.
I would like to thank and appreciate Dr. R. Rollins, and Dr. G. Worsdale for their efforts
in supervising this research. Professor David Smith has been always very helpful and
supporting me during my study at Huddersfield University, so I would like to thank him
very much.
Support and encouragement of my family were the most important assets for me in doing
my research without any tension or pressure. Dad, mom and my wife you were always
supportive.
Finally I need to thank all my friends who helped me in one way or another. Your
encouragement was the best thing to help me accomplish my research project. Special
thanks go to Farzad Ardalan, Vahid Sadeghian and Mohammad Reza Dalvi.

4
Abstract
Iranian businesses like all others around the world need to survive and grow in the global
marketplace. To facilitate this, they need true executive commitment to the provision of
high quality products and services. An established way to begin this important
development process is to implement Total Quality Management (TQM). By applying
TQM in Iranian organisations they can begin to achieve a high standard of quality
products and services at a cost that enables them to compete with their international
competitors.
The purpose of this research, a comparative study, was to investigate the effect of
organisational culture on the successful implementation and sustainability of the
operation of TQM within Iran. In the programme of research data was collected from 50
organisations in Iranian and 40 in the United Kingdom (UK). Senior executives, general
managers and quality managers were interviewed. They also completed comprehensive
questionnaires which identified the issues relating to the implementation and operation of
TQM in their organisations. The research then focused upon problems and barriers to the
introduction, implementation and sustained operation of TQM that were experienced in
Iranian businesses. Specifically issues concerning the relationship between organisational
culture and TQM at all levels of the organization are explored.
The critical issues that this study set out to address relate to the relationships and
interactions that exist within a Quality Management System, organisational culture and
the changes that need to be instigated for success. In his investigations the researcher
divided his study into two parts. Firstly the Hofestede national culture model (2002) was
tested against the organisational culture variables established in work by Denison (2006).
Secondly the Denison organisational variables were used to assess the implication of
culture on the successful implementation and sustained operation of TQM.
The research identified that the implementation and operation of TQM in the
organisations studied in the UK was highly successful whilst in the Iranian organisations
5
such success was identified to be low. In response to this, and based upon the knowledge
and understanding gained from the investigation and analysis, the researcher presents a
proposed framework to aid the successful introduction and implementation of TQM
within an Iranian context.
6
Table of Contents
Chapter One (Introduction) ........................................................................................... 15 1. Introduction ................................................................................................................. 16
1.2. Background .............................................................................................................. 17 1.2.1 The need for the study ........................................................................................... 17 1.2.2 The contribution of the study................................................................................ 19 1.2.3 Research aim and objectives ................................................................................. 22 1.2.4 Research Questions ................................................................................................ 23
1.3 Organisation of the thesis ......................................................................................... 24 Chapter Two (National Culture & Organisational culture) ....................................... 26 2.1 Introduction ............................................................................................................... 27 2.2 Explaining culture ..................................................................................................... 27
2.3 Cultural approach ..................................................................................................... 29 2.4 National culture ......................................................................................................... 30 2.4.1 Language ................................................................................................................. 31
2.4.2 Religion ................................................................................................................... 32
2.5 Hofstede’s Findings ................................................................................................... 32 2.5.1 Power distance ........................................................................................................ 34 2.5.2 Collectivism/ Individualism................................................................................... 35
2.5.3 Femininity/masculinity .......................................................................................... 38 2.5.4 Uncertainty avoidance ........................................................................................... 39
2.6 Discussion of National culture’s dimension ............................................................ 40 2.7 Organisational culture .............................................................................................. 41 2.7.1 Organisational culture dimensions ....................................................................... 43
2.7.2 Organisational culture and leadership................................................................. 49 2.7.3 Organisational culture and managers .................................................................. 51
2.7.4.1 Discussion on culture and organisational culture ............................................ 55 2.7.4.2 Criticisms of the concept of organisational culture ......................................... 59
2.8 Summary .................................................................................................................... 62 Chapter Three (Total Quality Management) ............................................................... 64 3. Introduction ................................................................................................................. 65
3.1. Definition of Quality and Total Quality ................................................................. 65 3.2. Definition of Total Quality Management (TQM) ................................................. 67
3.3. The Quality Gurus ................................................................................................... 69 3.3.1 Deming Philosophy ................................................................................................ 70
3.3.2 Joseph Juran........................................................................................................... 72 3.3.3 Philip Crosby .......................................................................................................... 74 3.3.4 Armand Feigenbaum ............................................................................................. 76 3.3.5 Kaoru Ishikawa ...................................................................................................... 77 3.4. Evolution of Total Quality Management ............................................................... 78
3.5 Quality management in the global context ............................................................. 81 3.6 TQM in the Middle East........................................................................................... 83 3.7 TQM in Iran: historical perspective ....................................................................... 85 3.8 Summary .................................................................................................................... 87 Chapter Four (TQM Implementations and operations) ............................................. 88 4. Introduction ................................................................................................................. 89
7
4.1 The Malcolm Baldrige Quality Award ................................................................... 90 4.2 The European Quality Award ................................................................................. 91 4.3 The Deming Prize ...................................................................................................... 95
4.4 The Canadian Quality Award ................................................................................. 97 4.5 Dubai Government Excellence................................................................................. 99 4.6 Singapore Quality Award......................................................................................... 99 4.7 Australian Quality Award ...................................................................................... 101 4.8 Models Proposed by Quality Experts and Consultants ....................................... 102
4.9 Quality Factor of TQM Implementation .............................................................. 108 4.9.1 Introduction .......................................................................................................... 108 4.9.2 Implementation factors ....................................................................................... 108 4.9.2.1 Leadership ......................................................................................................... 108
4.9.2.2. Employee involvement ..................................................................................... 111 4.9.2.3 Empowerment ................................................................................................... 114 4.9.2.4 Training and Education ................................................................................... 115
4.9.2.5 Middle management role .................................................................................. 118
4.9.2.6 Reward and Recognition .................................................................................. 119 4.9.2.7 Team work ......................................................................................................... 121 4.9.2.8 Strategic Planning ............................................................................................. 122
4.9.2.9 System and process management .................................................................... 123 4.9.2.9.1 Accredited quality management systems ..................................................... 123
4.9.2.9.2 Organising for Quality .................................................................................. 124 4.9.2.9.3 Process management ...................................................................................... 126 4.9.2.9.4 Benchmarking ................................................................................................ 127
4.9.2.9.5 Self-Assessment .............................................................................................. 128 4.9.2.9.6 Cost of Quality................................................................................................ 129
4.9.2.9.7 Quality Control Techniques .......................................................................... 130 4.9.2.9.8 Customer focus/satisfaction .......................................................................... 131
4.10 Discussion of TQM Literature ............................................................................. 132 4.10.1 Criticisms of Total Quality Management ........................................................ 132 4.10.2 TQM and Challenges to Management theory ................................................. 135
4.10.2 Organisational culture and TQM ..................................................................... 138 4.10.3 Social, Cultural and Economic Environment in TQM ................................... 142
4.11 Summary ................................................................................................................ 144 Chapter Five (Methodology) ........................................................................................ 145
5. Introduction ............................................................................................................... 146 5.1 Research Methodology and Paradigm .................................................................. 146 5.1.1 Quantitative Methodology................................................................................... 150 5.1.2 Qualitative Methodology ..................................................................................... 151 5.1.3 Multi-methods approach (Triangulation).......................................................... 153
5.2 Approaches to the Research ................................................................................... 155 5.2.1 The research design and the rationale behind this choice................................ 157 5.3 Population studied .................................................................................................. 159 5.4 Sampling .................................................................................................................. 159 5.4.1 Type of Sample:.................................................................................................... 160 5.5 Research Sample selection ..................................................................................... 163
8
5.6 Collection methods .................................................................................................. 165 5.6.1 Interview ............................................................................................................... 165 5.6.1.1 Interview data collection .................................................................................. 166
5.6.1.2 Interview analysis.............................................................................................. 169 5.6.1.3 Interview Analysis method ............................................................................... 170 5.6.1.4 Final Steps.......................................................................................................... 173 5.6.2 Questionnaire ....................................................................................................... 174 5.7 Designing the Research Questionnaire ................................................................. 176
5.7.1 The content of the Questionnaire ....................................................................... 177 5.7.2 Piloting the Questionnaire ................................................................................... 180 5.7.3 Validity .................................................................................................................. 180 5.7.4 Reliability .............................................................................................................. 182
5.8 Research Hypotheses and Proposed Model .......................................................... 185 5.8 Secondary data sources .......................................................................................... 189 5.9 Summary .................................................................................................................. 190
Chapter Six (Interview analysis) ................................................................................. 191
6.1 Introduction ............................................................................................................. 192 6.2 Comparative evaluation of Interview analysis ..................................................... 193 6.3 TQM Implementation ............................................................................................. 198
6.4 Summary .................................................................................................................. 216 Chapter Seven (Iranian Questionnaire Analysis) ...................................................... 218
7.1 Introduction ............................................................................................................. 219 7.2 Demographic information ...................................................................................... 219 7.3 Descriptive statistics................................................................................................ 221
7.4 Hypothesis testing .............................................................................................. 222 7.5 Correlation between variables ............................................................................... 223
7.6 Regression Analysis (Iranian Organisational culture) ........................................ 225 7.7 cultural approach and Iranian organisation ........................................................ 226
7.9 National culture has significant effect on organisational culture (mission,
adaptability, involvement and consistency). ............................................................... 228 7.10 Organisational culture as independent variable ................................................ 231
7.11Conclusion .............................................................................................................. 239 Chapter Eight (The UK Questionnaire Analysis) ...................................................... 240
8.1 Introduction ............................................................................................................. 241 8.2 Demographic information ...................................................................................... 241
8.3 Descriptive statistics................................................................................................ 242 8.4 Hypothesis testing ................................................................................................... 244 8.5 Correlation between variables ............................................................................... 245 8.6 Regression Analysis ................................................................................................ 246 8.6.1 Cultural approach and British organisation ..................................................... 248
8.6.3 Organisational culture as independent variable ............................................... 252 8.7 Conclusion ............................................................................................................... 261 Chapter Nine (Discussion) ............................................................................................ 262 9.1 Introduction ............................................................................................................. 263 9.1 Overview of National Culture, Organisational Culture and TQM .................... 263 9.1.1 National culture in the United Kingdom and Iran ........................................... 264
9
9.2 The study of organisation culture and TQM in the United Kingdom and Iran 265 9.2.1 Adaptability (Chapter 3) ..................................................................................... 266 9.2.2 Mission (chapter 3) .............................................................................................. 267
9.2.3 Involvement (Chapter 3) ..................................................................................... 268 9.2.4 Consistency (Chapter 3) ...................................................................................... 269 9.3 TQM Implementation ............................................................................................. 270 9.4 Result of organisational culture and TQM ........................................................... 272 9.5 Discussion on the statistical findings ..................................................................... 273
9.5.1 Correlation analysis ............................................................................................. 273 9.5.2 Regression analysis .............................................................................................. 274 9.6 Discussion of the finding and literature ................................................................ 276 9.6 Summary .................................................................................................................. 278
Chapter Ten (conclusion) ............................................................................................. 281 10. Introduction ............................................................................................................. 282 10.2 Conclusions ............................................................................................................ 283
10.3. Research Contributions to knowledge ............................................................... 295
10.4 Recommendation................................................................................................... 296 10.5 Research limitations and suggestions for research ............................................ 300 References ...................................................................................................................... 301
Appendix 1 ..................................................................................................................... 332 Appendix 2 ..................................................................................................................... 341
Appendix 3 ..................................................................................................................... 352
10
List of Figures
Figure 2.1 There levels of uniqueness in human mental programmimg (Hofstede,
2001)..................................................................................................................................28
Figure 2.2 Factors affecting national culture (Brooks, 2003, 266)..............................31
Figure 2.3 Levels of cultures (Chatman, and Jehn (1994)...........................................41
Figure 2.4 Levels of organisational culture (Schein, 1992, 236)...............................45
Figure 2.5 Denison's organisational culture model (www.denisonconsulting.com,
2006)..................................................................................................................................47
Figure 2.6 Individualism and collectivism source (Hofstede, 2001, 249)....................53
Figure 2.7 Culture frame work (Kanji, 2002)...............................................................54
Figure 3.1 Plan-do-check-act (Evans and Lindsay, 2001)............................................69
Figure 4.1 The structure and criteria of the EFQM model (Dahlgaard, 2010)..........92
Figure 4.2 A structure for building quality into people and organisation excellence
(Dahlgaard, 2002, 4).........................................................................................................94
Figure 4.3 Canadian framework for business excellence (Vokurka, 2000)
............................................................................................................................................97
Figure 4.4 Singapore quality award frameworks (SQA, 2009).................................100
Figure 4.5 Australian quality criteria framework (Canchick, 2001)........................101
Figure 4.6 Oakland's model for TQM.........................................................................102
Figure 4.7 Grahn's five drivers of TQM model (Quality progress, 1995, 65)..........106
Figure 4.8 Stamatas’ five assumption required to implement TQM (Stamatis,
1997)................................................................................................................................107
Figure 4.9 The quality training cycle (Vermeulen and Crous, 2000)......................117
Figure 5.1 Approach to the research............................................................................155
Figure 5.2 Selecting a probability sampling technique (Saunders et al., 2007)........162
Figure 5.3 Production classification.............................................................................178
Figure 5.4 Hypothesis model.........................................................................................188
Figure 7.1 Relationship between national culture and organisational culture........226
Figure 7.2 Effect of national culture on organisational culture (Mission,
Adaptability, Involvement, and Consistency).............................................................228
Figure 7.3 Might organisational culture effect on TQM............................................231
Figure 7.4 The effect of organisational culture on TQM implementation...............239
Figure 8.1 Relationship between national culture and organisational culture........248
Figure 8.2 National culture has significant effect on organisational culture...........252
Figure 8.3 Might organisational culture effect on TQM............................................252
Figure 8.4 The effect of organisational culture on TQM implementation................261
Figure 9.1 National culture in the UK..........................................................................264
Figure 9.2 National culture in the Iran........................................................................264
Figure 9.3 Measurement of organisational culture variables in the UK..................265
Figure 9.4 Measurement of organisational culture variables in Iran.......................265
Figure 9.5 Adaptability variables in the UK ..............................................................266
Figure 9.6 Adaptability Variables in Iran...................................................................266
Figure 9.7 Mission variables in the UK........................................................................267
Figure 9.8 Mission variables in Iran............................................................................267
Figure 9.9 Involvement variables in the UK...............................................................268
Figure 9.10 Involvement variables in Iran..................................................................268
11
Figure 9.11 Consistency variables in the UK...............................................................269
Figure 9.12 Consistency variables in Iran...................................................................269
Figure 9.13 TQM implementation in the UK..............................................................270
Figure 9.14 TQM implementation in Iran...................................................................270
Figure 9.15 The United Kingdom.................................................................................272
Figure 9.16 I.R. Iran......................................................................................................272
Figure 10.1 Relationship between organisational culture and TQM........................288
Figure 10.2 Shows the concept develops from regression analysis on the effect of
organisational culture on TQM implementation in the UK.......................................292
Figure 10.3 Shows the concept develops from regression analysis on the effect of
organisational culture on TQM implementation in Iran...........................................293
12
List of Tables
Table 2.1 Power distance index (PDI) values for the UK and Iran.............................35
Table 2.2 Individualism index (IDV) values for the UK and Iran..............................37
Table 2.3 IDV- scores and PDI- scores for relevant countries (Hofsted, 2001)..........37
Table 2.4 masculinity index (MAS) values for the UK and Iran.................................39
Table 2.5 Uncertainty avoidance index (UAI) values for the UK and Iran................40
Table 4.1 Edited by subcommitte of implementation award for Deming prize
(Revisio, 1992)..................................................................................................................96
Table 4.2 Principles and concepts of "pyramid" model (Kanji et al., 1993)............103
Table 4.3 TQM and other management theory...........................................................136
Table 5.1 Features of the two main approaches (Hussey and Hussey, 1997, 54).....148
Table 5.2 Strengths and weaknesses of positivistic and phenomenological
approaches (Amaratunga et al., 2002, 20)...................................................................149
Table 5.3 Impact of various factors on choice of probability sampling techniques
(Saunder et al., 2007).....................................................................................................161
Table 5.4 Reliability coefficient for the dependent variable (TQM implementation in
Iran).................................................................................................................................183
Table 5.5 Reliability coefficient for the independent variable (National and
organisational culture in Iran)......................................................................................183
Table 5.6 Reliability coefficient for the dependent variable (TQM implementation in
the UK)............................................................................................................................184
Table 5.7 Reliability coefficient for the independent variable (National culture and
organisational culture in the UK).................................................................................184
Table 6.1 Comparative results of the interview analysis……………….…………………193
Table 7.1 how is your company constituted?..............................................................219
Table 7.2 Please roughly position your company in one of the sectors?..................220
Table 7.3 How long has your company been trading?...............................................220
Table 7.4 How many employee do you have?..............................................................220
Table 7.5 Item statistic (Independent Variables)........................................................221
Table 7.6 Item statistic (Dependent Variables)...........................................................221
Table 7.7 Examining the values of skewness and Kurtosis (Independent
Variables)........................................................................................................................222
Table 7.8 Correlation.....................................................................................................224
Table 7.9 R-square (national culture)..........................................................................226
Table 7.10 ANOVA (b)..................................................................................................227
Table 7.11 Coefficients (a).............................................................................................227
Table 7.12 Model Summary (Involvement).................................................................228
Table 7.13 Model Summary (Consistency)..................................................................228
Table 7.14 Model Summary (Adaptability).................................................................228
Table 7.15 Model Summary (Mission).........................................................................229
Table 7.16 ANOVA (Involvement)...............................................................................229
Table 7.17 ANOVA (Consistency)................................................................................229
Table 7.18 ANOVA (Adaptability)...............................................................................229
Table 7.19 ANOVA (Mission).......................................................................................229
Table 7.20 Coefficients (Involvement)..........................................................................230 Table 7.21 Coefficients (Consistency)..........................................................................230
13
Table 7.22 Coefficients (Adaptability).........................................................................230
Table 7.23 Coefficients (Mission)..................................................................................230 Table 7.24 Model Summary (Organisational culture)................................................231
Table 7.25 ANOVA (TQM Implementation)...............................................................231
Table 7.26 Coefficients (TQM Imlementation)...........................................................232 Table 7.27 Model Summary (Management Commitment)........................................232
Table 7.28 Model Summary (Role of Quality Department).......................................233
Table 7.29 Model Summary (Training and Education).............................................233
Table 7.30 Model Summary (Employee Involvement)...............................................233
Table 7.31 Model Summary (Continues Improvement).............................................233
Table 7.32 Model Summary (Supplier Partnership)..................................................233
Table 7.33 Model Summary (Quality Policy)..............................................................233
Table 7.34 ANOVA (Management Commitment)......................................................233
Table 7.35 ANOVA (Role of Qulaity Dep)...................................................................234
Table 7.36 ANOVA (Training Education)...................................................................234
Table 7.37 ANOVA (Employee Involvement).............................................................234
Table 7.38 ANOVA (Continuous Improvement)........................................................234
Table 7.39 ANOVA (Supplier Partnership)................................................................234
Table 7.40 ANOVA (Quality Policy)............................................................................235
Table 7.41 Coefficients (Management Commitment).................................................235
Table 7.42 Coefficients (Role of Quality Dep).............................................................236
Table 7.43 Coefficients (Training and Education)......................................................236 Table 7.44 Coefficients (Employee Involvement)........................................................237
Table 7.45 Coefficients (Continuse improvment).......................................................237
Table 7.46 Coefficients (Supplier partnership)...........................................................238
Table 7.47 Coefficients (Quality Policy).......................................................................238
Table 8.1 How is your company constituted?..............................................................241
Table 8.2 Please roughly position your company in one of the sectors?...................241
Table 8.3 How long has your company been trading?...............................................242
Table 8.4 How many employees do you have?............................................................242
Table 8.5 Item Statistics (TQM implementation).......................................................243
Table 8.6 Item Statistics (Organisational culture)......................................................243
Table 8.7 Examining the value of Skewness and Kurtosis.........................................244
Table 8.8 Correlation.....................................................................................................245
Table 8.9 Model Summary (National culture)............................................................248
Table 8.10 ANOVA (Organisational culture)..............................................................248
Table 8.11 Coefficients (Organisational Culture).......................................................249 Table 8.12 Model Summary (Involvement).................................................................249
Table 8.13 Model Summary (Consistency)..................................................................249
Table 8.14 Model Summary (Adaptability).................................................................249
Table 8.15 Model Summary (Mission).........................................................................249
Table 8.16 ANOVA (Involvement)...............................................................................250
Table 8.17 ANOVA (Consistency)................................................................................250
Table 8.18 ANOVA (Adaptability)...............................................................................250
Table 8.19 ANOVA (Mission).......................................................................................250
Table 8.20 Coefficients (Involvement)..........................................................................251

14
Table 8.21 Coefficients (Consistency)..........................................................................251 Table 8.22 Coefficients (Adaptability).........................................................................251
Table 8.23 Coefficients (Mission)..................................................................................251 Table 8.24 Model Summary (Organisational Culture)..............................................252
Table 8.25 ANOVA (TQM Implementation)...............................................................253
Table 8.26 Coefficients (TQM Implementation).........................................................253 Table 8.27 Model Summary (Management Commitment)........................................254
Table 8.28 Model Summary (Role of Quality Department).......................................254
Table 8.29 Model Summary (Training and Education).............................................254
Table 8.30 Model Summary (Employee Involvement)...............................................254
Table 8.31 Model Summary (Continues Improvement).............................................254
Table 8.32 Model Summary (Supplier PArtnership).................................................255
Table 8.33 Model Summary (Quality Policy)..............................................................255
Table 8.34 ANOVA (Management Commitment)......................................................255
Table 8.35 ANOVA (Role of Quality Dep)...................................................................255
Table 8.36 ANOVA (Training and Education)...........................................................255
Table 8.37 ANOVA (Employee Involvement).............................................................256
Table 8.38 ANOVA (Continuous Improvement)........................................................256
Table 8.39 ANOVA (Supplier Partnership)................................................................256
Table 8.40 ANOVA (Quality Policy)............................................................................256
Table 8.41 Coefficients (Management Commitment).................................................257 Table 8.42 Coefficients (Role of Quality Dep).............................................................257 Table 8.43 Coefficients (Training and Education)......................................................258 Table 8.44 Coefficients (Employee Involvement)........................................................258 Table 8.45 Coefficients (Continuous Improvement)...................................................259 Table 8.46 Coefficients (Supplier Partnership)...........................................................259 Table 8.47 Coefficients (Quality Policy).......................................................................260 Table 9.1 The result of charts observation..................................................................270
Table 10.1 The current situation of organisation culture in the UK and Iran on
implementation and operation of TQM.......................................................................296
Table 10.2 The suggestion table regarding to implementing and operating TQM in
Iranian organisational culture......................................................................................297

15
Chapter One (Introduction)
16
1. Introduction
For a long time, developing countries have been making their economic plans using
models copied from successful western countries with the aim of enjoying the same
degree of economic success (Goncalo and Staw, 2006). However, globalisation and
international trade, along with advances in information technology have now
dramatically increased competition worldwide. To compete in a global market, firms
need to be equipped with new technology, up to date information, skilled employees, and
enhanced managerial skills. The concept of Total Quality Management (TQM) has been
developed and propagated as the result of intense global competition. Companies with
international trade and global competition have paid considerable attention to TQM
philosophies, procedures, tools, and techniques.
Despite globalisation, the implementation of quality management has not occurred at the
same pace in different regions of the world. While early implementation started in Japan,
the US, and Europe, followed by the South East Asian countries, countries in the Middle
East have lagged behind in the quality journey. To be acceptable and to compete in the
global market, countries in the Middle East such as Iran need to implement quality
management practices, tools, and techniques within all sections of their industries.
For a decade Iranian companies have been trying to implement TQM in their
organisation. According to a study by Mosadegh Rad, (2003) and other researchers
(Mortazavi, Tayab and Amiishai, 1999 and Dalvi 2005) in Iran, the percentage of
unsuccessful implementation and operation of TQM is quite high. This evidence points to
an important concern; Iranian organisations need to establish a new strategy towards
quality management and organisational culture (Mosadegh Rad, 2006), because one of
the interesting things about Iran is that the implementation and operation of TQM in
Iranian companies is different, due to the influence of national culture on the existing
organisational culture.
Having noted the issues relating to the implementation of TQM in an Iranian context, this
research focuses on the problems and barriers to the introduction and implementation of
17
TQM in Iranian companies. To identify these barriers and difficulties, this study will
examine the effect of national culture on organisational culture and organisational culture
on TQM implementation in Iran and UK. The researcher will also introduce a suggested
model for the successful implementation and operation of TQM in Iranian organisation.
1.2. Background
1.2.1 The need for the study
Each organisation has its own way of doing what it does and its own way of talking about
what it is doing i.e., its own culture (Dwan, 2004). Culture can be described as the
assumptions, values, behaviours and artefacts that an organisation exhibits. It is what
makes one organisation different from another (Ibid). The business environment, in
which organisations have to operate, has become more dynamic and competitive during
recent years (Schein, 1992, P.56). This in turn has led to organisations themselves having
to change and become increasingly responsive to the changes involve the workforce of
the organisation (Ibid). The way people work, their roles and responsibilities and their
behaviour are critical to the success or failure of an organisation‟s goals.
The issue of change, therefore, is one which is currently topical, and as managing
organisational change is not just a passing phase, but is here to stay, it is important that
change is understood in terms of its influence upon the direction of the organisation and
in terms of consequences for individuals and qualities within the organisation (Schein,
1992, P.56). Change needs to be managed and implemented effectively for the
organisation to survive. It is increasingly recognized that people, and their rate of
learning, will determine the nature of future organisations (Schein, 1992). All companies
need to be aware of new developments that affect their community, the marketplace, and
their own jobs. However, what remains constant is the fundamental importance of the
customer: the key to business success (Ibid).
18
According to Hellsten and Klefsjo (2003) the ability of organisations to adapt to the new
needs of customer is crucial for long term success. During the last decade, this need has
influenced many organisations to work with quality issues at a strategic level and total
quality management (TQM), has frequently been used as a management strategy to
develop organisations‟ quality strategies. However, many organisations do not realize
that the implementation of TQM in most cases is a comprehensive organisational change
(Hellsten, 2003) and, as a consequence, several organisations have not succeeded as
expected (Eskildsun, 1994). In the light of this, many researchers hold that implementing
TQM must involve a cultural transformation of the company (Atkinson, 1990, Deming,
1986, Drummond, 1992).
According to Guvenc and Carroll (1995, P.418), successful organisations today have built
an organisational climate that fosters creativity, harmony and teamwork, where
continuous improvement has become a way of life. With respect to developing strategy
the organisation must find its mission and goals. Strategy development is important and
related to whether or not the company has the appropriate structure to implement its goals
(Guvenc and Carrol, 1995, P.418). A significant issue of concern must be an
organisation‟s culture. Managers must determine what changes are needed to cultures or
core values when devolving change strategies. According to Guvenc (1995), we must
also examine whether or not the organisation possesses the right skill to manage and
resolve issues and problems which are critical to company‟s success.
Preffer (1994) argues that there are different sources of success for companies; traditional
sources such as: product and process technology, the protected and regulated domestic
market, access to financial resources, which are no longer the route for ongoing
competitiveness. He believes that people, people‟s culture, their expected knowledge and
how they are managed is becoming the most important, powerful and newest source for
success. To manage the people in organisation, it is best to have the right organisational
culture and right structure for the company (Preffer, 1994).
19
From the research variables that have been considered before the researcher identified the
key variables of national culture, organisational culture, and TQM implementation.
However, achieving TQM and customer satisfaction through organisational culture is a
relatively new approach to explore. In Iran, TQM and organisational culture have
recently become matters for the companies. Awareness of these subjects has been
heightened in recent years, where the Iranian government has paid much attention to
TQM and organisational culture in both sectors and made significant investment in, and
time on, such issues.
1.2.2 The contribution of the study
The contribution to knowledge from this study from connecting national culture with
organisational culture and organisational culture with total quality management (TQM)
implementation. Notably, in this study it is important to understand the development and
influence of organisational culture on total quality management (TQM) implementation,
in the context of both Iranian and English companies. For Iranian companies specially
there is an identified need for such a study. For other industrialised developing countries
there will be significant effects, due to the many other managerial theories, concepts and
practices which can be influenced by external environmental factors (political,
economical, social and cultural).
According to Mortazavi, Tayab, and Amirshahi (1999) many Iranian organisations in
terms of their total quality management are poor, because of the lack of modern
technology and marketing, low productivity of workforce; lack of development and
coordination of specialized organisations; weak relationships between small-and
medium-size enterprises and large scale industry; and lack of international cooperation
and foreign investment. In addition, TQM in Iran is often seen as a stand-alone process
rather than an important part of an overall organisational strategy of improvement.
Another important factor about TQM from other studies in Iran is that TQM programmes
are influenced by personal connection, nepotism and friendships that reflect cultural
pressures.

20
According to Mortazavi, Tayab, and Amirshahi (1999) organisations all around the world
are undertaking initiatives to improve quality, productivity and delivery of their products
or services. These include manufacturing, service, non-profit, governmental, political,
government-subsidised, international and national organisations. According to Mortazavi,
Tayab, and Amirshahi (1999) Iranian companies are faced of with particular challenges:
Unclear goals: Initiatives are often undertaken without setting realistic or
measurable objectives. Without clear, shared goals, it‟s difficult to plan
implementation, track progress, change direction if necessary, document result,
recognize or reward contributors or modify behaviour when people are not
contributing. Unfortunately, too many initiatives are perceived as “progress of the
month” as opposed to long standing changes in the way an organisation does
business. This is often the result of unclear goals.
Ineffective management process: without effective management process (e.g.,
quality process, performance management process, information system, financial
process, feedback system, etc) it is difficult for any organisation to be sustained
long term.
Negative climate: No initiative can succeed in an unfriendly or too negative
climate. Without cooperation, trust, and everyone‟s willingness to consider new
ideas, organisations can not achieve long-term improvement.
Inappropriate structure: if an organisation is not structured effectively,
improvement can be difficult, if not impossible. Excessive layers of management,
systemic redundancies, turf battles or overly bureaucratic reporting policies can
dramatically reduce or in some cases, destroy-the results of improvement
initiatives.
Undeveloped individuals: the best planned initiatives can only succeed if all the
workers have the necessary skills to pull them off. Team skills, technical skills
and other job skills are essential in order for change to be effectively
implemented.
21
Ineffective team work: long-term improvement requires more than clear goals,
effective structure, equal representation and highly skilled employees. If people
cannot work together or if business units are not organized for effective team
work, success will often be compromised.
According to Mortazavi, Tayab and Amiishai (1999), each type of organisation faces its
own unique challenges; most of these challenges are related to cultural issues.
22
1.2.3 Research aim and objectives
Aim
The previous research has suggested that there is a potential causal relationship between
the failure of TQM and aspects of Iranian culture, the key aim of this study is to explore
the relationship between national culture, organisational culture and TQM. Also, to
develop a framework to achieve successful implementation and operation of TQM in
Iran.
Objective
After identifying the challenges facing Iranian organisation, this research has a number of
objectives related to the national culture, organisational culture, and Total Quality
Management implementation, in Iranian and the UK companies. These objectives are:
1. To understand the role, function, and importance of organisational culture.
2. To understand the implementation, operation and sustaining of TQM in Iran and
UK organisation.
3. To understand the relationship between organisational culture and TQM.
4. To identify the factors that influence Iranian and the UK organisations through the
implementation and operation of TQM.
23
1.2.4 Research Questions
The questions addressed by the research are:
First Question: What is organisational culture; its importance, functions and role?
Second Question: How TQM could be organised, implemented, and sustained
within the Iranian and the UK organisation?
Third question: Should an organisational culture be initiated before TQM or vice
versa? Should they be initiated together? How would we ensure TQM and
organisational culture-s complements one another, instead of overshadowing?
Fourth question: What are the main factors which could influence TQM in
countries such as Iran and the UK?
24
1.3 Organisation of the thesis
This thesis contains ten chapters. A brief description of each chapter is presented below
to summarise the thesis.
Chapter one, provide an introduction to the subject of the thesis, research justification
and philosophy. The aims and objectives of the research, summary of main findings and
organisation of the thesis are also presented.
Chapter two, present the literature on national culture and organisational culture. It starts
by reviewing various definition of national culture and organisation culture and
concludes with an evaluation and criticism of different philosophies of organisational
culture.
Chapter three, explain the evolution of TQM with time, the TQM gurus who have
contributed to the training and practice the quality improvement.
Chapter four, this chapter describes the meaning, principles, tools, and techniques of
implementation and operation of TQM and discusses the recent research and
developments in the TQM implementation in Iran and the UK.
Chapter five, the aim of this chapter is to describe the research methodology that has
been applied in undertaking this research and to explain the steps followed and the
methods employed by the researcher to collect the data. This chapter starts with an
overview of the research methodology and paradigm. This is followed by a detailed
description of the data collection methods adopted in this research including a
justification for the research population and sample selection. This is developed to
explain the procedures undertaken relating to questionnaire design and plan, interview,
pilot work, question types and format, the covering letter, content of the final version of
the questionnaire, administering the questionnaire, the respondents, checking for non-
respondent bias and reliability and validity evaluation are also discussed. Finally, the

25
chapter concludes with a discussion and justification of the statistical methods and
techniques used in the data analysis in order to fulfil the objectives of the study.
Chapter six, this chapter aims to provide the interview analysis in three majors‟ topics;
national Culture; organisational Culture; and TQM Implementation. The interviews were
focused at the managers, quality control departments‟ managers and sales managers in
Iran and the UK.
Chapter seven, this chapter presents the result of the questionnaires which have been
collected from Iranian companies. First demographic information on the data set is
provided. Then, descriptive statistics on the meaning of each construct will be explained.
The findings have been expressed in both narrative and graphic forms, with references to
specific questions when necessary. Later reliability information on the item is discussed
and finally the correlation matrix is explained.
Chapter eight, this chapter presents the result of the questionnaire which is collected
from the UK companies. First demographic information on the data set is provided. Then,
descriptive statistics on the meaning of each construct will be explained. The findings
have been expressed in both narrative and graphic forms, with references to specific
questions when necessary. Reliability information on the item is then discussed and
finally the correlation matrix is explained.
Chapter nine, the aim of this chapter is to discuss the result of the qualitative and
quantitative data by focusing on internal/external validation, interpretation of the key
findings and their various implications.
Chapter ten presents the conclusion of the research and contributions to the body of
knowledge. A proposed model for TQM implementation within Iranian organisations is
presented. Suggestions for future research in the area also included.

26
Chapter Two (National Culture & Organisational culture)
27
2.1 Introduction
The term culture can be used in two different ways. The first is in the sense of national
culture whilst the second is to refer to organisational culture. Culture is the ideas, beliefs
and customs that are shared and accepted by people in a society or culture refers to the
underlying values, beliefs and codes of practice that make community what it is
(Shermerhorn, 2002). The customs of society, the self-image of its members, the things
that make it different from other societies, are it is culture. Culture is powerful subject
(Ibid). Culture has been on the agenda of management theorists for quite a long time.
2.2 Explaining culture
Culture is as difficult to define as many other concepts describing human social life.
Hofstede (2001) explains culture as collective programming of the mind. He argues that
every person carries with himself or herself, patterns of thinking, feeling and potential
acting which were learned in early childhood, because at that time a person is most
vulnerable to learning and understand. As soon as certain patterns of thinking, feeling
and acting have established themselves within a person‟s mind, she or he must unlearn
these before being able to learn something different, and unlearning is more difficult than
learning for the first time.
Hofstede (2001) says that culture always is a collective phenomenon, because it is at least
partly shared with people who live or lived within the same social environment, where it
was learned. That means it is the collective programming of the mind that distinguishes
the members of one group or category of people from another.
28
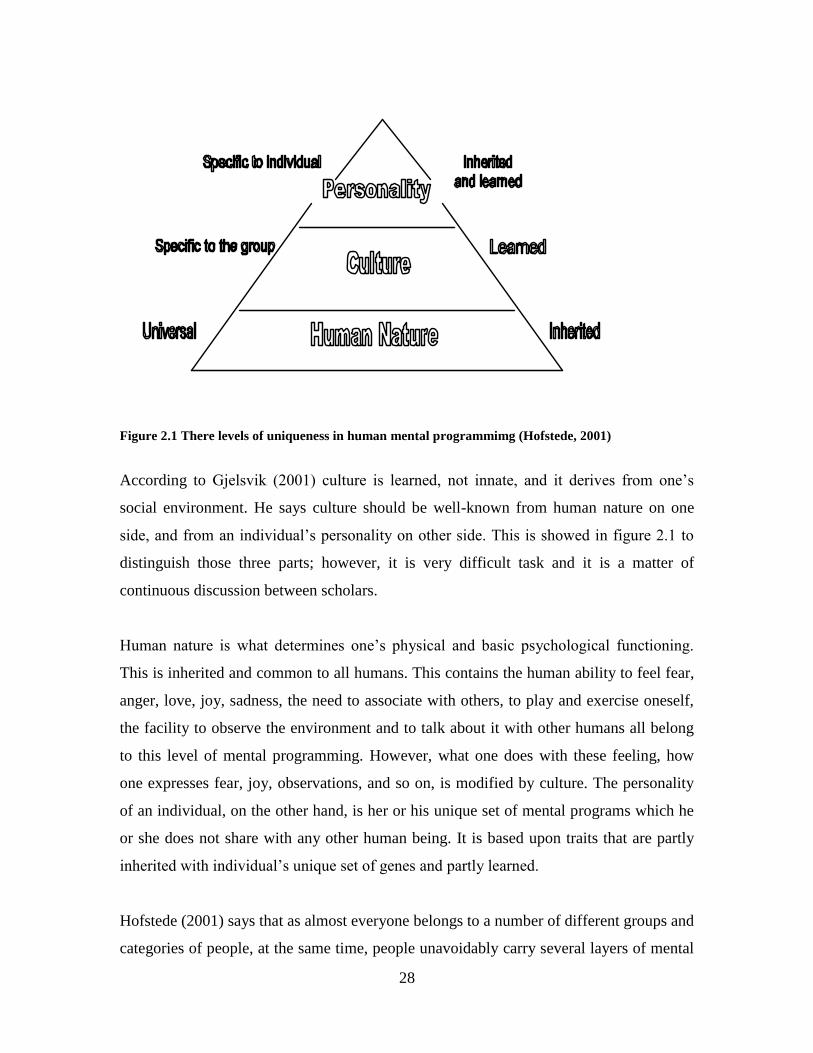
Figure 2.1 There levels of uniqueness in human mental programmimg (Hofstede, 2001)
According to Gjelsvik (2001) culture is learned, not innate, and it derives from one‟s
social environment. He says culture should be well-known from human nature on one
side, and from an individual‟s personality on other side. This is showed in figure 2.1 to
distinguish those three parts; however, it is very difficult task and it is a matter of
continuous discussion between scholars.
Human nature is what determines one‟s physical and basic psychological functioning.
This is inherited and common to all humans. This contains the human ability to feel fear,
anger, love, joy, sadness, the need to associate with others, to play and exercise oneself,
the facility to observe the environment and to talk about it with other humans all belong
to this level of mental programming. However, what one does with these feeling, how
one expresses fear, joy, observations, and so on, is modified by culture. The personality
of an individual, on the other hand, is her or his unique set of mental programs which he
or she does not share with any other human being. It is based upon traits that are partly
inherited with individual‟s unique set of genes and partly learned.
Hofstede (2001) says that as almost everyone belongs to a number of different groups and
categories of people, at the same time, people unavoidably carry several layers of mental
29
programming within themselves, corresponding to different levels of culture. For
example:
A national level according to one‟s country (or countries for people who migrated
during their life time)
A regional and/or ethnic and/or religious and/or linguistic affiliation level, as most
nations are composed of culturally different regions and/or ethnic and/or religious
and/or language groups
A gender level, according to whether a person was born as a girl or as a boy
A generation level, which separates grandparents from parents from children
A social class level, associated with educational opportunities and with a person‟s
occupation or profession
For those who are employed, an organisational or corporate level according to the
way employees have been socialised by their work organisation.
In a modern society these various levels are not necessarily in harmony, but are often
partly conflicting: for example, religious values may conflict with generation value‟s
gender values with organisational practices.
2.3 Cultural approach
The advocates of this approach among organisational theorists, although placing
emphasis on different aspects of organisations, have tried to analyse the underlying
values which shape the organisation as they are.
There are generally three groups in this approach: firstly, those who see the culture as the
only variable determining the organisational characteristics; secondly those who believe
there are some characteristics which are determined by cultural values and also some
which are universally seen in organisations all over the globe; third group reject the very
concept of culture and its utility; this group will be considered at the end of this chapter.
30
A review of the studies conducted by cultural view is essential, because it enables the
researcher to know their arguments, assumptions and limitations.
2.4 National culture
It is difficult to find one agreed definition of national culture, for example, Krober and
Kluckholm (1985) found over 160 definitions of culture in their research (Brooks, 2003).
This may be because culture can be viewed from different scientific perspectives such as
anthropological or sociological ones (Ibid). Two useful examples of definitions of culture
are as follows. According to Mead (1951) culture „is a body of learning behaviour, a
collection of beliefs, habits and traditions, shared by a group of people and successively
learned by people who enter society‟ (Brooks, 2003, P.265). Hofstede (2001) defines
national culture as the collective mental programming of the people in a national context.
However, the important element of culture is the set of values and fundamental, taken-
for-granted assumptions held by a group of people (Brooks, 2003). For instance that
value and assumptions are about the “manner of phenomena”, including those about what
is right and what is wrong and what is good and what is bad (Brooks, 2003, P.265). The
discussion above shows that culture includes some commonly held values among a group
of people which have been determined by the environment in which they grew up and
which, to some extent, will influence their behaviour both inside and outside the
organisation (Ibid). Simply describing differences in the behaviour of companies by
country of origin suggests that each individual country has a unique set of characteristics
that will affect decision made within the companies (Pagell, et al, (2004). For example
popular dimensions of culture which may affect on organisations are “language”,
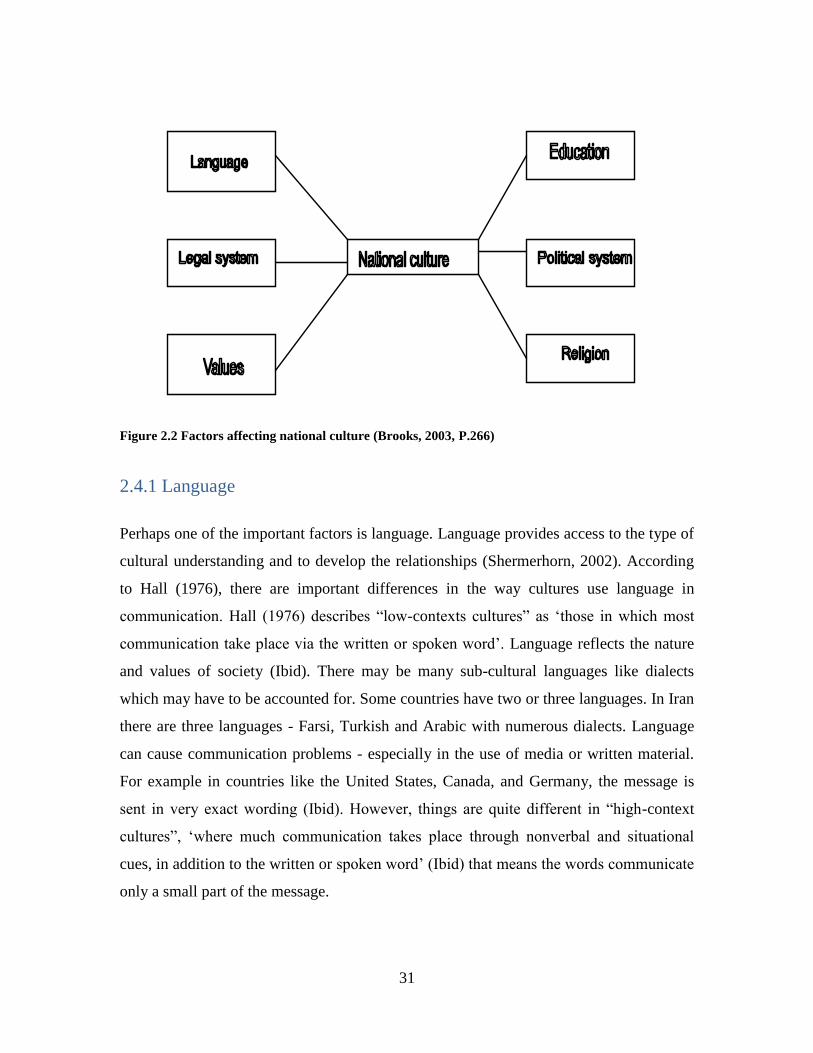
“interpersonal space”, “time orientation”, and “religion” (Shermerhorn, 2002). Figure 2.2
shows the origins of commonly held value.
As we can see, these are all factors that may affect how people‟s values develop within
the society in which they grow up and work (Brooks, 2003).
31
Figure 2.2 Factors affecting national culture (Brooks, 2003, P.266)
2.4.1 Language
Perhaps one of the important factors is language. Language provides access to the type of
cultural understanding and to develop the relationships (Shermerhorn, 2002). According
to Hall (1976), there are important differences in the way cultures use language in
communication. Hall (1976) describes “low-contexts cultures” as „those in which most
communication take place via the written or spoken word‟. Language reflects the nature
and values of society (Ibid). There may be many sub-cultural languages like dialects
which may have to be accounted for. Some countries have two or three languages. In Iran
there are three languages - Farsi, Turkish and Arabic with numerous dialects. Language
can cause communication problems - especially in the use of media or written material.
For example in countries like the United States, Canada, and Germany, the message is
sent in very exact wording (Ibid). However, things are quite different in “high-context
cultures”, „where much communication takes place through nonverbal and situational
cues, in addition to the written or spoken word‟ (Ibid) that means the words communicate
only a small part of the message.
32
2.4.2 Religion
As a cultural variable, religion is also important, because religion is a major influence on
many people‟s lives, and its impact may extend to practices regarding dress, food, and
behaviour (Ibid). The religion‟s effect may be especially pronounced in countries where
the religious and political systems are closely interlinked, such as in Iran, but it will also
be significant in determining the type of values developed (Ibid). For example, “Islamic
banks” in Iran, service their customers without any interest charges to remain consistent
with teachings of the Koran (Mortazavi, et al, 1999). In June 1979, „Iranian banks were
nationalized and banking regulations changed with the approval of the Islamic banking
law (interest free), and the role of banks in accelerating trade deals, rendering services to
clients, collecting deposits, offering credits to applicants on the basis of the “CBI's”
policies and so on was strengthened‟ (Ibid). The effect of religion may be especially
pronounced in countries where the religious and political systems are closely interlinked,
such as in Iran, but it will also be significant in determining the type of values developed.
2.5 Hofstede‟s Findings
One of the studies on the issue of the influence of national culture and cultural values on
structure in international comparative level has been conducted by Hofstede. In his
researches on subsidiaries of a multinational corporation in 64 countries, he identified
some of cultural values which are conceptually related to the organisation structure.
Hofstede (2001) identifies two main dimensions of organisation structure, i.e.,
“structuring of activities” (including standardisation, specialisation, and formalisation)
and “concentration of authority” (which includes centralisation). Hofstede argues that it
should be possible to find cultural dimensions (on which countries differ) related to these
structural dimensions. Hofstede‟s research (2001) offers one framework for
understanding the management implications of broad differences in national cultures.
Hofstede (2001) selected countries rank on the five dimensions. The five dimensions
were initially identified through a comparison of similar people (employee and managers)
33
in 64 different national subsidiaries of IBM Corporation. The employees were working
for the same multinational but in different countries. Those dimensions are:
“Power distance” is conceptually related to “concentration of authority” (Ibid).
Large power distance means vertical dependence in the organisation, making
everybody dependent on the top man, which leads to centralisation of decisions.
According to Hofstede (2001) power distance is the „degree to which a society
accepts or rejects the unequal distribution of power in organisation and the
institutions of society.
“Uncertainty avoidance” is „the degree to which a society tolerates risk and
situational uncertainties‟ (Ibid).
“Individualism-collectivism” is „the degree to which a society emphasizes
individual accomplishment and self-interests, versus collective accomplishments
and the good of groups‟ (Ibid).
“Masculinity-femininity” is „the degree to which a society values assertiveness
and material success, versus feeling and concern for relationship‟ (Ibid).
“Time orientation” is the degree to which a society emphasizes short term
considerations versus greater concern for the future‟ (Ibid).
Hofstede (2001) concludes that differences in these cultural dimensions across different
countries provide an underlying explanation for different organisational structures, and
given these cultural differences, the resultant structures in a culture are logical to
members of the same culture.
Hofstede (2001) then argues that in countries with large power distance and high
uncertainty avoidance the general pattern of organisations, be it work organisation or
political system will be an authoritarian one. In countries with low uncertainty avoidance
and small power distance, the general pattern of organisations, be it work organisation or
political system, will be a democratic one (Hofstede, 2001)
34
2.5.1 Power distance
According to Gjelsvik (2001) power distance (PDI-scores) informs us about dependence
relationships in a country. In country with low power distance there is limited
dependence of subordinates on managers, and a first choice for discussion, that is
interdependence between manager and subordinate. The emotional distance between
them is relatively low: subordinates will quite willingly approach and contradict their
managers (Ibid). In large power distance countries there is considerable dependence of
subordinates on managers (Ibid). Subordinates are unlikely to approach and contradict
their managers directly.
As Hofstede (2007) says power distance has roots in the family. In the large power
distance situation children are expected to be obedient towards their parents (Ibid).
Sometime there is even an order of authority among the children themselves, younger
children being expected to yield to older children (Ibid). Independent behaviour on the
part of children is not encouraged (Ibid). It is seen as a basic virtue; children see others
showing such respect, and soon require it themselves. Parental power continues to play a
role in peoples‟ lives as long as parents are alive. Parents and grandparents are treated
with formal deference even after their children have actually taken control of their own
lives (Gjelsvik, 2001). There is a pattern of dependence on seniors which passes through
all human contacts, and the mental “software” which people carry contains a strong need
for such dependence.
In the lower power distance situation children are more or less treated as equals as soon
as they are able to distinguish (Ibid). According to Hofstede (2007) the goal of parental
education is to let the children take control of their own live as soon as they can. Active
experimentation by the child is encouraged: a child is allowed to contradict its parents, it
learns to say no very early (Ibid). Relationships with others are not dependent on the
other‟s status; formal respect and deference are seldom shown (Gjelsvik, 2001). When
children grow up they replace the child-parent relationship by one of equals (Ibid). There
35
is an ideal of personal independence in the family. A need for independence is supposed
to be a major component of the mental software of an adult (Ibid).
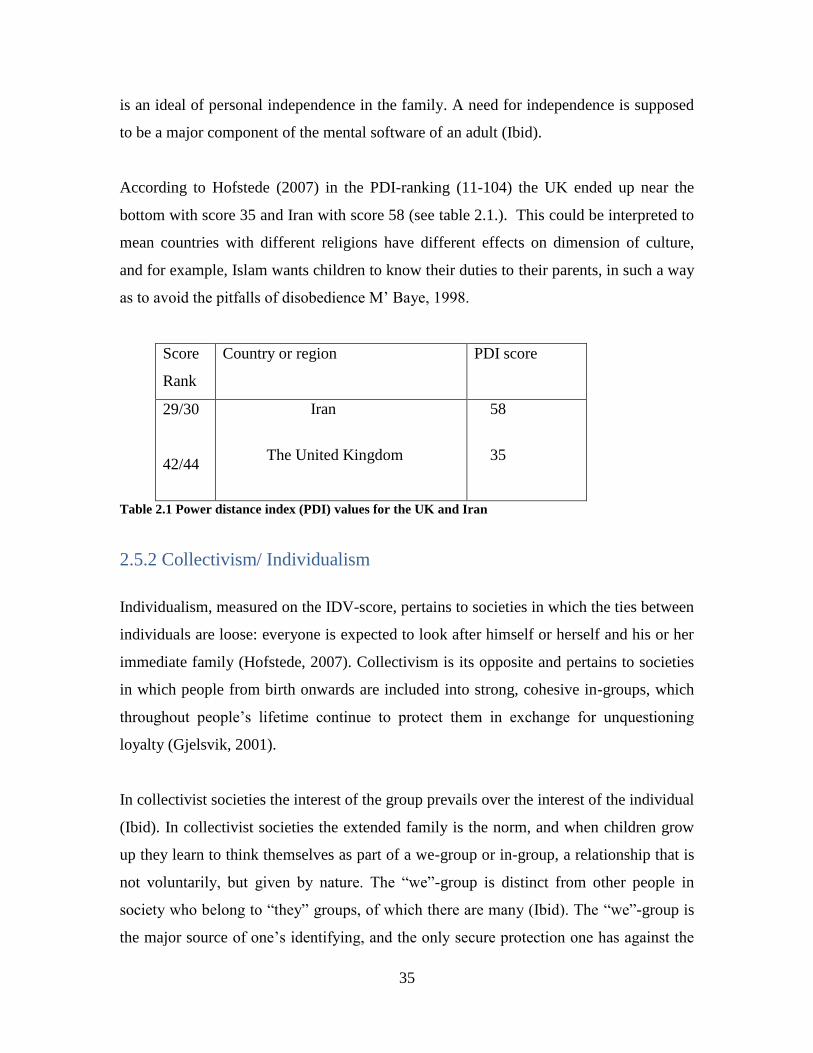
According to Hofstede (2007) in the PDI-ranking (11-104) the UK ended up near the
bottom with score 35 and Iran with score 58 (see table 2.1.). This could be interpreted to
mean countries with different religions have different effects on dimension of culture,
and for example, Islam wants children to know their duties to their parents, in such a way
as to avoid the pitfalls of disobedience M‟ Baye, 1998.
Score
Rank
Country or region PDI score
29/30
42/44
Iran
The United Kingdom
58
35
Table 2.1 Power distance index (PDI) values for the UK and Iran
2.5.2 Collectivism/ Individualism
Individualism, measured on the IDV-score, pertains to societies in which the ties between
individuals are loose: everyone is expected to look after himself or herself and his or her
immediate family (Hofstede, 2007). Collectivism is its opposite and pertains to societies
in which people from birth onwards are included into strong, cohesive in-groups, which
throughout people‟s lifetime continue to protect them in exchange for unquestioning
loyalty (Gjelsvik, 2001).
In collectivist societies the interest of the group prevails over the interest of the individual
(Ibid). In collectivist societies the extended family is the norm, and when children grow
up they learn to think themselves as part of a we-group or in-group, a relationship that is
not voluntarily, but given by nature. The “we”-group is distinct from other people in
society who belong to “they” groups, of which there are many (Ibid). The “we”-group is
the major source of one‟s identifying, and the only secure protection one has against the
36
difficulty of life (Ibid). Therefore one owes lifetime loyalty to one‟s in-group, and
breaking this loyalty is one of the worst things a person can do (Ibid). Between the person
and the in-group a dependence relationship develops which is both practical and
psychological (Ibid).
According to Hofstede (2007) in individualist societies the interest of the individual
prevails over interests of the group. In these societies the centre of the family is the norm
(Ibid). Children from such families, as they grow up, soon learn to think of themselves as
I (Gjelsvik, 2001, P.58). This I, their proposal identity, is distinct form other people‟s I
and these others not classified according to their group membership but to individual
characteristics (Ibid).
According to Hofstede (2007) in collectivist societies harmony should always be
maintained and direct confrontation stayed away from. There also exist a high-context
communications, and relationship prevails over task (Ibid). The relationship employer-
employee is perceived in moral terms, like a family link and management is management
of a group (Gjelsvik, 2001, P.59). On the other hand, in individualist societies, speaking
ones one‟s mind is a characteristic of an honest person (Ibid). There exist low-context
communication, and task succeeds over relationship (Ibid). The relationship of employee
is a contract supposed to be based on common advantage, and management is
management of individuals (Ibid).
According to (Hofstede, 2001) in the IDV-ranking (6-91) both Iran and the UK differ in
their placement, the UK ranking is 89 and Iran‟s ranking is 41 (See table 2.2). We see
that the UK is far more individualistic than Iran. In Islamic traditions family bonds are
thought to be strong and something that should be cherished (Maqsood, 1998). Also in
Islam the whole society is considered to be one unity and more important than
individualistic needs.

37
Score
Rank
Country or region IDV score
3
24
The United Kingdom
Iran
89
41
Table 2.2 Individualism index (IDV) values for the UK and Iran
If we plot the PDI score and IDV score, as shown in Figure 2.3, Iran end up in the large
power distance/collectivist corner, and the UK end up in the small power
distance/individualist corner.
Table 2.3 IDV- scores and PDI- scores for relevant countries (Hofsted, 2001)
38
2.5.3 Femininity/masculinity
According to Hofstede (2001) masculinity, measured by MAS-scores, pertains to
societies in which social gender roles are clearly distinct, for example men are supposed
to be self-confident, tough and focused on material success but women are supposed to
be more modest, tender, and concerned with quality of life. Femininity relates to societies
in which social gender roles are not clearly separated, that means both men and women
are supposed to be modest, caring and concerned about of the quality of life (Ibid).
In feminine cultures the dominant values in the society are caring for others and
preservation (Gjelsvik, 2001, P.59). People and good relationships are very important. In
the family both fathers and mothers deal with facts and feeling (Ibid). Arguments are
resolved by negotiation, and managers use feeling and strive for agreement, there is also a
stress on quality, solidarity, and quality of work-life (Ibid). In masculine cultures, on
other hand, the dominant values in society are material success and progress, money and
things are important (Ibid). In the family, fathers deal with facts and mothers with
feelings. Arguments are resolved by fighting them out, and managers are expected to be
decisive and assertive, there is a stress on equity, competition among colleagues, and
performance.
According to Hofstede (2007) in the MAS index (95-5) the UK is with scores 66, and
Iran s in the middle, with score 43. Maybe, one of the reasons will be religion, because
Islamic teaching forfeit segregation of sexes, and that women and men should hold
different roles in the society and in the family.

39
Score
Rank
Country or region MAS score
9/10
33/36
The United Kingdom
Iran
66
43
Table 2.4 masculinity index (MAS) values for the UK and Iran
2.5.4 Uncertainty avoidance
According to Hofstede (2001) uncertainty avoidance, measured by UAI-scores, refers to
the extent to which the members of a culture feel threatened by uncertain or unfamiliar
situations. This feeling is, among other things, expressed through nervous stress, a need
for predictability and a need for written and unwritten rules (Ibid).
According to Gjelsvik (2001) in a weak uncertainty avoidance culture uncertainty is a
normal feature of life and each day is taken as it comes. For example students are
comfortable with open learning situations and concerned with good discussion (Ibid).
There is also a tolerance of deviant ideas and behaviour, and time is a framework for
orientation, and precision and punctuality have to be learned (Ibid).
On other hand, in strong uncertainty avoidance cultures, the uncertainty inherent in life is
felt as a continuous threat that must be fought (Hofstede, 2001). Students are comfortable
in structured learning situations and worried about the right answers, and there exists a
suppression of deviant ideas and behaviour; resistant to innovation. Precision and
punctuality come naturally (Ibid). Hofstede (2001) says in the UAI ranking (112-8) the
UK is 35 and Iran is 59. We can see in table 2.4
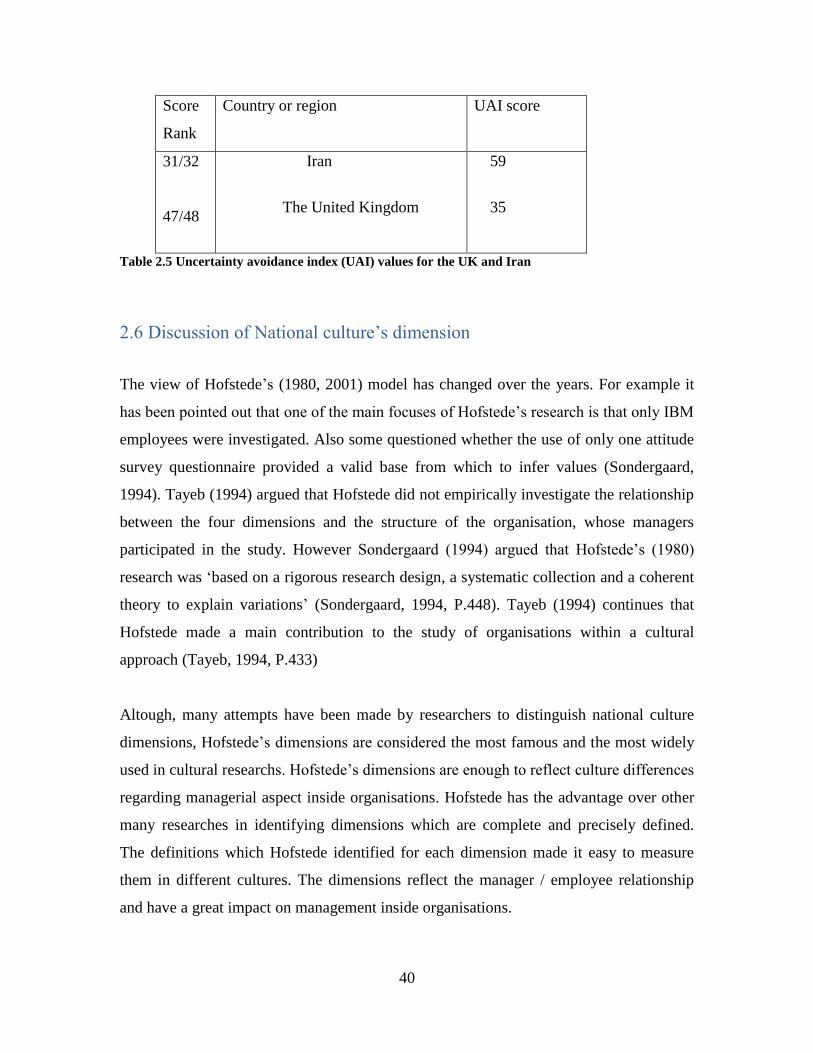
40
Score
Rank
Country or region UAI score
31/32
47/48
Iran
The United Kingdom
59
35
Table 2.5 Uncertainty avoidance index (UAI) values for the UK and Iran
2.6 Discussion of National culture‟s dimension
The view of Hofstede‟s (1980, 2001) model has changed over the years. For example it
has been pointed out that one of the main focuses of Hofstede‟s research is that only IBM
employees were investigated. Also some questioned whether the use of only one attitude
survey questionnaire provided a valid base from which to infer values (Sondergaard,
1994). Tayeb (1994) argued that Hofstede did not empirically investigate the relationship
between the four dimensions and the structure of the organisation, whose managers
participated in the study. However Sondergaard (1994) argued that Hofstede‟s (1980)
research was „based on a rigorous research design, a systematic collection and a coherent
theory to explain variations‟ (Sondergaard, 1994, P.448). Tayeb (1994) continues that
Hofstede made a main contribution to the study of organisations within a cultural
approach (Tayeb, 1994, P.433)
Altough, many attempts have been made by researchers to distinguish national culture
dimensions, Hofstede‟s dimensions are considered the most famous and the most widely
used in cultural researchs. Hofstede‟s dimensions are enough to reflect culture differences
regarding managerial aspect inside organisations. Hofstede has the advantage over other
many researches in identifying dimensions which are complete and precisely defined.
The definitions which Hofstede identified for each dimension made it easy to measure
them in different cultures. The dimensions reflect the manager / employee relationship
and have a great impact on management inside organisations.
41
2.7 Organisational culture
As an organisation grows, it starts to have an organisational culture. The concept of
organisational culture has become one of the most important topics in organisation
science. The concept of organisational culture has been defined by Berryman (1989) as a
set of assumptions or beliefs that are shared by members of an organisation. Recently,
Hofstede (2001) defined culture as the collective programming of the mind, which
distinguishes the employees of one organisation from another. However, O‟Reilly and
Chatman (1996) referred to the importance of differentiating between the formal control
mechanism and the social control mechanism inside the organisation. In other word, these
researchers viewed organisational culture as a form of social control that operates when
members of a group or organisation share expectations about values and these values are
to be set in the form of words and actions.
Schein (1992) distinguished three levels of culture:
(1) “Artefacts”, this includes visible organisational structures and process
(2) “Espoused values”, this includes strategies, objectives and philosophies
(3) “Basic underlying assumption”, this includes unconscious, taken for granted
beliefs.
Schein (1992) described organisational culture as the patterns of shared basic
assumptions that the group learned as it solved its problems of external adaptation and
internal integration. It worked well enough to be considered valid and therefore to be
taught to new members as the correct way to perceive, think and feel in relation to those
problems. Martin and Siehl (1993) suggested four statements which they believe reflect
the essence of much of the recent organisational culture research:
Cultures offer an interpretation of an institution‟s history which members use to
see what is expected from them
Cultures generate commitment to corporate values
42
Cultures serve as an organisational control mechanism
If we look at the first statement, we can see the first statement reflects to a great extent
Schein‟s definition of organisational culture.
According to Wilkins (1983) organisational culture will not reach the depth of socially
shared understanding of the paradigmatic cultures studied by anthropologists, since
learning organisational culture comes in adulthood. That means it‟s not expected that the
effect of organisational culture will be as strong as that of national culture. However,
Jaeger (1983) suggested that a firm with a strong organisational culture tends to have a
strong influence on the values of employees.
On other hand, professional culture is narrower in scope than organisational culture.
Although this is still has some degree of importance, and further research will be
interesting in this area, Bloor and Dawson (1994) did some research about nature of
professional culture. They argued that to be professional took place through such stages
as the formation of professional associations, the development of minimum standards of
professional training, the search for professional knowledge, and the development of a
code of ethics and political agreement, in order to gain public support for the claim of
professional status.
Chatman and Jehn (1994) tried to examine the relationship between two industries
(technology and growth) and organisational culture. The relationship was tested in the
organisational cultures within companies of each industry and across industries. In
Chatman and Jehn‟s (1994) research fifteen American companies in four industries
participated. The companies included eight of the largest American public accounting
companies, three general consulting companies, three national household product carrier
companies, and one government and transportation company. The result was found that
organisational culture varied across industries rather than across companies working in
the similar industry.

43
In this research professional or industrial culture is not part of the investigation, but it
helps to provide a whole picture of the different types of culture.
Figure 2.3 Levels of cultures (Chatman, and Jehn (1994))
2.7.1 Organisational culture dimensions
Hofstede (1998) discovered and introduces organisational culture dimensions by a study
in 1998. Hofstede‟s (1998) research took place in twenty Danish and Dutch
organisational units. In his study, Hofstede tried to cover a wide range of different
organisations, in order to measure the difference and similarities with the range of culture
differences that can be found in practice. Six dimensions of Hofstede‟s (1998)
organisational culture are:
1) Process-oriented versus results-oriented. This dimension tried to show
difference between a concern with means and a concern with objectives.
2) Employee-oriented versus job-oriented. This dimension explores the
differences between a concern for people and concern for getting the job
done.
44
3) Parochial versus professional. This dimension tried to compare and
contrast units whose employees derive their identity largely from the
organisation with units in which people identify with their type of job.
4) Open system versus closed system. This dimension tried to look at the
differences between open and closed systems.
5) Loose versus tight control. This dimension tried to look at the amount of
internal structuring in the organisation.
6) Normative versus pragmatic. Pragmatic units are market-driven with the
emphasis on meeting customers‟ needs and, results are more important
than following procedures. For the normative units, emphasis is on
correctly following organisational procedures, which are more important
than result.
Nevertheless, these organisational dimensions have not been as widely used as
Hofstede‟s national culture dimensions. However, Schein (1992) identified five levels of
organisational culture. According to Schein (1992) levels of organisation are fundamental
assumption, values, behavioural norms, pattern of behaviour, artefacts and symbols.
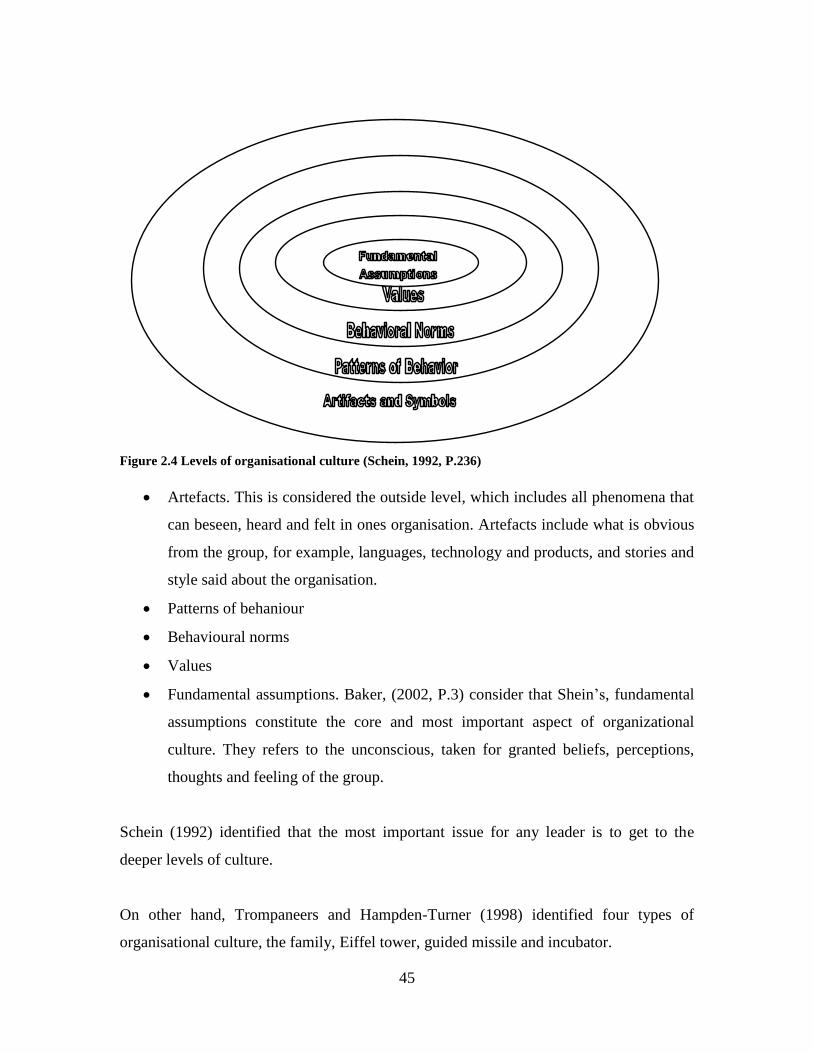
45
Figure 2.4 Levels of organisational culture (Schein, 1992, P.236)
Artefacts. This is considered the outside level, which includes all phenomena that
can beseen, heard and felt in ones organisation. Artefacts include what is obvious
from the group, for example, languages, technology and products, and stories and
style said about the organisation.
Patterns of behaniour
Behavioural norms
Values
Fundamental assumptions. Baker, (2002, P.3) consider that Shein‟s, fundamental
assumptions constitute the core and most important aspect of organizational
culture. They refers to the unconscious, taken for granted beliefs, perceptions,
thoughts and feeling of the group.
Schein (1992) identified that the most important issue for any leader is to get to the
deeper levels of culture.
On other hand, Trompaneers and Hampden-Turner (1998) identified four types of
organisational culture, the family, Eiffel tower, guided missile and incubator.
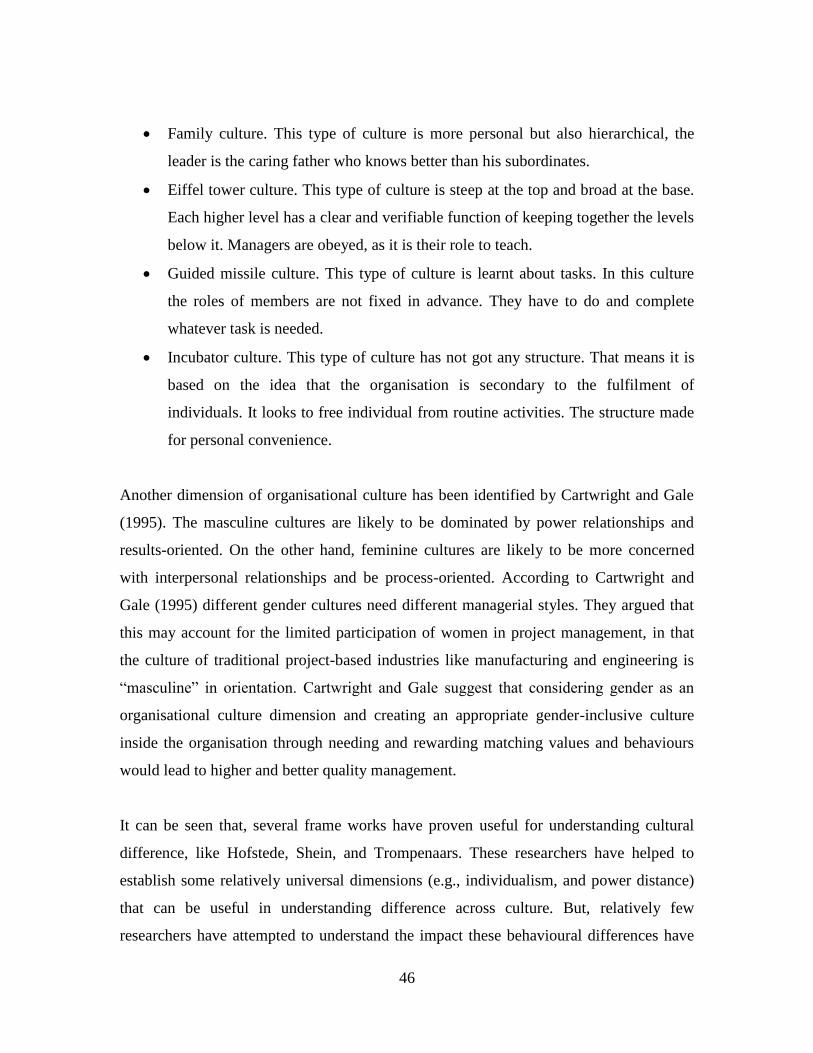
46
Family culture. This type of culture is more personal but also hierarchical, the
leader is the caring father who knows better than his subordinates.
Eiffel tower culture. This type of culture is steep at the top and broad at the base.
Each higher level has a clear and verifiable function of keeping together the levels
below it. Managers are obeyed, as it is their role to teach.
Guided missile culture. This type of culture is learnt about tasks. In this culture
the roles of members are not fixed in advance. They have to do and complete
whatever task is needed.
Incubator culture. This type of culture has not got any structure. That means it is
based on the idea that the organisation is secondary to the fulfilment of
individuals. It looks to free individual from routine activities. The structure made
for personal convenience.
Another dimension of organisational culture has been identified by Cartwright and Gale
(1995). The masculine cultures are likely to be dominated by power relationships and
results-oriented. On the other hand, feminine cultures are likely to be more concerned
with interpersonal relationships and be process-oriented. According to Cartwright and
Gale (1995) different gender cultures need different managerial styles. They argued that
this may account for the limited participation of women in project management, in that
the culture of traditional project-based industries like manufacturing and engineering is
“masculine” in orientation. Cartwright and Gale suggest that considering gender as an
organisational culture dimension and creating an appropriate gender-inclusive culture
inside the organisation through needing and rewarding matching values and behaviours
would lead to higher and better quality management.
It can be seen that, several frame works have proven useful for understanding cultural
difference, like Hofstede, Shein, and Trompenaars. These researchers have helped to
establish some relatively universal dimensions (e.g., individualism, and power distance)
that can be useful in understanding difference across culture. But, relatively few
researchers have attempted to understand the impact these behavioural differences have
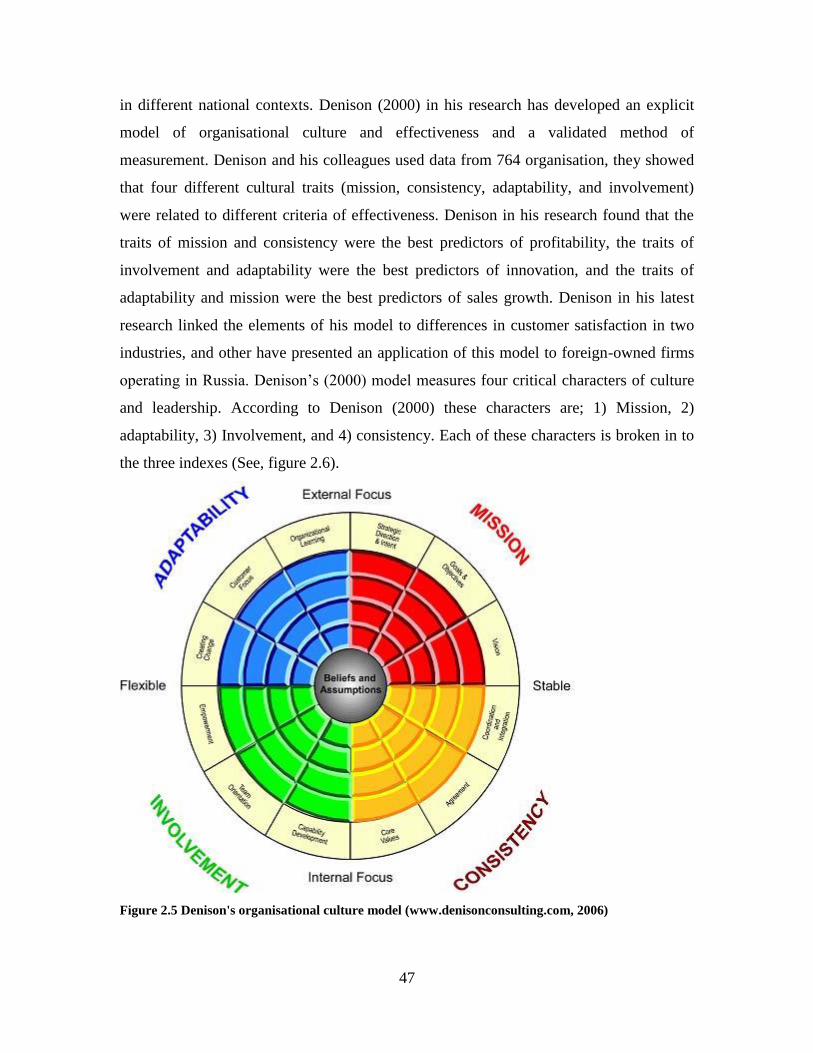
47
in different national contexts. Denison (2000) in his research has developed an explicit
model of organisational culture and effectiveness and a validated method of
measurement. Denison and his colleagues used data from 764 organisation, they showed
that four different cultural traits (mission, consistency, adaptability, and involvement)
were related to different criteria of effectiveness. Denison in his research found that the
traits of mission and consistency were the best predictors of profitability, the traits of
involvement and adaptability were the best predictors of innovation, and the traits of
adaptability and mission were the best predictors of sales growth. Denison in his latest
research linked the elements of his model to differences in customer satisfaction in two
industries, and other have presented an application of this model to foreign-owned firms
operating in Russia. Denison‟s (2000) model measures four critical characters of culture
and leadership. According to Denison (2000) these characters are; 1) Mission, 2)
adaptability, 3) Involvement, and 4) consistency. Each of these characters is broken in to
the three indexes (See, figure 2.6).
Figure 2.5 Denison's organisational culture model (www.denisonconsulting.com, 2006)
48
Mission: „A mission provides purpose and meaning by defining a social role and
external goals for the organisation‟ (Denison, 2000). Successful organisations
have a clear sense of purpose and direction that defines organisational goals and
strategic objectives and expresses a vision of how the organisation will look in the
future. When an organisation‟s underlying mission changes, changes also occur in
other aspects of the organisation‟ culture.
Adaptability: „Organisations hold a system of norms and beliefs that support the
organization's capacity to receive, interpret, and translate signals from its
environment into internal behavioural changes that increase its chances for
survival, growth and development‟ (Ibid). Ironically, organisations that are well
integrated are often the most difficult ones to change. Internal integration and
external adaptation can often be at odds. Adaptable organisations are driven by
their customers, take risks and learn from their mistakes, and have capability and
experience at creating change. They are continuously changing the system so that
they are improving the organisations‟ collective ability to provide value for their
customer.
Involvement: Organisational cultures characterized as "highly involved" „strongly
encourage employee involvement and create a sense of ownership and
responsibility‟ (Ibid). Effective organisations empower their people, build their
organisation around teams, and develop human capability at all levels.
Executives, managers, and employees are committed to their work and feel that
they own a piece of the organisation. However, people at all levels feel that they
have at least some input into decisions that will affect their work, and that their
work is directly connected to the goals of the organisation.
Consistency: „Consistency provides a central source of integration, coordination
and control‟ (Ibid). As Denison (2000) said, organisations tend to be effective
because they have strong cultures that are highly consistent, well coordinated, and
well integrated. Behaviour is rooted in a set of core values, and leaders and
followers are skilled at reaching agreement even when there are diverse points of
view. This type of consistency is a powerful source of stability and internal
integration that results from a common mindset and a high degree of conformity.

49
Like many models of organisational culture, this model focuses on the contradictions that
occur as organisations try to achieve internal integration and external adoption. For
example, organisations that are market focused and opportunistic often have problems
with internal integration. On the other hand, organisations that are well integrated and
over controlled usually have a hard time adapting to their environment. Organisations
with a top-down vision often find it difficult to focus on the empowerment and the
bottom up dynamics needed to implement that vision. At the same time, organisations
with strong participation often have difficulty establishing direction.
However, at the core of this model are underlying beliefs and assumption. The deeper
levels of organisational culture are typically quite unique to each firm and are thus
difficult to measure and harder to generalise about. They are often best understood from a
qualitative perspective. Nonetheless, they provide the foundation from which behaviour
and action spring. The four traits of organisational culture presented by Denison have
been expanded upon to include three sub dimensions for each trait, for a total of 12
dimensions. On other hand, this model is often used as part of a diagnostic process to
profile specific organisation in order to highlight the strengths and weaknesses of their
cultures and to suggest ways in which the organisation‟s culture may influence its
effectiveness.
2.7.2 Organisational culture and leadership
This section explore the relationship between organisational culture and leadership.
The organisational leader plays an important role in the nurturing, disseminating, and
shaping of organisational culture (Smircich, Morgan, 1982). Indeed, the manipulation of
culture has been described as being the „unique and essential function of leadership‟
(Schein, 1985, P.317).
50
„If the concept of leadership as distinguished from management and administration is to
have any value, we must recognise the centrality of this culture management function in
the leadership concept‟ (Ibid).
Schein (1985) outlines the process through which leaders influence culture in growing
organisations. He states that the leadership externalises its own assumptions and embeds
them gradually and consistently in the mission, goals, structure, and working procedures
of the group. Once the organisation develops a substantial shared history amongst its
members, culture becomes more of a cause than an effect. In the mature organisation,
culture now defines what is to be thought of as leadership.
Researchers have tried to define the different styles of the leadership in organisations in
many ways, but one of the most important distinctions is between: transformational
leadership and transactional leadership.
In organisation with established culture, transformational leadership is required to
manage the process of cultural change. Indeed, this function marks a distinction between
transformational as opposed to transactional management (Tichy and Devanna, 1986).
„A transformational leader is a person who can literally transform and imbedded
organisational culture by creating a new vision of and for the organisation and
successfully selling the vision by rallying commitment and loyalty to transform the vision
into a reality‟ (Ott, 1989, P.5).
Transformational leadership people are the main concern of this model. Hence the leader
spends a lot of time talking to his employees and trying to learn more about them
specially their goals, and problems (Bass and Riggio, 2006). It symbolises a leadership
attitude is focused more on future potential than present. The different side of
transformational leadership show us about the different strategies in different times and
this will design the organisational future. Transformational leadership is adjusted towards
change
(Ibid) which involved the development of future perspectives. The
51
transformational leaders try to develop a vision of the preference structure, products,
work processes and practices in their department and implementing a plan to achieve
their goals.
Making reference to the Lewinian (1947) change framework. Schein (1985, P.322)
argues that „the leader must therefore be a skilled change manager who first learns what
the present state of culture is, unfreezes it, redefines and changes it, and then refreezes the
new assumptions‟.
On the other hand, Transactional leadership is focused on the current work process and
results and is therefore present oriented (Bass and Riggio, 2006). The features of present
oriented individuals include a practical attitude, a focus on reality rather than on
potentiality, a forceful pursuit of short-term projects but also low self-efficacy as well as
higher degrees of fatalism and risk-taking behaviour (Ibid).
2.7.3 Organisational culture and managers
Organisational culture is typically defined as how an organisation sees itself and how the
people within it feel about the organisation (Dwan, 2004). It includes staff commitment
to the organisation, how staffs respond to management, and what the organisation stands
for (Dwan, 2004). According to Schwartz and Davis (1981, P.33),
„culture … is a pattern of beliefs and expectations shared by the
organisation‟s members. These beliefs and expectations produce norms that
powerfully shape the behaviour of individuals and groups in the organisation.‟
Dwan (2004), Schwartz and Davis (1981) have offered useful definitions of
organisational culture. This is due to the fact that there are direct relationship between
human resources and organisations, and culture is a pattern of beliefs and expectations
shared by the organisation‟s members.
52
According to Lok and Crawford, (2004), organisational culture can influence how people
set personal and professional objectives, manage resources to achieve set objectives and
perform tasks. Organisational cultures involve the ways in which people consciously and
subconsciously think and make decisions and the ways in which they recognize, feel and
act (Hansen and Wernerfelt, 1989; Schein, 1992). Deal and Kennedy (1982) have
suggested that organisational culture can apply considerable influence in organisations.
They identify areas such as performance and commitment where this is most prevalent.
Also, researchers of organisational cultures have proposed different type of culture. For
instance, in 1998 Goffee and Jones identified four types of organisational culture,
“network”, “mercenary”, “fragmented” and “communal”. Wallach (1983) suggested that
there were three main types of organisational cultures; these are “bureaucratic”,
“supportive” and “innovation”. However, according to Lok and Crawford (2004), values,
attitudes and beliefs are reflected in different national cultures. How personal values fit in
with the existing organisational culture and the influence of national culture on personal
values could be a major cause of differences in how firms in Iran and the UK are
managed (Hofstede, 2001). For example (see Figure 2.7), the existence of high power
distance values and a bureaucratic culture in Iranian companies is well acknowledged
(Ibid). In Iranian companies important decisions are made by the owner and senior
manager (Morrtazavi, Tayab, and Amirshahi, 1999). Owner and executives are on top of
any bureaucratic structure in Iranian companies (Ibid). Direction and orders tend to be
top-down and there is little delegation or empowerment (Ibid).
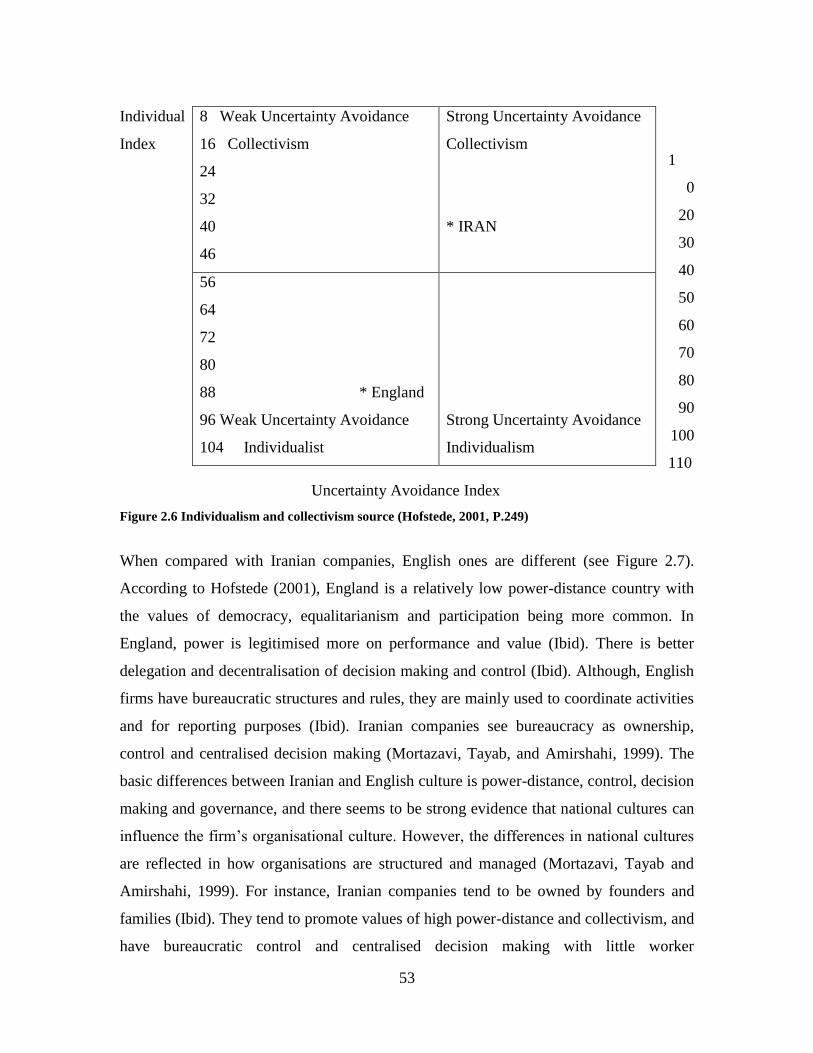
53
1
0
20
30
40
50
60
70
80
90
100
110
Uncertainty Avoidance Index
Figure 2.6 Individualism and collectivism source (Hofstede, 2001, P.249)
When compared with Iranian companies, English ones are different (see Figure 2.7).
According to Hofstede (2001), England is a relatively low power-distance country with
the values of democracy, equalitarianism and participation being more common. In
England, power is legitimised more on performance and value (Ibid). There is better
delegation and decentralisation of decision making and control (Ibid). Although, English
firms have bureaucratic structures and rules, they are mainly used to coordinate activities
and for reporting purposes (Ibid). Iranian companies see bureaucracy as ownership,
control and centralised decision making (Mortazavi, Tayab, and Amirshahi, 1999). The
basic differences between Iranian and English culture is power-distance, control, decision
making and governance, and there seems to be strong evidence that national cultures can
influence the firm‟s organisational culture. However, the differences in national cultures
are reflected in how organisations are structured and managed (Mortazavi, Tayab and
Amirshahi, 1999). For instance, Iranian companies tend to be owned by founders and
families (Ibid). They tend to promote values of high power-distance and collectivism, and
have bureaucratic control and centralised decision making with little worker
Individual
Index
8 Weak Uncertainty Avoidance
16 Collectivism
24
32
40
46
Strong Uncertainty Avoidance
Collectivism
* IRAN
56
64
72
80
88 * England
96 Weak Uncertainty Avoidance
104 Individualist
Strong Uncertainty Avoidance
Individualism

54
empowerment (Ibid). On the other hand, English companies tend to be owned by public
shareholders and run by professional managers (Hofstede, 2001). They tend to be less
bureaucratic and more empowering in their workers, and tend to promote individualism
and decentralised decision making (Ibid).
Figure 2.7 Culture frame work (Kanji, 2002)
Kanji‟s (2002) approach divides culture into 4 levels, “core values”, “espoused value”,
“behaviours”, and “artefacts”. According to Kanji (2002), core values are coming from
beliefs and assumptions at the heart of the organisational culture and he argues that core
values support all other element of the culture. Espoused values are derived from these
basic underlying assumptions and „espoused justifications of strategies, goals, and
55
philosophies‟ and that an organisation tries to hold or temporarily promotes to suit a
business need (Ibid). Finally, at the top level are artefacts which are defined as the things
we can observe in the work environment (Ibid). Kanji (2002) divided work environments
which we can observe to 11, those environments are, “image”, “philosophies”, “status
symbols”, “power structures”, “routines”, “office layout”, “language”, “stories”, “heroes
and villains”, “systems and processes” and “reward and recognition system”. The
researcher in this research is going to use these environments for his comparative study
between Iran and the UK in the cultural differentiation part of this thesis.
2.7.4.1 Discussion on culture and organisational culture
Organisation will be effective if its members are highly motivated (Demonstrating
work commitment and organisational commitment) (Stewart et al, 2006). If we look at
organisational effectiveness from this point of view we have to accept the existence of
a management function system and behaviour of staffs, which influence the levels of
motivation and performance. In addition, management performance and the behaviour
of staff predominantly originates from the values, attitudes and beliefs of management
and staff in relation to their job and the organisation. However, there is culture which
is influenced by national culture in every organisation which influences the behaviour
and performance of both management and staff (Schein, 1992).
The culture in an organisation provides a form of organisational actuality, this
actuality on form includes both a minor level of individual processes (daily behaviour
and the performance of the organisation‟s members) and a major level of
organisational processes (structure design, technologies applied and practical
activities). However, organisational culture as a set of common values, beliefs and
normalities related to the organisation, and nature of work is continually affected by
the environment in which the organisation exists and acts. In fact, the consistency and
growth of an organisation depends on the development of its suitable culture in order
to respond sufficiently to external environmental forces (Robbins et al., 2006). As the
effectiveness of as person depends on this ability to confront environmental
56
challenges, so the effectiveness of an organisation also depends on environmental
compatibility and creating a suitable organisational culture. Management should be
sensitive to environmental opportunities and intimidations in order to adopt policies,
which provide a better outcome with environment. This sensitivity refers to
understanding and responding to three major aspects of environment (Ronnins et al.,
2006):
a) Technical- economical b) political- legal c) cultural- social
The technical- economic environment is a base for making intimidations and
opportunities in terms of technical, financial and human resources which are all
considered as the necessities of the effective activity of organisations. So the success
of the organisation in properly responding to financial activity challenges, and
political environment which is dependents on economic conditions and the level of
existing technology.
The Legal and political environment also provides facilitating and preventive
conditions for the successful performance of organisations. For example, the
consistency of government direction (local, regional, and/or national) generates
commercial trust. A juridical system that provides protection against external
competition and a base for special working functions, and conventions is considered a
limitation or an opportunity for organisational well-being. Political considerations in
organisational management and bureaucratic barriers with which management is
involves also have an important role in organisational failure.
Finally, a cultural social environment (the national cultural of the individuals who
make the organisation) creates some challenges through the people in the organisation
and their interaction with customers. The cultural social environment of each society
determines values, methods, personal beliefs, attitudes and practical superiorities.
Since the activity of an organisation depends on the behaviour and perception of the
people who live in that society, organisational behaviour is deeply affected by the

57
cultural and social environment in which the organisation acts. Hence sensitivity to
social and cultural environment is of great importance, especially for the effective
management of the manpower in organisation (Bratton and Gold, 2007).
The results of the studies were taken from international commerce and cross- cultural
management studies. This has been considered as a factor in organisational
effectiveness in a country or among different countries (Bratton and Gold, 2007), and
also refers to environmental variables.
However, scientific researchers have questioned the difference between environmental
and cultural variables in developing and industrial countries and the way the
management can deal with them in order to increase effectiveness. (Rabbins et al.,
2006).
Most of our knowledge and information about the quality of the management of human
resources in organisations is gained from social science researchers and the theories and
management activities in developed countries, especially America and the UK. It should
be noted that social technologies and knowledge which have been successful in the
cultural and social conditions of one country do not necessarily work effectively in other
countries, because environmental variables play a very important role in defining the
performance and effectiveness of an organisation.
Those groups of development techniques, which note the cultural- social characteristics
of a society, are more suitable for organisations. The situation of industrialised Asian
countries such as Japan, South Korea, Taiwan, Singapore, Hong Kong and lately
Malaysia is an example for this claim. The success of organisations in these countries
results from the management style and work attitudes which are rooted in Confucian
values such as loyalty to family and respecting traditional structures, and it is not
necessarily related to American and European values (Al-Zamany, 2002). Imitating
Western development techniques is based on the idea that the social- cultural
characteristics of developing societies, which are generally called “traditionalist”, and it
might be harmful for economic development.
58
However, environmental changes in these dimensions have an important effect on
environmental behaviour as well as the behaviour of people and groups in
organisations. As Triandrs says, predictability implies the complexity of environment,
therefore, many predictable environments are simpler than unpredictable environments
and very complicated and simple societies both live in very predictable environments.
The industrial organisation in industrial countries shows a high level of complexity in
which many companies are providing products and services. The feature of
development means that bases are established very well, offering an experienced work
force, and the relationships between commercial companies and the government have
been developed to the extent that they facilitate free trade and/or at least, are not a
barrier to it. Therefore, the environment of developing countries shows complexity in
a different form. Developing countries are no more representing agricultural society
and are heading towards becoming industrialized and modernized. Sometimes, the
environment of developing countries becomes complicated due to lack of resources for
attaining desirable development. Therefore the complexity, is not only made by the
existing things but, also, is made by the things don‟t exist. Organisational objectives,
which are usually contradictory, cause some problems for effective management. In
addition, the environment of developing countries can be considered relatively
unpredictable. In most developing countries the political and legal atmosphere is
relatively inconstant. Most of the time they shows some special characteristics of weak
societies and it seems that illegal activities have been conventional in these countries.
In such environments, access to technical resources and skilled human resources is
confronted by many difficulties. So, the challenges which the management in
developing countries confronts naturally are different from those the managers in
industrial countries confront. Hence, the management of organisations in developing
countries need a different approach and distinct abilities in order to achieve success. In
order to become consistent with the environment, organisations adopt several
techniques such as the lack of long range planning with an unclear view of goals, the
absence of time management, the lack of entrepreneurship and low or average risk
taking and a behaviour which reflects the lack of trust in the system in responding the
59
complicated and unpredictable economic and political environment of developing
countries. Such impractical techniques, which are adopted for confrontation with
environment, act as an obstruction in the effectiveness of organisations. Consequently
it is necessary that such issues be noted in providing the theories of indigenous
management. (Rabbins et al., 2006)
Thus, making important environmental changes in order to make it easier and more
predictable is necessary within the framework of development discussions. The
changes that should be made to strengthen proper behaviour consist of providing
enough financial resources, raising and lifting the level of professional training,
developing technology, preventing political interventions, administrative and judicial
reform, training management, extension of time management and reforming reward
system.
2.7.4.2 Criticisms of the concept of organisational culture
Although the concept of organisational culture is widely used to aid the study of
management and organisations there are those who question its value, for example, those
authors associated with „Critical Management Studies‟ like Clegg et al, (2006). They
have traditionally rejected the analysis of organisations from a managerial perspective
that seeks to improve organisational efficiency and effectiveness. In this context one of
the best known criticisms of organisational culture as a tool of domination by manager
has been put forward by Willmott (1993). He draws attention to what he calls the „dark
side‟ of the emphasis on organisational culture, which he argues seeks to subjugate and
control employees.
Other Writers associated with Critical Management Theory have emphasised cultural
fragmentation rather than unity. They have gone on to put concepts such as flux and
ambiguity at the centre of their analysis of organisational culture. Lewis et al (2003)
provides a useful overview of such approaches in their study of organisational culture in
multi-agency development projects. In their research, they tried to give views about
anthropologists working on organisation studies, many of whom researchers are critical
60
of organisations theory. The researches like Peters and Waterman (1982) are almost
exclusively positivists, attempting to operationalise concepts so that they can be
measured (Wright, 1994). In comparative management studies organisational culture is
considered to be a background factor, an explanatory variable and a broad framework in
the development and reinforcement of beliefs. This supports a positivist approach to
organisational culture. On the other hand, Wright (1994) disagrees, she believes, „culture
is a process rather than thing‟ which direct us away from viewing organisations as
bounded entities seeking to accomplish tasks and challenges us to look more closely at
the continuous „process of organising‟, which gives meanings and structures everyday
organisational life. This view also affects the idea of culture not as a unitary, but as
mindsets, or as a complex set of conflicting sub-cultures (Lewis et al, 2003).
Another important critique of organisational cultures questions whether culture itself is
the right tool for the analysis of organised action (Ibid). Douglas (1992, P.167) criticises
the tendency to use culture as an all-purpose explanation or as „an extra resource to be
wheeled in after other explanations are defeated‟ (Lewis et al, 2003). Similar view from
Kuper (1999), he believes culture is as a „partial explanation‟, which needs to put
alongside the external environment (politic, economic and social). Douglas (1992)
studied a comparative study of labour markets in Britain and Sweden; in his research he
believes „analysis of values and their relationship to organisational forms is far more
useful than generalised notion of culture‟. Douglas (1992, P.176) explains culture as „the
package of values that are cited in the regular normative discussions that shape an
institution‟.
However, the researcher believes, several frame works have proven useful for
understanding culture difference, like Hofstede, Shein, and Trompenaars. These
researchers have helped to establish some relatively universal concepts (e.g.,
individualism, and power distance) that useful in understanding difference across culture.
But, few researchers have attempted to understand the impact these behavioural
differences have in different national context. Denison‟s (2000) research has developed
important model of organisational culture and effectiveness and a validated method of
61
measurement. As the researcher considers, organisational culture dimensions were not as
famous as national culture dimensions in finding differences among cultures in
organisation studies. Organisational culture dimensions are interesting to examine
differences in specific and detailed functions among organisations. Organisational culture
dimensions are appropriate for consideration of specific details in organisation. In other
words, in this research national culture dimension and organisational culture dimension
will be used, because national culture dimensions and organisational culture dimension
will be effective to achieving the objective of research.
62
2.8 Summary
This chapter has examined the concept of culture and concentrated on national and
organisational culture. Cultural dimensions were also explained. In the openion of the
researcher, dimensions of organisational culture were not as important as national cultural
dimensions in explaining differences among cultures in organisation studies in different
countries. Organisational culture dimensions are useful when investigating differences in
specific and detailed functions among organisation. Organisational culture dimensions
are appropriate for consideration of specific details in organisation. However, in this
research national culture and organisational culture dimension will be used, because
national cultural dimensions and organisational culture dimension will be effective to
achieving the objectives of the research.
Although organisational culture is known as a main concept in organisational theory, it
has often involved differing and sometimes inconsistent definitions (Bourantas et al.,
1990). According to various definitions, organisational culture includes a wide range of
aspects of work organisations' life, like basic assumptions, values and artefacts (Schein,
1992); beliefs, rituals, and ceremonies (Sathe, 1983); language, symbols, stories, and
ceremonies (Pettigrew, 1979; Wilkins and Ouchi, 1983); and contradictions, ironies and
ambiguities (Martin, 2002). Smircich (1983) provides insights into the differing
perspectives of organisational culture and argues that organisational culture is viewed as
both what an organisation “is” and as what an organisation “has”. The intense interest in
the association of culture with the different facets of organisational effectiveness in the
1980s and 1990s generated a great deal of research in which culture was examined in a
positivistic light. Such studies treat organisational culture as a variable. Those who
viewed organisational culture as what an organisation “is” adopted a qualitative
methodology (e.g. Martin et al., 2006; Alvesson, 2002; Schein, 1996). However, other
researchers who used an integrated approach, combining qualitative and quantitative
methods in their empirical studies (e.g. Hofstede et al., 1990; Denison and Mishra, 1995;
Fey and Denison, 2003). This research explores the association of culture with TQM, and
qualitative and quantitative methods will be used.
63
Many cross-cultural researchers have investigated different organisations in different
countries by using national culture dimensions and organisational culture dimension
together. To a great extent national culture dimensions complete the objective of cross-
cultural research. In this research, Hofstede‟s national culture dimension like power
distance, uncertainty avoidance and individualism will be more useful to measure the
national culture, and Denison dimension will be more useful to measure the
organisational culture, because the researcher is looking for impact of organisational
culture and national culture on total quality management. Those dimensions are
appropriate, because the researcher believes that they are important when making
international comparisons between Iranian and the UK society and organisations.
Therefore, the above explanation leads us to propose the important effect of cultural
differences on management and total quality management in organisation.
It is clear after considering the culture, national culture and organisational culture that
this research needs an in depth study in Iran and the UK. This type of study is required to
give readers a clear view of culture in Iran and the UK, and this opens the door to
understand organisational culture differences across different countries.
64
Chapter Three (Total Quality Management)
65
3. Introduction
Total quality management (TQM) has been a fundamental business strategy of the
world‟s leading organisations, such as Xerox, Motorola etc., throughout the 1980s and
1990s. Much has been written on the TQM philosophy and methods by quality
practitioners or gurus such as Crosby (1979), Deming (1986) and others. These
individuals have been highly critical of western management practices and have used
Japan as an example for the development of their concepts and principles. While western
managers have been preoccupied with the debate on trade policies, Japanese managers
have been achieving vast improvements in organisational performance by reducing defect
rates, increasing reliability levels, and product performance by applying the basic
principles of TQM (Kartha, 2004).
Now the researcher is going to explain TQM with definition of quality and quality
management and total quality management and then examine some theories of TQM.
3.1. Definition of Quality and Total Quality
In this part the researcher will explain quality, in the second part the researcher will
explain Total Quality, and in the next section the researcher will explain Total Quality
Management by using important contributions from the literature.
In terms of TQM, it is important to know what quality means. Quality is something such
as size, colour, feel or weight that makes one thing different from other thing or
according to Bright and Cooper, „“Quality” is often used as an adjective, and has become
synonymous with elegance and luxury. A more accurate use refers to comparative degree
of excellence by which products and services may be judged.‟(1993, P.21)
Other authors like, Juran (1988), Crosby (1984), Feigenbaum (1986), and Deming (1986)
have different view about quality. Their definitions of quality as Flood (1995, P.42) said
in his book, include:
66
„Quality is fitness for use- Juran (1988)
Quality is conformance to requirements- Crosby (1984)
Quality is in its essence a way of managing the organization- Feigenbaum (1986)
Quality is a predictable degree of uniformity and depend ability, at low cost and
suited to the market- Deming‟ (1986)
The definition of quality depends on orientation and purpose of the individual involved.
According to Reeves and Bednar (1994), no single definition of quality fits every
situation with respect to measurement, usefulness to management, and relevance to
customers. However, Garvin (1987) explains the multidimensional nature of quality by
explaining a five bases‟ system with eight dimensions. The five bases‟ system are;
“transcendental”, “product”, “user”, “manufacturing”, and “value”. The eight dimensions
are; “performance”, “features”, “reliability”, “conformance”, “durability”,
“serviceability”, “aesthetically”, “perceived quality”. Consequently, organisations must
meet one or more of these dimensions and they need to determine which of these are
crucial in the eyes of the customer.
As TQM deals with quality it seems reasonable that an essential step toward
understanding the meaning of TQM would require an understanding of the word quality
and all of these definitions shows satisfaction of customers‟ needs and the demand of
customers at the centre of the concept of quality. For example, Juran (1974, P.2-2)
considers quality as „fitness for use‟. Juran‟s definition emphasizes the customer
perspective. It is the customer who decides what products or service to buy. This implies
that the user determines the quality of the products or service that best satisfies his/her
needs. According to Juran (1994), quality is achieved when the requirements or
expectations of the customer from goods or service are satisfied. This reflects his strong
orientation towards meeting customer expectations.
The new researchers are not any different from the quality gurus in defining quality and
emphasising the satisfaction of customer as an indicator of quality. Bregman and Klesfjo
(1994) consider the quality of the product, as its ability to satisfy the needs and
67
expectations of the customers. In addition Oakland (2003, P.4) offers a convenient
definition of quality, which is free of many of the ambiguities in some other attempts, it is
„meeting the customer requirements‟. These needs may include availability, delivery,
reliability, maintainability, and cost effectiveness, among many other features, (Oakland,
2003). Its clear that there is a similarity between two researchers‟ definition of quality
(Oakland, and Juran) as both of them suggest quality is the most important aspect of
customer expectations. These efforts to define the term quality are only a small but
important sample of those found it in the literature. Furthermore, it is clear that the main
aspect of definitions is the customer, except Crosby‟s definition, which is a
manufacturing based one but even here quality will a part of the products, which
customers require.
3.2. Definition of Total Quality Management (TQM)
The concept of TQM can have the same elusiveness as the many definitions of “quality”.
As Reed et al. (1996) indicated, there is no consensus on the definition for TQM. TQM
definitions can vary based on the approach taken toward quality.
Flynn et al. (1994) defined TQM as:
„An integrated approach to achieving and sustaining high quality output, focusing on the
maintenance and continuous improvement of processes and defect prevention at all levels
and in all functions of the organisation, in order to meet or exceed customer
expectations.‟
The literature on TQM shows that there is general harmony on the importance of quality
management and on the basis in which it should be managed (Gehani, 1993, Raturi and`
McCutcheon, 1990). One of the interesting explanations of this is from Hill and
Wilkinson (1995). They argue that Total Quality Management (TQM) is a „notoriously
imprecise term‟ and according to Hill and Wilkinson (1990) there are number of reasons
for this. One of the reasons is the many authors on quality management have been short
68
on analysis but long on prescription and another reason is that practitioners like to use
ther term to explain a very wide range of practices (Ibid).
However Hill and Wilkinson (1995) make further important points in the discussion
about the meaning of Total Quality Management. One is that quality experts have been
disinclined „… to refer to previous management literature or indeed to reference much
outside quality management field‟ (Ibid). However, this literature tries to identify and
define the basic elements of Total Quality Management (TQM), and Hill and Wilkinson
(1995) recognise TQM as a way of managing or philosophising management by drawing
from work by Crosby (1979), Deming (1986), Feigenbaum (1983), Ishikawa (1985) and
Juran (1980). In their option, TQM is an organisation-wide approach based on three
important elements. These elements are “customer orientation”, “process orientation”,
and “continuous improvement”.
These three elements, as discussed, are implemented in a specific manner and the mode
of implementation‟s is itself a definition of TQM‟s future. Implementation is by means of
appropriate improvement tools, measurement systems and the processes of management
and organisation.
According to Zairi and Youssef (1995) TQM is:
„A positive attempt by the organisation concerned to improve structural, infrastructure,
attitudinal, behavioural and methodological ways of delivering to the end customer, with
emphasis on consistency improvements in quality, competitive enhancements, all with
the aim of satisfying or delighting the end customer.‟
Orkland in (2000) explains TQM as „a comprehensive approach to improving
competitiveness, effectiveness and flexibility through planning, organizing, and
understanding each activity and involving everyone at each level‟.
Another way to see TQM is to divide TQM in three words:
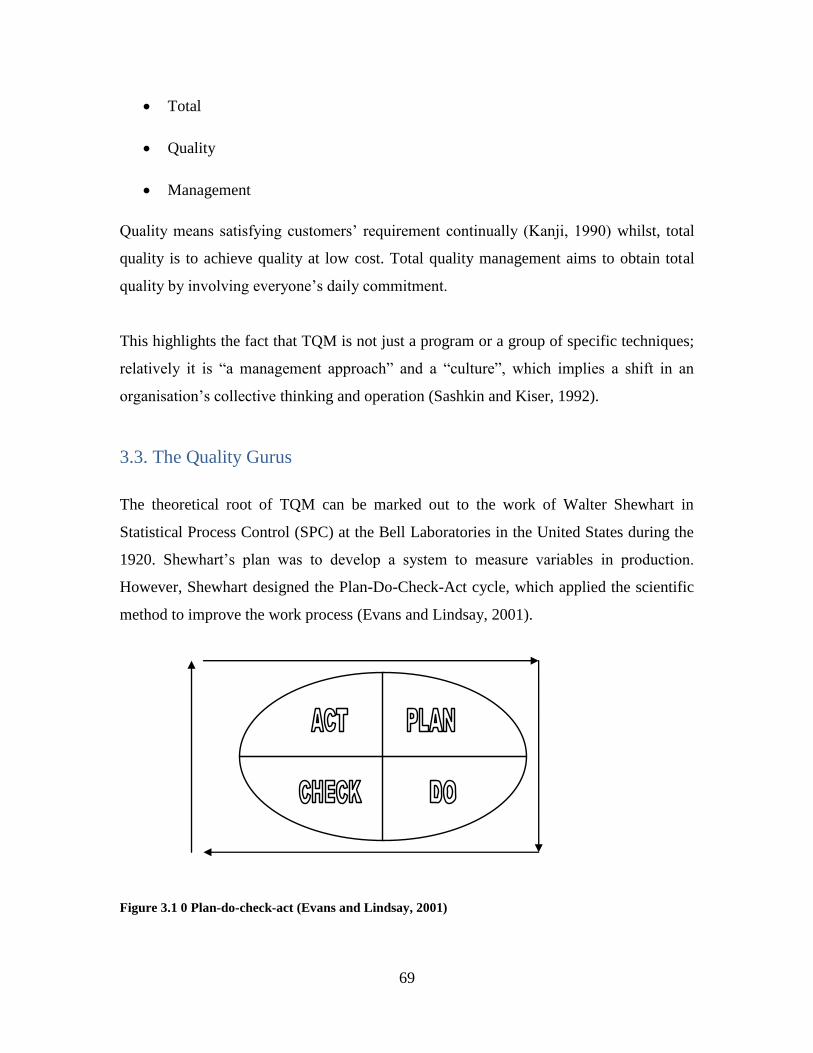
69
Total
Quality
Management
Quality means satisfying customers‟ requirement continually (Kanji, 1990) whilst, total
quality is to achieve quality at low cost. Total quality management aims to obtain total
quality by involving everyone‟s daily commitment.
This highlights the fact that TQM is not just a program or a group of specific techniques;
relatively it is “a management approach” and a “culture”, which implies a shift in an
organisation‟s collective thinking and operation (Sashkin and Kiser, 1992).
3.3. The Quality Gurus
The theoretical root of TQM can be marked out to the work of Walter Shewhart in
Statistical Process Control (SPC) at the Bell Laboratories in the United States during the
1920. Shewhart‟s plan was to develop a system to measure variables in production.
However, Shewhart designed the Plan-Do-Check-Act cycle, which applied the scientific
method to improve the work process (Evans and Lindsay, 2001).
Figure 3.1 0 Plan-do-check-act (Evans and Lindsay, 2001)

70
Additionally, the PDCA cycle is a structured approach to continuous improvement and
problem solving known as the Deming / Shewart cycle. Deming generalised the PDCA
cycle to any type of improvement activity and made it an integral part of quality
improvement. Deming (1986) recommends this cycle as a model for improvement and as
a procedure for finding special causes of variation.
However, Shewhart‟s work was on the statistical control of process and the control chart
established a foundation for the quality of management movement (Evans and Lindsay,
2001). Following Shehart, the three main persons lead the way in the quality movement
emerged, “Edward W. Deming”, “Joseph M. Juran”, and “Philip B. Crosby”. The
contribution of Deming, Juran, and Crosby to improving quality has had a profound
impact on countless managers and organisation around the world. Other, theories,
important to the revolution in quality management, include Armand V. Feigenbaurn,
Ishikawa, Bill Conway, Genichi Taguchi, Shigeo Shingo, and W.G. Ouchi. In the next
sections, I will explain these contributors to our present day understanding of TQM.
3.3.1 Deming Philosophy
Deming was the first to introduce quality principles to the Japanese on a large scale. He
met Schewart in 1927. It was from him that Deming learned the basic concept of
statistical quality control and Deming is now a national hero in Japan. Deming went to
Japan and started them on the path to Total Quality and to be competitive. His thrust was
by the use of statistics to improve quality and productivity. This has resulted in
high/quality low cost products giving value for money to the customer. Deming‟s theory
on quality is summarized in his “14 points” as Flood (1995, P.15) summarizes below:
1) „Create constancy of purpose to improve product and service,‟ (Deming, 1986)
with the aim to become competitive and to stay in business, and to provide.
2) „Adapt a new philosophy for new economic age.‟ (Flood, 1986) We can no longer
live with commonly accepted levels of delays, mistake, defective materials and
defective workmanship.
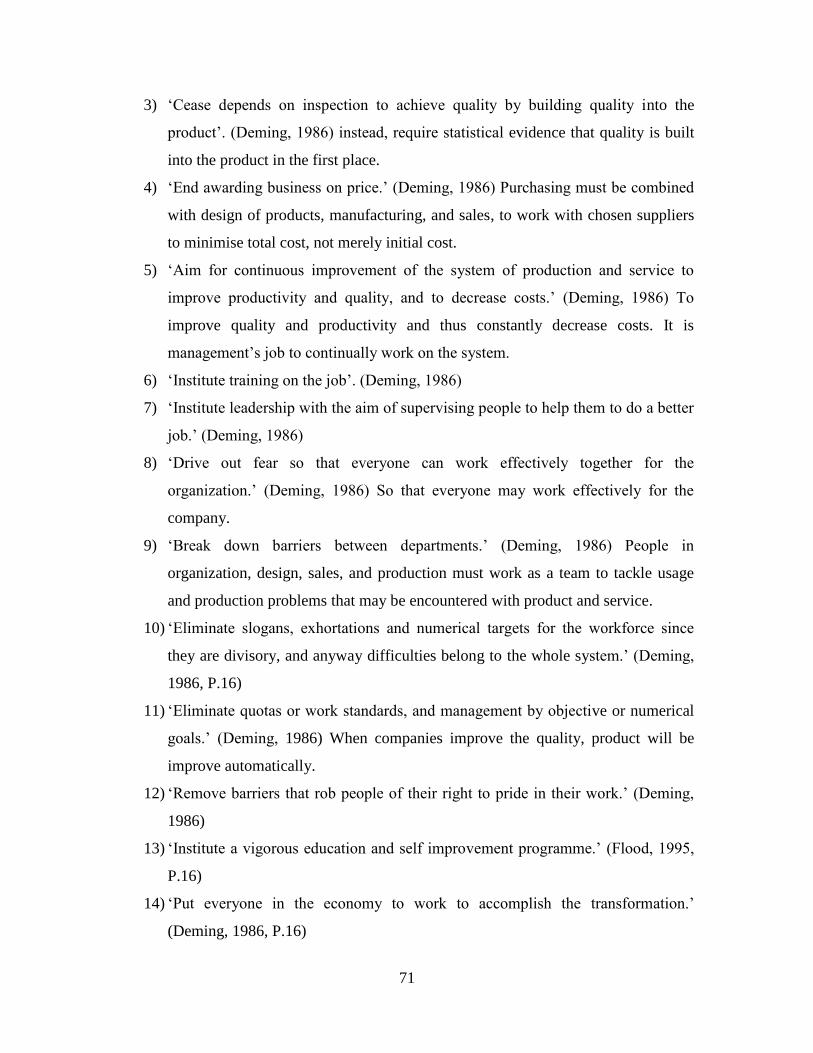
71
3) „Cease depends on inspection to achieve quality by building quality into the
product‟. (Deming, 1986) instead, require statistical evidence that quality is built
into the product in the first place.
4) „End awarding business on price.‟ (Deming, 1986) Purchasing must be combined
with design of products, manufacturing, and sales, to work with chosen suppliers
to minimise total cost, not merely initial cost.
5) „Aim for continuous improvement of the system of production and service to
improve productivity and quality, and to decrease costs.‟ (Deming, 1986) To
improve quality and productivity and thus constantly decrease costs. It is
management‟s job to continually work on the system.
6) „Institute training on the job‟. (Deming, 1986)
7) „Institute leadership with the aim of supervising people to help them to do a better
job.‟ (Deming, 1986)
8) „Drive out fear so that everyone can work effectively together for the
organization.‟ (Deming, 1986) So that everyone may work effectively for the
company.
9) „Break down barriers between departments.‟ (Deming, 1986) People in
organization, design, sales, and production must work as a team to tackle usage
and production problems that may be encountered with product and service.
10) „Eliminate slogans, exhortations and numerical targets for the workforce since
they are divisory, and anyway difficulties belong to the whole system.‟ (Deming,
1986, P.16)
11) „Eliminate quotas or work standards, and management by objective or numerical
goals.‟ (Deming, 1986) When companies improve the quality, product will be
improve automatically.
12) „Remove barriers that rob people of their right to pride in their work.‟ (Deming,
1986)
13) „Institute a vigorous education and self improvement programme.‟ (Flood, 1995,
P.16)
14) „Put everyone in the economy to work to accomplish the transformation.‟
(Deming, 1986, P.16)
72
When we think about the 14 points of Deming view, we can find many strengths and
some weakness. According to Flood (1995, P.17) the main strengths are, „Deming make a
notable prioritisation-that management comes before technology … leadership and
motivation of employees are recognised as important.‟ We can see of his strengths,
Deming has most focus on leadership and motivation of employees. And different
cultures like Japan and North America have responded to in different ways. For example
the Japanese like work group work but North Americans prefers individual work. But the
main things is, Deming outlined a new theory of management based on 14 points, which
„… provide criteria by which anyone in the company may measure the performance of
management‟ (Deming, 1986).
3.3.2 Joseph Juran
Juran is regarded as one of the prime architects of the quality initiative in Japan. In 1951
he published the first edition of quality control‟s handbook, which later became a seminal
work in the area and provided him with high reputation as member of the quality gurus.
He was assigned to the inspection function at Western Electric Hawthorne in 1924.
His approach to quality involved three basic processes. These processes are: quality
planning, quality control and quality improvement. According to Juran, quality planning
starts from identifying the process and the customer. This definition of the customer
includes external and internal customer.
By quality control, Juran meant that attention must be given to the critical element that
needed to be controlled. This requires identification of such elements as, definition of
measures and methods of measurement, and establishment of performance standards. In
this regard, Juran advocated quality control to be delegated to the lowest possible level,
and that if possible, it should be accomplished by the workers responsible for doing the
task. This requires widespread training in data collection and problem-solving techniques.
73
Juran believes that quality is the responsibility of all employees rather than of a
specialised department. He emphasised the concept of management for quality and
getting it right first time rather than inspecting it into finished product.
He called the errors made during the initial planning as chronic waste. He also created the
concept of cost quality (Juran, and Gryna, 1993), as he felt that a cost measure would be
an effective form of communication with management as he agrees with Deming that
quality problems are mostly attributed to management, not workers.
However, Juran is unlike Deming according to Flood (1995, P.18), Juran‟s view is, „the
vast majority of quality issues are the direct responsibility of management.‟ He said,
introducing quality into an organisation has to start at top level of organization.
Juran stresses 3 mains points (Juran, 1988):
1) “Quality planning”, it has the following steps:
„Determine quality goals
Develop plans to meet those goals
Identify the resources to meet those goal
Translate the goals into quality
Summarise first 4 steps into a quality plan‟ (Juran, 1988, P.19)
2) “Quality control”, it means having a simple feedback structure:
„Evaluate performance
Compare performance with set goals
Take action on the difference‟ (Juran, 1988, P.19)
3) “Quality improvement”, that means improve on by past these:
„Reducing wastage
Improving delivery
Enhancing employees‟ satisfaction
Becoming more profitable
Ensuring grater customer satisfaction‟ (Juran, 1988, P.19)
74
Juran‟s philosophy and main principles are clear enough but some argue taht these points
show his concern about recent work in quality has lost touch with the basic management
needs of organisations (Flood, 1995, P.19). Too often we think that the customer is the
customer, the end receiver of the product or service. But the customer according to Juran,
(Juran, 1988, P.20) should both „internal and external; anyone who we are providing a
product or service to.‟
3.3.3 Philip Crosby
Crosby described quality as free and argued that Zero defects was a desirable and
achieved goal. He believes that the cost of running a quality programme in an
organisation can be more than offset with the financial benefits of satisfied customer.
Crosby‟s quality definition is „conformance to requirements‟ his saying is „quality is
free‟.
He recognized that improving quality through increasing inspection efforts would
increase cost; he insisted that the way to achieve zero defects was to improve prevention
measures and techniques.
Crosby (1979) developed what he called the four absolutes of quality management to
articulate his view of quality:
1. Quality means conformance to requirement, and requirement needed to be clearly
specified so that everyone knew what was expected them.
2. Quality comes from prevention, and prevention was a result of training,
discipline, example, leadership, and more.
3. Quality performance standard is zero defects. Errors should not be tolerated.
4. Quality measurement is the price of non-conformance.
Crosby proposed a 14 points programme to improve quality:

75
Demonstrate management commitment by being convinced that quality
improvement is needed and subscribing to a written quality policy. This policy
should specify clearly that each person is expected to perform exactly as specified
or cause the specification to be changed to match the needs of the company or the
customer.
Form quality improvement teams. These should be cross-functional and include
department heads to oversee the quality improvement process. The team of
department heads should be responsible for promoting quality through the entire
company.
Establish measurements for quality in all activities. Although many of these
measures could be error rates, he also included some others. As examples, he
suggested that accounting could use the percentage of late reports; plant
engineering could use time lost because of equipment failures.
Evaluate the cost of quality and use it to identify where quality improvement
could be profitably made.
Raise the awareness of quality through the organisation. Get employees involved
by making them aware of costs.
Take corrective action to improve quality in areas identified in the previous steps.
Plan for Zero defects. Using members of the quality improvement team, plan a
zero defects program that fits the company and its culture.
Train all employees to carry out their part of their quality improvement program.
Hold a Zero Defects Day to signal to all employees that the company has
established a new performance standard.
Encourage people to set goals for themselves and their groups. These goals should
be specific and measurable, and progress should be measured against them.
Remove obstacles that prevent employees from achieving these goals by
encouraging them to report this obstacle management.
Provide recognition for those who participate. This should be public and none-
financial.
Establish quality councils consisting of team chairpersons and quality
professionals. They should meet regularly, share experiences and generate ideas.
76
Do it all over again to stress that quality improvement is a continuous process.
Crosby also developed a management maturity grid in which he lists five different stages
that include uncertainty, awakening, enlightenment, wisdom and certainty. In the
uncertainty stage, management fails to see quality as tool, fire fighting is the means to
handle problems, which are rarely resolved, and there are no organised activities for
quality improvement. However, in the fifth stage, certainty, the organisations is
persuaded that quality is important and essential for success, problems are generally
prevented, and quality improvement activities are organised, regular and continuing.
3.3.4 Armand Feigenbaum
Early in 1950s Feigenbaum (1991) defined total quality as „an effective system for
integrating the quality development, quality maintenance, and quality improvement
efforts of the various groups in an organisation so as to enable production and service at
the most economic levels which allow „customer satisfaction‟.
Feigenbaum originated the industrial cycle, which includes marketing, design,
production, installation and service elements. This industrial cycle is considered
nowadays essential in the quality management in an organisation, and in managing a
quality management as BS EN ISO 9000 (James, 1996).
Feigenbaum also champions the idea of the hidden plant. This introduced the idea that
waste lowered the real capacity of a plant because of rework and not actually getting it
right first time. Unlike other gurus who argued that their approaches can be used for any
process in the organisation, Feigenbaum limits his focus on the quality of the products or
service produced by the organisation (Feigenbaum, 1983).
Feigenbaum believes that quality organisation must provide some bases for world class
quality leadership to succeed in the global market of the 1990‟s. He mentions three major
requirements for such world class quality leadership:
77
Full understanding of the market
Quality strategy to satisfy the customer in the global markets.
Development of quality organisation culture and an environment promoting and
fostering quality leadership.
3.3.5 Kaoru Ishikawa
An applied chemistry graduate from the University of Tokyo in 1939, Ishikawa
advocated the use of statistical methods and fully committed his life to the promotion of
Total Quality throughout Japan. Ishikawa was best known for his contribution to quality
management through statistical quality control.
He developed the fishbone diagram (Known as Ishikawa diagram) and the employment
of other important tools of the quality movement. This helped improving the capabilities
of Japanese organisations in the usage of problem solving techniques. These tools are:
cause and effect „fishbone‟ diagram, Pareto analysis, histograms, check sheets, scatter
diagrams, control charts, process control charts, and satisfaction graphs.
Ishikawa defined the customer as the next person in the line, the person who gets your
work, and anybody who relies on you. He initiated the quality control circles, which
involved forming teams of workers to solve problems related to quality.
Ishikawa‟s philosophy is based on his belied of workforce education. Educated workers
can deal with quality problems as they can understand the problems and can implement
the solution with the support of management.
Ishikawa realised the value of using teams in solving quality related problems. Quality
circles were formed from 5-10 workers who understood the problem and who could
implement the solution. On a voluntarily basis, workers form circles to solve a problem
or to make use of an opportunity for improvement. If the solution was considered

78
appropriate by those workers, they standardise the activities to become part of their daily
work. The process used by the circle was a standard process that all Japanese companies
were trained to implement by the Japanese Union of Scientist and Engineers.
Ishikawa was a strong believer in the philosophy of company – wide quality control. He
created methods that could be taught to large number of people. He used the concepts
developed by Deming and Juran and brought them to level of the common worker.
3.4. Evolution of Total Quality Management
The concept of quality has evolved gradually. The development in the perception and
management of the quality movement can be directly traced back to the roots of the
principles of scientific management in the work of Shehart (1931), Crosby (1979),
Ishikawa (1985), Deming (1986), Juran (1988). They along with others have provided a
steady stream of contributions to the field of quality management. Zairi (1994) outlines
the evolution of quality concepts and points out that they have evolved from two
extremes:
From control driven to culturally driven: and
From controlling-in to managing-in quality
Feigbaum (1991) identified the following six phases in the evolution of quality:
1. Operator quality control was developed before 1900. In this stage, one worker or
very small group of workers was responsible for the manufacture of products.
(Each worker could easily control the quality of his or her own work) (Ibid)
2. Fore man quality control was practised between 1900 and 1918. It started about as
a result of mass production, which is characterised by the division of labour,
specialisation of skills and standardisation. The classical management approach
known as the scientific management method was initiated by Fredrick Taylore
and became very popular. Workers performing similar tasks were grouped under
79
the supervision of a foreman who then assumes responsibility for the quality of
his group‟s output.
3. Inspection quality control was developed during the First World War. By World
War II, the manufacturing system had become more complex and large numbers
of workers were reporting to each foreman who could quite easily have lost
control of the work. As a result, it was necessary to engage full-time quality
inspectors.
4. Statistical quality control peaked in the period between 1937 and 1960. There
became an increased need for quality inspection in the late mass-production era
because the volume and variety of components increased dramatically. Due to the
huge costs involved in quality inspection, Taylor‟s scientific management
approach became inappropriate. Statistical quality control concentrated on the
statistical tools and made the quality inspection rather than complete inspection.
However, its slow growth was not due to its development of technical and
statistical ideas but to other problems, which included process capability,
incoming material control, design control and ability of business. Consequently,
the fifth phase, total quality control, was evolved. As organisations began looking
for better ways for management to reduce inspection costs, Deming (1986)
introduced the ideal of statistical quality process control to aid Japanese industries
in their post-war reconstruction. The importance of quality control was now
widely recognised in the business world. Deming taught the Japanese statistical
techniques as a means of ensuring quality in production. He also offered his
fourteen points as the quality improvement path.
5. The Total Quality Control (TQC) phase started in the 1960‟s. Organisations that
adopted TQC found it possible to examine designs regularly, to analyse while the
products was in process and to take action at the manufacturing stage or source of
supply. It also provided the structure in which early statistical quality control tools
could be joined by additional techniques. For example, reliability, quality
information equipment, and quality motivation were linked with modern quality
control and with the overall quality function of business. During the 1960, some
80
researchers like Feigenbaum (1991) and Ishikawa (1985) extended the idea of
quality control and considered its management implications. The strategic focus,
which concentrated on customers, broadened the responsibility and scope of
quality control. This quality approach expanded beyond statistics and included
ideas of quality systems, quality costs, and quality assurance. It was known as
total quality control (Feigbaum, 1991) and included Total Quality Management.
6. Total Quality Management (TQM) is a term that was initially coined by the
Department of Defence in the United States (Evans and Lindsay, 2001). TQM
evolved during 1980 and began to have a major impact upon management and
engineering approaches to long-term success through customer satisfaction. It is
based on the participation of all members of an organisation in improving process,
products, services and the culture which they work. Garvin (1988) outlined the
evaluation of TQM as the outcome of four major eras of development. Garvin
(1988) described the evolutionary process where quality has moved from an
initial stage of inspecting, sorting and correcting standards to an era of developing
quality manuals and controlling process performance. The third stage was to
develop systems for third-party certification, more comprehensive manual
including areas of an organisation other than production, and the use of standard
techniques such as SPC. The present and fourth era of TQM is primarily strategic
in nature with continuous improvement as its driving force.
Mongelsdorf (1999), in tracing the evaluation of TQM thought and application, has
provided an up-to-date indication of how the various threads of TQM theory have
worked together to create the immediate, present-day impact of TQM. That present
impact Mangelsdorf (1999) argues as “an integrative management system based on
TQM”, as opposed to simply “quality management”. In his view, companies
themselves, through their exposure to and involvement with the various quality
theories and concerns over time, have extracted, implemented, adapted, and refined
whatever was essential for themselves. By the 1990‟s quality programmes for
productivity and innovation had been intensified to respond to new, often harsh,
81
world conditions and possibility. Quality management provided the basis for “a new
approach in business management for the turn-around” (Mangelsdorf, 1999).
3.5 Quality management in the global context
International/global quality management aims at understanding quality management in
the global context. Kathawala and Nanda (1989) were the first to address this issue.
However, the importance of global quality management, its definition, components and
essentials first appeared in a special issue on global quality management in the Journal of
Decision Sciences (1995, Vol. 26, P.5). Kim and Chang (1995) argued that
international/global quality management should be researched systematically. They
conceptualised global quality management (GQM) as the next generation of TQM. They
defined GQM as:
„The strategic planning and integration of products and processes to achieve higher
customer acceptance and low organisational disfunctionality across country market‟ (Kim
and Chang, 1995)
The concept of GOM serves as the motivation for developing a global quality
management standard for evaluating quality management practices between countries
(Rao et al., 1999). It also affect the practice of quality management, from the national to
global level (Kim and Chang, 1995, Chase, 1998), which helps firms to compete globally
and gain a competitive edge in the global market (Chase, 1998. Fawcett et al, 2000, Liu
and Kleuner, 2001, Dervitsiotis, 2001). To be competitive globally, firms need to have a
leadership role in quality (Feigenbaum, 1994). The study of global quality management
serves as a benchmarking tool for achieving this competitive advantage (Jarrar and Zairi,
2001), and a basis for international language and business performance in the global
context (Feigenbaum, 1997).
Early studies on international quality practices were mainly focused on developed
countries such as the US and Japan (Benson et al., 1991, Ebrahimpour & Johnson, 1992,
82
Garvin, 1986, Flynn, 1992, Hull et al, 1988, Reitsperger and Daniel, 1991, Raval, 1992,
Richardson, 1993, Rogers, 1993), Moreover, the empirical literature has extended its
scope by studying and comparing quality management practices in other developed and
developing countries, for example India (Rao et al, 1997, Sarkar, 1990, Jagadeesh, 1999),
Denmark (Dalhgaard et al., 1990), US and Taiwan (Madu et al., 1995, Solis et al., 1998),
China (Rao et al, 1998), Australia (Sampon and Sohal, 1990), Mexico (Solis and Rao,
1997, Solis et al, 1998), Singapore (Sohal et al., 1998), Asia and the South Pacific
(Corbett et al., 1998), East and West (Russia, Taiwan, Japan, Korea, Finland, Estonia,
Denmark, India, Sweden, England, and New Zeland) (Dahlgaard et al, 1998), Costa Rica
(Tate et al, 2000), UK (Dayton, 2001), US, Mexico, China and India (Quazi et al., 2002),
UK and Ireland (McAdam and Jackson, 2002).
While the above studies focus on the practice of quality management between countries
there is also interest in understanding the practice of quality management within
countries, including Greece (Tsiotras and Gotzamani, 1994), Korea (Lee and Crouch,
1995, Lee, 1998), Canada (Laszlo, 1998), Taiwan (Solis et al., 1998), South America
(Bertin, 1999), Scotland (Masson and Raeside, 1999), Russia (Eklof and Selivanova,
2000), China (Zhang, 2000), Malaysia (Agus et, al., 2000, Agus and Sagir, 2001), Spain
(Escanciano et al, 2001), Turkey (Beskese and Cebeci, 2001), Pacific Island (Djerdjour,
2002), Germany (Janas and Luczak, 2002), and Australia (Rahman, 2002).
The essence of most of the above studies was to understand the critical success factors of
TQM. However, as Sila and Ebrahimpour (2003) indicated, the question regarding the
universality of quality management practices has not been answered yet, and more
empirical, cross-country and industry-specific research is indeed on quality management.
There is also an emerging trend of increasing quality management studies in Middle
Eastern countries (Al-Sulimani and Sharad, 1994, Al-Khalifa and Aspinwall, 2000, Al-
Zamany et al., 2002). The same trend is observed in Africa (Perry, 1997, Thairu, 1999,
Beugre and Offodile, 2001, Temtime and Solomon, 2002, Temtime, 2003). The essence
of all the above studies was reaching a global model for quality management practices.
83
However, there is still literature available on the quality system implementation in
developing countries (Djerdjour and Patel, 2000).
Thus, it should be noted that in spite of all of this research, TQM is still in the early
stages of theory development (Dale et al., 2001, Taiwo, 2001), Now, rather than being a
separate discipline, it is still a part of operations management, this is changing and TQM
is becoming an independent discipline (Dale et al., 2001). Accordingly, to develop a
global quality management model that is time and context-free as well as to achieve an
agreement on TQM principles, it is essential that quality management practices in all
regions of the world be empirically studied. The generalisabilty of quality management
practices in the global context requires studying quality management practices in other
parts of the world that have not been studied empirically, including the Middle East.
3.6 TQM in the Middle East
The pace of the implementation of quality management in the Middle Eastern countries is
not at the same rate as in developed regions and countries (Al-Khalifa and Aspinwall,
2000, Chapman and Al-Khawaldeh, 2002, Al-Zamany et al., 2002). However, there is
increasing awareness and understanding of quality management in the Middle East region
(Dedhia, 2001). Most countries in the Middle East were not aware of the impact of
quality management on the productivity, efficiency and competitiveness of their
organisations. In fact, two trends were considered as the driving forces of quality
management practice in Middle Eastern countries: globalisation and the fluctuation of
petroleum and gas prices in the world market (Al-Khalifa and Aspinwall, 2000). The
dependence of the national economy of most Middle Eastern countries on the price of
oil/gas and the cyclic rise and fall of petroleum products in the world market forced
Middle Eastern countries to implement quality management in the oil/gas industry as well
as other industries, including public, private, and manufacturing industries (Al-Khalifa
and Aspinwall, 2000).
84
The literature on quality management has paid little attention to quality management in
developing counties and little empirical research has been carried out in developing
countries, especially Middle Eastern countries (Al-Khalifa and Aspinwall, 2000). The
first Persian Gulf international quality conference held in Bahrain in 1990 was the first
movement toward quality management in Middle East (Dedhia, 2001). Early studies on
the implementation of quality management in the Middle Eastern countries began around
1994. Al-Suleimani and Sharad (1994), Aly (1996), and Zairi (1996) addressed the
challenges and problems for organisations in the Middle Eastern countries. These studies
were further enhanced by a limited amount of national empirical research. The first study
was implemented in Qatar (Al-Khalifa and Aspinwall, 2000). Taking a national approach
for understanding of the level of implementation of TQM in Qatar, they found that the
level of understanding of TQM was very low in the organisations. A short history of
TQM implementation, lack of information, education, and training, and lack of
understanding of TQM “know-how” was reported as the major challenges for TQM
implementation in Qatar.
Some other studies have also contributed to the understanding of TQM implementation in
Middle Eastern countries. Chapman and Al-Khawaldeh (2002) studied the relationship
between TQM and labour productivity in Jordanian industrial companies. They found the
productivity of employees in companies have TQM was higher than companies without
TQM. The other study done in Yemen, addressed the level of understanding and
difficulties of implementing quality management in Yemen (Al-Zamany et al., 2002).
Using case studies, the researchers found that governmental support, better technical
understanding of TQM, and changes in organisational culture were the problems for
successful TQM implementation in Yemen. The study by Curry and Kadasah (2002) also
contributed to the practice of quality management in the Middle East. Their study was
conducted in Saudi Arabia, aimed at determining the key elements of TQM in companies;
they found that learning the concept of quality management is critical for successful
implementation of TQM.
85
3.7 TQM in Iran: historical perspective
Quality management initiatives did not start in Iran until the end of the 1980‟s. The first
five-year economic development program, which began in 1980, was the main driver for
emphasis on quality in the country. The initiative first began by presenting workshops on
quality management and quality assurance in a governmental institution, the Industrial
Management Institution (IMI). Also, economic relationships with certain European
countries (such as Germany, France, Italy) were a key reason for the application of ISO
9000 standard in Iran, where the first company received its certificate in 1989, registered
by Societs Generale de Surveillance (SGS). This movement urged companies to practice
quality management through the implementation of ISO 9000 standard.
The second movement toward quality management began around 1993, having its origin
in the automobile industry. The automobile industry in Iran was established around 1960,
but its technological capacity was not developed much beyond assembly and
maintenance. There was a national interest (mostly among the policy makers) for further
developing this industry. The government decided to restructure the automobile industry,
which was mainly integrated. The strategy was to disintegrate it, to provide the required
infrastructure for it, and finally to develop the national car. Thus, the government began
to invest in the automobile industry (labour, capital), collaborate in agreements with a
few European countries (France, Germany), and provide support (financial/technical) for
the automobile part makers.
The first movement in that regard started with collaboration with Peugeot. The two
corporations, Iran Khodro and Peugeot, signed a contract to produce Peugeot cars in Iran.
Along with that, the KIA Motors Company, from South Korea, established a production
line in Iran. It was during that period that QS-9000 standards were developed and
internalised in the automobile industry in Iran. This trend encouraged consulting firms to
seek more business opportunities for the automobile and automobile part makers, to the
extent that some of them changed their business strategy and mainly focused on the
automobile industry.
86
Despite all these efforts to develop quality management practices, still there is not a
national model to be considered by Iran as the official quality model. This is the
challenge for the Institute of Standards and Industrial Research of Iran to develop a
national quality management model to effectively encourage and recognise the
development of effective quality management in Iranian companies (Asian Productivity
Organisation, 2002).
According to the Mahmoud Saremi et al. (2009), a little attention has been paid by
Iranian researchers and the institute of standard to the role of external and consultants in
the successful implementation and operation of TQM in Iranian organisation. In this
chapter and the next the lack academic research on TQM in Iran is one issue the
researcher is concerned about for his study.

87
3.8 Summary
This Chapter explained the meaning, principal tools and techniques of TQM. The
evolution of TQM developed between the 1950‟s- and 1990‟s, as quality changed its
function with the passage time. TQM gurus have contributed to the training and practice
of quality improvement and others concentrated on the tools of quality. The gurus set
down points of wisdom in management and leadership and many organisations used
these to establish a policy based on quality. TQM tools are ways to display information
visually and to help managers or those responsible for quality and performance and see
how a system or process is operating.
To continue with the literature review a study on implementation and operation had to be
taken which will be looked at in the next chapter.
88
Chapter Four (TQM Implementations and operations)
89
4. Introduction
On the current world market, both manufacturers and consumers require guarantees for
the quality of products and services. Now it is no longer sufficient to provide products
and services that merely conform to certain standards. All manufacturers and service
organisations need to demonstrate their capability to provide a continuous quality for
their products and services. This is why all businesses and public organisations need to
set up quality systems enabling them to guarantee that required quality is obtained at the
appropriate cost, and also taking environmental concerns into consideration. But
choosing the right model for the organisation is one of the important issues.
There are many indicators and trends recognized by organisations, including: the
expanding world market, and national and international organisations that demonstrate
excellence in quality and overall achievement of an enterprise. Several national quality
award schemes have been established to promote productivity and quality and serve as
model for Total Quality Management, which, it is generally accepted today deals with
creating competitive value for customers while keeping resource consumption to a
minimum (Flood, 1995, P.19). Iranian organisations like other companies around the
world need to survive and grow in the world market. They also need true commitment,
and high quality products to compete with international companies. The usual way to do
this is to apply TQM. By applying TQM in Iranian organisations, Iranian companies can
achieve high quality standard services and processes to compete with international
companies. Since 1998 Iranian companies have been trying to apply TQM in their
organisation. However, according to a study by Mosadegh Rad, (2003) in Iran, 90 percent
of TQM efforts failed outright. This evidence points to an important concern; Iranian
organisations need to establish a new strategy towards quality management (Mosadegh
Rad, 2003).
90
4.1 The Malcolm Baldrige Quality Award
The Baldrige Award is specified by the President of the United States to businesses
manufacturing and service, small and large, and to education and health care
organisations that apply and are judged to be outstanding in seven areas: leadership;
strategic planning; customer and market focus; measurement, analysis, and knowledge
management; human resource focus; process management; and results (Evans and
Lindsay, 2001). According to the Baldrige criteria (2009), the objectives of the award
were:
1) Awareness of performance excellence as an increasingly important element in
competitiveness
2) Information sharing of successful performance strategies and the benefits derived
from using these strategies
According to Pannirselvam and Ferguson (2001), the Malcolm Baldrige National Quality
Award (MBNQA) criteria have evolved to be a measurement of organisational quality
since 1987; this is a guideline for companies moving towards performance excellence.
However, Evans and Lindsay (2001) mention that Baldrige Award criteria are made on a
set of core values and concepts derived from real world experiences that can be applied to
any type of organisation. According to Baldrige Award (2009) core concepts are:
visionary leadership
customer-driven excellence
organisational and personal learning
valuing workforce members and partners
Agility
focus on the future
managing for innovation
management by fact
societal responsibility
91
focus on results and creating value
systems perspective
These values and concepts are embedded beliefs and behaviours found in high-
performing organisations. They are the foundation for integrating key performance and
operational requirements within a results-oriented framework that creates a basis for
action and feedback.
Despite application of Baldrige criteria in practice, few theoretical or empirical studies
have been reported in the literature. Such research as exists on the Baldrige model falls
into two categories (Flynn and Saladin, 2001). First, the Baldrige model has been used as
a framework for operationalising quality management (Samson and Terziovski, 1999,
Dow et al, 1999, Handfield et al., 1998, Dellana and Hauser, 1999). The initial
application of the Malcolm Baldrige model as a frame work for identifying quality
management constructs was described by Steeples (1992). The second set of studies
examines the validity of the Baldrige framework (Wilson and Collier, 2000, Curkovic et
al., 2000, Pannirselvam and Ferguson, 2001).
However, according to Brock (1992) and Evan and Lindsay (2001), the MBNQA is
considered good and appropriate model for implementing and operating TQM. However,
according to Matta et al. (1996), in a study of MNBQA winners, found difficulties in
implementing TQM are rooted in three causes: 1) the holistic change of corporate culture;
2) achieving and maintaining employee acceptance of TQM; 3) integration with suppliers
and customers.
4.2 The European Quality Award
The European Foundation for Quality Management (EFQM) business excellence model
was developed in 1989 by 14 multinationals grouped in the European Foundation of
Quality Management to improve the quality of management in Western Europe
(Westerveld, 2003). The EFQM Excellence Model provides an holistic view of the
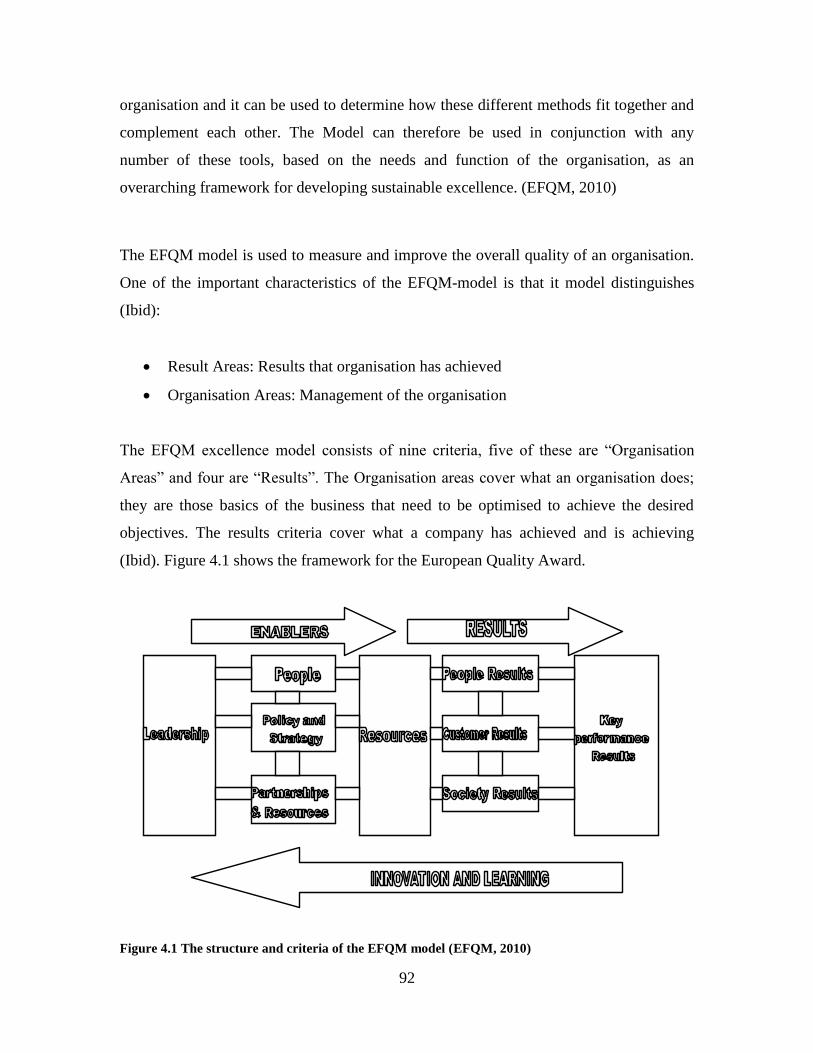
92
organisation and it can be used to determine how these different methods fit together and
complement each other. The Model can therefore be used in conjunction with any
number of these tools, based on the needs and function of the organisation, as an
overarching framework for developing sustainable excellence. (EFQM, 2010)
The EFQM model is used to measure and improve the overall quality of an organisation.
One of the important characteristics of the EFQM-model is that it model distinguishes
(Ibid):
Result Areas: Results that organisation has achieved
Organisation Areas: Management of the organisation
The EFQM excellence model consists of nine criteria, five of these are “Organisation
Areas” and four are “Results”. The Organisation areas cover what an organisation does;
they are those basics of the business that need to be optimised to achieve the desired
objectives. The results criteria cover what a company has achieved and is achieving
(Ibid). Figure 4.1 shows the framework for the European Quality Award.
Figure 4.1 The structure and criteria of the EFQM model (EFQM, 2010)
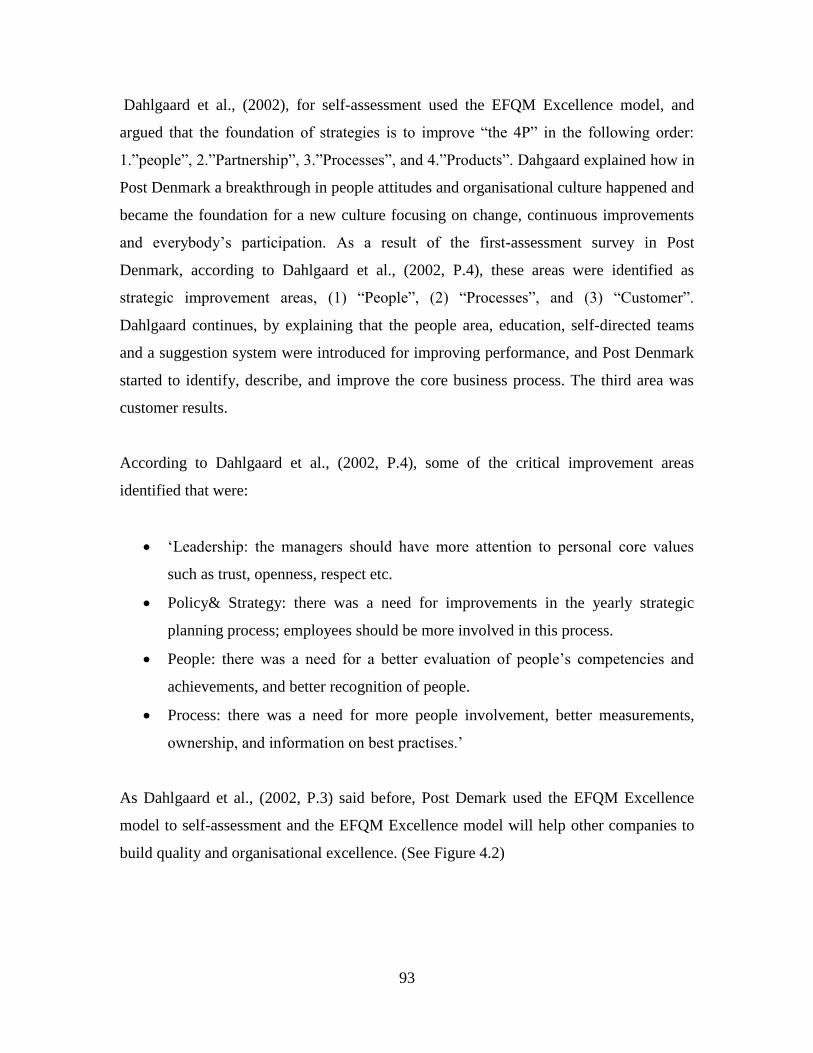
93
Dahlgaard et al., (2002), for self-assessment used the EFQM Excellence model, and
argued that the foundation of strategies is to improve “the 4P” in the following order:
1.”people”, 2.”Partnership”, 3.”Processes”, and 4.”Products”. Dahgaard explained how in
Post Denmark a breakthrough in people attitudes and organisational culture happened and
became the foundation for a new culture focusing on change, continuous improvements
and everybody‟s participation. As a result of the first-assessment survey in Post
Denmark, according to Dahlgaard et al., (2002, P.4), these areas were identified as
strategic improvement areas, (1) “People”, (2) “Processes”, and (3) “Customer”.
Dahlgaard continues, by explaining that the people area, education, self-directed teams
and a suggestion system were introduced for improving performance, and Post Denmark
started to identify, describe, and improve the core business process. The third area was
customer results.
According to Dahlgaard et al., (2002, P.4), some of the critical improvement areas
identified that were:
„Leadership: the managers should have more attention to personal core values
such as trust, openness, respect etc.
Policy& Strategy: there was a need for improvements in the yearly strategic
planning process; employees should be more involved in this process.
People: there was a need for a better evaluation of people‟s competencies and
achievements, and better recognition of people.
Process: there was a need for more people involvement, better measurements,
ownership, and information on best practises.‟
As Dahlgaard et al., (2002, P.3) said before, Post Demark used the EFQM Excellence
model to self-assessment and the EFQM Excellence model will help other companies to
build quality and organisational excellence. (See Figure 4.2)
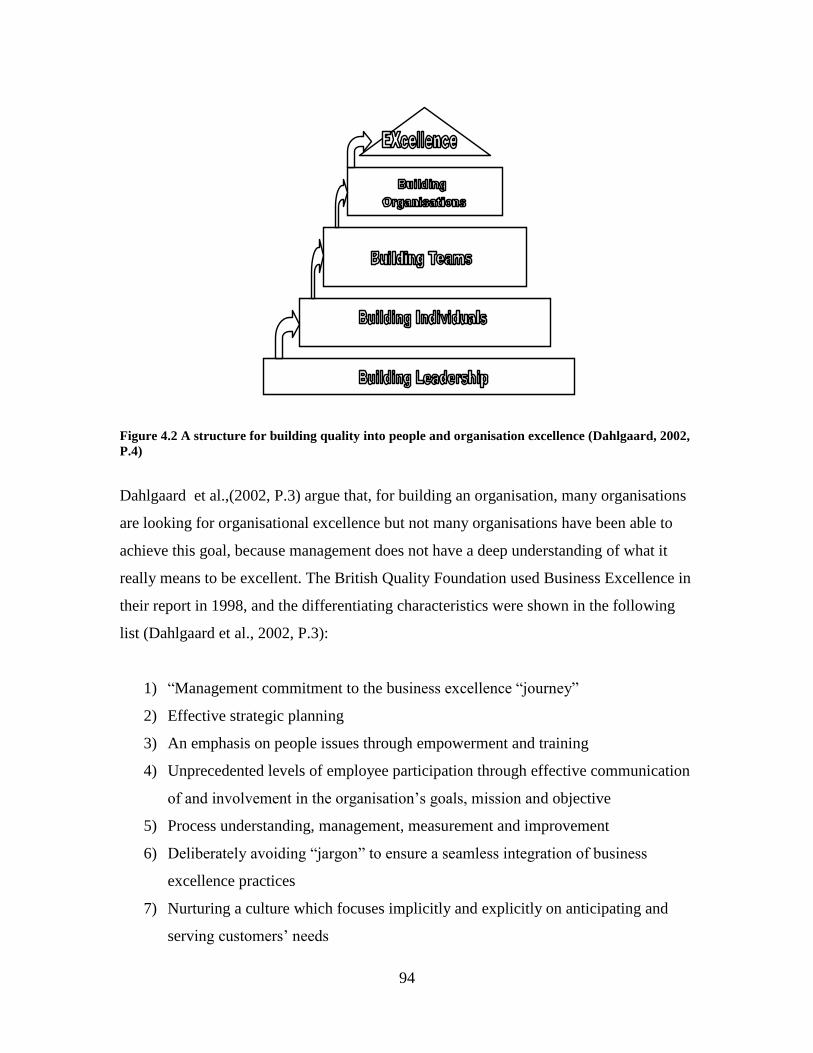
94
Figure 4.2 A structure for building quality into people and organisation excellence (Dahlgaard, 2002,
P.4)
Dahlgaard et al.,(2002, P.3) argue that, for building an organisation, many organisations
are looking for organisational excellence but not many organisations have been able to
achieve this goal, because management does not have a deep understanding of what it
really means to be excellent. The British Quality Foundation used Business Excellence in
their report in 1998, and the differentiating characteristics were shown in the following
list (Dahlgaard et al., 2002, P.3):
1) “Management commitment to the business excellence “journey”
2) Effective strategic planning
3) An emphasis on people issues through empowerment and training
4) Unprecedented levels of employee participation through effective communication
of and involvement in the organisation‟s goals, mission and objective
5) Process understanding, management, measurement and improvement
6) Deliberately avoiding “jargon” to ensure a seamless integration of business
excellence practices
7) Nurturing a culture which focuses implicitly and explicitly on anticipating and
serving customers‟ needs
95
8) Demonstrating concern for better environment management
9) Making the internal spread of best practice contagious”
The important thing about Dahlgaard et al., (2002) research in Post Denmark was using
business excellence for self-assessment. This can help companies to develop a strong
organisational culture and help to achieve successful Total Quality Management (TQM).
4.3 The Deming Prize
The Deming Prize is Japan‟s national quality award for industry (Deming prize, 2009). It
was established in 1951 by the Japanese Union of Scientists and Engineers (JUSE) and it
was named after W. Edwards Deming. Deming introduced statistical quality control
methodology to Japan after W.W.II. The Deming Prize is the world‟s oldest awards for
quality. Its principles are a national competition to seek out and commend those
organisations making the greatest strides each year in quality, or more specifically, TQC.
The prize has three award categories. They are Individual Person, the Deming
Application Prizes, and the Quality Control Award for factory. The Deming Application
prizes are awarded to private or public organisations and are subdivided into small
enterprises, divisions of large corporations, and overseas companies.
Evans and Lindsay (2001) emphasize that only a small number of awards given each
year, because they believe the awards are an indication of the difficulty of achieving the
performance required. The objectives of Deming‟s reward are to make sure that company
has completely set up the process and to make sure, they are going to continue their way
even after the awarded.
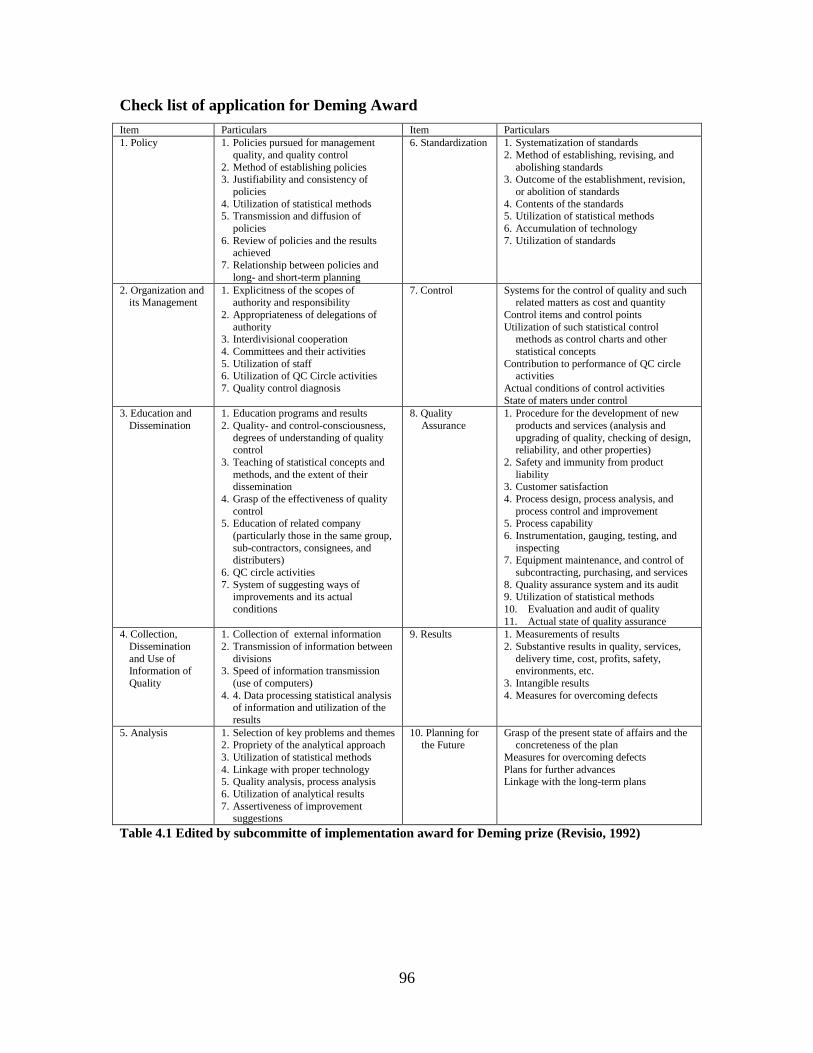
96
Check list of application for Deming Award
Item Particulars Item Particulars
1. Policy 1. Policies pursued for management
quality, and quality control
2. Method of establishing policies 3. Justifiability and consistency of
policies
4. Utilization of statistical methods 5. Transmission and diffusion of
policies
6. Review of policies and the results achieved
7. Relationship between policies and
long- and short-term planning
6. Standardization 1. Systematization of standards
2. Method of establishing, revising, and
abolishing standards 3. Outcome of the establishment, revision,
or abolition of standards
4. Contents of the standards 5. Utilization of statistical methods
6. Accumulation of technology
7. Utilization of standards
2. Organization and its Management
1. Explicitness of the scopes of authority and responsibility
2. Appropriateness of delegations of
authority 3. Interdivisional cooperation
4. Committees and their activities
5. Utilization of staff 6. Utilization of QC Circle activities
7. Quality control diagnosis
7. Control Systems for the control of quality and such related matters as cost and quantity
Control items and control points
Utilization of such statistical control methods as control charts and other
statistical concepts
Contribution to performance of QC circle activities
Actual conditions of control activities
State of maters under control
3. Education and
Dissemination
1. Education programs and results
2. Quality- and control-consciousness,
degrees of understanding of quality control
3. Teaching of statistical concepts and
methods, and the extent of their dissemination
4. Grasp of the effectiveness of quality
control 5. Education of related company
(particularly those in the same group,
sub-contractors, consignees, and distributers)
6. QC circle activities
7. System of suggesting ways of improvements and its actual
conditions
8. Quality
Assurance
1. Procedure for the development of new
products and services (analysis and
upgrading of quality, checking of design, reliability, and other properties)
2. Safety and immunity from product
liability 3. Customer satisfaction
4. Process design, process analysis, and
process control and improvement 5. Process capability
6. Instrumentation, gauging, testing, and
inspecting 7. Equipment maintenance, and control of
subcontracting, purchasing, and services
8. Quality assurance system and its audit 9. Utilization of statistical methods
10. Evaluation and audit of quality
11. Actual state of quality assurance
4. Collection,
Dissemination
and Use of Information of
Quality
1. Collection of external information
2. Transmission of information between
divisions 3. Speed of information transmission
(use of computers)
4. 4. Data processing statistical analysis of information and utilization of the
results
9. Results 1. Measurements of results
2. Substantive results in quality, services,
delivery time, cost, profits, safety, environments, etc.
3. Intangible results
4. Measures for overcoming defects
5. Analysis 1. Selection of key problems and themes 2. Propriety of the analytical approach
3. Utilization of statistical methods
4. Linkage with proper technology 5. Quality analysis, process analysis
6. Utilization of analytical results
7. Assertiveness of improvement suggestions
10. Planning for the Future
Grasp of the present state of affairs and the concreteness of the plan
Measures for overcoming defects
Plans for further advances Linkage with the long-term plans
Table 4.1 Edited by subcommitte of implementation award for Deming prize (Revisio, 1992)
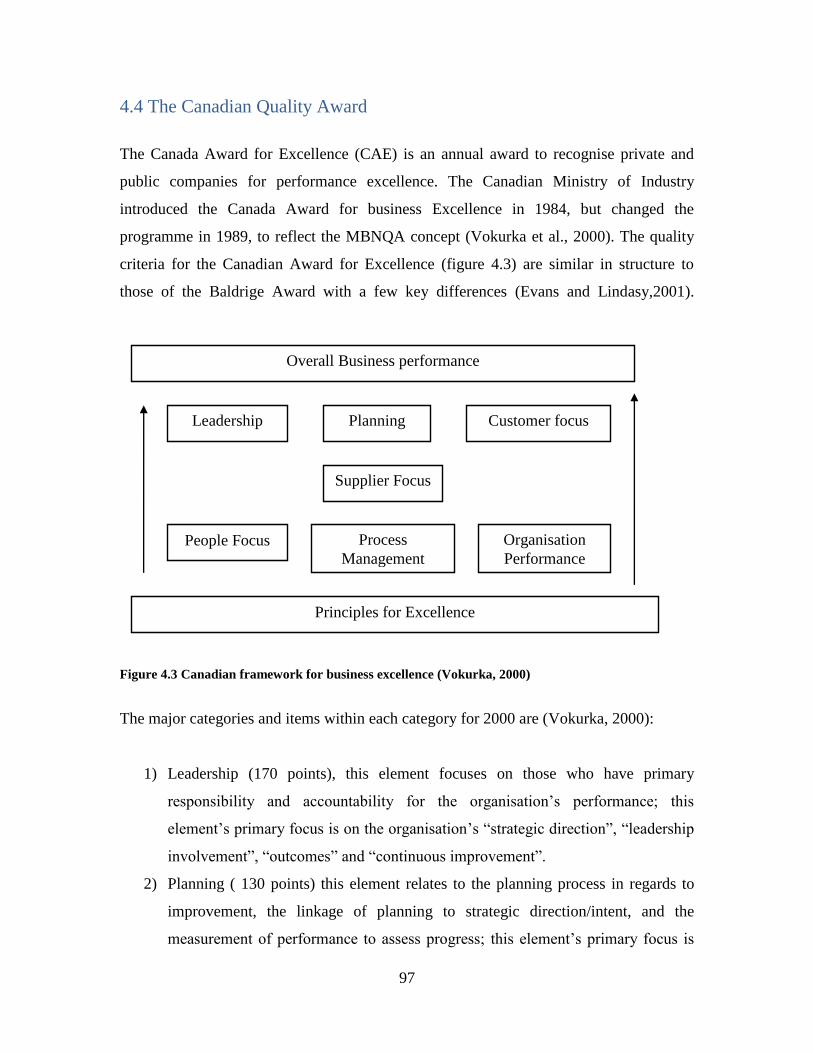
97
4.4 The Canadian Quality Award
The Canada Award for Excellence (CAE) is an annual award to recognise private and
public companies for performance excellence. The Canadian Ministry of Industry
introduced the Canada Award for business Excellence in 1984, but changed the
programme in 1989, to reflect the MBNQA concept (Vokurka et al., 2000). The quality
criteria for the Canadian Award for Excellence (figure 4.3) are similar in structure to
those of the Baldrige Award with a few key differences (Evans and Lindasy,2001).
Figure 4.3 Canadian framework for business excellence (Vokurka, 2000)
The major categories and items within each category for 2000 are (Vokurka, 2000):
1) Leadership (170 points), this element focuses on those who have primary
responsibility and accountability for the organisation‟s performance; this
element‟s primary focus is on the organisation‟s “strategic direction”, “leadership
involvement”, “outcomes” and “continuous improvement”.
2) Planning ( 130 points) this element relates to the planning process in regards to
improvement, the linkage of planning to strategic direction/intent, and the
measurement of performance to assess progress; this element‟s primary focus is
Overall Business performance
Leadership Planning Customer focus
Supplier Focus
People Focus Process
Management
Organisation
Performance
Principles for Excellence
98
on the organisation‟s “development and content”, “assessment”, “outcomes” and
“continuous improvement”.
3) Customer focus (200 points), this element relates to the organisation‟s focus on
customer driven innovation and on the achievement of customer satisfaction; it
focuses on “voice of the customer”, “management of customer relationships”,
“measurement of customer satisfaction”, “outcomes”, and “continuous
improvement”.
4) People focus (200 points), this element relate to development of human resource
plan for meeting the goals of the organisation, and achieving excellence through
people. This element‟s focus is on the organisation‟s “human resource planning”,
“participatory environment”, continuous learning”, and “employee satisfaction”.
5) Process management (200 points), this element relates to how work is organised
to support the organisation‟s strategic direction, with a specific focus on quality
assurance practices, as well as continuous improvement, this element focus is on
the organisation‟s, “process definition”, “process control”, process improvement”,
“outcomes”, and “continuous improvement”.
6) Supplier focus (180 points), this element relates to the organisation‟s external
relationships with organisations, institutions and alliances; it focuses on the
organisation‟s “partnering”, “outcomes”, and “continuous improvement”.
7) Organisation performance (200 points), this element relates to the outcomes from
overall efforts for improvement, and their impact on organisation achievement, it
focuses on the organisation‟s “service/product quality”, “operational results”,
“customers and market place”, “employee satisfaction and morale”, “financial
performance”.
99
4.5 Dubai Government Excellence
This award is part of the Dubai Excellence program, which was concerned to develop the
performance of the government sector. The important concern of the Dubai award is to
improve the official governmental working environment throughout all departments, in
ways such as increasing public satisfaction, developing resources, eliminating
unnecessary official procedures, documenting organisation, and encouraging innovation
and development of potential (Dubai Government Excellence program, 2006)
Specific objectives and principles of the Dubai government excellence are summarised as
follows (Dubai Excellence Program, 2006):
The programme emphasises leadership by the government in representing co-
operation with positive competition
Efficiency, quality and rationalisation of expenditure are sought.
Awareness of quality is promoted as the private is consolidated and enhanced.
Evaluation of performance is standardised, and government employees are
motivated
The overall concept of the programme is directed toward modernisation; incentive reward
is its basis; the Arabic language is the official language; participation is mandatory for
department, administration, administrative excellence and vocational/occupational
excellence groups.
4.6 Singapore Quality Award
For the first time in 1994 the government of Singapore established the Singapore Quality
Award (SQA, 2009). The main objective was to encourage organisations to do their best
for business performance at world-class standards. The SQA follows the model of the
Malcolm Baldrige, the European, and the Australian Award. Strengthening of
management systems is encouraged. Benefits to organisations include provision of a
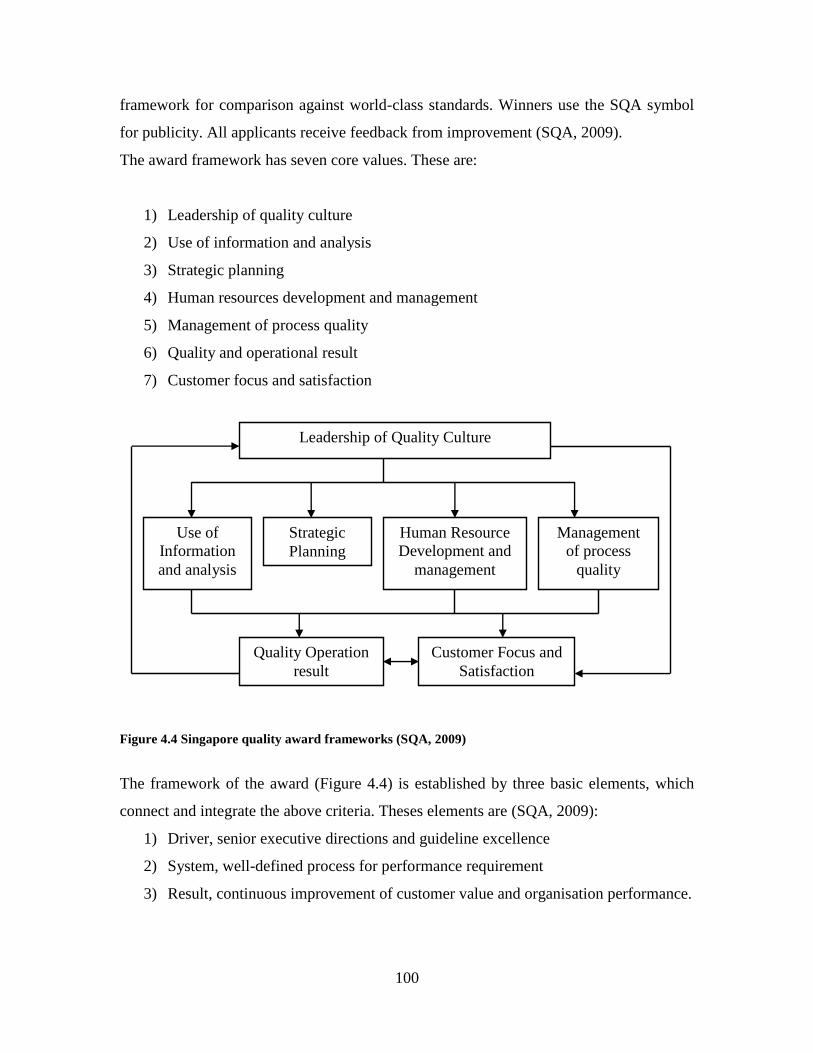
100
framework for comparison against world-class standards. Winners use the SQA symbol
for publicity. All applicants receive feedback from improvement (SQA, 2009).
The award framework has seven core values. These are:
1) Leadership of quality culture
2) Use of information and analysis
3) Strategic planning
4) Human resources development and management
5) Management of process quality
6) Quality and operational result
7) Customer focus and satisfaction
Figure 4.4 Singapore quality award frameworks (SQA, 2009)
The framework of the award (Figure 4.4) is established by three basic elements, which
connect and integrate the above criteria. Theses elements are (SQA, 2009):
1) Driver, senior executive directions and guideline excellence
2) System, well-defined process for performance requirement
3) Result, continuous improvement of customer value and organisation performance.
Leadership of Quality Culture
Use of
Information
and analysis
Strategic
Planning
Human Resource
Development and
management
Management
of process
quality
Quality Operation
result
Customer Focus and
Satisfaction

101
4.7 Australian Quality Award
The Australian Quality Award was introduced in 1988 and, therefore, is of the same age
as MBNQA (Zink, et al. 1997). It is awarded by the Australian Quality Council. The
Australian Quality Awards Foundation is responsible for the evaluation and selection of
applicants. The award was established to enhance quality awareness in Australian
organisations. As it recognizes excellent performance in improving the quality of
products, processes and services it gives a motivation to follow successful forerunners.
The Australian Quality Award should emphasize that total quality is crucial for
Australia‟s international competitiveness and the standard of living “down under”. The
model‟s structure is presented in figure 4.5.
Figure 4.5 Australian quality criteria framework (Canchick, 2001)
The objective of the award programme is to develop and deploy a comprehensive and
contemporary body of quality principles and best practices (Canchick, 2001). The award
measures quality performance through seven categories of criteria: (1) “Leadership”, (2)
“Strategy, Policy & Planning”, (3) “information and Analysis”, (4) “people”, (5)
“Customer Focus” , (6) “Quality of process, product and service”, and (7) “organisation”
(Ibid). According to the model, people, information and analysis, and strategy, policy and
5. Customer Focus
2. Strategy
Policy &
Planning
3. Information
and Analysis
4. People
6. Quality of
process, product
and service 7. Organisation
1. Leadership
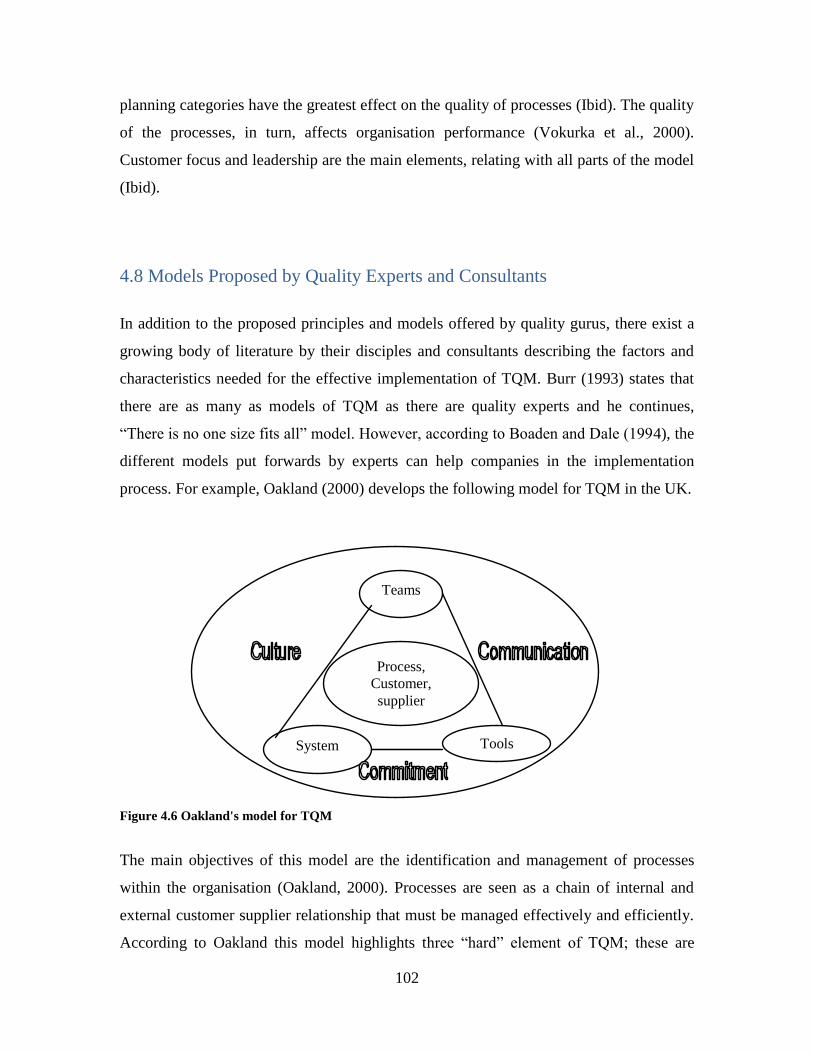
102
planning categories have the greatest effect on the quality of processes (Ibid). The quality
of the processes, in turn, affects organisation performance (Vokurka et al., 2000).
Customer focus and leadership are the main elements, relating with all parts of the model
(Ibid).
4.8 Models Proposed by Quality Experts and Consultants
In addition to the proposed principles and models offered by quality gurus, there exist a
growing body of literature by their disciples and consultants describing the factors and
characteristics needed for the effective implementation of TQM. Burr (1993) states that
there are as many as models of TQM as there are quality experts and he continues,
“There is no one size fits all” model. However, according to Boaden and Dale (1994), the
different models put forwards by experts can help companies in the implementation
process. For example, Oakland (2000) develops the following model for TQM in the UK.
Figure 4.6 Oakland's model for TQM
The main objectives of this model are the identification and management of processes
within the organisation (Oakland, 2000). Processes are seen as a chain of internal and
external customer supplier relationship that must be managed effectively and efficiently.
According to Oakland this model highlights three “hard” element of TQM; these are
Teams
System Tools
Process,
Customer,
supplier
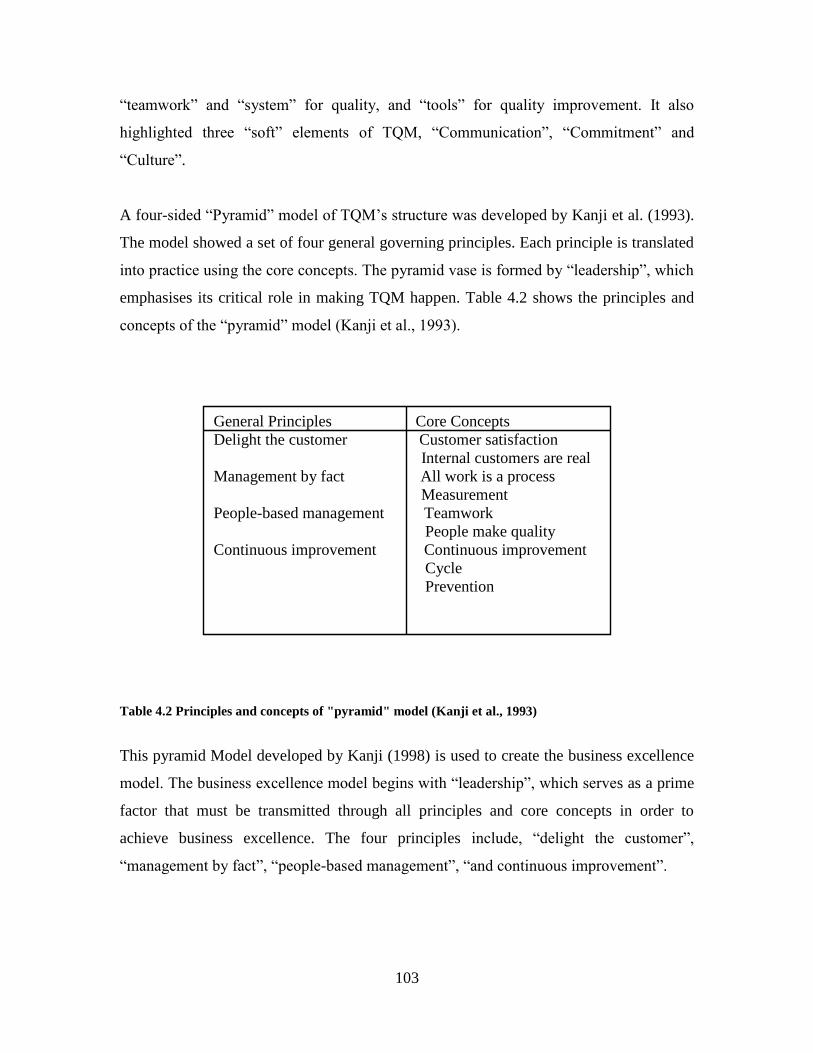
103
“teamwork” and “system” for quality, and “tools” for quality improvement. It also
highlighted three “soft” elements of TQM, “Communication”, “Commitment” and
“Culture”.
A four-sided “Pyramid” model of TQM‟s structure was developed by Kanji et al. (1993).
The model showed a set of four general governing principles. Each principle is translated
into practice using the core concepts. The pyramid vase is formed by “leadership”, which
emphasises its critical role in making TQM happen. Table 4.2 shows the principles and
concepts of the “pyramid” model (Kanji et al., 1993).
Table 4.2 Principles and concepts of "pyramid" model (Kanji et al., 1993)
This pyramid Model developed by Kanji (1998) is used to create the business excellence
model. The business excellence model begins with “leadership”, which serves as a prime
factor that must be transmitted through all principles and core concepts in order to
achieve business excellence. The four principles include, “delight the customer”,
“management by fact”, “people-based management”, “and continuous improvement”.
General Principles Core Concepts
Delight the customer Customer satisfaction
Internal customers are real
Management by fact All work is a process
Measurement
People-based management Teamwork
People make quality
Continuous improvement Continuous improvement
Cycle
Prevention
104
Each principle is divided into two core concepts, namely: customer satisfaction and
internal customers are real. All work is process and measurement; teamwork and people
make quality; continuous improvement cycle and prevention.
Kano in 1993 used an interesting concepts to show the structure of TQM; that concept is
“The House of TQM”. The first pillars of the house include both “theory of quality” and
“theory of management”. Customer satisfaction PDCA cycle (Plan, Do, Check, and Act)
includes practices that promote the concepts. Actual practices are based on concepts from
the second pillar (techniques) for collecting and analysing data, of which the seven QC
tools and statistical methods are typical. At this point, some practices for effectively and
efficiently promoting these two pillars within the organisation become necessary.
Management by policy like continuous improvement and training, and management by
fact like employee involvement are practices that can be called the third pillar.
However, Evans and Lindsay (2001) suggested that TQM is an approach to management
that is grounded on these three core principles:
1) A focus on the customer
2) Participation and team work
3) Continuous improvement
The principles are supported and implemented by
An integrated organisational structure
A variety of management practices
A wide variety of tools and techniques
According to Evans and Lindsay (2001), TQM structure (organisational infrastructure,
management practices and tools/techniques) must include leadership, strategic planning,
data/information management, process management, and resource management.
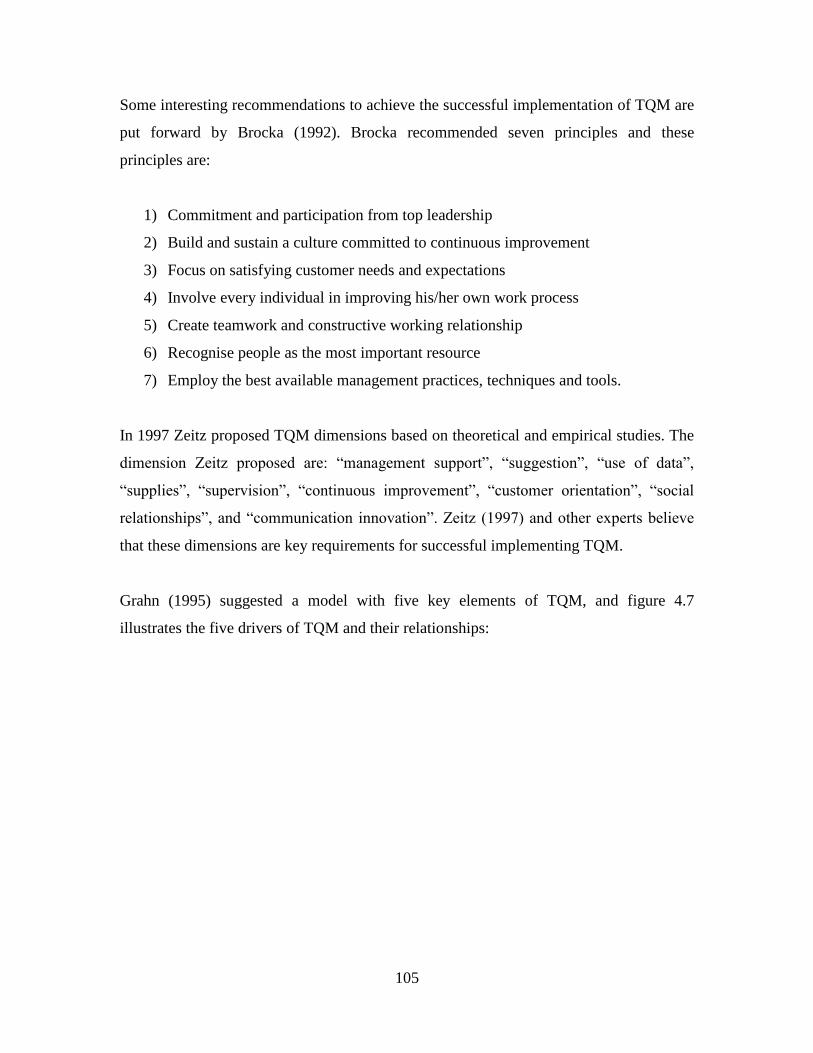
105
Some interesting recommendations to achieve the successful implementation of TQM are
put forward by Brocka (1992). Brocka recommended seven principles and these
principles are:
1) Commitment and participation from top leadership
2) Build and sustain a culture committed to continuous improvement
3) Focus on satisfying customer needs and expectations
4) Involve every individual in improving his/her own work process
5) Create teamwork and constructive working relationship
6) Recognise people as the most important resource
7) Employ the best available management practices, techniques and tools.
In 1997 Zeitz proposed TQM dimensions based on theoretical and empirical studies. The
dimension Zeitz proposed are: “management support”, “suggestion”, “use of data”,
“supplies”, “supervision”, “continuous improvement”, “customer orientation”, “social
relationships”, and “communication innovation”. Zeitz (1997) and other experts believe
that these dimensions are key requirements for successful implementing TQM.
Grahn (1995) suggested a model with five key elements of TQM, and figure 4.7
illustrates the five drivers of TQM and their relationships:
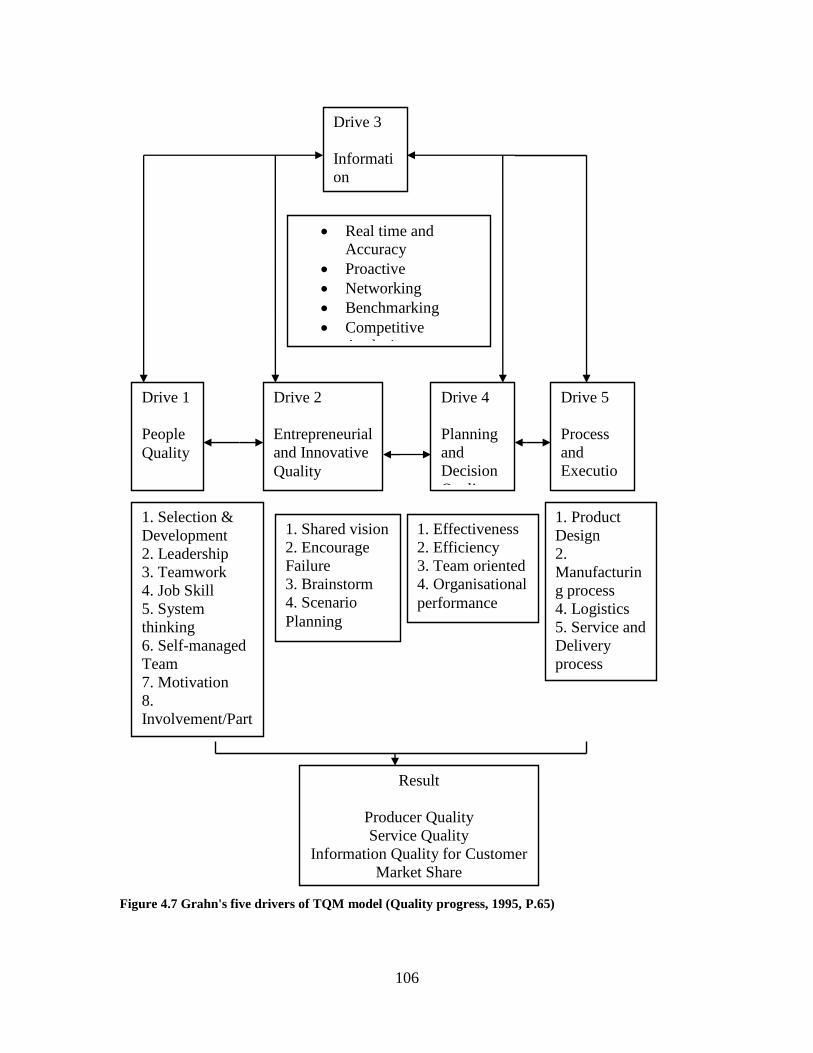
106
Figure 4.7 Grahn's five drivers of TQM model (Quality progress, 1995, P.65)
Drive 3
Informati
on
Quality
Drive 1
People
Quality
Drive 2
Entrepreneurial
and Innovative
Quality
Drive 4
Planning
and
Decision
Quality
Drive 5
Process
and
Executio
n
Real time and
Accuracy
Proactive
Networking
Benchmarking
Competitive
Analysis
1. Selection &
Development
2. Leadership
3. Teamwork
4. Job Skill
5. System
thinking
6. Self-managed
Team
7. Motivation
8.
Involvement/Part
icipation
1. Shared vision
2. Encourage
Failure
3. Brainstorm
4. Scenario
Planning
1. Effectiveness
2. Efficiency
3. Team oriented
4. Organisational
performance
1. Product
Design
2.
Manufacturin
g process
4. Logistics
5. Service and
Delivery
process
Result
Producer Quality
Service Quality
Information Quality for Customer
Market Share
107
This model aims to shows all five drivers in a balanced way such that it considers the
organisation‟s underlying systematic structure and how each of the elements influences
the other.
However, according to Stamatis (1997) the basis for TQM is management through
leadership. He argues that in one organisation when leadership has been defined, then a
policy, resources, and general management will lead the TQM process. Stamatis (1997)
identified five assumption required to implement TQM, which can be seen in the figure
4.8.
Figure 4.8 Stamatas’ five assumption required to implement TQM (Stamatis, 1997)
Leadership
Management of
People
Machine
Method
Material
Measurement
Environment
Process
Impact to Society
Outcome
Management of
Structure
Process
Outcome
Creating Policy
And developing
strategy
Impact to Customer Impact to
Organisation
108
4.9 Quality Factor of TQM Implementation
4.9.1 Introduction
Baidoun and Zairi (2003) argue „quality is an important consideration for executive
thinking‟. According to Kanji and Yui (1997), basic characteristics of the organisation,
such as its culture, this can affect the implementation of TQM. The drive to improve
quality, therefore, has to be managed differently. This part shows the important factors of
TQM implementation identified by researchers and supported by the writing of quality
gurus.
4.9.2 Implementation factors
4.9.2.1 Leadership
Leadership has an important role in quality management. According to Feigenbaum
(1989), „getting quality result is not a short-term, instant-pudding way to improve
competitiveness; implementing total quality management requires hands-on, continuous
leadership‟. The role of leadership and top management have been emphasised in most of
the literature on TQM. While some principles and practices of TQM may differ between
companies and industries, there is an almost common agreement as to the importance of
leadership by top management in implementing TQM. According to Joel (1993)
leadership is a prerequisite to all strategy and action planning. In fact, in the total quality
management process, top management has to understand the meaning of quality and
TQM. For example, even senior management has to be convinced o fits benefits to the
organisation, and acknowledge the fundamental change it will bring in the running of the
organisation.
However, according to Zairi (1999) given the importance of leadership, it is not
surprising to find that in all quality awards, leadership issues are not only placed at the
top of the list of criteria but also are emphasised in the other criteria as necessary to make
implementation successful. On the other hand, Robin and Denis (1995) point out that
109
TQM aims to encourage a participative style of management throughout the organisation
and that an organisation with this style of management is likely to be keener towards
TQM and it will have less need to change its system and communication structure.
Jacqueline and Shapiro (2003) in their study argue that a participative supervisory style is
positively related to employee participation and that the extent of employee participation
is positively related to the assessments of the benefit of TQM. Furthermore, participation
in an improvement structure represents a major vehicle by which employees can
contribute to continuous improvement (Lawler, 1994).
However, it is argued that organisations with an authoritative style of management,
wherein employees/manager who are promoted, are aggressive, career minded, and not
team workers, are likely to find it more difficult to cope with pressures of TQM
implementation (Baidoun, 2003).
Throughout the literature, leadership has been at the top with management commitment
as an essential precondition for successful quality management (Baidoun, 2003, Porter
and Parker, 1995, Wilkinson et al, 1994). In this respect, Hamzeh and Zairi (1996) say
that all the top mangers in the five companies they analysed were personally involved in
formulating, communicating, and implementing TQ initiative. In their study, Johnston
and Daniel (1991) in their conclusion say senior management visited on both side of the
Atlantic, assumed active responsibility for the success of TQM in their companies. In a
similar study in Thailand, Krasachali and Tannock (2000) reported that TQM
implementation is highly unlikely to be successful with-out top management support. In
all companies considered, it was obvious that total quality activities were fully supported
by senior management.
In 1982, Deming said that within a „Total Quality Organisation‟, the role of leadership is
one of understanding processes and variation, having a sense of the customer,
understanding human psychology, and having respect for people in the organisation.
Pulat in 1994 argued the importance of strong management leadership as the most
important element of TQM. According to Pulat (1994) such leadership involvement
110
includes regular meetings with customers, employees and suppliers with other
organisation, giving formal and informal recognition, receiving training and training
others. Their visible personal involvement in developing and maintaining an environment
that is conductive to quality excellence is needed for TQM to succeed. Senior
management also develops and communicates key company quality values which place
emphasis on the importance of the customer, process orientation, continuous
improvement, teamwork, management by fact, mutual respect and dignity whilst valuing
individual employees and their contribution. In this respect, Evans and Linsday (2001)
state that leaders are the role models for the whole organisation, and, therefore, must be
passionate about quality and actively live the values. Furthermore, Evans and Linsday
(2001) suggest the following leadership practices as importance in promoting quality and
high levels of performance:
The creation of a strategic vision and clear quality values that serve as basis for all
business decisions at all level of the organisation
Setting high expectations
Demonstrating substantial personal commitment and involvement in quality
Integrating quality values into daily leadership and management
Sustaining an environment for quality
The critical role of top management in providing leadership has also been explained by
reference to several diverse organisations. According to Whiford and Bird (1996) the
managing director of Day International-Stockton managed the steering committee to
initiate the TQM programme, which was based on a strategic five-year plan embodying
company goals and policies.
The Group Managing Director of P&P in the UK has personally accepted the quality
concept. The company committed itself to a regular communication programme and
sought to involve its staff at all levels in the change process. Top-level management of
P&P invited the staff to joint the voyage policies.
111
According to Ramirez and Loney (1993), the Corporate Management Committee of
Xerox approved a total quality process in 1982, Policy objectives were developed by
senior management, as was the statement of the desired future state of the company. In
1983, senior management appointed the first corporate vice president of quality. Senior
managers formed a quality implementation team in conjunction with a supporting quality
task force and consulted with quality experts to develop strategy. The core ideas of the
senior management vision are as follows:
quality is not enough but requires but requires addition of company inherent
qualities: “entrepreneurism, innovation, autonomy and diversity” (Ramirez and
Loney, 1993)
A new productivity is defined as creating value and assisting customer
productivity.
Bureaucracy needs breaking up with empowerment and stripping out management
layers.
Exploiting diversity: the whole is greater than the sum of the parts.
Learning to do thing differently by creating opportunity through failure and
questioning success for improvements.
Emphasising the group social mind: empowered and empowering beyond any
individual.
4.9.2.2. Employee involvement
In the context of TQM, it is widely acknowledged that participation in an improvement
structure represents a major vehicle for employees to contribution to continuous
improvement (Vermeulen and Crous, 2000; Lawler, 1994, Soin, 1992).
Employee involvement practices have been one of the techniques extensively used for
improvement purposes by pioneering organisations. Among those initiatives, the redesign
of work combined with job enrichment are two that are used widely to increase quality by
creating jobs that entail autonomy and feedback (Hackman & Oldham, 1980).
112
Restructuring work around teams has been another alternative organisational change tool
to contribute performance improvement through enhancing satisfaction at the work place
(Morley & Heraty, 1995; Rodwell et all, 1998). These approaches mainly focus upon
changing responsibilities and relationships among employees and are founded on a
number of assumptions. The assumption behind teamwork is to upgrade autonomy that is
realized in terms of identifying the best way of practicing a job to achieve the highest
performance through a continuous search by employees for alternative ways of working.
Increased autonomy is expected to foster self-fulfilment and make jobs significant (Ross,
1999).
However, employee involvement should begin with a personal commitment to quality. If
employees accept and commit to a quality philosophy, they are more apt to learn quality
tools and techniques and use them in their daily work (Evans and Lindsay, 2001). A
number of key practices are employed by quality leaders to foster employee involvement.
These include the following:
All employees are involved at all levels and in all functions
The effective use of suggestion systems to promote involvement and motivate
employees.
The support of teamwork throughout the organisation
Monitoring the extent and effectiveness of employee involvement. (Evans and
Lindsay, 2001)
By the same token, the Baldrige Quality Award and President‟s Quality Award
Programme provided the following the key considerations of employee involvement:
Involve employees in making decision, pursuing ideas, and taking risks.
Provide climate of workmanship pride independence.
Improve employee morale.
Visit and discuss with employees.
Encourage diversity in the workplace.
Provide educational opportunities.
113
The findings of the study conducted by Longenecker et al. (1994) demonstrate that
employee involvement and participation was the key to quality improvement. In a study
of employee participation, Jacqueline and Shapiro (1999) concluded that supervisory
participation is positively related to employee participation and the extent of employee
participation is positively related to the assessment of the benefits of TQM. Zhang et al.,
(2000) in their study identified that employee participation is very important in the
successful implementation of TQM. These findings are supported by Westund et al.
(2001).
However, for most companies, employee involvement means a fundamental change in
the organisation‟s culture (George and Weimerskirch, 1998). Lyondell Petrochemical
Company initiated employee involvement for its 1,500 employees at four manufacturing
sites in Texas. Lyondell began with empowerment. In Lyondell‟s terms, this means
management willingness to delegate responsibility, training management and employees
to make sharing of responsibility work, communication and feedback, and rewards and
recognition. To create employee involvement, company expectations for management
behaviours are taught to them over a two-day seminar. These behaviours are 1) low-cost
production; 2) quality; 3) entrepreneurship; 4) action orientation; 5) recognition that
people are the difference; 6) responsibility and accountability in all jobs; 7) teamwork; 8)
communication; 9) safety of people; and 10) social responsibility and ethics. Managers
are introduced to encourage employees to use „sound, creative thought and action that can
lead to innovative‟ (Geroge and Weimerskirch, 1998). Managers are encouraged to
„assure that people understand their responsibility to make the greatest, most positive
difference they can‟. People involvement means deliberate organisational overlapping of
behaviours and actions and the forming of an organisation-wide cultural web building the
strength of component integration.
114
4.9.2.3 Empowerment
In the 1990‟s empowerment became extensively discussed as the new business issue
(Bowen and Lawler, 1992, Minett and Ellis, 1997, Appelbaum and Honeggar, 1998). The
traditional view of leadership management is consistent with control and employees
waiting to be directed (Long, 1996). According to Hoffman and Bateson (1997) firms can
be successful with-out empowering employees and the amount of empowerment varies
by degree. Both the type and degree of empowerment are important, because they are key
parameters in defining appropriate actions (Rafiq and Ahmad, 1998). Bowen and Lawler
(1992) describe different levels of empowerment and compare this with the industrialised
service delivery. Hoffman and Bateson (1997) suggest empowerment can be suggestion
involvement when employees are allowed to give recommendations for improvement. It
can be further used within quality circles where small groups of employees brainstorm to
generate additional improvement suggestions.
Empowerment requires substantial training. In their study Prybutok and Kappelman
(1995), found that training alone provided little benefit and explained almost nothing
about success, but training combined with empowerment provided a great deal more
benefit and explanatory power. They conclude that providing employees with an
empowering experience in conjunction with their training significantly improved the
outcome of that training. Edosomwan (1992) suggests that following critical elements of
empowerment leading to an improved organisational performance:
Involve employees in developing the organisation‟s strategies
Provide the skills required to solve problems and make decisions
Define empowerment based on the ,mission of the organisation
Ross (1999) indicates that the greater employee autonomy and discretion implied by team
working are invariably accompanied by an intensification of work and increased self-
monitoring. According to Simmons et al (1996), true empowerment provides a critical
clue that contributes to organisational growth, to achieve the organisation‟s goal and to
115
create a new managerial behaviour. However, Gilbert (1993) argues that the essence of
TQM operation in an organisation is focusing on customer and process improvement
through sound empowerment, since empowerment establishes the initiative to activate
people toward accepting and fulfilling the organisation‟s goal.
Recent studies identified employee empowerment as critical factors of TQM
implementation (Martinez-Lorente et al., 2001, Claver et al., 2004, Dale, 2005). Eastman
chemical company implemented successful employee empowerment through, isolating
employee factors or characteristics that make empowerment difficult, unlikely or
impossible. The characteristics are that employees: „don‟t care; don‟t have appropriate
skills‟ (The X factor Executive Report, 1999). Eastman addressed the issues by outlining
processes for given employees the skills and authority needed to assume to increase
responsibility. Employees were surveyed to this end. They discussed disturbing aspects
of the employee appraisal system that were a major obstacle to their dedicated and
sincere involvement. However, it‟s good for the organisation to empower employees with
freedom and responsibility. Frontline people are increasingly empowered and the
organisation‟s structure has been increasingly flattened. Information flows to an
increasingly larger group of employees who progressively assume responsibility for
fundamental decisions. Empowerment creates a demand for communication change.
Organisation vision and policy communication flow through the empowered groups
(George and Weimerkirch, 2000).
4.9.2.4 Training and Education
An extremely important way to institute quality into an organisation, is to train
employees to do their jobs better. First Interstate Bancorp has demonstrated its
confidence in employee training by initiating credit training programmes for those
employees involved in the analysis, recommendation, approval or review of commercial
credits (Spagnola and Spagnola,1993, P.11). According to Thiagragan and Zairi (1997)
training and education based on total quality management must be planned and provided
for successful change is to be realised. According to Oakland (2000), training is the
116
single most important factor in improving quality once the necessary commitment has
been assured, and thus training strategy should be addressed early, along with other
strategies within the quality policy.
The training structure must be top-down, starting with the top team and cascading down
the organisation. The golden rule for successful implementation is to ensure managers
train their own people. This is necessary to show management commitment and to ensure
managers actually understand the TQM principles and methods (Spenley, 1992, P.94).
Through training and education, a common language may be achieved throughout the
organisation. The importance of effective education and training is emphasized by all the
authors who were surveyed. Bird (1993, P.66) sees training as important in order to give
employees the necessary knowledge to bring about quality improvement across the
company. Batten (1992, P.48) describes the importance of education and training by the
following words: ``Train, Train, and Train!''. Mcdonnel (1994, P.43), Schonberger (1992,
P.22) and Riley (1993, P.32) all regard training as fundamental in transforming the
workforce so that it can function in the demanding TQM environment.
For quality training to be effective, however, it must be planned in a systematic and
objective manner. Quality training must be continuous to meet not only changes in
technology, but also changes involving the environment in which an organisation
operates, its structure and most important of all, the people who work there. Oakland
(1993, P.264) developed the ``Quality training cycle'' and this cycle set out in figure 4.9.
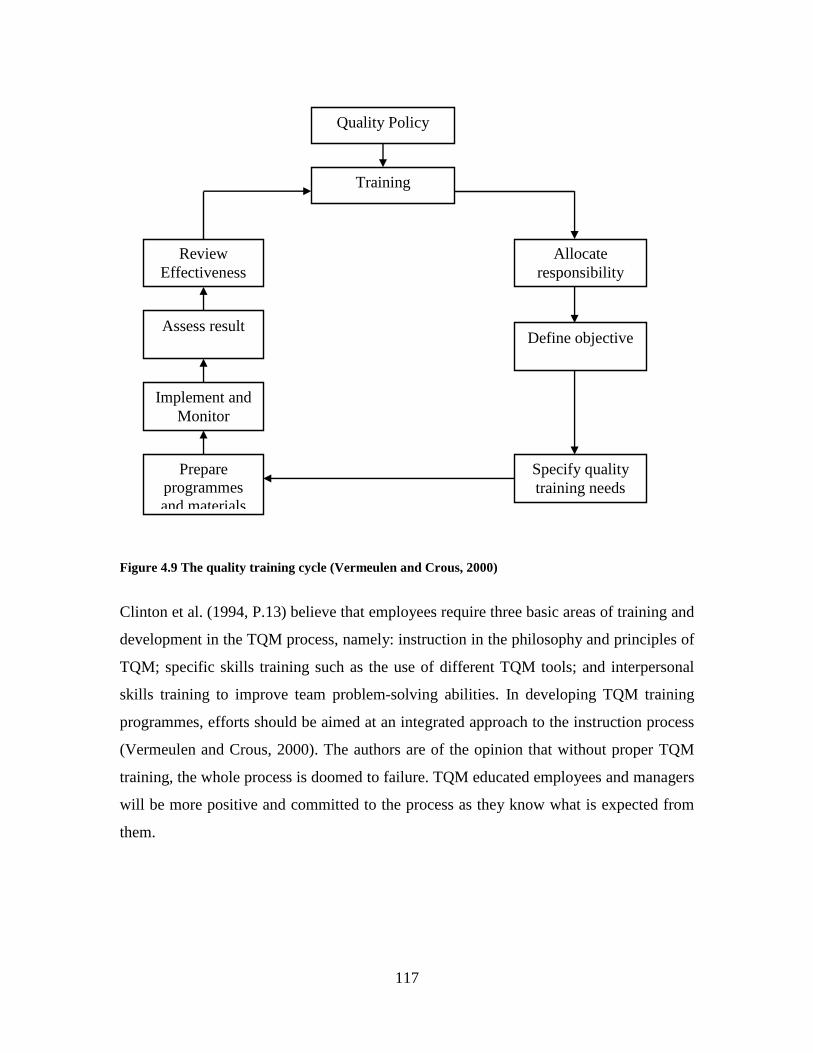
117
Figure 4.9 The quality training cycle (Vermeulen and Crous, 2000)
Clinton et al. (1994, P.13) believe that employees require three basic areas of training and
development in the TQM process, namely: instruction in the philosophy and principles of
TQM; specific skills training such as the use of different TQM tools; and interpersonal
skills training to improve team problem-solving abilities. In developing TQM training
programmes, efforts should be aimed at an integrated approach to the instruction process
(Vermeulen and Crous, 2000). The authors are of the opinion that without proper TQM
training, the whole process is doomed to failure. TQM educated employees and managers
will be more positive and committed to the process as they know what is expected from
them.
Quality Policy
Training
Review
Effectiveness
Assess result
Implement and
Monitor
Prepare
programmes
and materials
Allocate
responsibility
Define objective
Specify quality
training needs
118
4.9.2.5 Middle management role
Management must recognise that middle managers can make an important contribution to
organisational success and in the quality process (Burgelman, 1991, 1994; Bartlett and
Ghoshal, 1993; Livian and Burgoyne, 1997; Floyd and Wooldridge, 1997, 2000; King et
al.,2001; Balogun and Johnson, 2003; Kanter, 2004). Middle managers can influence the
design of organisational strategy by synthesising information for top management
attention and by championing new ideas. They also play an important role in
implementing strategy, as it is their role to translate strategic goals into concrete action,
thus aligning organisational competencies (Kanter, 2004). Middle management can
furthermore play an integrative role by arbitrating between employee needs and corporate
objectives.
According to Pugh et al. (1968); quoted in Floyd and Wooldridge, (1997), middle
management can be defined as organisational members who link the activities of
vertically related groups and who are responsible for sub functional work flows, but not
the work flow of the organisation as a whole. Middle managers have long been seen as
the linking pins (Likert, 1961) between top management and the organisation‟s
operational core. They connect the overall strategic direction with the day-to-day reality
at the operations level. Based on their unique position in the organisation, they have
knowledge of customer requirements, operating capabilities and top managerial intent.
Rather than merely passing down executive-level orders, middle managers interpret
these, negotiate their implementation and mediate between different organisational
interests (Bartlett and Ghoshal, 1993; Floyd and Wooldridge, 1997, 2000; Floyd and
Lane, 2000; Balogun, 2003; Kanter, 2004).
However, middle management can be difficult to convert to TQM, because many
mangers may have been with the organisation for a number of years and are used to a
certain style of management. According to Mann and Kehoe (1995), it may be difficult
for middle management to give greater responsibilities to employees and change to a
participant style of management, because they themselves may be controlled more by the
119
incoming TQM structure. To achieve the middle management‟s commitment and
confidence in TQM, an education and training programme must address their needs and a
support structure must be developed to assist them through the change period. Without
the total commitment of middle management, team building and employee involvement
will be affected. In this respect, Samuel in 1992 suggested the transformation of middle
managers into change agents through a systematic process that dissolves traditional
management boundaries and replaces them with an empowered and team-oriented state
of accountability for organised performance. On the other hand, effective implementation
of TQM within organisations depends on the integration of all components, notably the
productive effort of organisation member (Evans, and Lindsay, 2001).
4.9.2.6 Reward and Recognition
Reward and recognition are consistently acknowledged by organisations and managers as
an important element in motivating individual employees (Cocioppe, 1999). ``Employee
of the month'' schemes, profit sharing, monetary payment for higher productivity or
commission on sales revenue are widely used. There appears to little understanding
however, as to why particular incentives are used in different situations or at specific
times. However, London and Higgot (1997) argue that when establishing a TQM process
within a company, a transition in corporate culture towards one of continuous
improvement is a fundamental requirement. In this sense, an effective reward and
recognition process provides a clear and visible statement to all employees of the
organisational values and the commitment to employee involvement.
However, reward and recognition for individual employees remains one of the
controversial areas of quality management. Notable authors such as Deming (1986)
believed that fair ratings in such systems were impossible due to supervisor biases,
worker competition and organisational politics. More recently, Scholtes (1995) has listed
five reasons to explain why reward, recognition and incentive systems do not work: (1)
no data to show long term benefits; (2) they set up internal competition; (3) reward
120
systems undermine teamwork and co-operation; (4) they often reward those who are
lucky and pass by those who are unlucky; and (5) they create cynics and losers.
Other discussions of reward and recognition systems recognize their importance in TQM
processes and attribute any failure of the system to the methods of implementation
(Knouse, 1995). Lomdon and Higgot (1997) described process in their research that has
been tailored to the individual needs of the company; the process consists of the
following elements:
(1) Categories for awards;
(2) Nominations;
(3) Review of nominations;
(4) Recognition of successful nominations;
(5) Review of successful nominations;
(6) Final selection;
(7) Awards; and
(8) Annual quality award
On other hand, according to Gerorge and Weimerskirch (1998) reward and recognition is
a key factor in TQM implementation especially when it is aligned with the organisational
quality improvement effort. George and Weimerskirch (1998) state that most quality
leaders begin with formal recognition. Many companies such as Intel, IBM and
Honeywell, utilise corporate quality awards. These companies express two goals for their
organisation, these goals are:
Recognition of an employee‟s contribution and communication of quality
Customer satisfaction commitment at highest level.
121
4.9.2.7 Team work
Team activity represents the principal source of process improvement. The significance
of teams rests on the fact that they provide opportunities to individuals to solve problems
that they may not be able to solve on their own (Evans, and Lindsay, 2001). Zhang et al.
(2000) suggested the use of measures, such as cross-functional teams, within functional
teams, quality control circles, voluntary teams, and suggestion activities, for encouraging
employee participation. Teams should be the basic unit of performance for most
organisations because they represent a combination of multiple skills, experience and
judgments. Shaprio (1995) said that teamwork could be viewed and interpreted as the
collaborative activity of individuals and co-operative interactions within the group. In this
respect, Heath (1989) points out that commitment, support, trust and satisfaction are key
elements for establishing a sound environment for teambuilding. However Tam in 1997
identified five reasons why teams are successful, namely:
Flexibility, as teams are easier to assemble, deploy, refocus, and disband
Commitment: teams with commitment to clear objectives produce excellent result
Synergistic response to challenge: complementary skills and experiences enable
teams to respond synergistically to challenges changing events and demands.
Enhance work: teams help members to overcome barriers and establish
confidence.
Focus: teams help members to develop a shared sense of direction
In research on quality improvement through team-goal setting, feedback, and problem
solving, Longenecker et al. (1994) conclude that when a manager of a production cell sets
up quality problem-solving teams to respond to defect rate problems, he received not only
quicker response times but better decision making and more rapid implementation of
solutions. According to Evans and Lindsay (2001), the central role of teams and the needs
for such team skills as co-operation, communications, cross-training and group decision-
making, represents a fundamental shift in how the work of organisations is performed in
the western world. On other hand, the concept of teamwork in quality has been developed
122
and refined through quality circles in Japan and evolved into powerful self-managed
teams today, Quality circles, which are defined as small groups of employees from the
same work area, were instituted in Japan in the early 1960 and then brought to the USA
in the early 1970 (Evans and Lindsay, 2001). However, in Japan, the rapid push for
quality became a national priority and the result were domestic (Ibid), on other hand, the
western approach to quality circles moved toward improvement of employee satisfaction
and communications (Luzon, 1988). However, Ross (1999) argues that a useful way of
conceptualising the role of team working in quality strategies is to consider how it relates
to “employee empowerment”.
4.9.2.8 Strategic Planning
According to Evans, and Lindsay (2001) strategic planning is a systematic approach to
setting quality goals, it‟s clear, to have successful implementation of TQM in any
organisation, companies need to align of every member‟s effort with the aim of the
organisation (Olian et al, 1991). Quality gurus and researchers strongly emphasise the
importance of the strategic planning process based on the concept of total quality
(Deming, 1986; Juran, 1974; Crosby, 1979; Oakland, 1993; Zairi, 1994; Haksever, 1996;
Sinclair and Zairi. 2001). However, Juran (1974) considers policy development as an
integral part of management‟s commitment to quality. On other hand, Crosby sees quality
policy as a standard for practice that sets priorities by influencing the entire organisation
on what to do and what not to do.
According to Evans and Lindsay (2001), complete integration of TQM into strategic
planning is a result of a natural evolution. Good practice indicates that senior
management and employees actively participate in the planning process. However, to
have a strong relationship it is necessary to establish the credibility of a total quality
focus and integrate quality into the business planning process (Ibid). On other hand, the
total quality concept must be viewed as an integral strategy for daily management of the
business (Ross, 1999). The pervasive role that quality plays in strategic planning can best
be understood by considering the components of strategy which include; 1) mission; 2)
123
product/market scope; 3) competitive edge, 4) supporting policies, 5) objective and 6)
organisational culture (Ibid). Schonberger (1992) argues that a sound strategy should be
readily absorbable into the culture of the firm for day to day as well as for long range
actions, decision, and plans. Strategic decisions have far-reaching effects on sales,
capacity, finances, the competition, the environment, risk rate of change and so forth.
Groocock (1986) pointed out that the easiest part of strategy development is the
establishment of policy. Similarly, Juan (1991) indicates that the role of policy is to pave
the way for unity of direction in planning, control and improvement of processes. In a
study of six companies, Dale and Duncalf (1988) conclude that those companies without
a formulated quality policy are unlikely to have effective quality-related decision-making
processes.
4.9.2.9 System and process management
4.9.2.9.1 Accredited quality management systems
TQ culture, registration with a quality management system such as BS 5750/ISO 9000 is
seen by many organisations as a starting point and an important element of the
implementation process (Hirschhorn and Gilmore, 1992; Oakland and Porter, 1994;
Porter and Parker, 1993). At Carnaud Metalbox plc, the BS 5750/ISO 9000 registration
process provided the foundation on which a quality culture was built and helped the
company to move on in developing the total quality process (Oakland and Porter, 1994).
At Tioxide Group Ltd, the registration programme pushed quality to a much higher
profile in the firm as everyone was actively involved in the process. The firm also saw
itself in a better position to meet the specific needs of customers and improve its strategic
relationships (Oakland and Porter,1994). In discussing the implementation of the quality
management process at Esso Research Centre, UK, Price and Gaskill (1990) emphasize
that the use of the discipline of a recognized industry accreditation for a quality
management system, such as the ISO 9000, helps in the integration of the quality process
into the site culture. The systematic approach, as stipulated under the various elements
such as calibration and maintenance of laboratory equipment, staff training, and sample
124
management, assists in minimizing errors and increases the incidents of “right first time”.
Companies such as Nissan Motor UK, Federal Express and Club Med view operating
standards as an important requirement in the quality stakes. However, they do not see the
need to have a recognized industry accreditation (Binney, 1992). On other hand, many
organisations consider ISO 9000 certification as the first step in the implementation of
TQM (Oakland et al., 1994). A documented quality system as part of a TQMN strategy
can contribute to TQM by managing the organisation‟s process in consistent manner
(Zhang et al., 2000).
4.9.2.9.2 Organising for Quality
The success of the quality improvement process depends on effective and systematic
implementation (Crosby, 1989). Given the corporate-wide nature of TQM, a suitable
infrastructure to support quality initiatives is required (Johnston and Daniel, 1991).
Oakland and Porter (1994) in fact, highlighted that one of the responsibilities of senior
management at the outset of introducing TQM is the need to set up a defined quality
organisation structure in order to create a framework which will enable quality
improvement to develop and flourish (Bendell et al., 1993; Davies and Wilson, 1990;
Easton, 1993). In fact, they see the structure as a key element in ensuring the success of
TQM.
Some authors such as Oakland and Porter (1994) propose a three-tier quality structure,
made up of a quality council, process quality committees (or site steering committees)
and quality improvement teams to devise and implement TQM within an organisation.
The quality council, comprising a top management team and headed by the CEO, reviews
the strategic direction on TQM, decides resources, monitors, facilitates, and handles
impediments to progress (Bendell et al., 1993) . Glover (1993) views a quality council as
usually beneficial in planning and designing the TQM system. He goes on to say that it is
important that the council is high-powered if this is to be realized. The process quality
committees support the council by overseeing and managing quality at process or site
levels, depending on the size of the organisation. Oakland and Porter (1994) recommend
125
that every senior manager should be a member of at least one committee, and believe that
this provides the top-down support for full employee participation, through either a
quality improvement team or quality circle programme. The committees control the
quality improvement teams and assist by selecting projects, appointing team members
and monitoring progress. The team members, themselves cross-functional, are brought
together to tackle and solve specific problems on a project basis. A case example of a
three-tier structure is a quality structure introduced at a major British construction
machinery manufacturer (Goulden and Rawlins, 1995). The structures was made up of a
plant quality council, steering groups and cross-functional/multilevel project teams.
Overall strategy and management of the quality programme is provided by the council.
The steering groups sponsor and support individual teams, ensuring the required
resources are made available.
Members of the teams come from areas closely associated with the project. The quality
structure at Shorts Brothers is another example (Oakland and Porter, 1994). To direct a
quality management implementation process, a total quality organisational structure was
formed at the outset of the implementation process. This consisted of a quality council
chaired by the CEO, two divisional councils chaired by their respective vice-presidents,
and 18 functional quality teams chaired by senior managers. A total quality secretariat
was also established to coordinate the quality initiatives and to take a leading role in
assisting the quality council to develop a total quality strategy. The quality structure at
STC Cables Products UK is aimed at total employee involvement in the quality
improvement process (Davies and Wilson, 1990). The company designed a five-element
quality structure to harness their full potential at every level of the Organisation
(Thiagarajan and Zairi, 1997):
Quality improvement team: 1) comprising general manager, senior managers and
a facilitator, 2) ensures visibility of management commitment, 3) determines
quality policy, 4) establishes direction, 5) provides support
Quality improvement groups: 1) operate at all levels on a departmental basis, 2)
supervisors as leader, 3) address quality issues within work area
126
Corrective action teams: 1) brought together to address specific problems
allocated, 2) Disbanded when permanent solution found, 3) leader is appointed, 4)
leader selects members.
Quality improvement process manager: 1) senior manager, 2) facilitates day-to-
day operations of quality improvement groups and corrective action teams, 3) co-
ordinates quality activities
Individuals: 1) the employee is expected to strive for excellence and be totally
involved in the quality process
It is evident from the literature that support structures for quality management vary
widely (Black, 1993). Smith (1994) suggests that the differences reflect the cultures of
the organisations. The structures are also seen to be live, evolving as the TQM matures.
This may suggest that there is more concern with promoting ownership of the quality
process than there is with the structure required. Promoting ownership of the quality
process through structures becomes even more beneficial within Organisations with
geographically dispersed operating units. At Southern Pacific Lines, several regional
steering committees reporting directly to the central quality council were set up (Carman,
1993). However, organising for quality basically links with organisational culture. TQM
principles themselves are a critical influence on organisational culture, „most
organisations are in a position to improve cultural dimensions using various methods of
quality management‟ (Kanji and Youi, 1997).
4.9.2.9.3 Process management
Many organisations maintain and operate along vertical functional structures, stifling the
people within the organisation and thus preventing them from understanding how their
work affects the overall process of providing customer satisfaction. The functional
approach therefore allows barriers to customer satisfaction to evolve (Oakland and
Beardmore, 1995). It allows critical control points between departments to be vulnerable
to organisational “noise” (Edson and Shannahan 1991) such as “turf protection” and poor
communication.
127
However, if the aim of implementing TQM in an organisation is to achieve customer
satisfaction, then a first step is managing the internal customer-supplier relationship to
support the management of processes (Thiagarajan and Zairi, 1997). Within each
organisation there exists an intricate structure of both internal customer (one
individual/process/department dependent on another) and internal supplier (one
individual/process/department supplying another). Any weak link or break at any point in
the internal customer-supplier chain may find its way to the interface between the
organisation and the external customer (Oakland, 1993). Deming (1986) and Kanji
(1995) also talk about understanding the notion of internal customer-supplier as being
absolutely critical to a quality transformation. In this sense, the concept of an internal and
external customer supplier relationship forms the core of total quality (Kanji and Asher,
1993; Oakland, 1993). The best organisations ensure that everyone within the
organisation understands that they are dependent on one another, knows where their work
goes, and continuously ensures that the necessary quality at each interface meets overall
customer expectations (Bendell et al.,1993; Crosby, 1989). At Shorts Brothers, everyone
understood the concept of the internal customer-supplier and that satisfying the internal
customer must be realized in order for the company to succeed in its quality quest
(Oakland and Porter, 1994). In his study, Sinclair (1994) found that the identifying and
mapping of processes is one of the activities pursued by TQM organisations to support
the management of processes (Hardaker and Ward, 1987; McAdam, 1996).
4.9.2.9.4 Benchmarking
Benchmarking is another integral part of a total quality process (Bank, 1992; Beadle and
Searstone, 1995; Bendell et al., 1993; Kleiner, 1994; Mitchell, 1995). Rank Xerox, which
developed benchmarking as part of its quality process, provides the most practical
definition: A continuous, systematic, process of evaluating companies recognised as
industry leaders, to determine business and work processes that represent best practices,
establish rational performance goals (Zairi, 1994).
128
The primary objective of benchmarking is performance improvement (Thiagarajan and
Zairi, 1997). Identifying opportunities for performance improvement by comparing one
organisation‟s performance with that of another is a reflex of TQM (Bank, 1992). Zairi
(1994) identifies the link between TQM and benchmarking: „TQM is the wheel of
improvement, doing an internal, value-adding activity for the end customer.
Benchmarking is the external activity for identifying opportunities and ensuring that the
wheel of improvement is turning in the right direction and is making the necessary effort
towards the end destination, i.e. achieving high standards of competitiveness‟. Many of
the best organisations are using benchmarking as a tool for obtaining the information to
be used in the continuous improvement process, and to gain competitive edge (Booth,
1995; McNair and Leibfried, 1992). They are attracted to it because it stimulates and
challenges the improvement process (Smith, 1994). Through benchmarking, an
organisation discovers its strengths and weakness and incorporates the best practice into
its own operation.
According to Evans and Lindsay (2001) three major types of benchmarking could be
identified, namely:
Performance benchmarking which involves pricing, technical quality, features and
other performance characteristics of products and services.
Process benchmarking centres on work processes such as billing, order entry, or
employee training.
Strategic benchmarking, which examines how companies compete and seeks the
winning strategies that have led to competitive advantage and market success.
4.9.2.9.5 Self-Assessment
Self-assessment is an effective technique to measure the culture of quality within an
organisation (Zairi, 1994). In this sense, management can use self-assessment as the
means to assess whether its implementation efforts are deployed in the right way. The
ability to assess an organisation‟s progress against an accepted set of criteria would be
most valuable (Oakland, 1993; Porter and Tanner, 1995). The Malcolm Baldrige National
129
Quality Award (MBNQA) and the European Quality Award (EQA) assessment models
are available to organisations for self-assessment (Conti, 1991). For example, it has been
suggested that thousands of TQM organisations use the MBNQA criteria annually
(Sunday and Liberty, 1992).
However, executive management involvement and leadership in self-assessment is
regardeds as being essential because of their instrumental and encompassing role in
organisation improvement. The choice of model for implementation depends on top
management knowledge and preference (Fountain, 1998). In this sense, these provide a
more widely accepted technique to measure progress towards TQM than those suggested
by authors such as Saraph et al. (1989), Black (1993), Cupello (1994). Many
organisations adapt these well known criteria to suit their needs and objectives. The
award type self-assessment can be the most objective.
4.9.2.9.6 Cost of Quality
Quality costing is one quality tool that has been used to help justify the adoption of
quality improvement efforts to top management (Israeli and Fisher, 1991; Plunkett and
Dale, 1990). Dale and Plunkett (1991) consider quality costing as a useful first step along
the TQM journey. Crosby (1979) calls the measurement of quality costs one of the
absolutes of quality management Thomas Interior Systems (USA), which modelled its
14-step quality process on that of Milliken & Co, winner of the 1989 Baldrige Award,
considers the cost of quality as an important stage in its quality process (Johnson, 1993).
To ensure its people are comfortable with the improvement process, the company
introduced the cost of quality in the first year to everyone. It is believed that putting this
exercise at the beginning helped employees to believe in the quality process. Hilti (Great
Britain) Ltd also conducted a cost of quality analysis as an integral part of the TQM
process to show the staff in the early stages the tangible benefits of introducing total
quality (Findlay et al. 1990). At Shorts Brothers, management were quick to realize at the
outset of the TQM implementation that the total quality process would only survive if it
could provide tangible benefits to the company. It involved the workforce in the cost of
130
quality projects relevant to the business objectives (Oakland and Porter, 1994). The
success in savings convinced the staff of the benefits of total quality.
In order to get the efforts in tracking of the cost of quality started, several organisations
confine tracking to costs where measurable improvements can be obtained in the short to
medium term. LeaRonal (UK) concentrated initially on costs such as scrap and rework
quality assurance, compensation claims, staff turnover, and poor inventory management.
However, National Westminster Bank plc discovered early in its quality journey that
straight rework offered the largest opportunity for improving quality cost (Goodstadt,
1990). Thomas Interior Systems (USA) introduced the quality cost concept without
getting too specific or to try to account for every penny of cost by looking at errors in
specifications, lack of training, cost of not doing things right the first time, missed
opportunities and loss of repeat business (Johnson, 1993).
4.9.2.9.7 Quality Control Techniques
Juran (1974) states that quality control techniques are important tools, not only for low-
defect production but also for quality improvement. Shewhart defines quality control as
the use of statistical procedures to provide guides to produce good parts and to disclose
the cause of variations (Modaress and Aussari, 1989). Other quality gurus such as
Deming and Taguchi strongly support a comprehensive quality control system to aid the
management of quality. Deming says the key to achieving high quality conformance and
to overcoming process-related problems is the use of statistical quality control techniques
(Modaress and Aussari, 1989).
The techniques deal with the collection, analysis and interpretation of data related to the
causes of variations in quality characteristics. According to Juran, there are over 50
system quality control techniques (Quiros, 1994). However, the fundamental ones,
originally assembled by Ishikawa (1985) as the seven QC tools, are process flow
charting, check sheets or tally charts, histograms, Pareto analysis, cause and effect
diagrams, scatter diagrams and control charts. On other hand, system quality control for
131
defect prevention is one of the cornerstones of the quality strategy at Electrolux (Cullen
and Hollingum, 1987). The use of system quality control techniques was also seen as one
of the key elements in the development of Tioxide Group Ltd‟s total quality strategy,
while at CarnaudMetalbox plc, the system quality control initiative was seen as an
important vehicle for wider participation in teamwork and gave the total quality process a
new boost (Oakland and Porter, 1994).
4.9.2.9.8 Customer focus/satisfaction
According to Evans and Lindsay (2001) customer satisfaction is how an organisation
determines customer requirements and expectations. In the EFQM (1999) self-assessment
guidelines, customer satisfaction is referred to as what organisation will achieve, in
relation to the satisfaction of its customer. According to Oakland, and Porter (1994),
many quality award-winning companies, award applications, and other organisations
reporting successful business results share certain common approaches and basic
philosophies regarding to customer satisfaction. These companies have an intense
customer-centred focus in which employees at all levels are involved, informed about,
and committed to.
However, to satisfy the customer, a company must identify customer needs in order to
design the appropriate product or service (Spring et al., 1998). According to Chan (2001),
one TQM techniques is quality function development, which is a customer-oriented
approach for translating customer voices into various design features of products and
services. Govers (2001) emphasise that customer requirements and their relationship with
design characteristics are the driving forces of QFD methodology. On the other hand,
Zairi and Youssef (1996) identified three objectives of QFD, these objectives are:
To identify who is the customer
What the customer wants
How these wants can be fulfilled
132
However, according to Evans and Lindsay (2001) companies worked to continually
improve its total quality management efforts to meet the intentions set out in its strategic
vision through focusing on exceeding customer expectations while achieving rapid
globalisation, superior return on assets, and aggressive sales revenue growth. On other
hand, a strategic focus on customer satisfaction should lead to customer loyalty. Loyalty
is the intention to continue purchasing joined with a positive recommendation of the
company, its products and services (Ibid).
4.10 Discussion of TQM Literature
Quality achievement has become an important measure of organisational success in both
manufacturing and services. Throughout previous chapters, an attempt was made to
survey the literature on important factors in the process of TQM implementation.
Through the extensive literature review, many critical success elements of TQM
implementation are identified based on reviews of various models, quality awards, and
conceptual frameworks of academics, practitioners along with empirical studies.
4.10.1 Criticisms of Total Quality Management
According Evan and Lindsay (2001) there are many success stories of TQM
implementation and its benefits, the real impact of TQM cannot be disregarded. A
number of failures have also been reported, for example Eskildson in 1995, and Harari in
1993. According to Eskilson (1995) argues that TQM does not provide either a cure-all
nor is it single key to organisational success. Eskilson (1995) provides several examples
one of which was the bankruptcy of the Wallace Co, after receiving an award from
MBNQ. The reason for the bankruptcy of the Wallace Co. was spending too much on
quality.
However, the main disadvantages of TQM, based on Eskildson‟s suggestion are:
The number of overlapping programmes
133
Lack of clear accountability
Lack of credible measurement
Inadequate reporting
Difficulty in keeping up with changing customer priorities
Diversification of business
Lack of strategic focus
On other hand, according to Goodman et al. (1994), problems concerns the different
methods of data collection and classification, TQM requires surveys, customer
complaints, field reports and process data, and these methods cannot be combined
because of data conflict.
Another criticism on TQM is that it, mainly focuses on internal matters for example,
performance measures, training, employee participation and leadership, whilst the real
growth element comes from external matters like marketing. Therefore quality programs
should incorporate the marketing side of quality, in order to make customers‟ needs and
perceptions meaningful internally. In addition, the key is to find ways to link external
measures of customers‟ requirements, fulfilment and purchase behaviour to internal
quality measures (Kordupleski et al., 1993)
On other hand, Harari (1993) argues strongly about the disadvantages of TQM principles.
Harari (1993) pointed to ten reasons why TQM brings potential problems in real world
applications:
Focuses on internal processes rather than on external result
Focuses on minimum standard
Develops its own ponderous bureaucracy
In addition, total quality philosophy involves a comprehensive transformation
Does not require radical organisation reform
Does not demand changes in management compensation
Does not demand entirely new relationship with outside partners
134
Drains entrepreneurship and innovation from the organisational culture
Has no place for emotion and soul, but is a mechanical approach
Tries a one-size-fits all solution
In addition, total quality philosophy requires a comprehensive transformation of
organisational beliefs, values and behaviours (Olian and Rynes, 1992). For example,
senior management‟s lack of understanding the quality principles could result in a
misestimating of the degree of change involved in the adoption of a total quality strategy
(Ibid).
TQM implementation requires radical change to traditional management practices, for
example, traditional management paradigm stresses authoritarian control (Evans and
Lindsay, 2001). Therefore, though managers may support the principle of employee
participation and input, they are uneasy about giving up their authority (McConnell,
1995). The development of an effective work team may be problematic in organisational
cultures where human resource systems emphasise individual performance reviews and
compensation (Waldman, 1993).
However, Jung et al. (2008) discussed the benefits of implementation and operation of
TQM to the firms. They have mentioned that the implementation of TQM does not
warrant a positive result. The result of their study shows that effect organisational culture
is largely driven by national culture on implementation and operation of TQM. In their
research, they took an initial step to find the relationship between organizational culture
stemming from national culture and TQM elements. They found an interesting result
which shows “power distance” “long-term orientation” and “individualism” have
impacted the TQM implementation effort.
Despite the criticisms, not many academics nor practitioners dispute the fact that the
quality movement has been the most influential of all management innovations in the last
two decades (Krishman et al., 1993). Evans and Lindsay (2001) assert that many
135
companies achieved astonishing success through total quality emphasis and because the
world is becoming more quality conscious, companies that resist TQM may not be in
business for long. Moreover, TQM has been credited with some extraordinary success
stories. These successes involve business turnarounds for industry giants such as Ford,
Motorola and XEROX (Krishman et al., 1993).
Shine et al. (1998) states that the proper implementation of TQM could be a powerful
vehicle where companies are able to achieve excellence in business performance.
However, they also claim that companies that have not achieved TQM potential benefits
have begun abandoning its practices. These companies should not blame the TQM
framework, because the key reason for its failure is the lack of understanding of what
TQM means for each unique organisation and how to implement it effectively. Thus is
what has created scepticism about the effectiveness of TQM, not the basic concepts and
philosophy of TQM itself.
4.10.2 TQM and Challenges to Management theory
TQM principles challenge management theory and practice. Grant et al. (1994) indicate
that TQM is a challenge to conventional management techniques and the theories that
underlie them. TQM and management follow different paths of development and
diffusion. While TQM has its origins in statistical theory. Management theory has its
roots in the social sciences, including microeconomics, psychology, and sociology. TQM
has been developed primarily within the industry and the government, with the works of
quality gurus whose backgrounds were mainly in industrial engineering and physics. This
stands in contrast with management theory that has its origin in business schools and
consulting firms. Table 4.3 represents some characteristics of TQM and management
theory in terms of their origins and development (Grant et al., 1994).
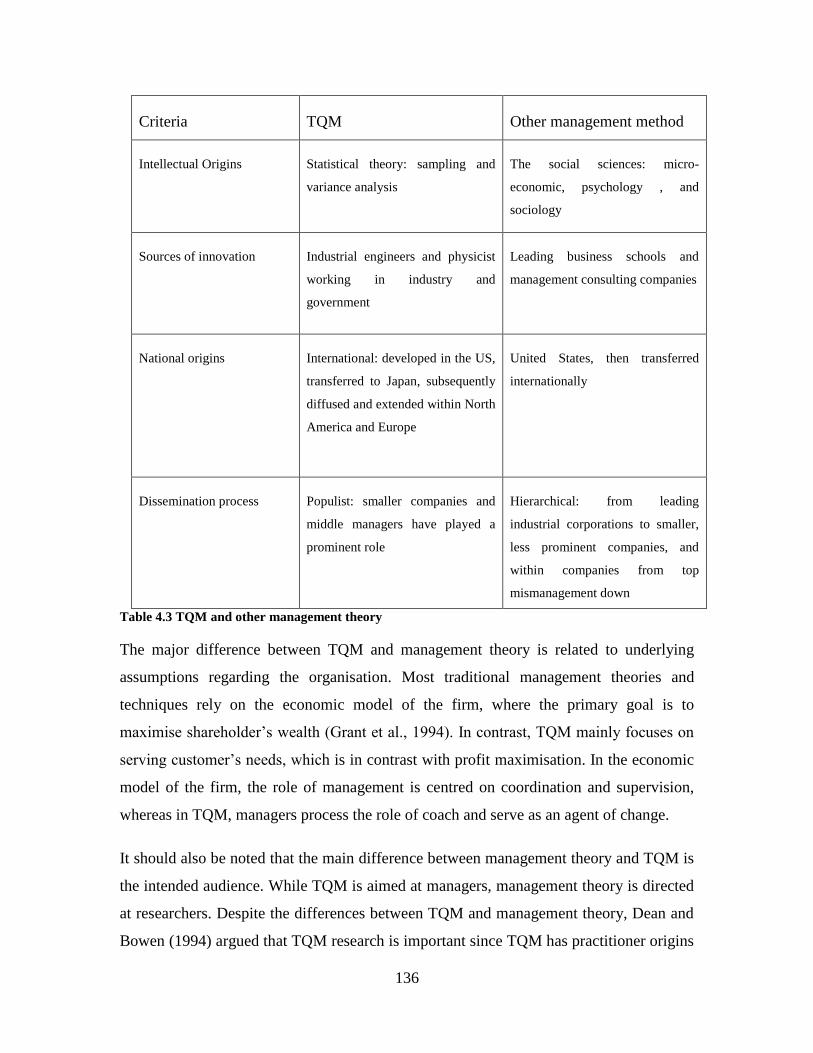
136
Criteria TQM Other management method
Intellectual Origins Statistical theory: sampling and
variance analysis
The social sciences: micro-
economic, psychology , and
sociology
Sources of innovation Industrial engineers and physicist
working in industry and
government
Leading business schools and
management consulting companies
National origins International: developed in the US,
transferred to Japan, subsequently
diffused and extended within North
America and Europe
United States, then transferred
internationally
Dissemination process Populist: smaller companies and
middle managers have played a
prominent role
Hierarchical: from leading
industrial corporations to smaller,
less prominent companies, and
within companies from top
mismanagement down
Table 4.3 TQM and other management theory
The major difference between TQM and management theory is related to underlying
assumptions regarding the organisation. Most traditional management theories and
techniques rely on the economic model of the firm, where the primary goal is to
maximise shareholder‟s wealth (Grant et al., 1994). In contrast, TQM mainly focuses on
serving customer‟s needs, which is in contrast with profit maximisation. In the economic
model of the firm, the role of management is centred on coordination and supervision,
whereas in TQM, managers process the role of coach and serve as an agent of change.
It should also be noted that the main difference between management theory and TQM is
the intended audience. While TQM is aimed at managers, management theory is directed
at researchers. Despite the differences between TQM and management theory, Dean and
Bowen (1994) argued that TQM research is important since TQM has practitioner origins
137
and management research should address the practice. They explored the relationship
between the principles of TQM and those of management theory, using Malcolm
Baldrige National Award as a bridge between the two approaches. Three major areas for
research and practice have been identified:
Areas in which management theory and TQM are essentially identical: these
include top-management leadership and human resource practises such as
employee involvement, the use of teams, training needs analysis and evaluations,
and career management.
Areas in which management theory may supplement TQM: these include analysis
of information, strategy formulation, employee selection, customer-supplier
relationship, and employee involvement and empowerment.
Areas in which TQM suggest new direction for management theory: these include
leadership, the role of quality in competitive strategy, and strategy formulation
process.
Dean and Bowen (1994) stated that some of the conflicts between TQM and management
theory arise because of the universal orientation of quality management which is in
contrast with the contingency approach of management theory. Another conflict between
TQM and management theory is in the underlying and philosophical assumptions of
TQM and management theory. TQM, from the viewpoint of its founders, emphasises
factors such as cooperation and the value of work (Wicks, 2001), which may be radically
in contrast with the rules of competition and profit generation (Deming, 1986). The
challenge in TQM implementation is how to make a balance between the principles of
TQM and those of key shareholders in the firm.
Grant et al., (1994) argued that quality management could bridge the gap between the
“rationalistic school” (based on scientific management) and the “human relation school”
138
(based on organisation as a social system with an emphasis on psychological and social
needs). However, they inducted that TQM and management principles are in conflict,
where the former emphasise the “social model of the firm”, and the latter focus on the
“economic model of the firm”. TQM is incompatible with an economic model of a firm,
and companies will need to choose between these two.
4.10.2 Organisational culture and TQM
Organisational culture plays an important role in coping with the competitive, continual
change facing organisations. It can be seen as a strategic tool for organisation managers.
However, it has been widely accepted that TQM implementation requires a culture
change in the organisation (Kekale, 1995). Gore (1999) argues that TQM provides a
framework for building an organisational culture that will equip an organisation to
continuously learn and improve. Gore (1999) concluded that TQM increasingly focuses
on all aspects of the organisation, include a holistic view of the employee, and as a result,
provides an approach to building a culture consistent with success. Similarly, Zeitz et al.
(1997) argues that the essence of TQM is culture change and that TQM practices are
merely tools for cultural transformation.
Lorsch (1986) considered organisational culture as a potential invisible barrier to change,
particularly when it clashes with the new posture that the company intends to take.
Because of this, Deshpande and Parasuraman (1986) argue that organisations must take
account of their corporate culture and attempt to harmonise it with their strategy in order
to achieve the desired results. It should be appreciated that cultural change should
incorporate the primary need to meet customer requirements, implement a management
philosophy that aknowledges this emphasis, encourage employee involvement, and
embrace the ethic of continuous improvement (Batten, 1994). With respect to
organisation culture and TQM, Deming (1987) calls for a transformation of American
management style; Feignbaum (1989) suggests a pervasive improvement through the
organisation.
139
Ross (1999) maintains that the basic vehicle for embedding an organisational culture is a
teaching process in which desired behaviours and activities are learned through
experiences, symbols, and explicit behaviour. Newman (1988) argues that managers need
to realise that transformational change is eventually important when implementing TQM.
According to Batten (1994), an organisation‟s level of quality development is one
characteristic that is often cited as a factor to consider when selecting which method of
implementation to use. In his work, he used two factors, those factors were “quality
activity” and “quality critical organisational characteristics” in order to identify the
characteristics of an organisation that affect the implementation of TQM.
However, Gore (1999) identifies a number of initiatives generally described as part of a
TQM effort that directly leads to creating a culture with very specific characteristics that
support change and improvement. These initiatives as outlined in the Baldrige Criteria
include the following: 1) participative management and openness, like supported by
encouraging employee involvement, empowerment, the use of teams, education and
training, 2) a rational approach like fact-based decision making, clear mission, objectives,
statistical tools and statistical process control, 3) flexibility like customer focus and
continues improvement. However, according to Anjard (1998), implementing a cultural
change is similar to, but it‟s more difficult than, implementing any other changing in an
organisation. It begins with a number of elements than include a clear plan, which
includes the derailing of the changes that need to take place, a scheduling of these
changes, a buyout package because of the difficulty in accepting or adjusting to the new
behaviours.
The above review of organisational quality and TQM shows that the effective
management of quality is related with organisational culture change. It also shows that
the efforts of organisation to improve quality have been limited by a failure to change the
soft aspect of quality which represents the implicit level of organisational culture.
However, the specific nature of the theoretical relationship between organisational
culture and TQM is often not made explicit.
140
There have been few empirical studies of the relationship between organisational culture
and TQM implementation factors. Little evidence has been produced to support the
assumption that organisational cultures are changed by TQM implementation factors. Al-
Shammari, (2000) argues that where cultural change has taken place as the result of a
TQM implementation, this has involved only the explicit level of organisational culture.
A number of assumptions are made in about organisational culture in the TQM chapter.
These are summarised below in relation to the three conceptual issues identified in the
above overview of the organisational chapter (See organisational chapter review).
Those who see the culture as the only variable determining the organisational
characteristics
It is implied that organisation consist of a set of variables which are causally related to
favourable indicaters of quality. There is an associated assumption that organisational
culture can be managed. Moreover, quality management is presented as a means through
which cultural change can be achieved. This is challenged by some conceptualisations of
culture. Although cultures do change, this does not necessarily imply that they can be
changed by management.
However, the characteristics of an organisation can affect the implementation of TQM,
this was emphasised by Van Der Akker (1989), who describes how TQM needed to be
implemented differently within Aery Materials Group Europe because of the culture
differences between the company‟s eight manufacturing plants and 15 sales offices. TQM
is generally easier to implement within one site than simultaneously, or according to the
same plan, in a number of sites. The larger in the number of sites at organisation, they
have more difficulty of controlling its implementation and developing an integrated
approach to TQM (Mann and Kehoe, 1995). Furthermore, implementation of TQM needs
a stable organisation structure as an unstable organisational structure can threaten the
implementation of TQM. Manny and Kehoe (1995) emphasise that TQM is likely to be
more quickly accepted in a „new organisation‟ or a „young organisation‟ rather than
established organisation. A new or young organisation can introduce TQM as a natural
141
element of its organisation while an established organisation may need to introduce some
changes.
Siehl and Martin (1990) have argued that organisational culture can have a strong
influence on quality. However, it was mostly the linkages of culture with TQM that were
examined in research studies. A natural extension of the pursuit of research in the culture-
TQM direction was the examination of the influence of national culture on quality
because of the inherent differences of many national cultures from the Japanese culture.
However, there are two views on the relationship between TQM and organisational
culture (Prajogo and McDermott, 2005). One views is TQM a standard set of procedures
that requires a similar culture with an emphasis on flexibility and people orientation,
whilst a competing views considers TQM as having different facets (for example,
standardisation and flexibility at the same time) and different cultural aspects promote
these divergent aspects. Prajogo and McDermott (2005) found support for the latter in
their study of manufacturing companies in Australia and New Zealand. However these
differences, and the academic literature in both views brings out the centrality of
organisational culture in the implementation of TQM.
One of the important reasons for the research interest in TQM was the wide popularity of
TQM practices in organisations in the 1980s and 1990s. While some of these studies
emphasise the need for compatibility between the philosophy of TQM and national
cultures (Gomez, 2004), some studies only highlight the need for the arrangement of
organisational culture with TQM (Maull et al., 2001). Some of these studies highlight the
role of organisational culture in improving quality. For example, Kanousi (2005) found
that the cultural dimensions of individualism, masculinity and long-term orientation were
related to service recovery expectations. Indeed, Jabnoun and Sedrani (2005), in his study
about UAE manufacturing firms, found that the TQM practices of customer satisfaction,
continuous improvement, management commitment to quality and benchmarking were
highly related with people-oriented and outward-oriented aspects of culture.
142
4.10.3 Social, Cultural and Economic Environment in TQM
According to Khan (2000) the socio-political or cultural environment interacts with the
many other possible factors, among them, „organisational culture, impact of technology,
market issues, nature of industry and the „manager psyche‟ towards change‟.
Consideration of these conditions and the likely impact of any change requires an
appropriate response from the TQM implementation strategy adopted. The dynamics of
the social, cultural and economic environment impact on the management of
organisational change. This is likely to be especially critical in Iran which is the focus of
this study, however, according to Khan (2000), „where economic transformation is taking
place, workforce is extremely multicultural and socio-political framework is quite
unique‟. Khan (2000) argued, „therefore, no one should attempt to universalise the issue
and import a model without first conducting some basic groundwork unique to the
Middle East‟.
However, consideration of culture and associated environment factors points to the
growing awareness concerning the exact nature of TQM implementation. As theory and
systems become increasingly elaborate and understanding more refined, the
organisational challenges of today to TQM are more contextual than theoretical,
„challenges are, to a large extent, not attributed to the principles of TQM, but rather to the
methodology and strategies used to implement it‟ (Al-Shammari, 2000).
A recent example on relating TQM with culture, contextual and environmental factors is
about the Japanese post-war success.
Jarrarand and Aspinwall (1998) referred to prevailing assumptions in management
thinking, when they said, „Japanese success, usually attributed to TQM, is now being
attributed to cultural differences, and not only to TQM itself‟. The case for the relevance
of cultural impact has been fulled by awareness of the Japanese experience, coupled with
a growing awareness of difficulties in implementation within other socio-cultural
contexts. Japanese cultural factors include a happy combination of an indigenous
persevering work ethic, respect for formal authority, concentration on the task at hand,
tranquillity and postponement of reward and gratification (Ibid). All of these factors,
143
either alone or in some combination, found in the Japanese culture must be considered in
any assessment of Japan‟s successful use of TQM.
144
4.11 Summary
In this chapter the researcher has surveyed the literature concerning the most important
factors in the process of TQM implementation. An extensive review of the literature on
quality management was performed for the purpose of clarifying critical factors that are
essential for TQM implementation, and a number of researchers have made attempts to
quantify these factors. However, this study is the first attempt to understand quality
management in Iran by considering important factors in the process of TQM
implementation. This study contributes to the understanding of quality management
practices in Iran and the UK. It also provides a better understanding of quality
management practices in a different environment, one having a different cultural, social,
and economic system. Finally, this study provides empirical results to test whether the
UK practise of quality management are applicable in another country, while determining
the effect of quality management constructs on the operational and business results.
Therefore, the above review leads to this research study of the relationship and
effectiveness of TQM with culture in organisations as well as national culture.
145
Chapter Five (Methodology)
146
5. Introduction
The aim of this chapter is to describe the research methodology that has been applied in
undertaking this research and to explain the steps followed and the methods employed by
the researcher to collect the data. This chapter starts with an overview of the research
methodology and paradigm. This is followed by a detailed description of the data
collection methods adopted in this research including a justification for the research
population and sample selection. This procedures undertaken relating to questionnaire
design and plan, interview, pilot work, question types and format, the covering letter,
content of the final version of the questionnaire, administering the questionnaire, the
respondents, checking for non-respondent bias and reliability and validity evaluation are
also discussed. Finally, the chapter concludes with a discussion and justification of the
statistical methods and techniques used in the data analysis in order to fulfil the
objectives of the study.
5.1 Research Methodology and Paradigm
Saunders et al (2007) distinguished between two terms that some writers use
interchangeably, “Research Methodology” and “Research Method”. Research
methodology refers to the overall approach to the research process, from the theoretical
underpinning to the collection and analysis of the data. Research methods, on the other
hand, refers only to the various means by which data can be collected and analysed.
Saunders et al (2007) argued that there are two approaches (paradigms) from which
research methodology can be derived, a “positivistic” approach and a
“phenomenological” approach. These two approaches are sometimes explained by
different terms. For example, the “positivistic” approach can be termed as “quantitative”,
“objectivist”, “scientific”, “experimentalist”, “traditionalist”, or “empiricist”, whilst the
phenomenological approach can be termed as “qualitative”, “subjectivist”, “humanistic”,
“interpretivist” or “post-positivistic” (Saunders et al, 2005). The terms that relate to each
approach are not necessarily interchangeable and, in many cases, have arisen as a result
of the author wishing to stand for a different approach.
147
The positivistic approach seeks the facts or causes of social phenomena, with little regard
to the subjective state of the individuals and thus logical reasoning can be applied to the
research so that precision and objectivity can be achieved when investigating research
problems and explaining the results. Explanation consists of establishing any type of
relationships between the variables and linking them to a deductive or integrated theory.
The phenomenological approach, on the other hand, arose as a result of criticisms of the
positivistic approach application in social science and it stems from the view that reality
is not objective and exterior, but socially constructed and given meaning by people (Ibid).
Thus, the act of investigating reality has an effect on that reality and considerable regard
is paid to the subjective state of the individual. More specifically, this approach to
research stresses the subjective aspects of human activity by focusing on the meaning,
rather than the measurement, of social phenomena (Saunders, et al, 2007)
However, the major difference between the positivistic (quantitative) and the
phenomenological (qualitative) paradigms of scientific inquiry can be illustrated through
the overall approach followed by each of these paradigms, with regard to the generation
of knowledge. On other hand, the most significant distinguishing feature between the two
approaches is that adopting either approach leads the researcher to employ a specific
research methodology. Adopting the positivistic approach requires a research
methodology that is concerned with hypotheses testing by collecting and analysing
quantitative data in order to arrive at generalisable inferences which are often based on
statistical analysis (Saunders, et al, 2007). Cross-sectional studies, longitudinal studies,
experimental studies and factorial studies are considered as types of research that can be
grouped together under the heading “positivistic methodology” (Ibid). On the contrary,
adopting the phenomological approach requires a research methodology that is concerned
with generating theories by collecting and analysing qualitative data in order to describe
and discuss a phenomenon in its context. Any type of case study such as descriptive,
illustrative, experimental and explanatory falls into this category of research
methodology (Ibid).
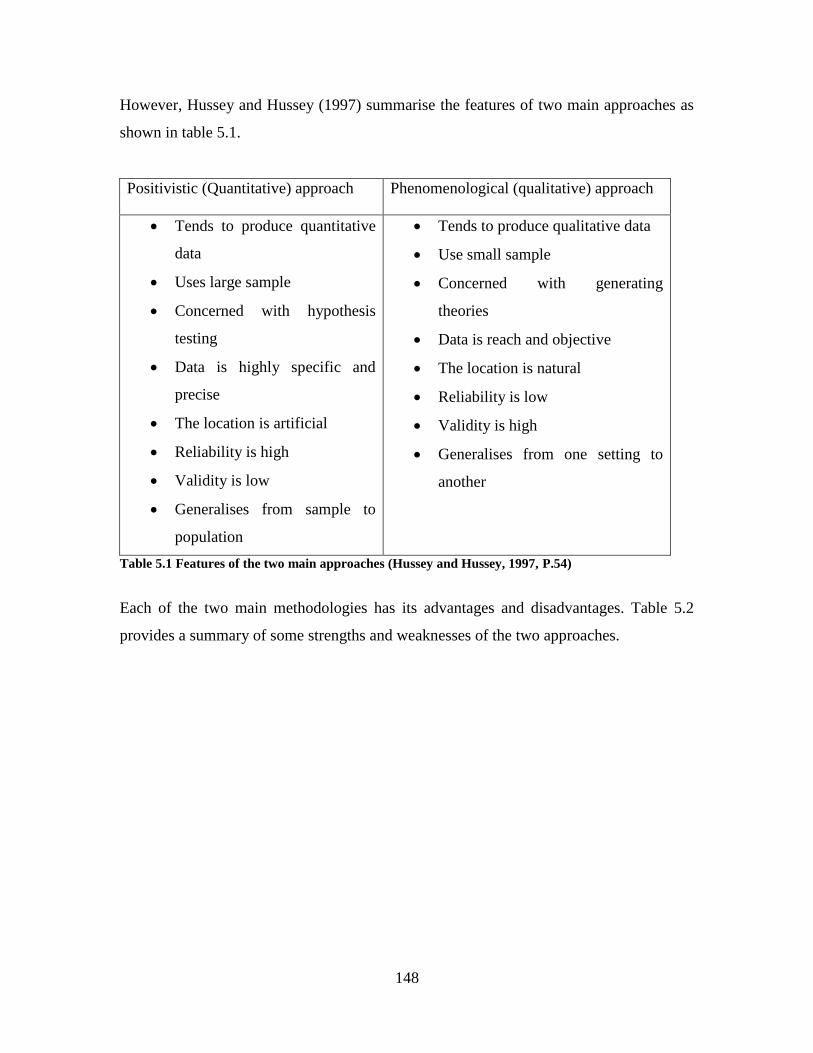
148
However, Hussey and Hussey (1997) summarise the features of two main approaches as
shown in table 5.1.
Positivistic (Quantitative) approach Phenomenological (qualitative) approach
Tends to produce quantitative
data
Uses large sample
Concerned with hypothesis
testing
Data is highly specific and
precise
The location is artificial
Reliability is high
Validity is low
Generalises from sample to
population
Tends to produce qualitative data
Use small sample
Concerned with generating
theories
Data is reach and objective
The location is natural
Reliability is low
Validity is high
Generalises from one setting to
another
Table 5.1 Features of the two main approaches (Hussey and Hussey, 1997, P.54)
Each of the two main methodologies has its advantages and disadvantages. Table 5.2
provides a summary of some strengths and weaknesses of the two approaches.
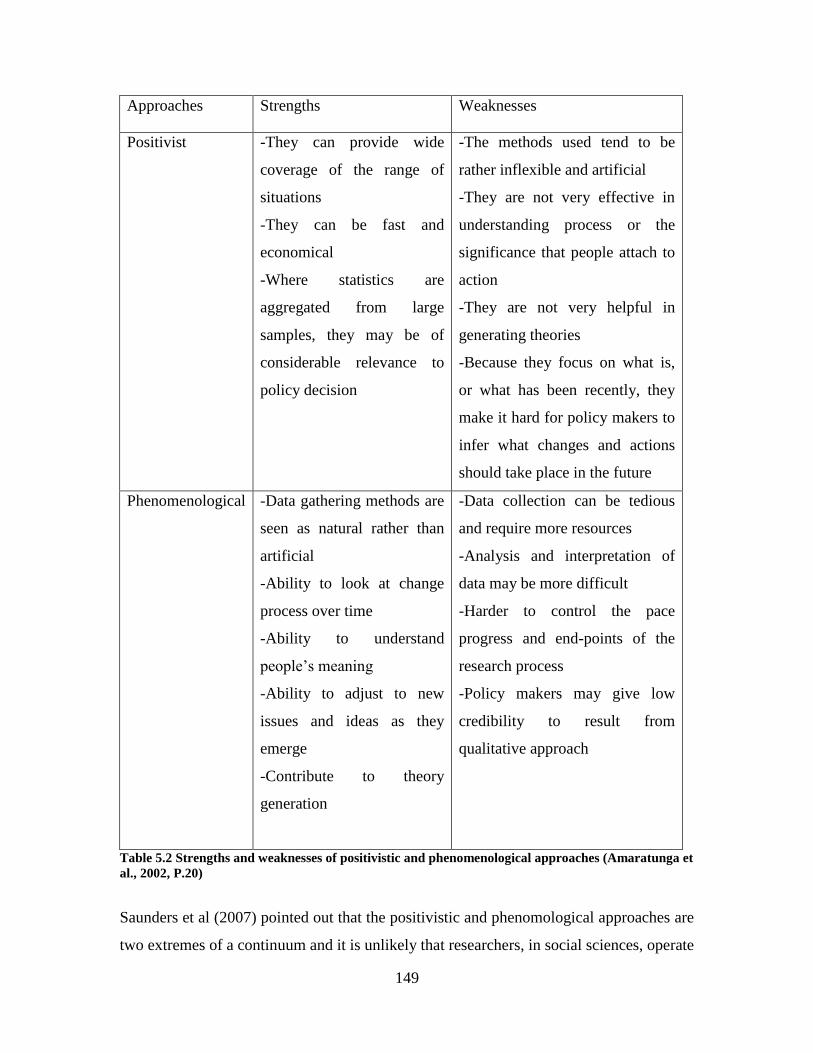
149
Approaches Strengths Weaknesses
Positivist -They can provide wide
coverage of the range of
situations
-They can be fast and
economical
-Where statistics are
aggregated from large
samples, they may be of
considerable relevance to
policy decision
-The methods used tend to be
rather inflexible and artificial
-They are not very effective in
understanding process or the
significance that people attach to
action
-They are not very helpful in
generating theories
-Because they focus on what is,
or what has been recently, they
make it hard for policy makers to
infer what changes and actions
should take place in the future
Phenomenological -Data gathering methods are
seen as natural rather than
artificial
-Ability to look at change
process over time
-Ability to understand
people‟s meaning
-Ability to adjust to new
issues and ideas as they
emerge
-Contribute to theory
generation
-Data collection can be tedious
and require more resources
-Analysis and interpretation of
data may be more difficult
-Harder to control the pace
progress and end-points of the
research process
-Policy makers may give low
credibility to result from
qualitative approach
Table 5.2 Strengths and weaknesses of positivistic and phenomenological approaches (Amaratunga et
al., 2002, P.20)
Saunders et al (2007) pointed out that the positivistic and phenomological approaches are
two extremes of a continuum and it is unlikely that researchers, in social sciences, operate
150
within their pure forms. Although the basic beliefs of the two approaches may be quite
incompatible, the differences between the actual research methodologies adopted by the
researcher are not always clear cut. Therefore, the choice of either methodology should
be based on the research questions and objectives which are to be addressed by the
researcher.
The researcher is going to use the quantitative (positivistic) approach in the present
research. Specially, in order to answer the research questions and fulfil the research
objectives, a cross-sectional study as a type of research methodology is applied. This is
because the empirical study is designed to examine the linkage between particular
variables, to test precise hypotheses and to find out the answers to questions in the form
of „what‟ and „why‟ rather than „how‟ or „how often‟.
5.1.1 Quantitative Methodology
The quantitative methodology reflects the positive thinking that research should concern
itself with “observable social reality” (Remenyi et al, 2000). The belief that observed
phenomena are measurable, and that “it should be possible to generalise or to model,
especially in the mathematical sense, the observed phenomena” is also expressed (Ibid).
The emphasis is on “quantifiable observations that lend themselves to statistical
analysis”. Thus, much of the methodological rationale for the present study rests on
positivist assumptions and an acceptance of positive-quantitative limitation that findings
based on quantitative analysis could be shallow and, hence, not representative of the true
dynamics of the research question under examination.
However, in management studies the quantitative methodology has not been widely
relied upon to provide general laws or boundaries for research investigation in recent
years. Rather, quantitative analysis, standard instruments and often extended surveys of
populations or statistically rendered samples provide a starting point for investigation and
a rational incentive for in-depth analysis. Quantitative procedures can provide an initial
151
assurance of representative data and a tentative insight into probable areas and factors of
generalise ability (Mc Clintock et al, 1979).
Research may lead to information and understanding that has surface meaning and
implications. However, this can be a starting point for a process of investigation that has
reasonable expectations for problem solving grounded on prior research finding. On the
other hand quantitative methodology and findings, despite attributes wonderfully
constructed to reveal social structures and to correlate with and build upon the larger
body of similar research, and limited in revealing of, this process, as well as its meaning,
purpose and motivation. Thus, such reliance upon quantifiable data and statistical
application, may act to over-simplify the subject matter by concealing its context. This
context is essential to make sense of a situation in a way that allows further engagement
for problem solving (Wong, 1992).
5.1.2 Qualitative Methodology
The qualitative methodology emphasises the unfolding of social processes (Van Maunen,
1979), primarily through the exploration of the research participants “own situated
experiences” (Symon and Cassell, 1998). When forming a quantitative theory, there is a
tendency for an “overarching reductions explanation” (Ibid). The use of qualitative
research may thus compensate for any failure to explore in depth “the richness and
significance of individual experience” (Ibid).
However, qualitative methodology, in contrast to quantitative, statistical, and positivist
perspective, is “phenomenological” in approach (Remenyi et al., 2000). This to say,
qualitative methodology reflects „a theoretical point of view that advocates the study of
direct experience taken at face value; and one which sees behaviour as determined by the
phenomena of experience rather than by external, objective and physically described
reality‟ (Remenyi, 2000). Qualitative analysis focuses upon certain assumptions in the
phenomenological perspective about “the primacy of subjective consciousness” over and
152
above those external objective physical phenomena that can be observed, described,
measured and statistically analysed (Ibid).
However, qualitative method can provide an insight into the intangible aspects of
complex social and organisational areas of study. This can provide meaning through
reconstruction, perception, and interpretation. The research participant‟s interpretation,
observation, perceptions, conclusions and trains of thought bring a sense of meaning and
order, or simply some sense of continuity and stability, to their experiences. This is the
data that helps the researcher understand what the participant is witnessing through his
own eyes and with his own feeling and intuitive responses. It offers the researcher the
prospect of understanding a situation first hand (Burgess, 1984; Bryman, 1992).
The qualitative approach to the examination of social issues, including those in business,
organisation and management is carried out primarily through interviews. Individual
interviews tend toward in-depth probing and a rather intensive exploration of the research
participant‟s individual perceptions, analyses, awareness, interpretations, and feeling
(Ibid).
The qualitative approach often uses semi-structured or open-ended interviews. The
categories used initially by the researcher should be capable of modification if they are
not to become limitations that obstruct the ultimate objectives of the research. The
respondent‟s point of view is more readily available, more forthcoming to the extent that
the categories and directives are its own and not those of the researcher (Ibid). The
researcher‟s real aim and task is to discover the world as the respondent experiences and
understands it, and to communicate whatever is available through the respondent‟s eyes
(Bryman, 1992, Wong, 1992). Intensive research exposure to an informant‟s personal
insight and interpretation works toward a sense of knowledge and meaning. The shared
discourse between researcher and information is the wellspring of meaning. It is viewed
as a creative, ongoing, and evolutionary process. It is not deduced from a sense of
absolutes, nor does it tend toward a narrow system of laws and principles (Symon and
Cassell, 1998).
153
On the other hand, case study is a typical research method widely used for qualitative
data collection in management research. Remenyi et al. (2000) emphasise that „the case
studies are being increasingly used in business and management studies as an evidence
collection approach for several reasons including the fact the scope of the case is
extensive, ranging from individuals to business groups, to fiscal policy‟. Yin (1994)
defines case study as an empirical inquiry, which investigates a contemporary
phenomenon within its context.
However, the data for a case study are usually obtained from a different data collection
approach. Remenyi et al. (2000) identifies six important sources of evidence used in case
studies. These are documents, archival records and interview as well as from any person
who has knowledge of the subject, observations of the researcher, participant observer
interactions as well as physical artefacts. Using multiple sources of information serves to
expose the inner dynamics of the case under observation, rather than to arrive at
statistical generalisations. It also contributes to a detailed understanding of the
phenomenon under investigation (Aaker et al., 1998).
5.1.3 Multi-methods approach (Triangulation)
Based on the arguments provided by Saunders et al. (2007), and also by Easterby-Smith
et al. (2002) that, in reality, business research rarely falls under one specific research
philosophy, positivism (quantitative) or phenomenology (qualitative), most management
and business research often uses a combination of both approaches. According to
Saunders et al. (2005), it is better to combine approaches within the same piece of
research. In this regards, Esterby-Smith et al. (2002) also stress that the distinction
between a quantitative and qualitative approach is not always clear. However, there are
many advantages for this approach. Importantly, researchers can use different methods in
combination in the one single study, either because of the research design or because they
wish to corroborate the results from one method with the result from another, an
approach known as „triangulation‟. Another advantage, according to Creswell (2003), is
154
that it is beneficial for the researcher to be “pragmatic” in mixing research approaches
and methods in a single study of social phenomena.
Using triangulation in one study has a number of advantages in that it provides a kind of
convergence of results complements findings reached from analysing various
observations and enhances the scope and breadth of a study (Creswell, 2003). On other
hand, Creswell (2003) has suggested three approaches to combined research designs.
First, the two-phase design approach, according to which the researcher conducts a
qualitative phase of the study and a separate quantitative one. Second, the dominant less
dominant design approach, in which the study is presented within a single, dominant
approach with one small component of the overall study drawn from the alternative
paradigm. Third, the mixed-methodology design approach, which represents the highest
degree of mixing approaches of the three designs. Using this approach the researcher
mixes aspects of the qualitative and quantitative approaches at all or many
methodological steps in the design.
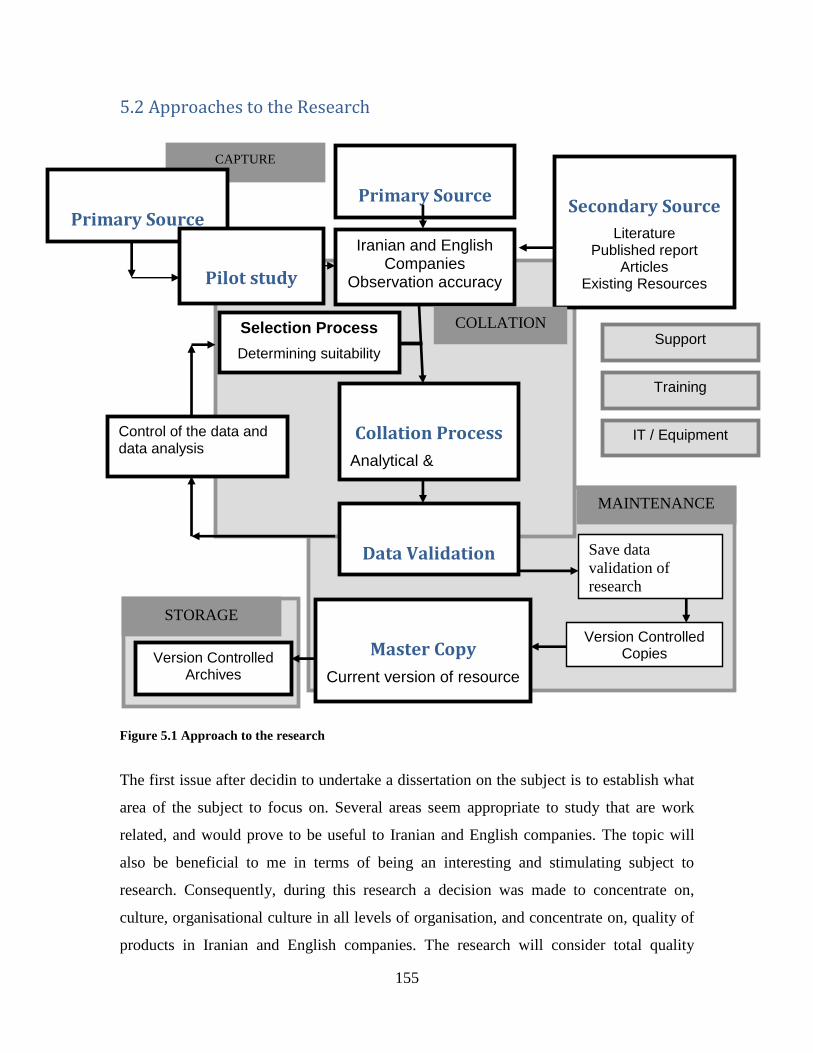
155
5.2 Approaches to the Research
Figure 5.1 Approach to the research
The first issue after decidin to undertake a dissertation on the subject is to establish what
area of the subject to focus on. Several areas seem appropriate to study that are work
related, and would prove to be useful to Iranian and English companies. The topic will
also be beneficial to me in terms of being an interesting and stimulating subject to
research. Consequently, during this research a decision was made to concentrate on,
culture, organisational culture in all levels of organisation, and concentrate on, quality of
products in Iranian and English companies. The research will consider total quality
Primary Source
Observation Secondary Source
Literature Published report
Articles Existing Resources
Iranian and English Companies
Observation accuracy
Selection Process
Determining suitability
Collation Process
Analytical &
Master Copy
Current version of resource
Data Validation
Data processing &
Support
Version Controlled Archives
Version Controlled Copies
Training
IT / Equipment
CAPTURE
COLLATION
MAINTENANCE
STORAGE
Save data
validation of
research
Primary Source
Questionnaire and
Pilot study
Control of the data and data analysis
156
management (TQM) and the role of general management in those companies. It feels that
the use of qualitative data through interview will be appropriate to address the research
aim. The qualitative aspect of the research design will be, „Multi-method in focus,
involving the interpretive, naturalistic approach to its subject matter. This means that
qualitative research study things in their natural settings, attempting to make sense of, or
interpret phenomena in terms of the meaning people bring to them.‟ (Bell, 1999, P.2)
The research process generally consists of answering the main question and subsidiary
questions, collection of data by semi structure interviews and questionnaires, analysis of
the data, and result presentation to the hypothesis or the solution of the research.
However, the steps in management research interact and depend on each other, each step
is to be /planned to ensure the right implementation of the research process.
The case studies approach will enable engagement with employers and some managers of
the companies in such a way as to „identify various interactive processes at work‟ (Bell,
1999, P.8). This process will the research to analyse the unique relationship between
organisational culture and TQM.
The information collected in this way will be supported with quantitative data that will
enable different perspectives and the corroboration of findings to be undertaken.
It is important to think these matters out clearly before the research commences, as this
helps researcher to choose the best means of data collection. It is believed that the aim of
this research can best be achieved by the researcher chosing to collect the evidence by a
questionnaire, an interview and observation. The researcher will discuss his reasons for
choosing questionnaire and interview in the next section.
157
5.2.1 The research design and the rationale behind this choice
It is worth mentioning that this particular research, like many others in management
studies, does not fall under one particular research philosophy: positivism or
phenomenology. Rather, it is a mixture of the two philosophies and a mixture of
quantitative and qualitative methods, which facilitates a flexible research design.
After the researcher had reviewed the literature on research methods in social science,
generally, and decided the research questions and objectives, in addition to considering
all methodological limitations, criticisms and issues relating to organisational culture and
TQM, the researcher found that the multi methods approach (method triangulation)
conducted through questionnaire, semi-structure interview and observation in a
complementary way, rather than competition with each other, was an appropriate and
flexible way to conduct this research. The reasons behind these choices are justified in
the following.
The research is to be conducted in the context of Iranian and British organisations.
It is designed to explore the current situation and practices of TQM in terms of
training implementation process, delivery methods and training evaluation and
follow up; also, to identify all the problems and challenges that might confront
TQM function and programmes. In addition, the role of TQM in achieving the
organisation‟s strategic objectives and improving the organisation‟s performance
will be explored. Achieving all of these aims requires applying a multi-methods
approach (qualitative and quantitative) including a questionnaire, a semi-
structured interview, and observation as the main primary data collection
methods, in addition to the survey of the available secondary data. Moreover,
most of the research questions and objectives are exploratory in nature; the
investigation is based on top managers, and TQM manager‟s viewpoints and
experiences (perceptions) in the context of Iranian and British organisation. That
requires applying many data collection methods and exploring themes
underpinning the research objectives, rather than relying only on one particular
158
method. The adopted approach provides useful quantitative and qualitative data,
which generate a rich wealth of data and interpretation.
As mentioned in chapter 2 there are few empirical studies conducted in the field
of organisational culture and TQM in Iranian organisation and a lack of studies
examining TQM and organisational culture relationships, but research could draw
hypotheses to be tested.
The chosen research design and approach is also used by other Iranian researchers
who have conducted studies related to TQM and organisational culture in
different contexts, such as, Mosadegh Rad (2006), Abzari, and Dalvi (2005),
Javidan and Dastmalchian (2003), and Mortazavi et al (1999). Those Iranian
researchers found that a multi-method approach combining questionnaires and
interviews is the most applicable and acceptable research method in Iran.
Applying the same research design used by other Iranian researcher strengthens
the current study consistency, validity and reliability since some part of research
conducted in Iran.
Based on the nature of the research questions and objectives, it is obvious that this
study includes many subjective variables or factors. These need to be investigated
and measured through qualitative and quantitative method. The research includes
many social behavioural factors, beliefs and attitudes that need to be explored and
explained in detail. Therefore, applying the chosen research design helps the
researcher to address all required qualitative and quantitative data that provide
more flexibility to meet multiple research interests and needs to facilitate using
different quantitative and qualitative data collection methods in one study, which
will enrich the findings from this study.
This approach enables methodological triangulation, which refers to using
different data collection method within one study, in order to ensure that data are
telling you what you think they are telling you, in other words, generate more
validity and reliability (Saunders et al, 2007). Triangulation involves
crosschecking for internal consistency and external validity, which is a concern of
this study. In this regard, Saunders et al. (2007) indicate that semi-structured
159
interviews, applied with other data collection methods like the questionnaire, and
observation, are very valuable ways of triangulation.
Statistical analysis of the quantitative data collected will make summaries,
comparisons and generalisation relatively easy and accurate, while qualitative
data will provide a forum for elaboration, explanation and description of events,
actions, attitudes, behaviour and lead to more meaningful and new ideas from the
perspective of the subjects who are being investigated (Bryman, 1992, P.61). This
will provide a more rigorous understanding of the subject under investigation.
5.3 Population studied
It would be useful to start this section by identifying the many reasons for choosing Iran
and England as places to conduct this research. Importantly, Iran is the home country of
the researcher, which means that the researcher is able to collect the required information
of his research without any difficulties regarding the language, cultural difference, time
issues, and so on. The researcher understands the ethical issues concerned in conducting a
research in Iran and England. The other important reason is that there is a shortage of
empirical studies concerning TQM in developing countries, including Iran, also,
concerning TQM and organisational culture relationships. This point emphasises that
Iran, as a developing country, needs empirical studies in the field of TQM which might
improve the TQM situation and practices and the way in which organisations look or
consider TQM also, they will support decision makers to have useful information
required to improve TQM roles and effectiveness in the organisation.
5.4 Sampling
Sampling can be defined as the „process of obtaining information from a subset (a
sample) of a large group (the universe or population)‟ (McDaniel and Gates, 2001).
McDaniel and Gate (2001) define a population as the totality of units or people about
whom the researcher needs to obtain information. A population is seen to be a complete
group of people that constitute a community, a society, an organisation, or anything that
160
may have some common characteristics or criteria. However, sampling allows the
researcher to identify some vague, unknown characteristics of the population. When the
number of population is similar, only a small sample can be used to conduct the study.
Sometimes, it is entirely impossible to collect data, or to test, or to examine every
element in terms of time, cost and other human resources (Sekaran, 2000). However, for
different reasons, it would be successful to restrict the study of the population to
sampling some of its members and then generalise it on the whole population (Ibid).
5.4.1 Type of Sample:
Sampling techniques fall into two broad categories, namely probability samples and non-
probability samples:
Probability sampling
The probability sample is based on chance selection procedures. In probability sampling,
every element in the population has a known non-zero probability of being selected, and
the selection of probability samples will always respect certain statistical rules that are
not subject to the interference of the researcher (Sekaran, 2000). Because of its
randomness, the probability sampling procedures eliminates the bias associated with the
non-probability sampling (Remenyi et al, 2000). One of the advantages of using the
probability sampling is that it allows the sophisticated use of statistical tests to research
for group differences.
However, a researcher‟s choice of probability sampling depends on the research
questions and objective and whether the researcher needs to make statistical inferences
from his sampling (Ibid). The impact of each of these is summarised in table 5.3.
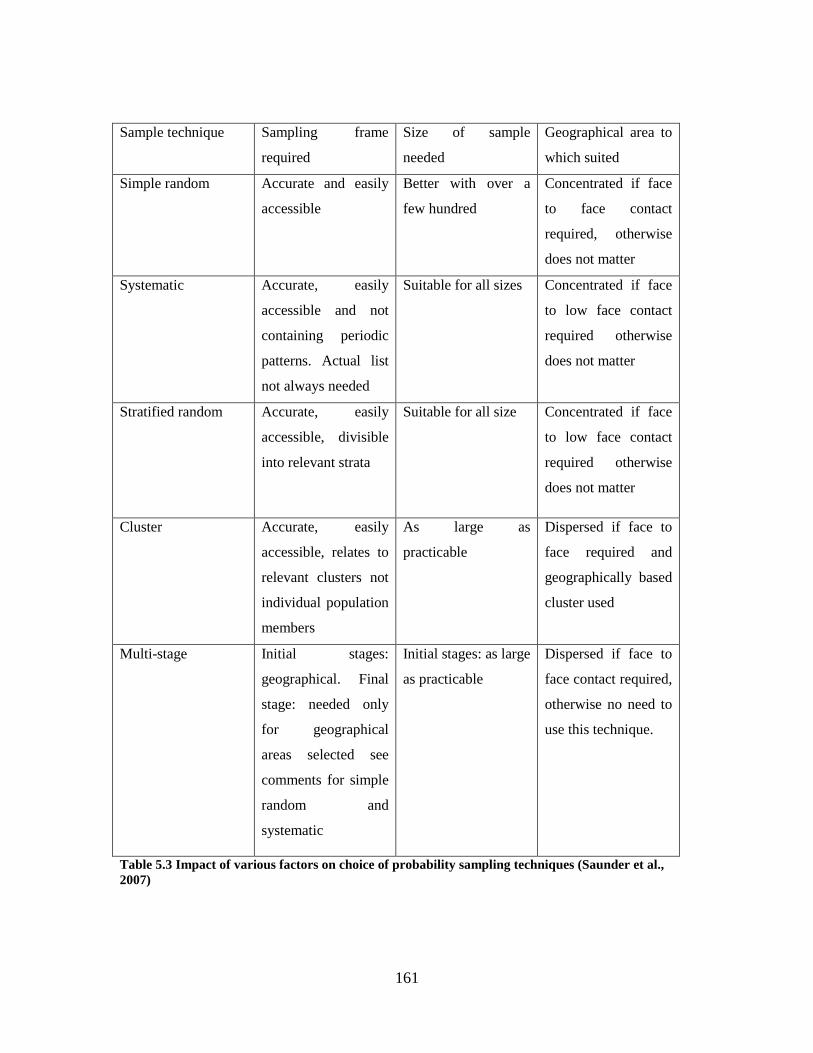
161
Sample technique Sampling frame
required
Size of sample
needed
Geographical area to
which suited
Simple random Accurate and easily
accessible
Better with over a
few hundred
Concentrated if face
to face contact
required, otherwise
does not matter
Systematic Accurate, easily
accessible and not
containing periodic
patterns. Actual list
not always needed
Suitable for all sizes Concentrated if face
to low face contact
required otherwise
does not matter
Stratified random Accurate, easily
accessible, divisible
into relevant strata
Suitable for all size Concentrated if face
to low face contact
required otherwise
does not matter
Cluster Accurate, easily
accessible, relates to
relevant clusters not
individual population
members
As large as
practicable
Dispersed if face to
face required and
geographically based
cluster used
Multi-stage Initial stages:
geographical. Final
stage: needed only
for geographical
areas selected see
comments for simple
random and
systematic
Initial stages: as large
as practicable
Dispersed if face to
face contact required,
otherwise no need to
use this technique.
Table 5.3 Impact of various factors on choice of probability sampling techniques (Saunder et al.,
2007)
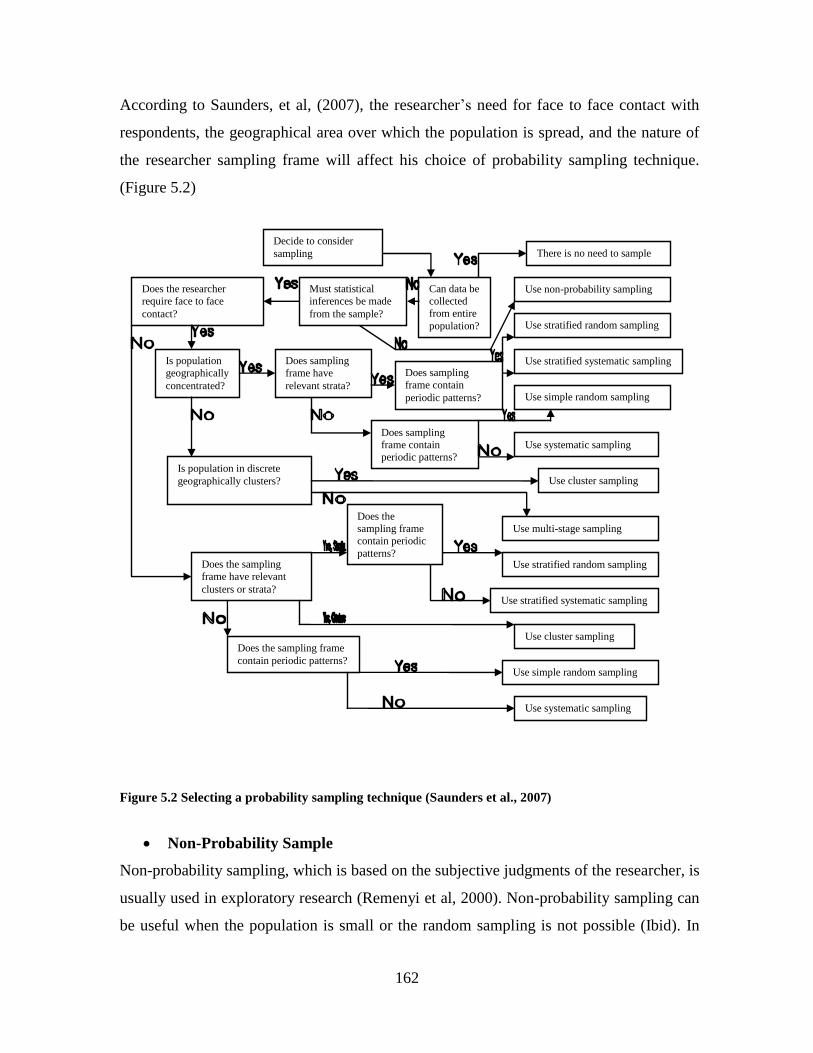
162
According to Saunders, et al, (2007), the researcher‟s need for face to face contact with
respondents, the geographical area over which the population is spread, and the nature of
the researcher sampling frame will affect his choice of probability sampling technique.
(Figure 5.2)
Figure 5.2 Selecting a probability sampling technique (Saunders et al., 2007)
Non-Probability Sample
Non-probability sampling, which is based on the subjective judgments of the researcher, is
usually used in exploratory research (Remenyi et al, 2000). Non-probability sampling can
be useful when the population is small or the random sampling is not possible (Ibid). In
Decide to consider
sampling
Does the researcher
require face to face
contact?
Must statistical
inferences be made
from the sample?
Can data be
collected
from entire
population?
There is no need to sample
Use non-probability sampling
Is population
geographically
concentrated?
Does sampling
frame have
relevant strata?
Does sampling
frame contain
periodic patterns?
Does sampling
frame contain
periodic patterns?
Is population in discrete
geographically clusters?
Does the sampling
frame have relevant
clusters or strata?
Does the
sampling frame
contain periodic
patterns?
Does the sampling frame
contain periodic patterns?
Use stratified random sampling
Use stratified systematic sampling
Use simple random sampling
Use systematic sampling
Use cluster sampling
Use multi-stage sampling
Use stratified random sampling
Use stratified systematic sampling
Use cluster sampling
Use simple random sampling
Use systematic sampling
163
this type of sampling, it is unlikely to specify or categorise the probability of each unit in
the sample. This implies that there is no chance for units to be selected (Saunders et al,
2005). The more popular non-probability sampling methods include the following:
Convenience Sample: this involves the population members who are easily located
and willing to participate. Convenience sampling is commonly used in exploratory
research to generate hypothesis, to test pilot questionnaires. However, this type of
sampling is rarely general, because some more important elements are not
available or include (Saunders et al, 2005).
Quota Sample: this sampling tries to divide the population into subgroups. Based
on the percentage of the population in each sub-group, subjects are selected so that
the sample matches the population proportion exactly. The main goal of this type
of sampling is to ensure that the sub-groups in a population are well represented in
the sample to the extent the examiner desired (Ibid).
Judgement Sampling: Judgement samples, also called purposive samples, are
samples in which the selection criteria are based on the researcher‟s personal
judgement about the representative of the population under study (Ibid).
Snowball Sampling: this is often used when population members are to identify
other numbers of the population to be contacted. Remenyi et al, (2000) defined
snowball sample as „one where the researcher used information to help him or her
find the next information.
5.5 Research Sample selection
This study has focused on the characteristics of the organisation, rather than on
management descriptions, as the basis for selecting the research sample to be included.
However, developing a TQM implementation framework as a research topic is best
investigated by studying total quality organisations (Thiagarajan, 1996, Wong, 1999). This
involves identifying Iranian organisations with known quality initiatives. The selection
process involved finding a mixture of organisations that varied in terms of size, maturity
of TQM implementation, and scope of business. This was necessary to elicit responses
164
that cover different industries in order to make sound generalisations about the whole
sample. Thus, the sample includes organisation from manufacturing.
However, the researcher had to select the organisations to be included in the sample on the
basis of those who were accredited quality management systems such as the ISO-9000
series and the TQM organisations. The ISO 9000 series certification implies that a quality
management system is running in these organisations, although this system may not be
observed at a company wide scale. However, it was assumed that ISO registered
companies are TQM-oriented, as ISO registration is considered a step towards the
implementation of TQM (Bredrup, 1995).
However, determining those organisations which fit identified TQM implementation
criteria for this study, involved several procedures. The general criteria perspectives
incorporated into the selection format included:
organisations that adopted quality management
Organisations certified by ISO 9000
Organisations that discussed their TQM experience in conferences and journals
Companies recommended by my supervisor
For this research, the researcher decided to choose a non-probability sampling, and more
specifically judgmental sampling. Indeed, the judgemental sampling is a form of
convincing sampling in which the population elements are purposely selected based on the
judgement of the researcher. In the researcher‟s case, it was felt that in order to have a
quality and a concise analysis of the results, a selection of organisations should be chosen
from two main sources in Iran: the ISO office in Tehran and the ISO office in Yazd, I in
the UK a selection of companies with TQM was a compulsory requirement.
165
5.6 Collection methods
The researcher seeks to identify the effects of organisational culture on TQM, and then to
do an analysis of interview and questionnaire result. Therefore, the researcher must
procure enough information from the research to make this possible. When deciding to
conduct research, regardless of the type of research, it is important for the researcher to
choose the best way to collect data. According to Bell (1999) there are eight kinds of
instrument or methods for data collection i.e. interview, telephone interview, observation,
questionnaire design, statistical significance, multilevel modelling, laddering in personal
constructs, speech act theory and item response theory and computer-adaptive testing.
This research used questionnaire and semi-structure interview because these methods
were simple and efficient. This research used closed questions for both the questionnaire
and the interview, because this facilitated gathering data for analysis.
5.6.1 Interview
On data collection method used in this study was face-to-face semi-structured interviews,
since the study is dealing with different subjective factors and variables which need to be
explored in depth; therefore, it was found that semi-structured interviews are an
appropriate data collection method for this study. Saunders et al. (2007) define an
interview as a purposeful discussion between two or more people. It helps to collect valid
and reliable data that are relevant to research question and objectives. Therefore, an
interview is a face to face or vice-to-voice conversation that is directed and conducted by
a researcher to obtain or elicit relevant data, information, expression, opinions and beliefs
that are relevant to the research objectives.
Personal face to face interviews can be divided into three types: in-depth unstructured
informal interviews, structured interviews and semi-structured (Ibid). In the structured or
standardised interview, a set of pre-determined questions is asked so that the responses
are recorded on a standard schedule. The semi-structured interview is a non-standardised
interview; the researcher has a list of questions to cover during the interview, however,
166
semi-structure-interviewing is a widely used research method having the advantages of
being flexible, since it is possible to follow up and probe the answers and often additional
information can be obtained. An unstructured or informal interview is also called an in-
depth interview and has no predetermined list of questions, however, the researcher or
interviewer has to have general ideas about the areas or aspects to be explored since this
type of interview helps to explore a general area in depth. On the other hand, respondent
is given the chance to talk freely about the situation, event, behaviour or beliefs in
relation to the topic area.
Information, regarding the current situation at Iranian and English companies, was
acquired by conducting semi-structured interviews to find company‟s views on the
culture, organisational culture, and TQM. However, the rationale for using semi-
structured interviews in this study was that the other Iranian researchers have chosen the
face to face semi-structured interview technique as means of data collection, in addition
to a survey questionnaire, to conduct their research such as, Abzari, and Dalve (2005),
Javidan and Dastmalchian (2003), and Mortazavi et al (1999). These researchers found
that this technique is very helpful in Iranian organisations, where managers prefer to talk
rather than to complete a questionnaire. In addition, they complement the questionnaires
and can explore or explain, in depth, any further details, information, themes and facts
under investigation behind the questionnaire‟s responses; in other word supplement and
validate the questionnaires‟ findings. Also, the interviews provide the researcher with
some important information when interpreting the questionnaires‟ findings.
5.6.1.1 Interview data collection
Data collection was not a smooth process with a constant stream of data being logged.
The volume of data that the researcher collected grew over time, and the influx of data
increased as the researcher spent more time on the project. In the early stages, especially
on the projects in Iran as the researcher was getting to know the project, the researcher
was constantly concerned that the researcher was getting no data since the researcher was
not making any interesting observations. In the UK the researcher collected data mainly
167
through ethnographic interviews (Spradley, 1979) in which the researcher asked
participants to talk about the challenges they faced in the companies. In Iran, since the
researcher had more time, he adopted a different approach. He spent a week reviewing all
sorts of documentation in the organisations such as production plans, organisation charts
and progress reports to gain an understanding of the state of the companies and the
participants involved. The researcher then spent a month exclusively conducting direct
observations of various meetings. The researcher sat in the back of the room at these
meetings and jotted down notes about the incidents that unfolded. At the end of a month,
the researcher had a good idea of the main issues and challenges that the companies were
facing. The researcher then started to interview people in parallel with making ongoing
observations in meetings to attempt to learn more about the events that the researcher
observed. During the three weeks stay in Iran and one month in the UK, the researcher
exclusively conducted interviews with head of ISO, and ten companies‟ manager in Iran
(Setareh Kavir Carpet Co., Khtereh Kavir Carpet Co., Kabir Carpet Co., Rangrazi Yazd
Co., Alyaf Yazd Co., Nasaji Yazd Co., Yazd Shahab Co., Pars Medad Co., Yazd Syringe
Co., Tak Mackaron Co.) and five companies managers in the UK (Sellers Engineering
Co., ID Williams (N Brown Group)., Pneumatic Conveyors Co., Huddersfield Wire.,
James Holdsworth Co.). Most of these interviews were ethnographic in nature, where the
researcher explored the issues of conflicts on organisational culture and TQM that gave
rise to them. The researcher tried to see how these views related to the observations that
the researcher made. Some interviews were more structured in nature. The researcher had
specific questions to ask or even hypotheses that the researcher tested through interviews.
Most of the interviews in Iran were tape-recorded.
Some informants provided good data, while others were practically useless. Saunders et
al (2007) recommends choosing informants who are interested in the research, who are
knowledgeable, and who can articulate accurately. The researcher tried to identify and
develop informants from various groups who fit these criteria, and who would be able to
provide rich information. It is important to conduct interviews at all levels, since no
single group in the field can be considered representative of the entire set of participants
(Ibid).
168
The researcher therefore conducted interviews at various levels of organisations. By
collecting data from different companies, the researcher could strengthen the internal
consistency of his findings as well as the validity of his research (Yin, 1994). Other
researchers advise maintaining a daily journal of field notes in addition to conducting
interviews or making observations (Eisenhardt 1989; Van Mannen 1988) a strategy that
the researcher adopted. At the end of every interview the researcher spent a few minutes
writing down some of the highlights from the interview. At the end of the day, the
researcher wrote down a narrative of the meetings that the researcher had attended and
the interviews that the researcher had conducted. The researcher was then in a position to
review his data without having to transcribe his interviews while still in the field.
In the UK, the researcher did not have much of a choice as the researcher received a
predetermined interview schedule. In Iran however, the researcher considered how to
collect data systematically on large companies with so many activities taking place. In
addition, there were several substantive areas on the companies in Iran such as sales
departments, quality departments and production groups. The researcher attempted to
interview people and attended an approximately equal number of meetings in all of these
areas so that the data would not be biased towards one substantive area.
However, the researcher was kept quite busy running from meetings to site visits to
interviews throughout his stay in Iran. In his data collection, the researcher was able to
identify and note down discrete incidents that occurred in meetings that he attended. In
addition the researcher was able to note down indicators relating the setting of the
incident. By doing this in a systematic manner for most meetings or the researcher
attended, the researcher was later able to count and identify the frequency of different
events, prove that some of them occurred on a regular basis, describe what happened, and
analyze what happened when some of the contextual parameters changed.
Completing data collection, researchers must make a choice about when to stop data
collection. The researcher‟s choice was governed by both theoretical and practical
169
factors. Ideally the researcher would have reached the point of „theoretical saturation‟
where no new insights are being obtained (Glaser and Strauss 1999). In Iran, although
complete theoretical saturation might have been virtually impossible to achieve, the
researcher opted to stay until he felt that he had reached a point where he understood the
causes, the effects and the processes behind most of the institutional challenges that
occurred on the projects. Towards the end of my stay, the researcher felt he was receiving
new stories or insights only at a very slow rate. Several practical issues also had to be
considered. In the UK, the organizations had only offered him one meeting. This kind of
time pressure was absent for Iranian case study. However, the researcher had to make a
decision in Iran to keep in mind the fact that he had to spend sufficient time analyzing his
data and writing up, and that he wanted to graduate in the near future.
5.6.1.2 Interview analysis
Data collection is succeeded by data analysis. However, many scholars advocate blending
data analysis with data collection (e.g. Eisenhardt 1989; Strauss and Corbin 1998). There
is much wisdom in this approach since, once a set of data are analyzed, there will
inevitably be gaps that have not been addressed and missing data. By coupling data
collection and data analysis, missing data can be gathered in real time as the need arises.
Typically, researchers collect data, take a break and return to home base to analyze the
data thoroughly, and then re-enter the field armed with the knowledge that results from
their analysis.
In order to analyze his data, the researcher maintained the practice of writing daily field
notes summarizing meetings and interviews conducted during the day. These notes were
very important in light of the fact that the researcher did not have time to transcribe
interviews in the field. Every Sunday the researcher reviewed the daily notes of the
previous weeks to refresh what he had learnt and to develop a mental picture and
preliminary theories of the project. Based on these notes, the researcher came up with
models that the researcher had investigated or wished to investigate. Depending on the
amount of information he lacked on each of these constructs, the researcher then prepared
170
a tentative schedule of meetings to attend and participants to talk to in the following
weeks, to help shed more light on his research questions. The researcher then set up
meetings and executed this schedule during the week, and repeated this process the
following Sunday. Over a period of time, the researcher collected more data points and
developed confidence that the researcher had sufficient information to theorize about and
describe challenges on organisational culture and TQM. This approach helped him to
analyse data in parallel with data collection in a fast-paced environment. Having iterated
between field data and his concepts, and having reached a point where he felt reasonably
certain that he had gathered enough data to provide descriptions of the effect of
organisational culture on TQM, and then he returned from the field to apply his self to
detailed analysis of the data.
5.6.1.3 Interview Analysis method
The process of data analysis started with data collection. The method of analysis was to
use my data to generate „codes‟ or categories of interest (Barley 1992; Strauss and Corbin
1998; Glaser and Strauss 1999). The researcher first used a process of „Open coding‟
(Strauss and Corbin 1998). As the researcher read through his transcripts or field notes,
the researcher isolated specific instances or incidents and assigned them to a „code‟ that
described the incident. Since any incident could be viewed from several perspectives,
some segments of data were assigned to multiple codes or categories. As the researcher
coded increasing amounts of his data, the researcher found some codes or concepts that
were highly recurrent, whereas some codes had only a few segments of data within them.
The researcher selected the codes that occurred frequently and use these codes as the
basic constructs or concepts that helped explain the effect of organisational culture on
TQM. The process of identifying and selecting these codes was not quite as linear as the
researcher has suggested. After spending two months in Iran, the researcher had intuitions
as to what variables and concepts were critical to the behaviours that the researcher had
observed on TQM implementation. These concepts were his starting points for analysis,
and the researcher used these categories or themes as the initial set of codes that the
researcher applied to the data. Codes also emerged as the researcher analyzed his data, as
171
the researcher uncovered an incident that would not fit into any of the existing categories.
Often times however, the researcher found his self force-fitting a code onto a segment of
data. The researcher then realized that the code that the researcher had used was too
general or simplistic and perhaps needed to be split into more specific codes that the
researcher could subsequently use to label segments. The researcher then recoded the
data with these new codes since the original code was now obsolete.
After generating a set of high-level codes from his data, the researcher went through a
process of Axial Coding (Strauss and Corbin 1998) where the researcher attempted to
develop sub-codes and sub-categories within each of these codes and understand how
these various subcategories related to each other. Initial open coding was similar to taking
segments of data that had common properties and putting them into a „bucket‟. In this
step, the researcher investigated the contents of the „bucket‟ and attempted to order and
arrange them in a systematic fashion. For instance, inside a bucket titled „issues between
the customer and the qualities‟, the researcher attempted to subcategorise the issues into
specific themes such as „conflict due to the organisational culture effect on TQM X‟ or
„conflicts due to the TQM effect on organisation Y‟. In some cases subcategories needed
to be split further in order to obtain a clear picture of all the different types of interactions
involved. For each category, the researcher investigated the amount or the frequency of
data segments that the researcher had collected as well as the magnitude of impact that
each of these instances or incidents had on the TQM implementation. Based on the way
that the researcher had collected data, the researcher was able to perform some level of
quantitative analysis. For instance, having observed several meetings and more than a 10
cases of conflicts between the general manger and the quality manager, the researcher
looked through the data and came to the conclusion that a certain process or pattern (sub
code) had occurred 25% of the time, while a certain other process had occurred just once.
The sub codes that had either very few incidents or incidents that had very little impact
on the TQM implementation were considered as not being salient incidents. The
researcher then analysed the sub codes where there were many incidents that affected the
project. The various incidents were arranged to see which ones replicated other incidents
within the same subcategory (and thereby gave more validity to their occurrence) and

172
how the different types of incidents could be used to build or extend a theoretical model.
As an example, within a selected subcategory there might have been several instances
where a certain set of parameters led to a certain outcome. The existence of several such
instances confirmed the occurrence of this type of incident. Also, within the same
subcategory, there may have been several other instances where one or more parameters
were different from the earlier set. The outcome of these incidents would also be
different. Using these two sets of incidents the researcher was then able to build a
„contingency model‟ wherein given a set of parameters or inputs; the researcher was able
to hypothesise on the outcomes or outputs. In addition, the researcher isolated the effects
of a parameter by noting the change in outcomes as this parameter changed. As the
researcher performed this analysis, the researcher attempted to sample data theoretically
(Strauss and Corbin 1998). The researcher constantly asked questions of his models. For
instance the researcher would ask his self that since Parameters X led to outcome Y, what
would happen if a certain entity was present or absent in the process such that the set of
parameters were different? The researcher then searched his data for such instances, so
that the researcher could understand what transpired in the presence and absence of each
of the parameters identified within the sub codes. In this regard, the researcher was aided
by the fact that the researcher remained in good touch with the participants in Iran.
Therefore, occasionally the researcher was able to ask them a question by email and
receive a response that contributed to a data point that was missing from his data set.
Using these analysis techniques, the researcher was able to develop theoretical models
that explained the observed outcomes on relationships between TQM and organisational
culture. The theories built were grounded in the data that the researcher had collected.
Having analyzed the data, the researcher selected the institutional factors or parameters
(codes) that had an impact on TQM implementation. The researcher then built models
that hypothesised an outcome given the presence of a certain set of institutional
parameters. As some of these parameters changed, the hypothesised outcomes varied.
Since the researcher had detailed observations of incidents, the researcher also explained
the process by which a set of parameters led to a set of outcomes. At the end of his
173
analysis therefore, the researcher had a set of theoretical hypotheses that helped predict
and explain the effect of organisational culture on TQM implementation.
5.6.1.4 Final Steps
The researcher‟s final task was to write up his work into a logical volume that would
provide some insights to theory as well as to practice. The process of writing began
during the analysis phase. Writing helped clarify some of his analysis and also helped
identified gaps in his theoretical models that the researcher needed to fill by returning to
the data that the researcher had collected. While writing up his research, the researcher
used such strategies as attempting to focus on his „story‟ i.e. the processes by which
culture affects organisation, and organisational culture will effect TQM implementation,
making a logical storyline, showing quotes from the field to provide realism to his
theories and portraying dramatic moments to make the story more interesting (Golden-
Biddle and Locke 1997).
Several scholars have recommended the comparison of concepts or theories that emerge
from such studies with the extant literature in order to make a meaningful contribution to
knowledge (Stablein 1996; Eisenhardt 1989). In line with this approach, the researcher
revisited several theoretical works as his theories emerged and as the researcher was
engaged in writing them up, in order to see how his ideas related to what had already
been discussed in the literature, and how they might extend existing discourses. This was
an iterative process of periodically revisiting new journal articles and books that the
researcher found relevant as a result of the analysis. Based on this „enfolding of the
literature‟ (Eisenhardt 1989) into his study, the researcher was able to discern and write
about the contributions of his work to existing bodies of theoretical and practical
knowledge.
Therefore, while the findings from this study may be applied to the companies beyond
those that are studied, not all the findings may be general. Apart from the findings of his
research, the researcher hopes that this elaboration of the methodology that the researcher

174
used will provide some modest assistance to other researchers who perform qualitative
studies of TQM implementation.
5.6.2 Questionnaire
Bell (1999, P.245) provides an insight into the use of questionnaire, he states, „the
questionnaire is a widely used and useful instrument for collecting survey information
providing structured, often numerical data, being able to be administered without the
presence of the researcher, and often being comparatively straight forward to analyse.‟
According to Jankowicz (1995, P.225), questionnaires rely on written information
supplied directly by people in response to questions asked by the researcher. Jankowicz
(1995, P.89), argues information from questionnaires tend to fall into two broad
categories – „Facts‟ and „opinions‟. In view of this, the researcher is searching for both,
fact and opinion from the questionnaire. I considered ethical issues within the research
context. According to Cohen, et al.(2000, P.245), „questionnaires will always be an
intrusion into the life of the respondent, be it in terms of time taken to complete the
questionnaire, the level of threat or sensitivity of the questions, or the possible invasion of
privacy.‟
However, according to Saunders et al. (2007), there are many types of questionnaire
design depending on how it is to be administered and the amount of contact with
respondents. These designs can be divided into self-administered questions and
interviewer administered questionnaire. Self-administered questionnaires are usually
completed by respondents; such questionnaires could be delivered and returned via email
or internet (online questionnaire), or posted to respondents who return them by post after
completion (posted or mail questionnaire), or they could be delivered by hand to each
respondent and collected latter (a personally administered questionnaire). On the other
hand, interviewer-administered questionnaires include a structured interview where the
respondents need to answer a predetermined set of questions based on standardised
questions. The choice between these types of questionnaires depends on many factors
175
such as the characteristics of the respondents from whon the researcher wishs to collect
data, where the respondents are, the size of sample required for analysis and the required
response rate. In addition, the choice depends on the type of questions required to be
asked to collect the data, the number of questions needed to be asked to collect data, the
time available to complete the data collection and the ease of automating data entry.
The questionnaire, like many other data collection methods, has its own advantages and
disadvantages. The main advantage of questionnaire is:
The ability to reach a relative large respondent population quickly and
economically, since it is based on a sample which should represent a large
population (Saunders et al, 2007). It is not expensive for both researchers and
respondents, there is no need for a highly skilled researcher, and it‟s based on
advanced statistical analysis of the collected standardised allowing easy
comparison and understanding (Ibid).
On other hand, questionnaire has some disadvantages as well:
The capacity to do it badly, in this regard, Oppenheim (1992) contends that it is
far harder to produce a good questionnaire than you might think, because of
possible non-response bias or missing data
The process of designing, piloting a questionnaire and analysing the results is
time consuming; it is not possible to explore and explain further issues related to
the research questions and objectives since the included questions are
standardised.
Considering the advantages of the questionnaire, it was decided in this study to use
questionnaires to explore the current practices in organisational culture and the
relationship between organisational culture and TQM. The questionnaire was conducted
in 50 Iranian organisations and 40 UK organisations.
176
5.7 Designing the Research Questionnaire
It was decided that the questionnaire should mainly deal with exploring the relationship
between organisational culture with TQM, and the implementation of TQM. However,
there were a few similar questions asked in the semi-structure interview as well, which is
also designed to achieve the research objectives and to validate the answers from the
questionnaire. However, designing and formulating the study questionnaire must aim to
answer the research questions and objectives. On other hand, wording, language, depth,
clarity, order and, above all, the type of questions asked are all important in order to get a
good analysis from the study. Thus, the researcher needs to ensure that the criteria of
questionnaire construction and pre-testing were met, so a lot of time and effort was
devoted towards the design, layout and wording of the questionnaire used in this
research. The language of questionnaires is an extremely important aspect of their
effectiveness and should reflect the respondent‟s own language usage. The wording of
questionnaires can also help to avoid difficulty, leading questions and double-barrelled
questions. Thus, because 50% most of the respondents of this study were Iranian, it was
decided that the questionnaire should be distributed to these in the Persian language in
order to that they would understand it well.
However, in this study the questions included in the questionnaire were based on
searching in previous studies of culture, organisational culture and TQM. It was decided
that using previous questionnaires (making some necessary modifications to the original
content to be applicable to the Iranian and British context) would ensure the study‟s
validity and reliability and enable comparison of the result of this study with other related
studies. Therefore, the questionnaire was derived from different studies (Schen, 1992,
Davis, 2000, Hofstede, 2001, Javidan and Dastmalchian, 2003, Denison, 2006).
As mentioned a researcher can use two types of questions for constructing the
questionnaire; first is open-ended and, second is close-ended types. Open-ended
questions allow each respondent to give a personal response or opinion in his or her own
words, while, closed questions allow a respondent to select answers from a numbers of

177
predetermined alternatives (Saunders et al, 2007). Most of the questions used in making
the questionnaire were closed questions. In this study, the questionnaire involves two
other different types of questions, first general questions, second it was more specific
questions.
5.7.1 The content of the Questionnaire
The questionnaire includes many questions since the research aims to achieve several
objectives and answer many questions. Therefore, the research questionnaire could be
described as comprehensive; it includes everything related to culture, organisational
culture and TQM in the organisation. The questionnaire includes the following sections
and parts.
Section A-A: General information and market position
This section is concerned with obtaining a general background of the participants, for
example, name of the company, company constitution, how long the company has been
established, number of employees, what kind of the product they produce, and market
position of the company.
In the first part of questionnaire, the researcher used a special model to find market
position of the company. The name of this model is the Puttick model.
Puttick Grid Model:
According to Davis et al (2000) the concept of the framework, is that firms can broadly
be categorised into four types of product/market situation with quiet different quality
requirements if they are to be better than their rivals. These are (Davis et al, 2000):
“Super value good” highly complex products such as aircraft or complex
machines that consist of a large number of components.
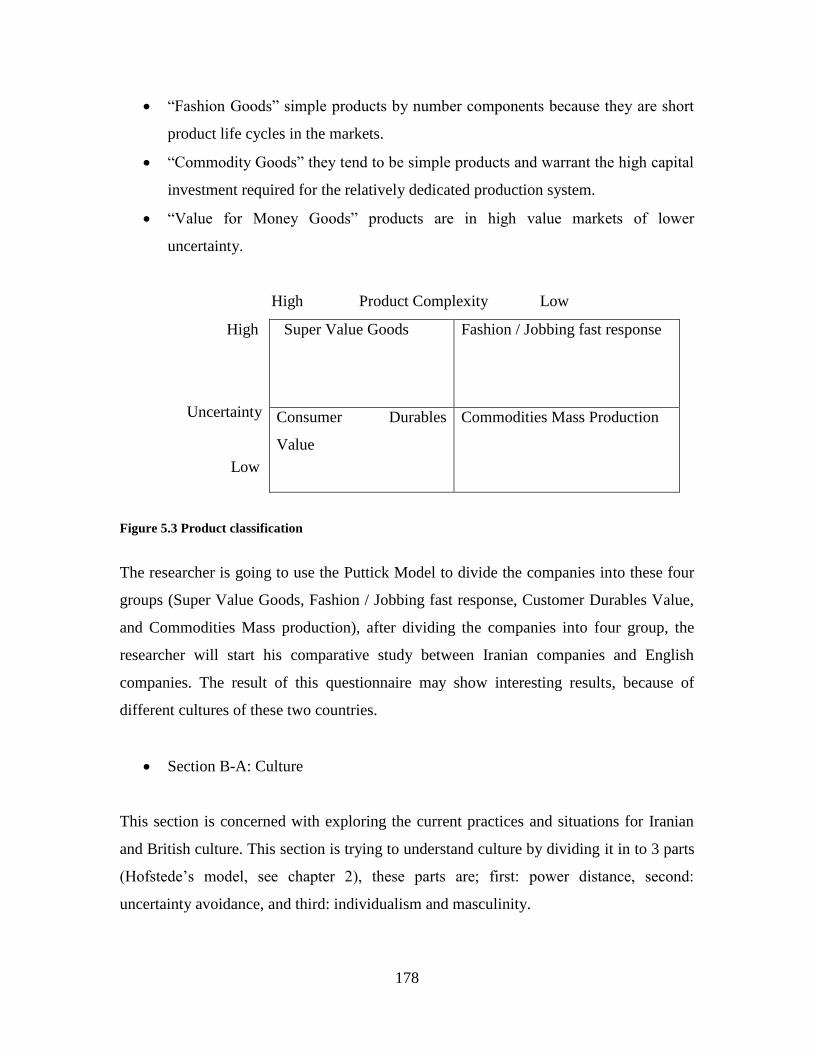
178
“Fashion Goods” simple products by number components because they are short
product life cycles in the markets.
“Commodity Goods” they tend to be simple products and warrant the high capital
investment required for the relatively dedicated production system.
“Value for Money Goods” products are in high value markets of lower
uncertainty.
High Product Complexity Low
High
Uncertainty
Low
Super Value Goods Fashion / Jobbing fast response
Consumer Durables
Value
Commodities Mass Production
Figure 5.3 Product classification
The researcher is going to use the Puttick Model to divide the companies into these four
groups (Super Value Goods, Fashion / Jobbing fast response, Customer Durables Value,
and Commodities Mass production), after dividing the companies into four group, the
researcher will start his comparative study between Iranian companies and English
companies. The result of this questionnaire may show interesting results, because of
different cultures of these two countries.
Section B-A: Culture
This section is concerned with exploring the current practices and situations for Iranian
and British culture. This section is trying to understand culture by dividing it in to 3 parts
(Hofstede‟s model, see chapter 2), these parts are; first: power distance, second:
uncertainty avoidance, and third: individualism and masculinity.
179
Section B-B: Organisational Culture
This section is concerned with exploring the current practices and situations for
organisation culture in Iranian and British companies. Therefore, it consists of several
parts, each designed to reveal or explore a particular aspect of organisational culture
(Denison‟s model, see chapter 2). These parts are:
First part: Involvement, this part consists of several parts, each designed to reveal or
explore a particular aspect of involvement (Empowerment, team orientation, and
capability development)
Second part: Consistency, this part consists of several parts, each designed to reveal or
explore a particular aspect of consistency (core value, coordination and integration)
Third part: Adaptability: this part consists of several parts, each designed to reveal or
explore a particular aspect of adaptability (Creating change, customer focus, and
organisational learning).
Fourth part: Mission, this part consists of several parts, each designed to reveal or explore
a particular aspect of mission (Strategic direction and intent, Goal and objective, and
vision)
Section B-C: Total Quality Management (TQM)
This section is concerned with obtaining information related to TQM and its impact on
the organisation (See chapters 3 and 4)
Section B-D: Critical success factors of TQM implementation
This section is concerned with exploring the current practices and situation for critical
success factors for TQM implementation in Iran and England. Therefore, it consists of

180
several parts, each parts designed to explore a particular aspect of TQM implementation.
These parts are: (1) management commitment, (2) role of the quality department, (3)
training and education, (4) employee involvement, (5) continuous improvement, (6)
supplier partnership, and (7) quality policies (see chapter 4).
5.7.2 Piloting the Questionnaire
According to Saunders et al. (2007: 308) „the purpose of the pilot test is to refine the
questionnaire so that respondents will have no problem in answering the questions and
there will be no problems in recording the data‟. After the completion of the first draft of
the questionnaire, a piloting test was conducted in several stages by people in different
places.
The first stage of the pilot test was conducted by researcher‟s supervisor who was
more concerned about the content of questionnaire
The second piloting stage was conducted by some of the academics who
specialised in TQM and organisational management at Huddersfield University.
Since the participants were Iranian and British management, the questionnaire
was translated to Persian language in order that it would be understand it by
Iranian manager easily.
During the translation process, which took a long time, the researcher translated
the questionnaire by himself first, and then the researcher sent his questionnaire to
his Iranian advisor in Isfahan University and some of his relatives to check on
translation.
5.7.3 Validity
The set of variables used in the questionnaires is the product of an in-depth review of the
literature. The critical factors were found compatible with those of previous studies. Two
very important general criteria to be satisfied in designing the data collection instrument
are reliability and validity. Before data collection, problems regarding validity and
181
reliability of the research instruments used in the study should be addressed. The validity
of a measurement technique refers to the extent to which it measures what is intended to
be measured. Litwin (1995) and Saraph et al. (1989) suggest four different type of
validity generally considered in empirical research:
(1) Content validity ensures that the measure includes an adequate and representative
set of items that represent the concept (Sekaran, 2003). It is considered as an
important first step for assessing construct validity (Graver and Mentzer, 1999).
The more the scale items represent the domain or universe of the concept being
measured, the greater the content validity (Sekaran, 2003). According to Cooper
and Schnidler (2001) content validity is judgemental and requires knowledge of
the theoretical nature of the construct. Therefore, it can be approached through a
careful definition of the items to be scaled, the scales used and also through the
use of a panel of persons to judge how well the instrument meets the standards.
To meet the content validity requirements, an extensive literature review was
undertaken to define and clarify the scales and measures used in this research.
Many items and scales used in this research were adopted from several other
studies that place emphasis on meeting the requirements of validity and reliability.
In addition, the questionnaire items were scrutinised and pre-tested by several
researchers undertaking doctorates relating to business studies and a panel of
academic experts to judge the content validity of the questionnaire.
(2) Criterion-related validity or external validity measures the degree to which a
construct performs as expected relative to other variables identified as meaningful
criteria (Hair et al., 2003). Two types of criterion validity can be performed. The
first is concurrent validity, which refers to the extent to which a measurement
scale relates to other well-validated measures of the same subject (Oppenheim,
1992). It is established when the results obtained from the scale used are
consistent with the results of other available scales that are used to describe the
same subject (Ibid). The second is predictive validity, which Sekaran, (2003)
refers to as ability of measuring instrument to differentiate among individuals
with reference to a future criterion.
182
(3) Construct validity testifies how well the results obtained from the use of the
measures fit the theories around which the test is designed (Sekaran, 2003). Face
or construct validity can be attained through pre-testing procedures. This study
has carried out a number of pre-trial stages and pilot work was undertaken to
ensure enhanced construct validity. Furthermore, Sekaran (2003) indicates that
construct validity is assessed through convergent and discriminate validity.
(4) Convergent validity is established when the scores obtained with two different
instruments measuring the same concepts are highly correlated (Sekaran, 2003).
In other worlds, convergent validity assesses the degree to which the measures of
each construct are correlated (Hair et al., 1998).
The instrument used to identify culture, organisational culture and quality factors in the
study has content validity, since the selection these factors was based on an extensive
review of the literature. To ensure content validity, the survey questionnaire has been
piloted in Iran and the UK, as mentioned in the section on the pilot study.
5.7.4 Reliability
The reliability of a measure indicates the extent to which it is without bias and hence
ensures a consistent measurement across time and across the various items in the
instrument (Sekaran, 2003). In other words it is concerned with the precision of
measurements such that the same results would be obtained on re-measurement
(Jankowicz, 1991). Reliability provides an indication about the consistency of the
instrument. It is primarily a matter of stability. However, the most commonly used form
of reliability is internal consistency assessed by Cronbach‟s alpham (Saunders et al.,
2005). Thus Cronbach‟s alpha is adapted in this research to assess the overall reliability
of the measurement scale for each defined construct of the study. Alpha provides an
estimate of the proportion of the total variance that is not due to error and thus
representing the reliability of the scale (Oppenheim, 1992). The recommended minimum
acceptable limit of reliability „alpha‟ for this measure is 0.70 (Hair et al., 2003). The
criterion that is used in the research to examine the reliability of dependent and
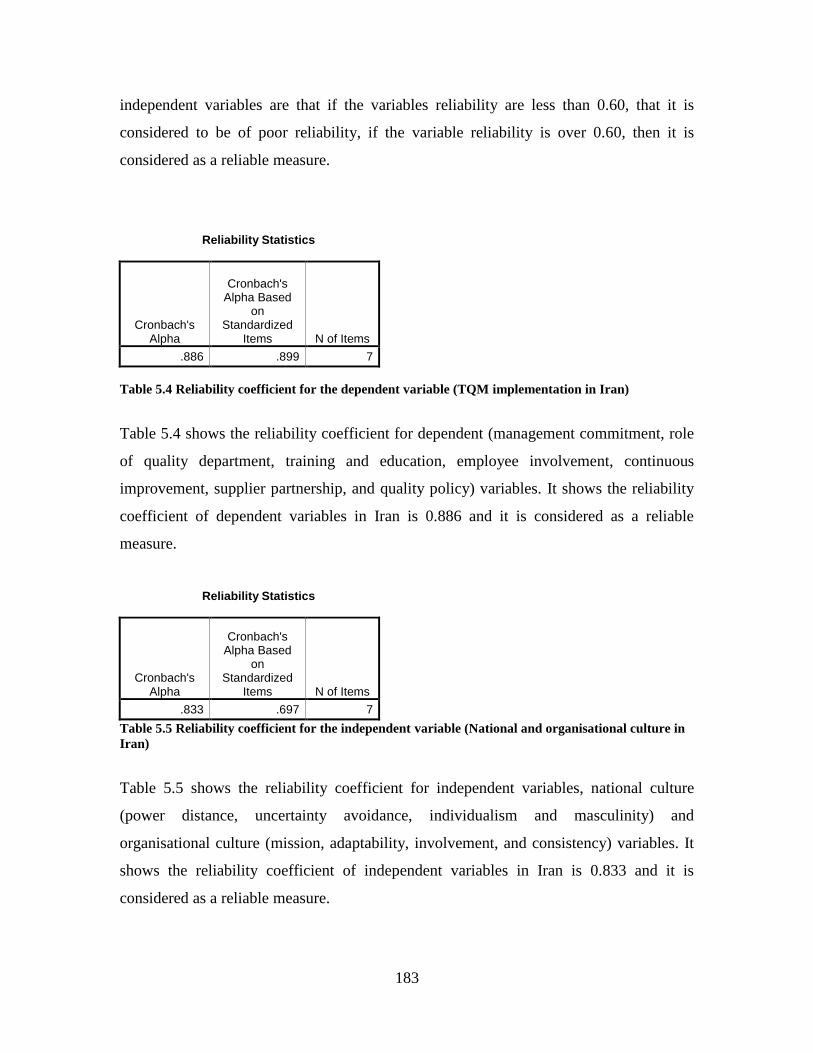
183
independent variables are that if the variables reliability are less than 0.60, that it is
considered to be of poor reliability, if the variable reliability is over 0.60, then it is
considered as a reliable measure.
Reliability Statistics
Cronbach's Alpha
Cronbach's
Alpha Based on
Standardized Items N of Items
.886 .899 7
Table 5.4 Reliability coefficient for the dependent variable (TQM implementation in Iran)
Table 5.4 shows the reliability coefficient for dependent (management commitment, role
of quality department, training and education, employee involvement, continuous
improvement, supplier partnership, and quality policy) variables. It shows the reliability
coefficient of dependent variables in Iran is 0.886 and it is considered as a reliable
measure.
Reliability Statistics
Cronbach's Alpha
Cronbach's Alpha Based
on Standardized
Items N of Items
.833 .697 7
Table 5.5 Reliability coefficient for the independent variable (National and organisational culture in
Iran)
Table 5.5 shows the reliability coefficient for independent variables, national culture
(power distance, uncertainty avoidance, individualism and masculinity) and
organisational culture (mission, adaptability, involvement, and consistency) variables. It
shows the reliability coefficient of independent variables in Iran is 0.833 and it is
considered as a reliable measure.

184
Reliability Statistics
Cronbach's Alpha
Cronbach's Alpha Based
on Standardized
Items N of Items
.816 .830 7
Table 5.6 Reliability coefficient for the dependent variable (TQM implementation in the UK)
Table 5.6 shows the reliability coefficient for dependent (management commitment, role
of quality department, training and education, employee involvement, continuous
improvement, supplier partnership, and quality policy) variables. It shows the reliability
coefficient of dependent variables in the UK is 0.816 and it is considered as a reliable
measure.
Reliability Statistics
Cronbach's Alpha
Cronbach's Alpha Based
on Standardized
Items N of Items
.911 .914 5
Table 5.7 Reliability coefficient for the independent variable (National culture and organisational
culture in the UK)
Table 5.7 shows the reliability coefficient for independent variables, national culture
(power distance, uncertainty avoidance, individualism and masculinity) and
organisational culture (mission, adaptability, involvement, and consistency) variables. It
shows the reliability coefficient of independent variables in the UK is 0.914 and it is
considered as a reliable measure.
The tables 5.5 and 5.7 show the reliability coefficients for dependent and independent
variables in Iran and the UK. They show that the reliability coefficient for independent
and dependent variables in Iran and the UK were above 0.70 which is acceptable.
185
5.8 Research Hypotheses and Proposed Model
A hypothesis is a formal statement of some unproven supposition that tentatively explains
certain facts or phenomena (Hair et al, 2003). The present research builds on previous
research findings, which have been discussed in the literature review chapters, in order to
meet the objectives of the study and find possible explanations for the investigated
relationships among variables.
The first objective of this study is to examine the effects of national culture on
organisational culture. The literature sources that were reviewed in chapter two “national
culture and organisational culture” led to the suggestion of 1 main research propositions
and 4 sub-research proposition (propositions one-a, one-b, one-3, and one-4) at the
conclusion to chapter two, that explained the effects of national culture on organisational
culture and organisational culture variables. The propositions were further confirmed by
the literature reviewed in chapter three and four “TQM and TQM implementation” which
concluded that national culture and organisational culture are the previous circumstances
of TQM and TQM implementation. Proposition one stated that national culture has a
positive effect on organisational culture. According to this proposition the present study
builds the first hypothesis.
H1: National culture has a positive effect on organisational culture.
Propositions 1-a, 1-b, 1-c, and 1-d at the conclusion to chapter two stated that national
culture a positive effect on mission, adaptability, involvement, and consistency.
According to these propositions the present study builds the sub-hypothesis.
H1a: National culture has a positive effect on mission.
H1b: National culture has a positive effect on adaptability.
H1c: National culture has a positive effect on involvement.
H1d: National culture has a positive effect on consistency.
186
The Second objective of this study is to investigate the effect of organisational culture on
TQM implementation. The literature reviewed in chapter three and four “TQM and TQM
implementation” led to the suggestion of research proposition two, at the conclusion to
chapter four, which stated that organisational culture, has a positive intervening effect on
the TQM implementation. According to this proposition the present study builds the
second hypothesis.
H2: Organisational culture has a positive effect on the TQM implementation.
The third objective of the present research is to investigate the effect of organisational
culture variables (mission, adaptability, involvement, and consistency) on TQM
implementation (management commitment, role of the quality department, training and
education, employee involvement, continuous improvement, supplier partnership, and
quality policy). The conclusion to Chapter two and four literature reviews on
“organisational culture and TQM implementation” led to the suggestion of research
proposition three. Therefore, it is hypothesized that the first organisational culture
variable; mission positively affects TQM implementation (management commitment,
role of the quality department, training and education, employee involvement, continuous
improvement, supplier partnership, and quality policy).
H3a: Mission has a positive effect on management commitment
H3b: Mission has a positive effect on role of quality department
H3c: Mission has a positive effect on training and education
H3d: Mission has a positive effect on employee involvement
H3e: Mission has a positive effect on continuous improvement
H3f: Mission has a positive effect on supplier partnership
H3g: Mission has a positive effect on quality policy
It is hypothesized that the second organisational culture variable (adaptability) positively
affects TQM implementation (management commitment, role of the quality department,
187
training and education, employee involvement, continuous improvement, supplier
partnership, and quality policy).
H4a: Adaptability has a positive effect on management commitment
H4b: Adaptability has a positive effect on role of quality department
H4c: Adaptability has a positive effect on training and education
H4d: Adaptability has a positive effect on employee involvement
H4e: Adaptability has a positive effect on continuous improvement
H4f: Adaptability has a positive effect on supplier partnership
H4g: Adaptability has a positive effect on quality policy
It is hypothesized that the third organisational culture variable (involvement) positively
affects TQM implementation (management commitment, role of the quality department,
training and education, employee involvement, continuous improvement, supplier
partnership, and quality policy).
H5a: Involvement has a positive effect on management commitment
H5b: Involvement has a positive effect on role of quality department
H5c: Involvement has a positive effect on training and education
H5d: Involvement has a positive effect on employee involvement
H5e: Involvement has a positive effect on continuous improvement
H5f: Involvement has a positive effect on supplier partnership
H5g: Involvement has a positive effect on quality policy
It is hypothesized that the fourth organisational culture variable (consistency) positively
affects TQM implementation (management commitment, role of the quality department,
training and education, employee involvement, continuous improvement, supplier
partnership, and quality policy).
H6a: Consistency has a positive effect on management commitment
H4b: Consistency has a positive effect on role of quality department
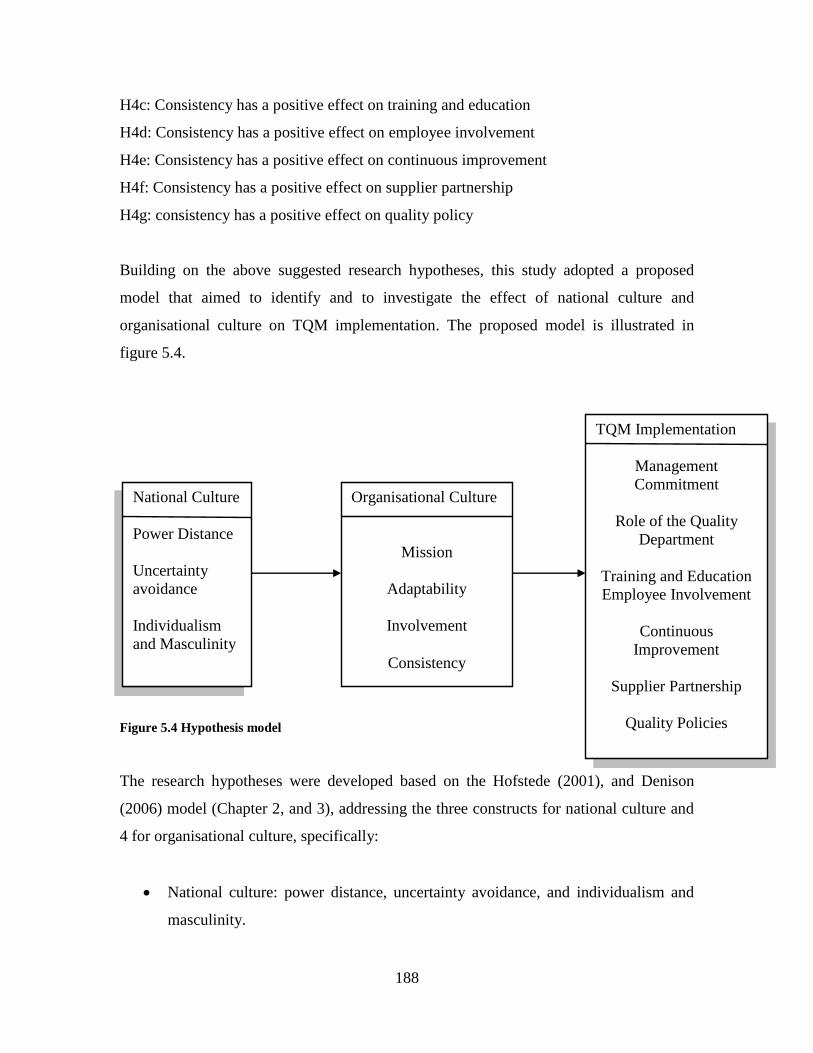
188
H4c: Consistency has a positive effect on training and education
H4d: Consistency has a positive effect on employee involvement
H4e: Consistency has a positive effect on continuous improvement
H4f: Consistency has a positive effect on supplier partnership
H4g: consistency has a positive effect on quality policy
Building on the above suggested research hypotheses, this study adopted a proposed
model that aimed to identify and to investigate the effect of national culture and
organisational culture on TQM implementation. The proposed model is illustrated in
figure 5.4.
Figure 5.4 Hypothesis model
The research hypotheses were developed based on the Hofstede (2001), and Denison
(2006) model (Chapter 2, and 3), addressing the three constructs for national culture and
4 for organisational culture, specifically:
National culture: power distance, uncertainty avoidance, and individualism and
masculinity.
National Culture
Power Distance
Uncertainty
avoidance
Individualism
and Masculinity
Organisational Culture
Mission
Adaptability
Involvement
Consistency
TQM Implementation
Management
Commitment
Role of the Quality
Department
Training and Education
Employee Involvement
Continuous
Improvement
Supplier Partnership
Quality Policies
189
Organisational culture: mission, adaptability, involvement, and consistency.
In this research, the researcher determines which of the TQM implementation construct
were affected by organisational culture variables in Iran and the UK. The researcher
based on his literature survey and the studies done in Iran and Middle East by other
researchers indentified collect TQM implementation constructs.
TQM implementation: management commitment, role of the quality department,
training and education, employee involvement continuous improvement, supplier
partnership, and quality policy.
5.8 Secondary data sources
The sources of secondary data are different from primary data and include:
Written materials for example: All electronic sources, books, journals, news
papers and etc.
Area based for example: Iranian and English publications and Journals.
Published reports
Professional people
As already explained an extensive related literature review was undertaken in the
following area:
Culture
Organisational culture
Total Quality Management (TQM)
Customer satisfaction
Strategy
Product innovation
190
5.9 Summary
Chapter five discussed the main methodological aspect of the thesis. It outlined the research
process, research philosophy, strategy and methods. Data access and sampling were discussed.
Data analysis was explained with references to quantitative methods relevant for this research.
The design of this research pertains to the strategy or schedule used to collect data, to analyse
the findings which will eventually enable the researcher to draw conclusions. Figure 5.1
describes the major research features and actions that were taken during the research.
In deciding on the choice of data collection methods, issues such as the facilities available,
time, costs and resources associated with gathering data should be, and were, taken into account
(Saunders et al., 2007). A questionnaire was used as the main method of data collection. This
was explained and justified in this chapter. A number of semi-structured face-to-face interviews
were conducted with top managers to gain more understanding about some hypotheses
formulated in the research. Pilot work was done prior to distribution of the final version of the
questionnaire as several drafts were made and amended in response to feedback received from
referees and panel experts. The questionnaire design and layout, question types and format,
contents of the final version of the questionnaire, population and sample, and the procedures for
administering the questionnaire were discussed in this chapter. The procedures for conducting
interviews were also highlighted. In addition, the issues of reliability and validity have been
discussed together with the statistical methods used in this research to address its model and
objectives. Finally, the chapter ended with a discussion of the methods of qualitative data
analysis.

191
Chapter Six (Interview analysis)
192
6.1 Introduction
This chapter aims to provide a review of the interview analysis in three major topics:
National Culture
Organisational Culture
TQM Implementation
The interviews were focused at the managers, quality control departments‟ managers and
sales managers in Iran and the UK.
The aim of the interview was to investigate the appreciation of TQM, implementation of
TQM, the awareness of TQM, and level of implementation of TQM in different
industries in Iran. The analysis of the interviews deals with current problems, and also
concerns the level of quality, how organisational culture will influence TQM, and how to
improve the implementation and operation of TQM in the different industries in Iran.
The researcher has undertaken various interviews to examine relationships within
organisational culture and TQM in the Iranian and UK based organisation. The results
verified relationships using data from top managers, mid level managers and employees.
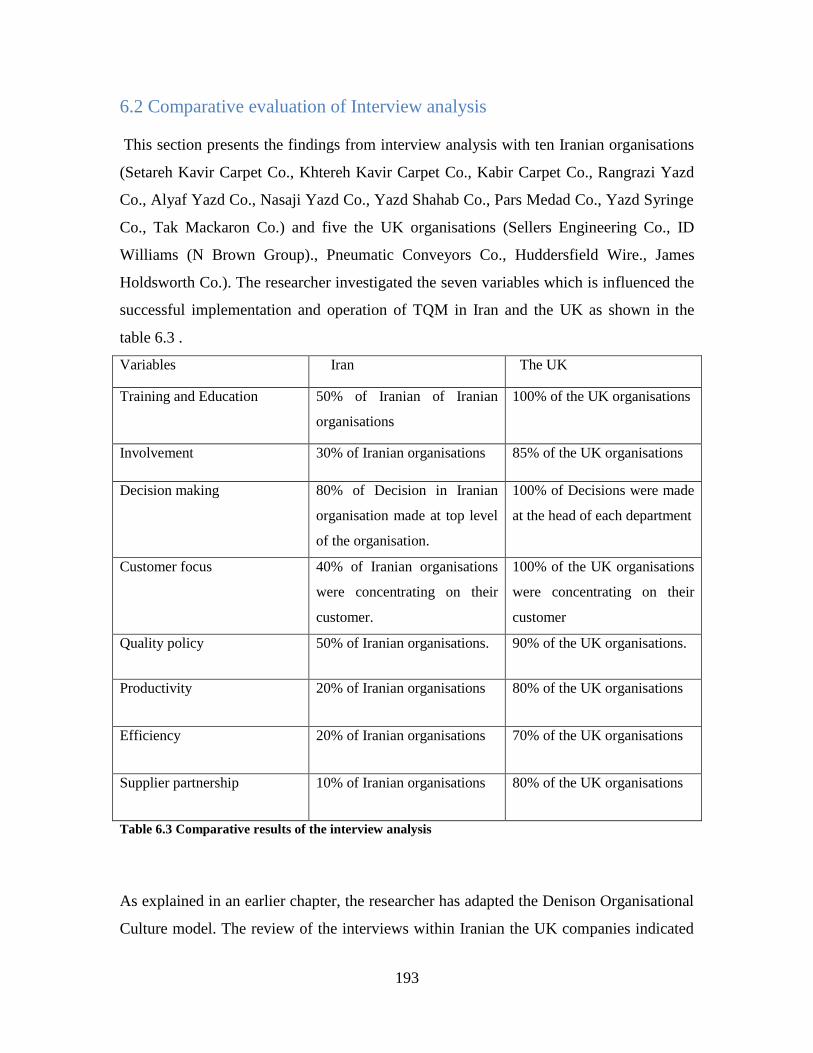
193
6.2 Comparative evaluation of Interview analysis
This section presents the findings from interview analysis with ten Iranian organisations
(Setareh Kavir Carpet Co., Khtereh Kavir Carpet Co., Kabir Carpet Co., Rangrazi Yazd
Co., Alyaf Yazd Co., Nasaji Yazd Co., Yazd Shahab Co., Pars Medad Co., Yazd Syringe
Co., Tak Mackaron Co.) and five the UK organisations (Sellers Engineering Co., ID
Williams (N Brown Group)., Pneumatic Conveyors Co., Huddersfield Wire., James
Holdsworth Co.). The researcher investigated the seven variables which is influenced the
successful implementation and operation of TQM in Iran and the UK as shown in the
table 6.3 .
Variables Iran The UK
Training and Education 50% of Iranian of Iranian
organisations
100% of the UK organisations
Involvement 30% of Iranian organisations 85% of the UK organisations
Decision making 80% of Decision in Iranian
organisation made at top level
of the organisation.
100% of Decisions were made
at the head of each department
Customer focus 40% of Iranian organisations
were concentrating on their
customer.
100% of the UK organisations
were concentrating on their
customer
Quality policy 50% of Iranian organisations. 90% of the UK organisations.
Productivity 20% of Iranian organisations 80% of the UK organisations
Efficiency 20% of Iranian organisations 70% of the UK organisations
Supplier partnership 10% of Iranian organisations 80% of the UK organisations
Table 6.3 Comparative results of the interview analysis
As explained in an earlier chapter, the researcher has adapted the Denison Organisational
Culture model. The review of the interviews within Iranian the UK companies indicated
194
that, successful implementation and operation of TQM was only attained through the
constant training and education of employees.
Strong and positive relationships are found between training and education and
successful implementation and operation of TQM. The results show that training and
education are relatively high in the UK organisations. This helps the UK organisations to
implement and operate TQM successfully. As the researcher identified in chapter four the
role of the training structure must be top-down, starting with the top team and cascading
down the organisation. The golden rule to successful implementation of TQM is to ensure
managers train their own people. This is necessary to show management commitment and
to ensure managers actually understand the TQM principles and methods. Through
training and education, a common language may be achieved throughout the
organisation.
Relatively strong negative relationships are found between Iranian organisation and
supplier partnerships, the results indicate that Iranian organisations did not give mu ch
attention to their suppliers. This is due to limited choice and access to suppliers from
around the world. On the other hand, it was found that there was a strong positive link
between the UK organisation and supplier partnerships. In most of the Iranian
organisations, it was argued that quality policy can be avoided because of cost
management and competition in the market. If we look at chapters three and four, we can
see the effect of cost reduction in the companies when they implement and operate TQM
in their organisation. On the other hand the UK organisations believe that the quality
policy in their organisation is one thing which should never be ignored, because of the
importance of competition and/or cost reduction . As was mentioned in chapter three, to
satisfy the customer a company must identify customer needs in order to design the
appropriate product or service
Also the researcher found a strong link between the involvement and decision making of
the employee with the implementation and operation of TQM in the UK organisations.
This result indicates that the UK organisations involve all the levels of organisation in the
195
process of implementation and operation of TQM and decision making can be done at
low level of the organisation. On the other hand in Iran organisational decision making is
conducted only at top level of the organisation.
The results of the interviews indicated that there was only a small improvement in the
productivity of employee after the implementation of TQM in Iranian organisations.
Managers of Iranian organisations stated that productivity and efficiency of their
organisation was not improved as much as thay had expected by implementing TQM . On
the other hand, the UK mangers were mentioning that by implementing and operation
TQM in their organisation, their employee productivity and their efficiency were
improved.
The review also finds the strong inter-relations between management and employees in
the UK organisations which help the UK organisations to understand the philosophical
and practical part of TQM.
„On realisation of personal targets, management can make sure how to benefit from their
employees skills and to use is in productive organisation.‟ (UK Manager)
British companies can utilise their manpower and manoeuvre in order to achieve their
employees‟ optimised efficiency.
“Educating and training employees to be multi-skilled is therefore a necessity, an
employee will be trained to perform specific or specialise tasks in given areas to ensure
productivity when the workload increases in the given area”. (UK Manger)
„Assessing the capacity plan as part of the half yearly management reviews held to
assessment the company‟s performance over a given period. Each manager will assess
the personal resources available as part of their department or management team.‟(UK
Manager)
196
The resources are then fitted into the capability plan of British companies; this ensures
that maximum productivity is gained from each department, person and machine (if
applicable). The plan is then used to set production schedules, delivery dates … etc, and
to ensure these are met with ease. The review of the interviews in the UK (Sellers
Engineering Co., ID Williams (N Brown Group)., Pneumatic Conveyors Co.,
Huddersfield Wire Co., James Holdsworth Co.) considers all areas of the British
companies and improvements to resources are made when it is necessary through training
and the utilisation of employees. The results of the interviews also show the important
relationship between management and departments in relation to training and
development.
At some British companies people are initially employed to perform a specific task or
job. However a person will be required to undergo specific training which involves
assessing and evaluating the skills of a trainee, technical skills, knowledge, and attitude.
This will give the company an insight into their background which may be utilised
elsewhere if and when required.
In British companies, people are assessed as part of the capacity plan; this involves each
departmental foreman manger, carrying out training analysis from both a departmental
and an individual view.
“Appraisal are carried on every individual to assess their needs and development over a
specification special specified period, if it is felt that training is required to further the
persons skills (i.e. multi-skills), then this is solved firstly internally, and then if that is not
possible then external training will be found.”(UK Mnagers)
Results of such training are recorded to ensure its success or otherwise. The company
will hence evolve over time an effective training policy to ensure its competency.
197
All training needs and appraisals for both departments and individuals will form the basis
of the involvement plan for the company, and they will be reviewed as part of the
management meetings. This ensures that all persons involved in the development of a
company are involved.
However, in Iranian industry, the lack of empowerment at different levels in
organisations is cited as being a barrier to productivity and organisational relationships to
the improve quality.
“When we receive an enquiry at a department, the enquiry has to be referred to the head
office. This makes the procedure very long within the organisational level. On the other
hand the customer is not interested with our internal system. Good quality service for
them is getting the answer now” (Iran manager)
“There are too many decisions that could be made by different level of departments but
this have to be referred to the head office. This is a waste of management time. Also it
has negative impaction on the customer” (Iran, Head of ISO).
Minor evidence was found in the interviews to indicate that the level of employee
empowerment had increased over the last 2 years in Iran. Head of ISO in Iran reported
that although there had been a slight transfer of decision-making from area offices to
local departments, it wasn‟t significant enough. In other words, there had been some
decentralisation but not empowerment.
On the other hand, the initial conceptualisation of customer focus was welcomed by
British Managers. Its central philosophy of putting the customer first was seen as
representative of traditional values associated with British companies.
“When customer focus was first introduced, it was really re-stating what we did already”
(UK Manager).
198
Sadly, Head of ISO in Iran felt that the philosophy of customer focus had been lost in the
programme that was implemented in Iranian companies.
“All that has really happened in some of Iranian companies since have ISO is that
“Iranian” quality managers tear off strips of paper and filed progress reports. It is being
managed in terms of a series of things to do, rather than assessing the results” (Iran
Manager).
As a result, the head of ISO considered that the implementation of the customer focus
programme in Iranian companies showed a lack of understanding of what was required to
improve the level of quality for external customers. There was a supposedly over
emphasis on quality in relation to service quality. There is also a feedback ignorance of
quality in relation to the internal processes in Iranian companies. Most of the Iranian
Managers conceded that there was plenty of room for improvement in service quality.
Presently customers are not satisfied with the level of quality within the service. Iranian
quality managers argue that the required quality level is not performed in the quality
department; this is due to resource issues and to the behaviour of employees. On the other
hand, as head of ISO in Iran said the customer focus programme is focusing on attitude.
In order to analyse this part in more details the researcher wishes to draw your attention
to the TQM implementation section.
6.3 TQM Implementation
The correct way to institute quality into an organisation is to train managers, supervisors
and employees to do their task satisfactorily. If employees are to do their task better, they
must not only obey the pattern set to them, but they must also have the skills and
knowledge to do so. In some organisations, training is for managers only; in other
organisations managers believe that they are somehow above training and that training is
considered relevant only to the shop floor. Both these attitudes are wrong, training is for
everyone (See chapter 4).
199
Training and education in Iranian and British organisations.
The training structure must be top-down, starting with the top team and flowing down the
organisation. The golden rule for successful implementation is to ensure managers train
their own employees (see chapter 4). This is necessary to show management commitment
and to ensure managers actually understand the TQM principles and methods, and to
make sure implementation of TQM is carried out in the correct sprit. Training and
educations are important because it gives employees the necessary knowledge to assist
quality improvement across the company.
The researcher interviewed companies‟ managers at different levels, including senior
management. According to the findings, the major barriers to employee involvement in
TQM programmes in Iranian companies are found in the following areas:
The motivation for implementing a TQM programme,
The attitude of the management
The employees, and team involvement
Head of ISO in Iran believes organisations will improve their performance if they change
their management systems to be more participative by involving employees in:
Problem solving
Decision making
Strategy formulation
However, managers who are used to a paternalistic and dictatorial mode of management
will have difficulty in delegating responsibility down the line and, therefore, will fail to
implement TQM (See chapter 4).
200
However, according to the head of ISO in Iran when employee involvement is ignored,
the TQM programme is going to be fail.
TQM is mainly concerned with continuous improvement at all levels, from high level
strategic planning and decision-making, to a detailed execution of work elements in
different departments. It leads to continuality improving results, in all fields.
As a result,
Employees
Processes
Technology and machine capabilities
And effectively the whole organisation is improved. However, continuous improvement
should deal not only with improving results, but more importantly with improving
capabilities to produce end products in the future.
Another important TQM principle involves relationships that are mutually beneficial to
Supplier
Organisation
Customer
The companies need to have detailed information about supplier quality such as
drawings, specifications, and other necessary data to meet their customer demands.
“It is also very important to establish a supplier information feedback system, which can
be used for release feedback to suppliers about their product performance from end-user.”
(UK Manager)
Such information may be used to further improve supplier performance. A purchasing
system includes three key activities:
201
Specification of requirements
Selection of a supplier
Contract management
Supplier quality audit is an organized evaluation of supplier capabilities to furnish
materials of a specific quality and quantity; it is an important basis for initial supplier
selection and ongoing supplier quality surveillance (Feigenbaum, 1991). What one firm
buys from another is not just material: It buys something more important, namely,
engineering and capability (Deming, 1986). These requirements of a supplier must be
established long before it produces any material.
The most widespread approach to the management of quality found during the study was
quality policy. This affects all aspects of company operation.
“The way that quality department manage:
“Quality is all about numbers, targets and feedback reports. This is not what I think,
quality is all about and it is not what the quality department says about quality” (UK
Manager)
On the other hand,
“Iranian managers have a rolling check of the quantitative dimensions that make up
quality. Quality is about conformance to quality policy. There are lots of rules to follow”
(Iran Manager)
The emphasis given to quality policy as a strategy for the management of quality reflects
the vision of the quality manager with quality responsibility for companies. However, the
belief in quality policy is not supported by Iranian managers. They argue that quality
policies encourage flexibility in service delivery and it employees to be creative for
quality improvement to within internal processes of the company. In addition, Iranian
202
managers believe that having a quality policy will affect their companies, but it will
increase an overhead expenditure at company.
Attitudes of quality managers and employees towards TQM implementation
The researcher will first consider issues of training and education. The Iranian employees
did not have a high level of training. An ISO expatriate who had been hired as a quality
manager in one Iranian organisation, described the situation as follows:
“When I arrived, I went to the production line, and it was terrible! Nobody was checking
products; no one was looking at waste products in the store. That was bad.” (Iran
Manager)
This ISO expatriate was appalled at what he saw on the production line. The basic quality
apparel such as checking the production line, management involvement and training and
education were completely lacking, and local labourers seemed to work oblivious to any
concerns about quality products.
The situation in another company in Iran was almost identical. A quality manager
working in Iran complained about the lack of training and education.
“Their training, they don‟t care (about it). (They) don‟t do what managers tell them to
do.” (Iran Manager)
An experienced quality manager who had worked in an Iranian company said:
“Why (do) we need this training? I work in this area, (and) we need no one to come from
ISO to check us.” (Iran Manager)
Head of ISO considered it wise to do training at all times, since there were high levels of
waste products in some Iranian companies.
203
It was not only the employees who had poor education. The quality manager in some of
the companies, was also not trained. They frequently paid „lip service‟ to the training
organisation, which they were asked to obey by ISO organisation. They were not very
serious about following TQM implementation, since they were keener on advancing the
work quantity. One of the Heads of ISO gave an example:
“The expert got the TQM or ISO manual and basically turned it into their quality
production plan. So everything that we asked them to do, it was already in their ISO
manual. Excellent! You think! What happened then, I went in to see their quality
manager and started asking questions about their ISO plan – and he had not read it – it
was just a document sent to him by head office.” (Iran, Head of ISO)
This was not an isolated incident. As the quality manager left, some of the other quality
managers had confessions to make on their commitment towards a quality plan. The
Head of ISO spoke about a conversation that he had had with another quality manager.
“We all got the ISO plans that nobody had ever read. Mr J a quality manager in an
Iranian company, said, “I‟ll be honest with you. When we applied for this job, we hadn‟t
even looked at that (quality plans). We didn‟t consider it.” (Iran, Head of ISO)
The quality managers in some other local organisation thus did not care to ensure that
employees had enough knowledge about their task in their specified departments. They
never put their labourers under pressure to adhere to the ISO plan.
This is neither a new nor a surprising finding. In another company the quality manager
claimed that the quality department often had a quality plan on paper but that most
employees were not aware of its existence.
204
They listed quality problems prevalent in most production lines in Iranian companies. They
also describe the lack of quality policy towards the labourers and the workers. They observe
that many workers take chances, and do not observe quality policy.
The quality managers in Iran also exhibited a poor attitude towards quality policy. Quality
policy was not an important part of the production problem for Iranian companies, as a
British quality manager pointed out
“Basically the English managers always think about quality first and then quality
improvement.” (The UK Manger)
As these views indicate, the Iranian quality managers and labourers on the TQM
implementation exhibited neither good quality policy nor a high level of training and
education. The head of ISO expressed a lack of education related quality issues, while the
quality manager did not realize the importance of TQM implementation.
There were several reasons why the Iranian managers were not interested in TQM
implementation.
Foremost amongst these was the fact that the cost of applying TQM implementation
was very high,
Amount of money available for quality and TQM implementation was quite low.
Further, there was no shortage of employees who were willing to work on TQM
implementation.
Over several years this led the Iranian managers to develop a mindset of not being concerned
about TQM implementation. Even though some Iranian customers occasionally inserted
contract specifications requesting high quality products cheaply, because of competition with
Chinese products they rarely enforced them. Therefore managers had become accustomed to
ignoring the TQM implementation. An experienced ISO manager, who had worked as a
quality manager in several Iranian companies for the last fifteen years, noted with surprise the
part of the TQM implementation when he and his team actually attempted to ensure that the
company maintained the TQM implementation.
205
He said:
“When you wish to inspect the companies or the suppliers, even if they reluctantly read all
the fine print (quality plan), they have probably seen it before but they have learnt to ignore
it, because it is never enforced, while here we do enforce it a lot more. And these managers
once ask to rely, they say, “Of course, of course,” (to our quality plans) but when it comes to
reality and they must to perform they are not able to full field the requiems.” (Iran Manager)
It was not only the managers who were to blame. The quality managers themselves were not
very keen to carry out orders. They did not seem to realize that there was a chance to increase
the quality of products, and that this would increase their market share.
Furthermore, as this manager understood, TQM implementation sometimes reduced
employees‟ productivity, because employees had to fill in ISO forms and papers, as part of
TQM implementation, reducing their daily productivity. Basically managers were not very
happy about this.
In contrast, British managers and quality managers were very concerned about TQM
implementation. The British managers were very keen on getting their companies to adopt
TQM implementation.
The British quality managers were contractually required to have a person on their team in
charge of quality improvement. Instead of making this a „bonus‟ position with no real
responsibilities, the person took this position very seriously. Their quality managers were
tasked with ensuring that there were no mistakes made on the production line to ensure
quality, and were given the backing and the authority to do so. One of the British quality
managers spoke about the commitment of British companies towards quality policies:
“They (employees) know the importance of quality policies and without their co-operation I
can‟t implement any of this (TQM implementation). Their cooperation is always there.
Quality policies and TQM implementation and so on has to go hand in hand.” (UK)
The British quality managers received the full support of the management team to perform
their tasks effectively and to ensure that there were no mistakes made on production and
206
quality of products. The quality managers placed a lot of emphasis on good TQM
implementation practices in companies, even if it interfered with the progress of the work.
The Head of Iranian ISO organisation, who had earlier made deprecating statements on the
quality policy of the Iranian companies, commented on the European (The UK) quality
policy:
“European and British companies have taken quality policies pretty seriously.” (Iran
Manager)
By comparing Iranian companies with the British, he felt that the TQM implementation at
British companies was far better than that of Iranian companies and that he truly believed in
the importance of TQM implementation especially in training and education. An Iranian
manager who was trained in the UK spoke about the British attitude towards TQM:
“Especially people in the UK, they are famous for quality and TQM. I‟ve never before seen
quality regulations as (strict as) in UK.” (Iran Manager)
In the UK, quality is often considered by management as a priority item in discussion. Most
of the British managers considered quality as a very important issue. British managers are
concerned for the well being of their workers and ensure that the quality manager and
employees were trained to implement TQM procedures at their companies.
The researcher was not surprised at the TQM requirements in the UK. Quality managers and
employees were used to following TQM procedures on their production and exhibited a very
high level of quality to their customers
In terms of quality, even though the Iranian managers wanted to make sure that the finishes
on their products were smooth and that the quality of the products was high, Iranian
employees did not pay quite as much attention to the overall quality of the work. For
example, Head of ISO in Iran spoke about the poor quality work of Iranian employees as
compared to the British:

207
“Iran is different. British follow the quality standards in production. But the Iranian
employees are something different – they don‟t think about quality” (Iran Manager)
The Iranian quality managers tended to agree with these views and admitted that customers
expect high quality standards. A UK quality manager spoke about the quality of work that
their general manager expected:
“The British managers‟ requirement is high. (It) is stricter for some details. For example for
the production design – their production design considers more detail.” (Uk Manager)
Iranian production designs were done too quickly to get the required quality necessary.
Iranian products also often failed in the export field, because customers expected high quality
products at a cheap price. An Iranian manager who worked in export and import in the
international market declared:
“The international customers know what they want. They want very high quality products
and at a very affordable price, we cannot just follow the textbook (TQM implementation).
Customers really don‟t know what our difficulties are?” (Iran Manager)
From this manager‟s perspective, the level of quality that the customer expected was
incredibly high but they were also looking for competitive price, almost impossible to
achieve for Iranian organisations (the reason being high inflation and high employee cost).
Even in Iran, the competition between domestic producers is high. Partly, because of low
level of work quality in Iran due to the workers‟ backgrounds (cultural issue) as well as the
requirements or norms of different industries in Iran. Just as it was the case for quality norms
that were neither espoused by managers nor enforced on customers. Iranian producers were
used to „getting away‟ with making products that were of a lower quality when compared to
those of international companies, because they knew they were not being question to anyone.
Furthermore, labourers who perform the work originally came from a very poor background
and had received very little training. Therefore it was difficult for them to perform good
quality work.
208
The UK manager noted:
“In (the) UK, the majority of workers own their own houses and they take some pride in this.
Their standard of living is reasonably high.” (The UK manager)
In Iran is different, An Iranian manager said:
“Look at the workers working here. Some of them they have big family and are living in
small houses. They don‟t have enough salary to manage their life; some of them work during
the day here, and during the night somewhere else. And then we try and say, “We want
quality”. They cannot digest what quality means! They have had no training on how to
perform their tasks.” (Iran Manager)
The economic and social background that labourers came from made it difficult for them to
conceptualize or understand what a high quality job task mean and so they were unable to
perform their work satisfactorily.
Another reason for reduced quality in the Iranian companies was the difference in the work
ethic of the supervisor. Many of the supervisors only performed exactly the work assigned to
them and were not concerned about the overall quality of the product. Furthermore the head
of ISO felt that the Iranian workers were not very productive during the working hours.
“Iranian workers are very lazy. They take a lot of break, drinking tea and chatting about, this
on its own influences productivity.” (Iran Manager)
The researcher can personally confirm that the Iranian reduced daily productivity is due to
multiple tea breaks during the working day and time spent in idle conversation over politics
and the difficulties of life, and some other meaningless chat.
However, many of the experienced managers in Iran did not quickly condemn the workers,
they were aware of the economic circumstances; especially American sanctions in Iran had
led to lower quality. They also understood that they were imposing a much higher standard of
quality on their products and therefore tried to work within the system to improve quality
standards.
209
Another important issue is that, Iranian managers are facing a lack of suppliers. In Iran
suppliers are limited because of political issues or economic sanctions. Most essential raw
material is handled by the Government in Iran (imported or locally available). Those locally
available are distributed by Governmental affiliated organisation nationwide. One has to have
a good connection with this distributing organisation to receive reasonably good quality raw
material otherwise one will receive what is left over (poor quality).
One of the Iranian managers said,
“In the UK, British companies have so many choices of suppliers, can choose or change
supplier easily if are not happy with one. Here it is different, sometimes Iranian companies
cannot import their essential row material directly, as of the Government policy to protect the
domestic producer, sometimes you have to work only with one supplier. These so called
suppliers can charge you whatever it takes. Since these suppliers are certifying by the
Government, one cannot change them to another supplier (if the quality of the material
supplied was not quality wise satisfactorily), simply, because these are the only certify by the
Government. On the other hand, retailer or wholesalers import end products from China
(which are very cheap). So there is a fight and struggle between the domestic producers of
products and importers (Price + Quality).” (Iran Manager)
UK quality manager was able to perform the task of implementing TQM because of the
support and cooperation of the top management. In the UK quality managers employ several
strategies to attempt to improve the quality in British organisation.
The researcher will now describe these strategies and analyze their effectiveness.
Customer satisfaction and winning of the international market has forced British companies
to have two main strategies to improve quality – a strategy of convincing and educating the
workers (an education strategy) and a strategy of forcing them into compliance (an
enforcement strategy) to produce higher quality end products.
As the UK quality manager said:
210
“Education is important. I will first explain why (a certain quality procedure has to be
adopted). Then if this fails, you start enforcement (Penalties, fines, and so on) to improve
their quality” (UK manager)
The researcher will now elaborate on each of these two strategies.
Educating the local workforce to be more quality conscious:
British quality managers employed numerous methods to convince and educate labourers to
work on high quality levels. They held daily „tool box talks‟ and lectured workers on quality
issues relevant to the tasks that they were going to perform on that particular day. They
organised periodical meetings to talk about quality issues. Workers were shown drawings and
pictures of what to do and what not to do and in many cases performed trials or „mock-ups‟
that were used to point out quality errors so that they could employ corrective measures when
they performed the actual work. Another British quality manager has described some of the
educational techniques used in his department to improve the quality of the product
“So that‟s the reason why I say we have organised weekly quality meetings. Then we see if
something is wrong. Then we can argue and discuss better way to establish the standards to
be followed. So based on this kind of system, we can avoid repeating the same mistake. We
will go through our system to control our quality. We don‟t want to repeat our (mistake)
again and again.” (UK Manager)
The UK quality managers felt that by constantly educating the workers, through training,
through mock trials and by providing them with feedback, the workers would learn from their
mistakes and the quality of the work would improve. Another British quality manager
described a similar way, he used in his department:
We can arrange demonstrations. For example we do the practical work before we do the
permanent work. We need to arrange demonstration, demonstration to let the workers
practice and then we start the permanent work. Let the workers practice on the job and then
record any defects or improvements, and then we implement them in the actual permanent
work.
211
This UK quality manager also felt that repeated practice and diagnosis of errors helped
workers learn how to improve product quality. Apart from merely telling the workers „what‟
to do, the British quality managers also attempted to explain to the workers „why‟ quality was
important and tried to get the workers to take pride in their work and therefore pay more
attention to quality.
The British quality managers were quite experienced and understood the need to tailor their
arguments to different environments. In one company the researcher met a British quality
manager who was new in the organisation but who described his method of providing
educational training:
“A lot of this is done by training. I do a lot of courses. I spent the first few weeks just going
around and taking a lot of photographs and video. So what I had to do was to gather a series
of photos here.” (UK manager)
This manager spent a lot of time documenting errors and taking photographs of the
production so that he could then use these as effective examples to motivate the workers.
Thus the British managers felt that they would be able to improve the quality standards on the
project through the use of various methods of educating the workers.
However, as the researcher shall now briefly describe, although this strategy had good results
in the UK, it was not so successful in Iran.
Much to the disappointment of the Iranian quality managers, their attempts to educate the
workforce did not yield the desired results as the workers seldom changed their quality
practices or improved the quality of their work. An ISO quality manager in Iran, who was
part of TQM implementation in one Iranian company, could not understand why the workers
had difficulties following relatively simple quality guidelines. He said
“I was thinking when I got an introduction here on quality, I was thinking, “It might be very
easy to follow all these rules”, but our quality inspectors are reporting daily from the
production line saying, “employees are not following our regulations.” So as this happened
we stopped the production to demonstrate quality techniques. We stopped it because people
were not following instructions.” (Iran Manager)
212
Several ISO quality managers on the TQM implementation in Iran also felt that educating
the workers did not lead to a discernible improvement in quality. This finding is consistent
with Wilson et al‟s findings from a study of TQM implementation in the US, that tool-box
talks and other educational sessions were very inadequate in improving quality levels in these
companies (Wilson et al., 2000). Although the TQM implementation in Wilson et al.‟s
research study was not global in nature, they also involved interactions between managers
and workers who did not pay much attention to quality policies. Their findings are therefore
relevant to the problem that the researcher uncovered in his field in Iran.
As a result, ISO organisations in Iran sometimes start another strategy – that forces the
quality managers and labourers to follow higher quality standards.
When the strategy of education did not yield the desired results, the Head of ISO organisation
in Iran encouraged the managers and quality managers to employ quality work practices and
pay more attention to work quality. One of the primary methods of coercion was to impose a
monetary penalty for poor quality work.
The same strategy was adopted by several other companies in Iran. A production manager
from one of the manufacturing firms in Iran spoke about how his organization tried to focus
on improved quality standards on their production:
“Every morning (we have) a meeting with the workers and continuously persuade them. If
(they) do not follow these quality regulations you will be penalized. Iranians workers due to
low income like the money and they do not wish the money to be taken from them. So we can
control by deducting the money from their salary as a penalty. Yes, so it takes about 3 or 4
months but finally they follow our instructions.” (Iran Manager)
This method of coercion worked quite well as most of the workers in Iran were motivated by
money. The fact that they were paid very little also implied that they were highly unwilling to
lose their income through fines and as a result quickly learnt to adopt the quality work
practices espoused by the quality manager.
A related approach that another quality manager used was to stop the work or to order
workers to repeat a part of the work, if an appropriate quality measure was not followed. This
213
was an indirect form of imposing monetary penalties since rework or work stoppages resulted
in production delays that often forced the company to pay damages to the customers if the
work was not completed on time. A work stoppage notice therefore pushed the local workers
to change their approach to quality policy.
The Head of ISO described the situation as follows:
“So at various stages we stopped the work! “This is not acceptable – so stop. You‟ll go no
further until you put this right” (we said). And they received a written stop work notice. That
had an effect. We don‟t like stopping the work, but the risk there was phenomenal!” (Iran,
Head of ISO)
The Head of ISO understood that stopping the work had an adverse effect on the timely
completion of the products. However, since they also placed high importance on the quality
policy, they felt justified in stopping the work occasionally if it led to an improvement in
quality policy.
In contrast to the strategy and education, the strategy of enforcement was quite successful in
bringing about a change in quality work implantation in Iran. As the above incidents have
indicated, enforcement of monetary penalties often coerced the workers into adopting TQM
implementation. Even though there was no guarantee that they would not revert back to their
old quality policy, their work attitudes towards TQM implementation on their current
situation displayed a marked improvement.
As an Iranian manager working for an international company in Iran said:
“So you identify what it is that‟s going to make them sit up and take notice. And in Iran there
is not a great deal that will make them sit up and take (notice). If the supervisor insists on it
and, the supervisor makes it happen, then the workers will follow in line – because they have
to. Since I first came to this company – you see, my views have changed – one of my
colleagues said, “We should fine the supervisor.” I was totally opposed to ask the supervisor
to impose fines on the workers. That‟s for the legal authorities to do. But there is no legal
214
authority to do it. So I now think that we should fine the supervisor – because nobody else is
going to do this. It‟s the only way that we‟re going to grab his attention.” (Iran Manager)
The Head of ISO in this instance referred to supervisors employed directly by the quality
managers to supervise quality works. Like most of the managers, they initially felt that
logical persuasion and education would change the workers‟ mentality. They even opposed
the use of coercive measures. However, after having failed in his attempt to educate workers
on quality policy issues he concluded that the use of force (in the form of fines etc) was the
only way to improve quality production. As a result, there was an overall increase in quality
standards in Iran.
Based on their backgrounds, the Head of ISO had highly institutionalized views about the
TQM implementation in Iranian organisation. They were committed to observing high
standards of quality. On the other hand, the quality managers and workers had been
influenced by a different set of forces over the course of their careers and were in the habit of
paying lesser attention to TQM implementation.
These two differing viewpoints come up.
The Head of ISO attempted to change the mindsets of the managers and workers. However,
as many scholars in the field of institutional theory have observed, the process of institutional
change is not an instantaneous one. Changing the „mindset‟ or bringing forward institutional
change is often a contentious process that takes place over a long time span – typically over
decades (e.g. Townley 2002). Furthermore, Head of ISO had an aggressive timeframe in
mind and wished to influence a change as quickly as possible, so that they could advance the
works seamlessly.
In her study of the introduction of American work practices into Europe, Djelic (1998) deals
with a somewhat related situation. She describes an attempt made in post-World War II
Europe, to change the mindsets of the European workers and the institutions underlying
commerce and production in Europe to a set of institutions that were more in tune with those
prevalent in the US. Based on Powell and DiMaggio‟s work (Powell and DiMaggio 1983),
Djelic (1998) describes three strategies –coercive, normative and mimetic – that American
sponsors and local champions undertook to influence this change. The American sponsors in
215
this case understood that even though coercive strategies led to the adoption of American
practices in the short term, this shift was likely to only be temporary. In the long term, they
felt that if the local workers did not fully embrace the new sets of rules, norms and values, the
American model would not be adopted. They therefore used more time intensive normative
and mimetic strategies and tried to inculcate American practices into the education system,
attempted to persuade and convince political leaders and so on. Over a period of decades,
they succeeded in using these tactics to bring about a change in the European mindset.
Although the quality managers and workers were successfully coerced into adopting TQM
implementation and to pay more attention to work quality, the magnitude of improvement
was not as much as the Head of ISO had hoped for. The Head of ISO understood that it was
difficult for workers to change their view completely overnight and were prepared to accept
less than perfect work, as long as there was a marked improvement in quality standards.
A manager in Iran remarked:
“They (the Iranian employees) don‟t perform 100%, but at least they perform 60-70% quality
work. „So-so‟ work. So I accept so-so work.” (Iran, Head of ISO)
Although this manager forced workers to be quality compliant, he had developed a level of
tolerance wherein he accepted work that had some relatively minor defects. Another manager
in Iran also did not feel the need to enforce 100% compliance towards all the quality criteria.
In his view, there were some criteria and policies that had to be strictly observed, while other
criteria could be relaxed.
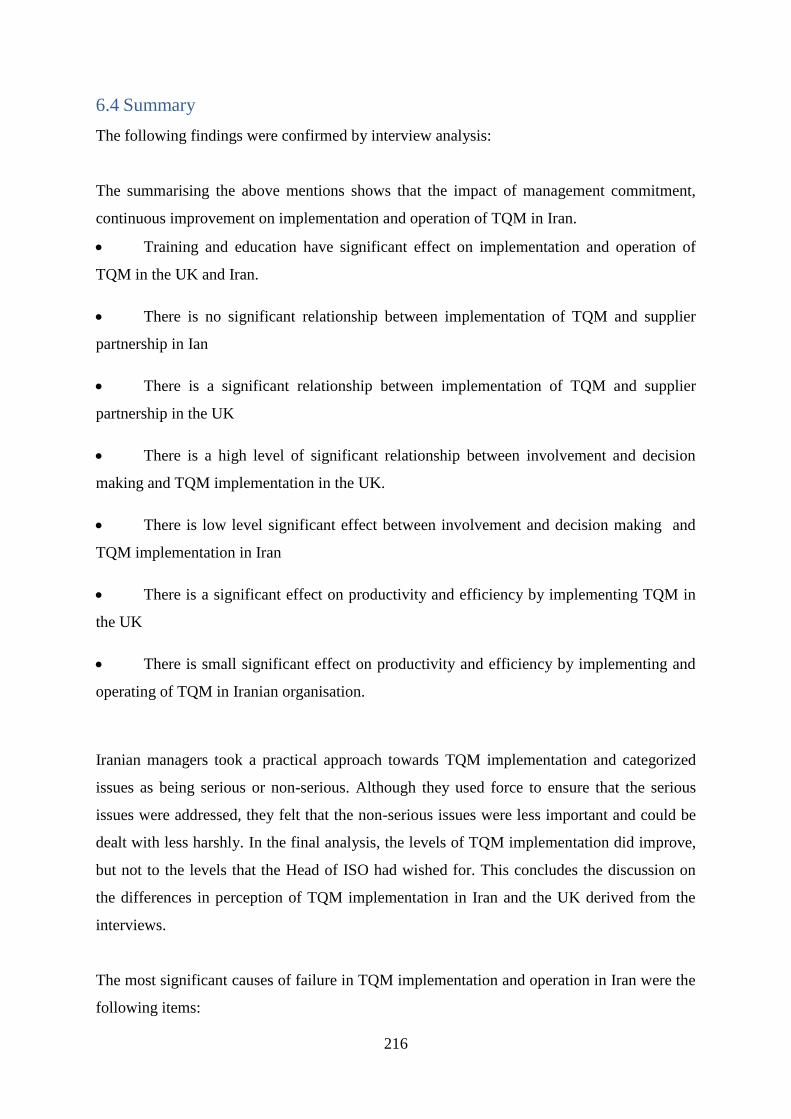
216
6.4 Summary
The following findings were confirmed by interview analysis:
The summarising the above mentions shows that the impact of management commitment,
continuous improvement on implementation and operation of TQM in Iran.
Training and education have significant effect on implementation and operation of
TQM in the UK and Iran.
There is no significant relationship between implementation of TQM and supplier
partnership in Ian
There is a significant relationship between implementation of TQM and supplier
partnership in the UK
There is a high level of significant relationship between involvement and decision
making and TQM implementation in the UK.
There is low level significant effect between involvement and decision making and
TQM implementation in Iran
There is a significant effect on productivity and efficiency by implementing TQM in
the UK
There is small significant effect on productivity and efficiency by implementing and
operating of TQM in Iranian organisation.
Iranian managers took a practical approach towards TQM implementation and categorized
issues as being serious or non-serious. Although they used force to ensure that the serious
issues were addressed, they felt that the non-serious issues were less important and could be
dealt with less harshly. In the final analysis, the levels of TQM implementation did improve,
but not to the levels that the Head of ISO had wished for. This concludes the discussion on
the differences in perception of TQM implementation in Iran and the UK derived from the
interviews.
The most significant causes of failure in TQM implementation and operation in Iran were the
following items:
217
Lack of management commitment on quality
Lack of awareness on the benefits of TQM implementation and operation in Iranian
organisations.
Insufficient knowledge of TQM and measuring techniques that are used to measure
effectiveness of TQM implementation.
Lack of clarity in the guideline, implementation plan and implementation method.
Lack of understanding about the positive result of continues improvement.
Ignoring the importance of the customer.
Lack of understand implication of national culture, organisational culture on
successful implementation and operation of TQM.
The following two chapters, i.e.7 and 8 will present the questionnaire results related to the
effect of organisational culture on TQM implementation in the UK and Iran.

218
Chapter Seven (Iranian Questionnaire Analysis)
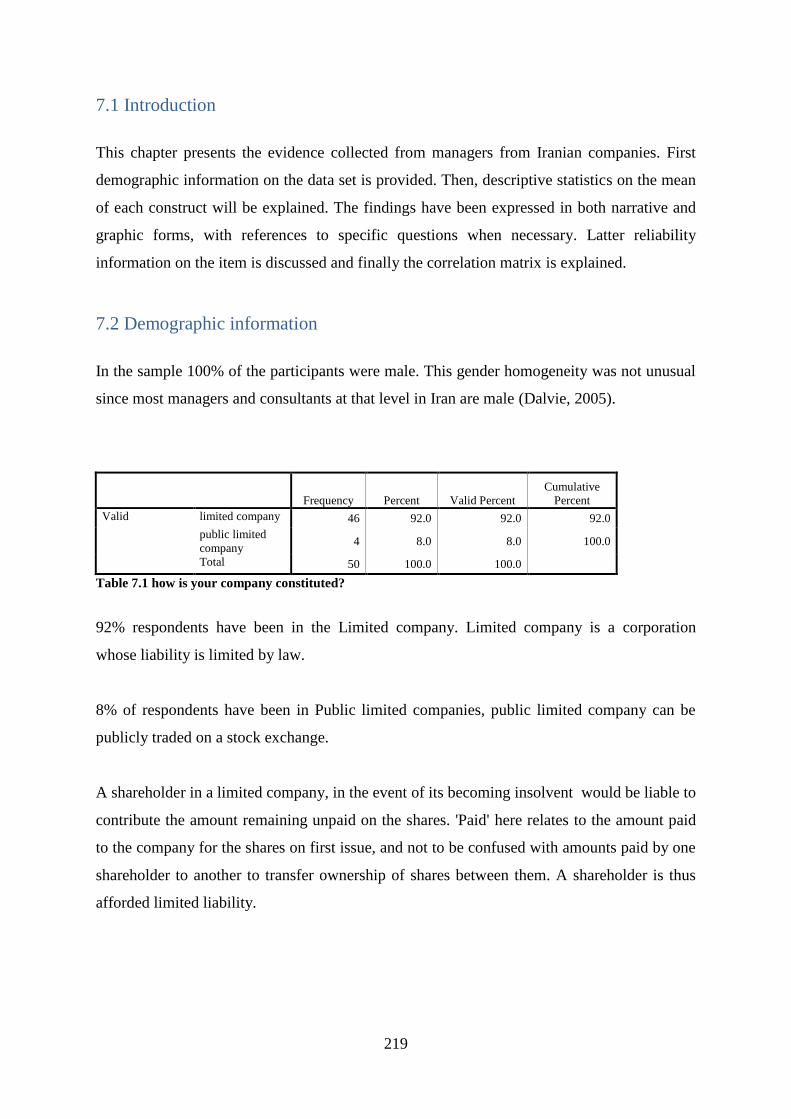
219
7.1 Introduction
This chapter presents the evidence collected from managers from Iranian companies. First
demographic information on the data set is provided. Then, descriptive statistics on the mean
of each construct will be explained. The findings have been expressed in both narrative and
graphic forms, with references to specific questions when necessary. Latter reliability
information on the item is discussed and finally the correlation matrix is explained.
7.2 Demographic information
In the sample 100% of the participants were male. This gender homogeneity was not unusual
since most managers and consultants at that level in Iran are male (Dalvie, 2005).
Frequency Percent Valid Percent
Cumulative
Percent
Valid limited company 46 92.0 92.0 92.0
public limited
company 4 8.0 8.0 100.0
Total 50 100.0 100.0
Table 7.1 how is your company constituted?
92% respondents have been in the Limited company. Limited company is a corporation
whose liability is limited by law.
8% of respondents have been in Public limited companies, public limited company can be
publicly traded on a stock exchange.
A shareholder in a limited company, in the event of its becoming insolvent would be liable to
contribute the amount remaining unpaid on the shares. 'Paid' here relates to the amount paid
to the company for the shares on first issue, and not to be confused with amounts paid by one
shareholder to another to transfer ownership of shares between them. A shareholder is thus
afforded limited liability.
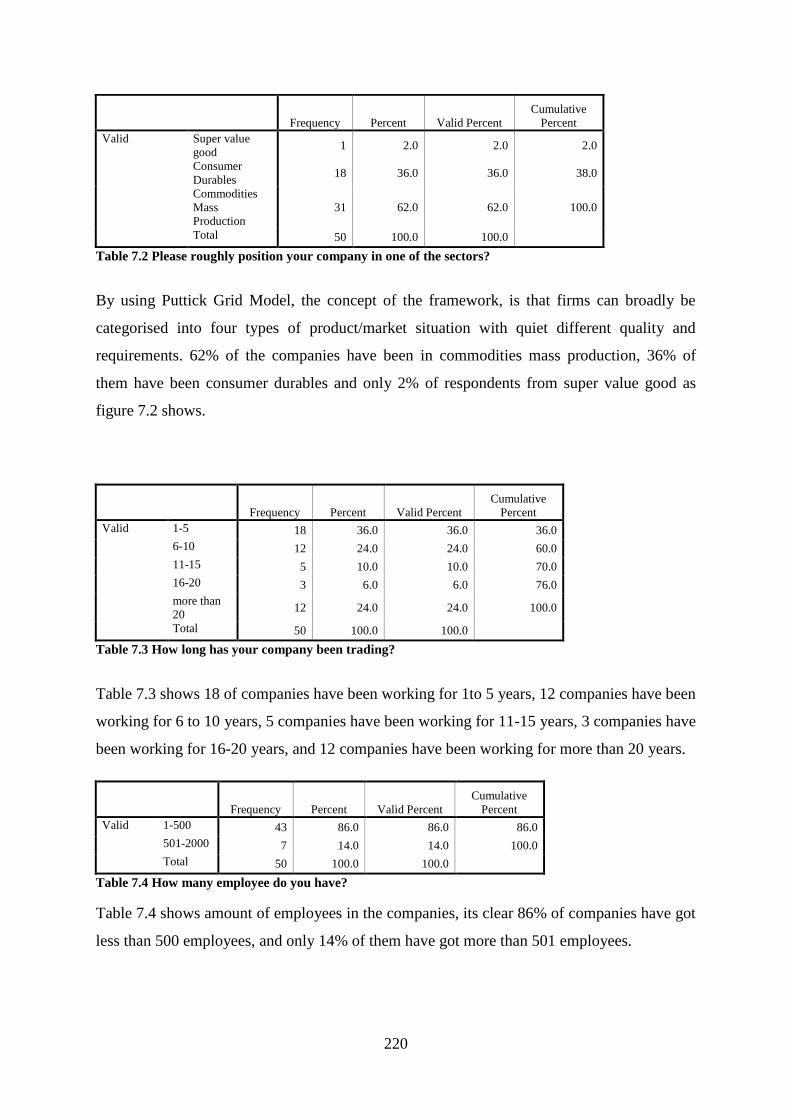
220
Frequency Percent Valid Percent
Cumulative
Percent
Valid Super value
good 1 2.0 2.0 2.0
Consumer
Durables 18 36.0 36.0 38.0
Commodities
Mass
Production
31 62.0 62.0 100.0
Total 50 100.0 100.0
Table 7.2 Please roughly position your company in one of the sectors?
By using Puttick Grid Model, the concept of the framework, is that firms can broadly be
categorised into four types of product/market situation with quiet different quality and
requirements. 62% of the companies have been in commodities mass production, 36% of
them have been consumer durables and only 2% of respondents from super value good as
figure 7.2 shows.
Frequency Percent Valid Percent
Cumulative
Percent
Valid 1-5 18 36.0 36.0 36.0
6-10 12 24.0 24.0 60.0
11-15 5 10.0 10.0 70.0
16-20 3 6.0 6.0 76.0
more than
20 12 24.0 24.0 100.0
Total 50 100.0 100.0
Table 7.3 How long has your company been trading?
Table 7.3 shows 18 of companies have been working for 1to 5 years, 12 companies have been
working for 6 to 10 years, 5 companies have been working for 11-15 years, 3 companies have
been working for 16-20 years, and 12 companies have been working for more than 20 years.
Frequency Percent Valid Percent
Cumulative
Percent
Valid 1-500 43 86.0 86.0 86.0
501-2000 7 14.0 14.0 100.0
Total 50 100.0 100.0
Table 7.4 How many employee do you have?
Table 7.4 shows amount of employees in the companies, its clear 86% of companies have got
less than 500 employees, and only 14% of them have got more than 501 employees.
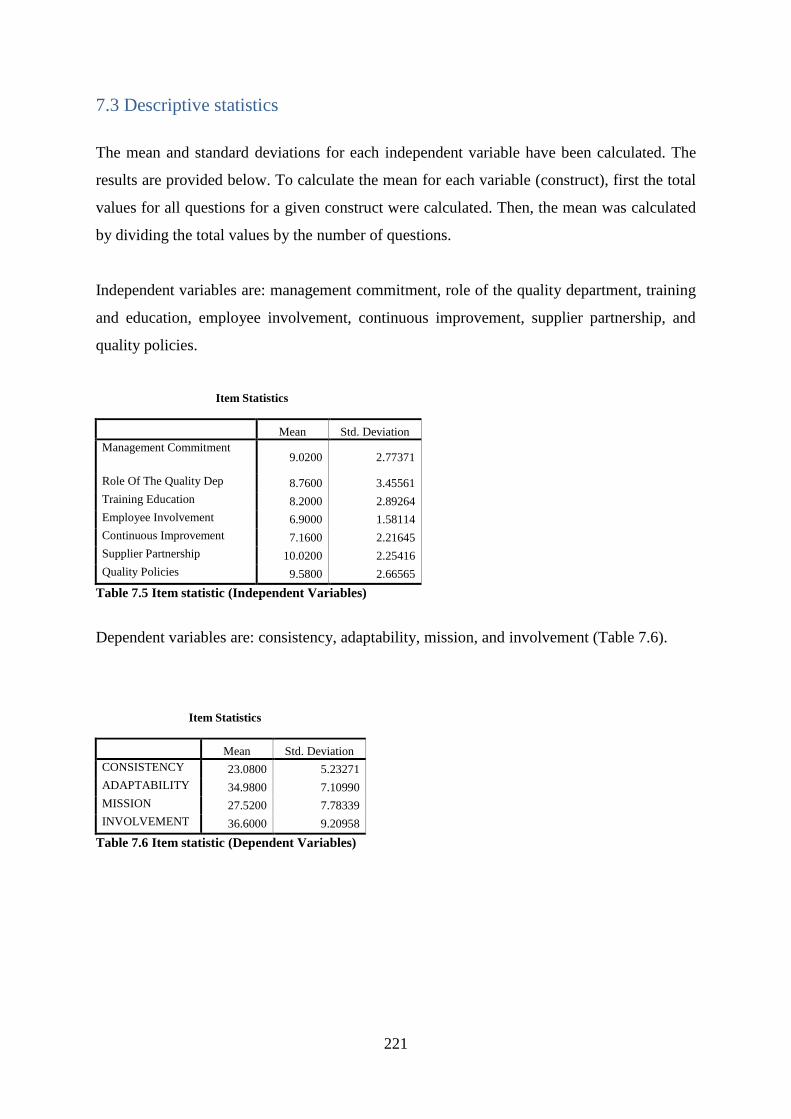
221
7.3 Descriptive statistics
The mean and standard deviations for each independent variable have been calculated. The
results are provided below. To calculate the mean for each variable (construct), first the total
values for all questions for a given construct were calculated. Then, the mean was calculated
by dividing the total values by the number of questions.
Independent variables are: management commitment, role of the quality department, training
and education, employee involvement, continuous improvement, supplier partnership, and
quality policies.
Item Statistics
Mean Std. Deviation
Management Commitment 9.0200 2.77371
Role Of The Quality Dep 8.7600 3.45561
Training Education 8.2000 2.89264
Employee Involvement 6.9000 1.58114
Continuous Improvement 7.1600 2.21645
Supplier Partnership 10.0200 2.25416
Quality Policies 9.5800 2.66565
Table 7.5 Item statistic (Independent Variables)
Dependent variables are: consistency, adaptability, mission, and involvement (Table 7.6).
Item Statistics
Mean Std. Deviation
CONSISTENCY 23.0800 5.23271
ADAPTABILITY 34.9800 7.10990
MISSION 27.5200 7.78339
INVOLVEMENT 36.6000 9.20958
Table 7.6 Item statistic (Dependent Variables)
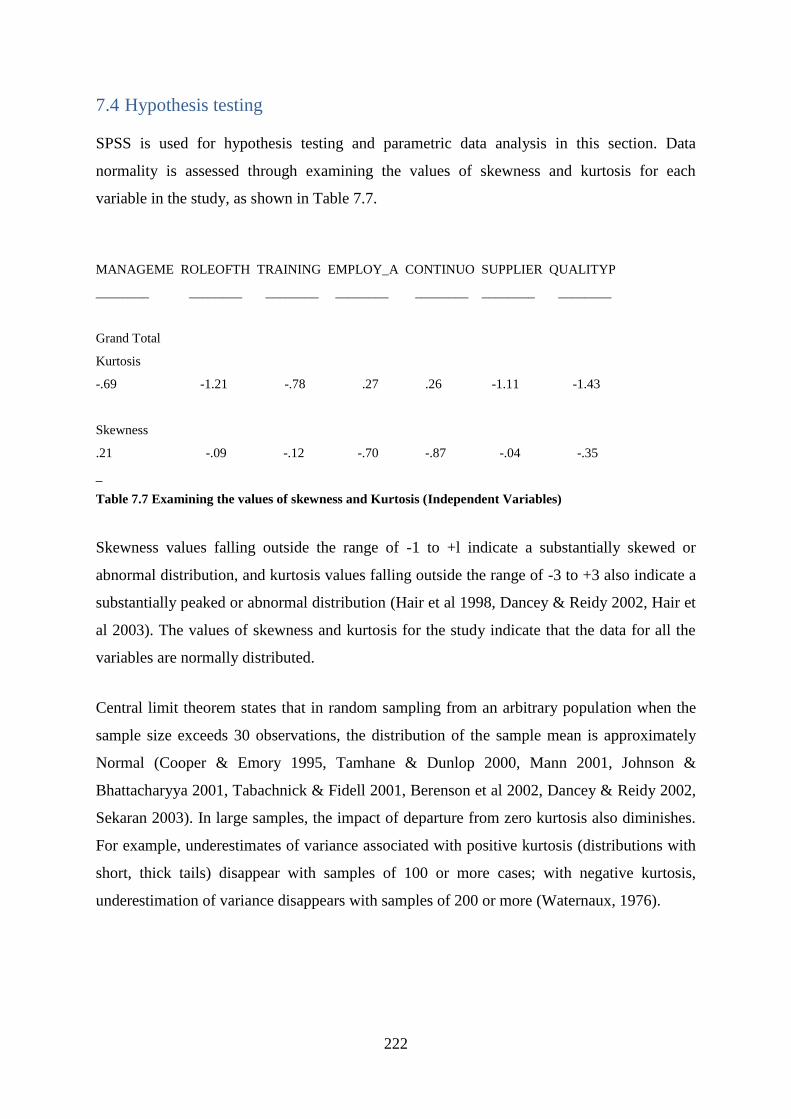
222
7.4 Hypothesis testing
SPSS is used for hypothesis testing and parametric data analysis in this section. Data
normality is assessed through examining the values of skewness and kurtosis for each
variable in the study, as shown in Table 7.7.
MANAGEME ROLEOFTH TRAINING EMPLOY_A CONTINUO SUPPLIER QUALITYP
________ ________ ________ ________ ________ ________ ________
Grand Total
Kurtosis
-.69 -1.21 -.78 .27 .26 -1.11 -1.43
Skewness
.21 -.09 -.12 -.70 -.87 -.04 -.35
_
Table 7.7 Examining the values of skewness and Kurtosis (Independent Variables)
Skewness values falling outside the range of -1 to +l indicate a substantially skewed or
abnormal distribution, and kurtosis values falling outside the range of -3 to +3 also indicate a
substantially peaked or abnormal distribution (Hair et al 1998, Dancey & Reidy 2002, Hair et
al 2003). The values of skewness and kurtosis for the study indicate that the data for all the
variables are normally distributed.
Central limit theorem states that in random sampling from an arbitrary population when the
sample size exceeds 30 observations, the distribution of the sample mean is approximately
Normal (Cooper & Emory 1995, Tamhane & Dunlop 2000, Mann 2001, Johnson &
Bhattacharyya 2001, Tabachnick & Fidell 2001, Berenson et al 2002, Dancey & Reidy 2002,
Sekaran 2003). In large samples, the impact of departure from zero kurtosis also diminishes.
For example, underestimates of variance associated with positive kurtosis (distributions with
short, thick tails) disappear with samples of 100 or more cases; with negative kurtosis,
underestimation of variance disappears with samples of 200 or more (Waternaux, 1976).
223
7.5 Correlation between variables
The next step in factor analysis is to establish whether the set of variables is a suitable
selection by showing that there is some systematic covariation among the variables under
consideration (Hair et al., 1998). In factor analysis, some degree of multicollinearity is
desirable, because the objective is to identify interrelated sets of variables. According to Hair
et al. (1998), if visual inspection of the correlation matrix reveals a substantial number of
correlations greater than 0.30, then factor analysis is appropriate. The correlations among
variables can be analysed by computing the partial correlations among variables. If “true”
factors exist in the data, the values of partial correlation should be small. In the
multicollinearity, a value of 0.70 or more is generally considered sufficiently high, while a
value below 0.50 is unsatisfactory and one over 0.90 is outstanding (Hair et al. 1998).
The multivariate correlation matrix of this study indicates no multicollinearity (R =0.80 or
higher) among study variables (Hair et al 1998, Tabachnick & Fidell 2001), as Table 7.8
indicates.
The direction of relationships among variables is another issue that should be considered in
analysing the correlations between variables. A positive correlation indicates that the
direction of the relationship is positive (if one increases, the other one increases). A negative
correlation indicates an inverse relationship between variables (if one increases the other one
increase).
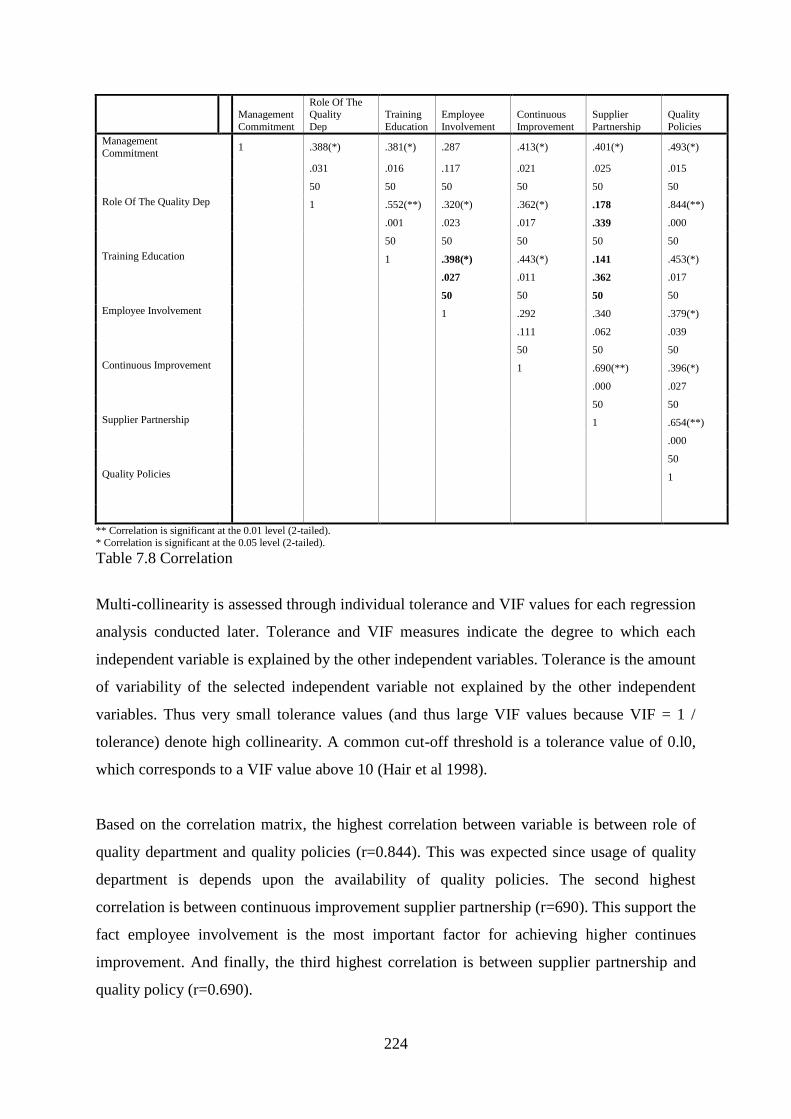
224
Management
Commitment
Role Of The Quality
Dep
Training
Education
Employee
Involvement
Continuous
Improvement
Supplier
Partnership
Quality
Policies
Management
Commitment
1 .388(*) .381(*) .287 .413(*) .401(*) .493(*)
.031 .016 .117 .021 .025 .015
50 50 50 50 50 50
Role Of The Quality Dep 1 .552(**) .320(*) .362(*) .178 .844(**)
.001 .023 .017 .339 .000
50 50 50 50 50
Training Education 1 .398(*) .443(*) .141 .453(*)
.027 .011 .362 .017
50 50 50 50
Employee Involvement 1 .292 .340 .379(*)
.111 .062 .039
50 50 50
Continuous Improvement 1 .690(**) .396(*)
.000 .027
50 50
Supplier Partnership 1 .654(**)
.000
50
Quality Policies 1
** Correlation is significant at the 0.01 level (2-tailed). * Correlation is significant at the 0.05 level (2-tailed).
Table 7.8 Correlation
Multi-collinearity is assessed through individual tolerance and VIF values for each regression
analysis conducted later. Tolerance and VIF measures indicate the degree to which each
independent variable is explained by the other independent variables. Tolerance is the amount
of variability of the selected independent variable not explained by the other independent
variables. Thus very small tolerance values (and thus large VIF values because VIF = 1 /
tolerance) denote high collinearity. A common cut-off threshold is a tolerance value of 0.l0,
which corresponds to a VIF value above 10 (Hair et al 1998).
Based on the correlation matrix, the highest correlation between variable is between role of
quality department and quality policies (r=0.844). This was expected since usage of quality
department is depends upon the availability of quality policies. The second highest
correlation is between continuous improvement supplier partnership (r=690). This support the
fact employee involvement is the most important factor for achieving higher continues
improvement. And finally, the third highest correlation is between supplier partnership and
quality policy (r=0.690).
225
The result of correlation can be used to support the hypotheses developed. The correlation
matrix indicates that there is a significant correlation between quality department and quality
policy usage (r=0.844, p=0.000).
7.6 Regression Analysis (Iranian Organisational culture)
Regression analysis was divided in to the two different parts; first part was to find effect of
national culture on organisational culture variable, in order to find this relationship,
researcher made a series of regression analyses. Second part was to find effect of
organisational culture on TQM implementation. In order to determine the effect of
organisational culture, involvement (empowerment, team orientation, capability
development), consistency (core value, coordination and integration), adaptability (creating
change, customer focus, and organisational learning), mission (strategic direction, goal
objective, and vision) on TQM implementation (management commitment, role of the quality
department, training and education, employee involvement, continuous improvement,
supplier partnership, and quality policies) results, a series of regression analyses were
performed. The regression analysis determines which variables (independent variables)
explain variability in the outcome (dependent variables), how much variability in the
dependent variables is explained by the independent variables, and which variables are
significant (over other variables) in explaining the variability of the dependent variable
In multiple regression analysis the “Enter” regression method is used because simultaneous
effects of all independent variables are required. In the standard, or simultaneous cause effect
analysis, all independent variables enter into the regression equation at once; each one is
assessed as if it had entered the regression after all other independent variables had entered.
Each independent variable is evaluated in terms of what it adds to prediction of the dependent
variable that is different from the predictability afforded by all the other independent
variables (Tabachnick & Fidell 2001). Standardized beta coefficients are used in regression
equations because they eliminate the problem of dealing with different units of measurement,
thus reflecting the relative impact on the dependent variable of a change in one standard
deviation in either variable. Therefore, standardized beta coefficients determine which
variable has the strongest impact (Berenson et al 2002, Dancey & Reidy 2002). However,
beta coefficients are used as a guide to the relative importance of the independent variables
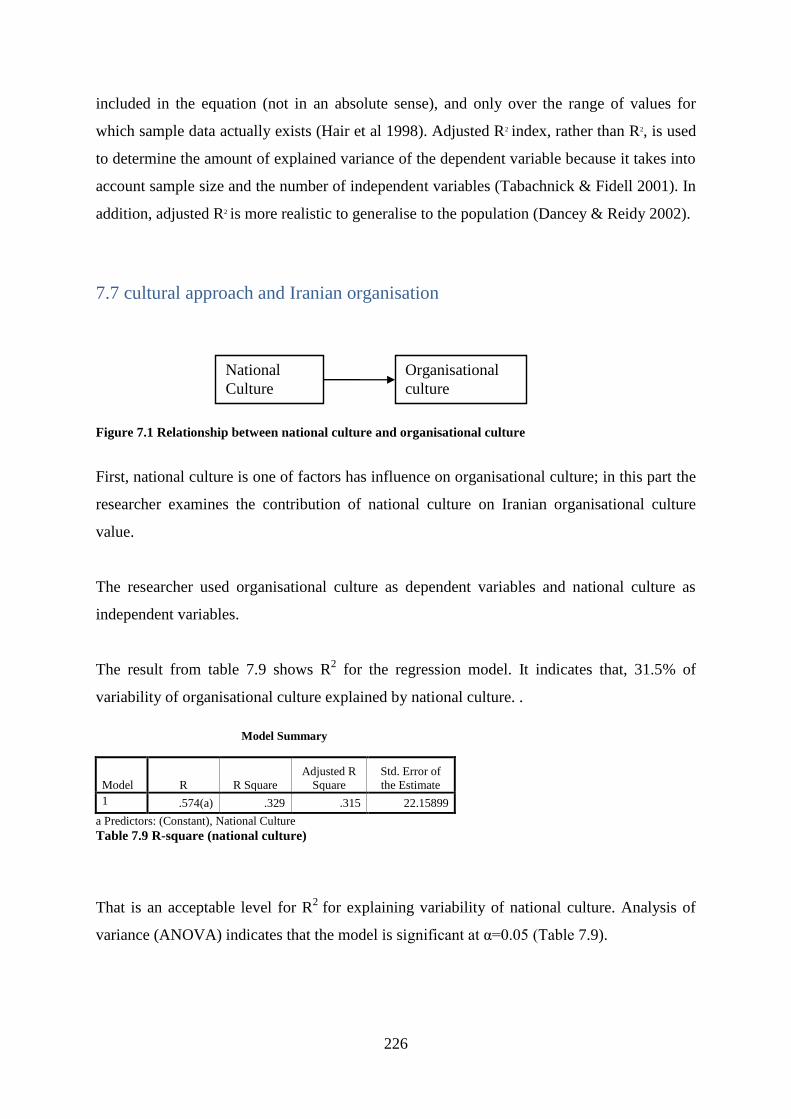
226
included in the equation (not in an absolute sense), and only over the range of values for
which sample data actually exists (Hair et al 1998). Adjusted R2 index, rather than R2, is used
to determine the amount of explained variance of the dependent variable because it takes into
account sample size and the number of independent variables (Tabachnick & Fidell 2001). In
addition, adjusted R2 is more realistic to generalise to the population (Dancey & Reidy 2002).
7.7 cultural approach and Iranian organisation
Figure 7.1 Relationship between national culture and organisational culture
First, national culture is one of factors has influence on organisational culture; in this part the
researcher examines the contribution of national culture on Iranian organisational culture
value.
The researcher used organisational culture as dependent variables and national culture as
independent variables.
The result from table 7.9 shows R2 for the regression model. It indicates that, 31.5% of
variability of organisational culture explained by national culture. .
Model Summary
Model R R Square
Adjusted R
Square
Std. Error of
the Estimate
1 .574(a) .329 .315 22.15899
a Predictors: (Constant), National Culture
Table 7.9 R-square (national culture)
That is an acceptable level for R2
for explaining variability of national culture. Analysis of
variance (ANOVA) indicates that the model is significant at α=0.05 (Table 7.9).
National
Culture
Organisational
culture
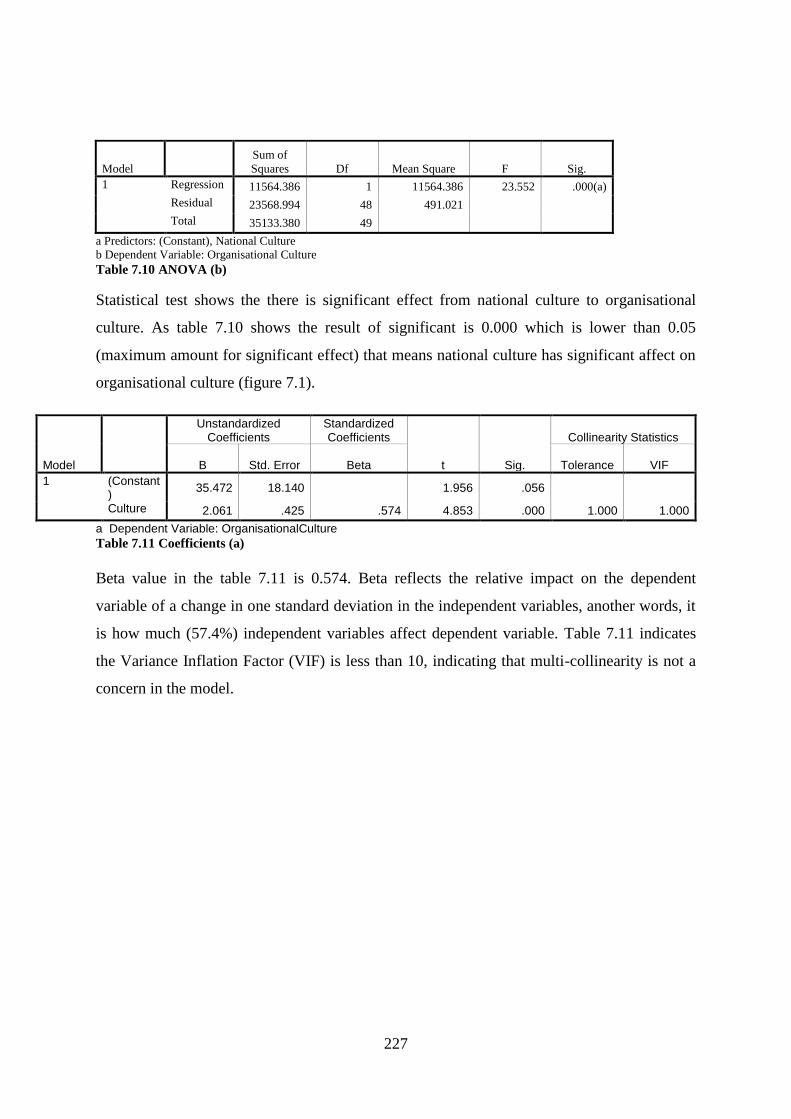
227
Model
Sum of
Squares Df Mean Square F Sig.
1 Regression 11564.386 1 11564.386 23.552 .000(a)
Residual 23568.994 48 491.021
Total 35133.380 49
a Predictors: (Constant), National Culture
b Dependent Variable: Organisational Culture
Table 7.10 ANOVA (b)
Statistical test shows the there is significant effect from national culture to organisational
culture. As table 7.10 shows the result of significant is 0.000 which is lower than 0.05
(maximum amount for significant effect) that means national culture has significant affect on
organisational culture (figure 7.1).
Model
Unstandardized Coefficients
Standardized Coefficients
t Sig.
Collinearity Statistics
B Std. Error Beta Tolerance VIF
1 (Constant)
35.472 18.140 1.956 .056
Culture 2.061 .425 .574 4.853 .000 1.000 1.000
a Dependent Variable: OrganisationalCulture
Table 7.11 Coefficients (a)
Beta value in the table 7.11 is 0.574. Beta reflects the relative impact on the dependent
variable of a change in one standard deviation in the independent variables, another words, it
is how much (57.4%) independent variables affect dependent variable. Table 7.11 indicates
the Variance Inflation Factor (VIF) is less than 10, indicating that multi-collinearity is not a
concern in the model.
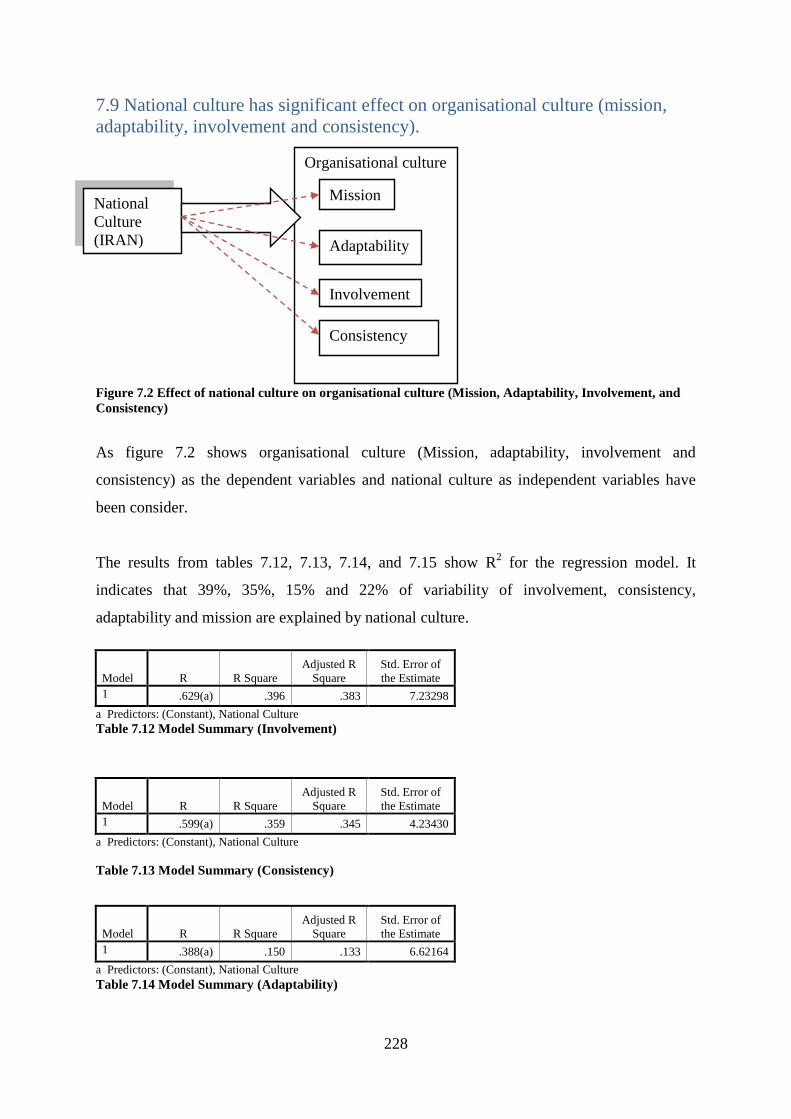
228
7.9 National culture has significant effect on organisational culture (mission,
adaptability, involvement and consistency).
Figure 7.2 Effect of national culture on organisational culture (Mission, Adaptability, Involvement, and
Consistency)
As figure 7.2 shows organisational culture (Mission, adaptability, involvement and
consistency) as the dependent variables and national culture as independent variables have
been consider.
The results from tables 7.12, 7.13, 7.14, and 7.15 show R2 for the regression model. It
indicates that 39%, 35%, 15% and 22% of variability of involvement, consistency,
adaptability and mission are explained by national culture.
Model R R Square
Adjusted R
Square
Std. Error of
the Estimate
1 .629(a) .396 .383 7.23298
a Predictors: (Constant), National Culture
Table 7.12 Model Summary (Involvement)
Model R R Square
Adjusted R
Square
Std. Error of
the Estimate
1 .599(a) .359 .345 4.23430
a Predictors: (Constant), National Culture
Table 7.13 Model Summary (Consistency)
Model R R Square
Adjusted R
Square
Std. Error of
the Estimate
1 .388(a) .150 .133 6.62164
a Predictors: (Constant), National Culture
Table 7.14 Model Summary (Adaptability)
National
Culture
(IRAN)
Organisational culture
Mission
Adaptability
Involvement
Consistency
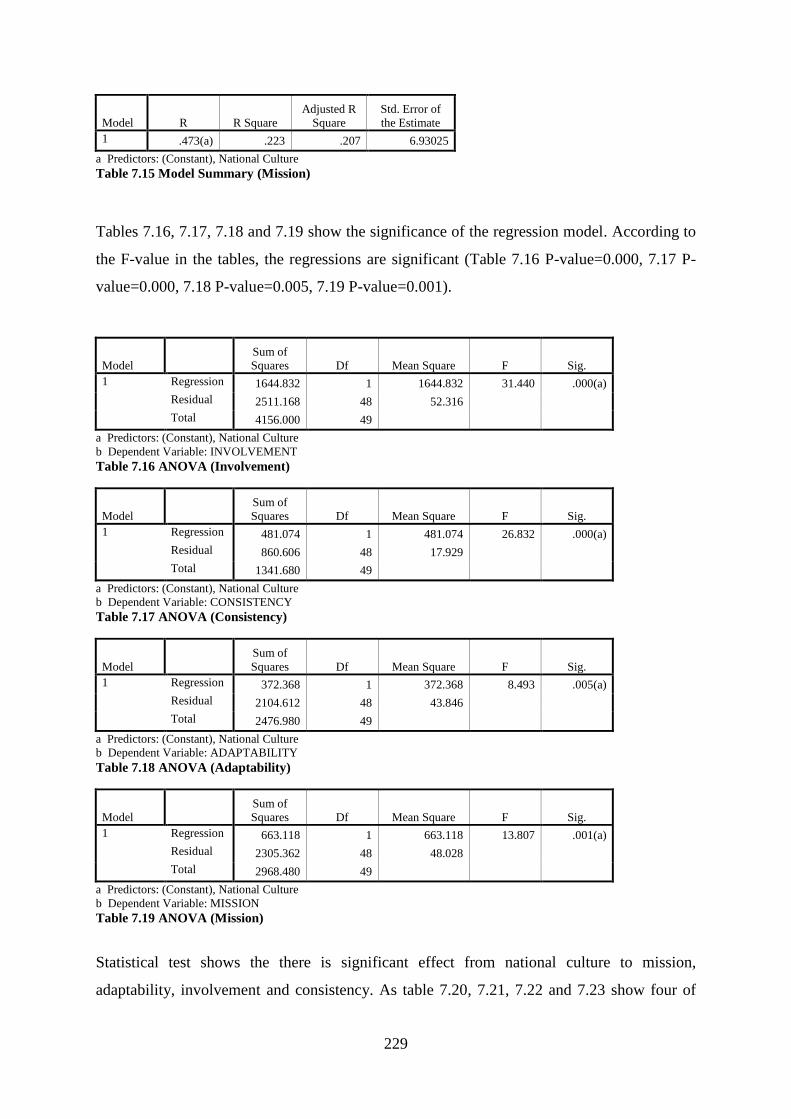
229
Model R R Square
Adjusted R
Square
Std. Error of
the Estimate
1 .473(a) .223 .207 6.93025
a Predictors: (Constant), National Culture
Table 7.15 Model Summary (Mission)
Tables 7.16, 7.17, 7.18 and 7.19 show the significance of the regression model. According to
the F-value in the tables, the regressions are significant (Table 7.16 P-value=0.000, 7.17 P-
value=0.000, 7.18 P-value=0.005, 7.19 P-value=0.001).
Model
Sum of
Squares Df Mean Square F Sig.
1 Regression 1644.832 1 1644.832 31.440 .000(a)
Residual 2511.168 48 52.316
Total 4156.000 49
a Predictors: (Constant), National Culture
b Dependent Variable: INVOLVEMENT
Table 7.16 ANOVA (Involvement)
Model
Sum of
Squares Df Mean Square F Sig.
1 Regression 481.074 1 481.074 26.832 .000(a)
Residual 860.606 48 17.929
Total 1341.680 49
a Predictors: (Constant), National Culture
b Dependent Variable: CONSISTENCY
Table 7.17 ANOVA (Consistency)
Model
Sum of
Squares Df Mean Square F Sig.
1 Regression 372.368 1 372.368 8.493 .005(a)
Residual 2104.612 48 43.846
Total 2476.980 49
a Predictors: (Constant), National Culture
b Dependent Variable: ADAPTABILITY
Table 7.18 ANOVA (Adaptability)
Model
Sum of
Squares Df Mean Square F Sig.
1 Regression 663.118 1 663.118 13.807 .001(a)
Residual 2305.362 48 48.028
Total 2968.480 49
a Predictors: (Constant), National Culture
b Dependent Variable: MISSION
Table 7.19 ANOVA (Mission)
Statistical test shows the there is significant effect from national culture to mission,
adaptability, involvement and consistency. As table 7.20, 7.21, 7.22 and 7.23 show four of
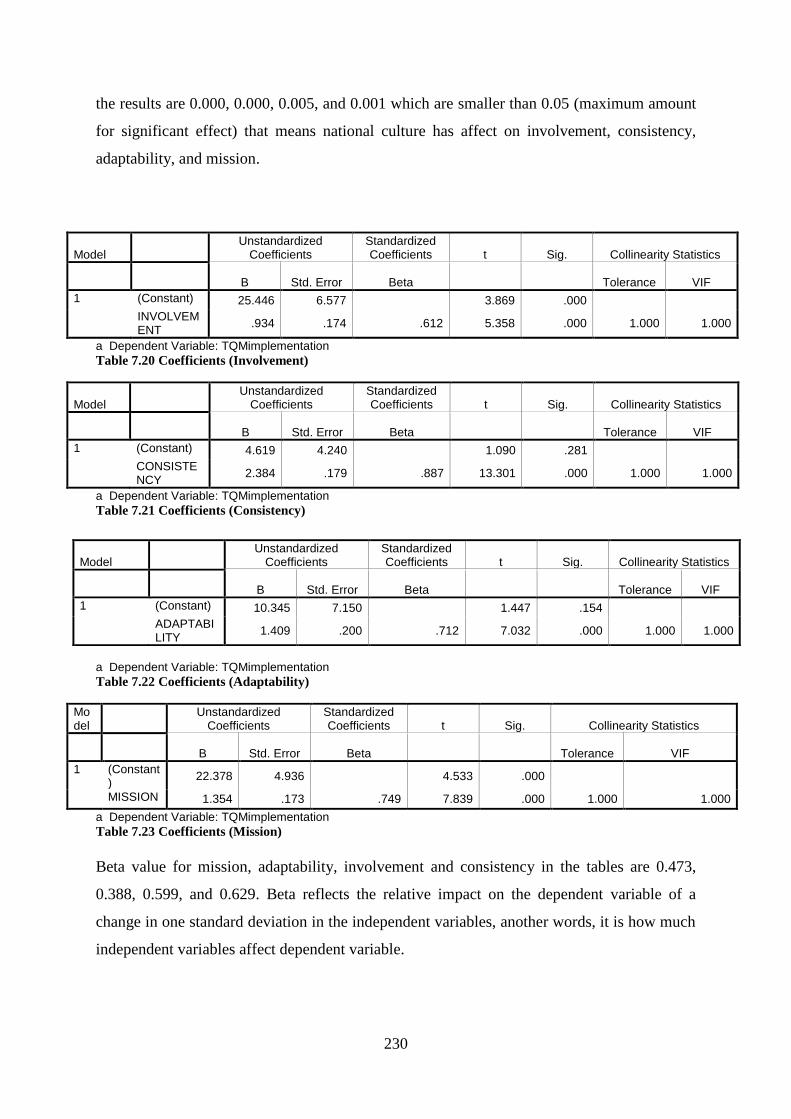
230
the results are 0.000, 0.000, 0.005, and 0.001 which are smaller than 0.05 (maximum amount
for significant effect) that means national culture has affect on involvement, consistency,
adaptability, and mission.
Model Unstandardized
Coefficients Standardized Coefficients t Sig. Collinearity Statistics
B Std. Error Beta Tolerance VIF
1 (Constant) 25.446 6.577 3.869 .000
INVOLVEMENT
.934 .174 .612 5.358 .000 1.000 1.000
a Dependent Variable: TQMimplementation
Table 7.20 Coefficients (Involvement)
Model Unstandardized
Coefficients Standardized Coefficients t Sig. Collinearity Statistics
B Std. Error Beta Tolerance VIF
1 (Constant) 4.619 4.240 1.090 .281
CONSISTENCY
2.384 .179 .887 13.301 .000 1.000 1.000
a Dependent Variable: TQMimplementation
Table 7.21 Coefficients (Consistency)
a Dependent Variable: TQMimplementation
Table 7.22 Coefficients (Adaptability)
Model
Unstandardized Coefficients
Standardized Coefficients t Sig. Collinearity Statistics
B Std. Error Beta Tolerance VIF
1 (Constant)
22.378 4.936 4.533 .000
MISSION 1.354 .173 .749 7.839 .000 1.000 1.000
a Dependent Variable: TQMimplementation
Table 7.23 Coefficients (Mission)
Beta value for mission, adaptability, involvement and consistency in the tables are 0.473,
0.388, 0.599, and 0.629. Beta reflects the relative impact on the dependent variable of a
change in one standard deviation in the independent variables, another words, it is how much
independent variables affect dependent variable.
Model Unstandardized
Coefficients Standardized Coefficients t Sig. Collinearity Statistics
B Std. Error Beta Tolerance VIF
1 (Constant) 10.345 7.150 1.447 .154
ADAPTABILITY
1.409 .200 .712 7.032 .000 1.000 1.000

231
However, as the statistical results and figure 7.2 showed, national culture has significant
effect on mission, adaptability, involvement, and consistency. The next step is to consider the
effect of organisational culture on TQM implementation.
7.10 Organisational culture as independent variable
Figure 7.3 Might organisational culture effect on TQM
The result of the regression analysis on TQM implementation as the dependent variables has
been considered.
The result from table 7.24 shows that, the regression equation more than 62% of variability of
organisational culture. That is an acceptable level for R2 for explaining variability of
organisational culture.
Model R R Square
Adjusted R
Square
Std. Error of
the Estimate
1 .791(a) .625 .617 8.70062
a Predictors: (Constant), Organisational Culture
Table 7.24 Model Summary (Organisational culture)
That is an acceptable level for R2 for explaining variability of organisational culture. Analysis
of variance (ANOVA) indicates that the model is significant at α=0.05 (Table 7.25).
Model
Sum of
Squares Df Mean Square F Sig.
1 Regression 6059.886 1 6059.886 80.051 .000(a)
Residual 3633.634 48 75.701
Total 9693.520 49
a Predictors: (Constant), Organisational Culture
b Dependent Variable: TQM implementation
Table 7.25 ANOVA (TQM Implementation)
Organisational culture TQM
Implementation
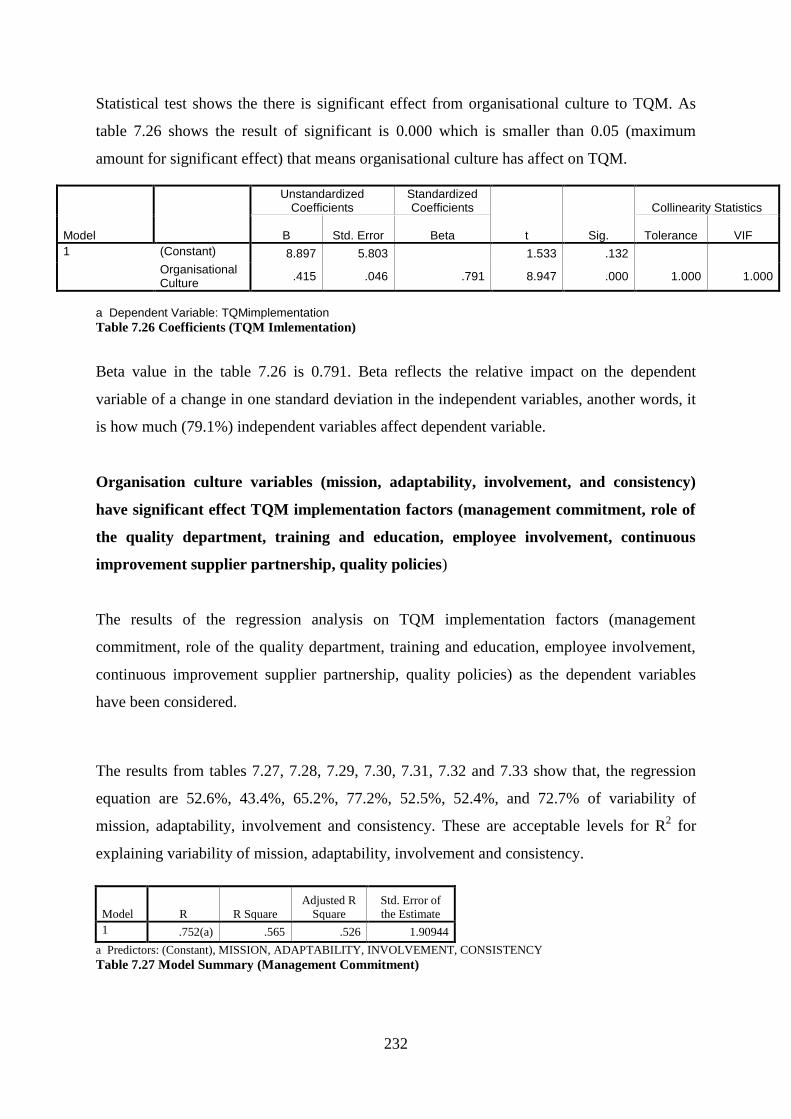
232
Statistical test shows the there is significant effect from organisational culture to TQM. As
table 7.26 shows the result of significant is 0.000 which is smaller than 0.05 (maximum
amount for significant effect) that means organisational culture has affect on TQM.
a Dependent Variable: TQMimplementation
Table 7.26 Coefficients (TQM Imlementation)
Beta value in the table 7.26 is 0.791. Beta reflects the relative impact on the dependent
variable of a change in one standard deviation in the independent variables, another words, it
is how much (79.1%) independent variables affect dependent variable.
Organisation culture variables (mission, adaptability, involvement, and consistency)
have significant effect TQM implementation factors (management commitment, role of
the quality department, training and education, employee involvement, continuous
improvement supplier partnership, quality policies)
The results of the regression analysis on TQM implementation factors (management
commitment, role of the quality department, training and education, employee involvement,
continuous improvement supplier partnership, quality policies) as the dependent variables
have been considered.
The results from tables 7.27, 7.28, 7.29, 7.30, 7.31, 7.32 and 7.33 show that, the regression
equation are 52.6%, 43.4%, 65.2%, 77.2%, 52.5%, 52.4%, and 72.7% of variability of
mission, adaptability, involvement and consistency. These are acceptable levels for R2 for
explaining variability of mission, adaptability, involvement and consistency.
Model R R Square
Adjusted R
Square
Std. Error of
the Estimate
1 .752(a) .565 .526 1.90944
a Predictors: (Constant), MISSION, ADAPTABILITY, INVOLVEMENT, CONSISTENCY
Table 7.27 Model Summary (Management Commitment)
Model
Unstandardized Coefficients
Standardized Coefficients
t Sig.
Collinearity Statistics
B Std. Error Beta Tolerance VIF
1 (Constant) 8.897 5.803 1.533 .132
OrganisationalCulture
.415 .046 .791 8.947 .000 1.000 1.000
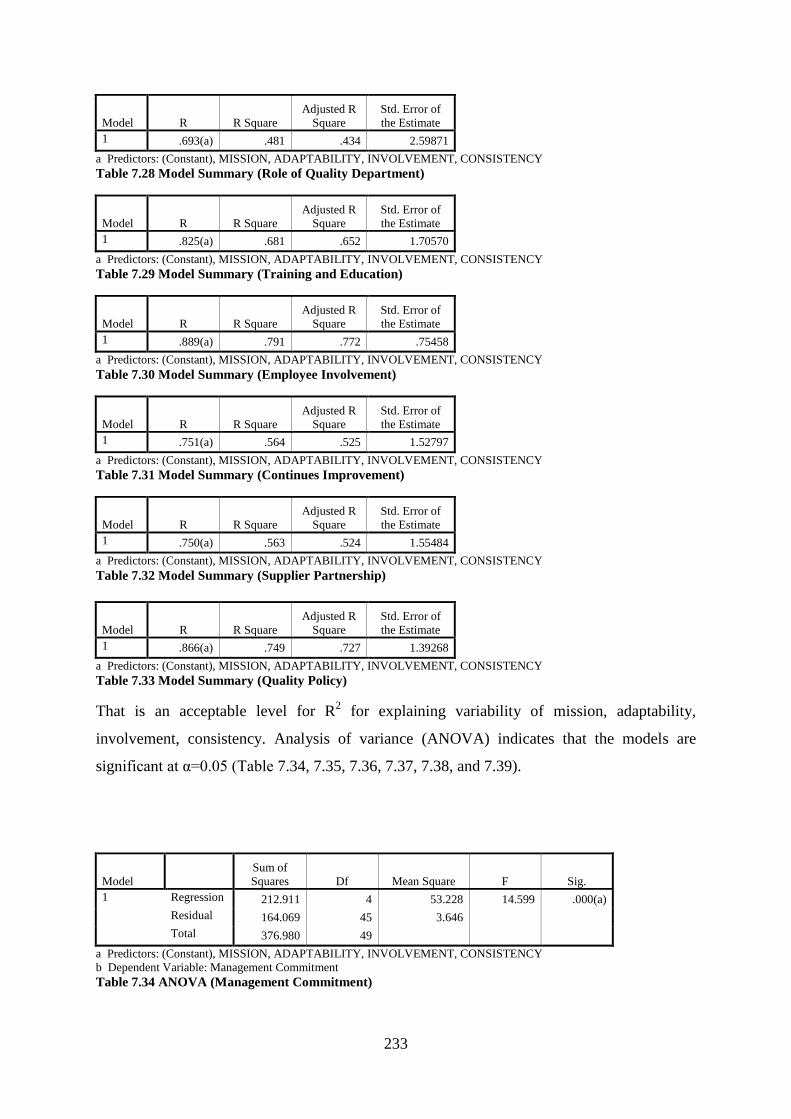
233
Model R R Square
Adjusted R
Square
Std. Error of
the Estimate
1 .693(a) .481 .434 2.59871
a Predictors: (Constant), MISSION, ADAPTABILITY, INVOLVEMENT, CONSISTENCY
Table 7.28 Model Summary (Role of Quality Department)
Model R R Square
Adjusted R
Square
Std. Error of
the Estimate
1 .825(a) .681 .652 1.70570
a Predictors: (Constant), MISSION, ADAPTABILITY, INVOLVEMENT, CONSISTENCY
Table 7.29 Model Summary (Training and Education)
Model R R Square
Adjusted R
Square
Std. Error of
the Estimate
1 .889(a) .791 .772 .75458
a Predictors: (Constant), MISSION, ADAPTABILITY, INVOLVEMENT, CONSISTENCY
Table 7.30 Model Summary (Employee Involvement)
Model R R Square
Adjusted R
Square
Std. Error of
the Estimate
1 .751(a) .564 .525 1.52797
a Predictors: (Constant), MISSION, ADAPTABILITY, INVOLVEMENT, CONSISTENCY
Table 7.31 Model Summary (Continues Improvement)
Model R R Square
Adjusted R
Square
Std. Error of
the Estimate
1 .750(a) .563 .524 1.55484
a Predictors: (Constant), MISSION, ADAPTABILITY, INVOLVEMENT, CONSISTENCY
Table 7.32 Model Summary (Supplier Partnership)
Model R R Square
Adjusted R
Square
Std. Error of
the Estimate
1 .866(a) .749 .727 1.39268
a Predictors: (Constant), MISSION, ADAPTABILITY, INVOLVEMENT, CONSISTENCY
Table 7.33 Model Summary (Quality Policy)
That is an acceptable level for R2 for explaining variability of mission, adaptability,
involvement, consistency. Analysis of variance (ANOVA) indicates that the models are
significant at α=0.05 (Table 7.34, 7.35, 7.36, 7.37, 7.38, and 7.39).
Model
Sum of
Squares Df Mean Square F Sig.
1 Regression 212.911 4 53.228 14.599 .000(a)
Residual 164.069 45 3.646
Total 376.980 49
a Predictors: (Constant), MISSION, ADAPTABILITY, INVOLVEMENT, CONSISTENCY
b Dependent Variable: Management Commitment
Table 7.34 ANOVA (Management Commitment)
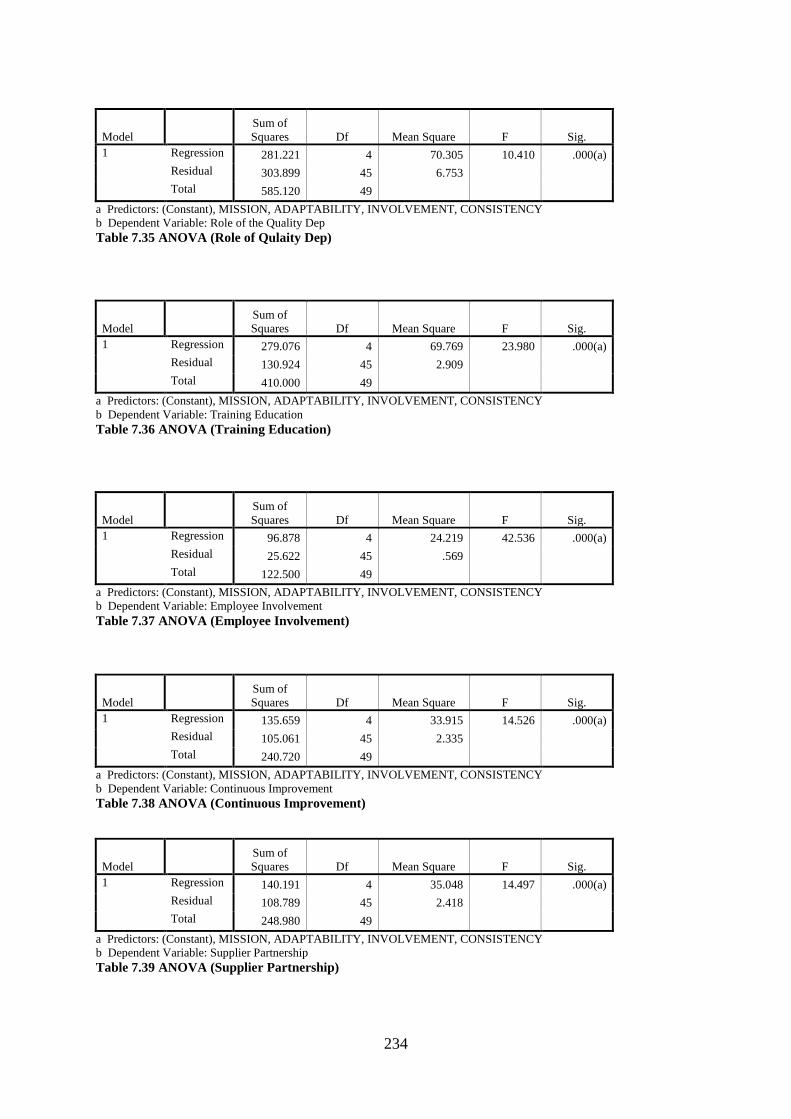
234
Model
Sum of
Squares Df Mean Square F Sig.
1 Regression 281.221 4 70.305 10.410 .000(a)
Residual 303.899 45 6.753
Total 585.120 49
a Predictors: (Constant), MISSION, ADAPTABILITY, INVOLVEMENT, CONSISTENCY
b Dependent Variable: Role of the Quality Dep
Table 7.35 ANOVA (Role of Qulaity Dep)
Model
Sum of
Squares Df Mean Square F Sig.
1 Regression 279.076 4 69.769 23.980 .000(a)
Residual 130.924 45 2.909
Total 410.000 49
a Predictors: (Constant), MISSION, ADAPTABILITY, INVOLVEMENT, CONSISTENCY
b Dependent Variable: Training Education
Table 7.36 ANOVA (Training Education)
Model
Sum of
Squares Df Mean Square F Sig.
1 Regression 96.878 4 24.219 42.536 .000(a)
Residual 25.622 45 .569
Total 122.500 49
a Predictors: (Constant), MISSION, ADAPTABILITY, INVOLVEMENT, CONSISTENCY
b Dependent Variable: Employee Involvement
Table 7.37 ANOVA (Employee Involvement)
Model
Sum of
Squares Df Mean Square F Sig.
1 Regression 135.659 4 33.915 14.526 .000(a)
Residual 105.061 45 2.335
Total 240.720 49
a Predictors: (Constant), MISSION, ADAPTABILITY, INVOLVEMENT, CONSISTENCY
b Dependent Variable: Continuous Improvement
Table 7.38 ANOVA (Continuous Improvement)
Model
Sum of
Squares Df Mean Square F Sig.
1 Regression 140.191 4 35.048 14.497 .000(a)
Residual 108.789 45 2.418
Total 248.980 49
a Predictors: (Constant), MISSION, ADAPTABILITY, INVOLVEMENT, CONSISTENCY
b Dependent Variable: Supplier Partnership
Table 7.39 ANOVA (Supplier Partnership)
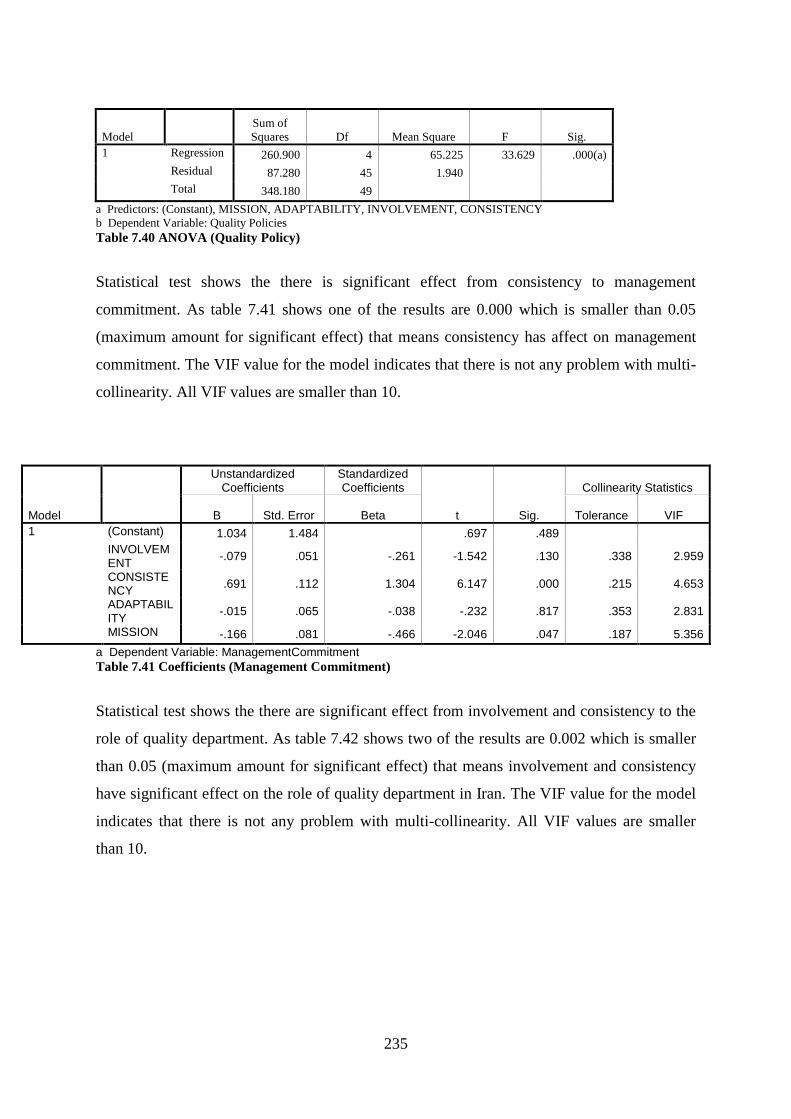
235
Model
Sum of
Squares Df Mean Square F Sig.
1 Regression 260.900 4 65.225 33.629 .000(a)
Residual 87.280 45 1.940
Total 348.180 49
a Predictors: (Constant), MISSION, ADAPTABILITY, INVOLVEMENT, CONSISTENCY
b Dependent Variable: Quality Policies
Table 7.40 ANOVA (Quality Policy)
Statistical test shows the there is significant effect from consistency to management
commitment. As table 7.41 shows one of the results are 0.000 which is smaller than 0.05
(maximum amount for significant effect) that means consistency has affect on management
commitment. The VIF value for the model indicates that there is not any problem with multi-
collinearity. All VIF values are smaller than 10.
Model
Unstandardized Coefficients
Standardized Coefficients
t Sig.
Collinearity Statistics
B Std. Error Beta Tolerance VIF
1 (Constant) 1.034 1.484 .697 .489
INVOLVEMENT
-.079 .051 -.261 -1.542 .130 .338 2.959
CONSISTENCY
.691 .112 1.304 6.147 .000 .215 4.653
ADAPTABILITY
-.015 .065 -.038 -.232 .817 .353 2.831
MISSION -.166 .081 -.466 -2.046 .047 .187 5.356
a Dependent Variable: ManagementCommitment
Table 7.41 Coefficients (Management Commitment)
Statistical test shows the there are significant effect from involvement and consistency to the
role of quality department. As table 7.42 shows two of the results are 0.002 which is smaller
than 0.05 (maximum amount for significant effect) that means involvement and consistency
have significant effect on the role of quality department in Iran. The VIF value for the model
indicates that there is not any problem with multi-collinearity. All VIF values are smaller
than 10.
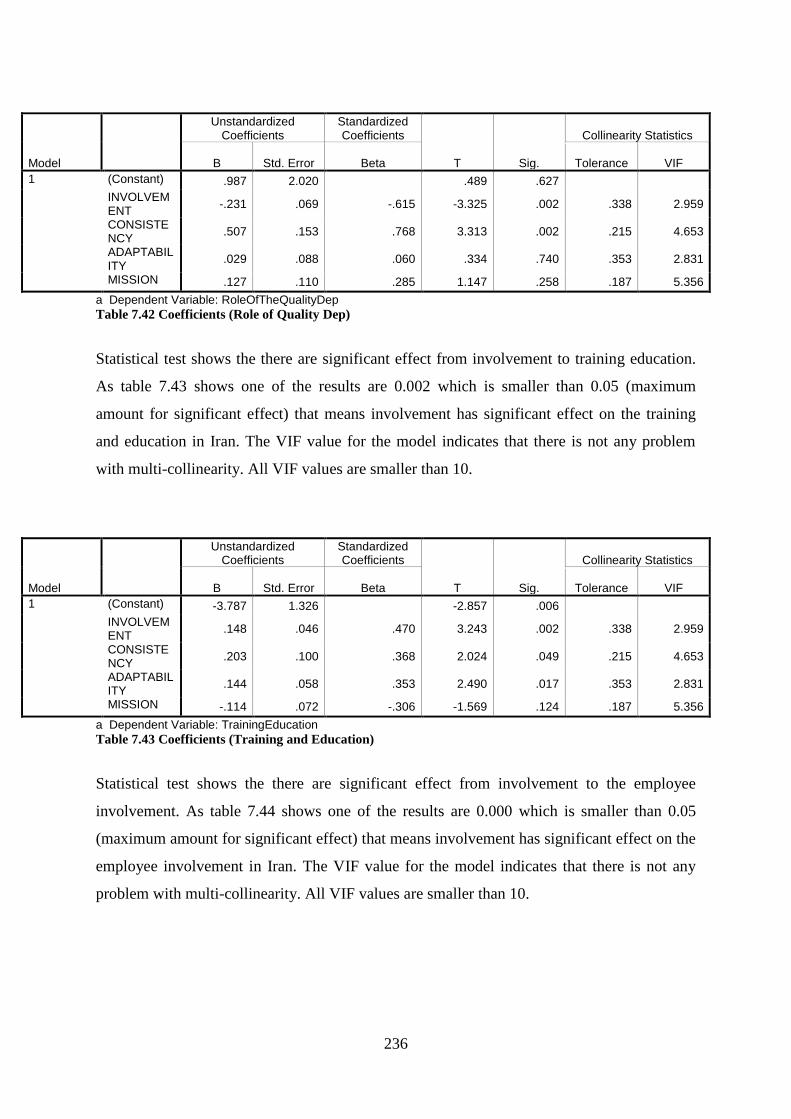
236
Model
Unstandardized Coefficients
Standardized Coefficients
T Sig.
Collinearity Statistics
B Std. Error Beta Tolerance VIF
1 (Constant) .987 2.020 .489 .627
INVOLVEMENT
-.231 .069 -.615 -3.325 .002 .338 2.959
CONSISTENCY
.507 .153 .768 3.313 .002 .215 4.653
ADAPTABILITY
.029 .088 .060 .334 .740 .353 2.831
MISSION .127 .110 .285 1.147 .258 .187 5.356
a Dependent Variable: RoleOfTheQualityDep
Table 7.42 Coefficients (Role of Quality Dep)
Statistical test shows the there are significant effect from involvement to training education.
As table 7.43 shows one of the results are 0.002 which is smaller than 0.05 (maximum
amount for significant effect) that means involvement has significant effect on the training
and education in Iran. The VIF value for the model indicates that there is not any problem
with multi-collinearity. All VIF values are smaller than 10.
Model
Unstandardized Coefficients
Standardized Coefficients
T Sig.
Collinearity Statistics
B Std. Error Beta Tolerance VIF
1 (Constant) -3.787 1.326 -2.857 .006
INVOLVEMENT
.148 .046 .470 3.243 .002 .338 2.959
CONSISTENCY
.203 .100 .368 2.024 .049 .215 4.653
ADAPTABILITY
.144 .058 .353 2.490 .017 .353 2.831
MISSION -.114 .072 -.306 -1.569 .124 .187 5.356
a Dependent Variable: TrainingEducation
Table 7.43 Coefficients (Training and Education)
Statistical test shows the there are significant effect from involvement to the employee
involvement. As table 7.44 shows one of the results are 0.000 which is smaller than 0.05
(maximum amount for significant effect) that means involvement has significant effect on the
employee involvement in Iran. The VIF value for the model indicates that there is not any
problem with multi-collinearity. All VIF values are smaller than 10.

237
Model
Unstandardized Coefficients
Standardized Coefficients
T Sig.
Collinearity Statistics
B Std. Error Beta Tolerance VIF
1 (Constant) .406 .586 .692 .492
INVOLVEMENT
.120 .020 .698 5.953 .000 .338 2.959
CONSISTENCY
.103 .044 .339 2.308 .026 .215 4.653
ADAPTABILITY
.032 .026 .145 1.261 .214 .353 2.831
MISSION -.050 .032 -.248 -1.570 .123 .187 5.356
a Dependent Variable: EmployeeInvolvement
Table 7.44 Coefficients (Employee Involvement)
Statistical test shows the there is significant effect from consistency to the continuous
improvement. As table 7.45 shows one of the results are 0.001 which is smaller than 0.05
(maximum amount for significant effect) that means consistency has significant effect on
continues improvement in Iran. The VIF value for the model indicates that there is not any
problem with multi-collinearity. All VIF values are smaller than 10.
a Dependent Variable: ContinuousImprovement
Table 7.45 Coefficients (Continues improvement)
Statistical test shows the there is significant effect from consistency to supplier partnership.
As table 7.46 shows one of the results are 0.000 which is smaller than 0.05 (maximum
amount for significant effect) that means consistency have significant effect on the supplier
partnership in Iran. The VIF value for the model indicates that there is not any problem with
multi-collinearity. All VIF values are smaller than 10.
Model
Unstandardized Coefficients
Standardized Coefficients
t Sig.
Collinearity Statistics
B Std. Error Beta Tolerance VIF
1 (Constant) -.436 1.188 -.367 .716
INVOLVEMENT
.020 .041 .083 .490 .626 .338 2.959
CONSISTENCY
.308 .090 .726 3.419 .001 .215 4.653
ADAPTABILITY
.010 .052 .032 .196 .846 .353 2.831
MISSION -.021 .065 -.075 -.331 .742 .187 5.356
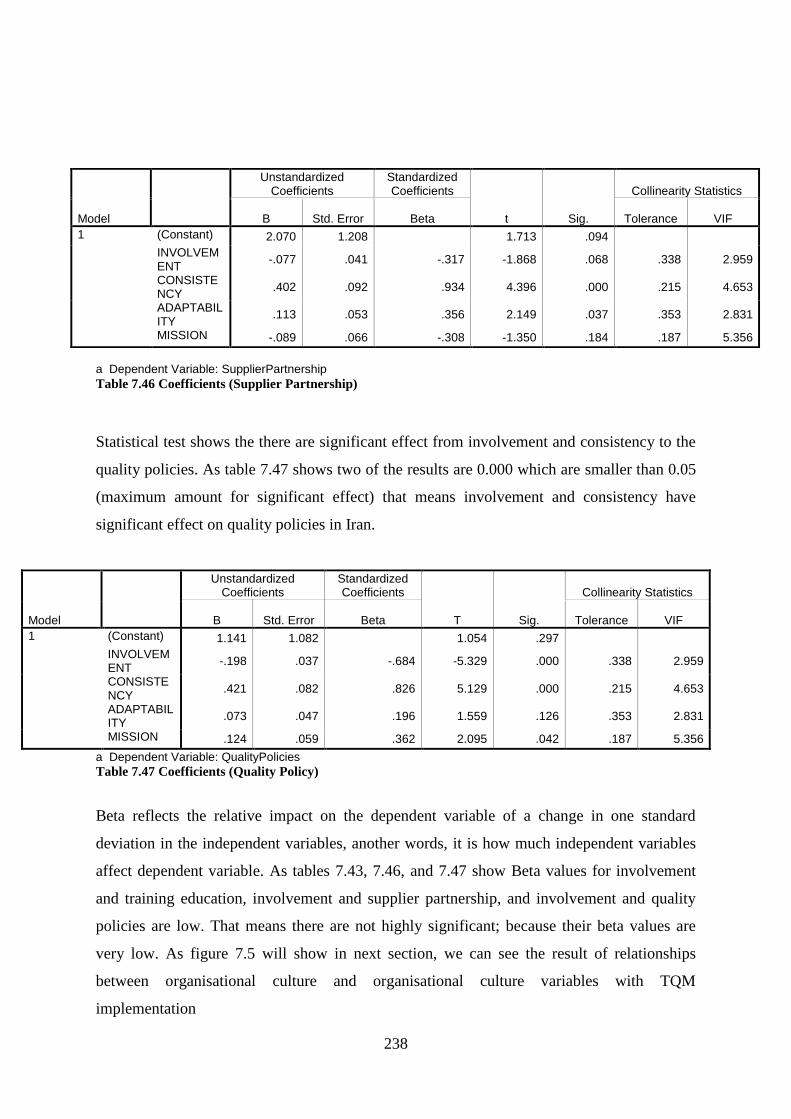
238
a Dependent Variable: SupplierPartnership
Table 7.46 Coefficients (Supplier Partnership)
Statistical test shows the there are significant effect from involvement and consistency to the
quality policies. As table 7.47 shows two of the results are 0.000 which are smaller than 0.05
(maximum amount for significant effect) that means involvement and consistency have
significant effect on quality policies in Iran.
Model
Unstandardized Coefficients
Standardized Coefficients
T Sig.
Collinearity Statistics
B Std. Error Beta Tolerance VIF
1 (Constant) 1.141 1.082 1.054 .297
INVOLVEMENT
-.198 .037 -.684 -5.329 .000 .338 2.959
CONSISTENCY
.421 .082 .826 5.129 .000 .215 4.653
ADAPTABILITY
.073 .047 .196 1.559 .126 .353 2.831
MISSION .124 .059 .362 2.095 .042 .187 5.356
a Dependent Variable: QualityPolicies
Table 7.47 Coefficients (Quality Policy)
Beta reflects the relative impact on the dependent variable of a change in one standard
deviation in the independent variables, another words, it is how much independent variables
affect dependent variable. As tables 7.43, 7.46, and 7.47 show Beta values for involvement
and training education, involvement and supplier partnership, and involvement and quality
policies are low. That means there are not highly significant; because their beta values are
very low. As figure 7.5 will show in next section, we can see the result of relationships
between organisational culture and organisational culture variables with TQM
implementation
Model
Unstandardized Coefficients
Standardized Coefficients
t Sig.
Collinearity Statistics
B Std. Error Beta Tolerance VIF
1 (Constant) 2.070 1.208 1.713 .094
INVOLVEMENT
-.077 .041 -.317 -1.868 .068 .338 2.959
CONSISTENCY
.402 .092 .934 4.396 .000 .215 4.653
ADAPTABILITY
.113 .053 .356 2.149 .037 .353 2.831
MISSION -.089 .066 -.308 -1.350 .184 .187 5.356
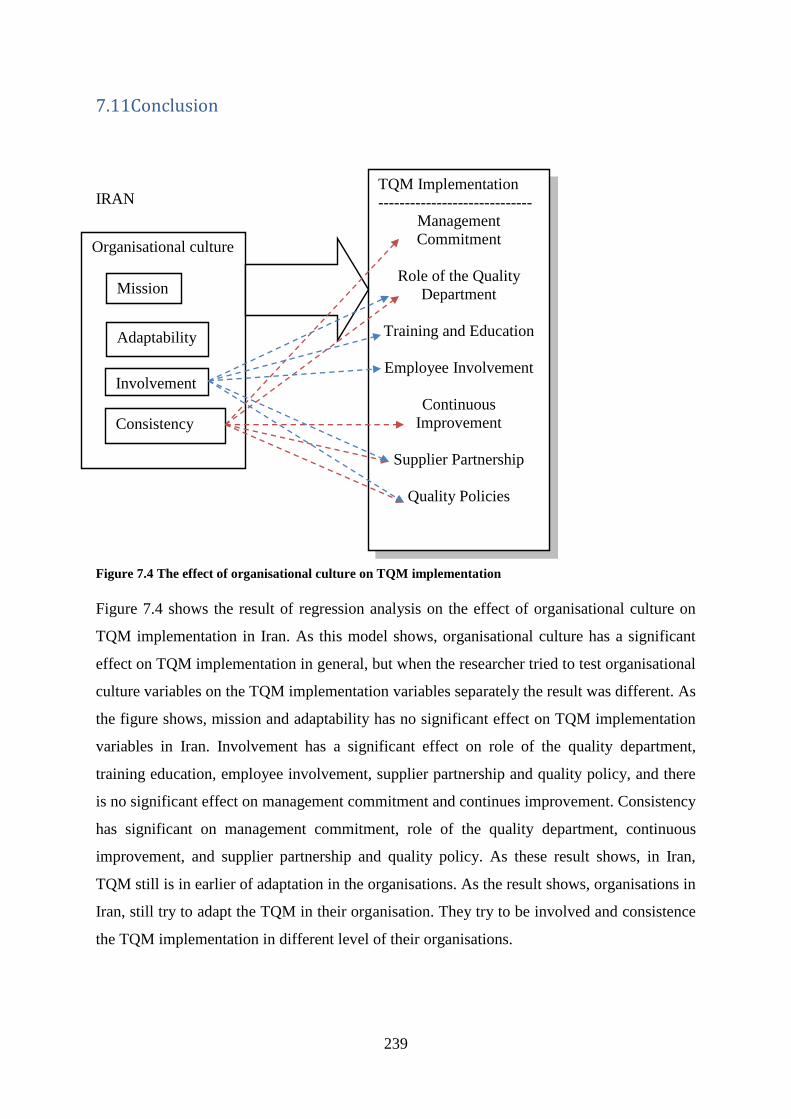
239
7.11Conclusion
IRAN
Figure 7.4 The effect of organisational culture on TQM implementation
Figure 7.4 shows the result of regression analysis on the effect of organisational culture on
TQM implementation in Iran. As this model shows, organisational culture has a significant
effect on TQM implementation in general, but when the researcher tried to test organisational
culture variables on the TQM implementation variables separately the result was different. As
the figure shows, mission and adaptability has no significant effect on TQM implementation
variables in Iran. Involvement has a significant effect on role of the quality department,
training education, employee involvement, supplier partnership and quality policy, and there
is no significant effect on management commitment and continues improvement. Consistency
has significant on management commitment, role of the quality department, continuous
improvement, and supplier partnership and quality policy. As these result shows, in Iran,
TQM still is in earlier of adaptation in the organisations. As the result shows, organisations in
Iran, still try to adapt the TQM in their organisation. They try to be involved and consistence
the TQM implementation in different level of their organisations.
Organisational culture
Mission
Adaptability
Involvement
Consistency
TQM Implementation
-----------------------------
Management
Commitment
Role of the Quality
Department
Training and Education
Employee Involvement
Continuous
Improvement
Supplier Partnership
Quality Policies
240
Chapter Eight (The UK Questionnaire Analysis)
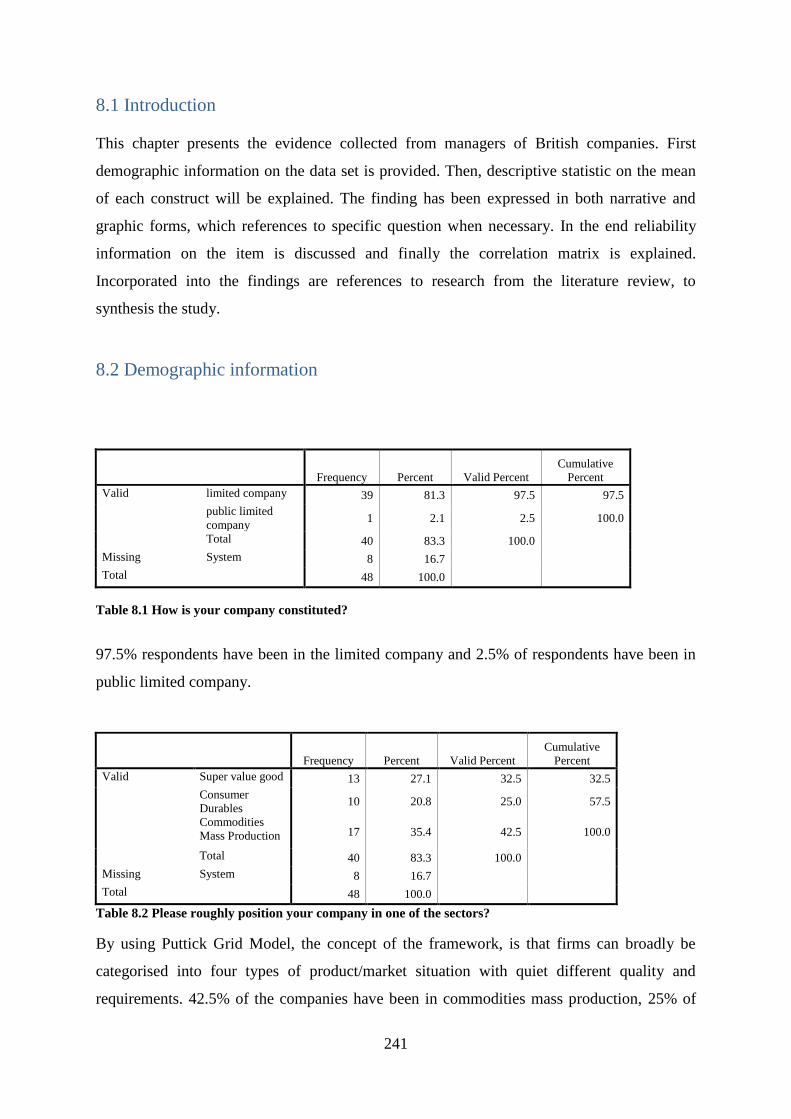
241
8.1 Introduction
This chapter presents the evidence collected from managers of British companies. First
demographic information on the data set is provided. Then, descriptive statistic on the mean
of each construct will be explained. The finding has been expressed in both narrative and
graphic forms, which references to specific question when necessary. In the end reliability
information on the item is discussed and finally the correlation matrix is explained.
Incorporated into the findings are references to research from the literature review, to
synthesis the study.
8.2 Demographic information
Frequency Percent Valid Percent
Cumulative
Percent
Valid limited company 39 81.3 97.5 97.5
public limited
company 1 2.1 2.5 100.0
Total 40 83.3 100.0
Missing System 8 16.7
Total 48 100.0
Table 8.1 How is your company constituted?
97.5% respondents have been in the limited company and 2.5% of respondents have been in
public limited company.
Frequency Percent Valid Percent
Cumulative
Percent
Valid Super value good 13 27.1 32.5 32.5
Consumer
Durables 10 20.8 25.0 57.5
Commodities
Mass Production 17 35.4 42.5 100.0
Total 40 83.3 100.0
Missing System 8 16.7
Total 48 100.0
Table 8.2 Please roughly position your company in one of the sectors?
By using Puttick Grid Model, the concept of the framework, is that firms can broadly be
categorised into four types of product/market situation with quiet different quality and
requirements. 42.5% of the companies have been in commodities mass production, 25% of
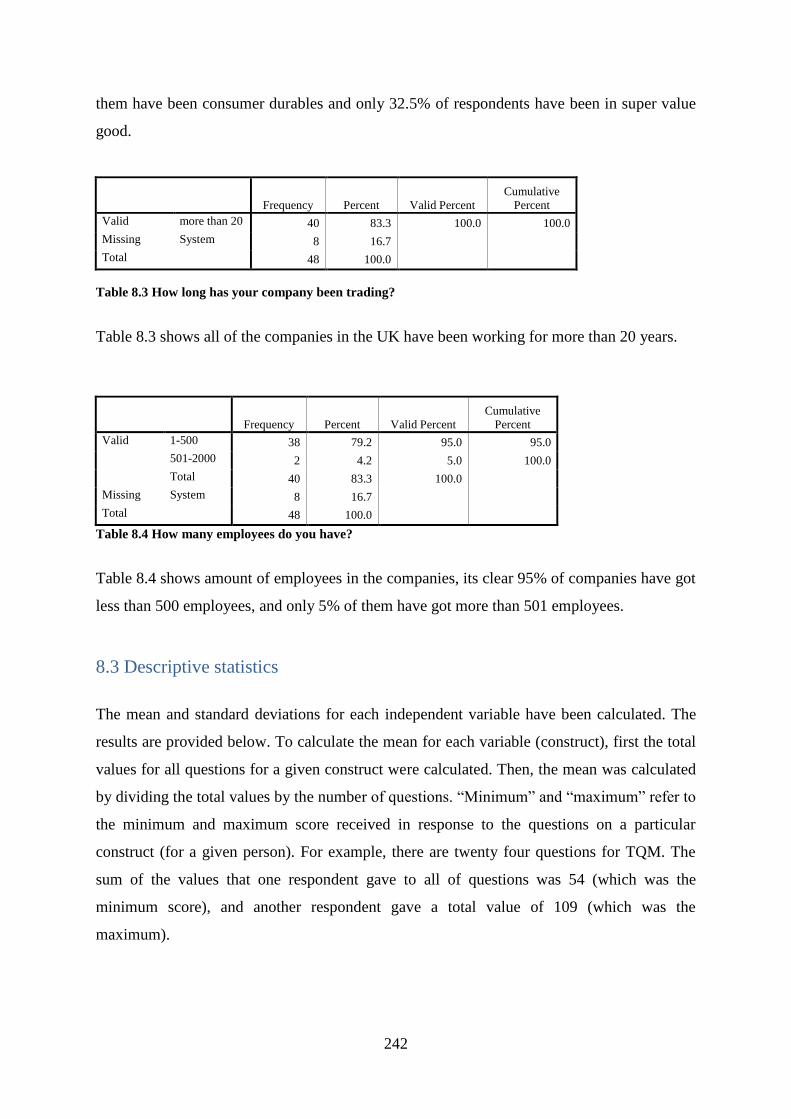
242
them have been consumer durables and only 32.5% of respondents have been in super value
good.
Frequency Percent Valid Percent
Cumulative
Percent
Valid more than 20 40 83.3 100.0 100.0
Missing System 8 16.7
Total 48 100.0
Table 8.3 How long has your company been trading?
Table 8.3 shows all of the companies in the UK have been working for more than 20 years.
Frequency Percent Valid Percent
Cumulative
Percent
Valid 1-500 38 79.2 95.0 95.0
501-2000 2 4.2 5.0 100.0
Total 40 83.3 100.0
Missing System 8 16.7
Total 48 100.0
Table 8.4 How many employees do you have?
Table 8.4 shows amount of employees in the companies, its clear 95% of companies have got
less than 500 employees, and only 5% of them have got more than 501 employees.
8.3 Descriptive statistics
The mean and standard deviations for each independent variable have been calculated. The
results are provided below. To calculate the mean for each variable (construct), first the total
values for all questions for a given construct were calculated. Then, the mean was calculated
by dividing the total values by the number of questions. “Minimum” and “maximum” refer to
the minimum and maximum score received in response to the questions on a particular
construct (for a given person). For example, there are twenty four questions for TQM. The
sum of the values that one respondent gave to all of questions was 54 (which was the
minimum score), and another respondent gave a total value of 109 (which was the
maximum).
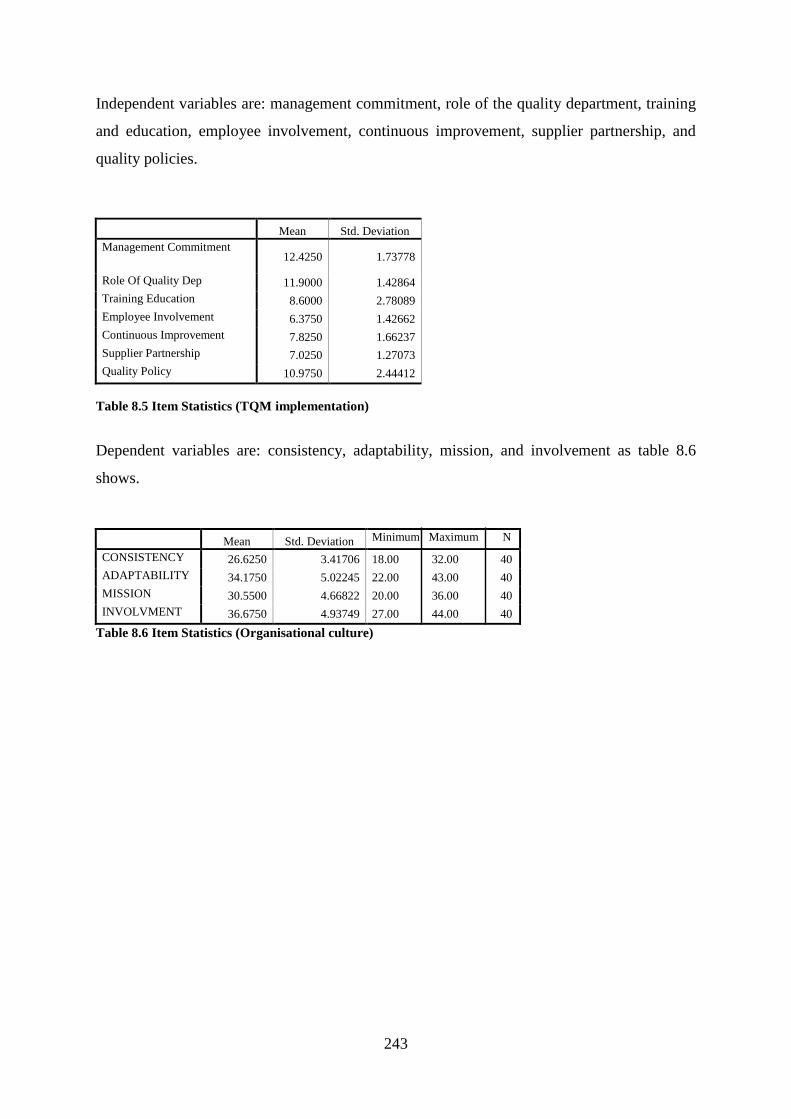
243
Independent variables are: management commitment, role of the quality department, training
and education, employee involvement, continuous improvement, supplier partnership, and
quality policies.
Mean Std. Deviation
Management Commitment 12.4250 1.73778
Role Of Quality Dep 11.9000 1.42864
Training Education 8.6000 2.78089
Employee Involvement 6.3750 1.42662
Continuous Improvement 7.8250 1.66237
Supplier Partnership 7.0250 1.27073
Quality Policy 10.9750 2.44412
Table 8.5 Item Statistics (TQM implementation)
Dependent variables are: consistency, adaptability, mission, and involvement as table 8.6
shows.
Mean Std. Deviation Minimum Maximum N
CONSISTENCY 26.6250 3.41706 18.00 32.00 40
ADAPTABILITY 34.1750 5.02245 22.00 43.00 40
MISSION 30.5500 4.66822 20.00 36.00 40
INVOLVMENT 36.6750 4.93749 27.00 44.00 40
Table 8.6 Item Statistics (Organisational culture)
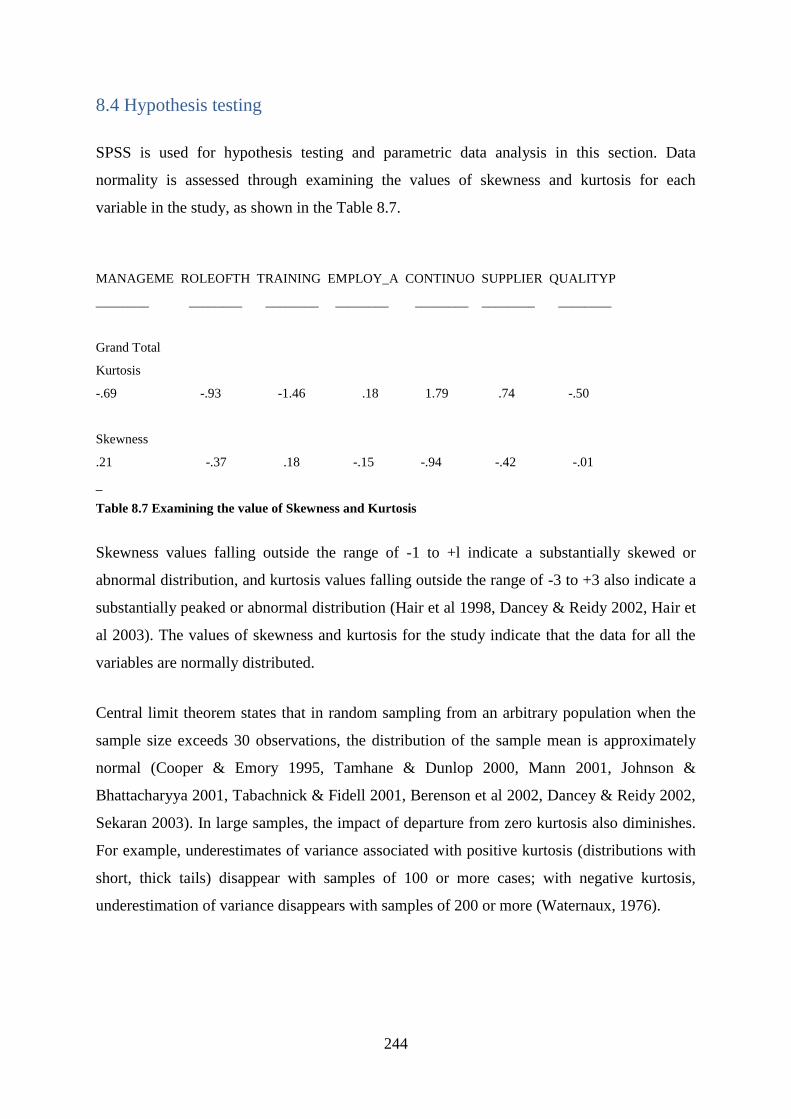
244
8.4 Hypothesis testing
SPSS is used for hypothesis testing and parametric data analysis in this section. Data
normality is assessed through examining the values of skewness and kurtosis for each
variable in the study, as shown in the Table 8.7.
MANAGEME ROLEOFTH TRAINING EMPLOY_A CONTINUO SUPPLIER QUALITYP
________ ________ ________ ________ ________ ________ ________
Grand Total
Kurtosis
-.69 -.93 -1.46 .18 1.79 .74 -.50
Skewness
.21 -.37 .18 -.15 -.94 -.42 -.01
_
Table 8.7 Examining the value of Skewness and Kurtosis
Skewness values falling outside the range of -1 to +l indicate a substantially skewed or
abnormal distribution, and kurtosis values falling outside the range of -3 to +3 also indicate a
substantially peaked or abnormal distribution (Hair et al 1998, Dancey & Reidy 2002, Hair et
al 2003). The values of skewness and kurtosis for the study indicate that the data for all the
variables are normally distributed.
Central limit theorem states that in random sampling from an arbitrary population when the
sample size exceeds 30 observations, the distribution of the sample mean is approximately
normal (Cooper & Emory 1995, Tamhane & Dunlop 2000, Mann 2001, Johnson &
Bhattacharyya 2001, Tabachnick & Fidell 2001, Berenson et al 2002, Dancey & Reidy 2002,
Sekaran 2003). In large samples, the impact of departure from zero kurtosis also diminishes.
For example, underestimates of variance associated with positive kurtosis (distributions with
short, thick tails) disappear with samples of 100 or more cases; with negative kurtosis,
underestimation of variance disappears with samples of 200 or more (Waternaux, 1976).

245
8.5 Correlation between variables
As has been explaned in chapter 7 (Section 7.5) they show that multicollinearity leads to
inaccurate estimates of coefficients and standard errors as well as inference errors, but they
also consider that the problem should not be viewed in separation, and that a high R2 and
large sample size can solve the problems caused by multicollinearity. The multivariate
correlation matrix of the study indicates no multicollinearity (R =0.80 or higher) among study
variables (Hair et al 1998, Tabachnick & Fidell 2001), as Table 8.8 indicates.
The direction of relationships among variables is another issue that should be considered in
analysing the correlations between variables. A positive correlation indicates that the
direction of the relationship is positive (if one increases, the other one increases). A negative
correlation indicates an inverse relationship between variables (if one increases the other one
increase).
Management
Commitm
ent
Role Of
Quality
Dep
Training
Education
Employee
Involveme
nt
Continuous
Improvement
Supplier
Partnershi
p
Quality
Policy
Management Commitment
1 .503(*) -.128 .399(*) .312 .518(*) .413(*)
.013 .430 .011 .139 .010 .018
40 40 40 40 40 40
Role Of Quality Dep
1 .532(*) .082 .198 .411(*) .630(*)
.019 .616 .222 .028 .017
40 40 40 40 40
Training
Education
1 .175 .314 .010 .569(*)
.000 .002 .005 .010
40 40 40 40
Employee
Involvement
1 .603(*) .405(*) .562(*)
.018 .014 .013
40 40 40
Continuous
Improvement
1 .221 .415(*)
.171 .019
40 40
Supplier
Partnership
1 .430(*)
.016
40
Quality Policy
1
** Correlation is significant at the 0.01 level (2-tailed)
* Correlation is significant at the 0.05 level (2-tailed).
Table 8.8 Correlation
246
Multicollinearity is also assessed through individual tolerance and VIF values for each
regression analysis conducted later. Tolerance and VIF measures indicate the degree to which
each independent variable is explained by the other independent variables. Tolerance is the
amount of variability of the selected independent variable not explained by the other
independent variables. Thus very small tolerance values (and thus large VIF values because
VIF = 1 / tolerance) denote high collinearity. A common cut-off threshold is a tolerance value
of 0.l0, which corresponds to a VIF value above 10 (Hair et al 1998).
Based on the correlation matrix (table 8.8), the highest correlation between variable is
between role of the quality department and quality policies (r=0.613). This was expected for
British companies, as quality department is important element to apply quality policies in
organisations. The second highest correlation is between employee involvement and
continues improvement (r=603). This element shows the role of employee in implementation
and opearation of TQM. Finally, the third highest correlation is between training education
and quality policies (r=0.559).
8.6 Regression Analysis
Regression analysis was divided in to the two different parts; first part was to find effect of
national culture on organisational culture and organisational culture variable, in order to find
this relationship, researcher made a series of regression analysises. Second part was to find
effect of organisational culture on TQM implementation. In order to determine the effect of
organisational culture, involvement (empowerment, team orientation, capability
development), consistency (core value, coordination and integration), adaptability (creating
change, customer focus, and organisational learning), mission (strategic direction, goal
objective, and vision) on TQM implementation (management commitment, role of the quality
department, training and education, employee involvement, continuous improvement,
supplier partnership, and quality policies) results, a series of regression analyses were
performed. The regression analysis determines which variables (independent variables)
explain variability in the outcome (independent variables), how much variability in the
dependent variables is explained by the independent variables, and which variables are
significant (over other variables) in explaining the variability of the dependent variable.
247
In multiple regression analysis “Enter” regression method is used because simultaneous
effects of all independent variables are required. In the standard, or simultaneous cause effect
analysis, all independent variables enter into the regression equation at once; each one is
assessed as if it had entered the regression after all other independent variables had entered.
Each independent variable is evaluated in terms of what it adds to prediction of the dependent
variable that is different from the predictability afforded by all the other independent
variables (Tabachnick & Fidell 2001). Standardized beta coefficients are used in regression
equations because they eliminate the problem of dealing with different units of measurement,
thus reflecting the relative impact on the dependent variable of a change in one standard
deviation in either variable. Therefore, standardized beta coefficients determine which
variable has the strongest impact (Berenson et al 2002, Dancey & Reidy 2002). However,
beta coefficients are used as a guide to the relative importance of the independent variables
included in the equation (not in an absolute sense), and only over the range of values for
which sample data actually exists (Hair et al 1998). Adjusted R2 index, rather than R2, is used
to determine the amount of explained variance of the dependent variable because it takes into
account sample size and the number of independent variables (Tabachnick & Fidell 2001). In
addition, adjusted R2 is more realistic to generalise to the population (Dancey & Reidy 2002).
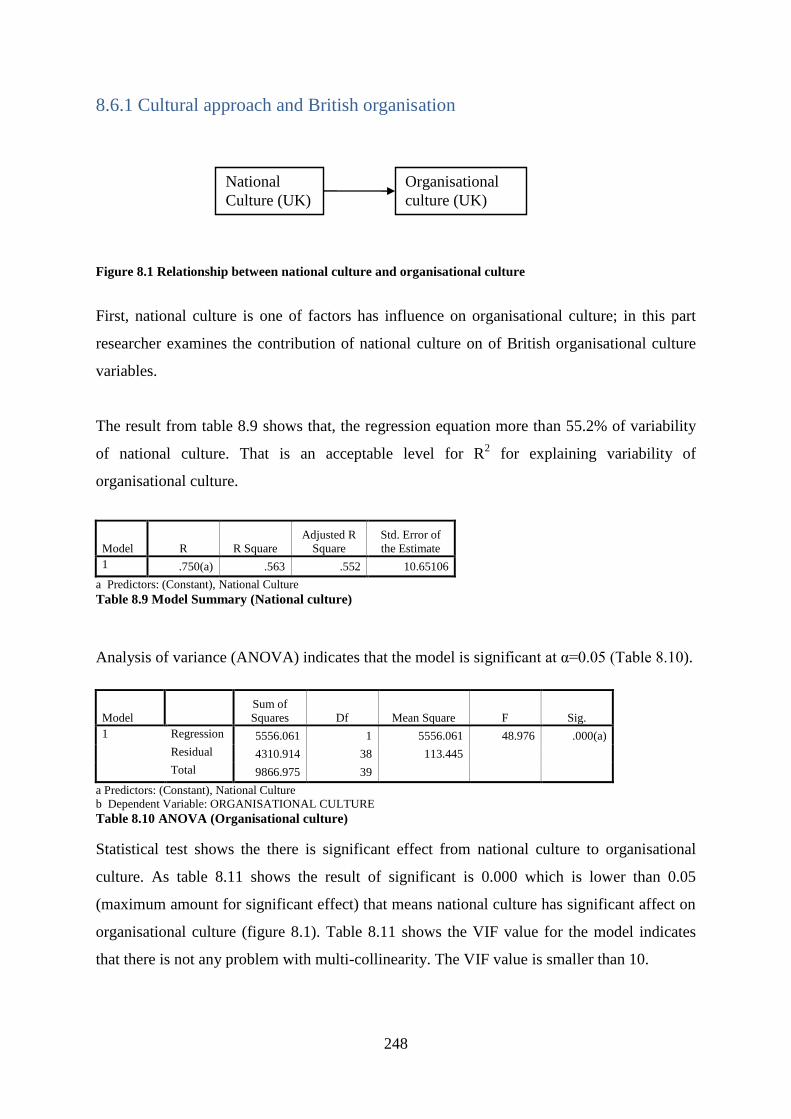
248
8.6.1 Cultural approach and British organisation
Figure 8.1 Relationship between national culture and organisational culture
First, national culture is one of factors has influence on organisational culture; in this part
researcher examines the contribution of national culture on of British organisational culture
variables.
The result from table 8.9 shows that, the regression equation more than 55.2% of variability
of national culture. That is an acceptable level for R2 for explaining variability of
organisational culture.
Model R R Square
Adjusted R
Square
Std. Error of
the Estimate
1 .750(a) .563 .552 10.65106
a Predictors: (Constant), National Culture
Table 8.9 Model Summary (National culture)
Analysis of variance (ANOVA) indicates that the model is significant at α=0.05 (Table 8.10).
Model
Sum of
Squares Df Mean Square F Sig.
1 Regression 5556.061 1 5556.061 48.976 .000(a)
Residual 4310.914 38 113.445
Total 9866.975 39
a Predictors: (Constant), National Culture
b Dependent Variable: ORGANISATIONAL CULTURE
Table 8.10 ANOVA (Organisational culture)
Statistical test shows the there is significant effect from national culture to organisational
culture. As table 8.11 shows the result of significant is 0.000 which is lower than 0.05
(maximum amount for significant effect) that means national culture has significant affect on
organisational culture (figure 8.1). Table 8.11 shows the VIF value for the model indicates
that there is not any problem with multi-collinearity. The VIF value is smaller than 10.
National
Culture (UK)
Organisational
culture (UK)
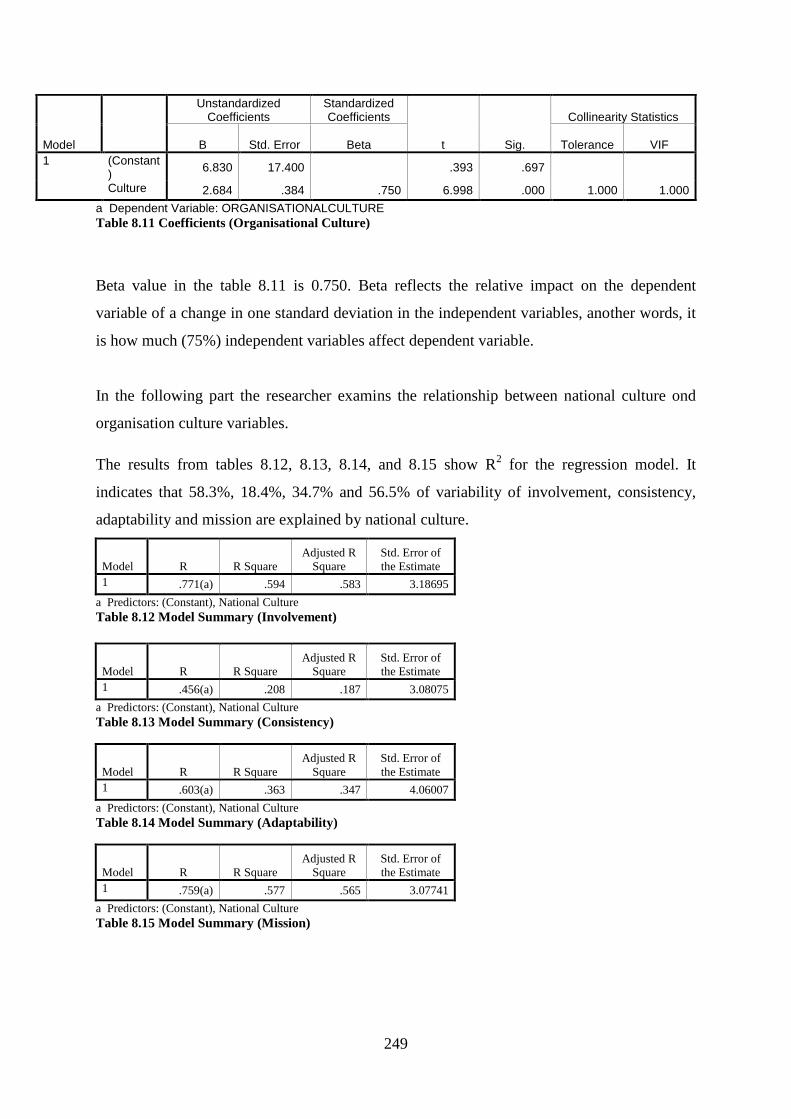
249
Model
Unstandardized Coefficients
Standardized Coefficients
t Sig.
Collinearity Statistics
B Std. Error Beta Tolerance VIF
1 (Constant)
6.830 17.400 .393 .697
Culture 2.684 .384 .750 6.998 .000 1.000 1.000
a Dependent Variable: ORGANISATIONALCULTURE
Table 8.11 Coefficients (Organisational Culture)
Beta value in the table 8.11 is 0.750. Beta reflects the relative impact on the dependent
variable of a change in one standard deviation in the independent variables, another words, it
is how much (75%) independent variables affect dependent variable.
In the following part the researcher examins the relationship between national culture ond
organisation culture variables.
The results from tables 8.12, 8.13, 8.14, and 8.15 show R2 for the regression model. It
indicates that 58.3%, 18.4%, 34.7% and 56.5% of variability of involvement, consistency,
adaptability and mission are explained by national culture.
Model R R Square
Adjusted R
Square
Std. Error of
the Estimate
1 .771(a) .594 .583 3.18695
a Predictors: (Constant), National Culture
Table 8.12 Model Summary (Involvement)
Model R R Square
Adjusted R
Square
Std. Error of
the Estimate
1 .456(a) .208 .187 3.08075
a Predictors: (Constant), National Culture
Table 8.13 Model Summary (Consistency)
Model R R Square
Adjusted R
Square
Std. Error of
the Estimate
1 .603(a) .363 .347 4.06007
a Predictors: (Constant), National Culture
Table 8.14 Model Summary (Adaptability)
Model R R Square
Adjusted R
Square
Std. Error of
the Estimate
1 .759(a) .577 .565 3.07741
a Predictors: (Constant), National Culture
Table 8.15 Model Summary (Mission)

250
Tables 8.16, 8.17, 8.18 and 8.19 show the significance of the regression model. According to
the F-value in the tables, the regressions are significant (Table 8.16 P-value=0.000, 8.17 P-
value=0.003, 8.18 P-value=0.000, 8.19 P-value=0.000).
Model
Sum of
Squares Df Mean Square F Sig.
1 Regression 564.822 1 564.822 55.611 .000(a)
Residual 385.953 38 10.157
Total 950.775 39
a Predictors: (Constant), National Culture
b Dependent Variable: INVOLVMENT
Table 8.16 ANOVA (Involvement)
Model
Sum of
Squares Df Mean Square F Sig.
1 Regression 94.715 1 94.715 9.979 .003(a)
Residual 360.660 38 9.491
Total 455.375 39
a Predictors: (Constant), National Culture
b Dependent Variable: CONSISTENCY
Table 8.17 ANOVA (Consistency)
Model
Sum of
Squares Df Mean Square F Sig.
1 Regression 357.376 1 357.376 21.680 .000(a)
Residual 626.399 38 16.484
Total 983.775 39
a Predictors: (Constant), National Culture
b Dependent Variable: ADAPTABILITY
Table 8.18 ANOVA (Adaptability)
Model
Sum of
Squares df Mean Square F Sig.
1 Regression 490.022 1 490.022 51.742 .000(a)
Residual 359.878 38 9.470
Total 849.900 39
a Predictors: (Constant), National Culture
b Dependent Variable: MISSION
Table 8.19 ANOVA (Mission)
Statistical test shows the there is significant effect from national culture to mission,
adaptability, involvement and consistency. As table 8.20, 8.21, 8.22, and 8.23 show four of
the results are 0.000, 0.003, 0.000, and 0.000 which are smaller than 0.05 (maximum amount
for significant effect) that means national culture has affect on involvement, consistency,
adaptability, and mission. The VIF value for the model indicates that there is not any problem
with multi-collinearity. All VIF values are smaller than 10.
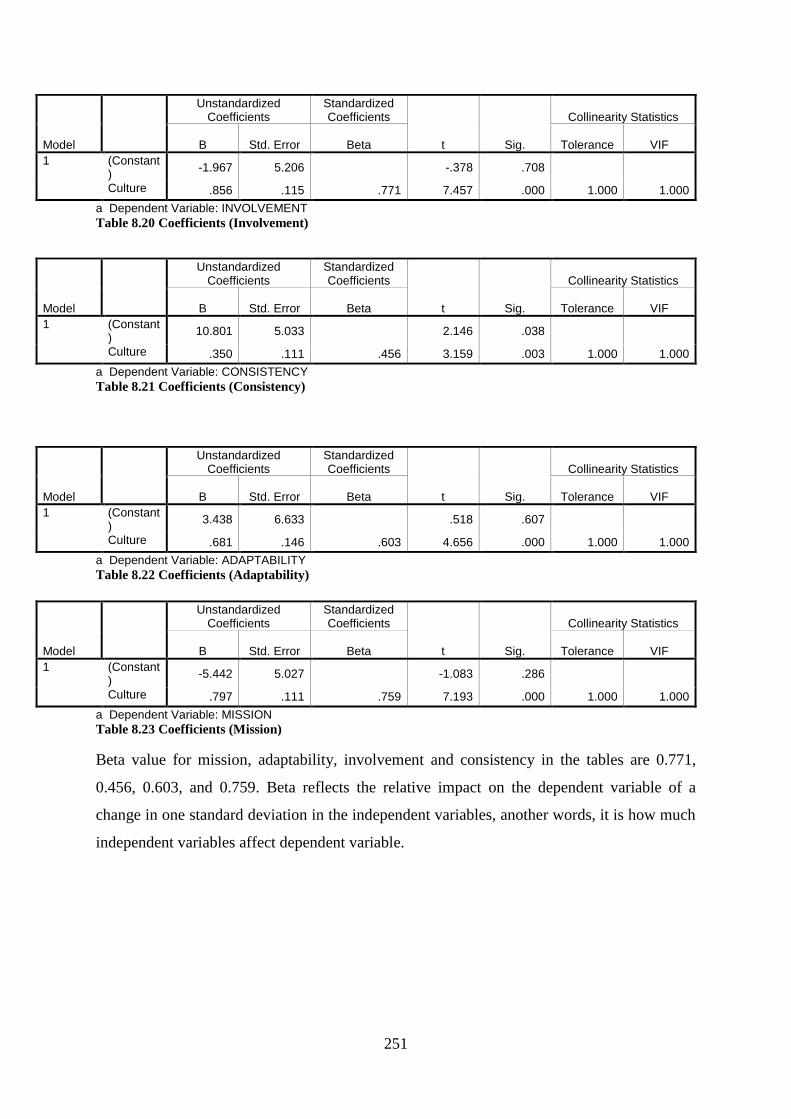
251
Model
Unstandardized Coefficients
Standardized Coefficients
t Sig.
Collinearity Statistics
B Std. Error Beta Tolerance VIF
1 (Constant)
-1.967 5.206 -.378 .708
Culture .856 .115 .771 7.457 .000 1.000 1.000
a Dependent Variable: INVOLVEMENT
Table 8.20 Coefficients (Involvement)
Model
Unstandardized Coefficients
Standardized Coefficients
t Sig.
Collinearity Statistics
B Std. Error Beta Tolerance VIF
1 (Constant)
10.801 5.033 2.146 .038
Culture .350 .111 .456 3.159 .003 1.000 1.000
a Dependent Variable: CONSISTENCY
Table 8.21 Coefficients (Consistency)
Model
Unstandardized Coefficients
Standardized Coefficients
t Sig.
Collinearity Statistics
B Std. Error Beta Tolerance VIF
1 (Constant)
3.438 6.633 .518 .607
Culture .681 .146 .603 4.656 .000 1.000 1.000
a Dependent Variable: ADAPTABILITY
Table 8.22 Coefficients (Adaptability)
Model
Unstandardized Coefficients
Standardized Coefficients
t Sig.
Collinearity Statistics
B Std. Error Beta Tolerance VIF
1 (Constant)
-5.442 5.027 -1.083 .286
Culture .797 .111 .759 7.193 .000 1.000 1.000
a Dependent Variable: MISSION
Table 8.23 Coefficients (Mission)
Beta value for mission, adaptability, involvement and consistency in the tables are 0.771,
0.456, 0.603, and 0.759. Beta reflects the relative impact on the dependent variable of a
change in one standard deviation in the independent variables, another words, it is how much
independent variables affect dependent variable.
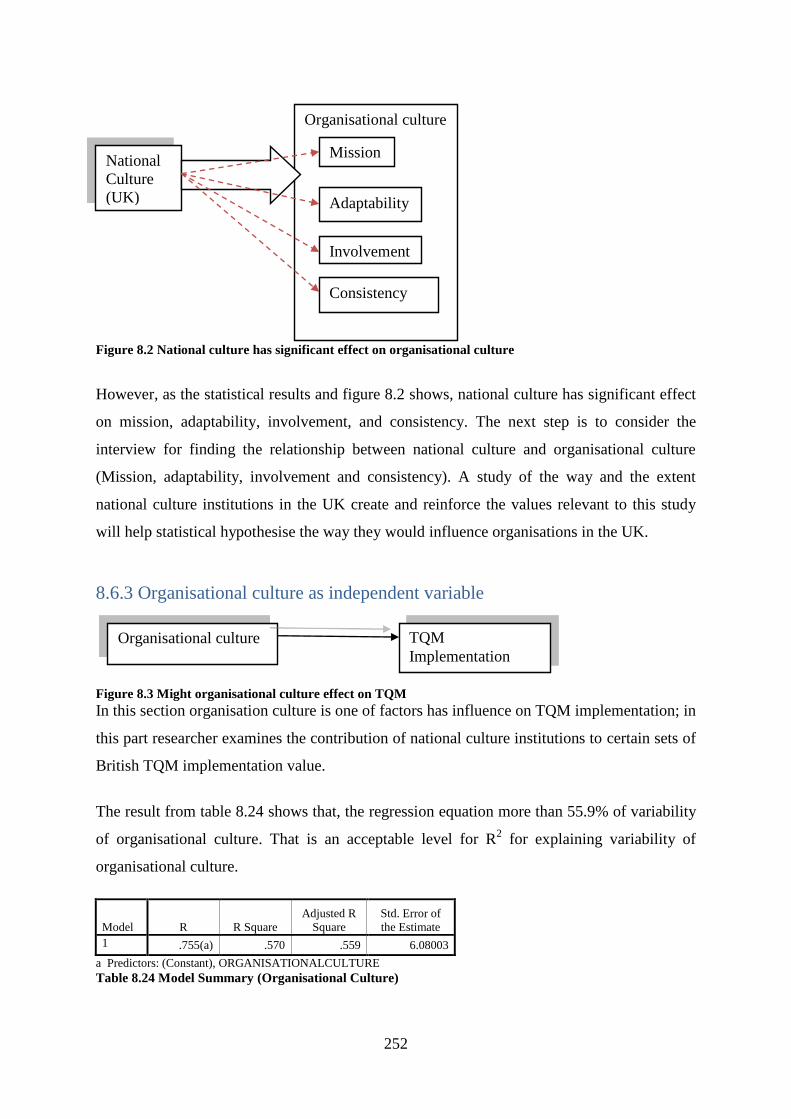
252
Figure 8.2 National culture has significant effect on organisational culture
However, as the statistical results and figure 8.2 shows, national culture has significant effect
on mission, adaptability, involvement, and consistency. The next step is to consider the
interview for finding the relationship between national culture and organisational culture
(Mission, adaptability, involvement and consistency). A study of the way and the extent
national culture institutions in the UK create and reinforce the values relevant to this study
will help statistical hypothesise the way they would influence organisations in the UK.
8.6.3 Organisational culture as independent variable
Figure 8.3 Might organisational culture effect on TQM
In this section organisation culture is one of factors has influence on TQM implementation; in
this part researcher examines the contribution of national culture institutions to certain sets of
British TQM implementation value.
The result from table 8.24 shows that, the regression equation more than 55.9% of variability
of organisational culture. That is an acceptable level for R2 for explaining variability of
organisational culture.
Model R R Square
Adjusted R
Square
Std. Error of
the Estimate
1 .755(a) .570 .559 6.08003
a Predictors: (Constant), ORGANISATIONALCULTURE
Table 8.24 Model Summary (Organisational Culture)
Organisational culture TQM
Implementation
National
Culture
(UK)
Organisational culture
Mission
Adaptability
Involvement
Consistency
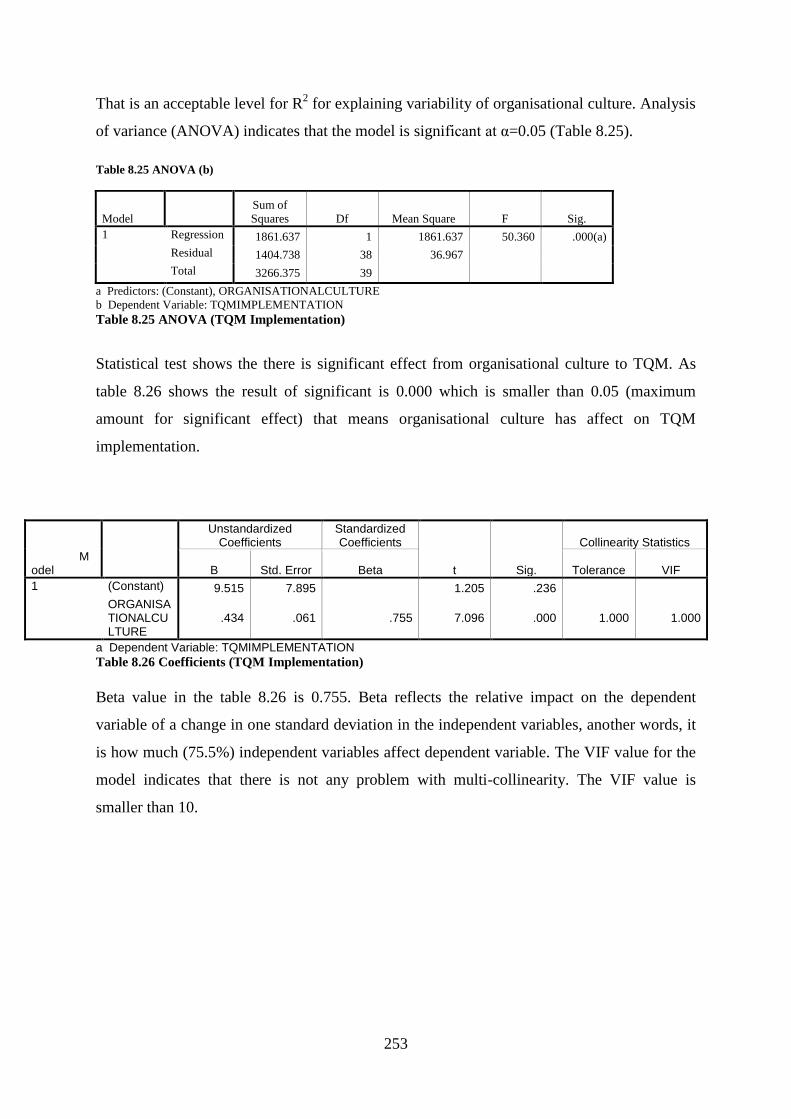
253
That is an acceptable level for R2 for explaining variability of organisational culture. Analysis
of variance (ANOVA) indicates that the model is significant at α=0.05 (Table 8.25).
Table 8.25 ANOVA (b)
Model
Sum of
Squares Df Mean Square F Sig.
1 Regression 1861.637 1 1861.637 50.360 .000(a)
Residual 1404.738 38 36.967
Total 3266.375 39
a Predictors: (Constant), ORGANISATIONALCULTURE
b Dependent Variable: TQMIMPLEMENTATION
Table 8.25 ANOVA (TQM Implementation)
Statistical test shows the there is significant effect from organisational culture to TQM. As
table 8.26 shows the result of significant is 0.000 which is smaller than 0.05 (maximum
amount for significant effect) that means organisational culture has affect on TQM
implementation.
Model
Unstandardized Coefficients
Standardized Coefficients
t Sig.
Collinearity Statistics
B Std. Error Beta Tolerance VIF
1 (Constant) 9.515 7.895 1.205 .236
ORGANISATIONALCULTURE
.434 .061 .755 7.096 .000 1.000 1.000
a Dependent Variable: TQMIMPLEMENTATION
Table 8.26 Coefficients (TQM Implementation)
Beta value in the table 8.26 is 0.755. Beta reflects the relative impact on the dependent
variable of a change in one standard deviation in the independent variables, another words, it
is how much (75.5%) independent variables affect dependent variable. The VIF value for the
model indicates that there is not any problem with multi-collinearity. The VIF value is
smaller than 10.
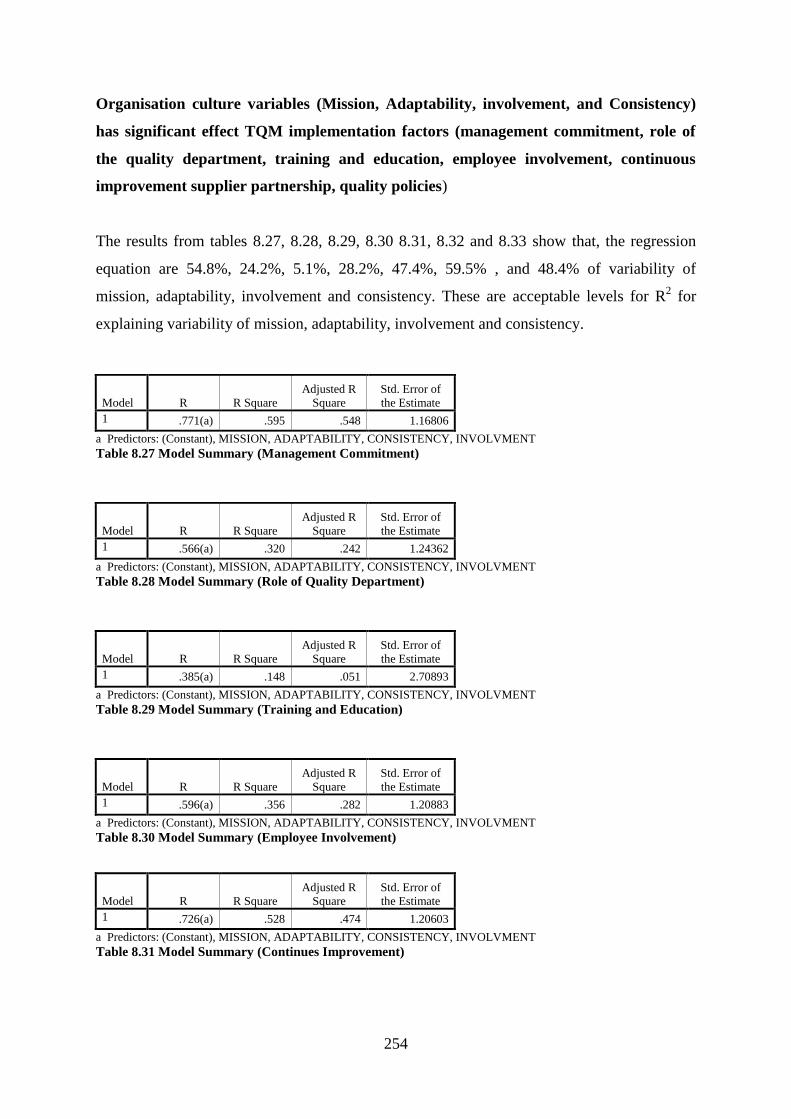
254
Organisation culture variables (Mission, Adaptability, involvement, and Consistency)
has significant effect TQM implementation factors (management commitment, role of
the quality department, training and education, employee involvement, continuous
improvement supplier partnership, quality policies)
The results from tables 8.27, 8.28, 8.29, 8.30 8.31, 8.32 and 8.33 show that, the regression
equation are 54.8%, 24.2%, 5.1%, 28.2%, 47.4%, 59.5% , and 48.4% of variability of
mission, adaptability, involvement and consistency. These are acceptable levels for R2 for
explaining variability of mission, adaptability, involvement and consistency.
Model R R Square
Adjusted R
Square
Std. Error of
the Estimate
1 .771(a) .595 .548 1.16806
a Predictors: (Constant), MISSION, ADAPTABILITY, CONSISTENCY, INVOLVMENT
Table 8.27 Model Summary (Management Commitment)
Model R R Square
Adjusted R
Square
Std. Error of
the Estimate
1 .566(a) .320 .242 1.24362
a Predictors: (Constant), MISSION, ADAPTABILITY, CONSISTENCY, INVOLVMENT
Table 8.28 Model Summary (Role of Quality Department)
Model R R Square
Adjusted R
Square
Std. Error of
the Estimate
1 .385(a) .148 .051 2.70893
a Predictors: (Constant), MISSION, ADAPTABILITY, CONSISTENCY, INVOLVMENT
Table 8.29 Model Summary (Training and Education)
Model R R Square
Adjusted R
Square
Std. Error of
the Estimate
1 .596(a) .356 .282 1.20883
a Predictors: (Constant), MISSION, ADAPTABILITY, CONSISTENCY, INVOLVMENT
Table 8.30 Model Summary (Employee Involvement)
Model R R Square
Adjusted R
Square
Std. Error of
the Estimate
1 .726(a) .528 .474 1.20603
a Predictors: (Constant), MISSION, ADAPTABILITY, CONSISTENCY, INVOLVMENT
Table 8.31 Model Summary (Continues Improvement)
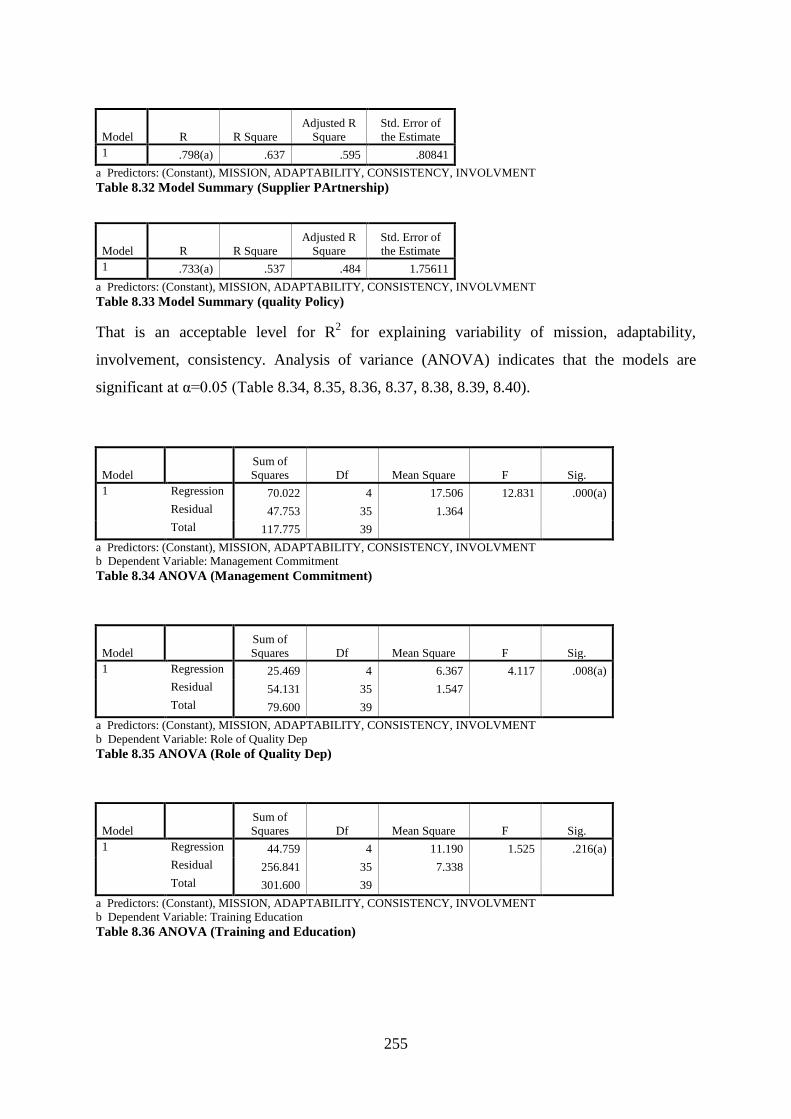
255
Model R R Square
Adjusted R
Square
Std. Error of
the Estimate
1 .798(a) .637 .595 .80841
a Predictors: (Constant), MISSION, ADAPTABILITY, CONSISTENCY, INVOLVMENT
Table 8.32 Model Summary (Supplier PArtnership)
Model R R Square
Adjusted R
Square
Std. Error of
the Estimate
1 .733(a) .537 .484 1.75611
a Predictors: (Constant), MISSION, ADAPTABILITY, CONSISTENCY, INVOLVMENT
Table 8.33 Model Summary (quality Policy)
That is an acceptable level for R2 for explaining variability of mission, adaptability,
involvement, consistency. Analysis of variance (ANOVA) indicates that the models are
significant at α=0.05 (Table 8.34, 8.35, 8.36, 8.37, 8.38, 8.39, 8.40).
Model
Sum of
Squares Df Mean Square F Sig.
1 Regression 70.022 4 17.506 12.831 .000(a)
Residual 47.753 35 1.364
Total 117.775 39
a Predictors: (Constant), MISSION, ADAPTABILITY, CONSISTENCY, INVOLVMENT
b Dependent Variable: Management Commitment
Table 8.34 ANOVA (Management Commitment)
Model
Sum of
Squares Df Mean Square F Sig.
1 Regression 25.469 4 6.367 4.117 .008(a)
Residual 54.131 35 1.547
Total 79.600 39
a Predictors: (Constant), MISSION, ADAPTABILITY, CONSISTENCY, INVOLVMENT
b Dependent Variable: Role of Quality Dep
Table 8.35 ANOVA (Role of Quality Dep)
Model
Sum of
Squares Df Mean Square F Sig.
1 Regression 44.759 4 11.190 1.525 .216(a)
Residual 256.841 35 7.338
Total 301.600 39
a Predictors: (Constant), MISSION, ADAPTABILITY, CONSISTENCY, INVOLVMENT
b Dependent Variable: Training Education
Table 8.36 ANOVA (Training and Education)
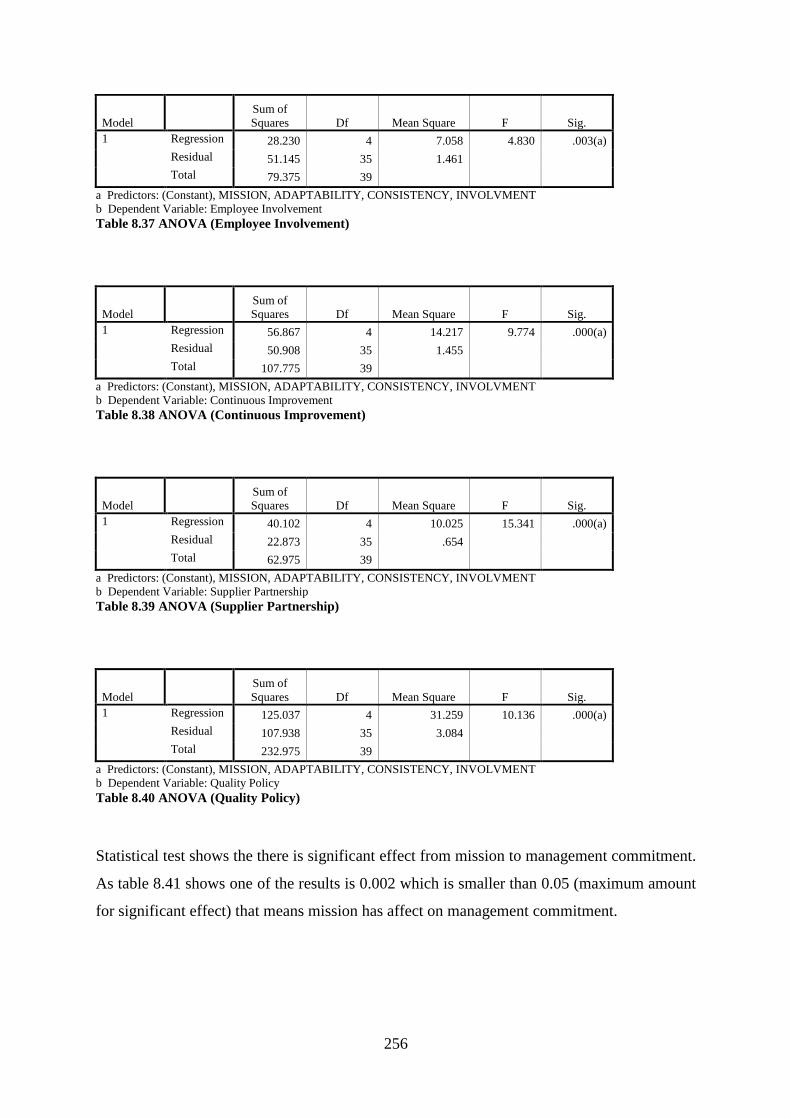
256
Model
Sum of
Squares Df Mean Square F Sig.
1 Regression 28.230 4 7.058 4.830 .003(a)
Residual 51.145 35 1.461
Total 79.375 39
a Predictors: (Constant), MISSION, ADAPTABILITY, CONSISTENCY, INVOLVMENT
b Dependent Variable: Employee Involvement
Table 8.37 ANOVA (Employee Involvement)
Model
Sum of
Squares Df Mean Square F Sig.
1 Regression 56.867 4 14.217 9.774 .000(a)
Residual 50.908 35 1.455
Total 107.775 39
a Predictors: (Constant), MISSION, ADAPTABILITY, CONSISTENCY, INVOLVMENT
b Dependent Variable: Continuous Improvement
Table 8.38 ANOVA (Continuous Improvement)
Model
Sum of
Squares Df Mean Square F Sig.
1 Regression 40.102 4 10.025 15.341 .000(a)
Residual 22.873 35 .654
Total 62.975 39
a Predictors: (Constant), MISSION, ADAPTABILITY, CONSISTENCY, INVOLVMENT
b Dependent Variable: Supplier Partnership
Table 8.39 ANOVA (Supplier Partnership)
Model
Sum of
Squares Df Mean Square F Sig.
1 Regression 125.037 4 31.259 10.136 .000(a)
Residual 107.938 35 3.084
Total 232.975 39
a Predictors: (Constant), MISSION, ADAPTABILITY, CONSISTENCY, INVOLVMENT
b Dependent Variable: Quality Policy
Table 8.40 ANOVA (Quality Policy)
Statistical test shows the there is significant effect from mission to management commitment.
As table 8.41 shows one of the results is 0.002 which is smaller than 0.05 (maximum amount
for significant effect) that means mission has affect on management commitment.
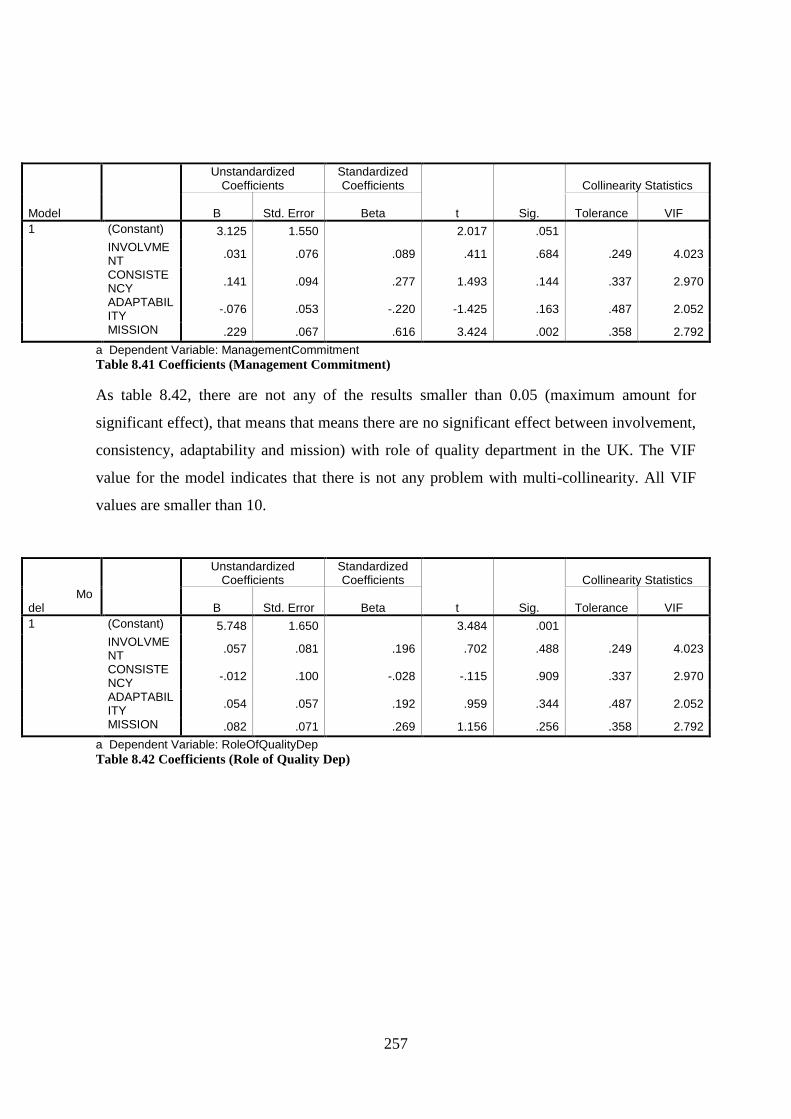
257
Model
Unstandardized Coefficients
Standardized Coefficients
t Sig.
Collinearity Statistics
B Std. Error Beta Tolerance VIF
1 (Constant) 3.125 1.550 2.017 .051
INVOLVMENT
.031 .076 .089 .411 .684 .249 4.023
CONSISTENCY
.141 .094 .277 1.493 .144 .337 2.970
ADAPTABILITY
-.076 .053 -.220 -1.425 .163 .487 2.052
MISSION .229 .067 .616 3.424 .002 .358 2.792
a Dependent Variable: ManagementCommitment
Table 8.41 Coefficients (Management Commitment)
As table 8.42, there are not any of the results smaller than 0.05 (maximum amount for
significant effect), that means that means there are no significant effect between involvement,
consistency, adaptability and mission) with role of quality department in the UK. The VIF
value for the model indicates that there is not any problem with multi-collinearity. All VIF
values are smaller than 10.
Model
Unstandardized Coefficients
Standardized Coefficients
t Sig.
Collinearity Statistics
B Std. Error Beta Tolerance VIF
1 (Constant) 5.748 1.650 3.484 .001
INVOLVMENT
.057 .081 .196 .702 .488 .249 4.023
CONSISTENCY
-.012 .100 -.028 -.115 .909 .337 2.970
ADAPTABILITY
.054 .057 .192 .959 .344 .487 2.052
MISSION .082 .071 .269 1.156 .256 .358 2.792
a Dependent Variable: RoleOfQualityDep
Table 8.42 Coefficients (Role of Quality Dep)
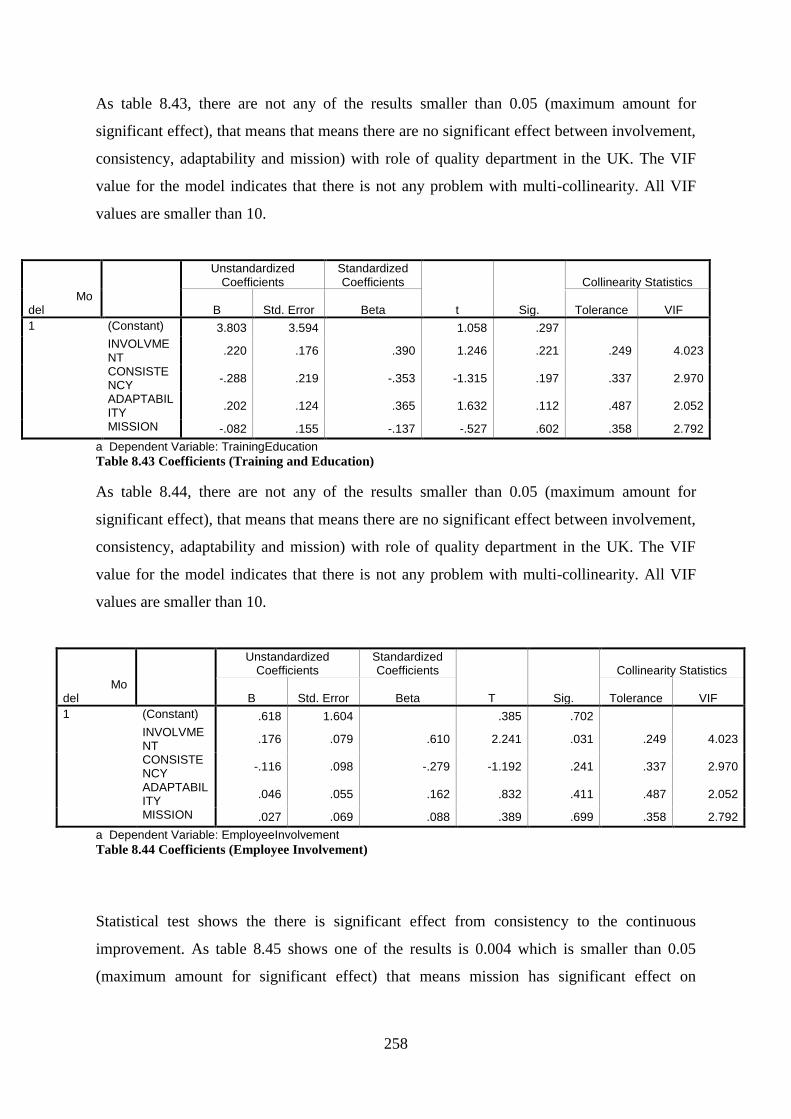
258
As table 8.43, there are not any of the results smaller than 0.05 (maximum amount for
significant effect), that means that means there are no significant effect between involvement,
consistency, adaptability and mission) with role of quality department in the UK. The VIF
value for the model indicates that there is not any problem with multi-collinearity. All VIF
values are smaller than 10.
Model
Unstandardized Coefficients
Standardized Coefficients
t Sig.
Collinearity Statistics
B Std. Error Beta Tolerance VIF
1 (Constant) 3.803 3.594 1.058 .297
INVOLVMENT
.220 .176 .390 1.246 .221 .249 4.023
CONSISTENCY
-.288 .219 -.353 -1.315 .197 .337 2.970
ADAPTABILITY
.202 .124 .365 1.632 .112 .487 2.052
MISSION -.082 .155 -.137 -.527 .602 .358 2.792
a Dependent Variable: TrainingEducation
Table 8.43 Coefficients (Training and Education)
As table 8.44, there are not any of the results smaller than 0.05 (maximum amount for
significant effect), that means that means there are no significant effect between involvement,
consistency, adaptability and mission) with role of quality department in the UK. The VIF
value for the model indicates that there is not any problem with multi-collinearity. All VIF
values are smaller than 10.
Model
Unstandardized Coefficients
Standardized Coefficients
T Sig.
Collinearity Statistics
B Std. Error Beta Tolerance VIF
1 (Constant) .618 1.604 .385 .702
INVOLVMENT
.176 .079 .610 2.241 .031 .249 4.023
CONSISTENCY
-.116 .098 -.279 -1.192 .241 .337 2.970
ADAPTABILITY
.046 .055 .162 .832 .411 .487 2.052
MISSION .027 .069 .088 .389 .699 .358 2.792
a Dependent Variable: EmployeeInvolvement
Table 8.44 Coefficients (Employee Involvement)
Statistical test shows the there is significant effect from consistency to the continuous
improvement. As table 8.45 shows one of the results is 0.004 which is smaller than 0.05
(maximum amount for significant effect) that means mission has significant effect on
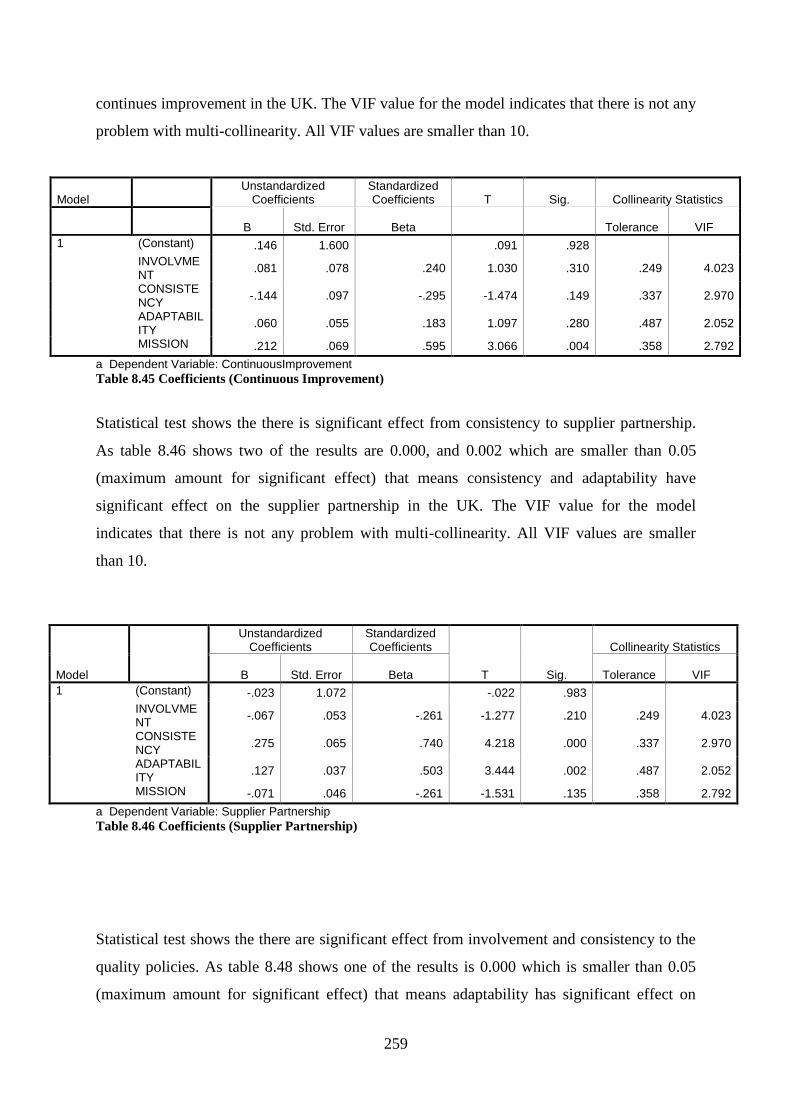
259
continues improvement in the UK. The VIF value for the model indicates that there is not any
problem with multi-collinearity. All VIF values are smaller than 10.
Model Unstandardized
Coefficients Standardized Coefficients T Sig. Collinearity Statistics
B Std. Error Beta Tolerance VIF
1 (Constant) .146 1.600 .091 .928
INVOLVMENT
.081 .078 .240 1.030 .310 .249 4.023
CONSISTENCY
-.144 .097 -.295 -1.474 .149 .337 2.970
ADAPTABILITY
.060 .055 .183 1.097 .280 .487 2.052
MISSION .212 .069 .595 3.066 .004 .358 2.792
a Dependent Variable: ContinuousImprovement
Table 8.45 Coefficients (Continuous Improvement)
Statistical test shows the there is significant effect from consistency to supplier partnership.
As table 8.46 shows two of the results are 0.000, and 0.002 which are smaller than 0.05
(maximum amount for significant effect) that means consistency and adaptability have
significant effect on the supplier partnership in the UK. The VIF value for the model
indicates that there is not any problem with multi-collinearity. All VIF values are smaller
than 10.
Model
Unstandardized Coefficients
Standardized Coefficients
T Sig.
Collinearity Statistics
B Std. Error Beta Tolerance VIF
1 (Constant) -.023 1.072 -.022 .983
INVOLVMENT
-.067 .053 -.261 -1.277 .210 .249 4.023
CONSISTENCY
.275 .065 .740 4.218 .000 .337 2.970
ADAPTABILITY
.127 .037 .503 3.444 .002 .487 2.052
MISSION -.071 .046 -.261 -1.531 .135 .358 2.792
a Dependent Variable: Supplier Partnership
Table 8.46 Coefficients (Supplier Partnership)
Statistical test shows the there are significant effect from involvement and consistency to the
quality policies. As table 8.48 shows one of the results is 0.000 which is smaller than 0.05
(maximum amount for significant effect) that means adaptability has significant effect on
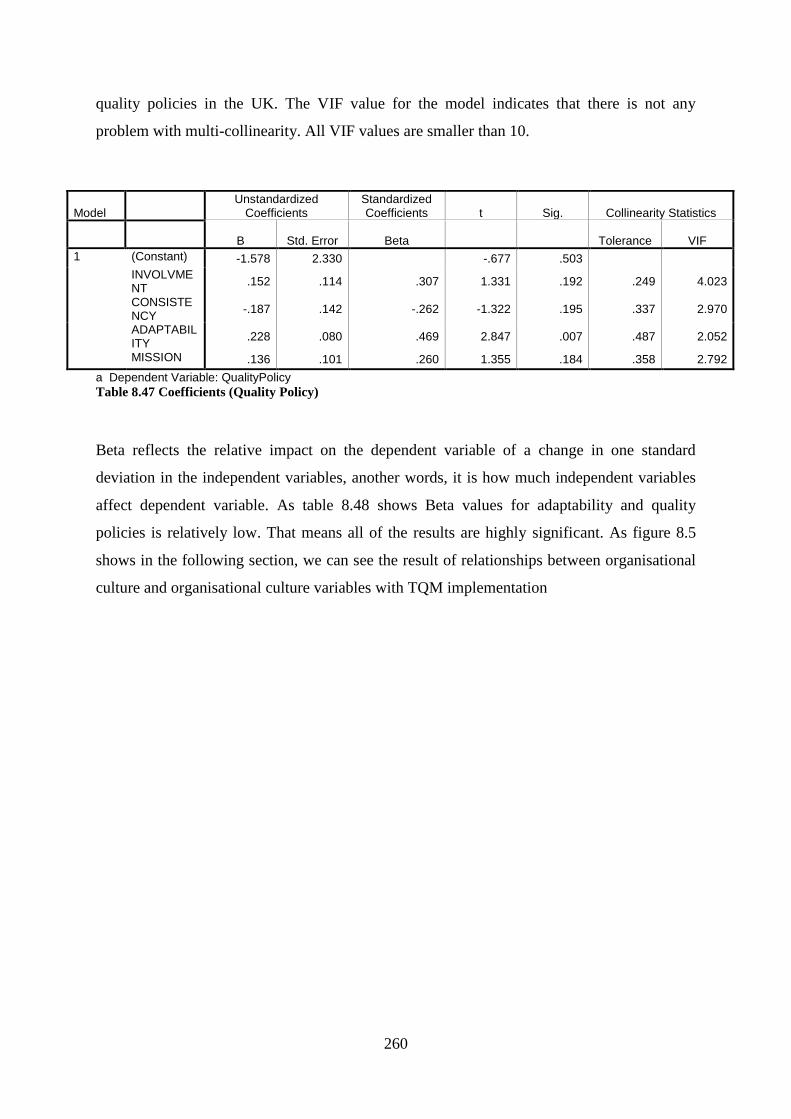
260
quality policies in the UK. The VIF value for the model indicates that there is not any
problem with multi-collinearity. All VIF values are smaller than 10.
Model Unstandardized
Coefficients Standardized Coefficients t Sig. Collinearity Statistics
B Std. Error Beta Tolerance VIF
1 (Constant) -1.578 2.330 -.677 .503
INVOLVMENT
.152 .114 .307 1.331 .192 .249 4.023
CONSISTENCY
-.187 .142 -.262 -1.322 .195 .337 2.970
ADAPTABILITY
.228 .080 .469 2.847 .007 .487 2.052
MISSION .136 .101 .260 1.355 .184 .358 2.792
a Dependent Variable: QualityPolicy
Table 8.47 Coefficients (Quality Policy)
Beta reflects the relative impact on the dependent variable of a change in one standard
deviation in the independent variables, another words, it is how much independent variables
affect dependent variable. As table 8.48 shows Beta values for adaptability and quality
policies is relatively low. That means all of the results are highly significant. As figure 8.5
shows in the following section, we can see the result of relationships between organisational
culture and organisational culture variables with TQM implementation
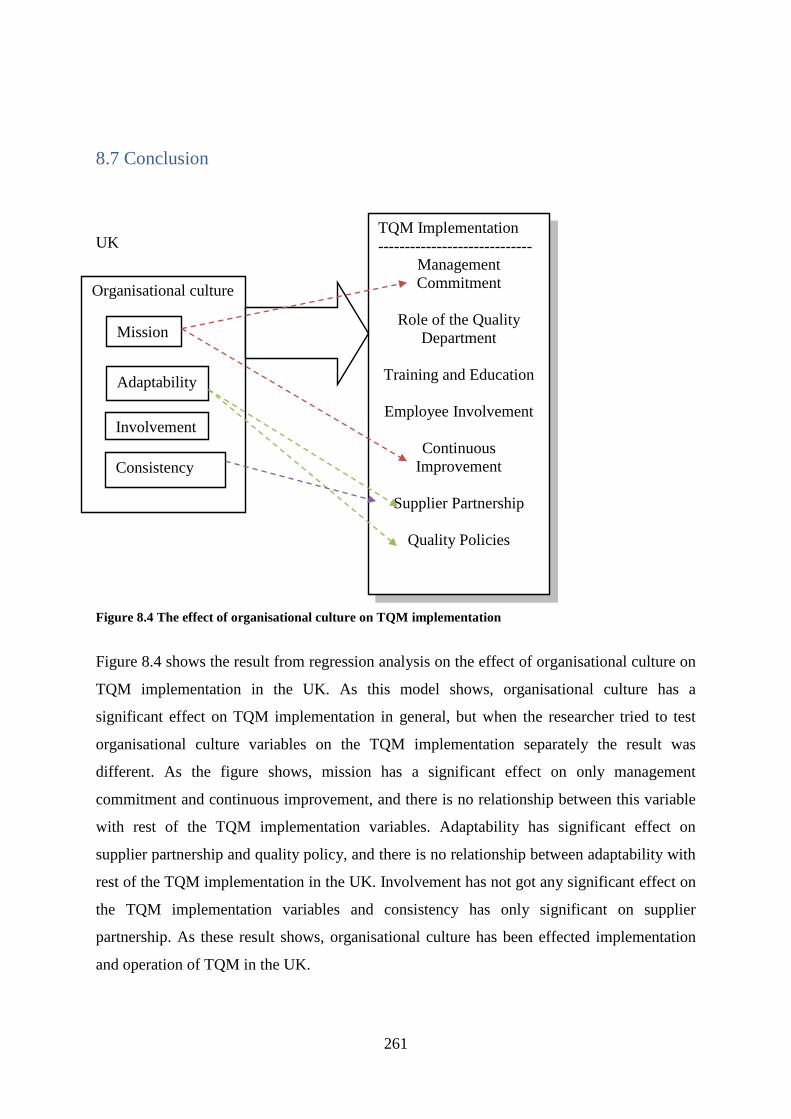
261
8.7 Conclusion
UK
Figure 8.4 The effect of organisational culture on TQM implementation
Figure 8.4 shows the result from regression analysis on the effect of organisational culture on
TQM implementation in the UK. As this model shows, organisational culture has a
significant effect on TQM implementation in general, but when the researcher tried to test
organisational culture variables on the TQM implementation separately the result was
different. As the figure shows, mission has a significant effect on only management
commitment and continuous improvement, and there is no relationship between this variable
with rest of the TQM implementation variables. Adaptability has significant effect on
supplier partnership and quality policy, and there is no relationship between adaptability with
rest of the TQM implementation in the UK. Involvement has not got any significant effect on
the TQM implementation variables and consistency has only significant on supplier
partnership. As these result shows, organisational culture has been effected implementation
and operation of TQM in the UK.
Organisational culture
Mission
Adaptability
Involvement
Consistency
TQM Implementation
-----------------------------
Management
Commitment
Role of the Quality
Department
Training and Education
Employee Involvement
Continuous
Improvement
Supplier Partnership
Quality Policies

262
Chapter Nine (Discussion)
263
9.1 Introduction
The aim of chapter 9 is to compare the organisational culture and TQM implementation
variables in the UK and Iran. The researcher studied the implementation of TQM in 40
organisations in the United Kingdom and 50 organisations in Iran, and the results presented
here are derived from these organisations.
The previous chapters have shown that Iranian organisational culture had the most effect on
process management commitment, focus on customer satisfaction, employee involvement
and quality policy. This indicates that organisational culture is an important element to ensure
successful implementation of TQM.
The measurement of national culture model in both the United Kingdom and Iran has been
adapted through Hofstede‟s (2001) model (Chapter 2).
The researcher has translated the Denison (2006) Organisational Culture model, in order to
show the relationship between organisations in the two above mentioned countries. The
review of the questionnaire and interview results verified the relationship between all levels
of organisation in British companies and Iranian companies. This discussion chapter is
divided in two parts, the first part is a comparative result from the findings and then the
second part is a general discussion related to the literature and result of this study.
9.1 Overview of National Culture, Organisational Culture and TQM
The research model has been driven from Hofstede, Denison (Chapter 2) and has been
adapted with ISO TQM implementation (Chapter 4) to provide a monitoring system between
two cultural organisations. The researcher has, considering Denison‟s model, adapted the
relationship between adaptability, mission, involvement, and consistency to obtain TQM
implementation.

264
9.1.1 National culture in the United Kingdom and Iran
INDIVIDUUNCERTAIPOWERDIS
Me
an
9
8
7
6
5
4
3
INDIVIDUUNCERTAIPOWERDIS
Me
an
8.5
8.0
7.5
7.0
6.5
6.0
Figure 9.1 National culture in the UK Figure 9.2 National culture in the Iran
The result from above chart shows, power distance index (PDI) in the United Kingdom is 4.7
and that of Iran is 8.2. This means the countries have different belief, and these have different
effects on dimensions of culture. For example. according to the interviews, Iranian prefers
their children to know their duties (to perform) to their parents.
The results for uncertainty avoidance show that the United Kingdom is 3.8 and Iran is 8.3,
this indicates that the British are not as worried by uncertainty as the Iranian are. The typical
Iranian does not see a clear horizon and has uncertainty with regard their future.
The final result from above chatt shows that individuality in the United Kingdom is 8.2 and
in Iran is 6.4. That means the United Kingdom is far more individualist than Iran. And also
in Iran the whole society is considered to be one unity and more important than individualist
needs.
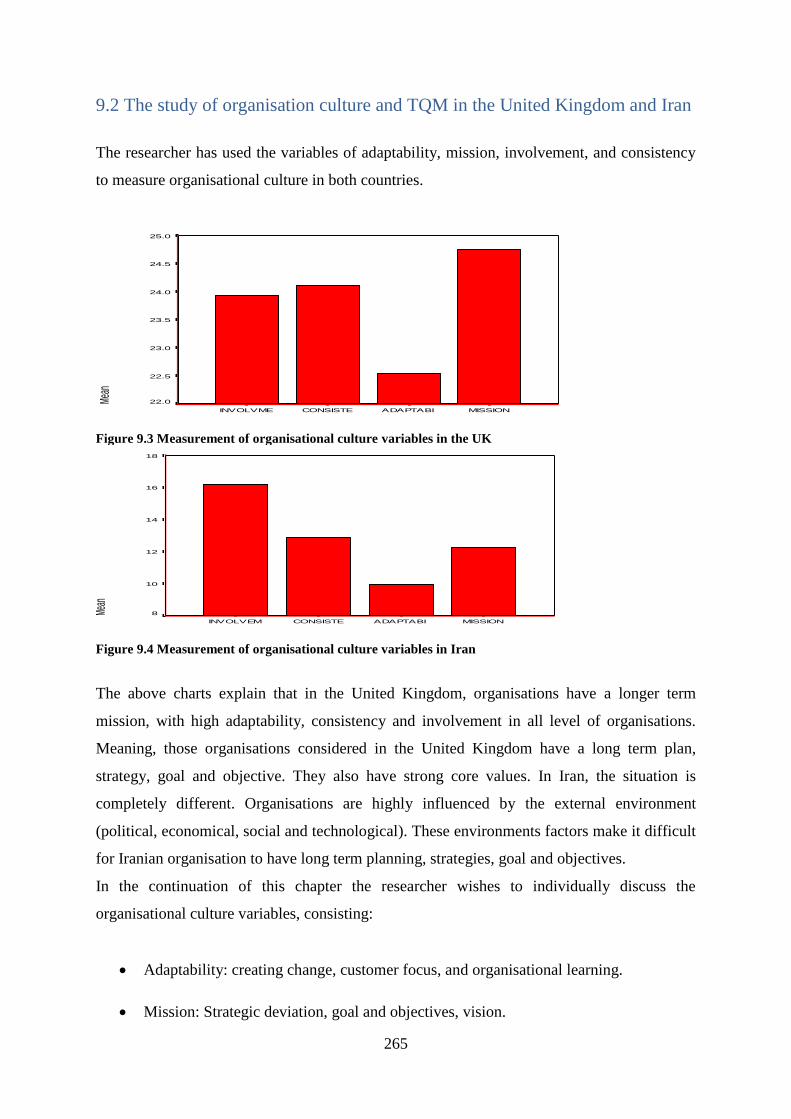
265
9.2 The study of organisation culture and TQM in the United Kingdom and Iran
The researcher has used the variables of adaptability, mission, involvement, and consistency
to measure organisational culture in both countries.
MISSIONADAPTABICONSISTEINVOLVME
Mean
25.0
24.5
24.0
23.5
23.0
22.5
22.0
Figure 9.3 Measurement of organisational culture variables in the UK
MISSIONADAPTABICONSISTEINVOLVEM
Mean
18
16
14
12
10
8
Figure 9.4 Measurement of organisational culture variables in Iran
The above charts explain that in the United Kingdom, organisations have a longer term
mission, with high adaptability, consistency and involvement in all level of organisations.
Meaning, those organisations considered in the United Kingdom have a long term plan,
strategy, goal and objective. They also have strong core values. In Iran, the situation is
completely different. Organisations are highly influenced by the external environment
(political, economical, social and technological). These environments factors make it difficult
for Iranian organisation to have long term planning, strategies, goal and objectives.
In the continuation of this chapter the researcher wishes to individually discuss the
organisational culture variables, consisting:
Adaptability: creating change, customer focus, and organisational learning.
Mission: Strategic deviation, goal and objectives, vision.
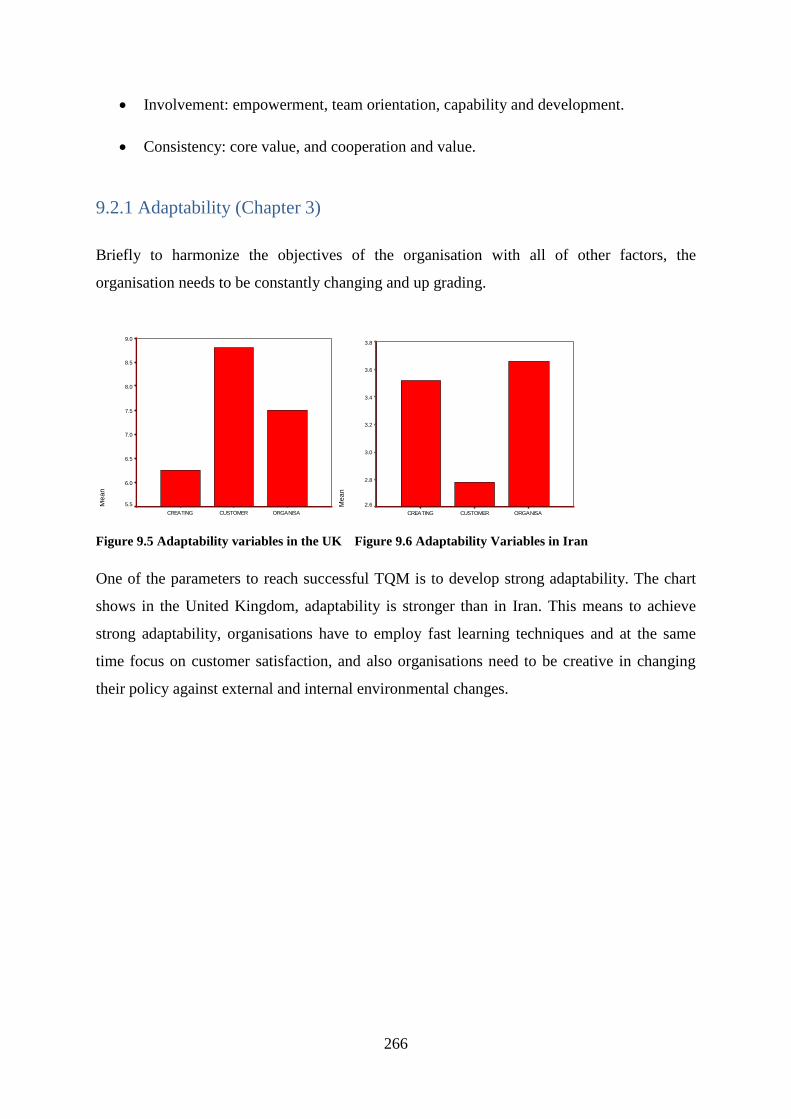
266
Involvement: empowerment, team orientation, capability and development.
Consistency: core value, and cooperation and value.
9.2.1 Adaptability (Chapter 3)
Briefly to harmonize the objectives of the organisation with all of other factors, the
organisation needs to be constantly changing and up grading.
ORGANISACUSTOMERCREATING
Me
an
9.0
8.5
8.0
7.5
7.0
6.5
6.0
5.5
ORGANISACUSTOMERCREATING
Me
an
3.8
3.6
3.4
3.2
3.0
2.8
2.6
Figure 9.5 Adaptability variables in the UK Figure 9.6 Adaptability Variables in Iran
One of the parameters to reach successful TQM is to develop strong adaptability. The chart
shows in the United Kingdom, adaptability is stronger than in Iran. This means to achieve
strong adaptability, organisations have to employ fast learning techniques and at the same
time focus on customer satisfaction, and also organisations need to be creative in changing
their policy against external and internal environmental changes.
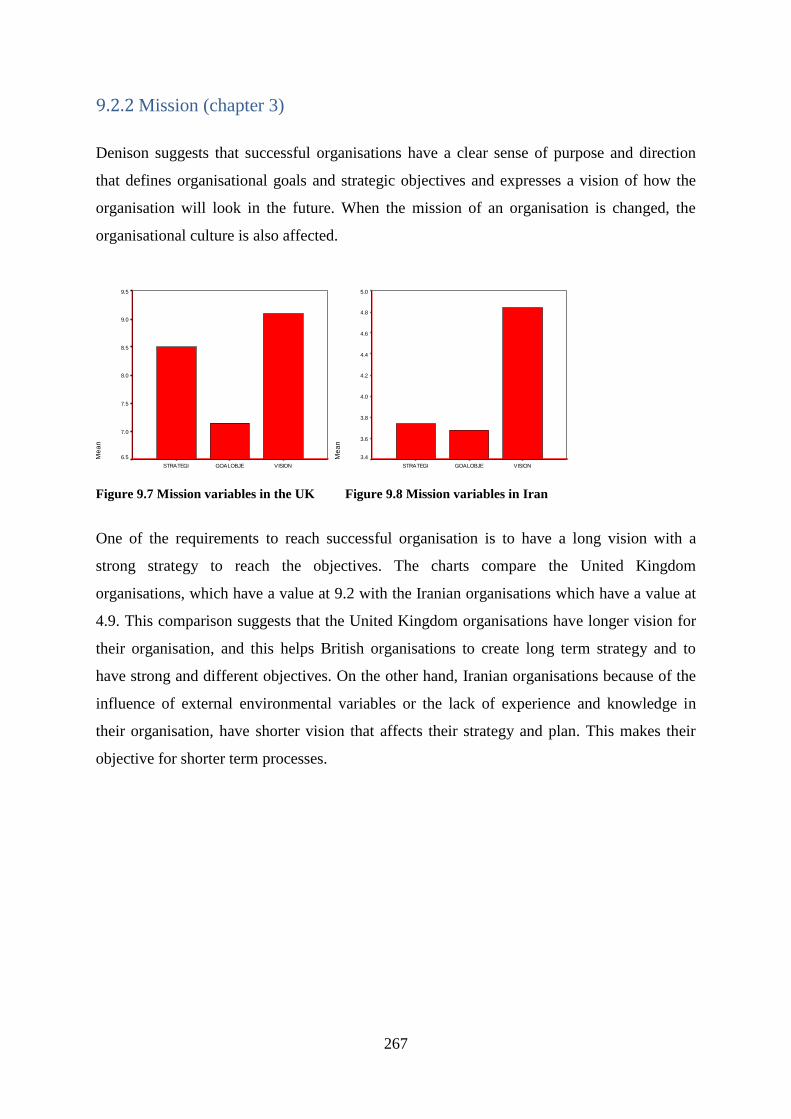
267
9.2.2 Mission (chapter 3)
Denison suggests that successful organisations have a clear sense of purpose and direction
that defines organisational goals and strategic objectives and expresses a vision of how the
organisation will look in the future. When the mission of an organisation is changed, the
organisational culture is also affected.
VISIONGOALOBJESTRATEGI
Me
an
9.5
9.0
8.5
8.0
7.5
7.0
6.5
VISIONGOALOBJESTRATEGI
Me
an
5.0
4.8
4.6
4.4
4.2
4.0
3.8
3.6
3.4
Figure 9.7 Mission variables in the UK Figure 9.8 Mission variables in Iran
One of the requirements to reach successful organisation is to have a long vision with a
strong strategy to reach the objectives. The charts compare the United Kingdom
organisations, which have a value at 9.2 with the Iranian organisations which have a value at
4.9. This comparison suggests that the United Kingdom organisations have longer vision for
their organisation, and this helps British organisations to create long term strategy and to
have strong and different objectives. On the other hand, Iranian organisations because of the
influence of external environmental variables or the lack of experience and knowledge in
their organisation, have shorter vision that affects their strategy and plan. This makes their
objective for shorter term processes.
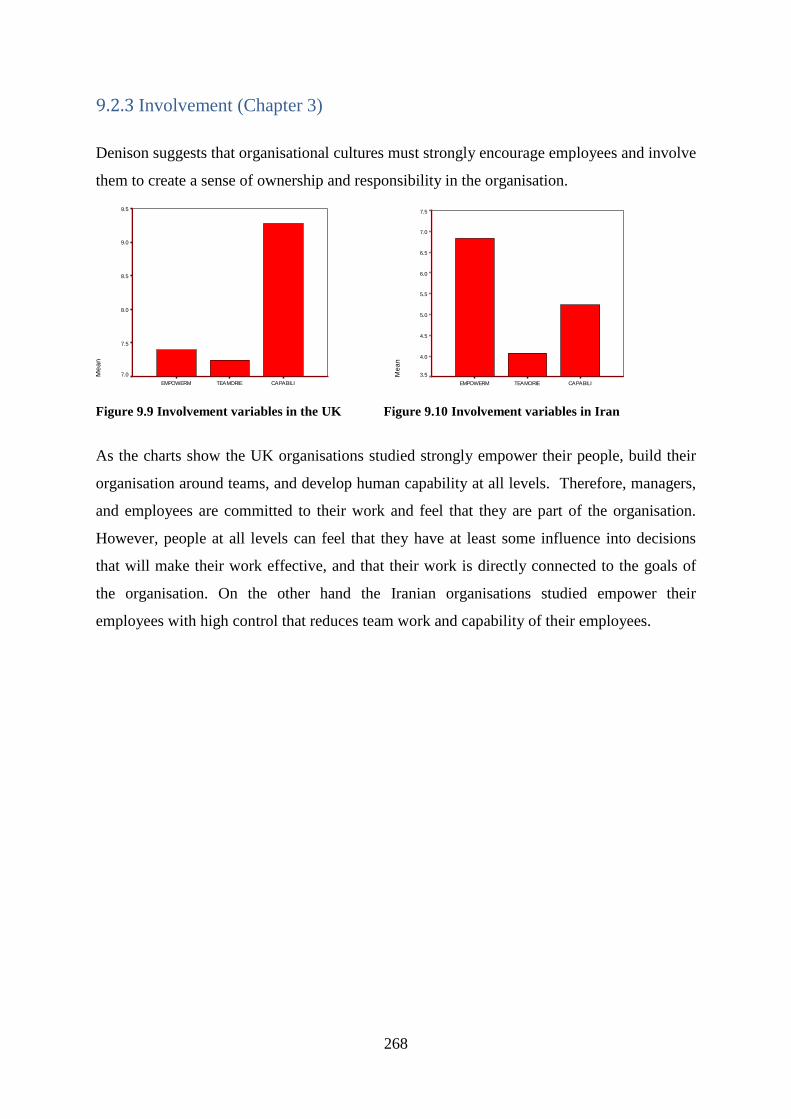
268
9.2.3 Involvement (Chapter 3)
Denison suggests that organisational cultures must strongly encourage employees and involve
them to create a sense of ownership and responsibility in the organisation.
CAPABILITEAMORIEEMPOWERM
Me
an
9.5
9.0
8.5
8.0
7.5
7.0
CAPABILITEAMORIEEMPOWERM
Me
an
7.5
7.0
6.5
6.0
5.5
5.0
4.5
4.0
3.5
Figure 9.9 Involvement variables in the UK Figure 9.10 Involvement variables in Iran
As the charts show the UK organisations studied strongly empower their people, build their
organisation around teams, and develop human capability at all levels. Therefore, managers,
and employees are committed to their work and feel that they are part of the organisation.
However, people at all levels can feel that they have at least some influence into decisions
that will make their work effective, and that their work is directly connected to the goals of
the organisation. On the other hand the Iranian organisations studied empower their
employees with high control that reduces team work and capability of their employees.

269
9.2.4 Consistency (Chapter 3)
Denison suggests that consistency make organisations have a central source of additional,
core-values and control.
COORDINACOREVALU
Me
an
8.7
8.6
8.5
8.4
8.3
8.2
COORDINACOREVALU
Me
an
8.0
7.5
7.0
6.5
6.0
5.5
5.0
Figure 9.11 Consistency variables in the UK Figure 09.12 Consistency variables in Iran
As can be seen in the charts, the United Kingdom organisations tend to be effective because
they have strong cultures that are highly consistent, and well coordinated. We can see,
British organisations‟ behaviour is rooted in a set of core values, and leaders and followers
are skilled at reaching agreement even when there are diverse points of view. On the other
hand, the Iranian organisations have a different side that makes them less consistent and less
coordinated. This could be due to typical Iranian behaviour that affects their core values.
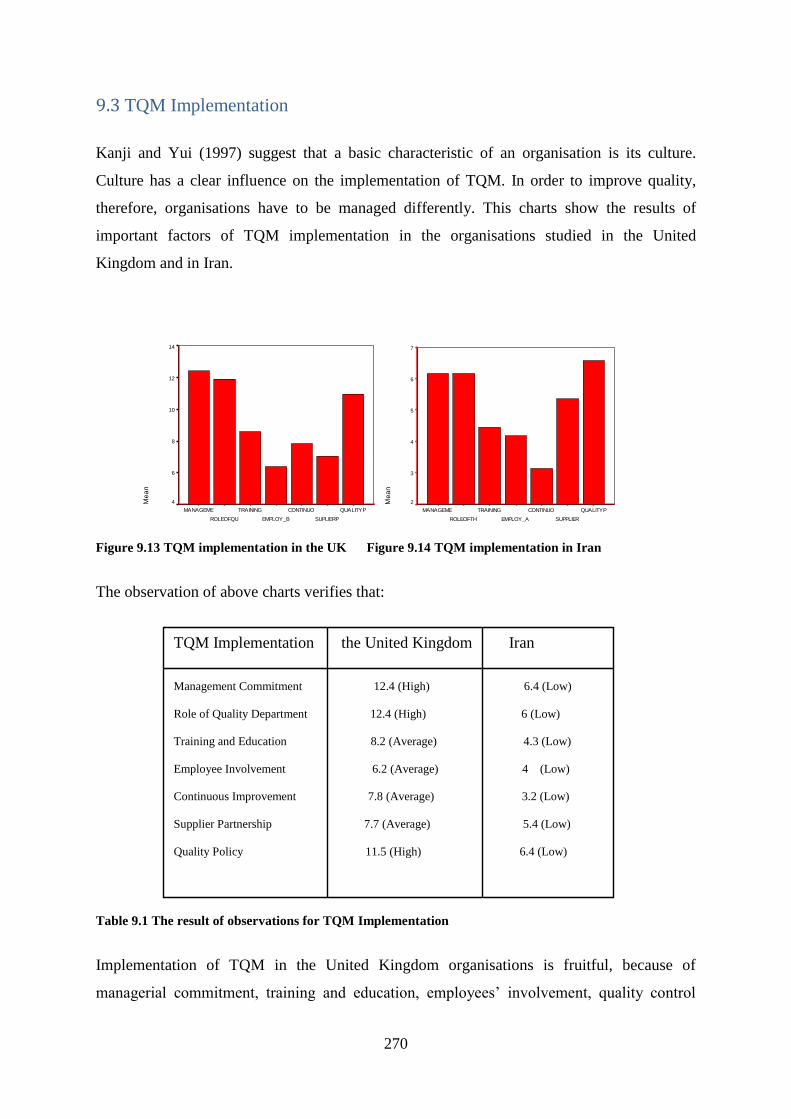
270
9.3 TQM Implementation
Kanji and Yui (1997) suggest that a basic characteristic of an organisation is its culture.
Culture has a clear influence on the implementation of TQM. In order to improve quality,
therefore, organisations have to be managed differently. This charts show the results of
important factors of TQM implementation in the organisations studied in the United
Kingdom and in Iran.
QUALITYP
SUPLIERP
CONTINUO
EMPLOY_B
TRAINING
ROLEOFQU
MANAGEME
Me
an
14
12
10
8
6
4
QUALITYP
SUPPLIER
CONTINUO
EMPLOY_A
TRAINING
ROLEOFTH
MANAGEME
Me
an
7
6
5
4
3
2
Figure 9.13 TQM implementation in the UK Figure 9.14 TQM implementation in Iran
The observation of above charts verifies that:
Table 9.1 The result of observations for TQM Implementation
Implementation of TQM in the United Kingdom organisations is fruitful, because of
managerial commitment, training and education, employees‟ involvement, quality control
TQM Implementation the United Kingdom Iran
Management Commitment 12.4 (High) 6.4 (Low)
Role of Quality Department 12.4 (High) 6 (Low)
Training and Education 8.2 (Average) 4.3 (Low)
Employee Involvement 6.2 (Average) 4 (Low)
Continuous Improvement 7.8 (Average) 3.2 (Low)
Supplier Partnership 7.7 (Average) 5.4 (Low)
Quality Policy 11.5 (High) 6.4 (Low)
271
policy and supplier partnership. Last but not the least; continuous improvement of quality in
British organisations is much higher than in Iranian organisations.
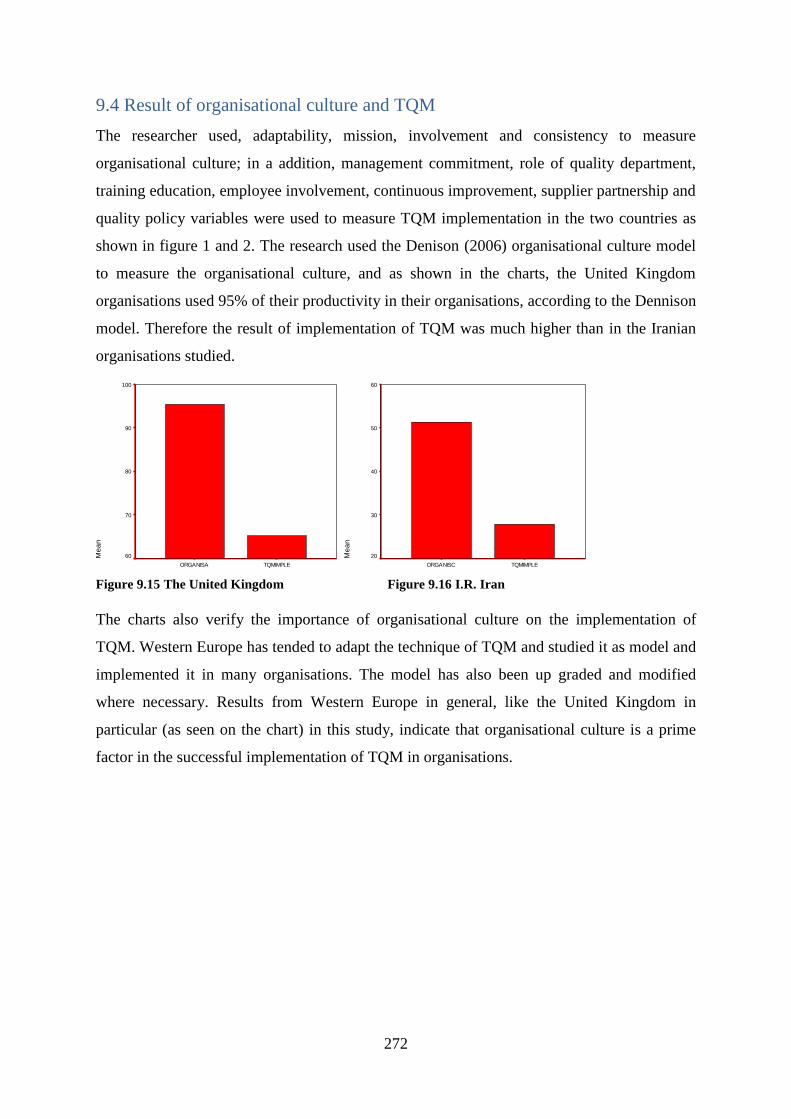
272
9.4 Result of organisational culture and TQM
The researcher used, adaptability, mission, involvement and consistency to measure
organisational culture; in a addition, management commitment, role of quality department,
training education, employee involvement, continuous improvement, supplier partnership and
quality policy variables were used to measure TQM implementation in the two countries as
shown in figure 1 and 2. The research used the Denison (2006) organisational culture model
to measure the organisational culture, and as shown in the charts, the United Kingdom
organisations used 95% of their productivity in their organisations, according to the Dennison
model. Therefore the result of implementation of TQM was much higher than in the Iranian
organisations studied.
TQMIMPLEORGANISA
Me
an
100
90
80
70
60
TQMIMPLEORGANISC
Me
an
60
50
40
30
20
Figure 9.15 The United Kingdom Figure 9.16 I.R. Iran
The charts also verify the importance of organisational culture on the implementation of
TQM. Western Europe has tended to adapt the technique of TQM and studied it as model and
implemented it in many organisations. The model has also been up graded and modified
where necessary. Results from Western Europe in general, like the United Kingdom in
particular (as seen on the chart) in this study, indicate that organisational culture is a prime
factor in the successful implementation of TQM in organisations.
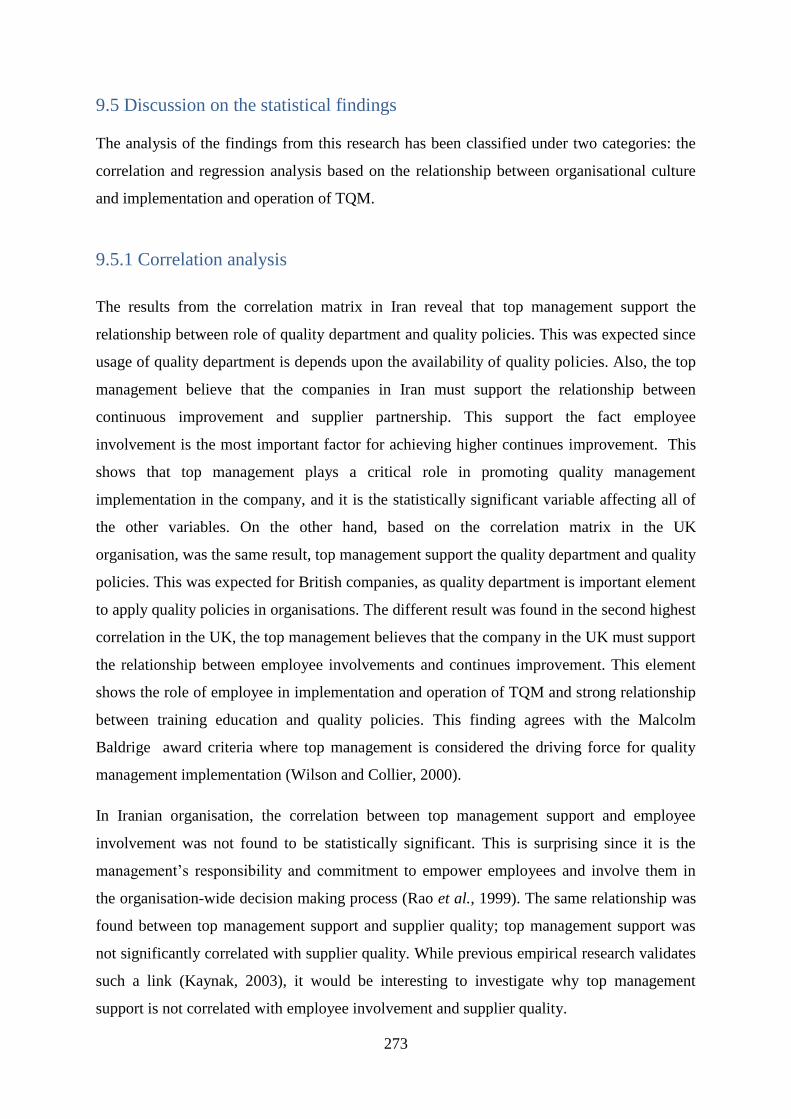
273
9.5 Discussion on the statistical findings
The analysis of the findings from this research has been classified under two categories: the
correlation and regression analysis based on the relationship between organisational culture
and implementation and operation of TQM.
9.5.1 Correlation analysis
The results from the correlation matrix in Iran reveal that top management support the
relationship between role of quality department and quality policies. This was expected since
usage of quality department is depends upon the availability of quality policies. Also, the top
management believe that the companies in Iran must support the relationship between
continuous improvement and supplier partnership. This support the fact employee
involvement is the most important factor for achieving higher continues improvement. This
shows that top management plays a critical role in promoting quality management
implementation in the company, and it is the statistically significant variable affecting all of
the other variables. On the other hand, based on the correlation matrix in the UK
organisation, was the same result, top management support the quality department and quality
policies. This was expected for British companies, as quality department is important element
to apply quality policies in organisations. The different result was found in the second highest
correlation in the UK, the top management believes that the company in the UK must support
the relationship between employee involvements and continues improvement. This element
shows the role of employee in implementation and operation of TQM and strong relationship
between training education and quality policies. This finding agrees with the Malcolm
Baldrige award criteria where top management is considered the driving force for quality
management implementation (Wilson and Collier, 2000).
In Iranian organisation, the correlation between top management support and employee
involvement was not found to be statistically significant. This is surprising since it is the
management‟s responsibility and commitment to empower employees and involve them in
the organisation-wide decision making process (Rao et al., 1999). The same relationship was
found between top management support and supplier quality; top management support was
not significantly correlated with supplier quality. While previous empirical research validates
such a link (Kaynak, 2003), it would be interesting to investigate why top management
support is not correlated with employee involvement and supplier quality.
274
9.5.2 Regression analysis
In Iran the result of regression analysis on the effect of organisational culture on TQM
implementation shows that organisational culture has a significant effect on TQM
implementation in general, but when the researcher tried to test organisational culture
variables on the TQM implementation variables separately the result was different. As the
figure shows, mission and adaptability has no significant effect on TQM implementation
variables in Iran. Involvement has a significant effect on role of the quality department,
training education, employee involvement, supplier partnership and quality policy, and there
is no significant effect on management commitment and continues improvement. Consistency
has significant on management commitment, role of the quality department, continuous
improvement, and supplier partnership and quality policy. As these result shows, in Iran,
TQM still is in earlier of adaptation in the organisations. As the result shows, organisations in
Iran, still try to adapt the TQM in their organisation. They try to be involved and consistence
the TQM implementation in different level of their organisations.
However, in the UK, the result from regression analysis on the effect of organisational culture
on TQM implementation shows that organisational culture has a significant effect on TQM
implementation in general, but when the researcher tried to test organisational culture
variables on the TQM implementation separately the result was different. As the figure
shows, mission has a significant effect on only management commitment and continuous
improvement, and there is no relationship between this variable with rest of the TQM
implementation variables. Adaptability has significant effect on supplier partnership and
quality policy, and there is no relationship between adaptability with rest of the TQM
implementation in the UK. Involvement has not got any significant effect on the TQM
implementation variables and consistency has only significant on supplier partnership. As
these result shows, organisational culture has been effected implementation and operation of
TQM in the UK.
The findings from the correlation analysis show that there are statistically significant
correlations between top management support, education and training, employee
involvement, quality policy, and customer focus. However, Taking into account the results
of the regression analysis (the final model developed based on previous theory), it is shown
275
that top management support, quality information availability, quality information usage and
employee training are significant predictors of implementation and operation of TQM in Iran.
The UK result indicates that internal quality results are achieved by: top management
support, quality policy, supplier partnership, training and education, and employee
involvement. From EFQM model, the results indicate that leadership, quality policy, training
and education, and employee involvement are significant predictors of implementation and
operation of TQM.
The above findings imply that to improve the implementation and operation of TQM, the
managers in the Iranian need to focus on four elements: top management support, quality
policy, training and education, and employee involvement. These three items together explain
more than 65% of the variability in the implementation and operation of TQM. The findings
indicate that successful implementation and operation of TQM are the effect of improvement
of organisational culture. The implication for managers in Iran is that profitability and higher
revenues is achieved when implementation and operation of TQM have been improved.
It is interesting to note that customer focus and satisfaction was not a significant predictor if
Iranian organisation. Theoretically, one of the main focuses of quality management is
customer satisfaction (Dean and Bowen, 1994), and it has been shown that higher customer
satisfaction results in higher profitability. No statistically significant relationship between
Iranian organisational culture and customer satisfaction and results has been found here.
Perhaps the high demand for products from customers and the high bargaining power of
Iranian organisation affects the customer-buyer relationship. That needs to be investigated
more in detail.
276
9.6 Discussion of the finding and literature
Denison (2006) contends that, in order to understand the ways of working in organise,
understanding the internal working culture, especially those presumptions which the
members of organisation consider unimportant, is necessary. The differences between Iran
and the UK in terms of cultural dimensions are shown in the previous section. The various
presumptions that are formed under the influence of culture and the effect working
behaviour of the members of an organisation can be divided into two categories:
Descriptive presumptions towards national culture
Prescriptive presumptions towards guidance basics of organisational culture
These two groups of presumptions are different; the first one explains national culture but the
second one provides normative guidance that forms the organisational culture. The national
cultures of Iran and the UK are different in terms of presumptions related to nature, casualty
and controlling the results (desirable and undesirable) that a person experiences in his/her
life. Thus people are different; some of them believe that employees are responsible by
themselves for the results and behaviours that have occurred.
Another difference that can be found in the organisations studied in Iran and the UK relates to
human abilities and flexibility. In Iranian organisation employees‟ abilities are often
supposed to be just unchangeable and limited. Consequently planning solutions and job
progress that is done through training is less noticed, while; in the UK organisations tend to
emphasize the flexibility, creative and unlimited capacity of human resources. Thus the
internal working culture in Iran relies more on applying the theory and pattern of traditional
management. But in the UK the theory of human relations and participatory management
pattern is relatively more suitable. The complicated and unpredictable environment in Iran
has typically developed a time horizon in which long range planning and foresight are less
noticed. In predictable environments the time horizon is long and farsighted and encourages
planning, while in unpredictable environments parochialism is more desirable so planning is
less noticed.
There are significant differences in the normative presumptions, which lead to differences in
the implementation and operation of TQM. For example, the organisations in the UK
encourage initiative-confronting with a problem: this response reflects the tendency to
277
masculinity behaviours in a cultural-social environment and a belief in locus of control. But
in Iran adopting a passive situation related to problems is more typical. In Iran people are
encouraged to change themselves in order to tolerate environmental pressures rather than
making changes in the environment. In Iranian organisations the fulfilment of successful
behaviours is measured with regard to work or practical activities. The tendency towards an
individual achievement style in the UK, which is mixed with masculinity, encourages using
practical normalities. Whereas in Iran a severe relationship-oriented frame and nice
sentiments and emotions towards others, and also using moralities based on tradition and
religious beliefs, are considered as the best methods of judgment on success in individual
behaviours and are emphasized, encouraged and extended. In such traditional societies people
are not considered to be successful due to entrepreneurship or achieving financial prosperity
but they are judged with regard to moral status and supporting other people‟s interests. The
sociability in the organisations in Iran, which consists of adherence, discipline and parental
behaviours, shows a tremendous power distance while the nature of collective and prudent
relations in the UK shows a relatively small power distance. In Iran the relationships between
superior and subordinate are often based on paternal behaviours in which human affinities are
worthy and encouraged but this process is completely different in the UK organisations.
Finally the behavioural tendency towards the environment in Iran shows the dependence on
the environment, which represents irrational or emotional thought. Environmental
independence in the UK organisations is a reflection of scientific thought. In Iran it is
presumed that basically rules and instructions are unconditional and there are some forces
that lead behaviour.
278
9.6 Summary
Furthermore, the results indicate that it is the people side of quality management that has a
significant impact on implementation and operation of TQM. Benchmarking, and quality
citizenship, were not statistically significant variables in explaining variability in the
implementation and operation of TQM. In one aspect, the results confirm the findings by
Powel (1995), who empirically showed that the “soft side” of quality, such as top
management support and open culture, affects firm performance. Another conclusion is that
quality management has not been incorporated in the strategic and long-term view of the
firm. Strategic planning for quality was not significantly correlated with implementation and
operation of TQM variables. That shows that quality is still regarded as an operational level
strategy and that there is much work left to be done to relate it to business-level strategy.
There is much work to do to show how to incorporate it into the strategic aspect of Iranian
organisations.
Relating these towards the qualitative and quantitative discussion the researcher introduced a
suggested model for the successful implementation and operation of TQM in Iranian
organisation in chapter 10.
In Iranian organisations following parameters are the main causes of TQM implementation
failure.
Effectiveness of the power distance
Lack of proper education
Individualism uncertainty
Lack of ability of risk taking in the organisation
Human resources problems
Lack of motivation for developing employees
Low salaries at most employments levels
279
The researcher has also found that team work is the most essential element for successful
implementation of TQM to achieve quality at all level of organisations.
All level of organisations includes:
Employees
Managers
Entrepreneurs
Suppliers need to play role in cooperation and commitment for quality achievement.
In Iranian organisations in order to improve quality it is required to change culture. TQM
requires a change in organisational culture, methodology, beliefs, and processes. To bring
new changes in system, a need to change the organisational culture is a must.
Through such changes implementation of new Ideas for an improve organisation can be
feasible.
TQM implementation will be thoroughly fruitful in a collaborative culture which is
distinguished by:
Trust
Honesty
Creativeness
Empowers Individuals
Braveness and openness
Ability of risk taking and carrying out the mission of the organisations.
280
The aim of this was to increase our understanding of the effects of organisation‟s culture on
the implementation and operation of TQM. The researcher has found the dimension of
organisational culture can play important role in implementation and operation of TQM.
Also, TQM is a management approach to change the culture in order to increase teamwork,
organisational learning, innovation, risk taking continues improvement, internal and external
customer relationship and supplier partnership. As the researcher found from his study the
success of TQM as an organisational change depends on the organisational culture.
Successful implementation of TQM needs a significant change in attitude, and value of
organisation. However, organisational culture and TQM should be initiated together.
In the next chapter presents the conclusion of the research and contributions to the body of
knowledge and a proposed model for TQM implementation within Iranian organisations is
presented. Suggestions for future research in the area also included.

281
Chapter Ten (conclusion)
282
10. Introduction
The key aim of thesis through an exploration of the relationship between organisational
culture and TQM implementation in Iran and the UK was to understand important function
and the role of organisations in the implementation and operation of TQM. The key
objectives were to answer the following questions:
First Question: What is organisational culture; importance, functions and role?
Second Question: How TQM could be organised, implemented, formulated and
sustained through the Iranian and the UK organisation?
Third question: Should an organisational culture be initiated before TQM or vice
versa? Should they be initiated together? How would we ensure TQM and
organisational culture complement one another, instead of overshadowing?
Fourth question: What are the factors which could influence TQM in countries such
as Iran and the UK?
This research covered such issues as how organisation culture variables affected TQM
implementation variables in the UK and Iran. The research discovered out the differences in
the operation and implementing the TQM in the UK and Iran. The research aimed to relate
and evaluate the data collected to the relevant western literature.
Part one of this thesis introduced the literature review, illustrated the context in which the
phenomenon of organisational culture and TQM was considered, and discussed different
methods and approaches to the research work.
Part two of the research comprised an in-depth analysis of the research findings based on the
result from the field work in the UK and Iran.
Part Three presents conclusions from the research by answering the questions posed at the
outset of the thesis. A revised conceptual framework of organisational culture and TQM
implementation is also proposed.
283
10.2 Conclusions
An important result of this study was to indentify the development and influence of
organisational culture on the implementation and operation of TQM, in the context of both
Iranian and English companies. The following sections meet the research objectives and give
the answers to the questions posed at the beginning of the thesis
First question, what is organisational culture; importance, functions and role?
In the most advanced societies in both private and governmental owned organisation, the
main concern is welfare and economical progress. The historical, geographical, and political
state of that society plays an important role in these interests. Welfare, and a good or
excellent economical situation do not usually happen overnight, and if they did, they would
probably be transient. Education and training play the most important role in the welfare of
society and general development. Most of the time, training without education is not fruitful.
The importance of EDUCATION FIRST and TRAINING SECOND is the golden role, the
introduction and implementation of any new ideas, or systems may need years of preparing a
foundation based on cultural and psychological education and training. When working in a
society with low income and large family members, it is even harder to mentally educate
them to follow certain patterns (standards). Where different classes of people exist and apathy
and ignorance are in existence, the goal of education and training seems even more difficult
to achieve.
In different societies, the meaning of quality differs. Considering societies where the supply
of end products is less than the demand, people tend to pay little attention to quality. Where
as in the opposite situation consumers not only look for quality of the products but the
products should meet:
Customer need
Safety regulation
Ease of operation
Environmental friendliness
Meet the budget price (Piece Competitive)
284
So in reality, to use or apply the correct tools as for quality (TQM) one has to differentiate,
WHERE and WHEN these strategies can be implemented. The approach of quality control
(QC) or implementation of TQM can have totally different meanings in different societies. In
one the employees might think that these are the managerial means of disciplinary control in
another they may really believe in the supply of quality end products.
The importance of the organisational culture is that it can increase the efficiency and
effectiveness of an organisation.
Organisational culture is one of the important factors in TQM implementation programs. The
success of TQM as an organisational change mechanism depends on organisational culture.
Successful implementation of TQM needs strong values, attitudes and the appropriate culture
of organisation.
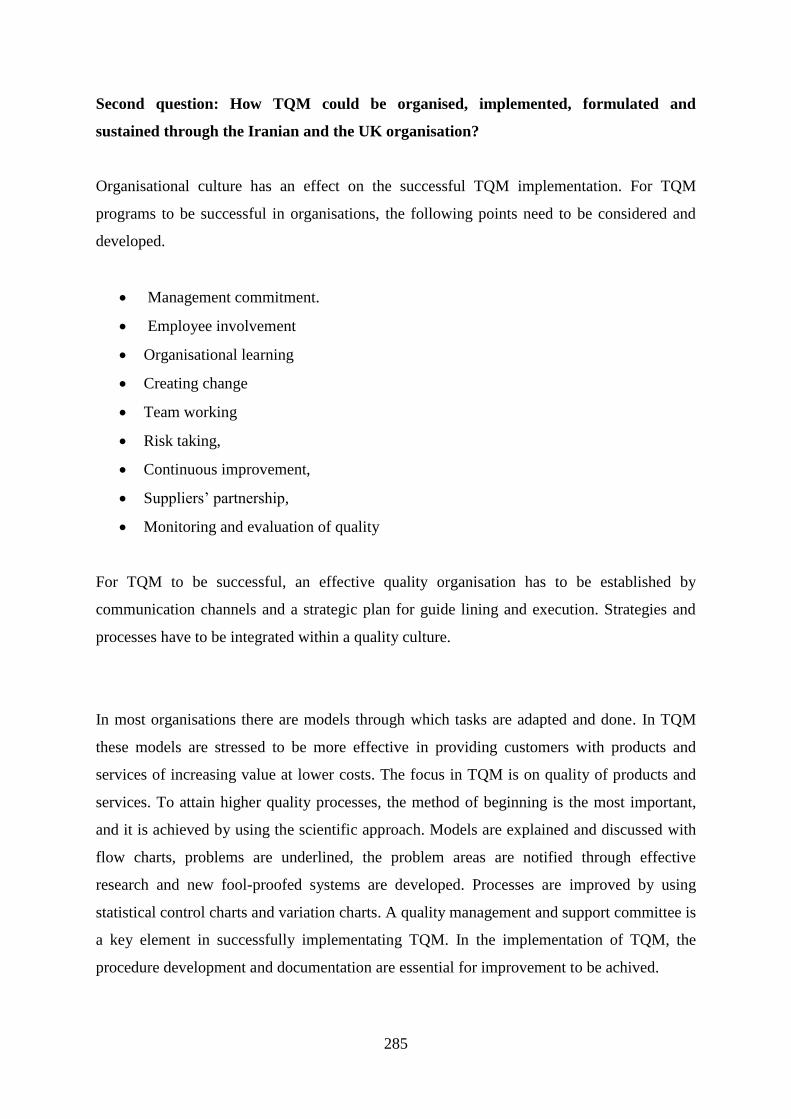
285
Second question: How TQM could be organised, implemented, formulated and
sustained through the Iranian and the UK organisation?
Organisational culture has an effect on the successful TQM implementation. For TQM
programs to be successful in organisations, the following points need to be considered and
developed.
Management commitment.
Employee involvement
Organisational learning
Creating change
Team working
Risk taking,
Continuous improvement,
Suppliers‟ partnership,
Monitoring and evaluation of quality
For TQM to be successful, an effective quality organisation has to be established by
communication channels and a strategic plan for guide lining and execution. Strategies and
processes have to be integrated within a quality culture.
In most organisations there are models through which tasks are adapted and done. In TQM
these models are stressed to be more effective in providing customers with products and
services of increasing value at lower costs. The focus in TQM is on quality of products and
services. To attain higher quality processes, the method of beginning is the most important,
and it is achieved by using the scientific approach. Models are explained and discussed with
flow charts, problems are underlined, the problem areas are notified through effective
research and new fool-proofed systems are developed. Processes are improved by using
statistical control charts and variation charts. A quality management and support committee is
a key element in successfully implementating TQM. In the implementation of TQM, the
procedure development and documentation are essential for improvement to be achived.
286
The final chapter of this study provides information about the success of TQM and barriers to
its successful implementation in a number of Iranian organisations. The barriers to successful
implementation of TQM in this survey included lack of senior management commitment and
involvement, instability of senior managers, inability to change organisational culture,
inflexibility of the organisational culture toward quality changes, inflexibility of organisation
toward environment and technological change, incorrect planning, lack of continuous
education and training for employees and managers, inadequate knowledge or understanding
of TQM philosophy, poor team work and participation, inappropriate evaluation of team
works, poor accessibility to data and results, and lack of attention to the needs of internal and
external customers.
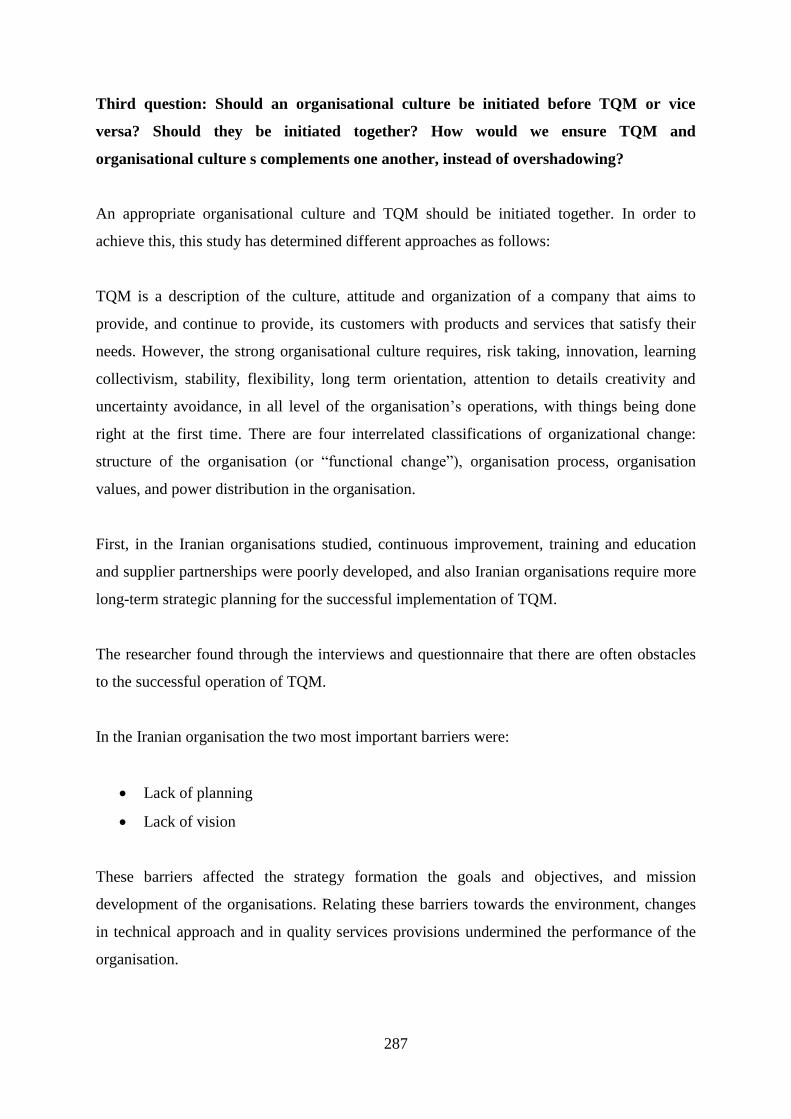
287
Third question: Should an organisational culture be initiated before TQM or vice
versa? Should they be initiated together? How would we ensure TQM and
organisational culture s complements one another, instead of overshadowing?
An appropriate organisational culture and TQM should be initiated together. In order to
achieve this, this study has determined different approaches as follows:
TQM is a description of the culture, attitude and organization of a company that aims to
provide, and continue to provide, its customers with products and services that satisfy their
needs. However, the strong organisational culture requires, risk taking, innovation, learning
collectivism, stability, flexibility, long term orientation, attention to details creativity and
uncertainty avoidance, in all level of the organisation‟s operations, with things being done
right at the first time. There are four interrelated classifications of organizational change:
structure of the organisation (or “functional change”), organisation process, organisation
values, and power distribution in the organisation.
First, in the Iranian organisations studied, continuous improvement, training and education
and supplier partnerships were poorly developed, and also Iranian organisations require more
long-term strategic planning for the successful implementation of TQM.
The researcher found through the interviews and questionnaire that there are often obstacles
to the successful operation of TQM.
In the Iranian organisation the two most important barriers were:
Lack of planning
Lack of vision
These barriers affected the strategy formation the goals and objectives, and mission
development of the organisations. Relating these barriers towards the environment, changes
in technical approach and in quality services provisions undermined the performance of the
organisation.
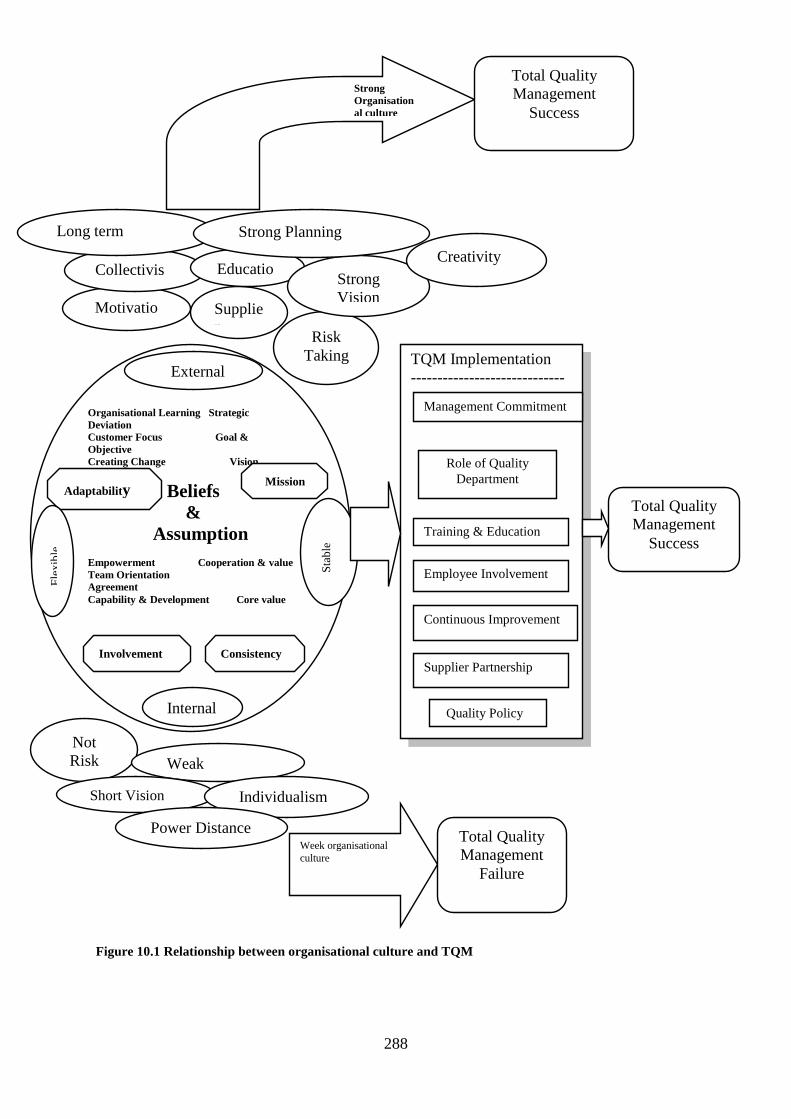
288
Figure 10.1 Relationship between organisational culture and TQM
Organisational Learning Strategic
Deviation
Customer Focus Goal &
Objective
Creating Change Vision
Beliefs
&
Assumption
Empowerment Cooperation & value
Team Orientation
Agreement
Capability & Development Core value
Adaptability
Involvement Consistency
Mission
F
lexib
le
S
tab
le
External
Focus
Internal
Focus
TQM Implementation
-----------------------------
Management Commitment
Role of Quality
Department
Training & Education
Employee Involvement
Continuous Improvement
Supplier Partnership
Quality Policy
Total Quality
Management
Success
Risk
Taking
Supplie
r
Motivatio
n
Collectivis
m
Educatio
n
Long term
Mission
Strong
Vision
Strong Planning
Strong
Organisation
al culture
Total Quality
Management
Success
Not
Risk
Taking Weak
Education Short Vision Individualism
Power Distance Week organisational
culture
Total Quality
Management
Failure
Creativity
289
In the Iranian organisations studied the following parameters are the main causes of TQM
implementation failure.
High power distance
Lack of proper education
Individualism uncertainty
Lack of ability of risk taking in the organisation
Human resources problems
Lack of motivation for developing employees
Low salaries at most employments levels
The researcher also found that team work is the most essential element for the successful
implementation of TQM to achieve quality at all level of organisations.
All level of organisations includes:
Employees
Managers
Entrepreneurs
Suppliers need to play a role in cooperation and commitment for quality achievement.
In Iranian organisations in order to improve quality it is necessary to change culture. TQM
requires a change in organisational culture, methodology, beliefs, and processes. To bring
new changes in the system, a requirement to change the organisational culture is a must.
Through such changes implementation of new ideas for an improved organisation can be
feasible.
TQM implementation will be more fruitful in a collaborative culture which is distinguished
by:
Trust
290
Honesty
Creativeness
Empowers Individuals
Braveness and openness
Ability of risk taking and carrying out the mission of the organisations.
One aim of this research was to increase our understanding of the effects of an organisation‟s
culture on the implementation and operation of TQM. The researcher has found the
dimension of organisational culture can play a very important role in the implementation and
operation of TQM. Also, TQM is a management approach to change the culture in order to
increase teamwork, organisational learning, innovation, risk taking continuous improvement,
internal and external customer relationships and supplier partnerships. As the researcher
found from his study the success of TQM as an organisational change strategy depends on the
organisational culture. Successful implementation of TQM needs a significant change in the
attitudes, and values of organisations. However, developing the right organisational culture
and TQM should be initiated together.
291
Fourth Question: What are the factors which could influence TQM in countries such as
Iran and the UK?
The significant contribution of this research was to find out the relationship between
organisational culture and TQM implementation in the UK and Iran. As the results of this
research have shown that TQM stage in Iranian organisations had the most effects on process
management commitment, focus on customer satisfaction, employee involvement and quality
policy. The research has also identified that cultural fit is the most important element in
ensuring the successful implementation of TQM in Iranian organisations.
For an effective and highly efficient model of quality management:
Self-assessment
Continuous monitoring
Evaluation of quality activities by employees
Providing good feedback is one of the most important factors in the success of TQM.
In this research, the main problem areas were identified as follows:
Lack of education and training,
Lack of continuous quality policy,
Lack of feed-back from customers.
This research provided evidence concerning the success of TQM and barriers to its successful
implementation and its relationship with organisational culture in a number of Iranian
organisations. Several critical factors are identified as necessary for TQM to be successful.
These include the support and commitment of manager, continues improvement, quality
policy, quality planning, mission, vision, values and quality objective of the organisation,
training and education, effective, employees empowerment, employees commitment. The
following graphs showed how organisations in Iran and the UK had effected the
implementation and operation of TQM.
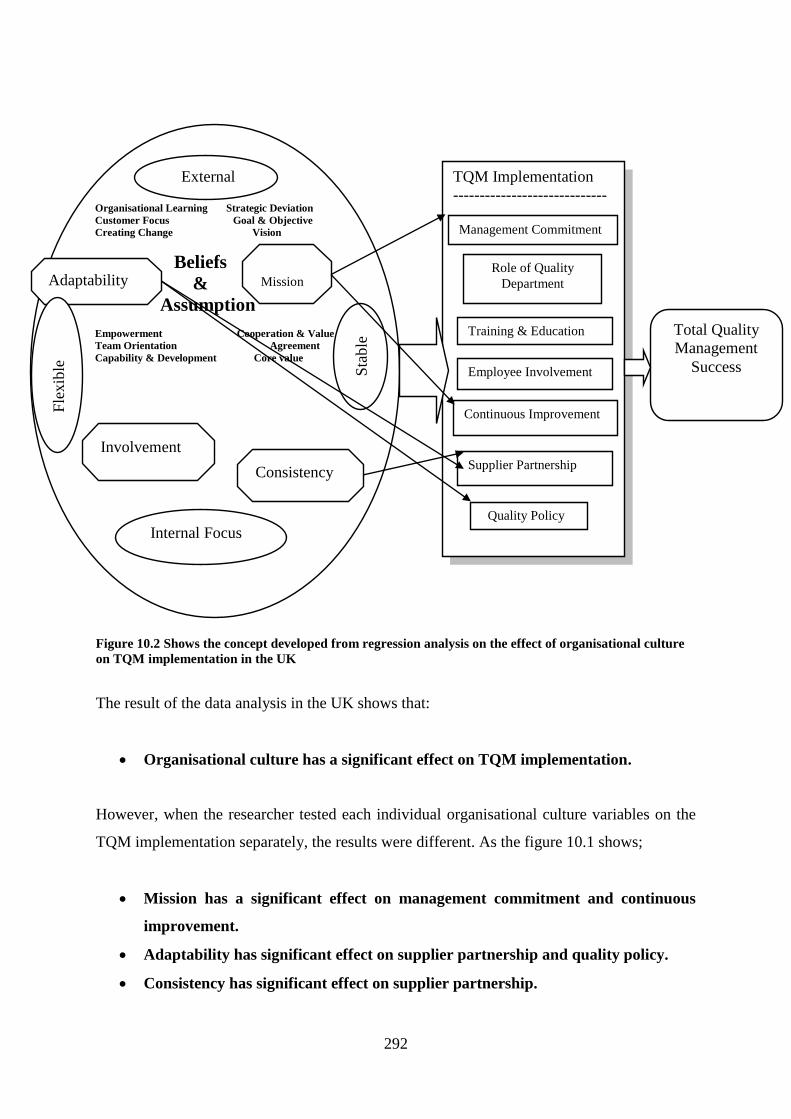
292
Figure 10.2 Shows the concept developed from regression analysis on the effect of organisational culture
on TQM implementation in the UK
The result of the data analysis in the UK shows that:
Organisational culture has a significant effect on TQM implementation.
However, when the researcher tested each individual organisational culture variables on the
TQM implementation separately, the results were different. As the figure 10.1 shows;
Mission has a significant effect on management commitment and continuous
improvement.
Adaptability has significant effect on supplier partnership and quality policy.
Consistency has significant effect on supplier partnership.
Organisational Learning Strategic Deviation
Customer Focus Goal & Objective
Creating Change Vision
Beliefs
&
Assumption
Empowerment Cooperation & Value
Team Orientation Agreement
Capability & Development Core value
Adaptability
Involvement
Consistency
Mission
F
lex
ible
S
tab
le
External
Focus
Internal Focus
TQM Implementation
-----------------------------
Management Commitment
Role of Quality
Department
Training & Education
Employee Involvement
Continuous Improvement
Supplier Partnership
Quality Policy
Total Quality
Management
Success
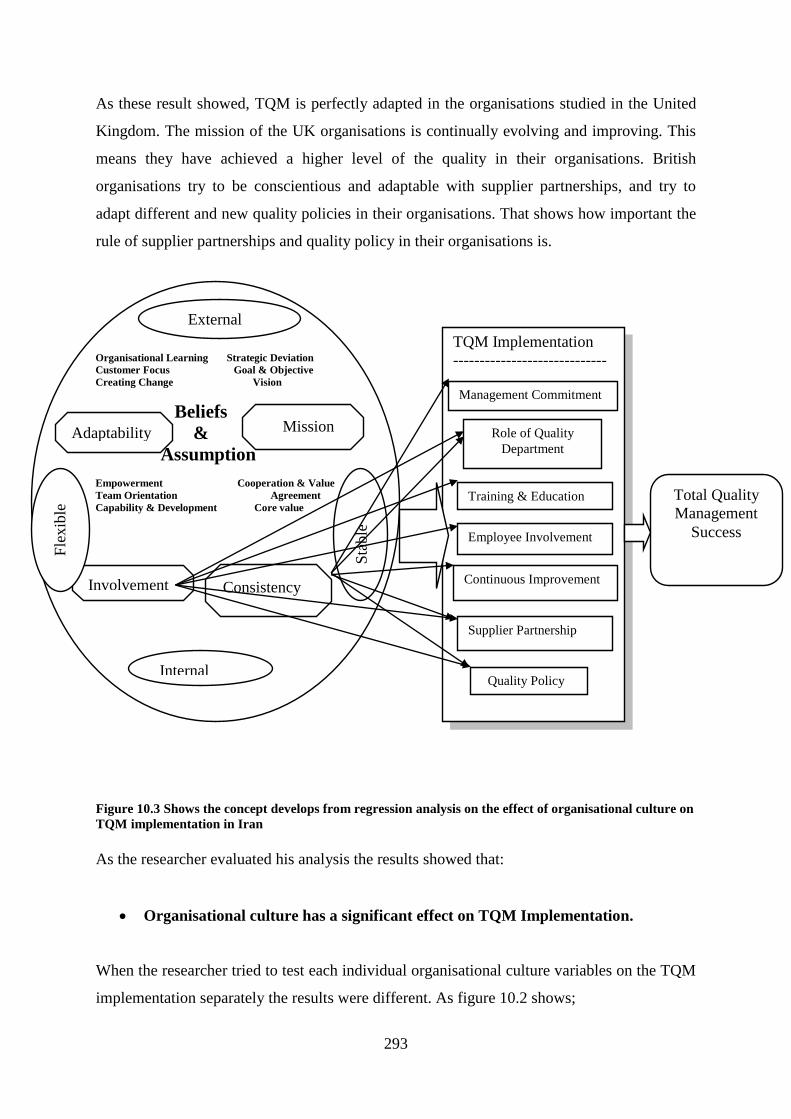
293
As these result showed, TQM is perfectly adapted in the organisations studied in the United
Kingdom. The mission of the UK organisations is continually evolving and improving. This
means they have achieved a higher level of the quality in their organisations. British
organisations try to be conscientious and adaptable with supplier partnerships, and try to
adapt different and new quality policies in their organisations. That shows how important the
rule of supplier partnerships and quality policy in their organisations is.
Figure 10.3 Shows the concept develops from regression analysis on the effect of organisational culture on
TQM implementation in Iran
As the researcher evaluated his analysis the results showed that:
Organisational culture has a significant effect on TQM Implementation.
When the researcher tried to test each individual organisational culture variables on the TQM
implementation separately the results were different. As figure 10.2 shows;
Organisational Learning Strategic Deviation
Customer Focus Goal & Objective
Creating Change Vision
Beliefs
&
Assumption
Empowerment Cooperation & Value
Team Orientation Agreement
Capability & Development Core value
Adaptability
Involvement Consistency
Mission
F
lexib
le
S
table
External
Focus
Internal
Focus
TQM Implementation
-----------------------------
Management Commitment
Role of Quality
Department
Training & Education
Employee Involvement
Continuous Improvement
Supplier Partnership
Quality Policy
Total Quality
Management
Success
294
Involvement has a significant effect on role of the quality department, training
education, employee involvement, supplier partnership and quality policy.
Consistency has a significant effect on management commitment, role of the
quality department, continuous improvement, and quality policy and supplier
partnership.
Models for successful TQM implementations are still in an earlier stage of adaptation to the
Iranian context. Iranian organisations are endorsing to engage their organisation to TQM
implementation at all levels of their organisations.
295
10.3. Research Contributions to knowledge
This study explained the conceptual difference between implementation and operation of
TQM in selected organisations in Iran and the UK. The findings of this study draw attention
to the importance of differentiating between the concept of national culture and
organisational culture dimensions in Iran and the UK.
Following a critical review of the literature, discussion, it became clear that the theories and
measures extended in the western industrialized world such as the UK will face serious
limitations when implemented in the situation of organisations in the developing world such
as Iran. For example, management theories which have been formed in advanced countries
are based on some assumptions that are only appropriate for people in these countries. So, in
order to compose the theories of total quality management, the most necessary thing is to
understand environmental factors such as cultural, economic, political, legal and especially
national culture, the way that they affect the behaviour of people and the performance of
organisations. What is needed is developing management theories and functions based on
local situations and conditions, and the cultural and social forces of each country.
Ignoring each of the environmental elements in the long term and persisting in uncritically
applying the theories and methods of imported management tools such as TQM, without
doubt will cause harmful effects on organisations‟ performance. It is clear that achieving the
required ability for the modification and reformation of successful management patterns,
whether in Iran or the UK, and using them with regard to environmental conditions requires a
careful appraisal of the theories and methods that often originate from western countries. This
is particularly the case when applying these theories developing countries and trying to raise
programs of management all over the world. So any effort which is made to apply
management tools and philosophies such as TQM necessarily must be done alongside an
evaluation of the theoretical basis and effective methods of western management in terms of
their direct applicability to a particular national culture.
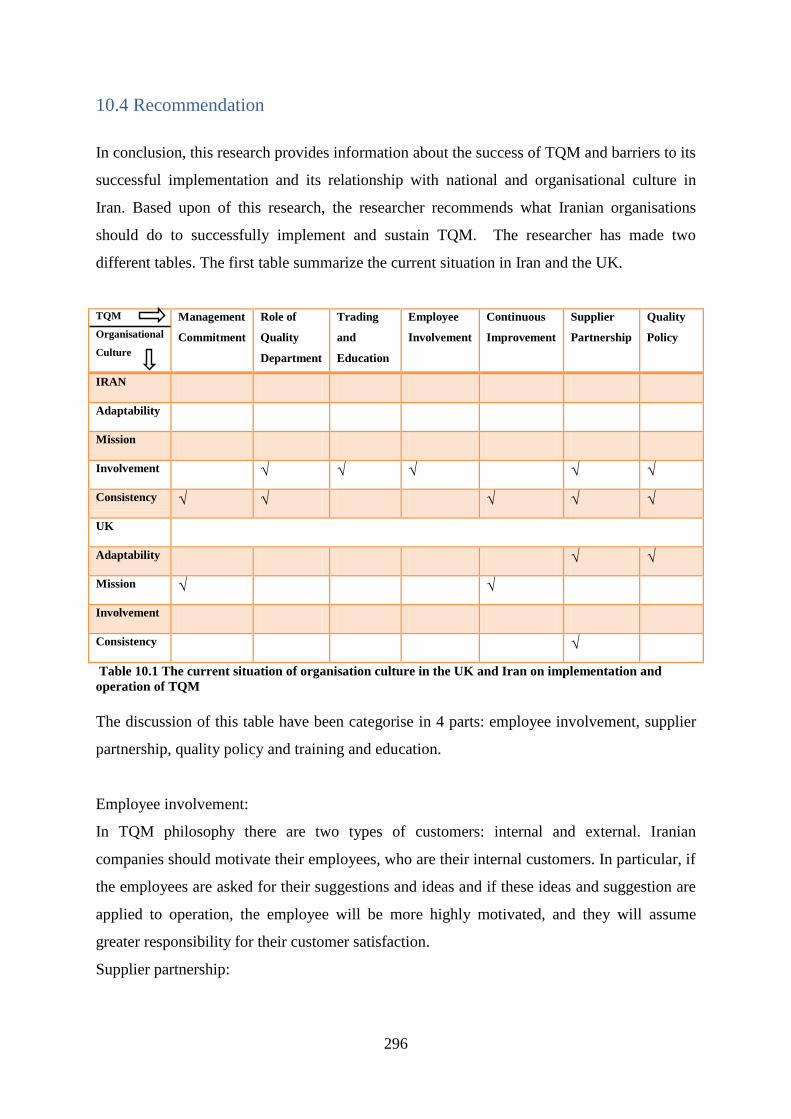
296
10.4 Recommendation
In conclusion, this research provides information about the success of TQM and barriers to its
successful implementation and its relationship with national and organisational culture in
Iran. Based upon of this research, the researcher recommends what Iranian organisations
should do to successfully implement and sustain TQM. The researcher has made two
different tables. The first table summarize the current situation in Iran and the UK.
TQM
Organisational
Culture
Management
Commitment
Role of
Quality
Department
Trading
and
Education
Employee
Involvement
Continuous
Improvement
Supplier
Partnership
Quality
Policy
IRAN
Adaptability
Mission
Involvement √ √ √ √ √
Consistency √ √ √ √ √
UK
Adaptability √ √
Mission √ √
Involvement
Consistency √
Table 10.1 The current situation of organisation culture in the UK and Iran on implementation and
operation of TQM
The discussion of this table have been categorise in 4 parts: employee involvement, supplier
partnership, quality policy and training and education.
Employee involvement:
In TQM philosophy there are two types of customers: internal and external. Iranian
companies should motivate their employees, who are their internal customers. In particular, if
the employees are asked for their suggestions and ideas and if these ideas and suggestion are
applied to operation, the employee will be more highly motivated, and they will assume
greater responsibility for their customer satisfaction.
Supplier partnership:
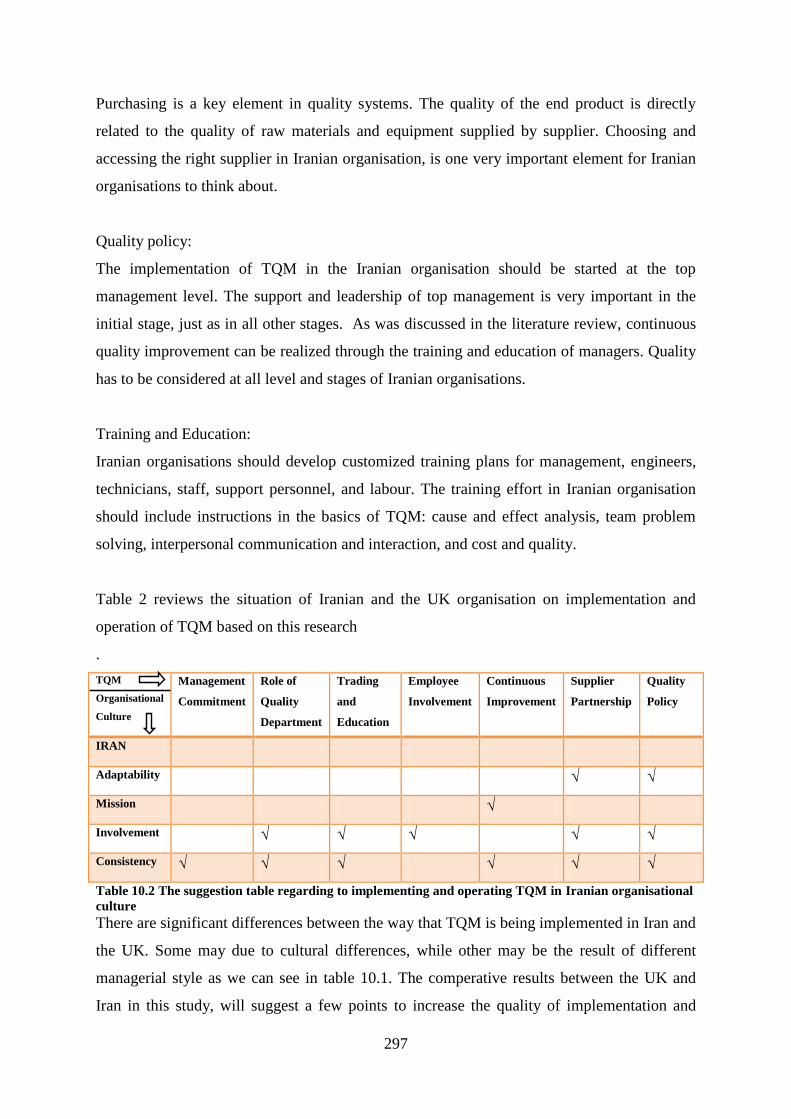
297
Purchasing is a key element in quality systems. The quality of the end product is directly
related to the quality of raw materials and equipment supplied by supplier. Choosing and
accessing the right supplier in Iranian organisation, is one very important element for Iranian
organisations to think about.
Quality policy:
The implementation of TQM in the Iranian organisation should be started at the top
management level. The support and leadership of top management is very important in the
initial stage, just as in all other stages. As was discussed in the literature review, continuous
quality improvement can be realized through the training and education of managers. Quality
has to be considered at all level and stages of Iranian organisations.
Training and Education:
Iranian organisations should develop customized training plans for management, engineers,
technicians, staff, support personnel, and labour. The training effort in Iranian organisation
should include instructions in the basics of TQM: cause and effect analysis, team problem
solving, interpersonal communication and interaction, and cost and quality.
Table 2 reviews the situation of Iranian and the UK organisation on implementation and
operation of TQM based on this research
.
TQM
Organisational
Culture
Management
Commitment
Role of
Quality
Department
Trading
and
Education
Employee
Involvement
Continuous
Improvement
Supplier
Partnership
Quality
Policy
IRAN
Adaptability √ √
Mission √
Involvement √ √ √ √ √
Consistency √ √ √ √ √ √
Table 10.2 The suggestion table regarding to implementing and operating TQM in Iranian organisational
culture
There are significant differences between the way that TQM is being implemented in Iran and
the UK. Some may due to cultural differences, while other may be the result of different
managerial style as we can see in table 10.1. The comperative results between the UK and
Iran in this study, will suggest a few points to increase the quality of implementation and
298
operation in Iranian organisation as we see in the table 10.2. The suggested points are as
follows:
The top management in Iranian organisation should support quality improvement and
think of this as key part of their mission. If they do that, employees will understand
the sensitivity and importance of TQM.
Quality policy should not simply involve consistency. The quality policy should be
adaptable within the organisation.
Human factors should not be in the corner. When the TQM philosophy need to be
applied in the organisation, the human resource has the highest potential for
effectively applying and improving TQM philosophy.
Iranian managers should determine the training and education needs of employees
systematically and, in order to conduct an effective training programme, they should
establish this procedure and broaden their effort as necessary within the procedure.
Improving the quality and supply of end products can be very expensive. It requires an
excellent strategy and involves brave managers who know and believe in themselves and are
capable of using and implementing these strategies to their specify organisation. And
moreover are capable of undertaking self sacrifices.
All the methods and strategies have to be studied by the manger and in all cases have to be
very well understood, before the implementation process takes place. These strategies and
methods have usually been formulated and tested and examined in western societies. That is
based on many fundamentals and methodologies. These strategies, where applicable, need to
be reconstructed (localised), so that the essence of strategies are well understood and applied.
In Iran, organisations have to pay more attention to the fast growing needs of high quality
end-products. With the importation of goods from China (now) and from all over the world in
future (WTO), it is essential to train and educate work forces nationwide while the time and
capital is available.
It is recommended that governmental owned, as well as private organisations must focus
highly on receiving feedback from the customers. Since quality can only be achieved and
299
progress on knowing exactly what is most needed from the enduser. Hence the allocation of
time and budget for this purpose is not a wasted strategy.
Iran for the last fifty years has always been an oil dependent country. In the past, one of the
strategies of Government was to employ many people to overcome an unemployment crise.
In doing so the degree or level of education / inelegance was not very important, at present
the ratio of NGO‟S to GO‟s in Iran is still less than one. Therefore education, training, and
then concept of quality have now to be constantly the main objectives of organisations in
Iran. In view of this, the successful implementation of TQM can and must be reached.
As mentioned already in this chapter the appropriate cultural adaptation is one of the most
important parameters for successful implementation of TQM.
300
10.5 Research limitations and suggestions for research
There are some limitations to this study that must be mentioned. Above all, the sample size
(50 companies in Iran and 40 companies in the UK) was relatively small. This sample size
prevents the researcher from performing more complex analysis on the data set. It is highly
recommended that any future research should be conducted with a larger sample size. While
production and exploration constitutes a considerable portion of the industry in Iran, the
results need to take account of other sections of industry. Accordingly, more research is
needed to specifically apply and test the results in other sectors, such as petrochemicals,
transportation, trading and services.
It is recommended that, if resources permit the same study be conducted with a larger and
more varied sample size. Due to the relatively small sample size in this study, it is sometimes
difficult to test the significance of some of the variables. With a larger sample size, it will
also be practical to use more advanced statistical tools, such as structural equation modelling
and path analysis. The researcher could not use these techniques because of the small sample
size. In future investigations of the perceptions of managers in Iran and the UK regarding
customer satisfaction, some qualitative studies are also recommended with customers of the
organisations in both countries.
It is recommended that future research should be conducted within similar cultures to Iran to
explore the significance of organisational culture on the successful implementation and
operation of TQM in Middle East countries more generally.

301
References
302
Agus, A., Krisnan, S., and Khadir, A. (2000) „The structural impact of total quality
management on financial performance relative to competitors through customer satisfaction:
a study of Malaysian manufacturing companies‟. Total Quality Management, Vol.11. No.6.
P.808-819
Agus, A., Krisnan, S., and Khadir, A. (2001) „The structural relationship between total
quality management, competitive adavantage and bottom line performance: an empirical
study of Malaysian manufacturing companies‟. Total Quality Management, Vol.12. No.8.
P.1018-1024
Alford, R.J. & Fisher, C.J. (2000) „Making the manger work‟. In Handbook of Business
Strategy. Thomson Financial Media, pp. 247 - 260.
Al-Khalifa, N., and Aspinwall, E.M. (2000) „The development of total quality management in
Qatar‟. TQM Magazine, Vol. 12. No. 3, P. 194-204
Al-Shammari, S. A. (2000) „SCECO-EAST‟s performance Improvement programme 2000‟.
Quality Beyond 2000 Challenges and opportunities conference proceeding.
Al-Sulimani, T. and Sharad, D. (1994) ‘Advent of TQM in Saudi Arabia‟. Transactions of the
American Association of Cost Engineers, P. 91-93
Aly, M. (1996) „Cultural uniqueness and implementation on the Middle East: fantasy or
reality‟. The Fourth Arab Management Conference, 16-18 July, University of Bradford, UK,
P. 146-186
Al-Zammany, Y., Hoddell, S.E., and Savage, B.M. (2002) „Understanding the difficulties of
implementing quality management in Yemen‟. TQM Magazine, Vol.14, No. 4, P. 240-247
Amaratunga, D. and Baldry, D. (2000) ‘Theory. building in facilities management research:.
NHS case study methodology‟. International Journal of Healthcare Quality Assurance.
Vol.15, No.6, PP.277 - 288.
Anjard, R. P. (1998) „Total Quality Management: Key Concepts‟. Work study, P. 238-247
303
Appelbaum, S. H. and Honeggar, K. (1998) „Empowerment: a contrasting overview of
organisation in general and nursing in particular-an examination of organisational factors,
managerial behaviour, Job design, and structural power‟. Empowerment in Organisation, P-
29-50
Asian Productivity Organisation (2002) „The quest for global competitiveness through
national quality and business excellence award‟. Report of the Symposium on Qality and
Business Excellence Awards, P. 18-20
Atkinson, P.E. (1990) Creating Culture Change: The Key to Successful Total Quality
Management, IFS Ltd, Bedford.
Auker C. R., Meszler R. M., and Carpenter D.O, (1983) „Apparent discrepancy between
single-unit activity and deoxyglucose labeling in optic tectum of the rattlesnake‟. J
Neurophysiol, No. 49, P. 1504–16
Alvesson, M. (2002) Understanding Organisational Culture, Sage Publications, London.
Baidoum, S. (2003) „An Empirical Investigation of Total Quality Management in Palestine:
A Proposed Generic Framework of Implementation.‟ University of Bradford PhD Thesis.
Baldrig National Quality Programe, (2009) Criteria for Performance Excellence.
www.baldrige.nist.gov
Balogun, J. and Johnson, G. (2003) „Organizational restructuring and middle manager sense
making‟. Academy of Management Journal, 47, 523-549
Balogun, J. (2003) „From blaming the middle to harnessing its potential: Creating
changeintermediaries‟. British Journal of Management, 14, 69-83
Bank, J. (1992) The Essence of Total Quality Management, Prentice Hall, London
304
Bartlett, C. A. and Ghoshal, S. (1993) „Beyond the m-form: Toward a managerial theory of
the firm‟. Strategic Management Journal, 14, 23-46
Barley, S.R. (1983) ‘Semiotics and the study of occupational and organizational cultures‟.
Administrative Science Quarterly, Vol. 28, P. 393-413.
Batten, J.D. (1992) „New paradigms for a total quality culture‟. Training & Development, P.
46.
Batten, J. (1994) „A Total Quality Culture‟. Management Review, P.61
Beadle, I. and Searstone, K. (1995) An investigation into the use of benchmarking within
quality programme, in Kanji, G.K. (Ed.), Total Qualiiy Management, Proceedings of the First
World Congress, Chapman-Hall, London.
Bell, J. (1999) Doing Your Research Project. A Guide for First Time Researchers in
Education and Social Sciences. Buckingham: Open University Press
Bendell, T., Boulter, L. and Kelly, J. (1993) Benchmarking for Competitive Advantage,
Pitman Publishing, London.
Benson, P.G., Sarph, J.V., and Schroeder, R.G. (1991) ‘The effects of organisational context
on quality management: an empirical investigation‟. Management Science, Vol. 17, P. 1107-
1124
Beugre, C.D., and Offodile, O.F. (2001) „Managing for organisational effectivenessin sub-
Saharan Africa: a cultural-fit model‟. International Journal of Human Resource
Management, Vol. 12, No.4, P. 535-550
Berryman, C. (1989) The manager Desk References, London: AMACO
Bertin, M.E.J. (1999) „A view of quality trends in South America in the twenty-first century‟.
The TQM Magazine, Vol. 11, No.6, P. 409-413
305
Beskese, A. and Cebeci, U. (2001) „Total quality management and ISO-9000 application in
Turkey‟. The TQM Magazine, Vol. 13. No.1, P.69-73
Bourantas, D., Anagnostelis J., and Mantes Y. (1990) „ Culture Gap in Greek Management‟,
Organisation Study, Vol. 11, P. 261-283.
Binney, G. (1992) Making Quality Work: Lessons from Europe’s Leading Companies. The
Economist Intelligence Unit, London.
Bird, A. (1993) „One bank's approach to total quality management‟. The Bankers Magazine,
May/June, P. 63-8.
Black, S.A. (1993) „Measuring the critical factors of total quality management, University of
Bradford‟. Unpublished PhD thesis.
Boaden, R, and Dale, B. (1994) „A Generic Framework for Managing Quality Improvement:
Theory and Practice‟. Quality Management Journal, P. 11-29
Booth, D. (1995) Benchmarking – the essential phase of preparation, in Kanji, G.K. (Ed.),
Total Quality Management, Proceedings of the First World Congress, Chapman & Hall,
London.
Bowen, D. and Lawler, E. E. (1992) The empowerment of service workers, what, why, how
and when, oxford, Butterworth.
Bredrup, H., (1995) „Performance Evaluation. In Performance Management: A Business
Process Benchmarking Approach‟, Chapman & Hall, London, United Kingdom, P. 191-198.
Bryman, A., (1992) „Quantitative and qualitative research: further reflections on their
integration. In: Brannen (Ed.)‟. Mixing Methods: qualitative and quantitative research,
Avebury, Aldershot,P. 57.
Brooks, I. (2003) Organisational Behaviour, Individuals, Groups and Organisation. Person
Education Limited, England
306
Brah, A.S., Tee, S.l., and Rao, M. (2002) „Relationship between TQM and performance of
Singapore companies‟. International Journal of Quality & Reliability Management, P. 356-
379
Brotton, J. and Gold, J. (2007) Human Resource Management: Theory and Practice,
Palgrave Macmillan, fourth Edition.
Brocka, B. (1992) Quality Management: Implementation the Best Ideas of the Masters,
Homewood, IL: Business One Irwin.
Burgelman, R. A. (1991) Intraorganizational ecology of strategy making and organizational
adaptation: Theory and field research. Organization Science, 2, 239-62
Burgelman, R. A. (1994) „Fading memories: A process theory of strategic business exit in
dynamic environments‟. Administrative Science Quarterly, 39, 24-56
Burgess, R. (1984) In The Field: an introduction to field research, Allen and Unwin: London
Burr, J. (1993) „A New Name for a Not-So-New Concept‟. Quality Progress, P. 87-88
Cartwright, S. and Gale, A. (1995) ‘Project Management: Different Gender, Different
Culture? A discussion on Gender and organisational culture, Leadership & organisational‟.
development studies, 16 (4): 12-16.
Carman, J.M. (1993) „Continuous quality improvement as a survival strategy: the Southern
Pacific experience‟. California Management Review, Vol. 35 No. 3, P. 118-32.
Canchick, M. (2001) „Comparing the Brazilian National Quality Award With Some of the
Major Prizes‟. The TQM Magazine, no.4.
Chan, K., Chan C. (2001) Integrated Management, in Proceedings of the International
Conference on ISO 9000 and TQM, Edited by Samuel M. Ho and Mike Donnelly.
307
Chapman, R., and Al-Khawaldeh, K. (2002) „TQM and labour productivity in Jordanian
industrial companies‟. The TQM Magazine, Vol. 14, No.4, P. 248-262
Chase, N. (1998) „Going global.‟ Quality, March, P. 32-36
Chatman, J. A. and Jehn, K.A. (1994) Assessing the Relationship Between Industry
Characteristics and Organisational culture: How different can you be? Academy of
management Journal, 37 (3): 522-543
Clinton, R.J., Williamson, S. and Bethke, A.L. (1994). „Implementing total quality
management: the role of human resources management‟. SAM Advanced Management
Journal, Spring, P. 10-16.
Cocioppe, R. (1999) „Using team-individual reward and recognition strategies to drive
organisation success‟. Leadership and Organisational Development Journal, P. 322-331.
Conti, T. (1991) „Company quality assessment.‟ The TQM Magazine, June/July, P. 14-27.
Cohen, L., Manion, L. & Morrison, K. (2000) Research Methods in Education. London:
Routledge Falmer.
Cooper, R., and Schindler, S. (2001) Business Research Methods, International Edition,
Boston, McGraw-Hill.
Corbett, L.M., Adam, E.E., Harrison, N.J., Lee, T.S., Rho, B.H., and Samson D. (1998) „A
study of quality management practices and performance in Asia and South Pacific‟.
International Journal of Production Research, Vol. 36, No. 9, P. 2597-2607
Creswell, J.W. (2003) Research design: Qualitative, quantitative, and mixed methods
approaches. (2nd ed.) Thousand Oaks: Sage
Crosby, P. (1979) Quality is free: The Art of Making Quality Certain, Penguin Books. N.Y.
Crosby, P. (1989) Let’s Talk Quality: 96 Questions that you always wanted to ask Phil
Crosby, McGraw-Hill, New York, NY
308
Cupello, J.M. (1994) ‘A new paradigm for measuring TQM progress’. Quality Progress,
May, P.79-82.
Davis, D. (2000) Business research for decision making, Fifth edition, Duxbury, A division
of Thomson Learning
Dale, B.G., Y-Wu, P., Zairi, M., Williams, A.R.T., and Van Der Wiele, T. (2001). „Total
quality management and theory: An exploratory study of contribution‟. Total Quality
Management, Vol.12, No. 4, P.439-449
Dahlgaard Park, S.M., and Dahlgaard, J. J., (2002) „Lean Production, Six Sigma Quality,
TQM and Company Culture - a Critical Review‟. TQM Magazine.
Dahlgaard, J.J., Kanji, G., and Kristensen, K. (1990). „A comparative study of quality control
methods and principle in Japan, Korea, and Denmark‟. Total Quality Management, Vol.1, P.
115-132
Dayton, N.A. (2001) „Total quality management critical success factors, a comparison: the
UK versus and the USA‟. Total Quality Management, Vol. 12, No. 3, P. 293-298
Dale, B.G. and Plunkett, J.J. (1991) Quality Costing, Chapman and Hall , London.
Dale, B., Zairi, M., and Van der Wiele, T. (2005) „Total Quality Management and Theory:
An Exploratory Study of Contribution‟. Total Quality Management, P. 439-449.
Davies, B. and Wilson, D. (1990) „TQM – organizing for success, in Oakland, J.S. (Ed.)‟.
Proceedings of the 3rd International Conference on Total Quality Management, Warwick,
IFS Ltd, Bedford.
Dean, J. W. and Bowen, D. E. (1994) „Management theory and total quality: improving
research and practice through theory development‟. The Academy of Management Journal,
Vol. 19, No. 3, P. 392-418
309
Deming, W.E. (1982) Quality, Productivity, and Competitive Position, Cambridge, Mass.:
MIT Centre for Advanced Engineering Study.
Deming, W.E. (1986) Out of the Crisis, Cambridge University Press, Cambridge.
Dedhia, N.S. (2001) „Global perspectives on quality‟. Total Quality Management, Vol. 12,
No. 6, P. 657-668
Denison, D. R. (2000) „Organizational Culture: Can it be a Key Lever for Driving
Organizational Change?‟. In Cooper, C.L., Cartwright, S. & Earley, P.C. (Eds.), The
International Handbook of Organizational Culture and Climate pp. 347-376
Deming, E. W. (1986) Out of the Crisis, MIT, Cambridge, Ma
Deming Prize (2009) The Deming prize guide,
http://www.juse.or.jp/e/deming/pdf/demingguide2009.pdf
Dervitsiotis, K. N. (2001) „Emerging elements of a world view for sustainable quality‟. Total
Quality Management, Vol. 12, No. 8, P. 817-824
Deon, J. W., Bowen, D. E. (1994) „Management theory and total quality management:
improving research and practice through theory development‟. Academy of Management
Review, Vol. 19 No.2.
Djerdjour, M. (2000) „Overview of the quality movement in the South Pacific Island‟. The
TQM Magazine, Vol. 12, No. 1, P. 62-66
Djerdjour, M., and Patel, R. (2000) „Implementation of quality programs in developing
counties: a Fiji Island case study‟. Total Quality Management, Vol. 11, No. 1, P. 25-44
Drummond, H. (1992) The Quality Movement: What Total Quality Management is Really All
About, Kogan Page Ltd, London.
Dwan, S. (2004) Changing organisational culture, NZB, June 2004.
310
Easterby-Smith, M., Thorpe, R., Lowe, A. (2002) Management Research: An Introduction,
2nd Edition, Sage: London.
Easton, G.S. (1993) „The 1993 state of US total quality management: a Baldrige examiner‟s
perspective‟. California Management Review, Vol. 35 No. 3, P. 32-54.
Ebrhimpour, M., and Johnson, J. L. (1992) „Quality,vendor evaluation and organisational
performance: a comparison of U.S. and Japanese firms‟. Journal of Business Research, Vol.
25, P. 129-142
Edosomwan, J.A. (1992) „Six Commandments to Empower Employee for Quality
Improvement‟. Industrial Engineering, P. 14-15
Edson, J. and Shannahan, R. (1991) „Managing quality across barriers‟. Quality Progress,
February, P. 45-7.
EFQM (2006) The EFQM Business Excellence Model, The European Foundation For Quality
Management, www.efqm.org
EFQM, (2010) introduction to EFQM model, http://ww1.efqm.org
Eisenhardt, K. M. (1989) „Building theories from case study research‟. Academy of
Management Review, 14(4), P. 548–549.
Eklof, J. A., and Selivanova, I. (2000) „Corporate quality management practices in Russia:
with international comparisons‟. Total Quality Management, Vol. 11, No. 6, P. 714-719
Eskildson, L. (1995) „TQM‟s Role Corporate Success: Analysis the Evidence.‟ National
Productivity Review, P.25-38.
Escanciano, C., Fernandez, E., and Vazquez, C. (2001) „ISO 9000 certification and quality
management in Spain: results of a national survey‟. The TQM Magazine, Vol. 13, No.3, P.
192-200
311
Eskildson, L, (1994) „Improving the odds of TQM‟s success‟. Quality Progress, Vol. 27, No
4, PP, 61-3.
Evans, J.R., and Lindsay, W.M. (2001) The Management and Control of Quality, New York:
West Publication,
Evans, J. R. and Lindsay, W.M. (2001) The Management and Control of Quality, 5th
edn,
New York: West Publication.
5th
edition.
Fawcett, S.E., Calantone, R.J., and Roath A. (2000) „Meeting quality and cost imperatives in
a global market‟. International Journal of Physical Distribution & Logistics, Vol. 30, No. 6,
P. 427-499
Feigenbaum, A.V. (1989) „Seven Keys to Constant Quality‟. Journal for Quality and
Participation, P. 20-23
Feigenbaum, A.V. (1994) „Quality leadership in the global economy‟. Journal of Quality and
Participation, No. 3, P. 36-41
Feigenbaum, A. V. (1997) Changing concepts and management of quality worldwide,
Quality Progress, Vol.30, No. 12, P. 45-48
Fey, C.F. and Denison, D.R. (2003) „Organisational culture and effectiveness: can American
theory be applied in Russia?‟. Organisation Science, Vol. 14 No. 6, P. 686-706.
Findlay, I., Wilshaw, G. and Dale, B.G. (1990) Total quality management in sales and
marketing organization: introduction and development, in Oakland, J.S. (Ed.),
Flood, R.L. (1995) Beyond TQM, England: John Wiley and Sons.
Floyd, S. W. and Wooldridge, B. (1997) Middle management‟s strategic influence and
organizational performance. Journal of Management Studies, 34, P. 465-485
312
Floyd, S. W. and Wooldridge, B. (2000) Building strategy from the middle:
Reconceptualising strategy process, Thousand Oaks, Cal.: Sage
Floyd, S. W. and Lane, P. J. (2000) „Strategizing throughout the organization: Management
role conflict in strategic renewal‟. Academy of Management Review, 25, P. 465-485
Flynn, B.B. (1992). Managing for quality in the US and in Japan, Interfaces, Vol. 22, No. 55,
P. 69-80
Flynn, B. B., Schroeder, R. G., and Sakakibara, S. (1994) „A framework for quality
management research and an associated instrument‟. The Academy of Management Journal,
vol. 11, P. 339-366
Fountain, M. (1998) „The Target Assessment Model as on International Standard for Self-
assessment‟. Total Quality Management. Vol. 9
Garver, M. and Mentzer, J. (1999) „Logistics research methods: employing structural
equation modelling t test for construct validity‟. Journal of Business Logistics, Vol. 20, P. 33-
57.
Garvin, D.A. (1987) „Competing on the Eight Dimensions of Quality‟. Harvard Business
Review, vol. 65, P. 101-109
Garvin, D.A. (1988) Managing Quality: The Strategic and Competitive Edge, McGraw-Hill,
NY
Gehani, R. (1993) „Quality Value-Chain: A Meta-Synthesis of Frontiers of Quality
Movement‟. Academy of Management Executive, vol. 7, P. 29-42
George S. and Weimerskirch, A. (2000) Total Quality Management: Strategies and
Techniques Proven at Today’s Most Successful Companies, John Wiley and Sons.
Gilbert, G.R. (1993) „Employee Empowerment: Flaws and Practical Approaches‟. The Public
Manager/The New Bureaucrat, P.45-48
313
Gjelsvik, J. (2001) Influence of Islamic culture on Scandinavian Management in Malaysia.
The university of Bergen.
Glover, J. (1993) „Achieving the organizational change necessary for successful TQM‟.
International Journal of Quality & Reliability Management, Vol. 10 No. 6, P. 47-64.
Glaser, Barney G, & Anselm L. Strauss. (1999) The Discovery of Grounded Theory:
Strategies for Qualitative Research. New York, NY: Adline De Gruyter.
Goodman, J. A., Bargatze, G.F. and Grimm, C. (1994) „The Key Problem With TQM‟.
Quality Progress, Vol, 27, P.45-48.
Goodstadt, P. (1990) Exceeding customer satisfaction, in Oakland, J.S. (Ed.),
Gore, E.W. (1999) „Organisational culture, TQM, and Business Process Reengineering: An
Empirical Comparison‟. Team performance Management, an International Journal, Vol. 5.
P. 164-170.
Goulden, C. and Rawlins, L. (1995) „A hybrid model for process quality costing‟.
International Journal of Quality & Reliability Management,Vol. 12 No. 8, P. 32-47
Govers, C.P.M. (2001) „QFD Not Just a Tool But a Way of Quality Management‟.
International production of Economies, P. 151-159
Gomez, C. (2004) „The influence of environmental, organisational and HRM factors on
employee behaviours in subsidiaries: a Mexican case study of organisational learning‟.
Journal of World Business, Vol. 39 No. 1, P. 1-11.
Goncalo, J. A. and Staw, B.M. (2006) „Individualism and group creativity‟. Organisational
Behaviour and Human Decision Processes, Vol. 100, P. 96-109
Golden-Biddle, K., & Locke, K. (1997) Composing qualitative research. Thousand Oaks,
CA: Sage
314
Grahn, D.P. (1995) „The Five Drivers of Total Quality‟. Quality Progress, Vol.28
Grant, R.M., Shani, R. and Krishnan, R. (1994) „TQM‟s challenges to management theory
and practice‟. Sloan Management Review, Vol. 35, No. 2, P. 25-35
Groocock, J.M. (1986) The Chain of Quality, Chichester: John Wiley and Sons.
Guvenc G. Alpander, Carroll R. Lee, (1995) Culture, strategy and teamwork College of
Business Administration, University of Maine, Maine, USA
Hair, J., Babin, B., Money A. H., and Samouel P. (2003) Essentials Of Business Research
Methods, Wiley
Hall, E. (1976) Beyond culture, New York: Doubleday
Hansen, G., Wernerdelt, B., (1989) „Determinants of firm performance: the relative impact of
economic and organisation factors’. Strategic Management Journal, 10, 3, 3999-411.
Haksever, C. (1996) „Total quality management in the small business environment‟. Business
Horizons, March-April, P. 33-40.
Hamzah, A. and Zairi, M. (1996) „People Management: Where is the Evidence of Best
Practice? Part III‟. Training for Quality, Vol. 4, P.37-44.
Hardaker, M. and Ward, B.K. (1987) „How to make a team work‟. Harvard Business Review,
Vol. 65 No. 6, P. 112-20.
Harari, O. (1993) „Ten Reasons Why TQM Doesn‟t Work‟. Management Review, Vol. 82, P.
33-38
Heath, P. (1989) „The Path to Quality Achievement Through Teamwork Plus Commitment‟.
International Journal of Quality and Reliability Management, Vol.1, P. 51-59.
315
Hellsten, U. and Klefsjo, B. (2003) „TQM as a Management system consisting of values,
techniques and tools‟. The TQM Magazine, Vol.12 No.4, pp. 238-44
Hill, S. and Wilkinson, A. (1995) „In Search of TQM‟. Employee Relations, vol. 17, P. 8-25.
Hirschhorn, L. and Gilmore, T. (1992) „The new boundaries of the boundaryless company‟.
Harvard Business Review, Vol. 70 No. 3, P. 104-15.
Hofstede, G. (2001) Culture Consequences, Second edition, Sage Publication, California.
Hofstede, G. (1980) Culture’s Consequences International Differences in Work Related
Values, Beverly Hills: C. A: Sage.
Hofstede, G. (1984) Culture’s Consequences International Differences in Work Related
Values, Beverly Hills: C. A: Sage.
Hofstede, G. (1998) „Attitudes, Values and organisational culture: Disentangling the
Concepts‟. Organisation studies, 19 (3): 477-493.
Hofstede, G. (2001) Culture Consequences, Second edition, Sage Publication, California.
Hofstede, G. (2007) Geert Hofstede cultural dimensions, http://www.geert-hofstede.com
Hoffman, K. D., and Bateson, E. G. (1997) Essentials of service marketing, Fort Worth: The
Dryden Press
Hull, F., Azumi, K.A., and Wharton, R. (1988) „Suggestion rates and socio-technical systems
in Japanese versus American factories: beyond quality circles‟. IEEE Transactions on
Engineering Management, February, P. 11-24
Hussey, J. & Hussey, R. (1997) Business Research. Macmillan Press Ltd, Basingstoke
316
Ishakawa, K. (1985) What Is Total Quality Control? The Japanese Way, Englewood Cliffs,
NJ: Prentice-Hall
Israeli, A. and Fisher, B. (1991) „Cutting quality costs‟. Quality Progress, January, P. 46-8.
Jabnoun, N. and Sedrani, K. (2005) „TQM, culture and performance in UAE manufacturing
Firms‟. Quality Management Journal, Vol. 12 No. 4, P. 8-20.
Jankovicz, A. D. (1995) Business Research Project, Thompson Business Press, London.
Jagadeesh, R. (1999) „Total Quality Management in India-perspective and analysis‟. Total
Quality Management, Vol. 11, No. 5, P. 321-337
Janas, I., and Luczak, H. (2002) „Explorative study of the expected consequences for existing
quality management systems due to the revision of ISO-9001 in certified companies in
Germany‟. The TQM Magazine, Vol. 14, No. 2, P. 127-132
Jarrar, Y.F. and Zairi. M. (2001) „Future trends in benchmarking for competitive advantage:
A global survey‟. Total Quality Management, Vol. 12, No. 8, P. 906-912
Jaeger, A. M. (1983) „The Transfer of Organisational Culture Overseas: An Approach to
Control in the Multinational Corporation‟. Journal of International Business Studies, 14 (2):
91-114
Jacquelin A. M. and Shapiro, C. (1999) „Employee Participation and Assessment of an
Organisational Change Intervention Three-Wave Study of Total Quality Management‟. The
Journal of Applied Behavioural Science, Vol. 35, P. 439-456.
Johnson, R.S. (1993) „TQM: leadership for the quality transformation.‟ Quality Progress,
Vol. 26 No. 1-5.
Johnston, C.G. and Daniel, M.J. (1991) Customer Satisfaction Through Quality. An
International Perspective, The Conference Board of Canada, Ottawa, Ontario.
317
Jung, J., Su, X., Baeza, M., and Hong, S. (2008) „The effect of organisational culture
stemming from national culture towards quality management deployment‟. The TQM
magazine, Vol. 20, P. 622-635
Juran, J. M. (1974) Quality Control Handbook, McGraw- Hill, London.
Juran, J. M. (1988) Quality Control Handbook, McGraw-Hill, New York.
Kanousi, A. (2005) „An empirical investigation of the role of culture on service recovery
Expectations‟. Managing Service Quality, Vol. 15 No. 1, P. 57-69
Kanji, G.K. and Asher, M. (1993) Total quality management process - a systematic
approach, Advances in Total Quality Management Series, Carfax Publishing Co., Abingdon.
Kanji, G.K. (1990). „Total Quality Management: The Second Industrial Revolution‟. Total
Quality Management, vol. 1, P. 3-11
Kanji, G, (2002) „On TQM role in Globalization and the knowledge-Based Community‟.
Congress in Dubai
Kanji, G.K, and Yui, H. (1997) „Total Quality Culture‟. Total Quality Management, Vol. 8,
P. 417-427.
Kano, N. (1993) „A Perspective on Quality Activities In American Firms‟. California,
Management review, P. 12-31.
Kanter, R. M. (2004) „The middle manager as innovator‟. Harvard Business Review, 83,
July-August, P. 150-161
Kathawala, Y. and Nanda, V. (1989) „Quality in a global context: a framework for analysis‟.
International Journal of Quality & Reliability Management, Vol. 6, No.2, P. 31-39
Kaynak, H. (2003) „The relationship between total quality management and their effects on
firm performance‟, Journal of Operations Management, Vol. 34 No.2, P.1-31
318
Kekale, T. and Kekale, J. (1995) „A mismatch of Cultures, A Pitfall of Implementation A
Total Quality Approach‟. International Journal of Quality and Reliability Management, Vol.
12, P. 210-220.
Khan, M. (2000) „Managing Change in the Middle East: Quality Beyond 2000‟. Conference
Proceedings, P. 35-49.
Kim, K.Y., and Chang, D. R. (1995) ‘Global quality management: a research focus‟.
Decision Sciences, Vol. 26, No. 5, P. 561-568
King, A. W., Fowler, S. W. and Zeithaml, C. P. (2001) „Managing organizational
competencies for competitive advantage, The middle-management edge‟. Academy of
Management Executive, 15, P. 95-106
Kleiner, B.M. (1994) „Benchmarking for continuous performance improvement‟. Total
Quality Environmental Management,Spring, P. 283-95.
Knouse, S. B. (1995) The Reward and Recognition Process in Total Quality Management,
ASQC Quality Press, Milwaukee, WI.
Kordupleski, R. E., Rust, R. T. and Zahoril, A. J. (1993) „Why Improving Quality Doesn‟t
Improve Quality (Or Whatever Happened to Marketing?),‟ California Management Review,
Vol. 35, P. 82-95.
Krasachali, L. and Tannock, J.D.T. (1999) „A Study of TQM Implementation in Thailand‟.
International Journal of Quality and Reliability Management, Vol. 6. P. 418-432.
Krishman, R. (1993) „In Search of Quality Improvement: Problems of Design and
Implementation‟. Academy of Management Executive, Vol, 7, P. 7-20.
Kroeber, A. and Kluckhohn, C. (1985) Culture: A critical review of concepts and definitions.
New York: Random House.
319
Laszlo, G. (1998) „ISO 9000 or TQM: which approach to adapt-a Canadian case study‟. The
TQM Magazine, Vol. 10, No. 5, P. 362-366
Lawler, E. (1994) „Total Quality Management and Employee Involvement, Are They
Compatible?‟. Academy of Management Executive, P. 68-76.
Lee, C.Y. and Crouch, H.L. (1996) „Quality management in Korea: an empirical
investigation‟. Proceedings of Pan-Pacific Conference XIII, Japan, P. 144-146
Lee, C.Y. (1998) „Quality management by small manufacturing in Korea: an exploratory
study‟. journal of Small Business Management, Vol. 10, P. 61-67
Leonard-Barton, D. (1990) „A dual methodology for case studies: synergistic use of a
longitudinal single site with replicated multiple sites‟. Organisational Science, 1(3), 249.
Litwin, M. S. (1995) How to Measure Survey Reliability and Validity. London: Sage
Likert, R. (1961) New patterns of management, New York: McGraw-Hill
Livian, Y.-F. and Burgoyne, J. G. (1997) Middle managers in Europe, London: Routledge
Liu, V.C. and Kleiner, B.H. (2001) „Global trends in managing innovation and quality‟.
Management Research News, Vol. 24, No. 4, P. 13-16
Lok, P. and Crawford, J. (2004) „The effect of organisational culture and leadership style on
job satisfaction and organisation commitment‟. Journal of management development. Nov
2004
London, C. and Higgot, K. (1997) „Case studies: An employee reward and recognition
process‟. The TQM Magazine, P. 328-335
Longenecker, C.O. and Scazzero, J. A. (1993) „Total Quality Management from Theory to
Practice: A Case Study‟. International Journal of Quality and Reliability Management, P. 24-
31.
320
Lorsch, J.W. (1986) „Managing Culture: The Invisible Barrier to Strategic Change‟.
California Management Review, Vol. 28. P. 95-110.
Luzon, M.D.M (1988) „Quality Circles and Organisational Culture‟. The international
Journal of Quality and Reliability Management, P. 46-56.
Madu, C. N., Kuei, C., and Lin C. (1995) A comparative analysis of quality practice in
manufacturing firms in the US and Taiwan, Decision Sciences, Vol. 26, P. 621-636
Martinez-Lorent, A. (2001) „Total Quality Management‟. The TQM Magazine, P. 378-386.
Martin, J., Frost, P.J. and O‟Neill, O.A. (2006) Organisational culture: beyond struggles for
intellectual dominance, in Clegg, S.R., Hardy, C., Lawrence, T.B. and Nord, W.R. (Eds), The
Handbook of Organisation Studies, 2nd ed., Sage Publications, Newbury Park, CA
Martin, J. (2002) Organisational Culture: Mapping the Terrain, Sage Publications, London.
Masson, R., and Raeside, R. (1999) „Quality in Scotland‟. The TQM Magazine, Vol.11, No.
Mann, R.S. and Kehoe, D. (1995) „Factors Affecting the Implementation and Success of
TQM‟. International Journal of Quality and Reliability Management, P. 11-23.
Maull, R., Brown, P. and Cliffe, R. (2001) „Organisational culture and quality improvement‟.
International Journal of Operations & Production Management, Vol. 21 No. 3, P. 302-326.
McAdam, R. (1996) „An integrated business improvement methodology to refocus business
improvement efforts‟. Business Process Re-engineering & Management Journal,Vol. 2 No.
1, P. 63-71.
McAdam, R., and Jackson, N. (2002) „A sectoral study of ISO-9000 and TQM transitions:
the US and Irish brewing sector‟. Integrated Manufacturing Systems, Vol. 13, No. 4, P. 255-
263
321
McClintock, C.C, Brannon, D, Maynard-Moody, S (1979) „Applying the logic of sample
surveys to qualitative case studies: the case cluster method‟. Administrative Science
Quarterly, Vol. 24 PP.612-29
McDaniel C., Gates R. (2001) Marketing research essentials. 3rd ed. Cincinatti, Ohio: South-
Western.
Mcdonnel, J. (1994) „The route to total quality management ± part one‟. Managing Service
Quality, Vol. 4 No. 3, P. 41-5.
Mcconnel, C. (1995) „Total Quality and the Shifting Management, Paradigm‟. Health
Supervisor, P. 71-79.
McNair, C.J. and Leibfried, L. (1992) Benchmarking: A Tool for Continuous Improvement,
Harper Business, New York, NY.
Mead, M. (ed.) (1951) Cultural Patterns and Technical change. Paris: UNESCO
Minett, S., and Ellis, S. (1997) „Using Empowerment to turn Employees into Entrepreneurs
too far‟. Train for Quality, P. 78-83
Mitchell, C.M. (1995) Preparing for benchmarking: an effective benchmarking strategy, in
Kanji, G.K.(Ed.), Total Quality Management: Proceedings of the First World Congress,
Chapman-Hall, London.
Modaress, B. and Aussari, M. (1989) Quality control techniques in US firms: a survey,
Production and Inventory Management Journal, 2nd quarter.
Mosadegh Rad, AM. (2003) „Introducing a practical model in Total Quality Management’.
The 2nd
congress in Total Quality Management in Health Care, Iran
Mosadegh Rad, A. (2003) „Introducing a practical model in Total Quality Management‟. The
2nd
congress in Total Quality Management in Health Care, Iran.
322
Mosadegh Rad, A. (2006) „The impact of organisational culture on the successful
implementation of Total Quality Management‟. Emerald, Vol. 18, Issue. 6
Mortazavi, SH., Tayab, M.S., and Amirshahi, M.A. (1999) Culture, Human Resource
Management and Organisation Behaviour, Nakhi, Tehran. 1, P. 12-16
Mortazavi, SH., Tayab, M.S., and Amirshahi, M.A. (1999) Culture, Human Resource
Management and Organisation Behaviour, Nakhi, Tehran.
Mosadegh Rad, A. (2003) Introducing a practical model in Total Quality Management, The
2nd
congress in Total Quality Management in Health Care, Iran.
Mosadegh Rad, A. (2006) „The impact of organisational culture on the successful
implementation of Total Quality Management‟. Emerald, Vol. 18, Issue. 6
Newman, R.G. (1988) „Primary source qualification‟. Journal of Purchasing & Material
Management, Summer, P. 10-17.
N.I.S.T. (1999) Malcolm Baldrige National Quality Award Criteria, U.S. Department of
Commerce, National Institute of Standards and Technology.
Oakland, J.S. (1993) Total Quality Management, Butterworth- Heinemann, Oxford.
Oakland, J.S. and Beardmore, D. (1995) „Best practice customer service‟. Total Quality
Management, Vol. 6 No. 2, P. 135-48.
Oakland, J.S. and Porter, L. (1994) Cases in Total Quality Management, Butterworth
Heinemann, Oxford.
Oakland, J.S. (2000) Total Quality Management-Text with Cases, Butterworth Heinemann,
2nd
edition.
323
Olian, J.D. and Rynes, S.L. (1991) „Making total quality work: Aligning organizational
processes, performance measures, and stakeholders‟. Human Resource Management, Vol. 30
No. 3, P.303-33.
Oppenheim, A. N. (1992) Questionnaire Design, Interviewing and Attitude Measurement, 2nd
edition, London: Pinter Publications.
Pattigrew, T. F. (1983) „Toward uniting social psychology‟, Contemporary Sociology, Vo.
12, P. 6-8
Perry, C. (1997) „Total quality management and re-conceptualizing management in Africa‟.
International Business Review, Vol. 6, No. 3, P. 233-243
Porter, L.I. and Tanner, S.I. (1995) Business improvement through self-assessment – a case
study from financial services, in Kanji, G.K. (Ed.), Total Quality Management. Proceedings
of the First World Congress, Chapman & Hall, London.
Porter, L.J. and Parker, A.J. (1993) „Total quality management – the critical success factors‟.
Total Quality Management, Vol. 4 No. 1, P. 13-22.
Powell, T.C. (1995) „Total quality management as competitive advantage: a review and
empirical study‟. Strategic Management Journal, Vol.16 P.15-37
Prajogo, D.I. and McDermott, C.M. (2005) „The relationship between total quality
management practices and organisational culture‟. International Journal of Operations &
Production Management, Vol. 25 No. 11, P. 1101-11022.
Preffer, J. (1994) Competitive Advantage through People, Harvard University Press, Boston,
MA
Price, R.C. and Gaskill, G.P. (1990) „Total quality management in research philosophy and
practice, in Oakland, J.S. (Ed.)‟. Proceedings of the 3rd International Conference on Total
Quality Management, Warwick, IFS Ltd, Bedford.
324
Proceedings of the 3rd International Conference on Total Quality Management, Warwick,
IFS Ltd, Bedford.
Prybutok V.R. and Kappelman L.A. (1995) „Early Empowerment Creates Productivities
Outcomes During Organisational Transformation.‟ Work Study, Vol. 44. P. 15-18.
Pugh, D. S.; Hickson, D. J.; Hinings, C. R. and Turner, C. (1968) „Dimensions of
organization structure‟. Administrative Science Quarterly, 13, P. 65-91
Pulate B.M. (1994) „Total Quality Management: A Framework for Application in
Manufacturing‟. The TQM Magazine, Vol. 6, P. 44-49
Quality Progress, (1995) „Workforce Study Identifies Most Calued Employee
Characteristics‟. Quality Progress, vol.28, P.14.
Quazi, H.A, Hing, C.H., and Meng, C.T. (2002) „Impact of ISO 9000 certification on quality
management practices: A comparative Study‟. Total Quality Management, Vol. 13, No. 1, P.
53-67
Rabbins, S., P. and Branwell, N. (2006) Organisation Theory: Concept and Cases, Pearson
Education Australia, Fifth Edition
Rahman, S. (2002) „A review of empirical research on total quality management using Scale
developing methods: an Australian perspective‟. Total Quality Management, Vol. 13, No. 5,
P. 635-649
Rafiq, M., and Ahmad, P.K. (1998) „A contingency model for empowering customer-contact
services employees‟. Management Decision, P. 686-693.
Ramirez, C. and Loney, T. (1993) „Baldrige Award Winners Identify the Essential Activities
of a Successful Quality Process‟. Quality Digest, P. 38-40.
325
Rao, S.S., and Raghu-Nathan, T.S. (1997) „Does ISO 9000 have an effect on quality
management practices? An international empirical study‟. Total Quality Management, Vol. 8,
No. 6, P. 333-344
Rao, S.S., Raghu-Nathan, T.S., and Solis, L.E. (1998) „The best commonly followed
practices in the human resource dimension of quality management in the new industrialized
countries (NIS): the case of India, China, and Mexico‟. International Journal of Quality &
Reliability Management, Vol. 16, No.3, P. 215-225
Rao, S.S., Solis, L.E., and Raghunathan (1999) „A framework for international quality
management research: Development and validation of a measurement instrument‟. Total
Quality Management, Vol. 10, No. 7, P. 1047-1075
Raval, D. (1992) „Comparative evaluation of U.S. and Japanese total quality management
concepts‟. Proceedings of the 30th
International Atlantic Economic Conference, Plymouth,
MA.
Remenyi, D., Williams, B., Arthur, M., and Swartz, E. (1998) Doing research in business
and management : an introduction to process and method, SAGE, London
Reeves, C.A., and Bednar, D.A. (1994) „What Prevents TQM Implementation in Healthcare
Organisations?‟. Quality Progress, P. 41-44
Reitsperger, W.D. and Daniel, S.J. (1991) „A Comparison of quality attitudes in the USA and
Japan: empirical evidence‟. Journal of Management Studies, Vol. 28, No. 6, P. 585-599
Riley, J.F. (1993) „Just exactly what is total quality management?‟. Personnel Journal,
February, P. 32.
Rogers, R.E. (1993) „Managing for quality: current differences between Japanese and
American approaches‟. National Productivity Review, Vol. 12, P. 503-517
Ross, J.E. (1999) Total Quality Management, Texts, Cases and Readings, 3rd
edition, St.
Lucie Press.
326
Samuel, M. (1992) „Catalysts for Change‟. The TQM Magazine.
Saremi, M., Mousavi, M. and Sanayei , A. (2009) „TQM consultant selection in SMEs with
TOPSIS under fuzzy environment‟. Science Direct, P. 2742-2749
Saraph, JV., Benson, PG., and Schroeder, RG. (1989) „An instrument for measuring the
critical factors of quality management‟. Decision Sciences, Vol. 20, P. 810–829
Sarker, B. (1990) „Status of quality control in Indian industries-a survey‟. Total Quality
Management Journal, Vol. 1, P. 133-146
Sashkin, M., and Kiser, K. (1992) „What is TQM?‟. Executive Excellence, vol. 9, P. 11-17
Sathe, V., (1983) „Implication of Corporate Culture: A manager Guide to Action‟.
Organisational Dynamics, Autumn
Saunders, M., Lewis, P. and Thornhill, A. (2007) Research Methods for Business Students,
4th ed., Prentice Hall
Schapiro, J.C. (1995) „The Impact of a TQM Intervention on Teamwork‟. Employee
Relations, P. 63-74
Schermerhorn, J. (2002) Management, 7th
edition
Schein, E.G. (1992) Organizational Culture and Leadership. San Francisco: Jossey-Bass
Publisher.
Scholtes, P. R. (1995) „Do reward and recognition systems work?‟. Quality Magazine,
December , P. 27-9.
Schonberger, R.J. (1992) „Total quality management cuts a broad swath ± through
manufacturing and beyond‟. Organizational Dynamics, Vol. 20 No. 4, P. 16-78.
Schwartz, H., and Davis, S.M. (1981) Matching Corporate Culture and Business Strategy,
organizational dynamics.
327
Sekaran U. (1992) Research methods for business: a skill-building approach. 2ed Edition.
John Wiley & sons, Inc.
Siehl, C. and Martin, J. (1990), „Organisational culture: a key to financial performance‟. in
Schneider, B. (Ed.), Organisational Climate and Culture, Jossey-Bass, San Francisco, CA, pp.
241-281.
Sila, I., and Ebrahimpour, M. (2003) „Examination and comparison of the critical factors of
total quality management (TQM) across countries‟. International Journal of Production
Research, Vol. 41, P. 235-268
Sinclair, D.A.C. (1994) Total quality-based performance. unpublished PhD thesis, University
of Bradford.
Smircich, L. (1983) „Concepts of culture and organisational analysis‟. Administrative science
Quarterly, Vol. 339, p. 58.
Smith, S. (1994) The Quality Revolution, Management Books 2000 Ltd, Didcot.
Spagnola, R.G. and Spagnola, C.M. (1993) „Total quality management in commercial
lending‟. The Journal of Commercial Lending, February, P. 6-17.
Sohal, A., and Wirth A. (1989) „Total quality control in an Asian division of a multinational
corporation‟. International Journal of Quality & Reliability Management, Vol.6, P. 60-74
Soin, S. (1992) Total Quality Control Essentials: Key Elements, Methodologies, and
Manager for success. New York: McGraw-Hill.
Solis, L.E., and Rao, S.S. (1997) ‘Total quality management: experience from Mexican top
quality achievers‟. Industrial Production, Vol. 1, P. 18-23
Spenley, P. (1992) World Class Performance Through Total Quality. Chapman-Hall,
London.
328
Spradley, J. P. (1979) The ethnographic interview. New York: Holt, Rinehart & Winston
Spring, M., McQuater, R., Swift, K., Dale, B. and Booker, J (1998) „The use of Quality Tools
and Techniques in Products Introduction: An Assessment Methodology‟. The TQM
Magazine, vol. 10, P.45-50.
Stablein, R. (1996) Data in Organisation Studies. In S.R. Clegg, C. Hardy and W.R. Nord
(eds.)Handbook of Organization Studies, Sage, London, P. 509-525.
Stamatis, D.H. (1997) Total Quality Management in Healthcare: Implementation Strategies
for Optimum Results. Daray Beach, Lucie Press.
Stewart, I., Barnes-Holms, D., Barnes-Holms, Y., Bond, F.W., and Hayes, S.C. (2006)
„Relational Frame Theory and Industrial/Organisational Psychology‟. Acceptance and
Mindfulness at Work: Applying Acceptance and Commitment Therapy and Relational Frame
Theory to Organisational Behaviour Management, Binghamton, NY: The Haworth Press,
P.55-90
Strauss, A. & Corbin, J. (1998) Basics of Qualitative Research: Grounded Theory
Procedures and Techniques, Sage, 2nd Ed. 1998
Sunday, J.L. and Liberty, L. (1992) „Benchmarking the Baldrige Award‟. Quality
Progress,Vol. 25 No. 9, P. 75-7.
Symon, G. and Cassel, C. (1998) Qualitative Methods and Analysis in Organisational
Research. London: SAGE publications.
Tan, P.K. (1997) „An Evaluation of TQM and Techniques for Successful Implementation‟.
Training for Quality, P.150-159.
Tayeb, M. (1994) „Organisations and National Culture: Methodology Considered‟.
Organisation studies, 15 (3): 429-444
329
Taylor and Bogdan (1984) Introduction to Qualitative Research Methods: The Search for
Meanings. Second Edition. New York: John Wiley and Sons.
Taguchi, G. (1987) On-line Quality Control During Production, Japanese Standards
Association, Tokyo, Japan
Taiwo, J. (2001) „Systems approaches to total quality management‟. Total Quality
Management, Vol. 12, No. 8, P. 967-973
Temtime, Z.T. and Solomon, G.H. (2002) „Total quality management and the planning
behaviour of SMEs in developing economies‟. The TQM Magazine, Vol. 14, No. 3, P. 181-
191
Temtime, Z.T. (2003) „The moderating impact of business planning and firm size on total
quality management practices‟. The TQM Magazine, Vol. 15, P. 52-60
Thairu, W. (1999) Team building and total quality management (TQM) in Africa.
Management of organisational in Africa: A Handbook of reference, P. 267-279
The X Factor, (1999) Winning Performance Through Business Excellence. European Centre
for Business Excellence.
Thiagarajan, T and Zairi, M. (1997) „A review of total quality management in practice: part
III‟. The TQM Magazine Volume 9 · Number 5. P. 344–356
Thiagaragan, T. (1996) „An empirical study of total quality management (TQM) in Malaysia:
A reposed framework of generic application‟. PhD thesis. University of Bradford
Tsiotrs, G. and Gotzamani, K. (1994) „ISO-9000 as an entry key to TQM: the case of Greek
industry‟. International journal of Quality Management & Reliability Management, Vol. 13,
No.4, P. 64-76
Van Maanen J. (1979) Qualitative Methodology, Sage, Beverly Hills
330
Vermeulen, W. and Crous, M. J. (2000) „Training and Education for TQM in the Commercial
banking Industry South Africa‟. Managing Service Quality, P.61-67
Waldman, D. (1993). A Theoretical Consideration of Leadership and Total Quality
Management, Leadership Quarterly, P. 65-79
Wallach, E., (1983) „Individuals and organisation: the culture match‟. Training and
Development Journal, 12, 28-36
Westlund, A. and Lothgren, M. (2001) „The Interaction between Quality, Productivity, and
Economic Performance: The case Swedish Pharmacies‟. Total Quality Management, P. 358-
396.
Wicks, A.C. (2001) „The value dynamic of total quality management: ethics and foundations
of TQM‟. Business Ethics Quarterly, Vol. 11, No. 3, P. 501-536
Wilkinson, A, and Willmot, H. (1995) Making Quality Critical-New Perspectives on
organisational change, London: Routledge.
Wilkins, A., and Ouchi, W., (1983) „Efficient cultures: exploring the relationship between
culture and organisational‟. Administrative Science Quarterly, Vol. 28, P. 468-481
Wilson, D. D., Collier. D. A. (2000) „An empirical investigation of the Malcolm Baldrige
National Quality Award causal model‟. Decision Sciences, Vol. 31, P.361390
Wong, Y. (1992) Research directions in hypermedia, Australian Centre for Unisys Software
North Ryde, NSW
Yin, R. K. (1992) „Case study design‟. In Encyclopedia of Educational Research, Vol. 1, P.
136.
Yin, R. K. (1994) Case study research: design and methods, (2nd
ed). Thousand Oaks, CA:
Sage.
331
Zairi, M, (1996) „Economic development and global competitiveness: why should Arab
manager take note of total quality management‟. The fourth Arab Management Conference,
P. 408-423
Zairi, M. and Youssef, M. A. (1995) „Benchmarking Critical Factors for TQM: Part I: Theory
and Foundation‟. Benchmarking for Quality Management and Technology, P. 5-20.
Zeitz, G., Russel, J. and Ritchie, J.E. (1997) „An Employee Survey Measuring Total Quality
Management Practices and Culture: Development and Validation‟. Group and
Organisational Management, vol.22.
Zhang, Z. (2000) „Quality management approach in China‟. The TQM magazine, Vol. 12, P.
92-104
Zhang, Z., Waszink, A. and Wijngaard, J. (2000) „An Instrument for Measuring TQM
Implementation for Chinese Manufacturing Companies‟. International Journal of Quality
and Reliability, vol.17, P. 730-755.

332
Appendix 1
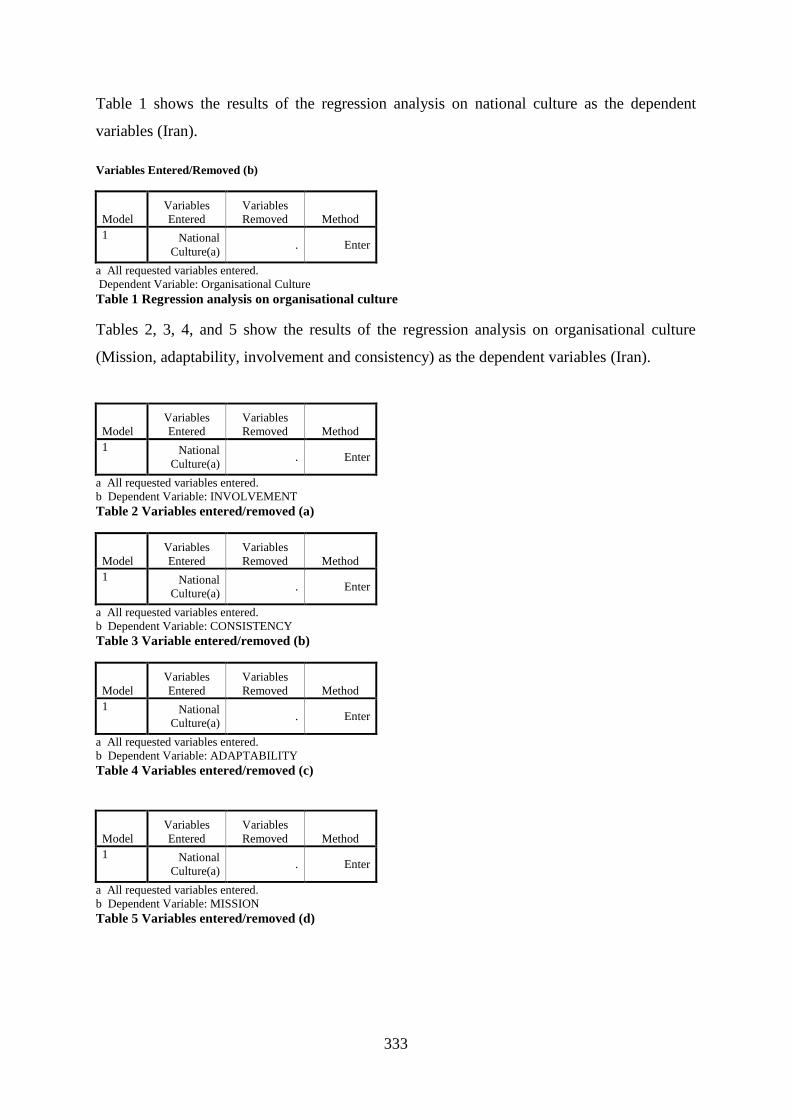
333
Table 1 shows the results of the regression analysis on national culture as the dependent
variables (Iran).
Variables Entered/Removed (b)
Model
Variables
Entered
Variables
Removed Method
1 National
Culture(a) . Enter
a All requested variables entered.
Dependent Variable: Organisational Culture
Table 1 Regression analysis on organisational culture
Tables 2, 3, 4, and 5 show the results of the regression analysis on organisational culture
(Mission, adaptability, involvement and consistency) as the dependent variables (Iran).
Model
Variables
Entered
Variables
Removed Method
1 National
Culture(a) . Enter
a All requested variables entered.
b Dependent Variable: INVOLVEMENT
Table 2 Variables entered/removed (a)
Model
Variables
Entered
Variables
Removed Method
1 National
Culture(a) . Enter
a All requested variables entered.
b Dependent Variable: CONSISTENCY
Table 3 Variable entered/removed (b)
Model
Variables
Entered
Variables
Removed Method
1 National
Culture(a) . Enter
a All requested variables entered.
b Dependent Variable: ADAPTABILITY
Table 4 Variables entered/removed (c)
Model
Variables
Entered
Variables
Removed Method
1 National
Culture(a) . Enter
a All requested variables entered.
b Dependent Variable: MISSION
Table 5 Variables entered/removed (d)
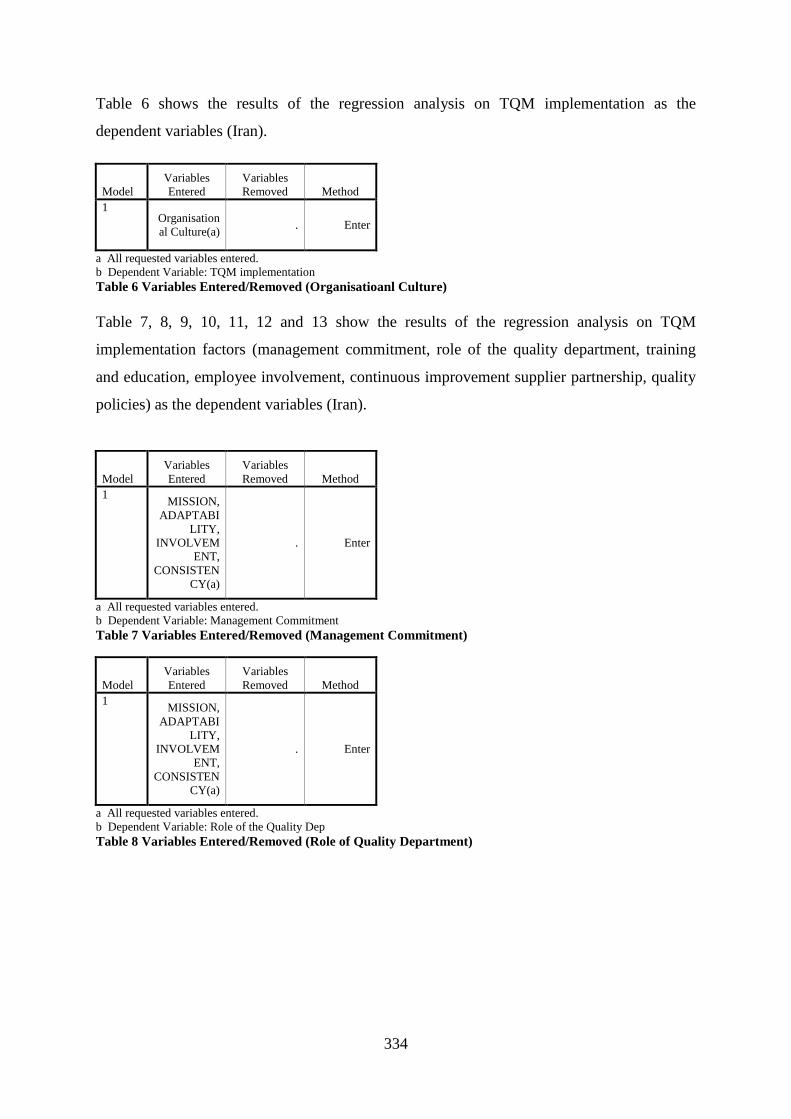
334
Table 6 shows the results of the regression analysis on TQM implementation as the
dependent variables (Iran).
Model
Variables
Entered
Variables
Removed Method
1 Organisation
al Culture(a) . Enter
a All requested variables entered.
b Dependent Variable: TQM implementation
Table 6 Variables Entered/Removed (Organisatioanl Culture)
Table 7, 8, 9, 10, 11, 12 and 13 show the results of the regression analysis on TQM
implementation factors (management commitment, role of the quality department, training
and education, employee involvement, continuous improvement supplier partnership, quality
policies) as the dependent variables (Iran).
Model
Variables
Entered
Variables
Removed Method
1 MISSION,
ADAPTABI
LITY,
INVOLVEM
ENT,
CONSISTEN
CY(a)
. Enter
a All requested variables entered.
b Dependent Variable: Management Commitment
Table 7 Variables Entered/Removed (Management Commitment)
Model
Variables
Entered
Variables
Removed Method
1 MISSION,
ADAPTABI
LITY,
INVOLVEM
ENT,
CONSISTEN
CY(a)
. Enter
a All requested variables entered.
b Dependent Variable: Role of the Quality Dep
Table 8 Variables Entered/Removed (Role of Quality Department)
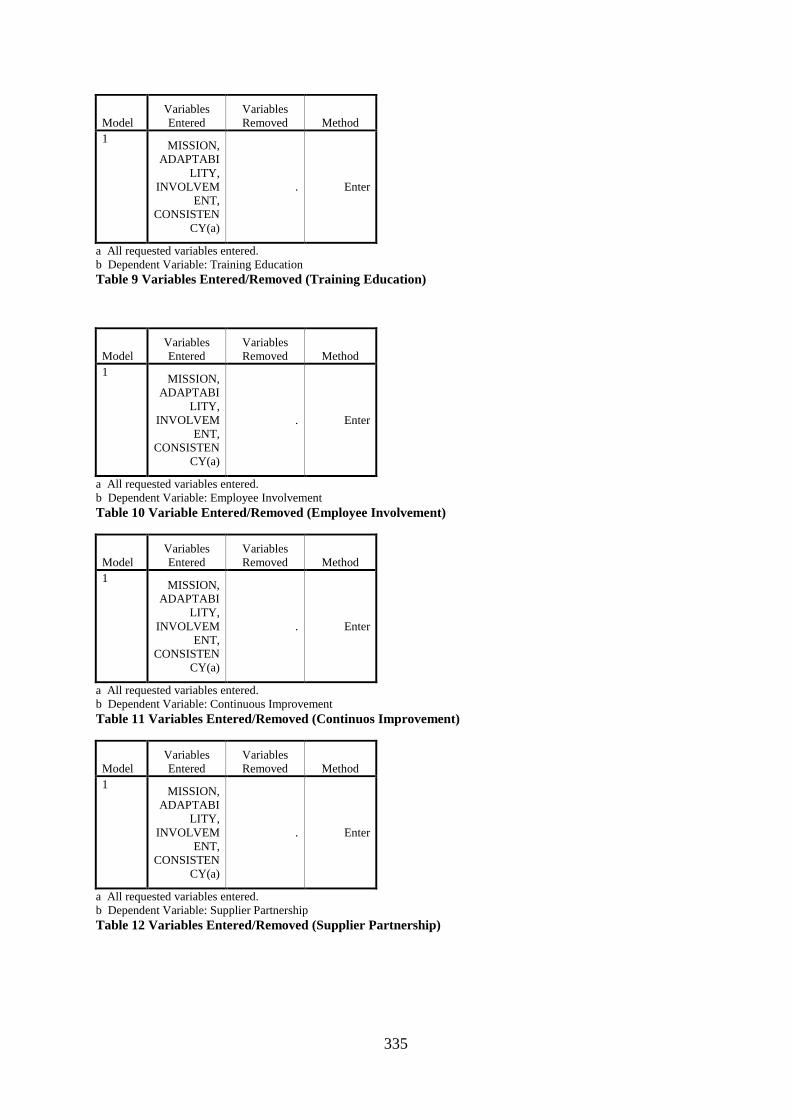
335
Model
Variables
Entered
Variables
Removed Method
1 MISSION,
ADAPTABI
LITY,
INVOLVEM
ENT,
CONSISTEN
CY(a)
. Enter
a All requested variables entered.
b Dependent Variable: Training Education
Table 9 Variables Entered/Removed (Training Education)
Model
Variables
Entered
Variables
Removed Method
1 MISSION,
ADAPTABI
LITY,
INVOLVEM
ENT,
CONSISTEN
CY(a)
. Enter
a All requested variables entered.
b Dependent Variable: Employee Involvement
Table 10 Variable Entered/Removed (Employee Involvement)
Model
Variables
Entered
Variables
Removed Method
1 MISSION,
ADAPTABI
LITY,
INVOLVEM
ENT,
CONSISTEN
CY(a)
. Enter
a All requested variables entered.
b Dependent Variable: Continuous Improvement
Table 11 Variables Entered/Removed (Continuos Improvement)
Model
Variables
Entered
Variables
Removed Method
1 MISSION,
ADAPTABI
LITY,
INVOLVEM
ENT,
CONSISTEN
CY(a)
. Enter
a All requested variables entered.
b Dependent Variable: Supplier Partnership
Table 12 Variables Entered/Removed (Supplier Partnership)
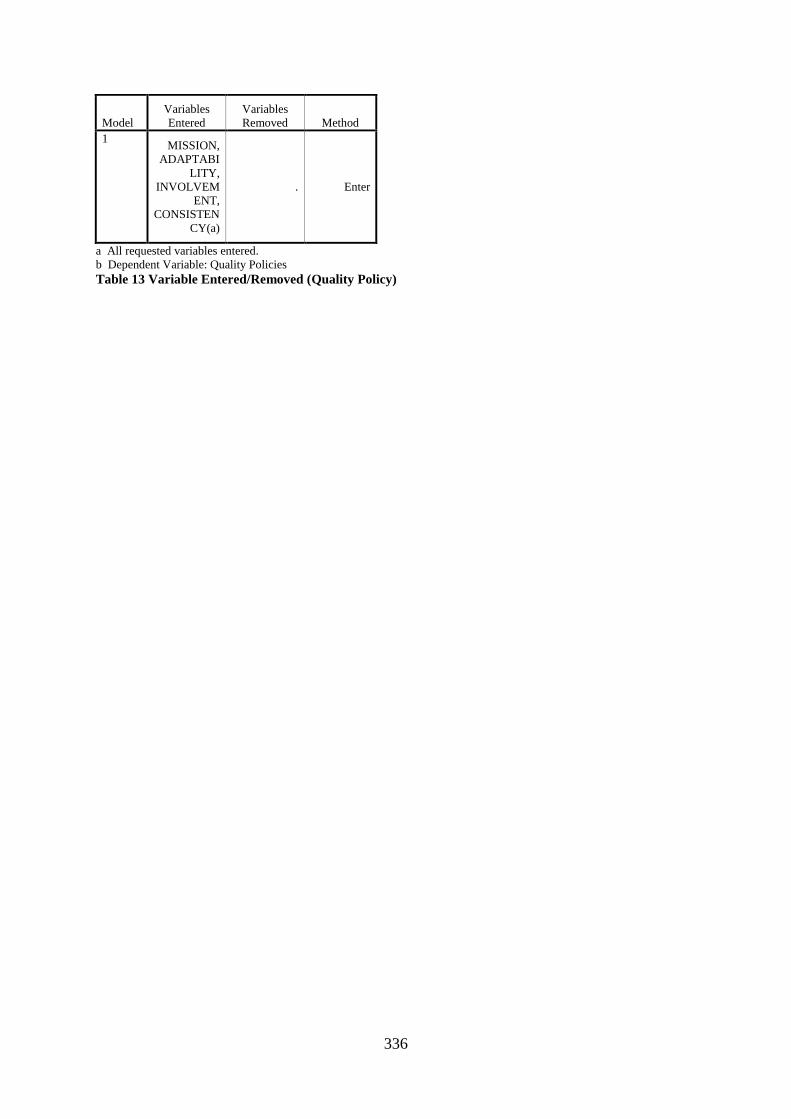
336
Model
Variables
Entered
Variables
Removed Method
1 MISSION,
ADAPTABI
LITY,
INVOLVEM
ENT,
CONSISTEN
CY(a)
. Enter
a All requested variables entered.
b Dependent Variable: Quality Policies
Table 13 Variable Entered/Removed (Quality Policy)
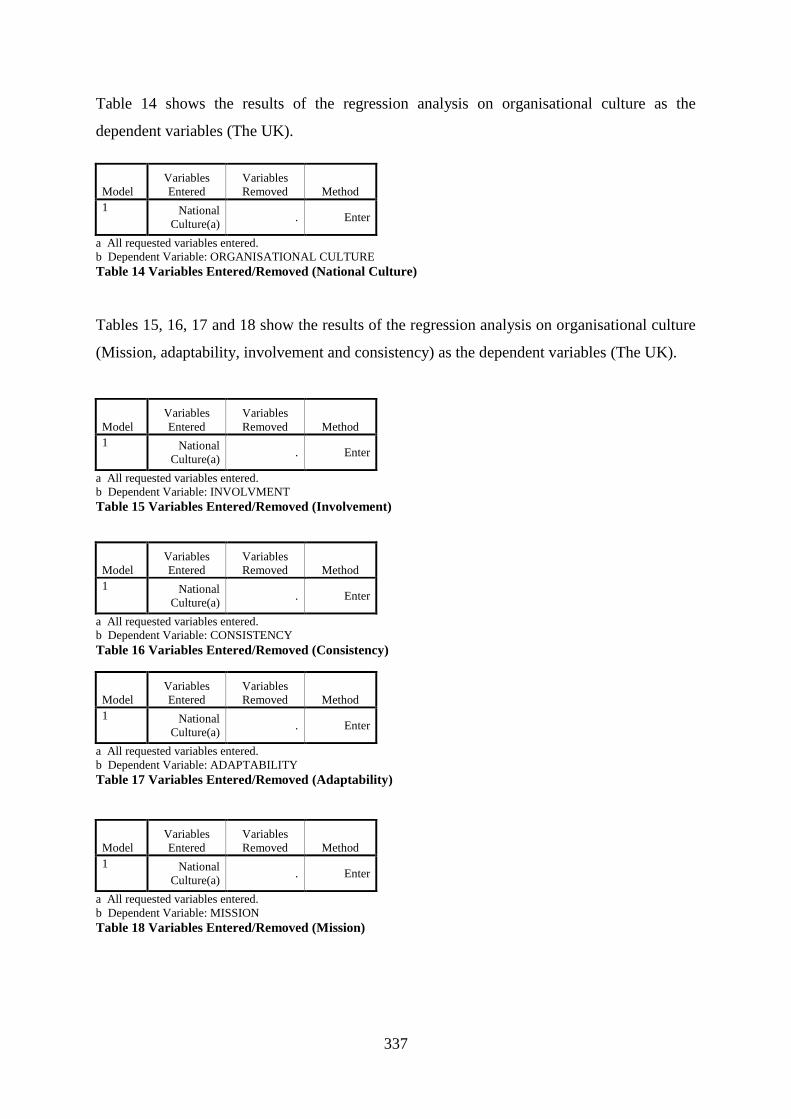
337
Table 14 shows the results of the regression analysis on organisational culture as the
dependent variables (The UK).
Model
Variables
Entered
Variables
Removed Method
1 National
Culture(a) . Enter
a All requested variables entered.
b Dependent Variable: ORGANISATIONAL CULTURE
Table 14 Variables Entered/Removed (National Culture)
Tables 15, 16, 17 and 18 show the results of the regression analysis on organisational culture
(Mission, adaptability, involvement and consistency) as the dependent variables (The UK).
Model
Variables
Entered
Variables
Removed Method
1 National
Culture(a) . Enter
a All requested variables entered.
b Dependent Variable: INVOLVMENT
Table 15 Variables Entered/Removed (Involvement)
Model
Variables
Entered
Variables
Removed Method
1 National
Culture(a) . Enter
a All requested variables entered.
b Dependent Variable: CONSISTENCY
Table 16 Variables Entered/Removed (Consistency)
Model
Variables
Entered
Variables
Removed Method
1 National
Culture(a) . Enter
a All requested variables entered.
b Dependent Variable: ADAPTABILITY
Table 17 Variables Entered/Removed (Adaptability)
Model
Variables
Entered
Variables
Removed Method
1 National
Culture(a) . Enter
a All requested variables entered.
b Dependent Variable: MISSION
Table 18 Variables Entered/Removed (Mission)
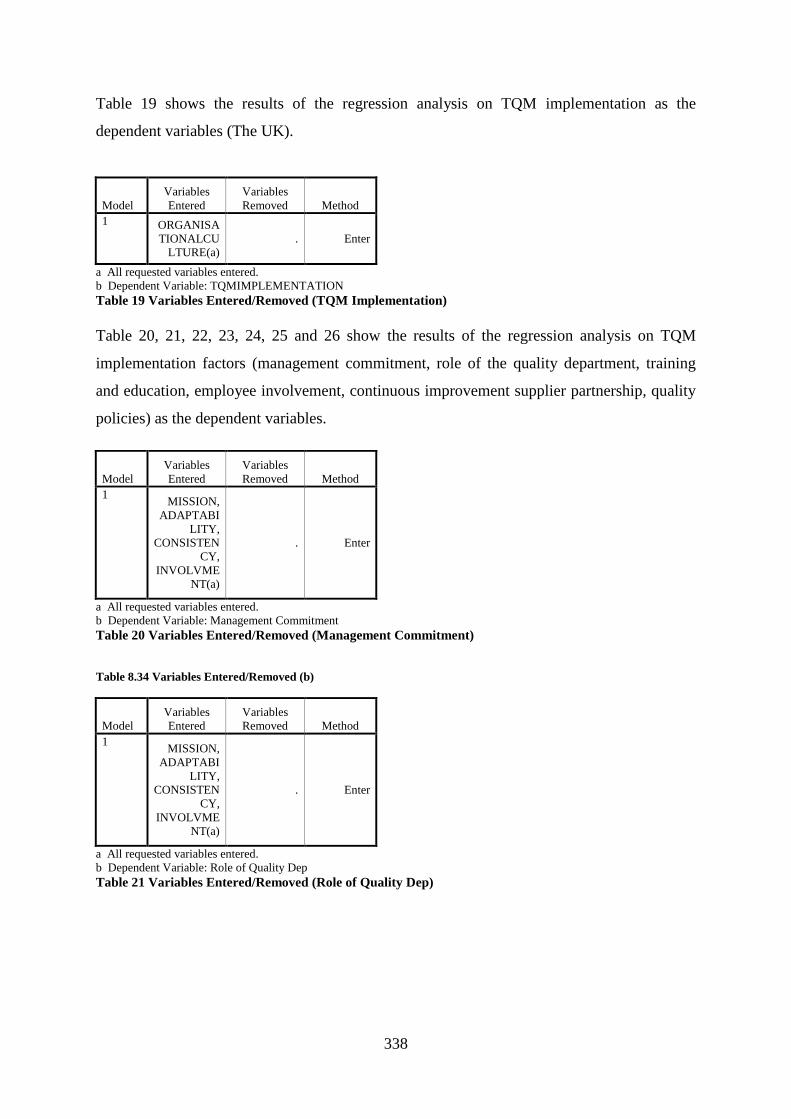
338
Table 19 shows the results of the regression analysis on TQM implementation as the
dependent variables (The UK).
Model
Variables
Entered
Variables
Removed Method
1 ORGANISA
TIONALCU
LTURE(a)
. Enter
a All requested variables entered.
b Dependent Variable: TQMIMPLEMENTATION
Table 19 Variables Entered/Removed (TQM Implementation)
Table 20, 21, 22, 23, 24, 25 and 26 show the results of the regression analysis on TQM
implementation factors (management commitment, role of the quality department, training
and education, employee involvement, continuous improvement supplier partnership, quality
policies) as the dependent variables.
Model
Variables
Entered
Variables
Removed Method
1 MISSION,
ADAPTABI
LITY,
CONSISTEN
CY,
INVOLVME
NT(a)
. Enter
a All requested variables entered.
b Dependent Variable: Management Commitment
Table 20 Variables Entered/Removed (Management Commitment)
Table 8.34 Variables Entered/Removed (b)
Model
Variables
Entered
Variables
Removed Method
1 MISSION,
ADAPTABI
LITY,
CONSISTEN
CY,
INVOLVME
NT(a)
. Enter
a All requested variables entered.
b Dependent Variable: Role of Quality Dep
Table 21 Variables Entered/Removed (Role of Quality Dep)
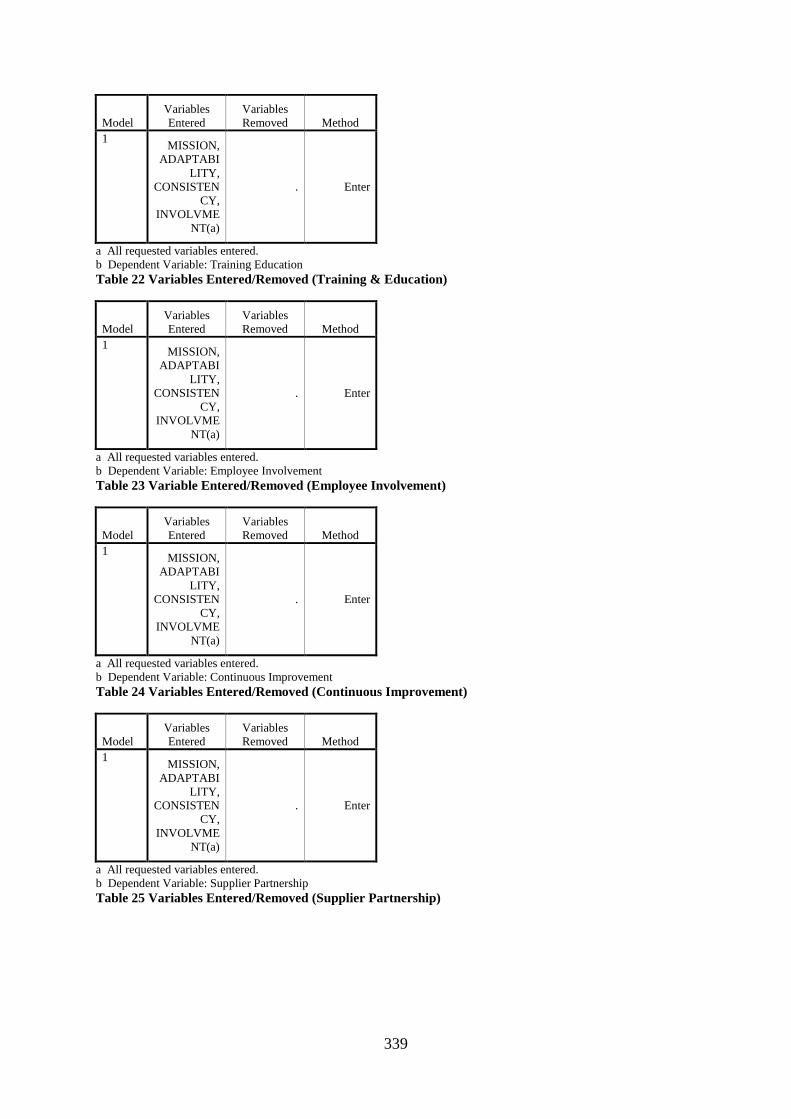
339
Model
Variables
Entered
Variables
Removed Method
1 MISSION,
ADAPTABI
LITY,
CONSISTEN
CY,
INVOLVME
NT(a)
. Enter
a All requested variables entered.
b Dependent Variable: Training Education
Table 22 Variables Entered/Removed (Training & Education)
Model
Variables
Entered
Variables
Removed Method
1 MISSION,
ADAPTABI
LITY,
CONSISTEN
CY,
INVOLVME
NT(a)
. Enter
a All requested variables entered.
b Dependent Variable: Employee Involvement
Table 23 Variable Entered/Removed (Employee Involvement)
Model
Variables
Entered
Variables
Removed Method
1 MISSION,
ADAPTABI
LITY,
CONSISTEN
CY,
INVOLVME
NT(a)
. Enter
a All requested variables entered.
b Dependent Variable: Continuous Improvement
Table 24 Variables Entered/Removed (Continuous Improvement)
Model
Variables
Entered
Variables
Removed Method
1 MISSION,
ADAPTABI
LITY,
CONSISTEN
CY,
INVOLVME
NT(a)
. Enter
a All requested variables entered.
b Dependent Variable: Supplier Partnership
Table 25 Variables Entered/Removed (Supplier Partnership)
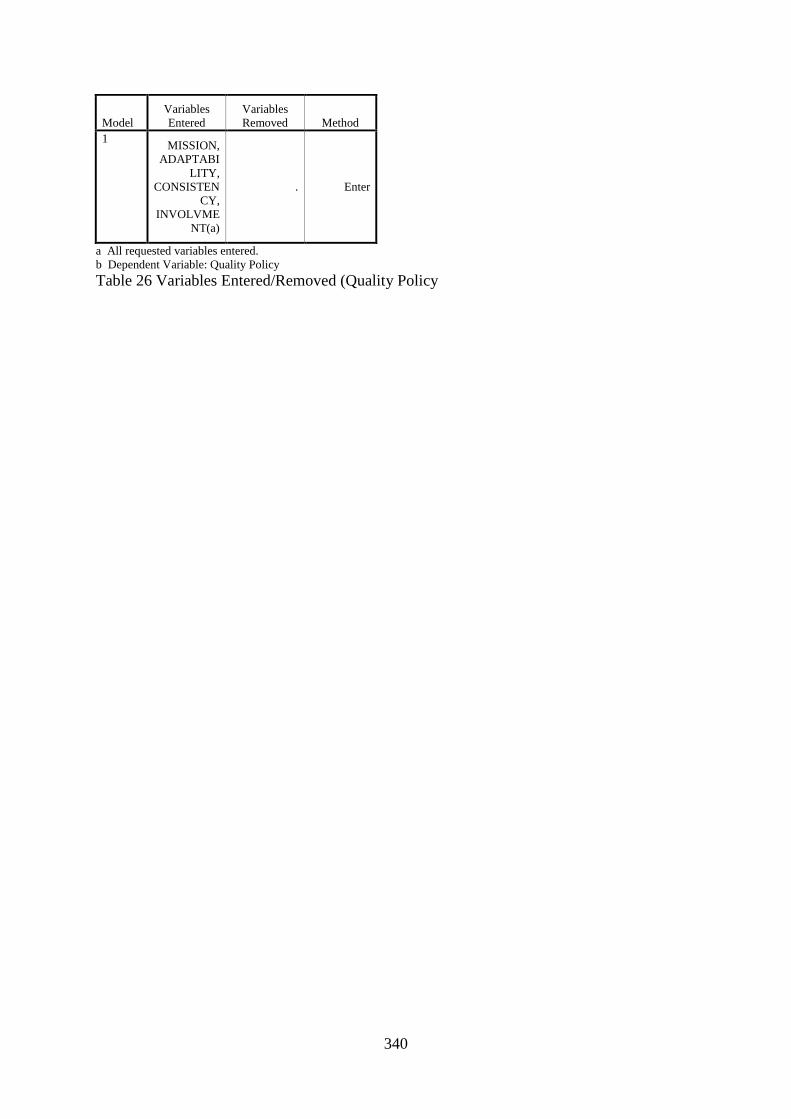
340
Model
Variables
Entered
Variables
Removed Method
1 MISSION,
ADAPTABI
LITY,
CONSISTEN
CY,
INVOLVME
NT(a)
. Enter
a All requested variables entered.
b Dependent Variable: Quality Policy
Table 26 Variables Entered/Removed (Quality Policy

341
Appendix 2
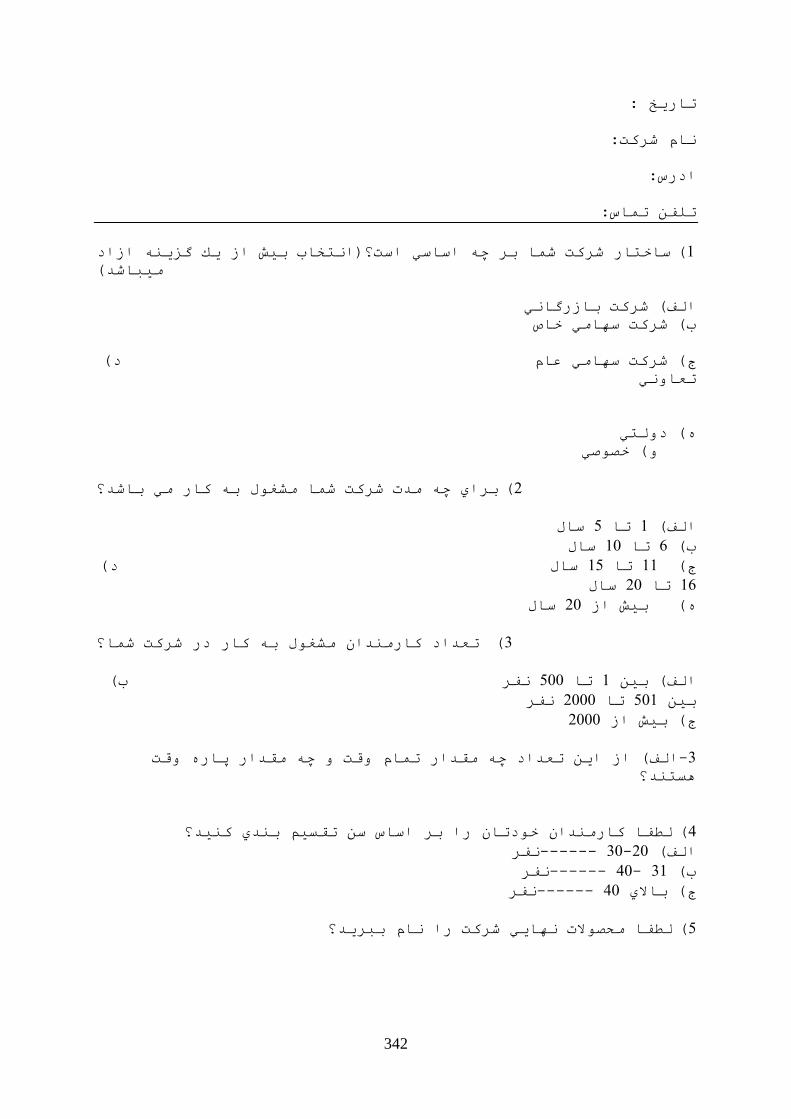
342
تبريخ :
بو ػزكت:
ادرص:
تهف تبص:
طبختبر ػزكت ػب ثز چ اطبطي اطت؟)اتخبة ثيغ اس يك گشي اساد (1
ييجبػذ(
انف( ػزكت ثبسرگبي
ة( ػزكت طبيي خبؽ
ج( ػزكت طبيي عبو د(
تعبي
( دنتي
( خـؿي
ثزاي چ يذت ػزكت ػب يؼغل ث كبر يي ثبػذ؟ (2
طبل 5تب 1انف(
طبل 11تب 6ة(
طبل د( 15تب 11ج(
طبل 21تب 16
طبل 21( ثيغ اس
تعذاد كبريذا يؼغل ث كبر در ػزكت ػب؟ (3
ة( فز 511تب 1انف( ثي
فز 2111تب 511ثي
2111ج( ثيغ اس
انف( اس اي تعذاد چ يقذار تبو قت چ يقذار پبر قت -3
ظتذ؟
نطفب كبريذا خدتب را ثز اطبص ط تقظيى ثذي كيذ؟ (4
فز ------ 31-21انف(
فز------ 41- 31ة(
فز------ 41ج( ثبالي
بيي ػزكت را بو ثجزيذ؟نطفب يسـالت (5
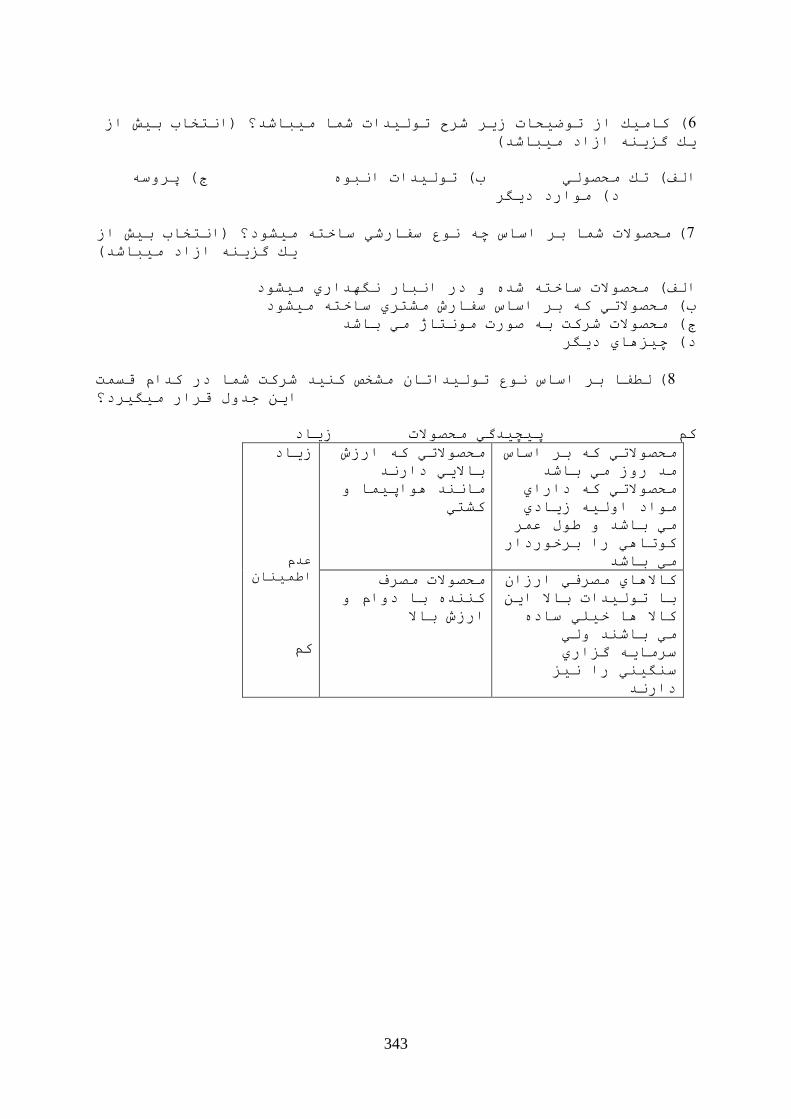
343
كبييك اس تضيسبت سيز ػزذ تنيذات ػب ييجبػذ؟ )اتخبة ثيغ اس (6
يك گشي اساد ييجبػذ(
انف( تك يسـني ة( تنيذات اج ج( پزط
د( يارد ديگز
ثيغ اس يسـالت ػب ثز اطبص چ ع طفبرػي طبخت ييؼد؟ )اتخبة (7
يك گشي اساد ييجبػذ(
انف( يسـالت طبخت ػذ در اجبر گذاري ييؼد
ة( يسـالتي ك ثز اطبص طفبرع يؼتزي طبخت ييؼد
ج( يسـالت ػزكت ث ؿرت يتبژ يي ثبػذ
د( چيشبي ديگز
نطفب ثز اطبص ع تنيذاتب يؼخؾ كيذ ػزكت ػب در كذاو قظت (8
گيزد؟اي خذل قزار يي
كى پيچيذگي يسـالت سيبد
يسـالتي ك ثز اطبص
يذ رس يي ثبػذ
يسـالتي ك داراي
ياد اني سيبدي
يي ثبػذ طل عز
كتبي را ثزخردار
يي ثبػذ
يسـالتي ك ارسع
ثباليي دارذ
يبذ اپيب
كؼتي
سيبد
عذو
اطيب
كى
كبالبي يـزفي ارسا
ثب تنيذات ثبال اي
كبال ب خيهي طبد
يي ثبػذ ني
طزيبي گشاري
طگيي را يش
دارذ
يسـالت يـزف
كذ ثب داو
ارسع ثبال
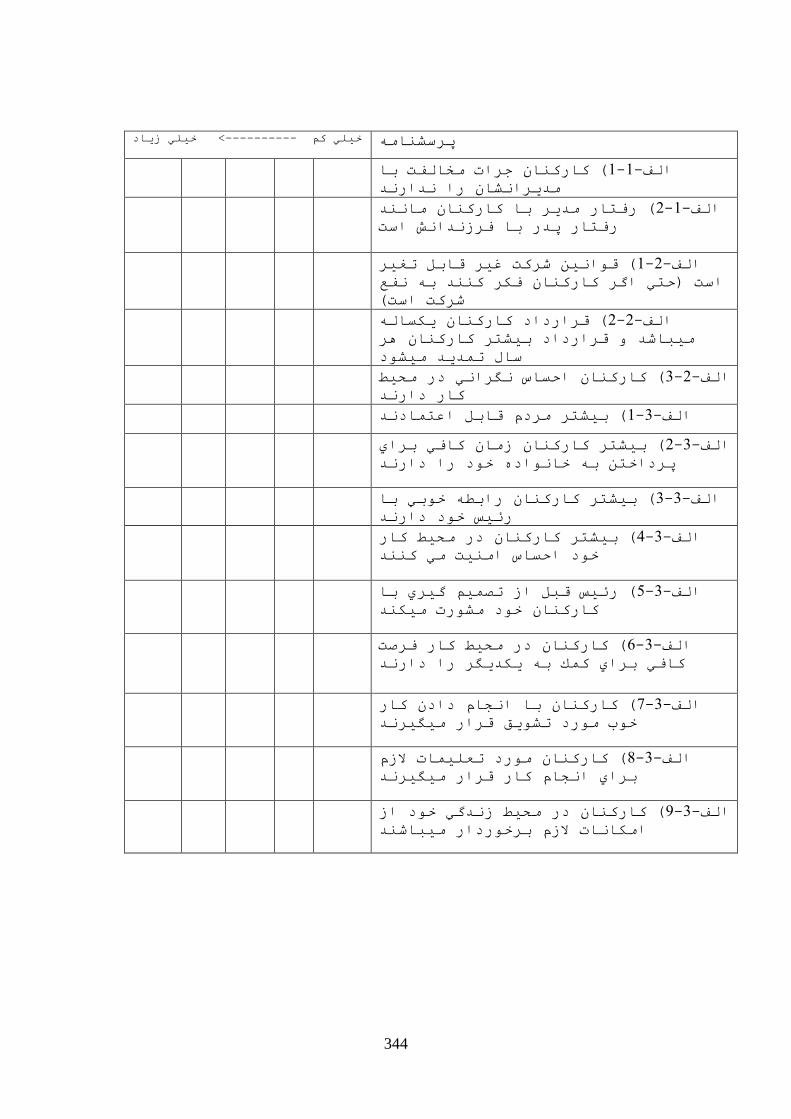
344
سيبد خيهي< ---------- خيهي كى پزطؼبي
( كبركب خزات يخبنفت ثب 1-1-انف
ذارذيذيزاؼب را
( رفتبر يذيز ثب كبركب يبذ 2-1-انف
رفتبر پذر ثب فزسذاغ اطت
( قاي ػزكت غيز قبثم تغيز 1-2-انف
اطت )زتي اگز كبركب فكز كذ ث فع
ػزكت اطت(
( قزارداد كبركب يكظبن 2-2-انف
ييجبػذ قزارداد ثيؼتز كبركب ز
طبل تذيذ ييؼد
( كبركب ازظبص گزاي در يسيط 3-2-انف
كبر دارذ
( ثيؼتز يزدو قبثم اعتبدذ1-3-انف
( ثيؼتز كبركب سيب كبفي ثزاي 2-3-انف
پزداخت ث خباد خد را دارذ
( ثيؼتز كبركب راثط خثي ثب 3-3-انف
رئيض خد دارذ
يسيط كبر ( ثيؼتز كبركب در 4-3-انف
خد ازظبص اييت يي كذ
( رئيض قجم اس تـيى گيزي ثب 5-3-انف
كبركب خد يؼرت ييكذ
( كبركب در يسيط كبر فزؿت 6-3-انف
كبفي ثزاي كك ث يكذيگز را دارذ
( كبركب ثب ادبو داد كبر 7-3-انف
خة يرد تؼيق قزار ييگيزذ
كبركب يرد تعهيبت السو ( 8-3-انف
ثزاي ادبو كبر قزار ييگيزذ
( كبركب در يسيط سذگي خد اس 9-3-انف
ايكببت السو ثزخردار ييجبػذ
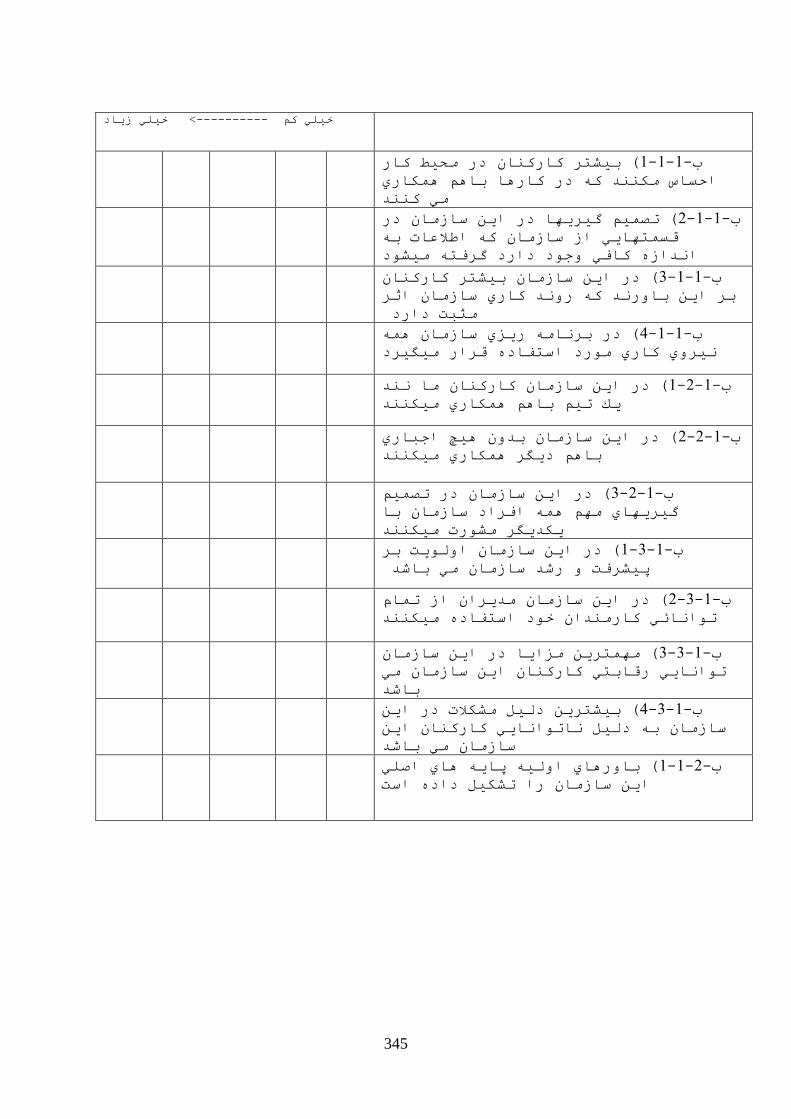
345
سيبد خيهي< ---------- خيهي كى
( ثيؼتز كبركب در يسيط كبر 1-1-1-ة
ازظبص يكذ ك در كبرب ثبى كبري
كذيي
( تـيى گيزيب در اي طبسيب در 2-1-1-ة
قظتبيي اس طبسيب ك اطالعبت ث
اذاس كبفي خد دارد گزفت ييؼد
( در اي طبسيب ثيؼتز كبركب 3-1-1-ة
ثز اي ثبرذ ك رذ كبري طبسيب اثز
يثجت دارد
( در ثزبي ريشي طبسيب 4-1-1-ة
كبري يرد اطتفبد قزار ييگيزديزي
( در اي طبسيب كبركب يب ذ 1-2-1-ة
يك تيى ثبى كبري ييكذ
( در اي طبسيب ثذ يچ اخجبري 2-2-1-ة
ثبى ديگز كبري ييكذ
( در اي طبسيب در تـيى 3-2-1-ة
گيزيبي يى افزاد طبسيب ثب
ييكذيكذيگز يؼرت
( در اي طبسيب انيت ثز 1-3-1-ة
پيؼزفت رػذ طبسيب يي ثبػذ
( در اي طبسيب يذيزا اس تبو 2-3-1-ة
تابئي كبريذا خد اطتفبد ييكذ
( يتزي يشايب در اي طبسيب 3-3-1-ة
تابيي رقبثتي كبركب اي طبسيب يي
ثبػذ
ثيؼتزي دنيم يؼكالت در اي ( 4-3-1-ة
طبسيب ث دنيم بتابيي كبركب اي
طبسيب يي ثبػذ
( ثبربي اني پبي بي اؿهي 1-1-2-ة
اي طبسيب را تؼكيم داد اطت
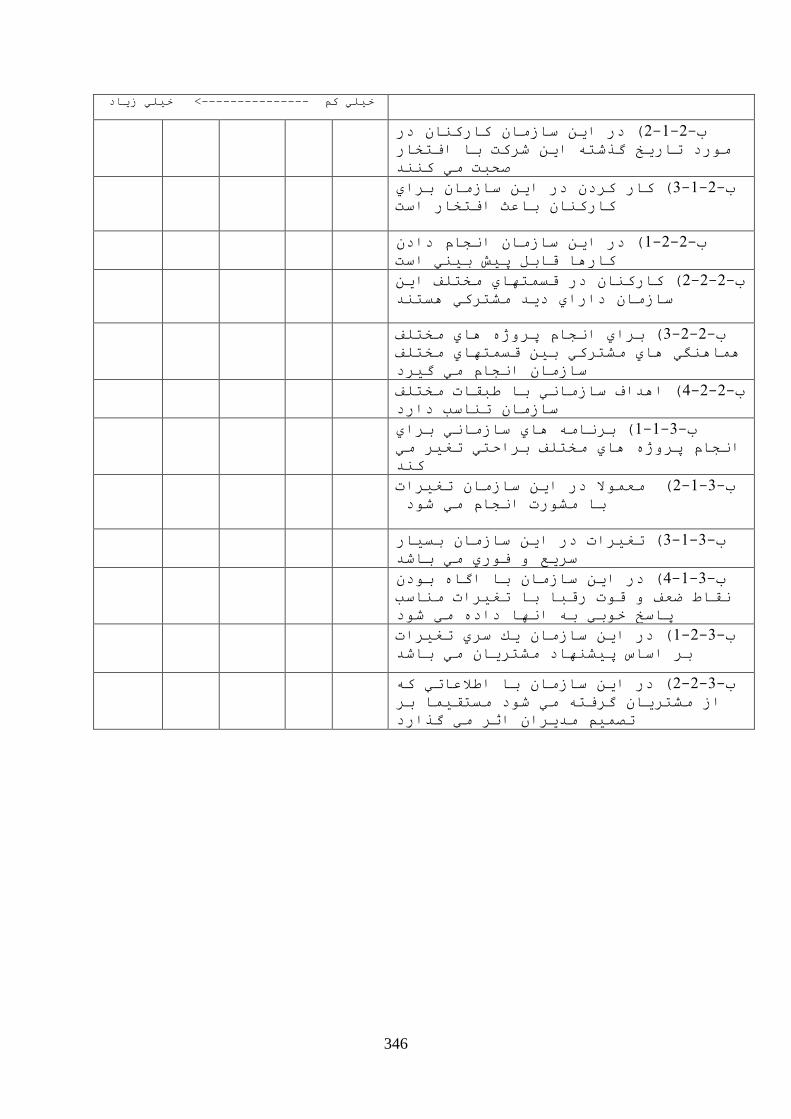
346
سيبد خيهي< --------------- خيهي كى
( در اي طبسيب كبركب در 2-1-2-ة
گذػت اي ػزكت ثب افتخبر يرد تبريخ
ؿسجت يي كذ
( كبر كزد در اي طبسيب ثزاي 3-1-2-ة
كبركب ثبعث افتخبر اطت
( در اي طبسيب ادبو داد 1-2-2-ة
كبرب قبثم پيغ ثيي اطت
( كبركب در قظتبي يختهف اي 2-2-2-ة
طبسيب داراي ديذ يؼتزكي ظتذ
( ثزاي ادبو پزژ بي يختهف 3-2-2-ة
بگي بي يؼتزكي ثي قظتبي يختهف
طبسيب ادبو يي گيزد
( اذاف طبسيبي ثب طجقبت يختهف 4-2-2-ة
طبسيب تبطت دارد
( ثزبي بي طبسيبي ثزاي 1-1-3-ة
ادبو پزژ بي يختهف ثزازتي تغيز يي
كذ
( يعال در اي طبسيب تغيزات 2-1-3-ة
ثب يؼرت ادبو يي ػد
( تغيزات در اي طبسيب ثظيبر 3-1-3-ة
طزيع فري يي ثبػذ
( در اي طبسيب ثب اگب ثد 4-1-3-ة
قبط ضعف قت رقجب ثب تغيزات يبطت
پبطخ خثي ث اب داد يي ػد
طبسيب يك طزي تغيزات ( در اي 1-2-3-ة
ثز اطبص پيؼبد يؼتزيب يي ثبػذ
( در اي طبسيب ثب اطالعبتي ك 2-2-3-ة
اس يؼتزيب گزفت يي ػد يظتقيب ثز
تـيى يذيزا اثز يي گذارد
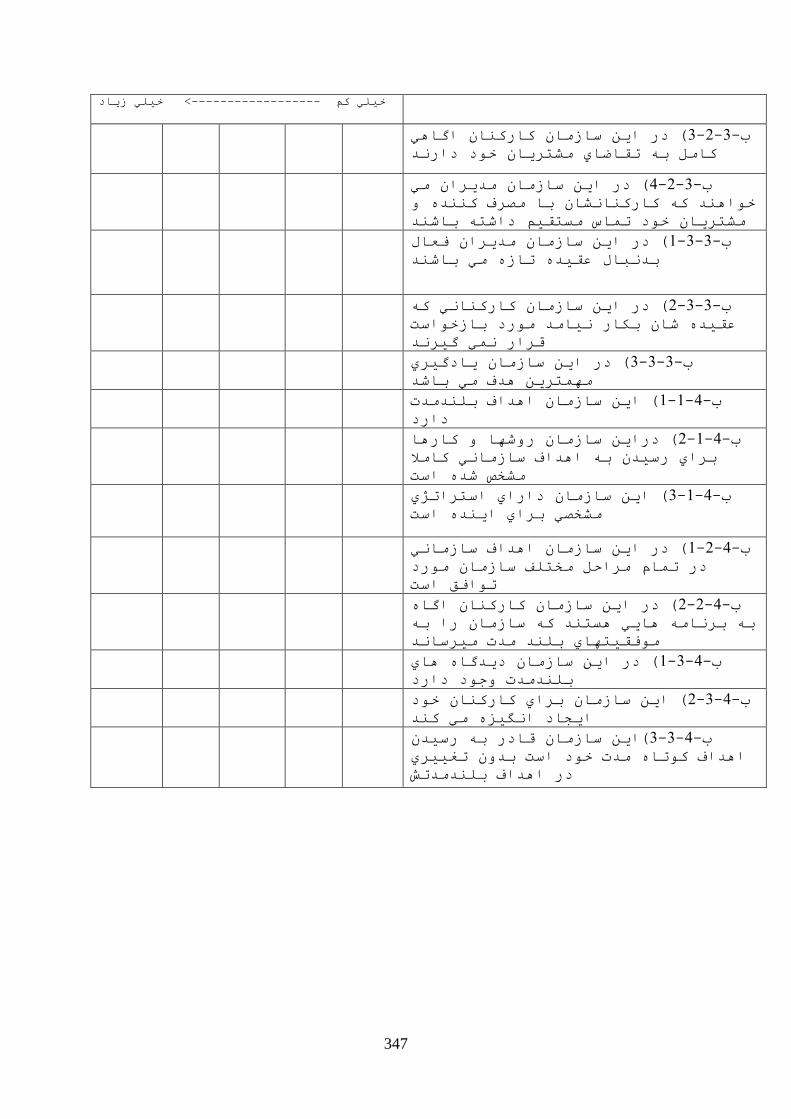
347
سيبد خيهي< ------------------ خيهي كى
اگبي ( در اي طبسيب كبركب 3-2-3-ة
كبيم ث تقبضبي يؼتزيب خد دارذ
( در اي طبسيب يذيزا يي 4-2-3-ة
خاذ ك كبركبؼب ثب يـزف كذ
يؼتزيب خد تبص يظتقيى داػت ثبػذ
( در اي طبسيب يذيزا فعبل 1-3-3-ة
ثذجبل عقيذ تبس يي ثبػذ
ك ( در اي طبسيب كبركبي2-3-3-ة
عقيذ ػب ثكبر يبيذ يرد ثبسخاطت
قزار ي گيزذ
( در اي طبسيب يبدگيزي 3-3-3-ة
يتزي ذف يي ثبػذ
( اي طبسيب اذاف ثهذيذت 1-1-4-ة
دارد
( دراي طبسيب رػب كبرب 2-1-4-ة
ثزاي رطيذ ث اذاف طبسيبي كبيال
يؼخؾ ػذ اطت
( اي طبسيب داراي اطتزاتژي 3-1-4-ة
يؼخـي ثزاي ايذ اطت
( در اي طبسيب اذاف طبسيبي 1-2-4-ة
در تبو يزازم يختهف طبسيب يرد
تافق اطت
( در اي طبسيب كبركب اگب 2-2-4-ة
ث ثزبي بيي ظتذ ك طبسيب را ث
يفقيتبي ثهذ يذت ييزطبذ
( در اي طبسيب ديذگب بي 1-3-4-ة
ثهذيذت خد دارد
( اي طبسيب ثزاي كبركب خد 2-3-4-ة
ايدبد اگيش يي كذ
(اي طبسيب قبدر ث رطيذ 3-3-4-ة
اذاف كتب يذت خد اطت ثذ تغييزي
در اذاف ثهذيذتغ
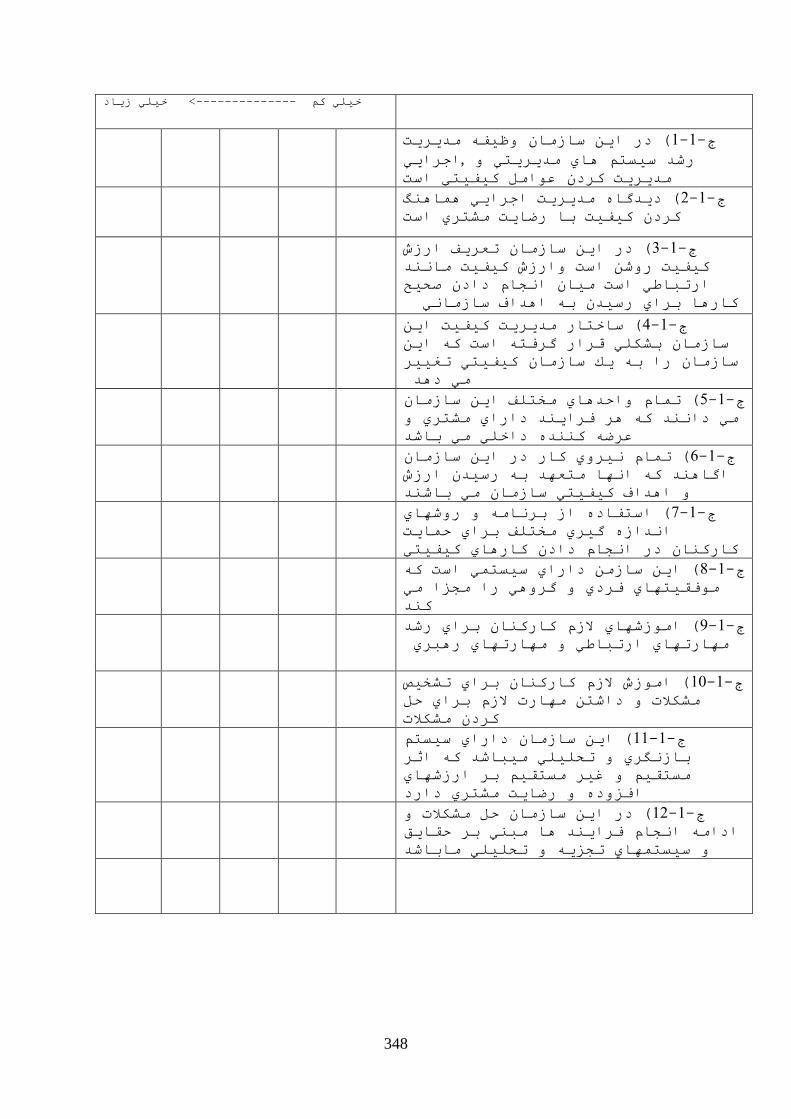
348
سيبد خيهي< -------------- خيهي كى
( در اي طبسيب ظيف يذيزيت 1-1-ج
,اخزايي رػذ طيظتى بي يذيزيتي
يذيزيت كزد عايم كيفيتي اطت
( ديذگب يذيزيت اخزايي بگ 2-1-ج
كزد كيفيت ثب رضبيت يؼتزي اطت
( در اي طبسيب تعزيف ارسع 3-1-ج
كيفيت رػ اطت ارسع كيفيت يبذ
ارتجبطي اطت ييب ادبو داد ؿسير
كبرب ثزاي رطيذ ث اذاف طبسيبي
( طبختبر يذيزيت كيفيت اي 4-1-ج
طبسيب ثؼكهي قزار گزفت اطت ك اي
طبسيب را ث يك طبسيب كيفيتي تغييز
يي دذ
( تبو ازذبي يختهف اي طبسيب 5-1-ج
يي داذ ك ز فزايذ داراي يؼتزي
عزض كذ داخهي يي ثبػذ
( تبو يزي كبر در اي طبسيب 6-1-ج
اگبذ ك اب يتعذ ث رطيذ ارسع
اذاف كيفيتي طبسيب يي ثبػذ
( اطتفبد اس ثزبي رػبي 7-1-ج
گيزي يختهف ثزاي زبيت اذاس
كبركب در ادبو داد كبربي كيفيتي
( اي طبسي داراي طيظتي اطت ك 8-1-ج
يفقيتبي فزدي گزي را يدشا يي
كذ
( ايسػبي السو كبركب ثزاي رػذ 9-1-ج
يبرتبي ارتجبطي يبرتبي رجزي
تؼخيؾ ( ايسع السو كبركب ثزاي11-1-ج
يؼكالت داػت يبرت السو ثزاي زم
كزد يؼكالت
( اي طبسيب داراي طيظتى 11-1-ج
ثبسگزي تسهيهي ييجبػذ ك اثز
يظتقيى غيز يظتقيى ثز ارسػبي
افشد رضبيت يؼتزي دارد
( در اي طبسيب زم يؼكالت 12-1-ج
اداي ادبو فزايذ ب يجي ثز زقبيق
طيظتبي تدشي تسهيهي يبثبػذ
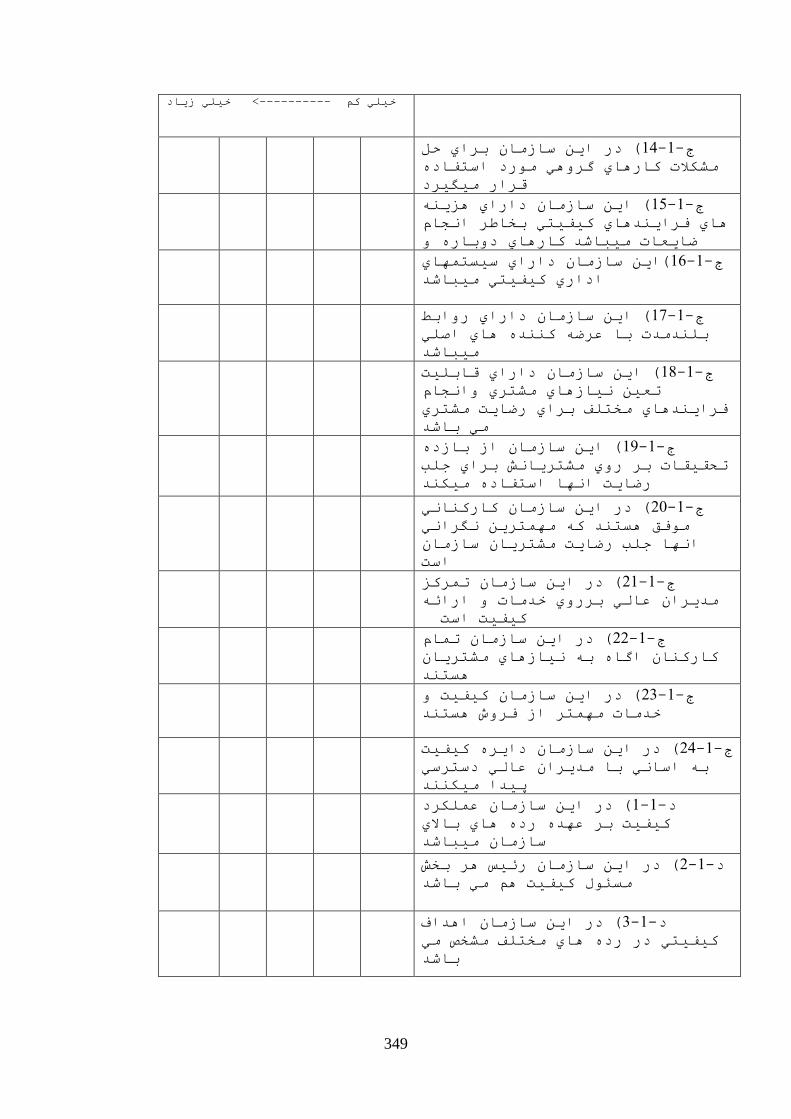
349
سيبد خيهي< ---------- خيهي كى
( در اي طبسيب ثزاي زم 14-1-ج
يؼكالت كبربي گزي يرد اطتفبد
قزار ييگيزد
( اي طبسيب داراي شي 15-1-ج
بي فزايذبي كيفيتي ثخبطز ادبو
ييجبػذضبيعبت كبربي دثبر
(اي طبسيب داراي طيظتبي 16-1-ج
اداري كيفيتي ييجبػذ
( اي طبسيب داراي راثط 17-1-ج
ثهذيذت ثب عزض كذ بي اؿهي
ييجبػذ
( اي طبسيب داراي قبثهيت 18-1-ج
تعي يبسبي يؼتزي ادبو
فزايذبي يختهف ثزاي رضبيت يؼتزي
يي ثبػذ
( اي طبسيب اس ثبسد 19-1-ج
تسقيقبت ثز ري يؼتزيبغ ثزاي خهت
رضبيت اب اطتفبد ييكذ
( در اي طبسيب كبركبي 21-1-ج
يفق ظتذ ك يتزي گزاي
اب خهت رضبيت يؼتزيب طبسيب
اطت
( در اي طبسيب تزكش 21-1-ج
يذيزا عبني ثزري خذيبت ارائ
كيفيت اطت
( در اي طبسيب تبو 22-1-ج
كبركب اگب ث يبسبي يؼتزيب
ظتذ
( در اي طبسيب كيفيت 23-1-ج
خذيبت يتز اس فزع ظتذ
( در اي طبسيب دايز كيفيت 24-1-ج
يذيزا عبني دطتزطي ث اطبي ثب
پيذا ييكذ
( در اي طبسيب عهكزد 1-1-د
كيفيت ثز عذ رد بي ثبالي
طبسيب ييجبػذ
( در اي طبسيب رئيض ز ثخغ 2-1-د
يظئل كيفيت ى يي ثبػذ
( در اي طبسيب اذاف 3-1-د
كيفيتي در رد بي يختهف يؼخؾ يي
ثبػذ
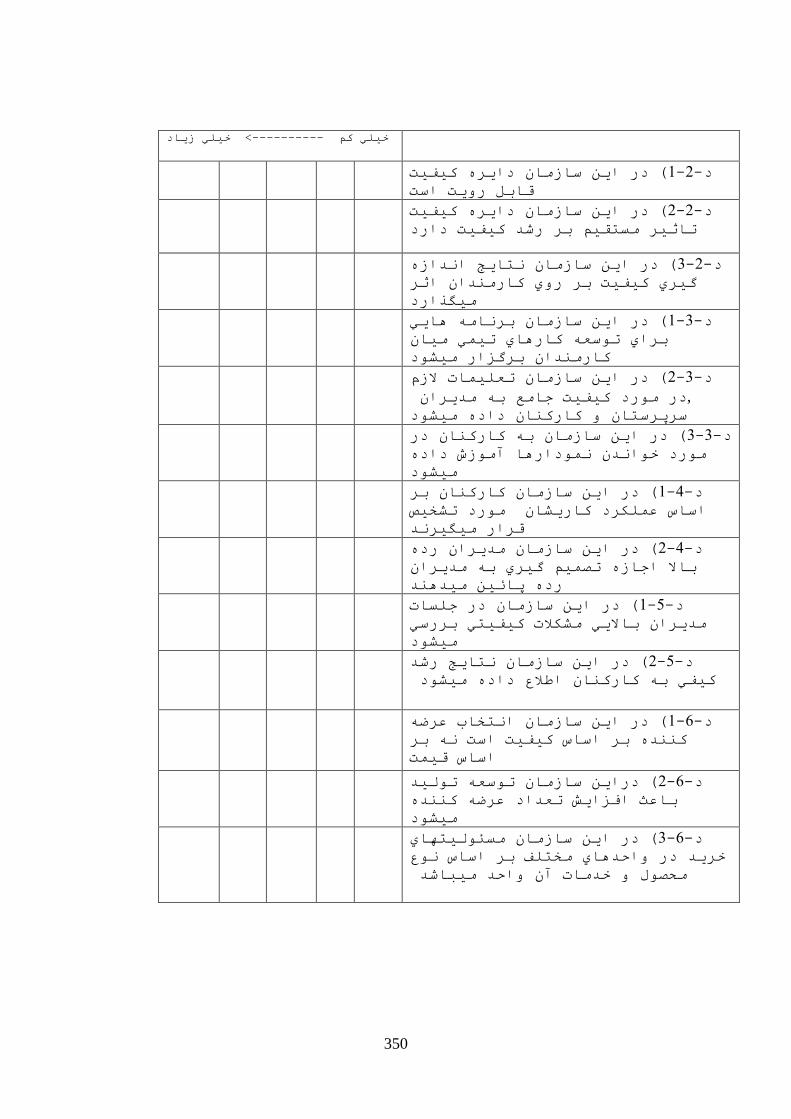
350
سيبد خيهي< ---------- كىخيهي
( در اي طبسيب دايز كيفيت 1-2-د
قبثم ريت اطت
( در اي طبسيب دايز كيفيت 2-2-د
تبثيز يظتقيى ثز رػذ كيفيت دارد
( در اي طبسيب تبيح اذاس 3-2-د
گيزي كيفيت ثز ري كبريذا اثز
ييگذارد
ثزبي بيي ( در اي طبسيب 1-3-د
ثزاي تطع كبربي تيي ييب
كبريذا ثزگشار ييؼد
( در اي طبسيب تعهيبت السو 2-3-د
,در يرد كيفيت خبيع ث يذيزا
طزپزطتب كبركب داد ييؼد
( در اي طبسيب ث كبركب در 3-3-د
يرد خاذ دارب آيسع داد
ييؼد
در اي طبسيب كبركب ثز ( 1-4-د
اطبص عهكزد كبريؼب يرد تؼخيؾ
قزار ييگيزذ
( در اي طبسيب يذيزا رد 2-4-د
ثبال اخبس تـيى گيزي ث يذيزا
رد پبئي ييذذ
( در اي طبسيب در خهظبت 1-5-د
يذيزا ثباليي يؼكالت كيفيتي ثزرطي
ييؼد
( در اي طبسيب تبيح رػذ 2-5-د
كيفي ث كبركب اطالع داد ييؼد
( در اي طبسيب اتخبة عزض 1-6-د
كذ ثز اطبص كيفيت اطت ثز
اطبص قيت
( دراي طبسيب تطع تنيذ 2-6-د
ثبعث افشايغ تعذاد عزض كذ
ييؼد
( در اي طبسيب يظئنيتبي 3-6-د
خزيذ در ازذبي يختهف ثز اطبص ع
يسـل خذيبت آ ازذ ييجبػذ
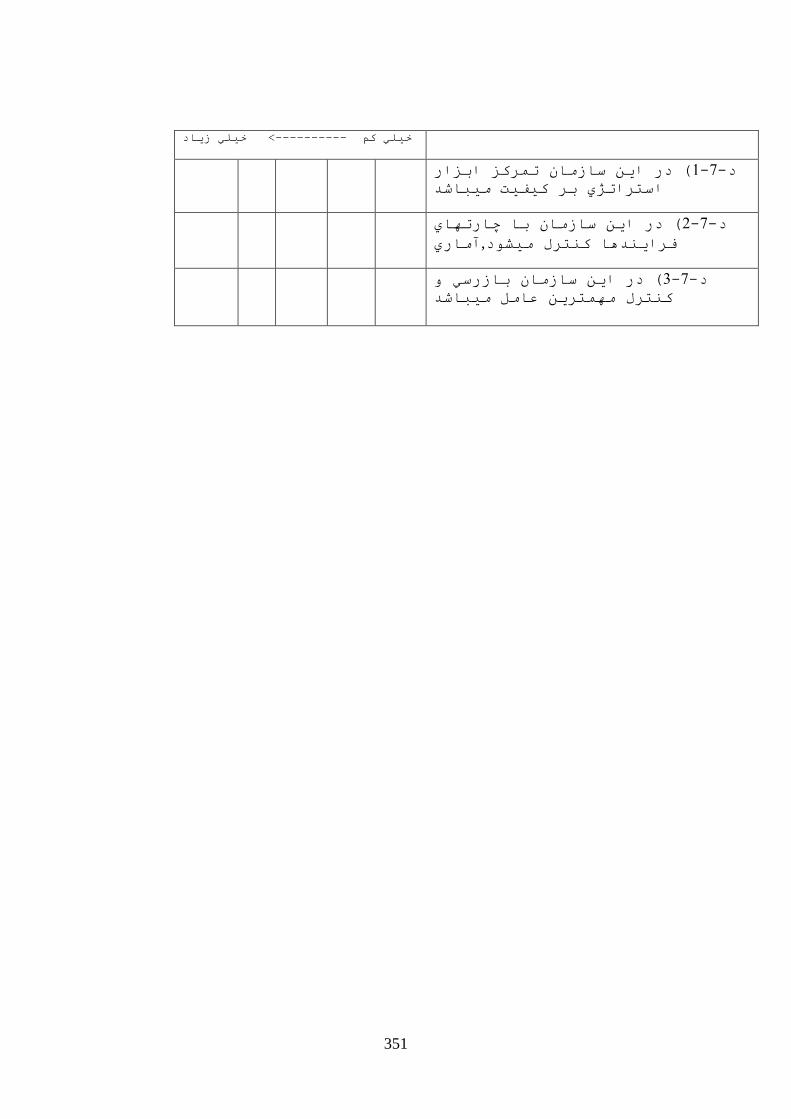
351
سيبد خيهي< ---------- خيهي كى
( در اي طبسيب تزكش اثشار 1-7-د
اطتزاتژي ثز كيفيت ييجبػذ
( در اي طبسيب ثب چبرتبي 2-7-د
,آيبري فزايذب كتزل ييؼد
( در اي طبسيب ثبسرطي 3-7-د
كتزل يتزي عبيم ييجبػذ

352
Appendix 3
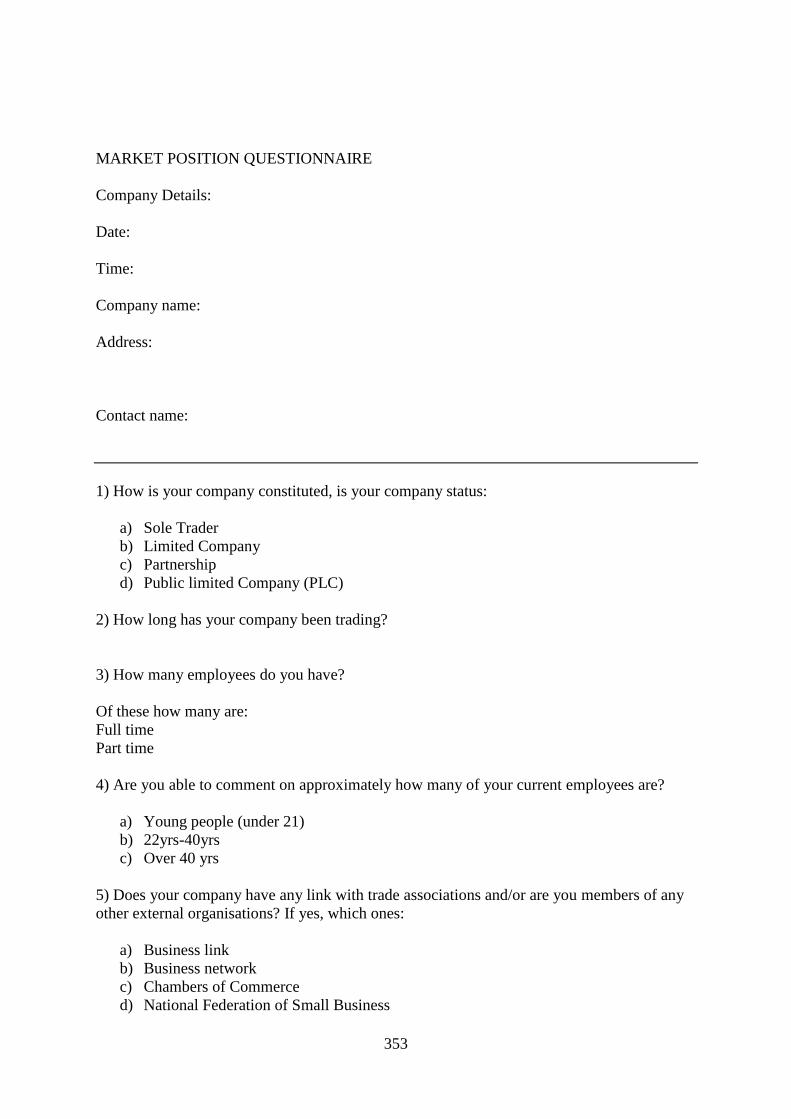
353
MARKET POSITION QUESTIONNAIRE
Company Details:
Date:
Time:
Company name:
Address:
Contact name:
1) How is your company constituted, is your company status:
a) Sole Trader
b) Limited Company
c) Partnership
d) Public limited Company (PLC)
2) How long has your company been trading?
3) How many employees do you have?
Of these how many are:
Full time
Part time
4) Are you able to comment on approximately how many of your current employees are?
a) Young people (under 21)
b) 22yrs-40yrs
c) Over 40 yrs
5) Does your company have any link with trade associations and/or are you members of any
other external organisations? If yes, which ones:
a) Business link
b) Business network
c) Chambers of Commerce
d) National Federation of Small Business
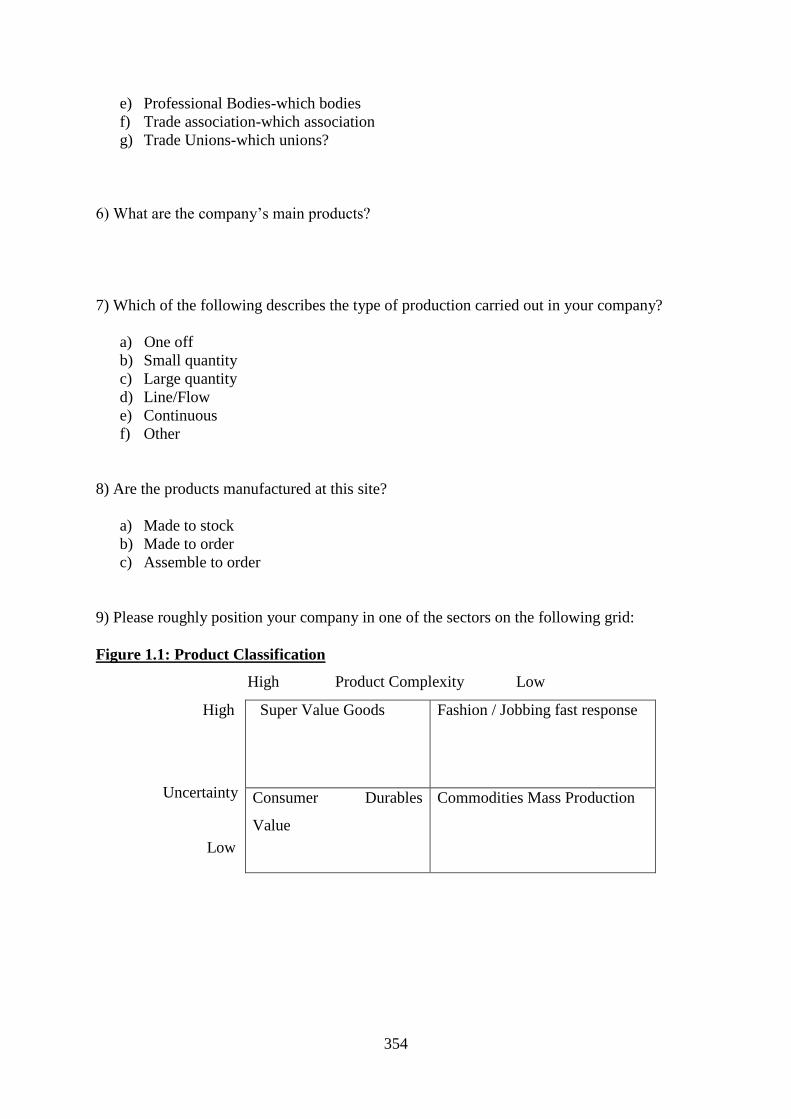
354
e) Professional Bodies-which bodies
f) Trade association-which association
g) Trade Unions-which unions?
6) What are the company‟s main products?
7) Which of the following describes the type of production carried out in your company?
a) One off
b) Small quantity
c) Large quantity
d) Line/Flow
e) Continuous
f) Other
8) Are the products manufactured at this site?
a) Made to stock
b) Made to order
c) Assemble to order
9) Please roughly position your company in one of the sectors on the following grid:
Figure 1.1: Product Classification
High Product Complexity Low
High
Uncertainty
Low
Super Value Goods Fashion / Jobbing fast response
Consumer Durables
Value
Commodities Mass Production
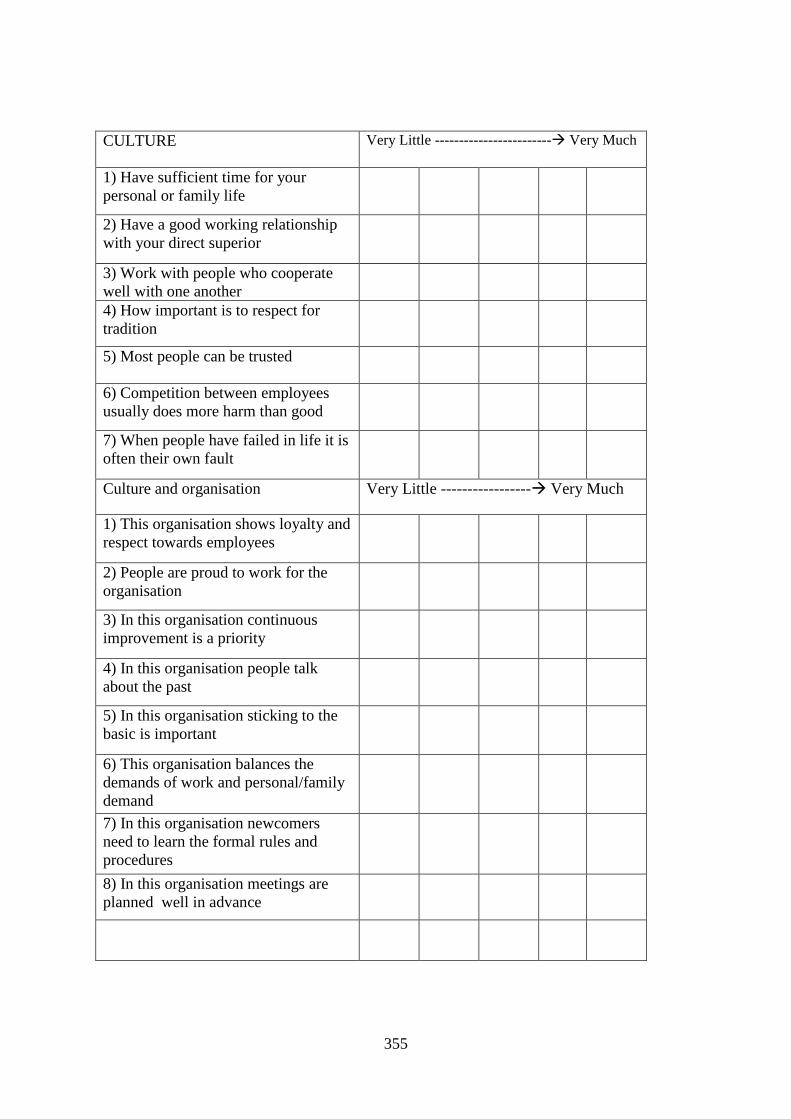
355
CULTURE Very Little ------------------------ Very Much
1) Have sufficient time for your
personal or family life
2) Have a good working relationship
with your direct superior
3) Work with people who cooperate
well with one another
4) How important is to respect for
tradition
5) Most people can be trusted
6) Competition between employees
usually does more harm than good
7) When people have failed in life it is
often their own fault
Culture and organisation Very Little ----------------- Very Much
1) This organisation shows loyalty and
respect towards employees
2) People are proud to work for the
organisation
3) In this organisation continuous
improvement is a priority
4) In this organisation people talk
about the past
5) In this organisation sticking to the
basic is important
6) This organisation balances the
demands of work and personal/family
demand
7) In this organisation newcomers
need to learn the formal rules and
procedures
8) In this organisation meetings are
planned well in advance
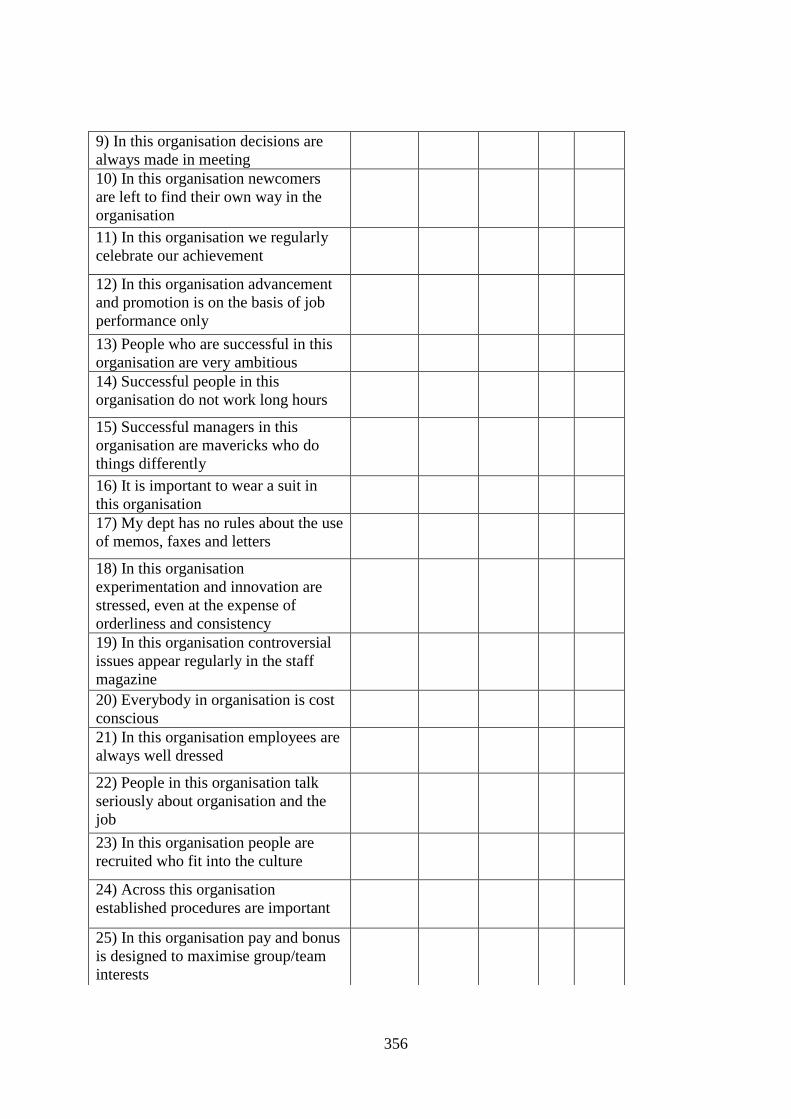
356
9) In this organisation decisions are
always made in meeting
10) In this organisation newcomers
are left to find their own way in the
organisation
11) In this organisation we regularly
celebrate our achievement
12) In this organisation advancement
and promotion is on the basis of job
performance only
13) People who are successful in this
organisation are very ambitious
14) Successful people in this
organisation do not work long hours
15) Successful managers in this
organisation are mavericks who do
things differently
16) It is important to wear a suit in
this organisation
17) My dept has no rules about the use
of memos, faxes and letters
18) In this organisation
experimentation and innovation are
stressed, even at the expense of
orderliness and consistency
19) In this organisation controversial
issues appear regularly in the staff
magazine
20) Everybody in organisation is cost
conscious
21) In this organisation employees are
always well dressed
22) People in this organisation talk
seriously about organisation and the
job
23) In this organisation people are
recruited who fit into the culture
24) Across this organisation
established procedures are important
25) In this organisation pay and bonus
is designed to maximise group/team
interests
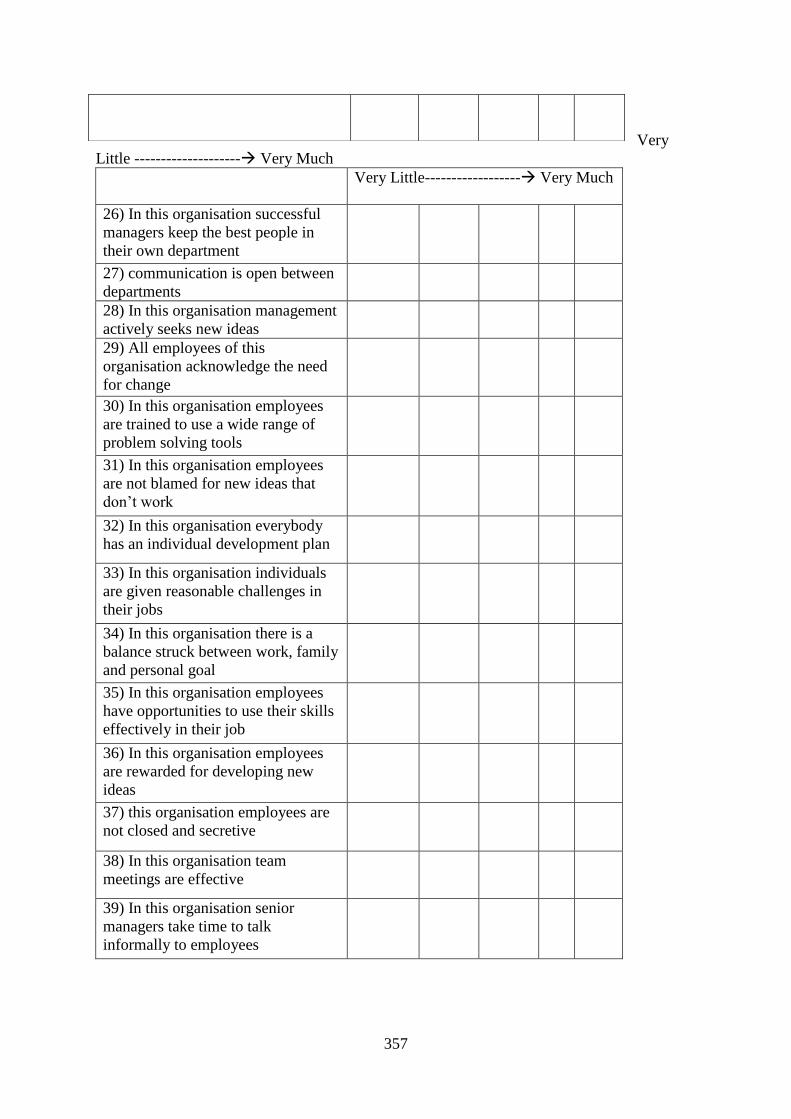
357
Very
Little -------------------- Very Much
Very Little------------------ Very Much
26) In this organisation successful
managers keep the best people in
their own department
27) communication is open between
departments
28) In this organisation management
actively seeks new ideas
29) All employees of this
organisation acknowledge the need
for change
30) In this organisation employees
are trained to use a wide range of
problem solving tools
31) In this organisation employees
are not blamed for new ideas that
don‟t work
32) In this organisation everybody
has an individual development plan
33) In this organisation individuals
are given reasonable challenges in
their jobs
34) In this organisation there is a
balance struck between work, family
and personal goal
35) In this organisation employees
have opportunities to use their skills
effectively in their job
36) In this organisation employees
are rewarded for developing new
ideas
37) this organisation employees are
not closed and secretive
38) In this organisation team
meetings are effective
39) In this organisation senior
managers take time to talk
informally to employees

358
40) In this organisation managers
make use of everyone‟s job skills
and talents
Very Little ----------------- Very Much
41) In this organisation managers
are prepared to pass on
responsibility and power
42) In this organisation employees
are treated fairly, and with respect
43) In this organisation people are
willing to share their power there is
a lot of co-operation
44) In this organisation employees
avoid observing rules for the sake of
rules
45) In this organisation key
processes have process owners
managers responsible for the
operation of that process
46) In this organisation senior
managers role is primarily strategy
and planning
47) This organisation is actively
developing new capabilities and
competencies to meet future needs
48) In this organisation managers
consider the longer-term when
making daily decisions
49) In this organisation we know our
competitors and their strengths and
weaknesses
50) In this organisation we are
strongly aware of the competition
and what they are doing
51) This organisation think ahead
three years or more

359
52) Everybody knows and
understands the this organisation
mission
53) This organisation has clear long
term goals agreed with all
employees committed to achieving
them
Very little ------------------ Very Much
54) This organisation procedures are
more important than results
55) In this organisation important
decisions are made by groups and
team
56) In this organisation changes are
normally made through consultation
57) In this organisation budget
pressures have no impact on
decisions being made
58) In this organisation employees
are comfortable in unfamiliar
situation
59) In this organisation change is
fast and immediate
60) In this organisation every day is
different
61) In this organisation there is clear
preference for challenge
62) In this organisation projects are
always implemented by agree
deadline
63) In this organisation we find it
easy to adjust to new requirements
TQM Very Little ---------------- Very Much
1) Senior executive assume active
responsibility for evaluation and
improvement of management
system, and leading quality drive
2) Visibility of senior executive
commitment to quality and customer
satisfaction
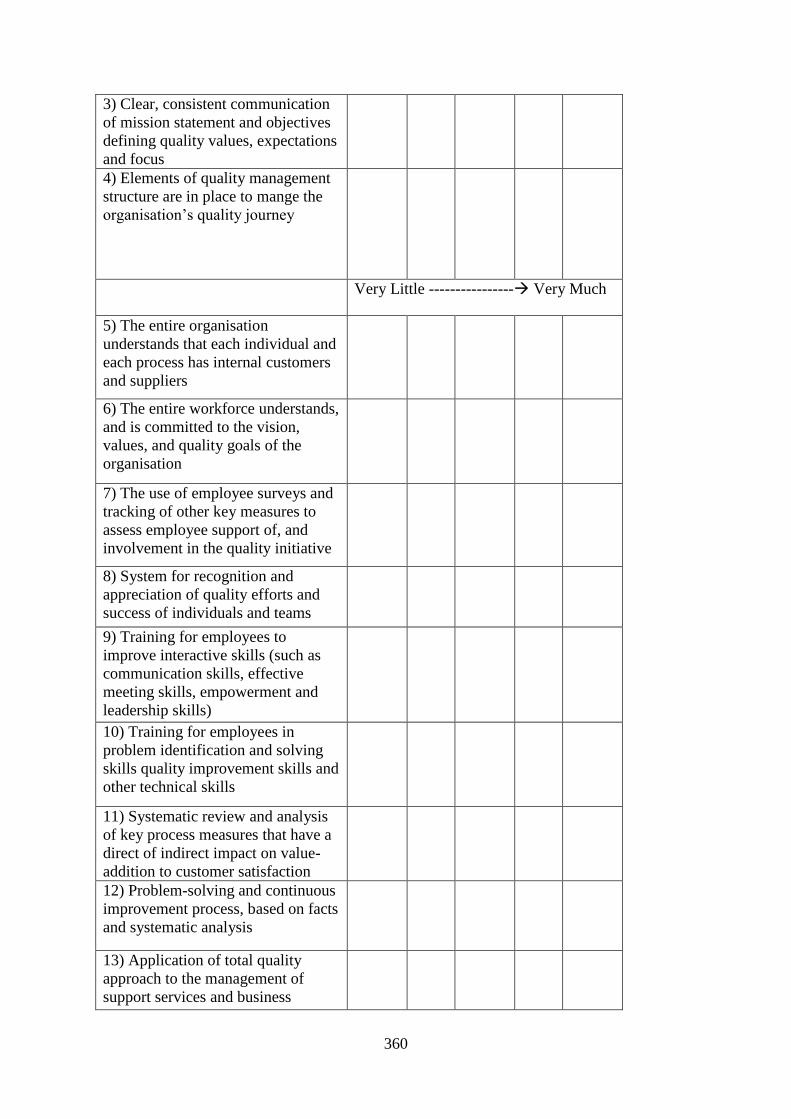
360
3) Clear, consistent communication
of mission statement and objectives
defining quality values, expectations
and focus
4) Elements of quality management
structure are in place to mange the
organisation‟s quality journey
Very Little ---------------- Very Much
5) The entire organisation
understands that each individual and
each process has internal customers
and suppliers
6) The entire workforce understands,
and is committed to the vision,
values, and quality goals of the
organisation
7) The use of employee surveys and
tracking of other key measures to
assess employee support of, and
involvement in the quality initiative
8) System for recognition and
appreciation of quality efforts and
success of individuals and teams
9) Training for employees to
improve interactive skills (such as
communication skills, effective
meeting skills, empowerment and
leadership skills)
10) Training for employees in
problem identification and solving
skills quality improvement skills and
other technical skills
11) Systematic review and analysis
of key process measures that have a
direct of indirect impact on value-
addition to customer satisfaction
12) Problem-solving and continuous
improvement process, based on facts
and systematic analysis
13) Application of total quality
approach to the management of
support services and business
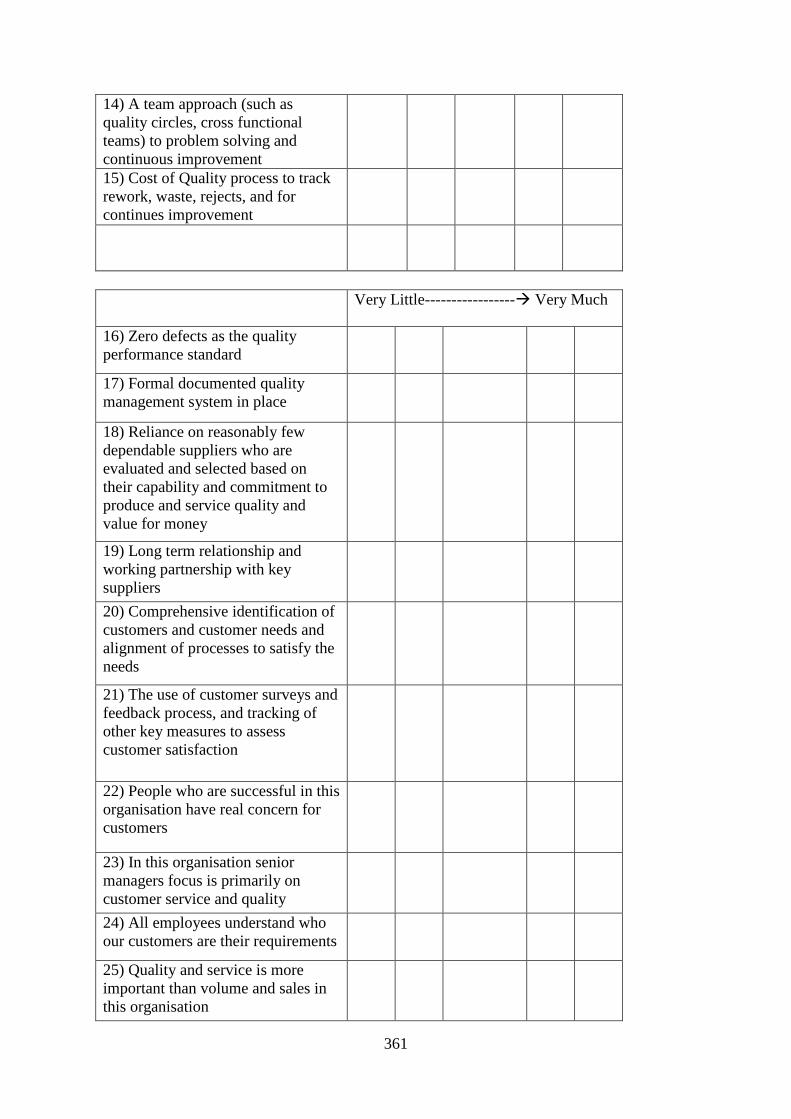
361
14) A team approach (such as
quality circles, cross functional
teams) to problem solving and
continuous improvement
15) Cost of Quality process to track
rework, waste, rejects, and for
continues improvement
Very Little----------------- Very Much
16) Zero defects as the quality
performance standard
17) Formal documented quality
management system in place
18) Reliance on reasonably few
dependable suppliers who are
evaluated and selected based on
their capability and commitment to
produce and service quality and
value for money
19) Long term relationship and
working partnership with key
suppliers
20) Comprehensive identification of
customers and customer needs and
alignment of processes to satisfy the
needs
21) The use of customer surveys and
feedback process, and tracking of
other key measures to assess
customer satisfaction
22) People who are successful in this
organisation have real concern for
customers
23) In this organisation senior
managers focus is primarily on
customer service and quality
24) All employees understand who
our customers are their requirements
25) Quality and service is more
important than volume and sales in
this organisation
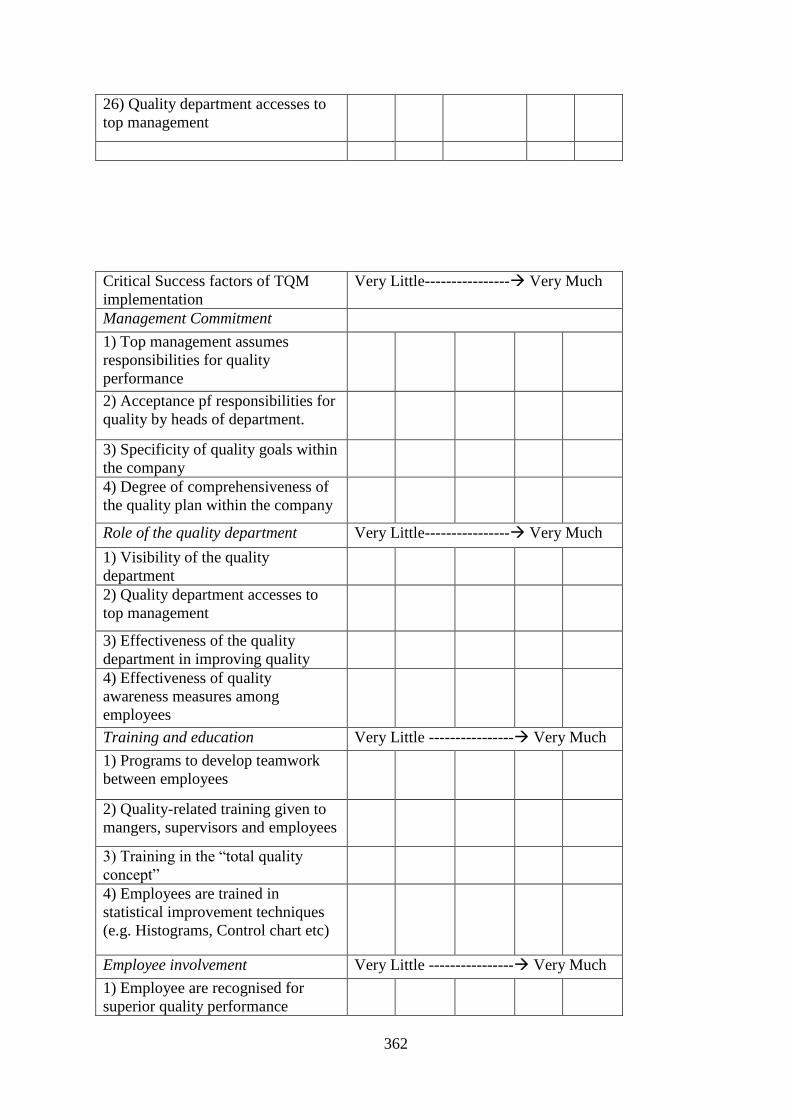
362
26) Quality department accesses to
top management
Critical Success factors of TQM
implementation
Very Little---------------- Very Much
Management Commitment
1) Top management assumes
responsibilities for quality
performance
2) Acceptance pf responsibilities for
quality by heads of department.
3) Specificity of quality goals within
the company
4) Degree of comprehensiveness of
the quality plan within the company
Role of the quality department Very Little---------------- Very Much
1) Visibility of the quality
department
2) Quality department accesses to
top management
3) Effectiveness of the quality
department in improving quality
4) Effectiveness of quality
awareness measures among
employees
Training and education Very Little ---------------- Very Much
1) Programs to develop teamwork
between employees
2) Quality-related training given to
mangers, supervisors and employees
3) Training in the “total quality
concept”
4) Employees are trained in
statistical improvement techniques
(e.g. Histograms, Control chart etc)
Employee involvement Very Little ---------------- Very Much
1) Employee are recognised for
superior quality performance
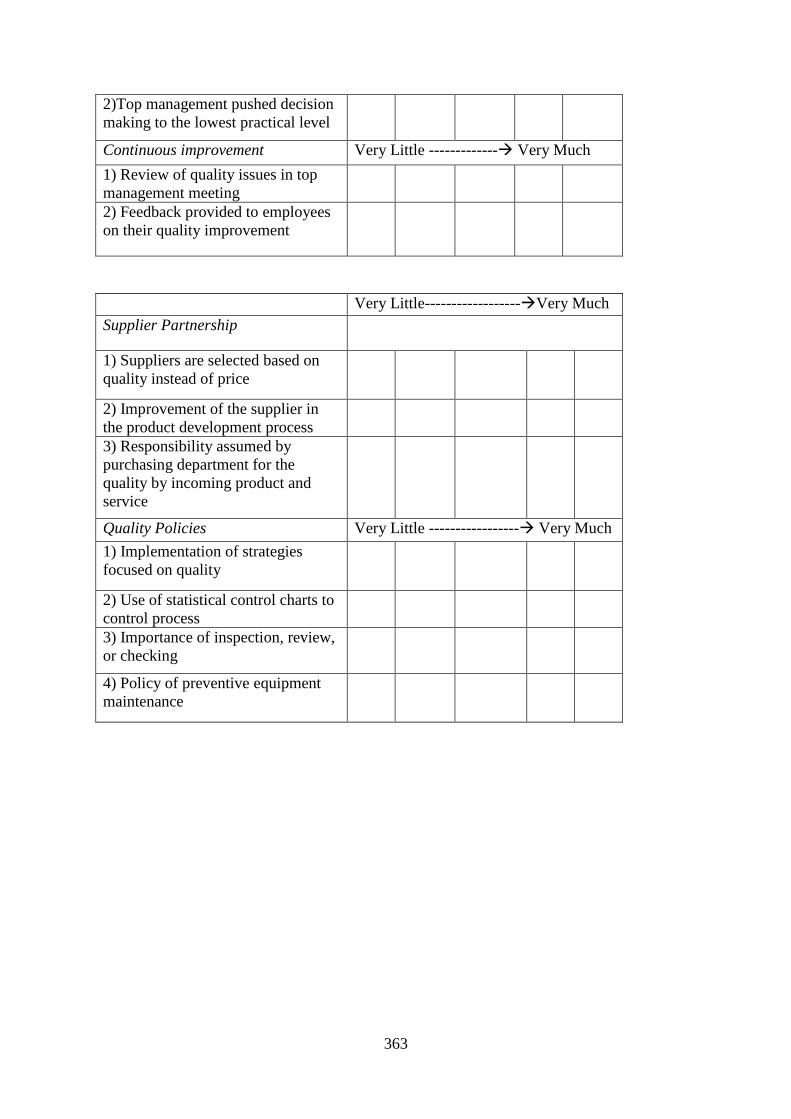
363
2)Top management pushed decision
making to the lowest practical level
Continuous improvement Very Little ------------- Very Much
1) Review of quality issues in top
management meeting
2) Feedback provided to employees
on their quality improvement
Very Little------------------Very Much
Supplier Partnership
1) Suppliers are selected based on
quality instead of price
2) Improvement of the supplier in
the product development process
3) Responsibility assumed by
purchasing department for the
quality by incoming product and
service
Quality Policies Very Little ----------------- Very Much
1) Implementation of strategies
focused on quality
2) Use of statistical control charts to
control process
3) Importance of inspection, review,
or checking
4) Policy of preventive equipment
maintenance

364