university of huddersfield repositoryeprints.hud.ac.uk/16672/1/14_2011.pdf · economic growth in...
TRANSCRIPT

University of Huddersfield Repository
Ghannouci, Walid and Radic, Nemanja
Banking efficiency and economic growth in the MENA region
Original Citation
Ghannouci, Walid and Radic, Nemanja (2011) Banking efficiency and economic growth in the MENA region. Working Paper. London Metropolitan University, London, UK.
This version is available at http://eprints.hud.ac.uk/id/eprint/16672/
The University Repository is a digital collection of the research output of theUniversity, available on Open Access. Copyright and Moral Rights for the itemson this site are retained by the individual author and/or other copyright owners.Users may access full items free of charge; copies of full text items generallycan be reproduced, displayed or performed and given to third parties in anyformat or medium for personal research or study, educational or notforprofitpurposes without prior permission or charge, provided:
• The authors, title and full bibliographic details is credited in any copy;• A hyperlink and/or URL is included for the original metadata page; and• The content is not changed in any way.
For more information, including our policy and submission procedure, pleasecontact the Repository Team at: [email protected].
http://eprints.hud.ac.uk/

CENTRE FOR EMEA BANKING, FINANCE & ECONOMICS
Banking Efficiency and
Economic Growth in the MENA Region
Walid Ghannouchi and Nemanja Radić
Working Paper Series
No 14/11

2
Banking efficiency and
Economic growth in the MENA region
WalidGhannouchi
Efficept management consulting,
Nemanja Radić*
London Metropolitan University,
Abstract
This paper examines the nexus between cost efficiency and economic growth in the Middle
East and North Africa region. We apply a causality analysis between cost efficiency and
financial deepening using the Generalized Methods of Moments and our findings show a
significant and positive causality and reverse relationship between financial deepening and
banking productivity. We introduce a set of control variables associated with the long run
growth and find an interesting interaction with banking productivity and financial deepening
suggesting that efforts should be focusing on the investments’ efficiency and the increase of
regulation to spur a more stable financial system and foster financial deepening in the
future.
JEL classification:O11; O16; G21; L23
Keywords: Financial development; Economic growth; MENA, Causality analysis
*
Corresponding Author: Centre for EMEA Banking, Finance and Economics, London Metropolitan Business School, London
Metropolitan University, 84 Moorgate, London EC2M 6SQ, UK; Tel: (+44) 020 7320 1550; E-mail: [email protected]

3
1 Introduction
This study focuses on seven countries in the MENA region in order to investigate the nexus between
banking efficiency and economic growth. We consider the banking system with no distinction
between conventional and Islamic banks, as our findings in the previous chapter suggest that the
technology gap between the two banking systems is quasi-null.
In the latest two decades, the MENA region has witnessed important efforts of market liberalization
and upgrade of the banking systems. The choice of the MENA region is motivated by the facts that
there is no specific empirical evidence on the analysis of the relationship between cost efficiency and
financial deepening and that many countries in the region have deliberately proceeded to the
reform of their financial sectors aiming higher economic growth (Boulila and Trabelsi (2004)).
Hence we consider that analysing banking productivity for the selected MENA countries in our
sample would help providing evidence on the causes of financial intermediary development and help
policymakers design reforms that indeed promote growth-enhancing financial sector development.
2 Literature review
There exists considerable literature on the nexus between finance and economics growth. Since
Schumpeter (1912) stressed the importance of financial services in promoting economic growth, a
large number of studies was undertaken exploring the finance economic growth nexus in various
regions of the world showing a general positive relationship between the two (Greenwood and
Jovanovic (1990), King and Levine (1993a), DeGregorio and Guidotti (1995), Beck and Levine (2002),
Levine, et al. (2000),Fung (2009)); other studies applied to developing countries, in line with the view
of the World Bank (WorldBank (1989) and WorldBank (2005)), suggest that the relationship between
financial development and economic growth cannot be generalized across countries because
economic policies are country specific (Al-Yousif (2002)).
Inthe MENA region, a certain number of relevant studies investigated the impact of finance
development on the economic growth and vice versa leading to mitigated conclusions.Boulila and
Trabelsi (2004) investigated the causality between financial development and economic growth over
a large time period from 1960 and 2002 in 16 countries and found little support that finance leads to
long run economic growth but a tendency that causality runs from the real sector to the
development of the financial sector whereas Abu-Bader and Abu-Qarn (2008) showed an empirical

4
evidence from six countries in the MENA region that strongly supports the hypothesis that finance
leads to growth and criticized that in the study Boulila and Trabelsi (2004) it is difficult to account for
a long run relationship since “for a large number of the countries, the number of observation did not
exceed 25 years” (Abu-Bader and Abu-Qarn (2008), page 804).Abu-Qarn and Abu-Bader (2007)
conducting a study on 10 countries over the period 1960 to 1998, investigated the factors leading to
the long run economic growth considering productivity gains and factor accumulation, their results
support that factor accumulation is a leading contributor to economic growth. Furthermore, at the
country level,Abu-Bader and Abu-Qarn (2008) focusing on Egypt’s case found a positive causality
relationship from financial development to economic growth through a simultaneous increase in
resources for investment and efficiency enhancement.These studies focusing mainly on the financial
development of the economy as a whole do not specifically address any causality relationship
between economic growth and financial institutions’ efficiency. Interestingly, a studybyBolbol, et al.
(2005)conducted at the country level considers the financial structure in Egypt and investigates its
causality effect with the total factor productivity.Furthermore, Pasiouras, et al. (2009) investigated
the relationship between bank efficiency and the regulatory and supervisory framework for 74
countries from 2000 to 2004, and included a set of control variables to assess the determinants of
banking productivity.
To our knowledge there are no studies specifically investigating the causality between banking cost
efficiency and financial deepening in the MENA region.
In order to assess the financial development in the MENA region we use a specific measure of
financial deepening:credit to the private sector in terms of GDP (CPR), considered as one of the
relevant indicators of the magnitude and the extend of financial intermediation broadly defined
(Boulila and Trabelsi (2004), page 211) . This indicator has been used widely in the literature (King
and Levine (1993a),Demetriades and Hussein (1996), DeGregorio and Guidotti (1995), Levine, et al.
(1999), Guillaumont, et al. (2006)) and is supposed to delimitate more precisely the investment
financing activity to the private sector as opposed to the credits to the government or public
companies and credits issued by the central bank.
Furthermore, we use other macro-economic variables considered as associated with the long run
economic growth such as GDP per capita, to measure the degree of wealth in a given country,
Government expenditures in terms of GDP, to measure the degree of implication of the government
in the economyand considered as one of the major variables commonly used in estimating growth

5
equations (Abu-Bader and Abu-Qarn (2008)), Consumer Price Index, measuring inflation level, Trade
(exports and imports) in terms of GDP and the exchange rate for each country.
A summary of the macro economic variables used in this study is presented in Table 1.
<< Insert Table 1 >>
3 Data and Methodology
3.1 Data
Table 2 provides a summary statistics of the variables used in this study split into bank based
variables (usedfor the cost efficiency estimation) and the macro economic variables (used for the
Generalised Method of Momentsestimation).
<< Insert Table 2 >>
3.1.1 Cost efficiency estimation
We gathered a total of 583 observations for seven countries in the MENA region over the time
period 2000-2006. The data were compiled from the International Bank Credit Analysis Bankscope
database and include the annual reports of conventional banks and fully pledged Islamic banks,
excluding Islamic windows of conventional banks.
For comparability purposes, accounting standards used to compile to annual reports are specific for
each industry considered, as for conventional banks’ annual reports are established under the IFRS
standards whereas for Islamic banks’ annual reports are established under the Accounting and
Auditing Organization for Islamic Financial Institutions (AAOIFI) Standards which are the specific
accounting standards for the Islamic banking industry (Bankscope allows downloading the data in
the AAOIFI standards under the “SupraNationalIslamnew”1 Model format).
For conventional banks, we specify three outputs consisting of loans, securities and off balance
sheet items. In order to find an analogy in the choice of variables for Islamic banks, we group under
the Loans variable, as proposed byHussein (2004), the specific Islamic forms of debts (i.e. Murabaha,
Salam and Quard fund for short term debts, and Sukuk, Leasing and Istisna for the long term debts),
1 The “SupraNationalIslamnew” Bankscope format includes in the depreciation: the amortization of goodwill which is not IFRS compliant,as well as the depreciation in
physical capital that is bought for leasing.
6
we consider for the second output variable the equity financing (i.e. Securities, Mudaraba,
Musharakah and other Investments) and for the third output variable the off-balance sheet items
since they generate income as well as liabilities for the banks and therefore should not be ignored.
We specify three inputs variables for both conventional and Islamic banks: the price of labour, the
price of funds and the price of physical capital and we include bank’s equity capital as a fixed input.
For Islamic banks, the price of funds is obtained by dividing the profits distributed to depositors and
investors (the case of savings accounts for the former and the case of profit and loss sharing
investment accounts for the latter) resulting from the Islamic banks’ investing and financing
activities (specifically labelled as “funding expenses” in Bankscope Database) over total funds. In
fact, the returns on the deposits at Islamic banks (whether in savings or two-tier mudarabah mode)
are determined ex-post depending on the economic return on investment in which the deposits
were placed (accordingly to the Sharia’ principles).
The dependant variable “Total Cost” is calculated as the sum of interest expenses (i.e. profits
distributed to depositors and investors for Islamic banks under respectively savings accounts and
profit and loss sharing investment accounts), commission expenses, fee expenses, trading expenses
and total operating expenses for each year.
3.1.2 Generalised Method of Moments estimation
The macro economic variables data used for the GMM estimation have been downloaded from the
IMF International Financial Statistics. The variables’ levels show certain disparities, in fact the credit
to the private sector (CPR) in Figure 1 shows various levels depending on the country with a mean
value of 51%, a minimum value of 31% observed in Saudi Arabia and a maximum value of 78%
observed in Jordan, this shows the differences in the degree of financial deepening between the
selected countries in the sample and clearly sets the countries with high level of CPR as relying
heavily on banks credits.
Figure 1 : Mean credit to the private sector in terms of GDP in the MENA region

7
Source: IMF international financial statistics
The inflation rate (CPI) shows an average value of 2.74% and maximum values observed in United
Arab Emirates and Qatar where the inflation rate soared the subsequent years leading to a runaway
two digits inflation rate. The TRADE in terms of GDP variable shows interesting results as it peaks at
157% for Bahrain and is relatively high for all the countries in the sample whereas the mean
GOV/GDP value is relatively low with a mean value of 18% and as Figure 2 shows, the trend is rather
oriented to lower government expenditures implying less implication from governments and more
market liberalization.
Figure 2 : Mean government expenditures in terms of GDP in the MENA region
Source: IMF international financial statistics
0
0.1
0.2
0.3
0.4
0.5
0.6
0.7
0.8
0.9
1
2000 2001 2002 2003 2004 2005 2006
CPR/GDP
BAHRAIN
JORDAN
KUWAIT
QATAR
SAUDI ARABIA
TUNISIA
UAE
0
0.05
0.1
0.15
0.2
0.25
0.3
2000 2001 2002 2003 2004 2005 2006
BAHRAIN
JORDAN
KUWAIT
QATAR
SAUDI ARABIA
TUNISIA
UAE

8
3.2 Methodology
The methodology includes two steps. In the first step we estimate the cost efficiency scores of each
country selected in the sample, for this we use the Stochastic Frontier Analysis to estimate the
efficiency of each bank relative to a common best-practice frontier. In the second step we run a
system of Generalized Method of Moments regression (GMM) to investigate the causality between
banking efficiency and economic growth using in a first stage the Cost Efficiency as a dependant
variable (answering the question: does financial deepening lead to more cost efficient banks?) and in
a second stage the Credit to Private Sector as the dependant variable in order to investigate the
reverse causality (answering the question: does banks cost efficiency lead to more financial depth?)
3.2.1 The stochastic Frontier Approach
The SFA was introduced quasi-simultaneously by Aigner, et al. (1977), Meeusen and Broeck (1977)
and Battese and Cona (1977). The stochastic frontier model assumes that: 1) banks in the sample are
assumed to compete in some way; 2) financial products offered by banks (outputs) are
homogeneous; 3) the sample is limited to the firms that make use of the full range of inputs and
outputs defined by the production set Berger, et al. (2000); 4) all firms operate under the same
frontier in order to benchmark the differences in firm’s efficiencies.
Following Aigner, et al. (1977), the cost efficiency function can be specified as
ktktkt xTC εβ +=ln (1)
Where TCkt represents the total cost of the bank k in period t, xkt is a vector of input prices and
output quantities and β is a vector of parameters to be estimated; we assume that the error of the
cost function is
ktktkt uv +=ε (2)
With vkt , the random error term that accounts for measurement errors, bad luck and other factors
unspecified in the cost function and ukt the cost inefficiency term represents the minimum cost.
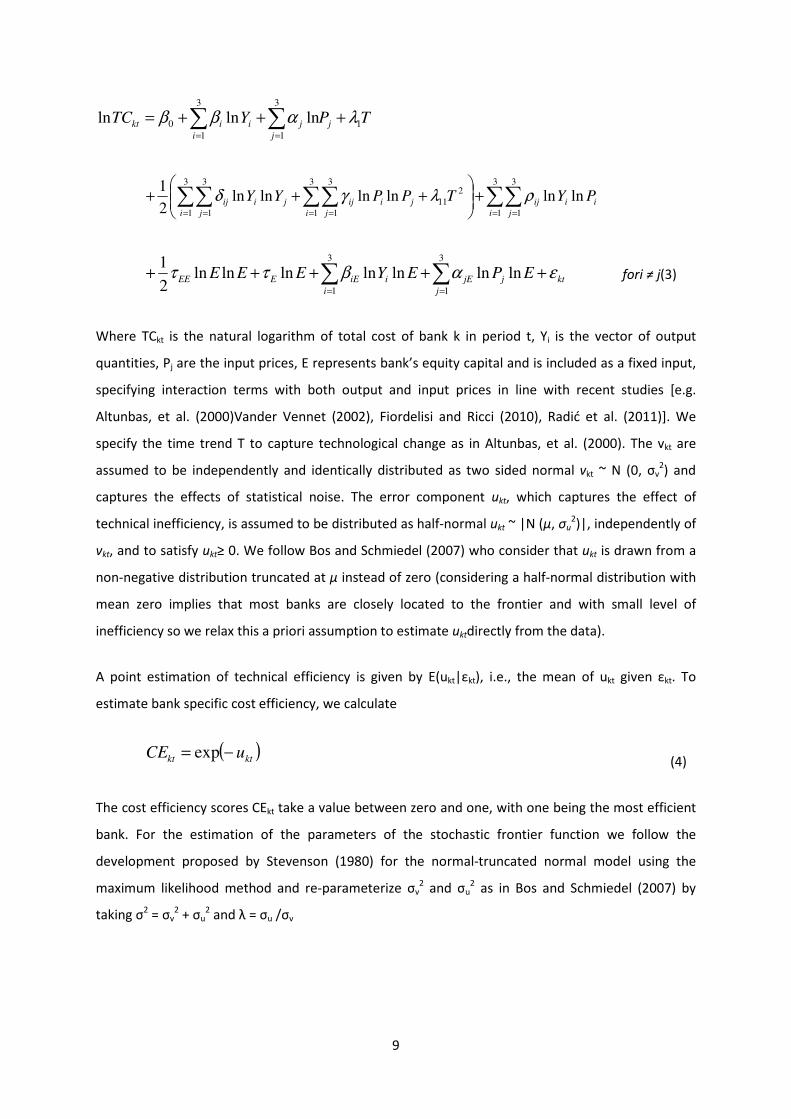
We specify a translog functional form with 3-input and 3-output for the cost frontier model
represented in logs as
9
TPYTC j
i j
jiikt 1
3
1
3
1
0 lnlnln λαββ +++= ∑ ∑= =
ii
i j
ij
i j i j
jiijjiij PYTPPYY lnlnlnlnlnln2
1 3
1
3
1
3
1
3
1
3
1
3
1
2
11 ∑∑∑∑ ∑∑= == = = =
+
+++ ρλγδ
∑ ∑= =
+++++3
1
3
1
lnlnlnlnlnlnln2
1
i j
ktjjEiiEEEE EPEYEEE εαβττ fori ≠ j(3)
Where TCkt is the natural logarithm of total cost of bank k in period t, Yi is the vector of output
quantities, Pj are the input prices, E represents bank’s equity capital and is included as a fixed input,
specifying interaction terms with both output and input prices in line with recent studies [e.g.
Altunbas, et al. (2000)Vander Vennet (2002), Fiordelisi and Ricci (2010), Radić et al. (2011)]. We
specify the time trend T to capture technological change as in Altunbas, et al. (2000). The vkt are
assumed to be independently and identically distributed as two sided normal vkt ~ N (0, σv2) and
captures the effects of statistical noise. The error component ukt, which captures the effect of
technical inefficiency, is assumed to be distributed as half-normal ukt ~ |N (μ, σu2)|, independently of
vkt, and to satisfy ukt≥ 0. We follow Bos and Schmiedel (2007) who consider that ukt is drawn from a
non-negative distribution truncated at μ instead of zero (considering a half-normal distribution with
mean zero implies that most banks are closely located to the frontier and with small level of
inefficiency so we relax this a priori assumption to estimate uktdirectly from the data).
A point estimation of technical efficiency is given by E(ukt|εkt), i.e., the mean of ukt given εkt. To
estimate bank specific cost efficiency, we calculate
( )ktkt uCE −= exp
(4)
The cost efficiency scores CEkt take a value between zero and one, with one being the most efficient
bank. For the estimation of the parameters of the stochastic frontier function we follow the
development proposed by Stevenson (1980) for the normal-truncated normal model using the
maximum likelihood method and re-parameterize σv2 and σu
2 as in Bos and Schmiedel (2007) by
taking σ2 = σv
2 + σu
2 and λ = σu /σv

10
3.2.2 Generalized Method of Moments
Levine (2004) considers the GMM methodology as especially useful when analyzing the finance-
growth relationship since it is argued that financial development is intrinsically related to greater
economic performance. Based on Roodman (2006) pedagogic paper, the system GMM is specifically
designed for panel data estimation where (1) N (number of observations) is large sample and T (time
period) is small, (2) linear function relationship, (3) dynamic single left-hand-side dependant
variable, (4) non strictly endogenous independent variables, (5) fixed effects model and (6)
heteroskedasticity and autocorrelation within individuals but not across them. Thus the system
GMM is considered as very reliable estimation methodology in the presence of endogeneity as it
takes into account both the time and cross-sectional variations and gives the possibility to avoid any
bias between cross country regressions. The use of instruments is considered as an advantage as
outlined by Levine (2004) who considers that : ‘to assess whether the finance-growth relationship is
driven by simultaneity bias, one needs instrumental variables that explain cross-country differences
in financial development but are uncorrelated with economic growth beyond their link with financial
development.’(Levine (2004),page 43)
In their seminal paper, Arellano and Bond (1991)proposed the GMM methodology for panel data
analysis and then developed by Blundell and Bond (1998).
We consider the following model:
titititi Xyy ,,1,, εβα ++= − (5)
tiiti ,, νµε += (6)
With [ ] [ ] [ ] 0=== itiiti EEE νµνµ (7)
Where y is the dependent variable, 1, −tiy is the lagged dependent variable,
tiX ,represent a set
ofexogenous variables (explanatory variables), ti ,ε is the disturbance term containing two
orthogonal components: the fixed effects, iµ representing the unobserved country-specific effect,
and ti ,ν representing the idiosyncratic shocks.i andtbeing the observations and time respectively.
The issue in this model is that the lagged dependent variable 1, −tiy is correlated with the fixed effects
iµ contained in the disturbance term, which Nickell (1981) identifies as the “dynamic panel bias”

11
since ‘using the standard within-group estimator for dynamic models with fixed individual effects
generates estimates which are inconsistent as the number of "individuals" tends to infinity if the
number of time periods is kept fixed’ (Nickell (1981), page 1417). Hence a first transformation called
“Difference GMM estimator” is proposed by Arellano and Bond (1991) in order to eliminate the fixed
effect, which gives:
titititi Xyy ,,1,, νβα ∆+∆+∆=∆ − (8)
Arellano and Bond (1991)suggest to use the lagged values of the exogenous variables as instruments
to correct their endogeneity, with the assumption that there is no serial correlation in the error term
ti ,ν and that tiX ,are weakly exogenous. They use the following moment conditions:
[ ] 0. 1,,, =− −− titistiXE νν (9)
For s≥2 ; t=3,...,T
They propose then to create a two step GMM estimator. In the first step the error terms are
assumed to be both independent and homoskedastic across countries and over time, and in the
second step they construct a consistent estimate of the variance co-variance matrix using the
residuals obtained from the first step obtaining the difference estimator (Beck, et al. (2000)).
However, even after purging the fixed effects 1, −tiy may still be endogenous as correlation persists
between 1, −tiy and
1, −tiν in equation (8). The same applies for the explanatory variables as they
might become potentially endogenous due to their correlation with 1, −tiν .Consequently, a second
transformation is proposed by Arellano and Bover (1995) using a system estimator in order to
eliminate the problems related to the difference estimator namely biasness and imprecision.
In this study, we follow Roodman (2006) usingxtabond2with the STATA package to estimate the
GMM system for it powerful features to provide on one hand the model testing results(the Hansen J-
test and the second order autocorrelation) and on the second hand allows the use of a two-step
robust estimation as proposed by Windmeijer (2005). Considering our sample of 583 observations,
whereas Arellano and Bond (1991)consider that caution should be advisable in making inferences
based on the two-step estimator alone in samples of medium size, Windmeijer (2005) uses a
corrected variance estimate to approximate the finite sample with more accurate inference.

12
The first stage of our estimation is the causality between Cost Effiency (CE) and financial deepening
(CPR) using the following equation:
tititititititi CPICPRCPRCPRCECE ,52,31,3,2,1,, βββββα +++++= −−
tiititititti taGDPpercapiXRATEGOVTRADE ,,8,8,7,6 νµββββ +++++ (10)
Then, in a second stage, we estimate the reverse causality represented by the following equation
tititititititi CPICECECECPRCPR ,52,31,3,2,1,, βββββα +++++= −−
tiititititti taGDPpercapiXRATEGOVTRADE ,,8,8,7,6 νµββββ +++++ (11)
Where the variables used in the GMM system are listed and defined in the table 3
<< Insert Table 3 >>
In order to test the robustness of our results, we run 6 models considering for:
1. Model 1: the endogenous dependent variableCE;
2. Model 2: the endogenous dependent variable CE with its lag CEt-1;
3. Model 3: The lagged endogenous dependent variables only CEt-1 andCEt-2;
4. Model 4: the endogenous dependent variable CPR;
5. Model 5: the endogenous dependent variable CPR with its lag CPRt-1; and
6. Model 6: The lagged endogenous dependent variables only CPRt-1 and CPRt-2.
Finally, we analyse two tests to assess the GMM methodologyas explained byCameron and Trivedi
(2009):
� The Hansen J-test: evaluates the correct identification of the variables used in the model and
rejects the null hypothesis that the over-identifying restrictions are valid, so if the p-value >
0.05 the model is valid; and
� The second order autocorrelation assumption testing: for consistent estimation, the
estimators require that the error termbe serially uncorrelated.

13
4 Results and discussion
Table 4 reports the cost efficiency results the selected countries in the sample. Overall banks in the
MENA region show high cost efficiency scores and are comparable with previous studies on banking
cost efficiency in the region (Al-Shammari and Salimi (1998), Iqbal and Molyneux (2007), Pasiouras,
et al. (2009)).Figure 2 shows that for Tunisia, the United Arab Emirates and Bahrain mean cost
efficiency scores are rather lower than the other 4 countries in the sample, this can be explained by
the fact that in the last decade, these countries witnessed strengthening regulation which caused for
the banks an increase in the costs of compliance (for more details see Naceur (2003);Creane, et al.
(2004)).
Figure 2 :Mean cost efficiency trends in the MENA region
Source: computed by the author
The next step of our analysis is to investigate the causality and reverse causality between cost
efficiency and financial deepening.
In table 5, the results show the causality relationship from financial deepening towards the Cost
Efficiency being the dependant variable.
<< Insert Table 5>>
We find a positive relationship between CE and CPR.The CPR coefficient in the main model is
significant and shows that an increase by 1% in the CPR impacts the CE by an increase of 16%. This
can be explained by the fact that a greater financial deepening shifts up the level of outputs at the
0.70
0.75
0.80
0.85
0.90
0.95
1.00
2000 2001 2002 2003 2004 2005 2006
BAHRAIN
JORDAN
KUWAIT
QATAR
SAUDI ARABIA
TUNISIA
UNITED ARAB EMIRATES

14
banks’ level leading to an increased banking productivity. However, we consider this causality as
relatively weak, as the main model validates the hypothesis that greater financial deepening implies
greater banking productivity for the selected MENA countries in our sample while in the robustness
testing models in table 6 the CPR variable is not statistically significant.
<< Insert Table 6 >>
Investigating the control variables, the main model, supported by the robustness models results,
shows the TRADE variable as significant and negatively impacting banking cost efficiency. The MENA
countries in our sample present the particularity of containing four of the largest oil exporting
countries, when digging at the level of imports and exports for each country we find that the level of
exports is relatively high. Hence the results suggest that banks evolving in expanding markets
sustained by high levels of oil exports would be less constrained to control their expenses and thus
become less cost efficient. The remaining control variables do not seem to have any significance in
the main model, although in the robustness testing models the GOV has a significant positive impact
on cost efficiency(models (a) and (b)) implying that government expenditures in the form of financial
incentives boost banking productivity. CPI and XRATE in models (a) and (b) of the robustness tests
are both statistically significant but have very weak impact. We can consider that an increment in
inflation may increase interest rates, particularly lending rates, boosting banking performance and
productivity.
The next stage of our analysis is the reversed causality. We investigate the impact of banking cost
efficiency the financial deepening, or put it differently: does banking productivity improve financial
deepening? We keep in this model the control variables in order to assess their effect on financial
deepening.
The results provided by table 7validate the Hansen J-test with a p-value above 5% so we consider
our results as conclusive. We find a positive causality relationship running from CE and its lag CEt-2 to
CPR.
<< Insert Table 7 >>
Although not validated by the robustness models (d) and (f) in table 8, these results are very
interesting since they show that banking productivity has both an immediate and a lagged effect on
financial development in the selected MENA countries, model (e) validates these findings at the
lagged CEt-1 value.

15
<< Insert Table 8 >>
The control variables show that TRADE has a significant impact on financial deepening. The level of
trade is normally associated with greater financial development, through for example, a greater
demand for new financial products, which could help with risk diversification. Bonfiglioli (2008)
suggests that the degree of openness affects the efficiency in the economy through several channels
such as specialization, comparative advantage, access to larger markets, and increased competition.
Inflation and foreign exchange rate have significant coefficient but present a very low impact on
financial deepening. We find a significant positive effect of government expenditures on financial
deepening in the three robustness models but not in the main model, in this context, these results
corroborate Bonfiglioli (2008) findings who argues that increases in government expenditure,
focused on stimulating the financial sector, crowds out private investments which could in turn
increase financial deepening and economic growth. Finally, and interestingly, the per capita GDP
variable has a statistically significant but negative impact on financial deepening. This result is
obtained under other specifications (models (e), (d) and (f)) and appears to be robust when
estimated in the main model. At first glance this evidence may appear puzzling, butDeGregorio and
Guidotti (1995) find similar results when analyzing the causality between financial deepening and
long term growth in Latin America. They suggest that the negative relationship between CPR and the
long run growth proxy GDP per capita comes from a negative effect on the efficiency of investments
and is the result of financial liberalization in a poor regulatory environment.Moreover, they consider
that the high level of financial intermediation could be a sign of a fragile and overexposed financial
system, rather than one that was efficiently allocating credit. In the MENA region, the recent debt
crisis in Dubai, one the seven states of the United Arab Emirates, is a true example of the lack of
efficiency in investments. The real estate bubble starting in year 2000 has propelled a frenetic
expansion on the back of borrowed cash and speculative investment andburst in 2009 leading to a
collapse in the whole middle-eastern economy where Dubai is a leading financial centre for real
estate development.
Our results are thus supportive of a positive causality and reverse causality relationship between
cost efficiency and financial deepening for the seven MENA countries in our sample.
5 Conclusion
This paper fills the gap in the banking cost efficiency literature in the MENA region and analyses the
causality relationship between banking productivity and financial deepening in seven MENA

16
countries from 2000 till 2006. We first estimated banking cost efficiency for each of the countries
using the stochastic frontier approach methodology. Then,we tested for the causality and reverse
causality relationship between banking productivity and financial deepening. Our empirical results
show a significant and positive causality and reverse relationship between financial deepening and
banks’ productivity suggesting that financial deepening has an important influence on banking
productivity which has in turn a direct positive impact on financial deepening. We introduced a set
of control variables associated with the long rungrowth, used in the literature following other
studies and found that the degree of openness has a negative impact on banking productivity in the
selected countries whereas it has a positive effect on financial deepening along with government
expenditures and inflation. Our results, supported by previous findings in the literature, show a very
interesting evidence of the negative impact of the GDP per capita on financial deepening in a poorly
regulated environment where the investments in the economy are not efficient. Therefore, the
results we show in this study, can be considered as an important argument to increase financial
deepening in the selected MENA countries in order to achieve higher banking productivity. We
consider that efforts should be focusing on the investments’ efficiency and the increase of regulation
to spur a more stable financial system to foster financial deepening in the future which can lead to a
virtuous cycle between financial deepening and banking productivity.

17
Tables and Figures
Table 1 – Mean values of the macro economic variables in the MENA region
CPR/GDP
GDP PER
CAPITA
(USD)
TRADE/GDP GOV/GDP CPI % XRATE
BAHRAIN 0.496036 15204.37 1.57527 0.170374 0.876041 0.376
JORDAN 0.783767 2047.791 1.252713 0.217193 2.715622 0.708998
KUWAIT 0.554767 22225.96 0.875003 0.204062 2.015829 0.298822
QATAR 0.327221 37259.14 0.94697 0.156374 4.725101 3.64
SAUDI ARABIA 0.307261 10678.21 0.757159 0.247652 0.259392 0.192528
TUNISIA 0.608916 2551.684 0.967496 0.155999 2.931406 0.539026
UNITED ARAB EMIRATES 0.550348 26732.84 1.501876 0.128041 5.657143 0.19653
Source: IMF International Financial Statistics
Table 2 – Descriptive statistics
MEAN
STANDARD
DEVIATION MIN MAX
Bank Based Variables
PRICE OF LABOUR 0.0119 0.0087 0.0017 0.0859
PRICE OF FUNDS 0.0308 0.0168 0.0026 0.1405
PRICE OF ASSETS 0.7662 1.0705 0.0034 8.8333
LOANS (in USD) 2,654,402 3,832,375 2,805 24,107,477
OTHER EARNING ASSETS (in USD) 2,235,902 3,320,306 1,320 17,944,246
OFF BALANCE SHEET ITEMS (in USD) 1,807,536 3,230,672 100 32,277,549
Macro Economic Variables
CPR/GDP 0.5183 0.1646 0.3073 0.7838
GDP PER CAPITA (in USD) 16,671 12,957 2,048 37,259
TRADE/GDP 1.1252 0.3203 0.7572 1.5753
GOV/GDP 0.1828 0.0417 0.1280 0.2477
CPI % 2.7401 1.9425 0.2594 5.6571
XRATE 1.9694 1.6418 0.2988 3.7489
Source: IMF International Financial Statistics and Bankscope (values computed by author)

18
Table 3 – Variables used to assess the causality between cost efficiency and economic growth
Variable Description
CE Cost Efficiency
CPR Credit to the private sector in terms of GDP.
CPI Annual percentage change in inflation; measured as the change in the
consumer price index.
TRADE The summation of exports and imports in terms of GDP.
GOV Government expenditure in terms of GDP.
XRATE Logarithm of the annual average exchange rate. (national currency to USD)
GDP per capita Logarithm of the average GDP per capita.
Source: IMF International Financial Statistics and Bankscope
Table 4 – Cost Efficiency mean scores
2000 2001 2002 2003 2004 2005 2006
BAHRAIN 0.91 0.84 0.89 0.87 0.91 0.90 0.87
JORDAN 0.98 0.98 0.98 0.98 0.98 0.98 0.98
KUWAIT 0.98 0.98 0.98 0.98 0.98 0.98 0.98
QATAR 0.99 0.99 0.99 0.99 0.99 0.99 0.99
SAUDI ARABIA 0.95 0.95 0.96 0.95 0.95 0.95 0.95
TUNISIA 0.95 0.73 0.79 0.85 0.90 0.89 0.86
UNITED ARAB EMIRATES 0.89 0.84 0.86 0.88 0.86 0.88 0.85
Source: computed by the author

19
Table 5–Main model: Causality results, Cost Efficiency as a dependent variable
CE ( main model)
CE lagged(t-1) 0.486 ***
CPR 0.164 **
CPR lagged(t-1) -0.096
CPR lagged(t-2) -0.030
CPI -0.001
TRADE -0.038 ***
GOV 0.201
XRATE -0.009
GDP per capita 0.006
Cte. 0.421
AR(1) -2.630
p-value 0.009
AR(2) -0.160
p-value 0.873
Hansen J test 55.380
p-value 0.821
Observations 321
Source: computed by the author * p-value<0.1; ** p-value<0.05; ***p-value<0.01

20
Table 6 – Robustness testing models: Causality results, Cost Efficiency as a dependent variable
CE ( model a ) CE ( model b ) CE ( model c )
CE lagged(t-1) 0.454 *** 0.472 *** 0.533 ***
CPR 0.047
-0.001
CPR lagged(t-1)
0.048
0.065
CPR lagged(t-2)
-0.060
CPI 0.003 ** 0.003 ** 0.001
TRADE -0.038 *** -0.034 *** -0.030 ***
GOV 0.489 *** 0.497 ** 0.193
XRATE -0.009 *** -0.008 ** -0.008
GDP per capita 0.010
0.010
0.001
Cte. 0.336 0.313 0.429
AR(1) -2.680
-2.680
-2.670
p-value 0.007
0.007
0.008
AR(2) -0.780
-0.760
-0.180
p-value 0.434
0.444
0.857
Hansen J test 80.180
79.040
59.970
p-value 0.928
0.930
0.716
Observations 441 441 321
Source: computed by the author * p-value<0.1; ** p-value<0.05; ***p-value<0.01

21
Table 7 – Main model: Reverse causality results, Credit to the private sector (CPR) as a dependent
variable
CPR ( main model)
CPR lagged(t-1) 0.895 ***
CE 0.146 ***
CE lagged(t-1) -0.084
CE lagged(t-2) 0.124 ***
CPI 0.007 ***
TRADE 0.067 ***
GOV 0.164
XRATE 0.001 **
GDP per capita -0.018 ***
Cte. -0.071
AR(1) -4.340
p-value 0.000
AR(2) -0.760
p-value 0.446
Hansen J test 81.150
p-value 0.099
Observations 321
Source: computed by the author * p-value<0.1; ** p-value<0.05; ***p-value<0.01

22
Table 8 – Robustness testing models: Reverse causality results, Credit to the private sector (CPR)
as a dependent variable
CPR ( model d ) CPR ( model e ) CPR ( model f )
CPR lagged(t-1) 0.896 *** 0.895 *** 0.896 ***
CE 0.025
0.001
CE lagged(t-1)
0.056 *** -0.023
CE lagged(t-2)
0.141 ***
CPI 0.007 *** 0.006 *** 0.007 ***
TRADE 0.069 *** 0.070 *** 0.063 ***
GOV 0.384 *** 0.357 *** 0.184 ***
XRATE 0.002 * 0.003 ** 0.000
GDP per capita -0.015 *** -0.016 *** -0.018 ***
Cte. 0.020 -0.001 -0.006
AR(1) -4.210
-4.240
-4.890
p-value 0.000
0.000
0.000
AR(2) -1.790
-1.670
-1.690
p-value 0.073
0.096
0.091
Hansen J test 104.590
105.020
81.880
p-value 0.357
0.320
0.104
Observations 441 441 321
Source: computed by the author * p-value<0.1; ** p-value<0.05; ***p-value<0.01

23
References
Abu-Bader, Suleiman, and Aamer S. Abu-Qarn, 2008, Financial Development and Economic Growth:
Empirical Evidence from Six Mena Countries Review of Development Economics 12, 803 - 817.
Abu-Bader, Suleiman, and Aamer S. Abu-Qarn, 2008, Financial development and economic growth:
The Egyptian experience, Journal of Policy Modeling 30, 887 - 898
Abu-Qarn, Aamer S., and Suleiman Abu-Bader, 2007, Sources of Growth Revisited: Evidence from
Selected MENA Countries, World Development 35, 752-771.
Aigner, Dennis, C. A. Knox Lovell, and Schmidt Peter, 1977, Formulation and Estimation of Stochastic
Frontier Production Models, Journal of Econometrics 6, 21-37.
Al-Shammari, Minwir, and Anwar Salimi, 1998, Modeling the operating efficiency of banks: a
nonparametric methodology, Logistics Information Management 11, 5-17.
Al-Yousif, Yousif Khalifa, 2002, Financial development and economic growth: Another look at the
evidence from developing countries, Review of Financial Economics 11, 131 - 150.
Altunbas, Yener, Ming-Hau Liu, Philip Molyneux, and Rama Seth, 2000, Efficiency and Risk in
Japanese Banking, Journal of Banking and Finance 24, 1605-1628.
Arellano, Manuel, and Stephen Bond, 1991, Some Tests of Specification for Panel Data: Monte Carlo
Evidence and an Application to Employment Equations, The Review of Economic Studies 58, 277-297.
Arellano, Manuel, and Olympia Bover, 1995, Another look at the Instrumental-Variable Estimation of
Error Component Models, Journal of Econometrics 68, 29 - 52.
Battese, George E., and Greg S. Cona, 1977, Estimation of a Production Frontier Model: With
Application to the Pastoral Zone of Eastern Australia, Australian Journal ofAgricultum1 Economics
21, 169-179.
Beck, Thorsten, and Ross Levine, 2002, Industry growth and capital allocation: does having a market-
or bank-based system matter?,Journal of Financial Economics 64, 147 - 180.
Beck, Thorsten, Ross Levine, and Norman Loayza, 2000, Finance and the sources of growth, Journal
of Financial Economics 58, 261-300.
Berger, Allen N., R. DeYoung, H. Genay, and G.F. Udell, 2000, Globalization of financial insitutions:
Evidence from cross-border banking perfomance, in R.E. Litan, and A. Santomero, eds.: Globalization
of financial insitutions: Evidence from cross-border banking perfomance (Brookings-Wharton Papers
on Financial Services).
Blundell, Richard, and Steve Bond, 1998, Initial Conditions and Moment Restrictions in Dynamic
Panel Data Models, Discussion Paper (University College London, London).
Bolbol, Ali A., Ayten Fatheldin, and Mohammed M. Omran, 2005, Financial development, structure,
and economic growth: the case of Egypt, 1974–2002 Research in International Business and Finance
19, 171-194
Bonfiglioli, Alessandra, 2008, Financial integration, productivity and capital Journal of International
Economics 76, 337 - 355.
Bos, J W B, and H Schmiedel, 2007, Is there a single frontier in a single European banking
market?,Journal of Banking and Finance 31, 2081-2102.
Boulila, Ghazi, and Mohamed Trabelsi, 2004, The Causality Issue in the Finance and Growth Nexus:
Empirical Evidence from Middle East and North African Countries, Review of Middle East Economics
and Finance 2, 123 - 138.
Cameron, A. Colin, and Pravin K. Trivedi, 2009.Microeconometrics using Stata (STATA Press, Texas).

24
Creane, Susan, Rishi Goyal, A. Mushfiq Mobarak, and Randa Sab, 2004, Financial Sector
Development in the Middle East and North Africa, IMF Working Paper (International Monetary
Fund).
DeGregorio, Jose, and Pablo E. Guidotti, 1995, Financial development and economic growth, World
Development 23, 433-448.
Demetriades, Panicos O., and Khaled A. Hussein, 1996, Does financial development cause economic
growth? Time-series evidence from 16 countries, Journal of Development Economics 51, 387-411.
Fiordelisi, Franco, and Ornella Ricci, 2010, What are the efficiency gains of Bancassurance? A two-
side analysis: the banking and the insurance standpoint, (Forthcoming, Submitted to European
Journal of finance).
Fung, Michael K., 2009, Financial development and economic growth: Convergence or divergence? ,
Journal of International Money and Finance 28, 56-67.
Greenwood, Jeremy, and Boyan Jovanovic, 1990, Financial Development, Growth, and the
Distribution of Income, Journal of Political Economy 98, 1076 - 1107.
Guillaumont, Jeanneney, S. Hua P, and Z Liang, 2006, Financial Development, Economic Efficiency,
and Productivity Growth: Evidence From China, The Developing Economies 44, 27 - 52.
Hussein, 2004, Efficiency in Bahrain: Islamic Vs Conventional Banks, (Islamic Research and Training
Institute, Saudi Arabia).
Iqbal, Munar, and Philip Molyneux, 2007.Thirty years of Islamic Banking. History, Performance and
Prospects (Palgrave).
King, Robert G., and Ross Levine, 1993a, Finance and Growth: Schumpeter Might be Righ, Quarterly
Journal of Economics 108, 717 - 737.
Levine, Ross, 2004, Finance and Growth: Theory and Evidence, NBER Working Paper Series (National
Bureau of Economic Research, Cambridge, MA).
Levine, Ross, Norman Loayza, and Thorsten Beck, 1999, Financial Intermediation and Growth:
Causality and Causes, World Bank Policy Research Working Paper.
Levine, Ross, Norman Loayza, and Thorsten Beck, 2000, Financial intermediation and growth:
Causality and causes, Journal of Monetary Economics 48, 31 - 77.
Meeusen, Wim, and Julien van den Broeck, 1977, Efficiency Estimation from Cobb-Douglas
Production Functions with Composed Error, Interrzational Economic Review 18, 435-444.
Naceur, Samy Ben, 2003, The determinants of the Tunisian banking industry profitability: Panel
evidence, Economic Research Forum 10th Conference (Marrakech, Morocco).
Nickell, Stephen, 1981, Biases in Dynamic Models with Fixed Effects, Econometrica 49, 1417-1426.
Pasiouras, Fotios, Sailesh Tanna, and C. Zopounidis, 2009, Banking Regulations, Cost and Profit
Efficiency: Cross-Country Evidence, International Review of Financial Analysis - Forthcoming.
Radić, N., Fiordelisi, F., Girardone, C., (2011).Efficiency and Risk-taking in pre-crisis Investment
Banks.Forthcoming Journal of Financial Services Research.
Roodman, David, 2006, How to do Xtabond2: An Introduction to Difference and System GMM in
Stata, (Center for Global Development Working Paper No. 103).
Schumpeter, Joseph A., 1912, Theorie der Wirtschaftlichen Entwicklung (The Theory of Economic
Development), Leipzig: Dunker& Humblot, Translated by Redvers Opie, Cambridge, MA: Harvard
University Press (1934).

25
Stevenson, Rodney E., 1980, Likelihood Functions for Generalized Stochastic Frontier Estimation,
Journal of Econometrics 13, 57-66.
Vander Vennet, Rudi, 2002, Cost and Profit Efficiency of Financial Conglomerates and Universal
Banks in Europe, Journal of Money, Credit, and Banking 34, 254-282.
Windmeijer, Frank, 2005, A finite sample correction for the variance of linear efficient two-step
GMM estimators, Journal of Econometrics 126, 25-51.
WorldBank, 1989, World Development Report 1989, New York: Oxford University Press.
WorldBank, 2005, World Development Indicators 2005, Washington, DC : World Bank (2005).