university of nairobicivil.uonbi.ac.ke/sites/default/files/cae/engineering/civil/final... ·...
TRANSCRIPT

UNIVERSITY OF NAIROBI
INVESTIGATING THE EFFECTS OF THE REPLACEMENT
OF SAND WITH QUARRY DUST ON THE PROPERTIES OF
CONCRETE
By:
Maina Simon Karanja
F16/36072/2010
A Project submitted in partial fulfillment of the requirement for the
award of the degree of
BACHELORS OF SCIENCE IN CIVIL ENGINEERING
2015
i
Abstract
Sand collected from natural deposit is expensive due to unwanted cost of transportation from
sources. Large scale exploitation of natural sand creates environmental impact on society.
River sand is most commonly used fine aggregate in concrete but due to acute shortage in
many areas, availability, cost & environmental impact are the major concern. To overcome
from this crisis, partial/full replacement of sand with quarry dust can be an economic
alternative. In developing countries like Kenya, quarry dust has been rampantly used in
different construction purposes but replacement technology has emerged as an innovative
development to civil engineering material.
Design mix of class 25 grade concrete with replacement of 0%, 25%, 50%, 75%, and 100%
of quarry have been considered for laboratory analysis of Slump test, compaction factor
test, compressive strength, split tensile strength and flexural strength.

ii
Dedication
First, I dedicate this research work to Almighty God who has brought me this far.
Second, my dedication goes to my Lecturers, family members, fellow students and friends for
their support and guidance throughout this project.

iii
Acknowledgements
An undertaking of this magnitude cannot be successfully achieved by the unilateral efforts of one
individual. I would wish to express my sincere gratitude first and foremost to God for His divine
guidance throughout my life and my five years in campus, my supervisor Dr. (Eng.) Monica
Wokabi for her immense support, encouragement and guidance during practical and report
writing without whom this work could not have been realized, To my parents Mr. & Mrs. Maina
who gave me financial and moral support that has seen me through my degree course and finally
to the technicians in the concrete laboratory who went out of their way to assist me finish my
tests on schedule.
iv
Table of Contents Abstract ....................................................................................................................................... i
Dedication .................................................................................................................................. ii
Acknowledgements .................................................................................................................. iii
List of tables .............................................................................................................................. vi
List of plates ............................................................................................................................. vii
List of graphs ......................................................................................................................... viii
CHAPTER 1 INTRODUCTION ............................................................................................. 1
1.1 Background ...................................................................................................................... 1
1.2 PROBLEM STATEMENT .............................................................................................. 2
1.3 PURPOSE OF THE STUDY ........................................................................................... 2
1.3.1 OVERALL OBJECTIVE .............................................................................................. 2
1.3.2 SPECIFIC OBJECTIVES.......................................................................................... 2
1.4 RESEARCH HYPOTHESIS ........................................................................................... 2
1.5 SIGNIFICACE OF THE STUDY .................................................................................... 3
1.6 DELIMITATIONS OF THE STUDY ............................................................................. 3
1.7 LIMITATION OF THE STUDY ..................................................................................... 3
CHAPTER 2 LITERATURE REVIEW .................................................................................... 4
2.1OVERVIEW...................................................................................................................... 4
2.2 CLASSIFICATION OF AGGREGATE .......................................................................... 5
2.3FINE AGGREGATE......................................................................................................... 6
2.3.1 CHARACTERISTICS ............................................................................................... 6
2.3.2 UTILIZATION APPLICATIONS .......................................................................... 10
2.4 RIVER SAND ................................................................................................................ 11
2.4.1 PRODUCTION ....................................................................................................... 11
2.4.2 PROPERTIES OF RIVER SAND ........................................................................... 11
2.5 QUARRY DUST............................................................................................................ 12
2.5.1 PRODUCTION ........................................................................................................... 12
2.5.2 PROPERTIES OF QUARRY DUST ...................................................................... 13
2.5.3 UTILIZATION APPLICATION ............................................................................. 14
2.5.4 EFFECTS OF QUARRY DUST ON ENVIRONMENT ........................................ 15
2.5.5 OBSTACLES TO UTILIZATION .......................................................................... 15
2.6 DESIGN OF CONCRETE MIXES................................................................................ 15

v
2.6.1 PRINCIPLES OF DESIGN ..................................................................................... 16
2.6.2 STAGES IN MIX DESIGN .................................................................................... 17
2.7 BATCHING OF CONCRETE MATERIALS ............................................................... 18
2.8 PROPERTIES OF CONCRETE. ................................................................................... 18
2.8.1 PROPERTIES OF FRESH CONCRETE ................................................................ 18
2.8.3 PROPERTIES OF CONCRETE. ............................................................................ 21
2.9 STANDARDS FOR FINE AGGREGATE .................................................................... 24
CHAPTER 3 RESEARCH METHODOLOGY ...................................................................... 26
3.1 SAMPLE COLLECTION, PREPARATION AND ASSESSMENT ............................ 26
Grading ............................................................................................................................. 27
3.2 SLUMP TEST ................................................................................................................ 28
3.3 COMPACTING FACTOR TEST .................................................................................. 28
3.4 DETERMINATION OF COMPRESSIVE STRENGTH .............................................. 30
3.5 INDIRECT TENSILE TEST ACCORDING TO BS1881-117:1983 ............................ 31
3.6 FLEXURAL STRENGTH TEST TO BS 1881:118 – 1983 .......................................... 33
3.7 Preparation of hollow fencing post ................................................................................ 35
CHAPTER 4.0 RESULTS, DATA ANALYSIS AND DISCUSSION ................................... 37
4.1 Sieve analysis ................................................................................................................. 37
4.2 Workability..................................................................................................................... 40
4.3 Compressive strength ..................................................................................................... 42
4.4 Tensile strength .............................................................................................................. 44
4.5 Flexural strength ............................................................................................................. 47
4.6 Cost Benefit Analysis ..................................................................................................... 48
6. Conclusion and recommendation ......................................................................................... 51
6.1 Conclusion ...................................................................................................................... 51
6.2 Recommendation ............................................................................................................ 52
REFERENCES ........................................................................................................................ 53
Appendix .................................................................................................................................. 54
THE MIX DESIGN PROCESS ............................................................................................... 54

vi
List of tables Table 1: slump, compaction and workability relationship ....................................................... 16
Table 2: Slump test for all ratios .............................................................................................. 28
Table 3: Compaction factor of different ratios ........................................................................ 29
Table 4: Summary of Average cube Crushing Strengths at 7 days ......................................... 31
Table 5: Summary of Average cube Crushing Strengths at 28 days ....................................... 31
Table 6: Seven days tensile Strengths ...................................................................................... 32
Table 7: Twenty eight tensile Strengths................................................................................... 33
Table 8: Flexural test results .................................................................................................... 35
Table 9: sieve analysis of coarse aggregate ............................................................................. 37
Table 10: sieve analysis of river sand ...................................................................................... 38
Table 11: sieve analysis of quarry dust .................................................................................... 39
Table 12: batching ratio 1:1.5:3(cement: fine aggregate: coarse aggregate) ........................... 40
Table 13: compaction factor of different ratios ....................................................................... 40
Table 14: slump test for the all ratios....................................................................................... 41
Table 15: Summary of Average cube Crushing Strengths at 7 days ....................................... 42
Table 16: Summary of Average cube Crushing Strengths at 28 days ..................................... 43
Table 17: batching ratio 1:1.5:3(cement: fine aggregate: coarse aggregate) ........................... 44
Table 18: seven days’ tensile Strengths ................................................................................... 44
Table 19: twenty eight day tensile strength ............................................................................. 45
Table 20: 5 twenty eight day flexural strength of beams ......................................................... 47
Table 21: mass of different ratios ............................................................................................ 48
Table 22: Costs of different replacement ................................................................................. 49

vii
List of plates Plate 1: Arrangement of different size of sieves ........................................................................ 8
Plate 2: particle size distribution graph ........................................................................................
Plate 3: shape and texture of aggregate (2) .............................................................................. 10
Plate 4: quarry dust production (7) .......................................................................................... 13
Plate 5: Typical quarry dust ..................................................................................................... 14
Plate 6: Typical quarry dust ..................................................................................................... 16
Plate 7: slump test .................................................................................................................... 19
Plate 8: compaction factor apparatus ....................................................................................... 20
Plate 9: casted cubes ready to be remolded and cured ............................................................. 21
Plate 10: cylinder in compression machine ready to be crushed ............................................. 22
Plate 11: conducting of flexural test ........................................................................................ 23
Plate 12: Arrangement of loading of test specimen (centre-point loading) ............................. 34
Plate 13: 100% sand replacement hollow fencing post ........................................................... 36

viii
List of graphs Graph 1: sieve analysis of coarse aggregate ............................................................................ 37
Graph 2: river sand sieve analysis ........................................................................................... 38
Graph 3: quarry dust sieve analysis ......................................................................................... 39
Graph 4: seven days compressive strength .............................................................................. 42
Graph 5: twenty eight days compressive strength ................................................................... 43
Graph 6: seven days tensile strength ........................................................................................ 45
Graph 7: twenty eight day tensile strength .............................................................................. 46
Graph 8:twenty eight day flexural strength ............................................................................. 47
Graph 9: Graph of total prices against the quarry .................................................................... 49

1
CHAPTER 1 INTRODUCTION
1.1 Background
Concrete is the most widely used composite material today. The constituents of concrete are
coarse aggregate, fine aggregate, binding material and water. Rapid increase in construction
activities leads to acute shortage of conventional construction materials. The function of the
fine aggregate is to assist in producing workability and uniformity in the mixture. It is
conventional that sand is being used as fine aggregate in concrete. This is due to the ease of
acquisition and its well-graded nature and that all sizes of grains are well distributed in a
given sample. The application of river sand is mainly for all kinds of civil engineering
construction.
The annual sand demand for the construction industry in Kenya and other developing
countries is high and all is obtained from major rivers. (1)
The excessive excavation of river sand is becoming a serious environmental problem.
Erosion and failure of river banks, lowering of river beds and damage of structures situated
closer to the rivers, saline water intrusion into the land and coastal erosion are the major
adverse effects due to intensive river sand mining. The demand for natural sand is also quite
high in developing countries owing to rapid infrastructural growth which results to scarcity of
natural sand. Therefore, construction industries of developing countries are in stress to
identify alternative materials to replace the demand for natural sand.
In the future, the entire construction industry may come to a halt if there are no alternative
sources of sand. Therefore, it is necessary to explore the possibilities for alternative sources
to minimize river sand extraction.
At present, the identified alternative sources are fibre glass as partial replacement, wood ash,
saw dust, recycled concrete and fly ash. They are not effective because of their quantity and
they also have low workability. Quarry dust has been proposed as an alternative to river sand.
Quarries are operating in many parts of Kenya to supply coarse aggregates for various types
of construction, especially for concrete, road construction and foundations of buildings. The
advantages of utilization of byproducts or aggregates obtained as waste materials are
pronounced in the aspects of reduction in environmental load & waste management cost,
reduction of production cost as well as augmenting the quality of concrete. (2)

2
1.2 PROBLEM STATEMENT
The quarry dust, the by-product, was never used before instead of river sand earlier because
of the different quality. Various rock types produce different types or different qualities of
quarry dusts due to the inclusion of their fresh minerals. Also, it has no uniformity and
similarity to river sand. Although now it is used for road work the industry people are afraid
to use it for concrete or such strong constructions due to the higher percentages of minerals
other than quartz. Therefore, detailed studies on quarry dusts are needed to find out their
suitability.
The research will focus on the use of quarry dust as replacement for aggregates in concrete. It
will investigate the compression strength properties of concrete containing quarry dust and
the application of quarry dust concrete in construction of fencing posts. (2)
1.3 PURPOSE OF THE STUDY
1.3.1 OVERALL OBJECTIVE
To investigate the possibility of either partial or total replacement of fine aggregates with
quarry dust in the manufacture of concrete blocks and hollow fencing posts.
1.3.2 SPECIFIC OBJECTIVES
i) To investigate the compressive, tensile and flexural strength of concrete made
using quarry dust as fine aggregate.
ii) To investigate changes in strength of concrete as river sand is replaced with
quarry dust in different percentages.
iii) To investigate the effect of quarry dust on the workability of concrete in different
proportions.
iv) To test practical application of quarry dust concrete in construction of a hollow
fencing posts
v) To assess the cost implications of using quarry dust in concrete manufacture as
compared to river sand.
1.4 RESEARCH HYPOTHESIS
The compression strength of concrete depend on ratio of mixtures (cement, fine aggregate
and course aggregate) and water-cement ratio, quarry dust has small particles than river sand
so requires less water-cement ratio hence concrete compression strength is expected to
improve when river sand is replaced with quarry dust.

3
There is direct relationship between properties of river sand (density, void ratio and particle
size) and properties of quarry dust hence one cannot only use quarry dust as a partial
replacement of river sand but also as full replacement of river sand.
1.5 SIGNIFICACE OF THE STUDY
This research will help determine strength of concrete produced with quarry dust hence it will
be easier for engineers to specify in which projects and in what proportions quarry dust will
be used.
The research will increase development in areas with little or no access to river sand for
quarry dust will be used in replacement during constructions.
There is need for this research since quarry dust has recently gained good attention to be used
as an effective filler material instead of sand. Some construction companies tend to use it
without the knowledge of its strength which results to risk of failure of structures.
1.6 DELIMITATIONS OF THE STUDY
Apart from preparation of cubes, samples of hollow fencing posts are prepared to examine
the workability of the research. The post cross section area is a cube 120 mm length by 120
mm width, with a hollow 55 mm diameter and a height of 2000 mm.
1.7 LIMITATION OF THE STUDY
Time factor is the major limitation of this project because testing for the durability of hollow
post required much time in order for one to come up with conclusive reports.
Quarry dust is obtained from rocks with different chemical properties hence there may be no
specific compression strength for concrete produced by different quarry dust.

4
CHAPTER 2 LITERATURE REVIEW
2.1OVERVIEW
Aggregates are widely used as a base material for foundations and as an ingredient in
Portland cement concrete and asphalt concrete. While the geological classification of
aggregates gives insight into the properties of the material, the suitability of a specific source
of aggregates for a particular application requires testing and evaluation.
Civil engineers select aggregates for their ability to meet specific project requirements, rather
than their geologic history. The physical and chemical properties of the rocks determine the
acceptability of an aggregate source for a construction project. These characteristics vary
within a quarry or gravel pit, making it necessary to sample and test the materials continually
as the aggregates are being produced.
Rapid increase in construction activities leads to acute shortage of aggregates especially fine
aggregate resulting to research of finding other better materials to be used as replacements.
Some of the projects are;
1. Partial replacement of river sand with fly ash.
The conclusion of experiment was that Fly ash is a byproduct that can be used in concrete to
obtain durability, cost, and environmental benefits. Increase of amount of fly ash reduces
workability of the concrete. (3)
2. Properties of concrete containing saw dust as fine aggregate
There was reduction in strength of concrete with sawdust as fine aggregate due to its higher
rate of water absorption because the higher the water contents in concrete, the lower the
strength of the concrete. Optimum replacement of sawdust with sand was found to be 25%
beyond the limit, which did not meet the code requirement for strength BS 1881 part4 (1970).
(3)
3. Use of wood ash as fine aggregate in production of concrete
The conclusion was wood ash is suitable for use in concrete making. The water requirement
increases as the ash content increases. Compressive and tensile strength of concrete mix
increases with age of curing and decreases as the ash content increases. The Flexural strength
of the beam of the concrete for all mix increases with age of curing and decreases as the ash
content increases. Ash is available in insignificant quantities as a waste and can be utilized
for making concrete. (3)
4. Utilization of Industrial Waste Slag as fine aggregate in Concrete Applications
The results indicated that compressive strength was higher by 4 to 6% in mixes at all ages for
the re- placement levels in-between 30% to 50%. Strength reduction was observed at 100%
replacement of fine aggregate with granular slag by 7% to 10% which was attributed to the
coarser particles that affected cohesive properties of concrete. (3)

5
5. Use of rice husks as fine aggregate in production of concrete
From the investigations the following conclusions were be made: There exists a high
potential for the use of rice husk as fine aggregate in the production of lightly reinforced
concrete. Weight-Batched Rice Husk Concrete and Volume-Batched Rice Husk Concrete
show similar trends in the variation of bulk density, workability and compressive strength.
Loss of bulk density, workability and compressive strength is higher for Weight-Batched
Rice Husk Concrete than Volume-Batched Rice Husk Concrete. (3)
6. Use of crushed granite fine as replacement of river sand in concrete production
Based on the results of the experiment, conclusions were: The physical and chemical
properties of granite fines had satisfied the requirement of code provisions. The other strength
and durability test conducted shows that the granite fines is fit to be used in concrete mixes.
(3)
2.2 CLASSIFICATION OF AGGREGATE
Aggregates can be divided into several categories according to different criteria.
a) in accordance with size:
Coarse aggregate: Aggregates predominately retained on the No. 4 (4.75 mm) sieve. For mass
concrete, the maximum size can be as large as 150 mm.
Fine aggregate (sand): Aggregates passing No.4 (4.75 mm) sieve and predominately retained
on the No. 200 (75 μm) sieve.
b) In accordance with sources:
Natural aggregates: This kind of aggregate is taken from natural deposits without changing
their nature during the process of production such as crushing and grinding. Some examples
in this category are sand, crushed limestone, and gravel.
Manufactured (synthetic) aggregates: This is a kind of man-made materials produced as a
main product or an industrial by-product. Some examples are blast furnace slag, lightweight
aggregate (e.g. expanded perlite), and heavy weight aggregates (e.g. iron ore or crushed
steel).
c) In accordance with unit weight
Light weight aggregate: The unit weight of aggregate is less than 1120 kg/m3
. The
corresponding concrete has a bulk density less than 1800 kg/m3
. (Cinder, blast-furnace slag,
volcanic pumice).
Normal weight aggregate: The aggregate has unit weight of 1520-1680 kg/m3
. The concrete
made with this type of aggregate has a bulk density of 2300-2400 kg/m3
.
Heavy weight aggregate: The unit weight is greater than 2100 kg/m3
. The bulk density of the
corresponding concrete is greater than 3200 kg/m3
. A typical example is magnetite limonite,
a heavy iron ore. Heavy weight concrete is used in special structures such as radiation
shields. (4)

6
2.3FINE AGGREGATE
2.3.1 CHARACTERISTICS
Many properties of fine aggregate are derive from its parent rock:
1. Physical properties such as Porosity, absorption, surface moisture, Particle shape, Particle
surface texture and Permeability.
2. Mechanical properties such as relative density, strength, stiffness, hardness, permeability
and pore structure.
3. Chemical such as mineral composition, Alkali–aggregate reactivity and Sulphate
soundness.
Thus the origin of the parent rock is very important. Rocks themselves are comprised of
various minerals, defined as ‘naturally occurring inorganic substances of more or less definite
chemical composition and usually of a specific crystalline structure’. Rocks of the earth’s
crust are generally classified as igneous, sedimentary, or metamorphic, relating to their
origin. (5)
2.3.1.1 Moisture content
2.3.1.1.1 Moisture content in aggregate
The moisture condition of aggregates refers to the presence of water in the pores and on the
surface of aggregates. There are four different moisture conditions:
a) Oven Dry (OD): This condition is obtained by keeping aggregates at temperature of 1100
C
for a period of time long enough to reach a constant weight.
b) Air Dry (AD): This condition is obtained by keeping aggregates under room temperature
and humidity. Pores inside the aggregate are partly filled with water.
c) Saturated Surface Dry (SSD): In this situation the pores of the aggregate are fully filled
with water and the surface is dry. This condition can be obtained by
immersion in water for 24 hours following by drying of the surface
with wet cloth.
d) Wet (W): The pores of the aggregate are fully filled with water and the surface of
aggregate is covered with a film of water. Saturated Oven Dry
Concrete properties at both the fresh and hardened states are strongly affected by the water
content, it is very important to ensure that the right amount of water is added to the mix. The
moisture content under saturated surface dry condition is used as reference because that is an
equilibrium condition at which the fine aggregates will neither absorb water nor give up
water to the paste. Thus, if moisture content value for a batch of fine aggregates is positive,
there is surface moisture on the aggregates. If it is negative, it means that the pores in fine
aggregates are only partly filled with water. Since the fine aggregates may give out or absorb
water, the amount of water added to the mix need to be adjusted according to the moisture
content value.

7
2.3.1.1.2 Moister content in concrete
Water is added to the concrete during batching to allow hydration of the cement and provide
the workability required to place and finish the concrete. Some water will be lost through
bleeding and evaporation, and some will be consumed by the hydration process. A small
quantity of water will remain following hydration of the cement either in the minute spaces
(capillary pores) within the concrete, or within the hydration products themselves (gel pores).
For low water-cement ratios, all the water in the mix may be consumed during hydration,
thus avoiding the necessity for the concrete to dry prior to the application of finishes.
In order to determine the correct amount of water as part of the design process, the Portland
Cement Association (PCA) states the following: “Mixture proportioning refers to the process
of determining the quantities of concrete ingredients, using local materials, to achieve the
specified characteristics of the concrete. A properly proportioned concrete mix should
possess these qualities:
1. Acceptable workability of the freshly mixed concrete
2. Durability, strength, and uniform appearance of the hardened concrete
3. Economy”
Parameters of the concrete affected by the addition of water to a load of concrete in excess of
the design water/cement, the following performance characteristics will likely be negatively
affected:
•Compressive Strength
The compressive strength of a concrete mixture is reduced when additional water is added.
•Resistance to cycles of freezing and thawing
•Resistance to damage from Sulfates in soil and water
•Permeability – and its associated impact to strength and various durability characteristics
•Minimizing potential for corrosion of reinforcing steel
2.3.1.2 Density and specific gravity
Density (D): weight per unit volume (excluding the pores inside a single aggregate)
Bulk density: the volume includes the pores inside a single fine aggregate.
Specific gravity (SG): mass of a given substance divided by unit mass of an equal volume of
water (it is the density ratio of a substance to water). Depending on the definition of volume,
the specific gravity can be divided into absolute specific gravity (ASG) and bulk specific
gravity (BSG). In practice, the bulk specific gravity value is the realistic one to use since the
effective volume that fine aggregate occupies in concrete includes its internal pores. The bulk
specific gravity of most rocks is in the range of 2.5 to 2.8.
2.3.1.3 Size distribution
The particle size distribution of fine aggregates is called grading. Sand particles range in
diameter from 0.0625 mm (or 1⁄16 mm) to 2 mm. An individual particle in this range size is
termed a sand grain. Sand grains are between gravel (with particles ranging from 2 mm up to
64 mm) and silt (particles smaller than 0.0625 mm down to 0.004 mm). The size specification
between sand and gravel has remained constant for more than a century, but particle
diameters as small as 0.02 mm was considered sand under the Albert Atterberg standard in

8
use during the early 20th century. A 1953 engineering standard published by the American
Association of State Highway and Transportation Officials set the minimum sand size at
0.074 mm. Sand feels gritty when rubbed between the fingers (silt, by comparison, feels like
flour).
To determine distribution of fine aggregate sieve analysis is done. Sieves, square mesh with
woven wire (brass or stainless steel). A full set of sieves shall include the following:
NO.1O-2mm
No. 18-1 mm
No. 35 - 500 micron
No. 60 - 250 micron
No. 100 - 149 micron
No. 140 - 105 micron
No. 270 - 53 micron
Plate 1: Arrangement of different size of sieves
The grading determines the paste requirement for a workable concrete since the amount of
void in aggregate are filled with same amount of cement paste in a concrete mixture. To
obtain a grading for fine aggregate, sieve analysis has to be conducted.

9
There are five different kinds of size distributions, dense graded, gap-graded, uniformly
graded, well graded and open graded. Dense and well-graded fine aggregates are desirable for
making concrete, as the space between larger particles is effectively filled by smaller particles
to produce a well-packed structure. Gap-grading is a kind of grading which lacks one or more
intermediate size. Gap-graded fine aggregates can make good concrete when the required
workability is relatively low. For the uniform grading, only a few sizes dominate the bulk
material. The open graded contains too much small particles and easy to be disturbed by a
hole.
2.3.1.4 Fineness modulus
To characterize the overall coarseness or fineness of fine aggregate, a concept of fineness
modulus is developed. To calculate the fineness modulus, the sum of the cumulative
percentages retained on a definitely specified set of sieves need to be determined, and the
result is then divided by 100.
The Fineness Modulus for fine aggregates should lie between 2.3 and 3.1. A small number
indicates a fine grading; whereas a large number indicates a coarse material. Fineness
modulus can be used to check the constancy of grading when relatively small change is
expected; but it should not be used to compare the grading of fine aggregates from two
different sources.
2.3.1.5 Shape and texture of aggregate
Fine aggregate shape and surface texture influence the properties of freshly mixed concrete
more than the properties of hardened concrete. Rough-textured, angular, and elongated
particles require more water to produce workable concrete than smooth, rounded compact
fine aggregate. Consequently, the cement content must also be increased to maintain the
Figure 1: particle size distribution graph Plate 2: particle size distribution graph

10
water-cement ratio. However, with rough fine aggregates, there is better mechanical bond in
the hardened concrete, so strength is higher (if concrete with the same w/c ratio is compared).
Hence, when smooth fine aggregates are replaced with rough fine aggregates, concrete of
similar flow properties and strength can be produced by adding a little bit more water.
Plate 3: shape and texture of aggregate (2)
2.3.2 UTILIZATION APPLICATIONS
Fine aggregates are used in various industries in different ways
I. underlying material for foundations
II. construction of bituminous roads
III. water treatment plants
IV. production of concrete
V. dam constructions
VI. Constructing aggregate base before placing the hot-mix asphalt
VII. Production of motor
VIII. Base of road
IX. Railway works
X. Production of curb or brick
XI. Precast concrete production
XII. Molds used in foundries for casting metal are made of fine aggregate
XIII. It is glued to paper to make sandpaper
XIV. Wall art
XV. Paint texture
XVI. Beach nourishment: Governments move sand to beaches where tides, storms or
deliberate changes to the shoreline erode the original sand.
XVII. Landscaping: Sand makes small hills and slopes (for example, in golf courses).

11
2.4 RIVER SAND
2.4.1 PRODUCTION
River sand is derived from rocks of the earth’s crust. Their properties are governed first by
the chemical and physical properties of the parent rocks. Rocks undergo various processes of
alteration, including natural geothermal and/or weathering processes which occur over long
periods of geological time. Such processes may produce granular materials in the form of
natural gravels and sands that can be used in concrete with a minimum of further processing.
On the other hand, production of sand may require processes encompassing human related
activities in the form of rock breaking, crushing, and so on. These processes, which convert
the rock in a very short period of time into useful engineering materials, must be linked to the
nature of the parent rock and the required properties of the sand, in order to produce
acceptable materials.
Natural sand can be sourced from pits, river banks and beds, the seabed, gravelly or sandy
terraces, beaches and dunes, or other deposits that provide granular materials that can be
processed with minimal extra effort or cost. Sand and gravel, which are unconsolidated
sedimentary materials, are important sources of natural sand. The occurrence of high quality
natural sands and gravels within economic distance of major urban areas may be critical for
viable concrete construction in those areas. (1)
2.4.2 PROPERTIES OF RIVER SAND
Material obtained from river sources will depend on the rocks present in the river’s catchment
area, and how readily they break down and weather to be transported in the river. During
river transport, rock fragments will undergo further weathering, be slowly reduced in size,
and be shaped by processes of attrition. Consequently, most river aggregates are reasonably
well shaped, rounded, and smooth.
A feature of many rivers is erratic flow, and consequently different particle sizes tend to be
transported and deposited during different regimes of flow. This can lead to marked
stratification, making it necessary to blend or mix the materials to obtain consistency and
uniformity and improve the grading. On the other hand, rivers with consistent flow will sort
and deposit the material, with rapid velocities giving a deficiency of fine material and vice
versa. Thus it may be necessary to blend the materials with other sources to extend the
grading envelope. River aggregates will generally have lower water requirements in concrete
due to their superior shape and surface texture, but the water requirement may be increased
by poor grading and absorptive fines in some cases.
Beach deposits
Beach materials fall within the influence of waves and tidal action. Being transported, they
generally have reasonably smooth textures and good particle shapes, although in the larger
sizes above 5–10 mm, particles tend to be discoid rather than spherical. The major deficiency
of beach sands is their poor grading, resulting from the sorting action of waves. Frequently,
only one or two particle sizes are present, with shortage or absence of fine material.
Consequently these materials, particularly sands, need to be blended with other aggregates to
improve grading and provide adequate fines for cohesiveness of the concrete mix.

12
Beach sands are composed mainly of quartz grains, but varying amounts of shell fragments
may also be present. This seldom presents a problem since these fragments are normally
sound and non-fragile. Higher shell contents (in excess of say 30 per cent) may lead to
increased mix-water if the shell fragments are poorly shaped or partly hollow.
Beach sands may also contain salts, but if they are washed so that the chloride content is no
greater than 0.01 per cent by mass, there should be no problem with corrosion of steel
embedded in concrete made with the sand. (6)
2.5 QUARRY DUST
2.5.1 PRODUCTION
Quarry dust is produced from the full range of quarrying activities including:
Extraction - (overburden removal, drilling and blasting, loading and hauling).
Rock preparation- (such as pre-screening and primary crushing and screening).
Further processing- (secondary, screening and treatment).
Quarry dust comprises material less than (about) 6 mm generated from any of the above
activities. They may be used as specific products (for example, as fine aggregate below 4
mm) or within other aggregate products (for example, as part of the overall grading for a sub
base). Quarry dust (that is material less than 6 mm) are an essential part of many aggregate
products and are intentionally produced by quarrying activities in order to provide the
required product grindings. The amount of dust produced during blasting is estimated to be as
high as 20% (The University of Leeds, 2007c).
There are certain advantages of crushed sands manufactured under modern controlled
conditions that may not always be appreciated:
(a) Modern crushing techniques can produce particle shapes equivalent or even superior to pit
sources.
(b) Controlled conditions can produce consistently uniform grading that may not be the case
with natural deposits where grading vary depending on the stratum of deposit being exploited
at any given time.
(c) Crusher sands are less likely to be contaminated with clay minerals and organic
substances than are natural materials. For this reason, higher fines contents for crusher sands
are often allowed in specifications, although care should be exercised when the source is
certain shale or basic igneous rocks which may contain undesirable clays.

13
Plate 4: quarry dust production (7)
2.5.2 PROPERTIES OF QUARRY DUST
Different quarries, or activities within the same quarry, may generate a range of quarry dust
in relation to their particle size and composition. For instance, dusts produced from primary
screening may have higher or lower clay content than those produced through tertiary
crushing and screening. Quarry dust is composed of the same mineral substances as the soil
and solid rock from which they are derived, even though changes to their physical and
chemical characteristics may have occurred. Quarry dust by their nature, are usually inert or
non-hazardous. Disaggregation, mixing and moving to different locations, exposure to
atmospheric conditions and to surface or groundwater, as well as segregation and the increase
of surface area due to particle size reduction, may cause physical and chemical
transformations with detrimental effects to the environment (BGS, 2003).
Quarry dust is considered more a consistent materials in relation to their composition and
particle size, also over time (temporal variability), they are commonly inert or non-hazardous
which means that their impact to the environment and human health is very low, and they
could provide some degree of security to the end user in terms of stable material supply.
Commonly, the decision making criteria upon which the suitability of quarry dust is
determined, are based on technical specifications and standards or on characterization
procedures developed by end users, such as construction product manufacturers. Therefore, it
is end users that define whether quarry dusts comprise a valuable material.

14
Parameters such as rock type, extraction technique and processing route, affect the generation
of quarry dust as well as their end properties, (for example, composition, particle size and
shape).
Plate 5: Typical quarry dust
2.5.3 UTILIZATION APPLICATION
Various utilization prospects exist for quarry fines, which can broadly be classified into
unbound and bound applications. Both categories of end use may require some degree of
processing of the quarry fines to be undertaken in order to comply with technical
specifications. End applications may be of high or low value, or may require a small or a
large volume of quarry fines.
These uses include:

15
2.5.4 EFFECTS OF QUARRY DUST ON ENVIRONMENT
Environmental protection and social responsibility is of vital importance to the quarrying
sector to reduce any adverse consequences (for example, in health and safety) and costs
associated with the production of quarry dust (for example, storage, dealing with arising
transport, and handling).
The generation of quarry fines may cause adverse impacts on the environment (such as the
local air, land, water, flora and fauna) and human health, and the mitigation of potential
impacts is mandatory. Commonly, various dust control practices (conventional or alternative)
are employed to minimize the impact of dust generated by quarry activities (Petavratzi et al,
2005; Petavratzi, 2006; EIPPCB, 2006). Health issues and the protection of fauna and flora
are addressed through the management and protection of air quality.
The utilization of quarry dust is seen as a way to minimize the accumulation of unwanted
material and at the same time to maximize resource use and efficiency. (8)
2.5.5 OBSTACLES TO UTILIZATION
Quarry dusts can be suitable materials for a variety of end applications; however, currently
their utilization is not widespread to the level it would have been expected mainly due to
reasons related to the geographical position of quarries.
Very often quarries operate in remote location from potential end users and the cost of
material to them includes high transport costs, which discourages their use. There are
occasions where producers of aggregates are not aware of potential utilization routes for their
quarry fines in the local area, and these materials remain unused.
Another major obstacle to utilization is the limited knowledge of exact quantities of quarry
fines. The figures on quantities of fines produced, marketed and stockpiled should be
calculated in order to properly evaluate the quantities of quarry fines currently available, and
information that present the geographical distribution of quarry fines, should be compiled to
enable the identification of potential end markets.
Some of the barriers to utilization are related to the location of quarry fines, the limited
awareness of potential markets by aggregate producers, the limited knowledge about quarry
dusts arising and their characteristics, and the absence of fully developed fit-for-use
specifications for a wide range of end products.
Often quarry fines require some degree of processing before they can be used, which may
increase their cost and at the same time requires suitable infrastructure and equipment to
become readily available. (9)
2.6 DESIGN OF CONCRETE MIXES
This is the process of selecting the correct proportions of cement, fine and coarse aggregate,
water and sometimes admixtures to produce concrete having specified and desirable
properties i.e. workability, compressive strength, density and durability requirements by
means of specifying the minimum or maximum water/cement ratio.

16
2.6.1 PRINCIPLES OF DESIGN
Strength Margin
Due to variability of concrete strengths, the mix must be designed to have higher mean
strengths than the characteristic strength. The difference between the two is the Margin. The
margin is based on the variability of concrete strengths from previous production data
expressed as a standard deviation.
Workability
Two alternative methods were used to determine workability; Slump test which is more
appropriate for higher workability mixes and the compacting factor test which is particularly
appropriate for mixes which are applicable to mixes compacted by vibration.
Plate 6: Typical quarry dust
Table 1: slump, compaction and workability relationship
Degree of
workability
Slump
(mm)
Compaction
factor
Use for which concrete is suitable
Very low 0 – 25 0.78 Very dry mixes. eg road making
Low 25 – 50 0.85 Low workability mixes. E.g. foundation with
light reinforcement
Medium 50 – 100 0.92 Medium workability mixes.eg in normal
reinforcement manually compacted
High 100 – 175 0.95 High workability concrete. For section with
congested reinforcement, normally not suitable
for vibration
Free – water
The total water in a concrete mix consists of water absorbed by the aggregate to bring it to
saturated surface – dry condition and the free – water available for hydration of cement and
for the workability of the fresh concrete. The workability of fresh concrete depends on a large
extent on its free – water content. In practice, aggregates are often wet and they contain both
17
absorbed water and free surface water so that the water added to the mixer is less than the
free – water content. The strength of concrete is better related to the free – water/cement ratio
since on this basis the strength of concrete does not depend on the absorption characteristics
of the aggregates.
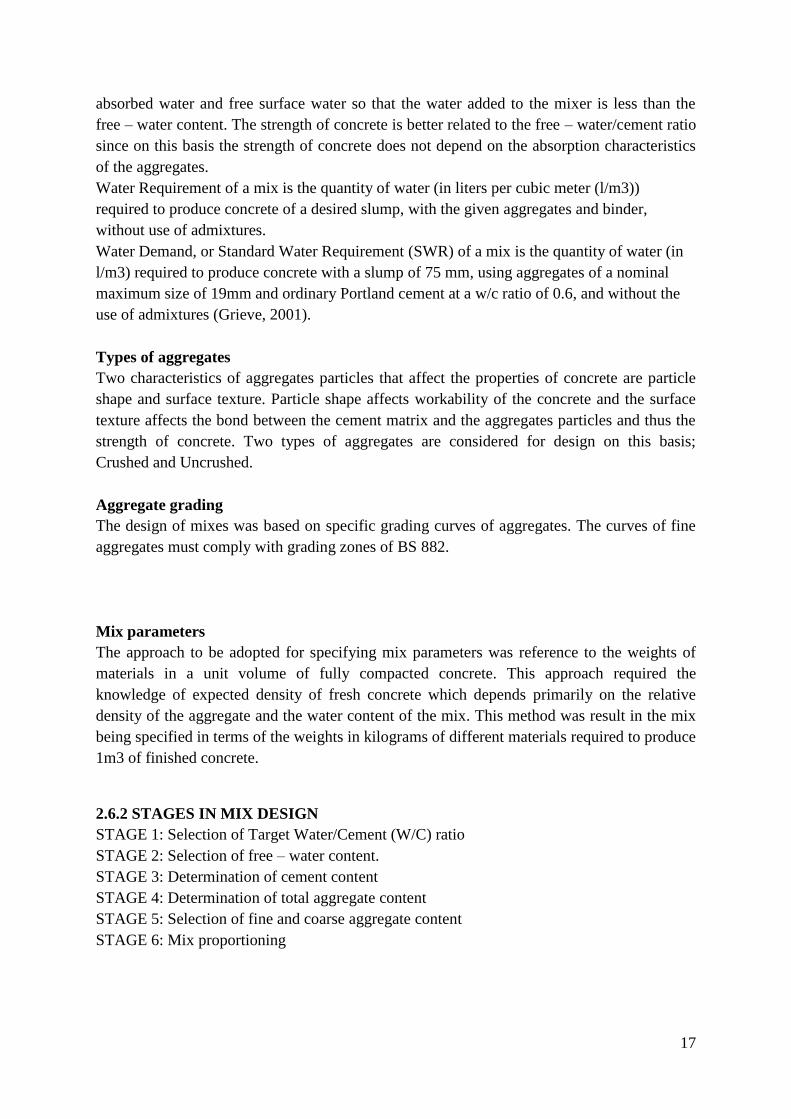
Water Requirement of a mix is the quantity of water (in liters per cubic meter (l/m3))
required to produce concrete of a desired slump, with the given aggregates and binder,
without use of admixtures.
Water Demand, or Standard Water Requirement (SWR) of a mix is the quantity of water (in
l/m3) required to produce concrete with a slump of 75 mm, using aggregates of a nominal
maximum size of 19mm and ordinary Portland cement at a w/c ratio of 0.6, and without the
use of admixtures (Grieve, 2001).
Types of aggregates
Two characteristics of aggregates particles that affect the properties of concrete are particle
shape and surface texture. Particle shape affects workability of the concrete and the surface
texture affects the bond between the cement matrix and the aggregates particles and thus the
strength of concrete. Two types of aggregates are considered for design on this basis;
Crushed and Uncrushed.
Aggregate grading
The design of mixes was based on specific grading curves of aggregates. The curves of fine
aggregates must comply with grading zones of BS 882.
Mix parameters
The approach to be adopted for specifying mix parameters was reference to the weights of
materials in a unit volume of fully compacted concrete. This approach required the
knowledge of expected density of fresh concrete which depends primarily on the relative
density of the aggregate and the water content of the mix. This method was result in the mix
being specified in terms of the weights in kilograms of different materials required to produce
1m3 of finished concrete.
2.6.2 STAGES IN MIX DESIGN
STAGE 1: Selection of Target Water/Cement (W/C) ratio
STAGE 2: Selection of free – water content.
STAGE 3: Determination of cement content
STAGE 4: Determination of total aggregate content
STAGE 5: Selection of fine and coarse aggregate content
STAGE 6: Mix proportioning

18
2.7 BATCHING OF CONCRETE MATERIALS
Following the mix design process, concrete materials (Cement, Fine and Coarse Aggregates)
should be prepared early enough before the concrete works begins. This allows the smooth
running of the project. Batching of materials was done by weight. The advantage of weight
method is that bulking of aggregates (especially fine aggregates) does not affect the
proportioning of materials by weight unlike batching by volume method. Bulking of sand
results in a smaller weight of sand occupying a fixed volume of the measuring container thus
the resulting mix becomes deficient in sand and appears stony and the concrete may be prone
to segregation and honeycombing. Concrete yield may be reduced.
The batch weights of aggregates determined in the mix design process are based on saturated
surface – dry conditions. When working with dry aggregates, the following options may be
adopted to achieve saturated surface – dry conditions;
1. The batch weights of fine and coarse dry aggregates required for the trial mix were
calculated by multiplying the batch weights derived from mix design by 100/100+𝐴 ,where A
is the percentage by weight of the water needed to bring the aggregate to the saturated surface
– dry condition.
2. The dry aggregates are brought to a saturated surface – dry condition before mixing
process by addition of the required amount of water for absorption by the aggregate
according to BS 1881 – 125:1983.
3. Increasing the weight of mixing water to allow for the absorption of some mixing water by
the dry aggregate during mixing process.
Batching of concrete materials by weight may be expressed as follows;
Wt (C) + Wt (CA) + Wt (FA) + Wt (Air) = Wt (CC)
Where;
Wt (C) = Weight of cement.
Wt (CA) = Weight of coarse aggregate.
Wt (FA) = Weight of fine aggregate.
Wt (Air) = Weight of entrained air.
Wt (CC) = Weight of compacted concrete.
2.8 PROPERTIES OF CONCRETE.
2.8.1 PROPERTIES OF FRESH CONCRETE
2.8.1.1 Workability
Workability may be described as the consistence of a mix such that the concrete can be
transported, placed and finished sufficiently easily and without segregation. Workability may
also be specifically defined as the amount of useful work necessary to obtain full compaction
i.e. the work done to overcome the internal friction and the surface friction between the
individual particles in concrete and also between the concrete and the surface of the mould or
of the reinforcement.

19
The main factor affecting workability is the water content of the mix expressed in Kilograms
per cubic meter of concrete. If the water content and other mix proportions are fixed,
workability is governed by the maximum size of aggregate, shape and texture.
The free – water required to produce concrete of a specified slump depends upon the
characteristics of the aggregate. The grading of coarse aggregates, provided it complies with
the requirements of BS 882, has little effect on water requirement of a concrete mix. The
grading of fine aggregate has a considerable effect on the water requirement of the concrete.
Changing the grading of sand from a coarse one (e.g. 20% by weight passing the 600mm test
sieve) to a finer one (e.g. 90% by weight passing 600mm test sieve) can result in an increase
of water content of 25Kg/m3 in order to maintain the required workability of the concrete.
Such a change in water content would reduce considerably the compressive strength of the
concrete. The workability can be maintained by reducing the fines content.
2.8.1.2 SLUMP TEST
Slump test has been used extensively in site work to detect variations in the uniformity of mix
of given proportions. It is useful on the site as a check on the variations of materials being fed
to the mixer. An increase in slump may mean that the moisture content of aggregate has
increased or a change in grading of the aggregate, such as the deficiency of fine aggregate.
Too much or too low slump gives an immediate warning and enables the mixer operator to
remedy the situation.
The test is done according to BS 1881 – 102:1983 which describes the determination of
slump of cohesive concrete of medium to high workability. The slump test is sensitive to the
consistency of fresh concrete. The test is valid if it yields a true slump, this being a slump in
which the concrete remains substantially intact and symmetrical.
Plate 7: slump test

20
2.8.1.3 COMPACTING FACTOR TEST
This is the degree of compaction measured by the density ratio that is the ratio of density
actually achieved in the test to the density of the same concrete fully compacted.
The apparatus used consist of two hoppers, each in the shape of a frustum and one cylinder,
the three being above one another. The hoppers have hinged door at the bottom. All inside
surfaces are polished to reduce friction.
Compacting Factor =weight of partially compacted concrete ÷ weight of fully compacted
concrete
Plate 8: compaction factor apparatus

21
2.8.3 PROPERTIES OF CONCRETE.
2.8.2.1 COMPRESSIVE STRENGTH
Out of many test applied to the concrete, this is the utmost important which gives an idea
about all the characteristics of concrete. By this single test one can judge that whether
Concreting has been done properly or not. For cube test two types of specimens either cubes
of 15 cm X 15 cm X 15 cm or 10cm X 10 cm x 10 cm depending upon the size of aggregate
are used. For most of the works cubical moulds of size 15 cm x 15cm x 15 cm are commonly
used.
This concrete is poured in the mould and tempered properly so as not to have any voids. After
24 hours these moulds are removed and test specimens are put in water for curing. The top
surface of these specimens should be made even and smooth. This is done by putting cement
paste and spreading smoothly on whole area of specimen.
Plate 9: casted cubes ready to be remolded and cured
These specimens are tested by compression testing machine after 7 days curing or 28 days
curing. Load should be applied gradually at the rate of 140 kg/cm2 per minute till the
Specimen fails. Load at the failure divided by area of specimen gives the compressive
strength of concrete.

22
2.8.2.2 TENSILE TEST
Tensile strength is an important property of concrete because concrete structures are highly
vulnerable to tensile cracking due to various kinds of effects and applied loading itself.
However, tensile strength of concrete is very low in compared to its compressive strength.
Due to difficulty in applying uniaxial tension to a concrete specimen, the tensile strength of
the concrete is determined by indirect test methods: (1) Split Cylinder Test (2) Flexure Test.
It should be noted that both of these methods give the higher value of tensile strength than the
uniaxial tensile strength
2.8.2.2.1 Split-Cylinder Test
It is the standard test, to determine the tensile strength of concrete in an indirect way. A
standard test cylinder of concrete specimen (300 mm X 150mm diameter) is placed
horizontally between the loading surfaces of Compression Testing Machine.
The compression load is applied diametrically and uniformly along the length of cylinder
until the failure of the cylinder along the vertical diameter. To allow the uniform distribution
of this applied load and to reduce the magnitude of the high compressive stresses near the
points of application of this load, strips of plywood are placed between the specimen and
loading platens of the testing machine. Concrete cylinders split into two halves along this
vertical plane due to indirect tensile stress generated by Poisson’s effect.
Plate 10: cylinder in compression machine ready to be crushed

23
2.8.2.2.2 Flexure Test
After the Splitting tensile test another common test performed for determination of tensile
strength is the Flexure test.
The test could be performed in accordance with BS 1881: Part 118: 1983. A simple plain
concrete beam is loaded at one-third span points. Normal standard size of specimen is
150x150x750 mm. If the largest nominal size of the aggregate does not exceed 25mm, size of
150x150x500 mm may also be used. Span of the beam is three times its depth.
Plate 11: conducting of flexural test
The typical arrangement for the test is equal Loads are applied at the distance of one-third
from both of the beam supports. It induces equal reaction same as the loading at both of the
supports. Loading on beam is increased in such a manner that rate of increase in stress in the
bottom fibre lies within the range of 0.02 MPa & 0.10 MPa. The lower rate is for low
strength concrete and the higher rate is for high strength concrete.
From the loading configuration it is clear that at the middle one-third portion, in between two
loadings, the beam is subjected to pure bending. No shear force is induced within this portion.
It is this portion of beam where maximum pure bending moment of Pd/2 is induced
accompanied by zero shear force.
As loading increases, if fracture occurs within the middle one-third of the beam, the
maximum tensile stress reached called "modulus of rupture" fbt is computed from the
standard flexure formula.

24
2.9 STANDARDS FOR FINE AGGREGATE
GENERAL REQUIREMENTS
The fine aggregate shall consist of natural sand or, subject to approval, other inert materials
with similar characteristics, or combinations having hard, strong, durable particles.
Fine aggregate from different sources shall not be mixed or stored in the same pile nor used
alternately in the same class of construction or mix, without permission from the Engineer.
SPECIFIC REQUIREMENTS (2)
A. Deleterious Substances: The amount of deleterious substances shall not exceed the
following limits by dry weight:
Clay lumps........................................... 0.5%
Coal and lignite.................................... 0.3%
Shale and other materials having a specific gravity less than 1.95............. 1.0%
Other deleterious substances (such as alkali, mica, coated grains, soft and flaky
particles).............................. 1.0%
The maximum amount of all deleterious substances listed above shall not exceed 2.0 percent
by dry weight.
B. Soundness: When the fine aggregate is subjected to five cycles of the sodium sulfate
soundness test, the weighted loss shall not exceed ten percent by weight.
A satisfactory soundness record for deposits from which material has been used in concrete
for five years or more, may be considered as a substitute for performing the sodium sulfate
soundness test.
C. Organic Impurities: The fine aggregate shall be free from injurious amounts of organic
impurities. Aggregates subjected to the colorimetric test for organic impurities and producing
a color darker than the standard number 3 shall be rejected.
Should the aggregate show a darker color than samples originally approved for the work, it
shall not be used until tests have been made to determine whether the increased color is
indicative of an injurious amount of deleterious substances.
D. Alkali-Silica Reactivity (ASR) Requirements: When specified in the plans, the
following items shall apply.
Fine aggregates from sources that have not been tested shall be submitted to the Materials
and Surfacing Office for ASR testing 30 days prior to performing the concrete mix design.
ASR testing shall be performed in accordance with ASTM C1260, except that the gradation
of the material used for testing shall be as produced from the source
When a fine aggregate supplier changes locations within the pit, the fine aggregate from the
new location in the pit shall be resubmitted for testing.
When more than one source of fine aggregates is blended to meet the gradation
specifications, the expansion value of the blended sands will be used for determining
acceptability and type of cement required.
E. Grading: Fine aggregate shall be well graded from course to fine and shall conform to the
following grading requirements:
Passing 3/8 inch (9.50 mm) sieve............… 100%
Passing No. 4 (4.75 mm) sieve... .................. 95-100%

25
Passing No. 16 (1.18 mm) sieve.................... 45- 85%
Passing No. 50 (300 m) sieve....................... 10- 30%
Passing No. 100 (150 m) sieve...................... 2- 10%
F. Uniformity of Grading: The graduation requirements given above represent the extreme
limits which shall determine suitability for use from all sources of supply. The gradation from
any source shall be uniform and not subject to the extreme percentages of gradation specified
above. For the purpose of determining the degree of uniformity, a Fineness
Modulus (FM) shall be made upon representative samples from sources proposed for use.
Fine aggregate from any source shall maintain a fineness modulus within ±0.2 from the
design mix fineness modulus. If the fineness modulus falls outside this limit contact the
Concrete Engineer.
A new or adjusted design mix may be provided. The uniformity of grading requirements does
not apply to fine aggregate for Low slump Dense Concrete and Class M (I) concrete. (2)

26
CHAPTER 3 RESEARCH METHODOLOGY
The research methodology is aimed at giving the procedures of achieving objectives of the
project. The objectives and methods used to achieve them are as follows:
1. To investigate the compression and tensile strength of concrete made using quarry
dust as fine aggregate. Cubes and cylinders were prepared using 100% quarry dust as
fine aggregate. They were then crushed using compression machine and their results
compared with that of 100% river sand.
2. To investigate changes in strength of concrete as river sand is replaced with quarry
dust in different percentages. Several cubes and cylinders ware prepared using
different ratios of quarry dust and river sand as fine aggregate. They were crushed
and graphs drawled of the compression/tensile strengths on Y-axis and percentage
replacement on X-axis.
3. To observe the effect of quarry dust proportions on the workability of concrete. This
was done by conducting slump test and compaction factor of different ratios from
0% sand replacement to 100% sand replacement.
4. To test practical application of quarry dust concrete in construction of a hollow
fencing posts. Beams were prepared and crushed to determine the flexural strength
of concrete prepared with quarry dust as fine aggregate and results compared with
flexural strength of concrete prepared with river sand. A sample of hollow fencing
post was then prepared using 100% quarry dust as fine aggregate to show the
practical use of quarry dust.
5. To assess the cost implications of using quarry dust in concrete manufacture as
compared to river sand. Research was done on both the cost of quarry dust and river
sand. Production Cost of one meter cube of concrete was determined for different
percentage replacement of sand and results compared.
3.1 SAMPLE COLLECTION, PREPARATION AND ASSESSMENT
The cement, coarse and fine aggregates (sand & quarry dust) were obtained from the
Materials Laboratory in the Nairobi University. Coarse aggregate was crushed granitic stone.
Fine aggregate to be used was river-washed sand and quarry dust which was used to replace
river sand. Weight batching was done for different percentage replacement.

27
Grading
Objectives
i) To determine the particle size distribution of specified aggregates.
ii) To draw grading curves for the specified aggregates.
Apparatus
i) Balance accurate to ±0.5% of mass of test sample.
ii) Test sieves
iii) Tightly fitting pan and lid, for the sieves.
iv) Mechanism of shaking sieves.
v) Test data sheet for recording results.
vi) Brushes
Sieve sizes:
Coarse aggregates: 40mm, 30mm, 25.4mm, 20mm, 15mm, 10mm and 5mm.
Fine aggregates: 10mm, 4.75mm, 2.38mm, 1.2mm, 0.42mm, 0.3mm, 0.074mm and 0.15mm.
Procedure
1. Test sieves were arranged from top to bottom in order of decreasing aperture sizes
with pan and lid to form a sieving column.
2. The aggregate sample was then poured into the sieving column and thoroughly
shaken, manually.
3. The sieves were removed one by one starting with the largest aperture sizes (top
most), and each sieve shaken manually ensuring that no material is lost. All the
material which passed each sieve was returned into the column before continuing with
the operation with that sieve.
4. The retained material on the sieve with the largest aperture size was weighed and its
weight recorded with its corresponding sieve size.
5. The same operation was carried out for successive sieves in the column and their
weights recorded.
6. The screened material that remained in the pan was weighed and its weight recorded.
Calculations
1. Calculate the mass retained and passing on each sieve as a percentage of the original
dry mass.
2. Calculate the cumulative percentage of the original dry mass passing each sieve down
to the smallest aperture sieve.

28
3.2 SLUMP TEST
Objective
To determine slump of fresh concrete mix.
Apparatus
A standard mould (frustum of a cone) complying with BS 1881 – 102: 1983.
A standard flat base plate preferably steel.
A standard tamping rod.
Standard graduated steel rule from 0 to 300mm at 5mm intervals.
A scoop approximately 100mm wide.
Procedure
1) The inside surfaces of the mould was cleaned and oiled to prevent adherence of fresh
concrete on the surfaces.
2) The mould was placed on the base plate and firmly held.
3) The cone was then be filled with fresh concrete in three layer with each layer compacted
with 25 strokes of the tamping rod.
4) After filling the mould, the top surface was struck off by means of rolling action of the
tamping rod.
5) Immediately after filling, the cone was slowly and carefully lifted.
6) Immediately after removal of the mould the slump of the unsupported concrete was
measured and recorded.
Table 2: Slump test for all ratios
sand replacement (%) Slump (mm)
0
25
50
75
100
3.3 COMPACTING FACTOR TEST
Introduction
This is the degree of compaction measured by the density ratio that is the ratio of density
actually achieved in the test to the density of the same concrete fully compacted. The
apparatus used consist of two hoppers, each in the shape of a frustum and one cylinder, the
three being above one another. The hoppers have hinged door at the bottom. All inside
surfaces were polished to reduce friction.

29
Objective
To determine the workability of concrete mix by compacting factor method
Apparatus
Compacting factor apparatus
Weighing balance
Standard rod
A scoop approximately 100mm wide
A trowel or a float
Procedure
1. The inside surfaces of the hoppers and the cylinder were cleaned, dried and oiled to
reduce friction between the hopper surfaces and the concrete.
2. The upper hopper was then filled with concrete mix.
3. The door of the hopper was released so that the concrete fell on to the lower hopper.
4. The door of the lower hopper was released so that the concrete fell on to the cylinder.
Excess concrete was then cut by a trowel or a float. Concrete adhering to the cylinder
outside surfaces was removed.
5. The weight of the concrete in the cylinder was weighed. This gave the weight of the
partially compacted concrete.
6. Using the same cylinder, the concrete was re - filled in three layers, each layer
vibrated to achieve full compaction. The concrete was then weighed. This gave the
weight of fully compacted concrete.
Table 3: Compaction factor of different ratios
sand replacement (%) Partially
compacted (Kg)
Fully compacted (Kg) Compaction factor
0
25
50
75
100
Calculations
Compacting Factor =weight of partially compacted concrete ÷ weight of fully compacted
concrete.

30
3.4 DETERMINATION OF COMPRESSIVE STRENGTH
(Cube test to BS en 12390 – 2:2000)
Apparatus
i) platform balance
ii) Iron moulds, 150mm cubes
iii) Steel trowel
iv) Vibrator
v) Spade
vi) Mixing trough
Procedure
1. The inside of the moulds’ surfaces were first cleaned and oiled in order to prevent
development of bond between concrete and the mould. The moulds were then
assembled and bolts and nuts tightened to prevent leakage of cement paste.
2. Using the specified mixes the weights of the materials was determined.
3. The materials were mixed in the concrete mixer to a uniform consistency.
4. The specimens are cast in iron moulds, 100mm cubes, conforming to the
specifications of BS 1881 – 3:1970. A poker vibrator was used to ensure sufficient
compaction without causing segregation of concrete.
5. The top of the concrete was leveled off using the vibrator and smoothed off using a
steel trowel.
6. The specimens were then left in the moulds undisturbed for 24 hours before taking
them out of mould.
Curing of cubes
Curing may be defined as the procedures used for promoting the hydration of cement, and
consists of a control of temperature and of the moisture movement from and into the
concrete. The objective of curing was to keep concrete as nearly saturated as possible, until
the originally water – filled space in the fresh cement paste is filled to the desired extent by
the products of hydration of cement. The temperature during curing also controls the rate of
progress of the reactions of hydration and consequently affects the development of strength
of concrete. The cubes were placed in a curing pond/tank at a temperature of 20 ± 20C for the
specified period of time.
Before placing cubes into a curing tank they were marked with a water proof marker. Details
to be marked on the cubes are mainly; type of mix, date of casting, duration for curing and
crushing day.
Compressive Test
After curing the cubes for 7 and 28 days, they were removed and wiped to remove surface
moisture in readiness for compression test. The cubes was then be placed with the cast faces
in contact with the platens of the testing machine that was the position of the cube when
tested should be at right angles to that as cast. The load was applied at a constant rate of stress
of approximately equal to 15 N/mm2 to failure. The readings on the dial gauge was recorded
for each cube.

31
Table 4: Summary of Average cube Crushing Strengths at 7 days
sand
replacement (%)
Compressive Strengths (N/mm2) Average
Compressive
Strength (N/mm2) Sample 1 Sample 2 Sample 3
0
25
50
75
100
Table 5: Summary of Average cube Crushing Strengths at 28 days
sand replacement
(%)
Compressive Strengths (N/mm2) Average
Compressive
Strength (N/mm2) Sample 1 Sample 2 Sample 3
0
25
50
75
100
3.5 INDIRECT TENSILE TEST ACCORDING TO BS1881-117:1983
Apparatus
(i) Cylindrical moulds (150mm diameter by 300mm height)
(ii) Compression Testing Machine
(iii) Weighing machine
(iv) Mixing Trough
(v) Spade
(vi) Trowel
(vii) Vibrator

32
Procedure
The appropriate proportions of water, cement, sand, quarry dust and coarse aggregate
according to the calculated mix design ware used to come up with different replacement
mixes.
The mixes were then placed in the moulds using the trowel.
Compaction was carried out using a vibrator.
After filling the moulds the top of the moulds were leveled and finishing done.
The moulds were left in a moist atmosphere for 24 hours.
Curing of cylinder
After 24 hours the specimens were removed from the moulds and stored in a curing sink for 7
and 28 days. The objective of curing was to keep concrete as nearly saturated as possible,
until the originally water – filled space in the fresh cement paste was filled to the desired
extent by the products of hydration of cement. The temperature during curing also controls
the rate of progress of the reactions of hydration and consequently affects the development of
strength of concrete. Before placing the cylinders in water they were marked.
Tensile Test
The specimens were removed from the curing sink after 7 and 28 days and subjected to
indirect tensile testing using the compression testing machine.
From the maximum applied load at failure the indirect tensile strength was calculated as
follows
б= 2F/п*l*d
б is the indirect tensile strength in N/mm².
F is the maximum applied load in N.
l is the length of cylinder in mm.
d is diameter in mm.
Table 6: Seven days tensile Strengths
sand replacement
(%)
Cylinder Crushing Strengths (KN) Average tensile
Strengths
(N/mm2) Sample 1 Sample 2 Sample 3
0
25
50
75
100

33
Table 7: Twenty eight tensile Strengths
sand replacement
(%)
Cylinder Crushing Strengths (KN) Average tensile
Strengths
(N/mm2) Sample 1 Sample 2 Sample 3
0
25
50
75
100
3.6 FLEXURAL STRENGTH TEST TO BS 1881:118 – 1983
Flexural testing was used to determine the flexure or bending properties of a material.
Sometimes referred to as a transverse beam test, it involves placing a sample between two
knife-edge points and initiating a load at the midpoint of the sample. Maximum stress and
strain were calculated on the incremental load applied.
Casting beams
Plain concrete beams were cast in moulds. The beam was square of 100 mm. The overall
length of the specimen was 5d. The ratio of d to the maximum particle size of aggregate was
not less than three. Compaction was done using a poker vibrator. After compacting the top
layer it was then smoothened level using a plasterer’s float and the mould wiped clean to
remove adhering concrete on its outer surfaces. The specimens were then stored for 24 hours
in an undisturbed place and then cured for 28 days.
Loading beams
1. Beam specimens were removed from the curing tank and placed in the testing
machine. The specimens were centered with the longitudinal axis of the beam at right
angles to the rollers.
2. A load was applied at a constant rate through one roller at the midpoint of the span
until the specimen failed. The load was not applied until all loading and supporting
rollers are resting evenly against the test specimen. The load was applied without
shock and increases continuously, at the selected constant rate ±10 %, until no greater
load was sustained.

34
Loading of test specimen (centre-point loading)
Plate 12: Arrangement of loading of test specimen (centre-point loading)
Key
1 Loading roller (capable of rotation and of being inclined)
2 Supporting roller
3 Supporting roller (capable of rotation and of being inclined)
Expression of results
The flexural strength is given by the equation:
Where
fcf is the flexural strength, in megapascals (Newton’s per square millimeter);
F is the maximum load, in Newton’s;
l is the distance between the supporting rollers, in millimeters;
d1, d2 are the lateral dimensions of the specimen, in millimeters.

35
Table 8: Flexural test results
sand replacement (%) d1 d2 l F
0%
0%
0%
100%
100%
100%
3.7 Preparation of hollow fencing post
Apparatus
(i) Weighing machine
(ii) Mixing Trough
(iii) Spade
(iv) Trowel
(v) Vibrator
(vi) 55mm diameter plastic pipe
Casting of post
Plain concrete hollow post was cast in mould prepared at the timber laboratory. The post was
square of 120 mm with a circular hollow diameter 55mm made using plastic pipe. The overall
height of the post was 2000mm. Compaction was done using a poker vibrator. After
compacting the top layer it was then smoothened level using a plasterer’s float and the mould
wiped clean to remove adhering concrete on its outer surfaces. The post was stored for 24
hours in an undisturbed place and then cured for 28 days.

36
Plate 13: 100% sand replacement hollow fencing post

37
CHAPTER 4.0 RESULTS, DATA ANALYSIS AND
DISCUSSION
4.1 Sieve analysis
Weight of coarse aggregate used was 6453.5 gms
Table 9: sieve analysis of coarse aggregate
SEIVE
SIZE(mm)
WEIGHT
RETAINED
(gms)
WEIGHT PASSING
(gms)
%PASSING
38.1 0 6453.50 100
20 1426 5027.5 77.90
15 1152.5 3875.0 60.04
10 2064.5 1810.5 28.05
5 707 1103.5 17.10
2.36 118 985.5 15.27
<2.36 985.5 0 0
Graph 1: sieve analysis of coarse aggregate
0
20
40
60
80
100
120
0 0.5 1 1.5 2
pe
rce
nta
ge p
assi
ng
sieve sizes (mm)
seive analysis of coarse aggregate
Series1

38
River sand
Table 10: sieve analysis of river sand
SEIVE SIZE(mm)
WEIGHT
RETAINED
(gms)
WEIGHT PASSING
(gms)
%PASSING
10 0 425.0 100.00
5 2.5 422.5 99.41
2.36 6.5 416.0 97.88
1.18 40 376.0 88.47
0.6 276.5 99.5 23.41
0.3 29.5 70.0 16.47
0.15 50 20.0 4.71
0.075 13.5 6.5 1.53
pan 6.5 0.00
Graph 2: river sand sieve analysis
Quarry sand
Weight of quarry dust used was 332 gms
0
20
40
60
80
100
120
-1.5 -1 -0.5 0 0.5 1 1.5
pe
rce
nta
ge p
assi
ng
log sieve size
sieve analysis of river sand

39
Table 11: sieve analysis of quarry dust
SEIVE SIZE(mm) WEIGHT
RETAINED(gms)
WEIGHT PASSING
(gms)
%PASSING
10 0 332.0 100.00
5 50.0 282.0 84.93
2.36 62.5 219.5 66.11
1.18 106 113.5 34.19
0.6 47.5 66.0 19.87
0.3 37.0 29.0 8.73
0.15 15.5 13.5 4.06
0.075 8.0 5.5 1.65
pan 5.5 0.00
Graph 3: quarry dust sieve analysis
Discussion
Sieve analysis was done using the standard test sieves conforming to BS 410:1976.
Fine aggregate should be well graded from course to fine and should conform to the
following grading requirements:
Passing 3/8 inch (9.50 mm) sieve............… 100%
Passing No. 4 (4.75 mm) sieve... .................. 95-100%
0
20
40
60
80
100
120
-1.5 -1 -0.5 0 0.5 1 1.5
pe
rce
nta
ge p
assi
ng
log sieve size
quarry dust sieve analysis

40
Passing No. 16 (1.18 mm) sieve.................... 45- 85%
Passing No. 50 (300 m) sieve....................... 10- 30%
Passing No. 100 (150 m) sieve...................... 2- 10%
The results obtained of fine aggregates (both river sand and quarry dust) were within grading
requirement. Quarry dust was found to contain more fine particles compared to river sand
which contained more coarse particles.
Coarse aggregates particles were well distributed as seen from graph 4.1 in data analysis.
Grading was used during concrete mix design in the determination of the proportion of fine
aggregates and of course aggregate content.
4.2 Workability
Table 12: batching ratio 1:1.5:3(cement: fine aggregate: coarse aggregate)
BATCHING FOR THE CUBES
sand replacement
(%)
Mass of
cement(Kg)
Mass of quarry
dust(Kg)
Mass of river
sand(Kg)
Mass of coarse
aggregate(Kg)
0 3.1 0 4.6 9.3
25 3.1 1.2 3.4 9.3
50 3.1 2.3 2.3 9.3
75 3.1 3.4 1.2 9.3
100 3.1 4.6 0 9.3
Table 13: compaction factor of different ratios
sand replacement (%) Partially
compacted(Kg)
Fully compacted (Kg) Compaction factor
0 8.7 10.7 0.81
25 9.2 11.0 0.83
50 9.3 11.1 0.84
75 9.5 11.5 0.83
100 9.6 11.7 0.82

41
The variation of workability was also measured in terms of compaction factor with constant
w/c ratio (0.5).The values were obtained from different mixes such as 0% quarry dust, 25%
quarry dust, 50% quarry dust), 75% quarry dust and 100% quarry dust were 0.81, 0.83, 0.84,
0.83 and 0.82 respectively.
As per the data above, concrete does not give adequate workability with the increase of
quarry dust as fine aggregate.
Table 14: slump test for the all ratios
sand replacement (%) Slump (mm)
0 31
25 22
50 15
75 10
100 6
The measured slump values of quarry dust with constant water/cement ratio i.e. w/c ratio
(0.5) are 31mm,22mm,15mm,10mm and 6mm for different mixes such as 0% quarry dust,
25% quarry dust, 50% quarry dust,75% quarry dust and 100% quarry dust respectively. It
was observed that the slump value decreases with increase in percentage replacement of sand
with quarry dust for the same w/c ratio. It clear that quarry dust requires more w/c ratio than
river sand hence concrete does not give adequate workability with increase of quarry dust. It
can be due to the extra fineness of quarry dust
Increased fineness require greater amount of water for the mix ingredients to get closer
packing, results in decreased workability of the mix.

42
4.3 Compressive strength
Table 15: Summary of Average cube Crushing Strengths at 7 days
sand replacement
(%)
Compressive Strengths (N/mm2) Average
Compressive
Strength
(N/mm2)
Sample 1 Sample 2 Sample 3
0 16.5 16.5 16.8 16.73
25 16.7 16.8 16.6 17.1
50 16.9 17.0 16.8 16.9
75 16.9 17.3 17.1 16.7
100 16.6 16.9 16.7 16.6
Graph 4: seven days compressive strength
16.5
16.6
16.7
16.8
16.9
17
17.1
17.2
0 50 100 150
com
pre
ssiv
e s
tre
ngt
h
percentage replacement
compressive strength vs % replacement
compressive strength vs% replacement

43
Table 16: Summary of Average cube Crushing Strengths at 28 days
sand
replacement (%)
Compressive Strengths (N/mm2) Average
Compressive
Strength
(N/mm2)
Sample 1 Sample 2 Sample 3
0 22.6 22.8 22.4 22.83
25 23.1 22.8 22.8 24.9
50 24.2 24.3 23.8 24.1
75 25.0 24.8 24.9 22.9
100 23.1 22.7 22.7 22.6
Graph 5: twenty eight days compressive strength
Discussion
The results show that there is an increase in the compressive strength of the concrete with the
increment of quarry dust up to about 25% replacement then strength begins to reduce up to
100% replacement both for 7 and 28 days strength. At 75% replacement compressive strength
is almost equal to 0% replacement. The increase in strength on replacement is because quarry
fines act as filler hence fewer void while reduce in strength in 100% quarry dust is as result of
fewer larger particles as compared with sand hence poor workability.
22
22.5
23
23.5
24
24.5
25
25.5
0 20 40 60 80 100 120
com
pre
ssiv
e s
tre
ngt
h
percentage replacement
compressive strength vs % replacement 28 day
compressive strength vs %replacement 28 day

44
The strength of 0% replacement was higher than that of 100% replacement but with little
strength hence quarry dust is fit to be used as sand replacement material.
When results of 7 day strength was compared with 28 day strength it was found to range from
0.68 to0.73 which was within expected result of about or above 67%.
4.4 Tensile strength
Table 17: batching ratio 1:1.5:3(cement: fine aggregate: coarse aggregate)
BATCHING OF THE CYLINDERS
sand replacement
(%)
Mass of
cement(Kg)
Mass of quarry
dust(Kg)
Mass of river
sand(Kg)
Mass of coarse
aggregate(Kg)
0 14.5 0 21.8 43.6
25 14.5 5.4 16.4 43.6
50 14.5 10.9 10.9 43.6
75 14.5 16.4 5.4 43.6
100 14.5 21.8 0 43.6
Table 18: seven days’ tensile Strengths
sand replacement
(%)
cylinder Crushing Strengths (KN) Average tensile
Strengths
(N/mm2) Sample 1 Sample 2 Sample 3
0 125 124 126 1.77
25 130 126 127 1.81
50 121 125 125 1.75
75 115 120 119 1.67
100 110 110 118 1.59
Tensile strength = 2P/surface area

45
Graph 6: seven days tensile strength
Table 19: twenty eight day tensile strength
sand
replacement (%)
cylinder Crushing Strengths (KN) Average
cylinder
Crushing
Strengths
(N/mm2)
Sample 1 Sample 2 Sample 3
0 190 185 190 2.66
25 195 190 192 2.72
50 185 185 188 2.63
75 175 185 183 2.56
100 180 175 180 2.52
1.55
1.6
1.65
1.7
1.75
1.8
1.85
0 20 40 60 80 100 120
ten
sile
str
en
gth
percentage replacement
tensile strength vs % replacement
tensile strength vs %replacement 7 day

46
Graph 7: twenty eight day tensile strength
Discussion
The tensile test result also showed increase in strength as percentage replacement increased
up to 25% replacement then strength began to reduce up to 100% replacement. The increase
was not much as that of compressive strength and 50% was almost equal to 0% replacement.
In design of concrete structures, concrete is considered to have low tensile strength and steel
reinforcements are used hence tensile strength for all replacement is ok. The ratio of 7 day
tensile strength to 28 day tensile strength was 0.66 which is about the expected range 0.67 or
67%.
2.5
2.55
2.6
2.65
2.7
2.75
0 20 40 60 80 100 120
ten
sile
str
en
gth
percentage replacement
tensile strength vs % replacement
tensile strength of 28 day

47
4.5 Flexural strength
Table 20: 5 twenty eight day flexural strength of beams
Flexural test
sand replacement
(%)
d1(mm) d2(mm) l(mm) F(KN) fcf (N/mm2)
0% 100 100 300 12.57 5.66
25% 100 100 300 12.17 5.57
50% 100 100 300 12.37 5.48
75% 100 100 300 11.57 5.30
100% 100 100 300 11.77 5.21
Where
F is the maximum load, in Newton’s;
l is the distance between the supporting rollers, in millimeters;
d1, d2 are the lateral dimensions of the specimen, in millimeters.
Graph 8:twenty eight day flexural strength
5.15
5.2
5.25
5.3
5.35
5.4
5.45
5.5
5.55
5.6
5.65
5.7
0% 20% 40% 60% 80% 100% 120%
fle
xura
l str
en
gth
percentage replacement
flexural strength vs % replacement
flexural strength vs %replacement

48
Discussion
Flexural strength decreased as the percentage replacement increased from 0% replacement up
to 100% replacement. The flexural strength different between 0% sand replacement and 100
% sand replacement was not large (0.45N/mm2) hence was within same range. The strength
characteristic required in fencing post is flexural strength hence quarry dust as fine aggregate
can be used to prepare hollow fencing post.
4.6 Cost Benefit Analysis
In cost benefit analysis exercise the total cost of producing a specified quantity of concrete
was analyzed in order to ascertain whether it’s more economical to use quarry dust as better
replacement of sand in terms of its cost and benefits
Price of a ton of sand = KS. 1950
Price of a ton of Ballast = KS 1780
Price of 50kgs of cement = KS 800
Price of Quarry Dust = KS 1500
One meter cube of concrete was considered and the rates below;
1m3 multiplied with density of concrete 2400kg/m3 to get 2500kg of concrete.
Taking a mix ratio of 1:1.5:3 (cement: fine aggregate: coarse aggregate) the of each ratios is
436.4kg: 654.5kg: 1309.1kg
The weight of fine aggregate was considered during replacement of sand which is 654.5kg. A
summary of the cost analysis for this project is presented in the tables below;
Table 21: mass of different ratios
Percentage replacement Quarry dust (kg) River sand (kg)
0% 0 654.5
25% 163.6 490.9
50% 327.2 327.2
75% 490.9 163.6
100% 654.5 0

49
Table 22: Costs of different replacement
Percentage
replacement
Quarry dust (ksh) River sand (ksh) Total cost
0% 0 1276.28 1276.28
25% 245.40 957.26 1202.66
50% 490.80 638.04 1128.84
75% 736.35 319.02 1055.37
100% 981.75 0 981.75
Graph 9: Graph of total prices against the quarry
Discussion
The results were a decrease in cost with increase in percentage replacement of sand with
quarry dust. 100 % replacement of sand gave the lowest cost hence its economical to replace
sand with quarry dust in concrete production.
0
200
400
600
800
1000
1200
1400
0% 50% 100% 150%
cost
in k
sh
% replacement
cost comparison
cost comparison

50
4.7 General discussion
Generally increase in replacement of river sand with quarry dust resulted to increase in both
compression and tensile strength of concrete. But different rocks have different chemical
properties depending on their method of formation hence its necessary to carry out different
strength test whenever using quarry dust.
As the replacement of the sand with quarry dust increases the workability of the concrete is
decreasing due to the absorption of the water by the quarry dust hence water/cement ratio
should be increased with increase of quarry dust replacement to maintain slump required.

51
6. Conclusion and recommendation
6.1 Conclusion
The experimental data shows that the addition of quarry dust improves the strength properties
of concrete. Due to the high fines of quarry dust it provided to be very effective in assuring
very good cohesiveness of concrete. From the above study it is concluded that the quarry dust
may be used as a replacement material for fine aggregate up to 75% replacement.
Currently Quarry dust is used for different activities in the construction industry such as for
road construction and manufacture of building materials
From the laboratory study conducted as explained above following conclusions are drawn.
1. Non availability of river sand at reasonable cost as fine aggregate in cement concrete for
various reasons, search for alternative material stone crushed dust qualifies itself as a suitable
substitute for sand at lower cost.
2. Aggregates with higher surface area are requiring more water in the mixture to wet the
particle surfaces adequately and to maintain a specific workability. Obviously increasing in
water content in the mixture will adversely affect the quality of concrete.
3. The slump value decreases with increase in percentage replacement of sand with quarry
dust is due to flaky particles shape and higher percentage of fines. Concrete does not give
adequate workability with higher water/cement ratio and the concrete tends to segregate.
4 The compressive strength and tensile strength maximum increase was about 25%
replacement hence during construction of heavy weight structures it’s recommended to use
mixture of quarry dust and river sand rather than quarry dust or river sand alone.
5. Compression strength of 0% replacement had equal value to that of 75% replacement
hence for medium weight structures it’s recommended to use the 75% replacement mixture.
6. It was observed in compaction test that the density of concrete increases with increase in
percentage of dust content. As expected the compressive strength increases with increase in
density of concrete.
7. Although there is decrease in flexural strength with increase of sand replacement the
difference is small hence quarry dust can be used in structures in which design depend mainly
on flexural strength (e.g. fencing post).
In order to achieve Kenya’s vision 2030 cheaper construction materials and conservation of
environment are necessary. Quarry dust is cheaper than river sand and its use will reduce
environmental degradation in various ways:
Reduction of overdependence on natural sources of river sand

52
Quarry fines products can be put into more use as fine aggregates in concrete, other
than dumping and land filling.
6.2 Recommendation
From the test results and analysis above, 50% to 80% replacement of river sand with quarry
dust would be recommend. However for light weight structures such as fencing post, culverts,
one story buildings I would recommend 100% replacement.
It is necessary for trial test with the proposed quarry dust to be carried out in order to achieve
the most suitable water/cement ratio and mix proportions to suit compression strength, tensile
strength and flexural strength required.
One should investigate the chemical composition of rock from which quarry dust is extracted
to prevent any chemical reaction which would lower the strength of concrete.
Further research should be carried out to determine the long term strengths of quarry dust
concrete and also the strengths of quarry dust in reinforced concrete.

53
REFERENCES 1. (Aggregates in Concrete by Mark Alexander & Sidney Mindess. ‘Modern Concrete
Technology 13’)
2. (Materials For Civil and Construction Engineers By Michael S. Mamlouk & John P.
Zaniewski. Third Edition)
3. (Ref: International Journal of Advanced Engineering Research and Studies)
4. (Orchard, D.F. (1976) Concrete Technology, Volume 3, Properties and Testing of
Aggregates, London: Applied Science.)
5. (Brown, B.V. (1993) ‘Aggregates: The greater part of concrete’, in R.K. Dhir and M.R.
Jones (eds), Concrete 2000, London: E&FN Spon.)
6. (M.S. Shetty, Concrete Technology Theory and Practice, 5thedition, S.Chand & Co. Ltd.,
New Delhi)
7. (Md.Safiuddin, S.N.Raman and M.F.M. Zain, Utilization of Quarry waste fine Aggregate
inconcretemixures, 2007 Journal of Applied sciences research 3(3) : 202-208)
8. (M.S.Jaafar, W.A.Thanoon, M.R.A.Kadir and D.N.Trikha, Strength and Durability
characteristics of high strength autoclaved stone dust concrete, The Indian concrete journal,
December 2002 , pp771-774. )
9. (Strength and durability properties of concrete containing quarry dust as fine aggregate,
R.Ilangovana, N.Mahendrana and K.Nagamanib, Pg.No. 20 to 26, ARPN Journal of
Engineering and Applied Science, Vol.3,No.5, October 2008. )

54
Appendix
THE MIX DESIGN PROCESS (Based on the procedure given by the Department of Environment – Transport and Road Research Laboratory,
London)
Figure A-1(fig 4): Relationship between compressive strength and Free – water/cement ratio
Figure A-2(fig 3): Relationship between standard deviation and characteristic strength
The margin; Equation C1
The margin may be derived from the calculation below:
𝑀=𝑘×𝑠 ……………………………………..…C1
where M= the margin.

55
k= a value appropriate to the ‘percentage defectives’ permitted below the characteristic strength.
s= the standard deviation
The target mean strength; Equation C2
𝑓𝑚=𝑓𝑐+𝑀 …………………………………..C2
Where 𝑓𝑚 = the target mean strength
𝑓𝑐 = the specified characteristic strength
𝑀 = the margin
Cement content; Equation C3
Cement content = free – water content
water/cement ratio ………………………………..…….C3
Total Aggregate content; Equation C4
Total aggregate content = 𝐷−𝑊𝐶−𝑊𝐹𝑊 …………….………………………..C4
Where 𝐷 = the wet density of concrete (Kg/m3)
𝑊𝐶 = cement content (kg/m3)
𝑊𝐹𝑊 = free – water content (kg/m3)
Fine and coarse aggregates contents; Equation C5 & C6
Fine aggregate content = total aggregate content × proportion of fines …….…….C5
Coarse aggregate content = total aggregate content – fine aggregate content …….…….C6

56
Figure A-3 (fig 5 & 6): Charts used in mix design

57

58
Chapter 3
Properties and characterization of aggregates If concrete science and technology are to keep pace with developments in other fields of engineering, it is essential that we make the most effective use of concrete materials. It is necessary to move beyond simply knowing the properties of the aggregates to an understanding and application of the effects of their properties on concrete in its various forms. The link between aggregate properties and performance in concrete is not yet entirely understood in many respects. Aggregate properties have profound influences on concrete properties, and these influences need to be understood and appreciated. Concrete aggregates are required to meet minimum standards of cleanliness, strength, and durability, and to be substantially free of deleterious substances. Materials that are soft, very flaky, too porous, or that can react detrimentally in concrete should be excluded. For this reason, thorough testing and examination, including petrographic examination, should be carried out before new or untried sources of aggregate are used. Aggregates for concrete are characterized by using standard tests. Absorption and moisture state Aggregates that are porous can absorb water. Absorption is thus governed by porosity. For the pores of an aggregate particle to fill with water, the pores must be interconnected and open to the surface so that water from the exterior can penetrate the solid. This is not always the case, and what is measured is usually an ‘apparent porosity’ which does not account for the impermeable pores. This is not normally a problem, except that the density or strength of the aggregate may be affected. Absorption is measured in the same type of test as that for porosity, by allowing oven-dry aggregates to absorb water while being submerged and then measuring their mass in a saturated-surface-dry (SSD) condition. Absorption is expressed as the ratio of the increase in mass of an oven-dried sample after saturation to the mass of the saturated-surface-dry sample, in per cent. Water absorption of less than 1 per cent will have little practical effect on concrete properties such as shrinkage and creep. Aggregates with absorptions much higher than 2–3 per cent should be treated as suspect and checked for their influence on concrete performance, for example whether they impart higher drying shrinkage to concrete. Absorption limits are rarely specified in standards, although project-specific specifications may if a suspect aggregate is likely to be used. Where a relationship exists between absorption and some other undesirable property such as poor frost resistance, water absorption limits may be specified for control and compliance purposes. Porous aggregates may adversely affect the resistance of concrete to freeze–thaw conditions. .
(aggregate in concrete by Mark Alexander and Sidney Mindess page 80)