university of missouri u.s. baseline briefing book the usda national institute of food and...
TRANSCRIPT

Agricultural Markets & PolicyUniversity of Missouri
Projections for Agricultural and Biofuel Markets
March 2017
FAPRI-MU Report #01-17
Prepared by the Integrated Policy Group, Division of Applied Social Sciences
fapri.missouri.edu — amap.missouri.edu
U.S. Baseline Briefing Book

Published by the Food and Agricultural Policy Research Institute (FAPRI) at the University of Missouri (MU), 101 Park DeVille Drive, Suite E; Columbia, MO 65203. FAPRI–MU is part of the Division of Applied Social Sciences (DASS) in the College of Agriculture, Food and Natural Resources (CAFNR).
www.fapri.missouri.edu This material is based upon work supported by the U.S. Department of Agriculture, under Agreement No. 58-0111-16-011, and the USDA National Institute of Food and Agriculture, Hatch project number MO-HASS0024. Any opinion, findings, conclusions, or recommendations expressed in this publication are those of the authors and do not necessarily reflect the view of the U.S. Department of Agriculture nor the University of Missouri. The crop, biofuel, government cost and farm income projections in this report were prepared by the team at FAPRI-MU, including Pat Westhoff ([email protected]), Scott Gerlt ([email protected]), Jarrett Whistance ([email protected]), Julian Binfield ([email protected]), Sera Chiuchiarelli ([email protected]), Deepayan Debnath ([email protected]), Hoa Hoang ([email protected]), Kateryna Schroeder ([email protected]), and Wyatt Thompson ([email protected]). The livestock, poultry, dairy and consumer price projections were prepared by the MU Agricultural Markets and Policy (AMAP) team, including Scott Brown ([email protected]) and Daniel Madison ([email protected]). FAPRI-MU and AMAP are both part of the Integrated Policy Group in the MU Division of Applied Social Sciences. U.S. crop trade figures reported here were prepared with the help of Mike Helmar ([email protected]) at the University of Nevada, Reno, Eric Wailes ([email protected]) and Eddie C. Chavez ([email protected]) at the University of Arkansas and Darren Hudson ([email protected]) at Texas Tech University. The Agricultural and Food Policy Center at Texas A&M University will prepare a companion set of estimates of the farm-level impacts of these projections (www.afpc.tamu.edu). The authors would like to thank participants in a workshop reviewing a preliminary version of these estimates in Washington, D.C., in December 2016. Any remaining errors are those of the authors. Permission is granted to reproduce this information with appropriate attribution to the authors and FAPRI–MU.
The University of Missouri does not discriminate on the basis of race, color, religion, national origin, sex, sexual orientation, gender identity, age, genetics information, disability or status as a protected veteran. For more information, call Human Resource Services at 573-882-4256 or the US Department of Education, Office of Civil Rights.

Table
s
Summary....................................................................................2. Grains .......................................................................................15 . Oilseeds....................................................................................29. Other crops..............................................................................39 . Biofuels....................................................................................49 . Livestock and dairy.................................................................55 . Aggregate indicators...............................................................63

FAPRI-MU AMAP | 2017 U.S. Baseline
2
Summary
Net farm income could fall for the fourth straight year in 2017, and the farm debt-to-asset ratio is rising. Even with a
modest recovery in farm income in 2018 and beyond, pressure on farm finances is expected to continue.
These baseline projections for agricultural and biofuel markets were prepared using market information available in Janu-
ary 2017. Macroeconomic assumptions are based primarily on forecasts by IHS Global Insight which suggest moderate
growth in the U.S. and global economies. The baseline incorporates 2014 farm bill provisions and assumes a continuation
of current agricultural and biofuel policies.
The world is an uncertain place and commodity markets will continue to be volatile. We use our models to develop a range
of projected market outcomes that takes into account some major sources of uncertainty about future supply and demand
conditions. In some of the resulting 500 outcomes, prices, quantities and values are much higher or much lower than the
averages reported here.
Some key results:
Record U.S. yields and world production have resulted in further declines in the prices of corn, wheat and many other crops in the 2016/17 marketing year.
Because of shifts in relative prices, projected soybean and cotton planted acreage increases in 2017, while wheat and corn acreage declines.
Projected corn prices average $3.60 per bushel for the 2017/18 marketing year, up slightly from 2016/17. Cornprices average $3.71 per bushel for the 2018-2026 period.
Strong export demand has supported soybean and cotton prices in 2016/17. Projected soybean prices average $9.57 per bushel in 2017/18 and remain near that level in later years.
Cattle, hog, chicken and milk prices have all declined sharply since 2014. Production has increased, and a strong dollar is constraining meat export sales.
Cattle and hog prices both fall in 2017 because of large domestic supplies. U.S. milk prices increase in 2017 with stronger international markets.
Net farm income has declined by 48 percent since its 2013 peak. It increases in 2018 and later years, but in real terms, projected net farm income remains below the 2015 level.
Lower farm income and rising interest rates result in lower projected land prices and farm asset values. The debt-to-asset ratio increases from 11 percent in 2012 to nearly 14 percent in 2017 and 16 percent in 2026.
Agricultural risk coverage (ARC) payments are expected to decline rapidly, largely because of reduced guarantees tied to moving averages of past market prices. More farmers are assumed to choose price loss coverage (PLC) in 2019 if current program rules are extended by a new farm bill and producers are allowed to make a new election.
Crop insurance net outlays are projected to average about $8 billion per year for fiscal years 2018-2026. Major commodity program outlays average about $7 billion per year over the same period.
Food price inflation was just 0.3 percent in 2016, and is expected to reach 1.7 percent in 2017. In later years, pro-
jected food price inflation is similar to the overall rate of inflation in the U.S. economy.

FAPRI-MU AMAP | 2017 U.S. Baseline
3
Key results
2011/12-2015/16 2018/19-2026/27
Marketing year average 2016/17 2017/18 average
Crop prices
Corn farm price, dollars per bushel 4.98 3.38 3.60 3.71
Soybean farm price, dollars per bushel 11.79 9.46 9.57 9.62
Wheat farm price, dollars per bushel 6.55 3.79 4.44 5.10
Upland cotton farm price, cents per pound 72.2 66.7 63.3 64.1
Crop area planted, million acres
Corn 92.6 94.0 92.1 93.5
Soybeans 79.0 83.4 87.1 84.3
Wheat 55.5 50.2 46.2 47.0
Upland cotton 11.2 9.9 10.5 10.2
12 major crops* 259.3 258.5 257.2 255.8
2011-2015 2018-2026
average 2016 2017 average Calendar year except as noted
Livestock sector prices
Fed steers, 5-area direct, dollars per cwt 133.23 120.86 110.66 110.82
Barrows and gilts, 51-52% lean, dollars per cwt 63.51 46.16 43.64 50.43
National wholesale broiler, cents per pound 92.22 84.30 83.48 89.57
All milk, dollars per cwt 20.04 16.20 17.76 18.74
Biofuel production, billion gallons
Ethanol 13.9 15.3 15.6 16.4
Corn starch-based ethanol 13.7 14.9 15.2 16.0
Biomass-based diesel 1.3 1.9 2.1 2.4
Government outlays, billion dollars, fiscal year
Commodity Credit Corporation net outlays 9.0 9.6 11.3 9.9
Major commodity programs 4.3 6.4 8.4 6.8
CRP, disaster and all other CCC net outlays 4.7 3.2 2.9 3.0
Crop insurance net outlays 8.2 4.2 2.9 7.8
Net farm income, billion dollars 101.4 68.3 63.7 87.7
In 2016 dollars 106.5 68.3 62.9 77.5
Farm balance sheet, billion dollars
Farm assets 2,718 2,868 2,789 2,637
Farm debt 322 376 387 408
Debt-to-asset ratio 11.9% 13.1% 13.9% 15.5%
Annual consumer food price inflation 2.4% 0.3% 1.7% 2.5%
*Includes corn, soybeans, wheat, upland cotton, sorghum, barley, oats, rice, peanuts, sunflowers, sugarcane and sugar beets.
Note: The estimates are based on market information available in January 2017. Projections are averages across 500 outcomes.

FAPRI-MU AMAP | 2017 U.S. Baseline
4
Large supplies have
pushed down prices
Since the 2012 drought, world av-
erage yields for grains and oilseeds
have exceeded the long term trend
for four straight years. In 2016,
world production exceeded the
2010-2012 average by 20 percent
for corn, 12 percent for wheat and
31 percent for soybeans. Consump-
tion has also increased, but by a
slightly smaller proportion.
With production growing more
rapidly than use, world carryover
stocks of grains and oilseeds have
increased. The result has been
sharply lower market prices. U.S.
marketing year average prices for
corn are projected to be 45 percent
below the average of 2010/11 to
2012/13. Wheat prices are also
down by 45 percent, and soybean
prices have declined by 26 percent.
Livestock, poultry and milk prices
have also retreated in response to
larger supplies. Since prices peaked
in 2014, U.S. production of beef,
pork and chicken have all increased
far more quickly than population.
Combined with the effects of a
strong dollar on export sales, the
result has been a sharp reduction
in prices. Projected prices for 2017
are 28 percent below the 2014 level
for fed cattle and 43 percent lower
for barrows and gilts. Wholesale
chicken prices have declined 20
percent and the all-milk price has
dropped by 26 percent.
20
12
31
18
9
28
0
5
10
15
20
25
30
35
C o r n W h e a t S o y b e a n sP
erce
nta
ge c
han
ge
World crop production growth outpaces use
Production, 2016/17 vs. 2010-12 avg. Use, 2016/17 vs. 2010-12 avg.
70
30 35
-45 -45
-26
-60
-40
-20
0
20
40
60
80
C o r n W h e a t S o y b e a n s
Per
cen
tage
ch
ange
The result is larger stocks and lower prices
World ending stocks, 2016/17 vs. 2010-12 avg. U.S. price, 2016/17 vs. 2010-12 avg.
814
85
-28
-43
-20-26
-50
-40
-30
-20
-10
0
10
20
B e e f P o r k C h i c k e n M i l k
Per
cen
tage
ch
ange
More meat and milk also means lower prices
U.S. production, 2017 vs. 2014 Indicator price, 2017 vs. 2014

FAPRI-MU AMAP | 2017 U.S. Baseline
5
Crop outlook highlights
Average prices for major crops re-
cover, but remain well below recent
peak levels. After the record yields
of 2016, prices could increase for
crops harvested in 2017 if yields
return to more normal levels. Pro-
jected 2017/18 corn prices average
$3.60 per bushel, with wheat at
$4.44 and soybeans at $9.57. Aver-
age prices over the next ten years
are above the price loss coverage
(PLC) reference price for soybeans,
near the reference price for corn
and below it for wheat.
Given changes in relative prices,
projected soybean and upland cot-
ton acreage increases in 2017 as
corn and wheat area contracts.
Across 12 major crops, total area
declines slightly in 2017, assuming
average spring planting conditions.
Projected acreage for 2018-2026
generally remains between the
2016 and 2017 levels for each of the
major crops.
Direct and countercyclical pay-
ments (DCP) and the average crop
revenue election (ACRE) programs
are gone. Agricultural risk coverage
(ARC) payments peaked in 2015/16,
but then fall as benchmarks adjust
to a declining moving average of
prices. Wheat accounts for most of
the increase in PLC payments in
2016/17. In 2019, it is assumed that
producers will be able to make new
ARC/PLC elections and that most
corn, soybean and wheat producers
will choose PLC given projected
payment rates.
9.57
4.44
3.600
2
4
6
8
10
12
14
16
1 0 / 1 1 1 2 / 1 3 1 4 / 1 5 1 6 / 1 7 1 8 / 1 9 2 0 / 2 1 2 2 / 2 3 2 4 / 2 5 2 6 / 2 7
Do
llars
per
bu
shel
Marketing year
Crop prices remain well below peaks
Soybeans Wheat Corn
87.146.2
92.1
10.5
0
20
40
60
80
100
120
1 0 / 1 1 1 2 / 1 3 1 4 / 1 5 1 6 / 1 7 1 8 / 1 9 2 0 / 2 1 2 2 / 2 3 2 4 / 2 5 2 6 / 2 7
Mill
ion
acr
es
Marketing year
Soybean and cotton area increases in 2017
Soybeans Wheat Corn Upland cotton
0
2
4
6
8
10
1 0 / 1 1 1 2 / 1 3 1 4 / 1 5 1 6 / 1 7 1 8 / 1 9 2 0 / 2 1 2 2 / 2 3 2 4 / 2 5 2 6 / 2 7
Bill
ion
do
llars
Marketing year
ARC payments fall, PLC payments increase
DCP & ACRE ARC PLC

FAPRI-MU AMAP | 2017 U.S. Baseline
6
Livestock and dairy
outlook highlights
Cash receipts for livestock endured
a second consecutive sharp drop in
2016. Last year’s receipts of $168.1
billion were down 21 percent from
the 2014 peak. However, last year’s
level was still higher than any year
prior to 2012. Some relief has been
found with lower input costs, as
purchased feed and purchased live-
stock expenses have dropped more
than $12 billion in the past two
years. Receipts are projected fairly
flat for the next two years.
Despite the large decline in output
prices and receipts, many livestock
inventory categories have contin-
ued to increase. Beef cow, sow and
dairy cow inventories are all up in
2017 for the second year in a row.
In some cases producers are carry-
ing through with expansion plans
made during the record high prices
of 2014. Also, a stable feed cost
outlook and above average pasture
conditions are contributing to herd
growth. Large meat supplies will
continue to grow for the next cou-
ple of years.
Even as U.S. production levels have
been growing, net exports of meat
have struggled to keep pace. A
stronger dollar has offset some of
the price decline in U.S. meat and
dairy products, making it more dif-
ficult to compete in the interna-
tional marketplace.
88
90
92
94
96
98
100
102
104
106
2 0 0 4 2 0 0 6 2 0 0 8 2 0 1 0 2 0 1 2 2 0 1 4 2 0 1 6 2 0 1 8
Ind
ex, 2
00
4 =
10
0
Inventories slow to adjust to lower returns
Beef cows Pork breeding herd Dairy cows
0
25
50
75
100
125
150
175
200
225
2 0 0 4 2 0 0 6 2 0 0 8 2 0 1 0 2 0 1 2 2 0 1 4 2 0 1 6 2 0 1 8B
illio
n d
olla
rs
Livestock cash receipts fell again in 2016
Purchased feed expenses Purchased livestock expenses
Total livestock cash receipts
0
5
10
15
20
25
2 0 0 4 2 0 0 6 2 0 0 8 2 0 1 0 2 0 1 2 2 0 1 4 2 0 1 6 2 0 1 8
Per
cen
t o
f p
rod
uct
ion
exp
ort
ed
Meat exports struggle against a strong dollar
Beef Pork Chicken

FAPRI-MU AMAP | 2017 U.S. Baseline
7
Farm income, debt and food prices
Different measures of net income
for the farm sector all show sharp
declines from recent peaks. Net
farm income falls for the fourth
straight year in 2017. Net cash in-
come increases slightly in 2017,
with inventory changes explaining
most of the difference between the
two measures. Both measures indi-
cate rising nominal income begin-
ning in 2018. Correcting for infla-
tion, average real net farm income
never exceeds the 2015 level.
The farm debt-to-asset ratio
peaked in 1985 during the farm
financial crisis. The rate was cut in
half between 1985 and 2012 as as-
set values increased more rapidly
than debt. Rising debt has in-
creased the debt-to-asset ratio
from 11 percent in 2012 to 14 per-
cent in 2017. Projected reductions
in farm real estate values and fur-
ther increases in debt increase the
projected ratio to 16 percent in
2026. If interest rates rise as pro-
jected, servicing debt will become
more difficult for some producers.
The CPI for food grew by just 0.3
percent in 2016, the lowest annual
growth rate since 1959. Inflation for
food at home was lower than the
previous year for every month in
2016. Food away from home infla-
tion has remained remarkably
steady, as the percentage of con-
sumer dollars spent on food away
from home continues to rise. Food
prices will grow modestly for the
next couple of years due to a small
rebound in many farm commodity
prices and increases in the cost of
processing and marketing food.
0
20
40
60
80
100
120
140
2 0 0 6 2 0 0 8 2 0 1 0 2 0 1 2 2 0 1 4 2 0 1 6 2 0 1 8 2 0 2 0 2 0 2 2 2 0 2 4 2 0 2 6
Bill
ion
do
llars
Farm income measures stay far below peaks
Net cash income Net farm income Real net farm income
-2
-1
0
1
2
3
4
5
6
7
8
2 0 0 4 2 0 0 6 2 0 0 8 2 0 1 0 2 0 1 2 2 0 1 4 2 0 1 6 2 0 1 8
Per
cen
tage
ch
ange
Lower prices for food at home reduce food CPI
Total CPI for food CPI for food at home CPI for food away from home
0
5
10
15
20
25
1 9 8 0 1 9 8 5 1 9 9 0 1 9 9 5 2 0 0 0 2 0 0 5 2 0 1 0 2 0 1 5 2 0 2 0 2 0 2 5
Per
cen
t
Debt-to-asset ratio rises, but below 1980s record

FAPRI-MU AMAP | 2017 U.S. Baseline
8
Policy assumptions
ARC is one option for grain and
oilseed producers. Participating
producers receive a payment when
revenues fall below a trigger tied to
past market prices and county
yields. For illustration purposes
only, the chart uses national aver-
age corn prices and yields. With
these assumptions, payments occur
for the 2014/15-2016/17 marketing
years, but not for 2017/18 and later
years, assuming current ARC rules are
maintained in the next farm bill.
PLC is the other option for grain
and oilseed producers. Payments
occur when national marketing year
average prices fall below a fixed ref-
erence price. As with ARC, pay-
ments are made on 85 percent of
base acres for a particular crop.
Given expected wheat prices, PLC
payments continue each year.
Renewable Fuel Standard (RFS)
obligations increase at a steady
pace on a percentage basis. Com-
bined with declining motor fuel use
over time, the RFS requirements
on a volume basis grow at a slower
rate. Conventional ethanol is pro-
jected to account for 15 billion gal-
lons each year, while the biomass-
based diesel requirements grow.
0
5
10
15
20
25
2 0 1 2 2 0 1 4 2 0 1 6 2 0 1 8 2 0 2 0 2 0 2 2 2 0 2 4 2 0 2 6
Bill
ion
gal
lon
s
Calendar year
Applied RFS volumes grow slowly
Conventional gap Advanced gap Biomass-based diesel Cellulosic
0
1
2
3
4
5
6
7
8
1 0 / 1 1 1 2 / 1 3 1 4 / 1 5 1 6 / 1 7 1 8 / 1 9 2 0 / 2 1 2 2 / 2 3 2 4 / 2 5 2 6 / 2 7
Do
llars
per
bu
shel
Marketing year
PLC payments are tied to fixed reference prices
Wheat market price Wheat reference price
0
200
400
600
800
1000
1 0 / 1 1 1 2 / 1 3 1 4 / 1 5 1 6 / 1 7 1 8 / 1 9 2 0 / 2 1 2 2 / 2 3 2 4 / 2 5 2 6 / 2 7D
olla
rs p
er a
cre
Marketing year
Moving averages reduce ARC benchmarks
Corn revenue per acre 86% of corn benchmark

FAPRI-MU AMAP | 2017 U.S. Baseline
9
Selected policy assumptions, 2016-26
Policy Description
Price loss coverage Makes payments when marketing year average price falls below fixed reference prices:
(PLC) Corn $3.70/bu.
Soybeans $8.40/bu.
Wheat $5.50/bu.
Rice $14.00/cwt ($16.10/cwt for Japonica)
Sorghum $3.95/bu.
Barley $4.95/bu.
Oats $2.40/bu.
Peanuts $535/ton
Sunflowers 20.15 cents/lb.
Cotton not available
Paid on program yields and 85% of base acreage.
Agriculture risk coverage Makes payments when revenues fall below 86% of a benchmark
(ARC) County option (ARC-CO) benchmark: 5-year Olympic average of national marketing year
multiplied by the 5-year Olympic average of county yields per planted acre
Farm option (ARC-IC) benchmark: 5-year Olympic average of weighted farm revenue per acre
Maximum payment is 10% of benchmark value
Paid on 85% (ARC-CO) or 65% (ARC-IC) of base acreage
Available for program crops (not upland cotton)
ARC/PLC participation For 2014-2018, participation reflects elections made in 2015
In 2019, producers assumed to make a new program election
Participation rates for 2019 and subsequent years are based on a comparison of expected
payments. The corn PLC participation rate, for example, is increased to 70%
Sequestration Assumed to apply to PLC and ARC payments and certain conservation payments
Rate: 6.8% for 2016 crop payments, 6.9% for 2017-25 crop payments and zero for 2026
Marketing loan program 2014 farm bill levels provisions
Supplemental coverage option Available for program crops not enrolled in ARC
Area crop insurance available as a supplement to conventional insurance
Covers range between 86% and individual coverage level
65% of premium subsidized
Upland cotton Stacked income protection program (STAX)
Area crop insurance available in addition to conventional insurance
80% of premium subsidized
Loan rate varies in range depending on recent world cotton prices
No cotton PLC or ARC programs
Former cotton base (now "generic base") eligible for PLC or ARC if planted to other crops
Sugar 2014 farm bill provisions
Agreement with Mexico incorporated
Conservation reserve Caps conservation reserve acreage at 24 million acres by 2017
Dairy Margin protection program (MPP-Dairy)

FAPRI-MU AMAP | 2017 U.S. Baseline
10
Crop program
participation
Under the 2014 farm bill, producers
made a one-time election of ARC or
PLC for each crop for the 2014-
2018 crop years. For corn and soy-
beans, projected average ARC pay-
ments per base acre are larger over
the 2014-18 period than average
projected PLC payments. The re-
verse is true for wheat, sorghum,
barley, rice and peanut base.
For corn and soybeans, projected
ARC payments decline as the mov-
ing average of prices used to set the
ARC benchmark adjusts to the low-
er prices of recent years. Projected
average ARC payments per partici-
pating base acre are smaller than
projected PLC payments for all the
major crops for 2019-2026.
For baseline purposes, we assume
farmers will have an opportunity to
make a new ARC-PLC election for
the 2019-2026 period. Given pro-
jected payments, PLC may look
more attractive in 2019 than it did
in 2015, when the 2014-2018 elec-
tion was made. As a result, we as-
sume greater PLC participation for
corn, soybeans, wheat and several
other crops after 2019.
3012 15 10 6
3860
203
27 3210
116
187
0
50
100
150
200
250
C o r n S o y b e a n s W h e a t S o r g h u m B a r l e y R i c e P e a n u t s
Do
llars
per
par
tici
pat
ing
bas
e ac
re2014-18 annual average
ARC and PLC payments differ by crop
ARC PLC
7 3
44
6875
95 100
7060
8090 85
95 100
0
20
40
60
80
100
120
C o r n S o y b e a n s W h e a t S o r g h u m B a r l e y R i c e P e a n u t s
Per
cen
t o
f b
ase
acre
age
Share of base area enrolled in PLC
PLC enrollment expected to increase in 2019
2014-18 2019-26
15 8 8 5 729
5732
1122
3522
99
207
0
50
100
150
200
250
C o r n S o y b e a n s W h e a t S o r g h u m B a r l e y R i c e P e a n u t s
Do
llars
per
par
tici
pat
ing
bas
e ac
re
2019-26 annual average
For some crops, patterns change after 2019
ARC PLC

FAPRI-MU AMAP | 2017 U.S. Baseline
11
ARC and PLC payments and participation rates
Average Average Share of base acres in:
ARC payment PLC payment ARC PLC
Average for 2014-2018 crop years (Dollars per base acre) (Percent)
Corn 30.22 19.99 93.0 7.0
Soybeans 12.38 3.33 96.8 3.2
Wheat 15.13 26.97 56.5 43.5
Sorghum 10.33 31.86 31.7 68.3
Barley 6.04 10.05 25.3 74.7
Oats 4.93 10.18 64.7 35.3
Rice 38.48 115.63 5.0 95.0
Long grain 45.10 122.60 0.2 99.8
Short and medium grain 38.33 68.99 30.5 69.5
Peanuts 59.89 187.46 0.3 99.7
Sunflower seed 7.27 20.10 43.6 56.4
Average for 2019-2026 crop years
Corn 14.67 32.30 30.0 70.0
Soybeans 8.40 10.88 40.0 60.0
Wheat 8.31 22.24 20.0 80.0
Sorghum 5.04 35.42 10.0 90.0
Barley 7.12 21.84 15.0 85.0
Oats 1.77 11.15 10.0 90.0
Rice 28.81 99.41 5.0 95.0
Long grain 37.41 103.52 0.2 99.8
Short and medium grain 28.58 71.63 30.6 69.4
Peanuts 57.29 207.17 0.3 99.7
Sunflower seed 10.88 32.74 10.0 90.0

FAPRI-MU AMAP | 2017 U.S. Baseline
12
Macroeconomic assump-
tions and farm prices paid
IHS Global Insight forecasted in
January that U.S. real GDP growth
would accelerate to 2.3 percent in
2017 and to 2.7 percent in 2018.
Growth averages 2.1 percent per
year between 2017 and 2026. Pro-
jected inflation picks up to an aver-
age of 2.6 percent. The prime lend-
ing rate increases to 6.0 percent by
2020.
The baseline adopts IHS Global
Insight’s forecast of steadily in-
creasing oil prices. The annual av-
erage price in 2026 exceeds the
previous record in nominal terms,
but remains far lower in real terms.
Higher oil prices increase farm
production costs and can affect de-
mand for biofuels.
Lower feed, fuel and fertilizer prices
reduced the index of farm produc-
tion input prices in 2015 and 2016.
Projected fuel costs begin to in-
crease again in 2017. The rate of
increase in farm input prices is 2.0
percent per year from 2018-2026.
-4
-2
0
2
4
6
8
10
2 0 0 6 2 0 0 8 2 0 1 0 2 0 1 2 2 0 1 4 2 0 1 6 2 0 1 8 2 0 2 0 2 0 2 2 2 0 2 4 2 0 2 6P
erce
nt
Real GDP growth is steady, interest rates rise
Prime rate CPI inflation Real GDP growth
40
50
60
70
80
90
100
110
120
130
140
2 0 0 6 2 0 0 8 2 0 1 0 2 0 1 2 2 0 1 4 2 0 1 6 2 0 1 8 2 0 2 0 2 0 2 2 2 0 2 4 2 0 2 6
Ind
ex:
20
11
= 1
00
Farm input prices increase after recent declines
All production items Feed Fertilizer Fuel
0
20
40
60
80
100
120
2 0 0 6 2 0 0 8 2 0 1 0 2 0 1 2 2 0 1 4 2 0 1 6 2 0 1 8 2 0 2 0 2 0 2 2 2 0 2 4 2 0 2 6
Do
llars
per
bar
rel
Higher oil prices affect production costs, biofuels
Refiners' acquisition cost West Texas Intermediate WTI in 2016 dollars

FAPRI-MU AMAP | 2017 U.S. Baseline
13
Macroeconomic assumptions
Calendar year 2016 2017 2018 2019 2020 2021 2022 2023 2024 2025 2026
Real GDP growth (Percentage change from previous year)
United States 1.6 2.3 2.6 2.3 2.1 2.2 2.1 2.0 1.9 1.8 1.8
China 6.7 6.4 6.2 6.1 6.1 6.0 6.0 5.9 5.8 5.6 5.4
World 2.4 2.8 3.1 3.1 3.0 3.1 3.2 3.1 3.1 3.0 3.0
Population growth
United States 0.8 0.8 0.8 0.8 0.8 0.8 0.8 0.8 0.7 0.7 0.7
World 1.1 1.1 1.1 1.1 1.0 1.0 1.0 1.0 0.9 0.9 0.9
U.S. CPI, all urban consumers 1.3 2.5 2.1 2.5 2.7 2.7 2.7 2.8 2.7 2.7 2.7
(Percent)
U.S. unemployment rate 4.9 4.6 4.3 4.1 4.2 4.3 4.5 4.5 4.6 4.6 4.7
3-month Treasury bill rate 0.3 0.9 1.7 2.5 2.9 2.9 2.9 2.9 2.9 2.9 2.9
Prime interest rate 3.5 4.0 4.7 5.7 6.0 6.0 6.0 6.0 6.0 6.0 6.0
Petroleum prices (Dollars per barrel)
West Texas Intermediate 43.17 53.20 55.64 62.30 69.33 76.59 83.81 90.52 96.66 102.24 106.74
Refiners' acquisition cost 40.05 47.89 50.64 57.35 64.66 72.02 79.16 85.83 91.80 97.29 102.00
Natural gas price (Dollars per million BTU)
Henry Hub 2.49 3.35 2.95 2.93 3.18 3.18 3.52 3.88 4.19 4.36 4.46
Exchange rates (Currency per dollar)
Euro 0.90 0.99 0.98 0.90 0.83 0.79 0.77 0.75 0.74 0.73 0.73
Chinese yuan 6.64 7.17 7.45 7.57 7.55 7.41 7.23 7.09 6.98 6.89 6.84
Source: IHS Global Insight, Dec. 2016 (world) and Jan. 2017 (U.S.).
Indices of prices paid by farmers
Calendar year 2016 2017 2018 2019 2020 2021 2022 2023 2024 2025 2026
(2011=100) Production items, interest,
taxes and wages 105.9 106.5 108.2 110.3 112.6 115.1 117.8 120.6 123.3 126.1 128.7
Production items 104.3 104.4 105.7 107.5 109.5 111.9 114.4 117.0 119.5 122.0 124.3
Feed 103.1 102.0 103.4 104.2 103.8 103.1 103.0 102.9 102.9 103.0 102.8
Livestock & poultry 104.6 98.0 95.8 95.1 95.9 99.0 102.5 106.0 108.7 112.0 115.1
Seeds 111.5 110.6 110.3 111.0 112.4 113.9 115.2 116.4 117.7 119.0 120.3
Fertilizer 72.3 72.8 73.5 72.6 74.3 76.7 78.3 80.6 83.0 84.4 84.9
Agricultural chemicals 107.9 108.4 109.2 112.8 117.5 121.0 125.4 130.2 134.9 138.7 142.1
Fuels 56.2 63.1 65.3 70.6 77.0 83.4 90.0 95.9 101.0 105.7 109.8
Supplies & repairs 106.0 108.0 110.2 112.8 115.4 118.1 120.9 123.9 126.9 129.9 133.0
Autos & trucks 106.0 107.3 108.3 109.3 110.5 111.8 113.1 114.5 115.8 117.3 118.6
Farm machinery 114.6 117.1 120.8 125.0 129.1 132.8 136.5 140.4 144.4 148.6 152.9
Building material 107.7 109.4 111.0 112.7 114.4 116.1 117.8 119.5 121.1 122.8 124.4
Farm services 116.6 119.4 122.9 126.9 131.0 135.1 139.3 143.7 148.2 152.9 157.8
Interest* 105.5 112.3 120.2 128.4 133.2 136.2 139.2 142.4 145.7 149.1 152.6
Taxes** 128.4 132.6 135.2 136.5 138.2 140.6 143.0 145.8 148.9 152.1 155.5
Wage rates 115.9 118.7 122.5 126.8 131.2 135.9 140.7 145.6 150.6 155.9 161.3
*Interest per acre on farm real estate debt and interest rate on farm non-real estate debt.
**Farm real estate taxes payable per acre.

FAPRI-MU AMAP | 2017 U.S. Baseline
14
The Stochastic Baseline
The March baseline is constructed to incorporate the uncertainty of forecasts. Any estimate of the future has
a random component that can not be known ahead of time. As a result, a subset of the variables is allowed to
be stochastic. This means that they contain a random effect. Since the models are interconnected, this leads
to variability throughout the model. It is impossible to capture all uncertainty. Therefore, the stochastic base-
line should not be treated as thoroughly capturing all risk.
While the tables present one number for each variable, there is actually a distribution behind each. Many of
the paths for the variables appear flat as if there is little year over year change. This is because the expectation
for each year is presented, which is the mean of the distribution. In reality, our models approximate an infi-
nite number of outcomes.
The stochastic nature of the baseline can lead to interesting results. Consider the Price Loss Coverage (PLC)
program that makes payments when the farm price falls below a reference price. Our expected farm price
may be above the reference price. However, there is likely some probability that the price may fall below the
reference price in the future. These outcomes are weighted into our expected PLC payments. As a result, our
tables may show an expected PLC payment even when the expected farm price is above the reference price.
Anytime the farm price is above the reference price, the PLC payment is zero. However, if the inverse is true
then the payment rate has a one to one relationship with the farm price. This creates an asymmetry in the
distribution of PLC payments as the lower tail is limited at zero while the upper tail can be quite high. The
Aggregate Indicators section includes a table with confidence interval information for several select variables.
0
2
4
6
8
10
12
14
16
1 4 / 1 5 1 6 / 1 7 1 8 / 1 9 2 0 / 2 1 2 2 / 2 3 2 4 / 2 5 2 6 / 2 7
Bill
ion
do
llars
Marketing year
Total PLC payments
80% confidence interval Expectation

Gra
ins

FAPRI-MU AMAP | 2017 U.S. Baseline
16
Corn
The 2016 corn crop was the largest
on record. This was caused by a
combination of high acreage and a
record yield. The past four years of
production have exceeded any year
prior to 2013. The record crops
have caused production to exceed
use in three of the past four years,
resulting in a large buildup of
stocks.
The consistently high production of
corn helped to bring prices down
from the record 2012/13 levels. The
2015 farm price was $0.09 per
bushel below and the 2016 project-
ed price is $0.32 below the $3.70
reference price. The long term pro-
jected farm price hovers around the
reference price.
Lower corn prices more than offset
higher yields, leading to reduced
revenues. This effect, when coupled
with higher variable costs, has led
to lower post 2011/12 market re-
turns. While soybeans have largely
followed the same pattern, soybean
returns are expected to remain
stronger in 2016/17 as price has
increased despite a higher yield.
This leads to a temporary spike in
soybean returns.
3.00
3.50
4.00
4.50
5.00
5.50
6.00
6.50
7.00
1 0 / 1 1 1 2 / 1 3 1 4 / 1 5 1 6 / 1 7 1 8 / 1 9 2 0 / 2 1 2 2 / 2 3 2 4 / 2 5 2 6 / 2 7
Do
llars
per
bu
shel
September-August marketing year
Corn prices remain well below 2012/13 peak
Corn farm price Reference price
10
11
12
13
14
15
16
1 0 / 1 1 1 2 / 1 3 1 4 / 1 5 1 6 / 1 7 1 8 / 1 9 2 0 / 2 1 2 2 / 2 3 2 4 / 2 5 2 6 / 2 7B
illio
n b
ush
els
September-August marketing year
Record corn production in 2016/17
Production Total use
250
300
350
400
450
500
550
600
1 0 / 1 1 1 2 / 1 3 1 4 / 1 5 1 6 / 1 7 1 8 / 1 9 2 0 / 2 1 2 2 / 2 3 2 4 / 2 5 2 6 / 2 7
Do
llars
per
acr
e
September-August marketing year
2016/17 corn returns surpassed by soybeans
Corn market net return Soybean market net return

FAPRI-MU AMAP | 2017 U.S. Baseline
17
The 2016/17 spike in soybean re-
turns while corn returns remained
flat leads to a projected loss of al-
most 2 million corn acres in 2017.
Some of this area is expected to
return to corn in the future as dy-
namics in the markets work them-
selves out. Projected corn area hov-
ers in the 93 million acre range.
The spike in 2016 corn production
is expected to lead to an increase in
use. Feed and residual use includes
any accounting discrepancies in
corn supply and use. This category
tends to be large during a bumper
crop which causes 2016/17 project-
ed feed and residual use to in-
crease. Lower prices and a reduced
2016 Brazilian corn crop increase
2016/17 U.S. corn exports.
Average ARC payments for corn
were between $40 and $50 per
base acre for 2014/15 and 2015/16.
As prices continue to fall, the corn
ARC benchmark shrinks. However,
with corn prices falling to near the
reference price, expected corn
PLC’s have risen. Starting in
2017/18, average PLC payments
exceed average ARC payments for
corn. Producers are assumed to be
able to make a new program elec-
tion in 2019, with 70 percent of
base acreage enrolling in PLC.
0
1
2
3
4
5
6
7
1 0 / 1 1 1 2 / 1 3 1 4 / 1 5 1 6 / 1 7 1 8 / 1 9 2 0 / 2 1 2 2 / 2 3 2 4 / 2 5 2 6 / 2 7
Bill
ion
bu
shel
s
September-August marketing year
Corn use increases in 2016/17
Feed and residual Ethanol and coproducts Exports
05
101520253035404550
1 4 / 1 5 1 6 / 1 7 1 8 / 1 9 2 0 / 2 1 2 2 / 2 3 2 4 / 2 5 2 6 / 2 7Do
llars
per
par
tici
pat
ing
bas
e ac
re
September-August marketing year
PLC payments surpass ARC payments for corn
PLC ARC
85.0
87.5
90.0
92.5
95.0
97.5
100.0
2 0 1 0 2 0 1 2 2 0 1 4 2 0 1 6 2 0 1 8 2 0 2 0 2 0 2 2 2 0 2 4 2 0 2 6
Mill
ion
acr
es
Calendar year
Corn planted area falls in 2017

FAPRI-MU AMAP | 2017 U.S. Baseline
18
Corn milling products
Distillers dried grains (DDGS) pro-
duction follows the increase of dry-
mill ethanol production over the
projection period and rises to 46
million tons. Most of this increase
in production is absorbed by do-
mestic use. DDGS net exports dip
in 2016/17 because of Chinese im-
port restrictions.
Prices for DDGS are projected to
dip slightly in 2016/17 before re-
covering the following year. Over
the course of the projection period,
DDGS prices hold a very slight pre-
mium relative to corn. The ratios of
other corn product prices to the
corn price are also estimated to re-
main fairly stable.
Corn oil use, in total, is estimated
to increase over the projection peri-
od to nearly 7 billion pounds. While
food and residual use experience a
slight decline, biodiesel and feed
uses of distillers corn oil expand
over time.
0
1
2
3
4
5
6
7
8
1 0 / 1 1 1 2 / 1 3 1 4 / 1 5 1 6 / 1 7 1 8 / 1 9 2 0 / 2 1 2 2 / 2 3 2 4 / 2 5 2 6 / 2 7
Bill
ion
po
un
ds
October-September marketing year
Corn oil use grows steadily
Food and other Feed Biodiesel Net exports
0
50
100
150
200
250
300
1 0 / 1 1 1 2 / 1 3 1 4 / 1 5 1 6 / 1 7 1 8 / 1 9 2 0 / 2 1 2 2 / 2 3 2 4 / 2 5 2 6 / 2 7
Do
llars
per
to
n
September-August marketing year
DDGS prices near parity with corn
Distillers grains Corn Corn gluten feed
0
10
20
30
40
50
1 0 / 1 1 1 2 / 1 3 1 4 / 1 5 1 6 / 1 7 1 8 / 1 9 2 0 / 2 1 2 2 / 2 3 2 4 / 2 5 2 6 / 2 7
Mill
ion
to
ns
September-August marketing year
Distillers grain production trends upward
Distillers, brewers grains production Domestic use Net exports

FAPRI-MU AMAP | 2017 U.S. Baseline
19
Wheat
The winter wheat seedings report
indicated that producers planted
32.8 million acres of winter wheat
in the fall of 2016. If confirmed, it
would be the lowest since 1909.
Total wheat area is projected to be
46.2 million acres in 2017 which
would be the smallest amount since
the total has been recorded. Low
wheat prices have caused a sus-
tained loss of acres to other crops
as high world stocks have been
weighing on markets.
The 2016 wheat crop is the largest
since 2003. Most of the increase in
projected 2016/17 use is in the feed
and residual and export categories.
Wheat prices are expected to fall
enough relative to corn to encour-
age extra feed consumption of
wheat. However, the low plantings
and a return to trend yields in 2017
reduce expected production.
U.S. wheat ending stocks have
been building the past few years to
very high levels. In 2017/18, wheat
consumption is not expected to fall
nearly as fast as production. As a
result, stocks are drawn down, al-
lowing a modest recovery in prices.
1.8
1.9
2.0
2.1
2.2
2.3
2.4
2.5
1 0 / 1 1 1 2 / 1 3 1 4 / 1 5 1 6 / 1 7 1 8 / 1 9 2 0 / 2 1 2 2 / 2 3 2 4 / 2 5 2 6 / 2 7
Bill
ion
bu
shel
s
June-May marketing year
Wheat production drops sharply
Production Total use
0.0
0.2
0.4
0.6
0.8
1.0
1.2
1 0 / 1 1 1 2 / 1 3 1 4 / 1 5 1 6 / 1 7 1 8 / 1 9 2 0 / 2 1 2 2 / 2 3 2 4 / 2 5 2 6 / 2 7
Bill
ion
bu
shel
s
June-May marketing year
Wheat ending stocks are drawn down
30
35
40
45
50
55
60
2 0 1 0 2 0 1 2 2 0 1 4 2 0 1 6 2 0 1 8 2 0 2 0 2 0 2 2 2 0 2 4 2 0 2 6
Mill
ion
acr
es
Calendar year harvested
Winter wheat seedings fall
All wheat planted area Winter wheat seedings

FAPRI-MU AMAP | 2017 U.S. Baseline
20
Sorghum
Average 2016/17 sorghum prices
are expected to fall by 55 percent
from the 2012/13 peak. Although
some recovery is anticipated, lower
grain prices keep the average farm
price below the reference price eve-
ry year in the baseline. This gener-
ates average annual PLC payments
in the $35 to $40 range per partici-
pating base acre.
Sorghum area in 2016 was below
the levels observed the previous
three years. This drop was experi-
enced in most sorghum producing
states as prices for the commodity
fell harder than for most alternative
crops. The low price coupled with
some recovery in cotton returns
limits sorghum acreage in the base-
line.
Barley and oats
Barley prices have exceeded corn
prices since 2012/13. High malting
barley prices have contributed to a
slight increase in barley acreage.
The U.S. continues to be a large net
importer of oats.
2.50
3.00
3.50
4.00
4.50
5.00
5.50
6.00
6.50
1 0 / 1 1 1 2 / 1 3 1 4 / 1 5 1 6 / 1 7 1 8 / 1 9 2 0 / 2 1 2 2 / 2 3 2 4 / 2 5 2 6 / 2 7D
olla
rs p
er b
ush
elSeptember-August marketing year
Sorghum prices remain below reference price
Sorghum farm price Reference price
5.0
5.5
6.0
6.5
7.0
7.5
8.0
8.5
9.0
2 0 1 0 2 0 1 2 2 0 1 4 2 0 1 6 2 0 1 8 2 0 2 0 2 0 2 2 2 0 2 4 2 0 2 6
Mill
ion
acr
es
Calendar year
Sorghum area moderates
1.00
2.00
3.00
4.00
5.00
6.00
7.00
1 0 / 1 1 1 2 / 1 3 1 4 / 1 5 1 6 / 1 7 1 8 / 1 9 2 0 / 2 1 2 2 / 2 3 2 4 / 2 5 2 6 / 2 7
Do
llars
per
bu
shel
Marketing year
Feedgrain farm prices
Barley Corn Oats

FAPRI-MU AMAP | 2017 U.S. Baseline
21
Rice
U.S. rice production in 2016 was
bolstered by an increase in acreage
of long grain and japonica rice. The
area in 2017 is expected to fall.
Trend yields in 2017 would be high-
er than the actual yields in 2016,
but this would not be large enough
to offset the acreage effect. As a re-
sult, 2017/18 use outpaces domes-
tic production in the baseline.
The bump in 2016/17 production
pushed rice prices lower across the
board. This reduces acreage in 2017
which allows some price recovery
in that year. Other short and medi-
um grain and long grain prices are
low enough to trigger PLC pay-
ments for those types.
5.00
7.50
10.00
12.50
15.00
17.50
20.00
22.50
25.00
1 0 / 1 1 1 2 / 1 3 1 4 / 1 5 1 6 / 1 7 1 8 / 1 9 2 0 / 2 1 2 2 / 2 3 2 4 / 2 5 2 6 / 2 7
Do
llars
per
cw
t
August-July marketing year
Rice farm prices
Long grain Japonica Other S/M grain
170
190
210
230
250
270
290
1 0 / 1 1 1 2 / 1 3 1 4 / 1 5 1 6 / 1 7 1 8 / 1 9 2 0 / 2 1 2 2 / 2 3 2 4 / 2 5 2 6 / 2 7
Mill
ion
cw
t
August-July marketing year
U.S. rice use outpaces domestic production
Production Domestic use

FAPRI-MU AMAP | 2017 U.S. Baseline
22
Corn supply and use
September-August year 16/17 17/18 18/19 19/20 20/21 21/22 22/23 23/24 24/25 25/26 26/27
(Million acres) Area
Planted area 94.0 92.1 92.9 93.6 93.4 93.3 93.5 93.6 93.6 93.7 93.7
Harvested area 86.7 84.1 84.9 85.4 85.4 85.2 85.5 85.4 85.4 85.5 85.5
(Bushels per harvested acre)
Yield 174.6 168.6 170.1 172.0 173.8 175.6 177.2 178.8 180.6 182.6 184.6
(Million bushels)
Supply 16,940 16,521 16,607 16,812 17,004 17,170 17,367 17,529 17,727 17,931 18,154
Beginning stocks 1,737 2,294 2,116 2,067 2,114 2,164 2,174 2,203 2,238 2,261 2,307
Production 15,148 14,177 14,440 14,695 14,840 14,956 15,143 15,277 15,439 15,620 15,796
Imports 55 50 50 50 50 50 50 50 50 50 50
Domestic use 12,419 12,382 12,460 12,525 12,579 12,640 12,729 12,834 12,938 13,041 13,138
Feed and residual 5,613 5,420 5,466 5,525 5,545 5,554 5,572 5,596 5,607 5,612 5,624
Ethanol and coproducts 5,370 5,524 5,550 5,552 5,579 5,628 5,697 5,774 5,864 5,957 6,037
HFCS 481 480 482 479 480 476 472 468 465 463 461
Seed 30 31 31 31 31 31 31 31 31 31 31
Food and other 924 927 931 937 945 952 958 965 971 978 985
Exports 2,227 2,023 2,080 2,174 2,261 2,356 2,435 2,458 2,528 2,583 2,658
Total use 14,646 14,405 14,539 14,698 14,840 14,996 15,164 15,292 15,466 15,624 15,796
Ending stocks 2,294 2,116 2,067 2,114 2,164 2,174 2,203 2,238 2,261 2,307 2,358
CCC inventory 0 0 0 0 0 0 0 0 0 0 0
Under loan 145 131 124 130 134 134 134 138 139 143 146
Other stocks 2,149 1,986 1,943 1,984 2,030 2,040 2,069 2,099 2,122 2,165 2,211
Prices, program provisions (Dollars per bushel)
Farm price 3.38 3.60 3.77 3.76 3.71 3.70 3.71 3.70 3.70 3.69 3.65
Loan rate 1.95 1.95 1.95 1.95 1.95 1.95 1.95 1.95 1.95 1.95 1.95
Reference price 3.70 3.70 3.70 3.70 3.70 3.70 3.70 3.70 3.70 3.70 3.70
(Million acres)
Base area 97.2 97.2 97.2 97.2 97.2 97.2 97.2 97.2 97.2 97.2 97.2
(Bushels per acre)
PLC program yield 123.6 123.6 123.6 123.6 123.6 123.6 123.6 123.6 123.6 123.6 123.6
(Percent of base acres)
PLC participation rate 7.1 7.1 7.1 70.0 70.0 70.0 70.0 70.0 70.0 70.0 70.0
ARC participation rate 92.9 92.9 92.9 30.0 30.0 30.0 30.0 30.0 30.0 30.0 30.0
Returns and payments (Dollars)
Gross market revenue/a. 590.18 603.16 637.59 641.62 640.42 645.03 653.34 657.02 664.90 669.54 669.61
Variable expenses/a. 312.71 305.74 308.76 312.59 318.62 326.29 333.79 341.67 349.66 356.67 362.06
Market net return/a. 277.47 297.42 328.83 329.03 321.80 318.74 319.55 315.35 315.24 312.87 307.55
Marketing loan benefits/a.* 0.00 0.24 0.40 0.20 0.25 0.56 0.50 0.58 0.49 0.28 0.23
Payments to participants
PLC/base a.* 31.23 31.20 28.74 31.40 32.78 31.26 30.66 32.79 32.63 33.30 33.60
ARC/base a.* 35.56 14.69 11.34 11.92 13.01 14.10 14.84 15.57 15.44 16.12 16.35
Insurance net indemnities/a.* -2.12 21.47 20.55 21.57 21.58 21.86 22.12 22.57 23.01 22.81 22.73
*Marketing loan benefits and insurance net indemnities are averaged across all acres. PLC and ARC payments are per participating acre.
All projections are averages across 500 stochastic outcomes.

FAPRI-MU AMAP | 2017 U.S. Baseline
23
Corn product supply and use
Marketing year 16/17 17/18 18/19 19/20 20/21 21/22 22/23 23/24 24/25 25/26 26/27
High-fructose corn syrup (Thousand tons, Oct.-Sep. year)
Production 8,644 8,640 8,695 8,660 8,679 8,630 8,580 8,526 8,484 8,461 8,446
Domestic use 7,519 7,442 7,476 7,396 7,393 7,332 7,297 7,253 7,207 7,173 7,136
Net exports 1,125 1,197 1,219 1,264 1,285 1,298 1,282 1,273 1,278 1,289 1,311
(Cents per pound, Oct.-Sep. year)
Price, 42% Midwest 30.05 30.80 31.46 31.28 31.56 31.56 31.86 32.06 32.32 32.51 32.56
HFCS price/ref. sugar price 94% 94% 94% 95% 95% 96% 96% 97% 97% 97% 98%
Distillers, brewers grains (Thousand tons, Sep.-Aug. year)
Production (dry equiv.) 40,406 41,562 41,782 41,796 42,017 42,397 42,913 43,522 44,262 45,027 45,699
Domestic use 29,650 30,845 31,078 31,100 31,308 31,682 32,187 32,796 33,538 34,290 34,951
Net exports 10,756 10,717 10,704 10,697 10,710 10,715 10,726 10,726 10,724 10,737 10,748
(Dollars per ton, Sep.-Aug. year)
Price, IL points 123.81 130.53 135.62 135.61 133.39 132.64 133.28 133.56 134.02 133.41 131.94
DDGS price/corn price 103% 101% 101% 101% 101% 100% 101% 101% 101% 101% 101%
Corn gluten feed (Thousand tons, Sep.-Aug. year)
Production 9,336 9,410 9,406 9,394 9,407 9,408 9,423 9,441 9,456 9,477 9,496
Domestic use 8,184 8,297 8,327 8,339 8,371 8,393 8,430 8,470 8,506 8,546 8,584
Net exports 1,153 1,113 1,079 1,055 1,036 1,015 993 972 950 931 912
(Dollars per ton, Sep.-Aug. year)
Price, 21%, IL points 89.56 93.39 96.62 96.39 94.86 94.28 94.51 94.44 94.56 94.08 93.00
CGF price/corn price 74% 73% 72% 72% 72% 71% 71% 71% 72% 71% 71%
Corn gluten meal (Thousand tons, Sep.-Aug. year)
Production 2,457 2,476 2,475 2,472 2,476 2,476 2,480 2,485 2,489 2,494 2,499
Domestic use 1,629 1,635 1,625 1,610 1,599 1,587 1,580 1,575 1,569 1,563 1,557
Net exports 828 841 850 862 876 889 899 909 920 931 942
(Dollars per ton, Sep.-Aug. year)
Price, 60%, IL points 477.67 474.51 479.89 476.26 464.86 459.66 460.14 462.59 465.21 463.45 459.82
CGM price/soymeal price 150% 151% 150% 151% 152% 152% 152% 152% 152% 152% 152%
(Million pounds, Oct.-Sep. year) Corn oil
Production 4,866 5,333 5,706 6,042 6,232 6,361 6,505 6,639 6,744 6,843 6,928
Domestic use 4,003 4,435 4,819 5,157 5,350 5,476 5,619 5,752 5,850 5,951 6,038
Biodiesel 1,266 1,559 1,814 2,058 2,257 2,339 2,452 2,547 2,594 2,700 2,749
Feed 740 888 1,065 1,175 1,301 1,343 1,369 1,418 1,475 1,466 1,505
Food/other 1,997 1,989 1,940 1,923 1,791 1,794 1,797 1,787 1,781 1,785 1,785
Net exports 876 876 873 871 873 876 878 880 885 886 887
Ending stocks 134 156 171 184 194 203 211 218 227 232 236
(Cents per pound, Oct.-Sep. year)
Chicago price 44.02 44.87 46.44 47.69 47.99 47.57 47.61 47.74 46.69 46.87 47.51
Corn oil price/soyoil price 126% 125% 124% 123% 123% 123% 123% 123% 124% 124% 123%
All projections are averages across 500 stochastic outcomes.

FAPRI-MU AMAP | 2017 U.S. Baseline
24
Wheat supply and use
June-May year 16/17 17/18 18/19 19/20 20/21 21/22 22/23 23/24 24/25 25/26 26/27
Area (Million acres)
Planted area 50.2 46.2 46.8 47.1 47.5 47.6 47.3 47.0 46.8 46.5 46.3
Harvested area 43.9 39.5 40.1 40.5 40.8 40.9 40.7 40.4 40.2 40.0 39.7
(Bushels per harvested acre)
Yield 52.6 45.9 46.2 46.6 47.0 47.3 47.6 47.9 48.2 48.5 48.9
(Million bushels)
Supply 3,411 3,114 2,995 2,950 2,927 2,923 2,920 2,918 2,922 2,924 2,927
Beginning stocks 976 1,175 1,013 928 874 851 846 847 848 848 848
Production 2,310 1,814 1,853 1,888 1,919 1,937 1,940 1,936 1,940 1,942 1,945
Imports 125 125 130 133 134 135 134 134 134 134 134
Domestic use 1,259 1,214 1,196 1,187 1,189 1,193 1,206 1,212 1,222 1,229 1,240
Feed and residual 234 182 159 144 139 137 142 142 145 146 151
Seed 63 64 65 65 65 65 65 65 65 64 64
Food and other 962 969 972 978 984 991 998 1,005 1,012 1,018 1,025
Exports 977 888 871 889 888 883 866 858 852 847 834
Total use 2,236 2,102 2,067 2,076 2,076 2,077 2,072 2,070 2,074 2,076 2,074
Ending stocks 1,175 1,013 928 874 851 846 847 848 848 848 853
CCC inventory 0 0 0 0 0 0 0 0 0 0 0
Under loan 66 41 36 33 33 33 33 34 34 34 36
Other stocks 1,109 971 893 841 818 813 814 815 814 814 817
Prices, program provisions (Dollars per bushel)
Farm price 3.79 4.44 4.90 5.15 5.20 5.20 5.13 5.14 5.11 5.09 5.02
Loan rate 2.94 2.94 2.94 2.94 2.94 2.94 2.94 2.94 2.94 2.94 2.94
Reference price 5.50 5.50 5.50 5.50 5.50 5.50 5.50 5.50 5.50 5.50 5.50
(Million acres)
Base area 63.4 63.3 63.3 63.3 63.3 63.3 63.3 63.3 63.3 63.3 63.3
(Bushels per acre)
PLC program yield 40.0 40.0 40.0 40.0 40.0 40.0 40.0 40.0 40.0 40.0 40.0
(Percent of base acres)
PLC participation rate 43.5 43.4 43.4 80.0 80.0 80.0 80.0 80.0 80.0 80.0 80.0
ARC participation rate 56.5 56.6 56.6 20.0 20.0 20.0 20.0 20.0 20.0 20.0 20.0
Returns and payments (Dollars)
Gross market revenue/a. 199.67 203.35 225.75 239.20 244.07 245.26 243.78 245.67 245.47 246.48 244.77
Variable expenses/a. 109.77 107.25 110.41 113.58 117.45 121.29 125.00 128.49 131.94 134.90 137.38
Market net return/a. 89.89 96.10 115.35 125.62 126.62 123.97 118.79 117.18 113.53 111.58 107.38
Marketing loan benefits/a.* 2.88 1.09 1.40 0.94 0.88 0.80 0.90 1.43 1.39 1.22 1.03
Payments to participants
PLC/base a.* 53.82 35.33 26.46 23.01 21.60 20.38 21.17 21.91 22.43 22.98 24.47
ARC/base a.* 20.48 16.35 9.99 7.68 7.54 8.04 8.07 8.44 8.61 8.87 9.25
Insurance net indemnities/a.* 1.61 9.99 11.32 12.49 13.16 13.38 13.54 13.56 13.74 14.05 14.16
*Marketing loan benefits and insurance net indemnities are averaged across all acres. PLC and ARC payments are per participating acre.
All projections are averages across 500 stochastic outcomes.

FAPRI-MU AMAP | 2017 U.S. Baseline
25
Sorghum supply and use
September-August year 16/17 17/18 18/19 19/20 20/21 21/22 22/23 23/24 24/25 25/26 26/27
Area (Million acres)
Planted area 6.69 6.92 6.93 6.91 6.91 6.92 6.93 6.95 6.96 6.96 6.97
Harvested area 6.16 6.19 6.21 6.20 6.20 6.19 6.22 6.23 6.23 6.23 6.24
(Bushels per harvested acre)
Yield 77.9 66.4 66.5 66.7 67.1 67.1 67.2 67.4 67.4 67.6 67.7
Supply and use (Million bushels)
Production 480 413 415 416 418 417 420 422 422 423 425
Imports 1 1 1 1 1 1 1 1 1 1 1
Domestic use 232 229 217 214 209 206 207 207 207 206 204
Exports 247 204 200 202 210 211 213 215 215 218 221
Ending stocks 39 20 19 19 19 21 21 22 23 24 25
Prices, returns and payments (Dollars)
Farm price/bu. 2.82 3.24 3.44 3.44 3.40 3.40 3.40 3.40 3.41 3.40 3.38
Reference price/bu. 3.95 3.95 3.95 3.95 3.95 3.95 3.95 3.95 3.95 3.95 3.95
Market net return/a. 90.48 83.25 94.86 91.73 87.60 82.48 78.90 75.14 71.44 68.46 64.04
Marketing loan benefits/a.* 0.00 1.05 1.26 1.23 1.09 1.33 1.19 1.57 1.15 1.03 1.02
Payments to participants
PLC/base a.* 55.58 38.81 33.48 35.16 35.66 34.58 35.42 35.03 35.03 36.06 36.43
ARC/base a.* 16.67 9.77 4.67 4.35 4.46 5.89 5.06 4.74 5.05 5.27 5.47
Insurance net indemnities/a.* -2.05 14.73 16.82 17.83 17.72 17.52 17.26 17.01 17.11 17.03 17.23
*Marketing loan benefits and insurance net indemnities are averaged across all acres. PLC and ARC payments are per participating acre.
All projections are averages across 500 stochastic outcomes.
Barley supply and use
June-May year 16/17 17/18 18/19 19/20 20/21 21/22 22/23 23/24 24/25 25/26 26/27
Area (Million acres)
Planted area 3.05 3.14 2.90 2.87 2.84 2.77 2.69 2.61 2.50 2.40 2.31
Harvested area 2.56 2.70 2.49 2.47 2.44 2.38 2.31 2.24 2.15 2.06 1.99
(Bushels per harvested acre)
Yield 77.9 71.7 72.8 73.6 74.5 75.3 76.4 77.3 78.4 79.4 80.4
Supply and use (Million bushels)
Production 199 194 182 182 182 179 176 174 169 164 160
Imports 17 23 27 25 24 28 31 33 37 41 45
Domestic use 208 208 206 201 198 198 197 197 197 197 197
Exports 6 10 9 10 10 10 9 9 8 7 7
Ending stocks 104 102 97 93 91 90 91 92 94 95 96
Prices, returns and payments (Dollars)
All barley farm price/bu. 4.87 4.61 4.74 4.84 4.86 4.85 4.83 4.78 4.74 4.69 4.59
Feed barley price/bu. 2.75 2.90 3.03 3.07 3.05 3.04 3.04 3.01 2.99 2.97 2.91
Reference price/bu. 4.95 4.95 4.95 4.95 4.95 4.95 4.95 4.95 4.95 4.95 4.95
Market net return/a. 212.19 162.36 175.06 181.85 181.99 178.65 176.83 171.56 167.51 163.59 157.03
Marketing loan benefits/a.* 0.00 1.34 2.26 2.06 1.94 1.82 2.32 2.38 2.65 2.55 2.58
Payments to participants
PLC/base a.* 3.91 23.56 22.76 20.66 19.94 19.43 20.23 21.54 22.88 24.27 25.80
ARC/base a.* 4.10 11.96 8.84 6.83 6.63 6.17 6.42 6.78 7.47 8.05 8.59
Insurance net indemnities/a.* 0.38 9.44 9.95 10.27 10.60 11.20 10.80 10.66 10.91 11.58 11.66
*Marketing loan benefits and insurance net indemnities are averaged across all acres. PLC and ARC payments are per participating acre.
All projections are averages across 500 stochastic outcomes.

FAPRI-MU AMAP | 2017 U.S. Baseline
26
Oats supply and use
June-May year 16/17 17/18 18/19 19/20 20/21 21/22 22/23 23/24 24/25 25/26 26/27
Area (Million acres)
Planted area 2.83 2.91 2.91 2.88 2.87 2.90 2.91 2.93 2.93 2.94 2.95
Harvested area 0.98 1.07 1.08 1.07 1.06 1.07 1.08 1.08 1.08 1.08 1.09
(Bushels per harvested acre)
Yield 66.0 65.2 65.7 66.2 66.8 67.1 67.6 67.9 68.3 68.7 69.1
Supply and use (Million bushels)
Production 65 70 71 71 71 72 73 74 74 75 76
Imports 90 91 92 92 92 91 91 91 90 90 89
Domestic use 163 163 163 161 160 161 161 161 161 161 161
2 2 2 2 2 2 2 2 2 2 2 Exports
Ending stocks 47 44 43 43 44 45 46 47 49 50 52
Prices, returns and payments (Dollars)
Farm price/bu. 2.00 2.16 2.27 2.28 2.29 2.28 2.29 2.28 2.28 2.28 2.26
Reference price/bu. 2.40 2.40 2.40 2.40 2.40 2.40 2.40 2.40 2.40 2.40 2.40
Market net return/a. 34.95 43.26 49.63 49.27 48.20 44.51 42.42 39.17 36.61 34.75 31.39
Marketing loan benefits/a.* 0.00 0.37 0.62 0.27 0.52 0.41 0.45 0.56 0.65 0.65 0.59
Payments to participants
PLC/base a.* 16.03 12.49 11.16 10.78 11.30 10.86 10.90 11.20 11.36 11.12 11.71
ARC/base a.* 8.28 5.99 3.17 1.96 1.69 1.50 1.65 1.74 1.82 1.85 1.91
Insurance net indemnities/a.* 0.95 1.26 1.55 1.63 1.58 1.61 1.54 1.52 1.58 1.58 1.58
*Marketing loan benefits and insurance net indemnities are averaged across all acres. PLC and ARC payments are per participating acre.
All projections are averages across 500 stochastic outcomes.

FAPRI-MU AMAP | 2017 U.S. Baseline
27
Rice supply and use
August-July year 16/17 17/18 18/19 19/20 20/21 21/22 22/23 23/24 24/25 25/26 26/27
Area (Million acres)
Planted area 3.15 2.92 3.01 2.98 2.97 2.99 3.02 3.02 3.02 3.04 3.04
Harvested area 3.10 2.88 2.97 2.94 2.92 2.95 2.97 2.98 2.98 2.99 3.00
(Pounds per harvested acre)
Yield 7,237 7,718 7,784 7,842 7,906 7,974 8,046 8,111 8,181 8,254 8,327
Supply and use (Million hundredweight)
Production 224.1 222.5 231.3 230.2 231.1 235.4 239.4 241.6 243.9 246.9 249.7
Imports 23.5 23.4 23.6 23.8 24.1 24.3 24.6 24.8 25.1 25.3 25.6
Domestic use 132.2 133.6 134.5 135.9 136.8 137.5 138.3 139.4 140.1 141.2 142.0
Exports 110.9 117.1 120.5 118.6 118.7 121.6 124.7 126.3 128.3 130.3 132.6
Ending stocks 51.0 46.2 46.1 45.6 45.3 46.0 46.9 47.6 48.0 48.8 49.5
Program provisions (Dollars per hundredweight)
Loan rate 6.50 6.50 6.50 6.50 6.50 6.50 6.50 6.50 6.50 6.50 6.50
Reference price
Long grain 14.00 14.00 14.00 14.00 14.00 14.00 14.00 14.00 14.00 14.00 14.00
Japonica 16.10 16.10 16.10 16.10 16.10 16.10 16.10 16.10 16.10 16.10 16.10
Other medium/short 14.00 14.00 14.00 14.00 14.00 14.00 14.00 14.00 14.00 14.00 14.00
Base area (Million acres)
Long grain 4.04 4.03 4.03 4.03 4.03 4.03 4.03 4.04 4.04 4.04 4.04
Medium/short 0.76 0.76 0.76 0.76 0.76 0.76 0.76 0.76 0.76 0.76 0.76
Countercyclical/PLC yield (Pounds per acre)
Long grain 4,779 4,779 4,779 4,779 4,778 4,779 4,779 4,779 4,779 4,779 4,779
Medium/short 6,697 6,691 6,684 6,682 6,682 6,682 6,683 6,683 6,683 6,683 6,682
PLC participation rate (Percent of base acres)
Long grain 99.8 99.8 99.8 99.8 99.8 99.8 99.8 99.8 99.8 99.8 99.8
Medium/short 69.2 69.3 69.3 69.4 69.4 69.4 69.4 69.4 69.4 69.4 69.4
ARC participation rate
Long grain 0.2 0.2 0.2 0.2 0.2 0.2 0.2 0.2 0.2 0.2 0.2
Medium/short 30.8 30.7 30.7 30.6 30.6 30.6 30.6 30.6 30.6 30.6 30.6
Prices, returns and payments (Dollars)
Farm price/cwt 10.23 11.38 11.54 11.42 11.61 11.86 12.09 12.14 12.40 12.43 12.61
Long grain 9.68 10.47 10.68 10.51 10.77 11.07 11.37 11.42 11.74 11.79 12.02
Japonica 14.00 16.82 17.04 17.12 17.12 17.27 17.37 17.42 17.51 17.52 17.53
Other medium/short 9.93 11.45 11.65 11.58 11.72 11.93 12.10 12.14 12.34 12.36 12.45
Gross market revenue/a. 740.20 878.25 898.48 895.57 917.63 945.33 973.17 984.94 1014.50 1026.26 1050.35
Variable expenses/a. 553.27 559.03 568.14 582.63 601.34 621.44 642.25 662.36 680.99 697.96 712.92
Market net return/a. 186.94 319.22 330.34 312.94 316.28 323.89 330.92 322.58 333.51 328.30 337.43
Marketing loan benefits/a.* 0.00 8.70 8.37 8.14 8.63 6.94 5.23 4.73 4.12 3.08 3.04
Payments to participants
PLC/base a.* 160.76 125.66 119.66 124.07 117.20 106.62 97.65 96.04 87.55 86.23 79.89
ARC/base a.* 107.25 40.81 37.87 27.92 26.77 28.58 28.84 29.36 27.82 29.46 31.74
Insurance net indemnities/a.* 19.26 14.26 14.85 15.03 15.04 15.18 15.43 15.59 15.71 15.94 16.07
*Marketing loan benefits and insurance net indemnities are averaged across all acres. PLC and ARC payments are per participating acre.
All projections are averages across 500 stochastic outcomes.

FAPRI-MU AMAP | 2017 U.S. Baseline
28

Oils
eeds

FAPRI-MU AMAP | 2017 U.S. Baseline
30
Soybeans and products
Soybean production broke the two
year old record in 2016. This was
achieved through both formerly
unachieved yields and area. A re-
turn to trend yields in 2017 would
reduce production, but a projected
new record for planted area of 87.1
million acres would keep it at high
levels. Soybean area is expected to
remain high throughout the projec-
tion period.
Despite record production, 2016/17
returns are expected to increase
from 2014/15 and 2015/16. High
yields combined with price strength
in the soybean market allow soy-
bean returns to exceed corn. This is
not expected to continue as corn
returns overtake soybeans starting
in 2017/18.
The spike in 2016/17 soybean re-
turns leads to a corresponding posi-
tive change in 2017 acreage. As
profits wane, acreage falls in subse-
quent years. However, average soy-
bean area remains at least 84 mil-
lion acres, greater than any year
prior to 2017.
3.00
3.25
3.50
3.75
4.00
4.25
4.50
1 0 / 1 1 1 2 / 1 3 1 4 / 1 5 1 6 / 1 7 1 8 / 1 9 2 0 / 2 1 2 2 / 2 3 2 4 / 2 5 2 6 / 2 7B
illio
n b
ush
els
September-August marketing year
Record soybean production in 2016
Production Total use
250
300
350
400
450
500
550
600
1 0 / 1 1 1 2 / 1 3 1 4 / 1 5 1 6 / 1 7 1 8 / 1 9 2 0 / 2 1 2 2 / 2 3 2 4 / 2 5 2 6 / 2 7
Do
llars
per
acr
e
September-August marketing year
2016/17 soybean returns surpass corn
Corn market net return Soybean market net return
70.0
72.5
75.0
77.5
80.0
82.5
85.0
87.5
90.0
2 0 1 0 2 0 1 2 2 0 1 4 2 0 1 6 2 0 1 8 2 0 2 0 2 0 2 2 2 0 2 4 2 0 2 6
Mill
ion
acr
es
Calendar year
2017 soybean plantings could be a record

FAPRI-MU AMAP | 2017 U.S. Baseline
31
The growing demand for soybeans
in China has largely been met by a
corresponding increase in Brazilian
exports. U.S. soybean exports re-
main flat on average in the baseline.
However, this is heavily dependent
on U.S. and Brazilian weather as
well as Chinese demand growth.
The large 2016 crop helps to push
projected 2016/17 soybean ending
stocks to the highest level since
2006/07. Soybean prices remain
strong in spite of large stockpiles
which keeps production strong in
2017 and beyond. As a result,
stocks are expected to slowly re-
gress from the recent peak.
Soybean oil for biodiesel had seen
stable growth for years. However,
much of the future growth in bio-
diesel is anticipated to come from
other fats and oils. Soybean oil food
consumption increases slightly with
population growth, as the decline in
per capita consumption slows.
50
100
150
200
250
300
350
400
450
1 0 / 1 1 1 2 / 1 3 1 4 / 1 5 1 6 / 1 7 1 8 / 1 9 2 0 / 2 1 2 2 / 2 3 2 4 / 2 5 2 6 / 2 7
Mill
ion
bu
shel
s
September-August marketing year
Soybean ending stocks jump sharply
0
2
4
6
8
10
12
14
16
1 0 / 1 1 1 2 / 1 3 1 4 / 1 5 1 6 / 1 7 1 8 / 1 9 2 0 / 2 1 2 2 / 2 3 2 4 / 2 5 2 6 / 2 7
Bill
ion
po
un
ds
October-September marketing year
Soybean oil for biodiesel use levels off
Domestic food use Biodiesel use Exports
1.0
1.5
2.0
2.5
3.0
3.5
1 0 / 1 1 1 2 / 1 3 1 4 / 1 5 1 6 / 1 7 1 8 / 1 9 2 0 / 2 1 2 2 / 2 3 2 4 / 2 5 2 6 / 2 7
Bill
ion
bu
shel
s
September-August marketing year
Soybean exports dependent on China and Brazil
U.S. net exports Brazilian net exports Chinese net imports

FAPRI-MU AMAP | 2017 U.S. Baseline
32
Peanuts
Market revenues are the product of yield and the marketing year aver-age price. Like many other crops, peanut market revenues have been steadily declining since 2012/13. However, peanut farm prices have fallen well below the reference price, creating large PLC payments. These payments are tied to base acres instead of planted acres. Producers enrolled 99.7 per-cent of peanut base acres in PLC.
Generic base acres are eligible for
the payments corresponding to the
crops grown on them. Peanuts have
been planted on many generic base
acres. In 2015 and 2016 total plant-
ings are at the highest levels since
2005 if 2012 is excluded.
Sunflower seed
Falling prices have pushed sunflow-
er seed market returns down. Varia-
ble expenses have also fallen, but
not to the same extent. The average
sunflower seed price in the baseline
is below the reference price thereby
generating steady PLC payments.
0
200
400
600
800
1000
1200
1400
1 0 / 1 1 1 2 / 1 3 1 4 / 1 5 1 6 / 1 7 1 8 / 1 9 2 0 / 2 1 2 2 / 2 3 2 4 / 2 5 2 6 / 2 7
Do
llars
per
acr
eAugust-July marketing year
Peanut PLC payments maintain margins
Market Program payments Variable expenses
050
100150200250300350400450500
1 0 / 1 1 1 2 / 1 3 1 4 / 1 5 1 6 / 1 7 1 8 / 1 9 2 0 / 2 1 2 2 / 2 3 2 4 / 2 5 2 6 / 2 7
Do
llars
per
acr
e
September-August marketing year
Sunflower market returns fall
Market Program payments Variable expenses
1.000
1.125
1.250
1.375
1.500
1.625
1.750
2 0 1 0 2 0 1 2 2 0 1 4 2 0 1 6 2 0 1 8 2 0 2 0 2 0 2 2 2 0 2 4 2 0 2 6
Mill
ion
acr
es
Calendar year
Peanut planted area

FAPRI-MU AMAP | 2017 U.S. Baseline
33
Other oilseeds
Average sunflower seed and canola
prices remain below the reference
price of 20.2 cents per pound. Can-
ola area in the U.S. has been in-
creasing sharply in the past five
years. Cottonseed prices average
10.0 cents per pound through the
projection period. This commodity
is not currently a program com-
modity eligible for PLC or ARC pay-
ments. Lower soybean prices keep
pressure on oilseed prices.
0
5
10
15
20
25
30
35
1 0 / 1 1 1 2 / 1 3 1 4 / 1 5 1 6 / 1 7 1 8 / 1 9 2 0 / 2 1 2 2 / 2 3 2 4 / 2 5 2 6 / 2 7
Cen
ts p
er p
ou
nd
Marketing year
Oilseed prices
Sunflower seed Canola Cottonseed
FAPRI-MU AMAP | 2017 U.S. Baseline
34
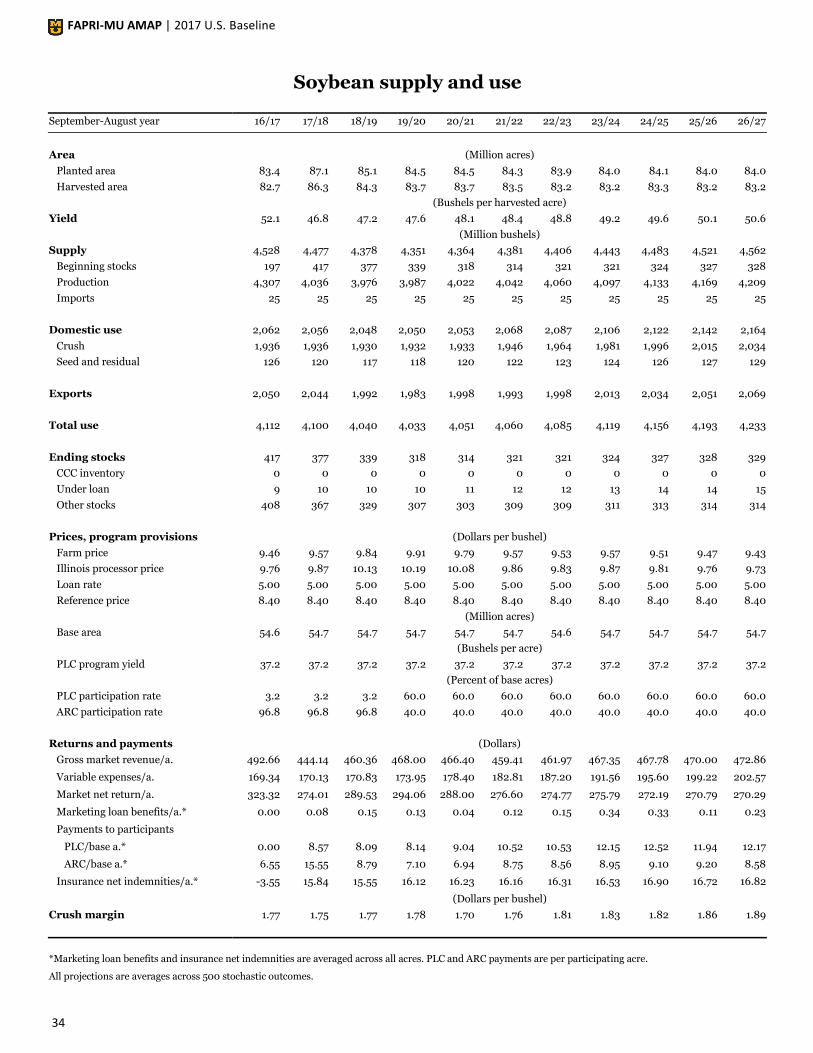
Soybean supply and use
September-August year 16/17 17/18 18/19 19/20 20/21 21/22 22/23 23/24 24/25 25/26 26/27
Area (Million acres)
Planted area 83.4 87.1 85.1 84.5 84.5 84.3 83.9 84.0 84.1 84.0 84.0
Harvested area 82.7 86.3 84.3 83.7 83.7 83.5 83.2 83.2 83.3 83.2 83.2
(Bushels per harvested acre)
Yield 52.1 46.8 47.2 47.6 48.1 48.4 48.8 49.2 49.6 50.1 50.6
(Million bushels)
Supply 4,528 4,477 4,378 4,351 4,364 4,381 4,406 4,443 4,483 4,521 4,562
Beginning stocks 197 417 377 339 318 314 321 321 324 327 328
Production 4,307 4,036 3,976 3,987 4,022 4,042 4,060 4,097 4,133 4,169 4,209
Imports 25 25 25 25 25 25 25 25 25 25 25
Domestic use 2,062 2,056 2,048 2,050 2,053 2,068 2,087 2,106 2,122 2,142 2,164
Crush 1,936 1,936 1,930 1,932 1,933 1,946 1,964 1,981 1,996 2,015 2,034
Seed and residual 126 120 117 118 120 122 123 124 126 127 129
Exports 2,050 2,044 1,992 1,983 1,998 1,993 1,998 2,013 2,034 2,051 2,069
Total use 4,112 4,100 4,040 4,033 4,051 4,060 4,085 4,119 4,156 4,193 4,233
Ending stocks 417 377 339 318 314 321 321 324 327 328 329
CCC inventory 0 0 0 0 0 0 0 0 0 0 0
Under loan 9 10 10 10 11 12 12 13 14 14 15
Other stocks 408 367 329 307 303 309 309 311 313 314 314
Prices, program provisions (Dollars per bushel)
Farm price 9.46 9.57 9.84 9.91 9.79 9.57 9.53 9.57 9.51 9.47 9.43
Illinois processor price 9.76 9.87 10.13 10.19 10.08 9.86 9.83 9.87 9.81 9.76 9.73
Loan rate 5.00 5.00 5.00 5.00 5.00 5.00 5.00 5.00 5.00 5.00 5.00
Reference price 8.40 8.40 8.40 8.40 8.40 8.40 8.40 8.40 8.40 8.40 8.40
(Million acres)
Base area 54.6 54.7 54.7 54.7 54.7 54.7 54.6 54.7 54.7 54.7 54.7
(Bushels per acre)
PLC program yield 37.2 37.2 37.2 37.2 37.2 37.2 37.2 37.2 37.2 37.2 37.2
(Percent of base acres)
PLC participation rate 3.2 3.2 3.2 60.0 60.0 60.0 60.0 60.0 60.0 60.0 60.0
ARC participation rate 96.8 96.8 96.8 40.0 40.0 40.0 40.0 40.0 40.0 40.0 40.0
Returns and payments (Dollars)
Gross market revenue/a. 492.66 444.14 460.36 468.00 466.40 459.41 461.97 467.35 467.78 470.00 472.86
Variable expenses/a. 169.34 170.13 170.83 173.95 178.40 182.81 187.20 191.56 195.60 199.22 202.57
Market net return/a. 323.32 274.01 289.53 294.06 288.00 276.60 274.77 275.79 272.19 270.79 270.29
Marketing loan benefits/a.* 0.00 0.08 0.15 0.13 0.04 0.12 0.15 0.34 0.33 0.11 0.23
Payments to participants
PLC/base a.* 0.00 8.57 8.09 8.14 9.04 10.52 10.53 12.15 12.52 11.94 12.17
ARC/base a.* 6.55 15.55 8.79 7.10 6.94 8.75 8.56 8.95 9.10 9.20 8.58
Insurance net indemnities/a.* -3.55 15.84 15.55 16.12 16.23 16.16 16.31 16.53 16.90 16.72 16.82
(Dollars per bushel)
Crush margin 1.77 1.75 1.77 1.78 1.70 1.76 1.81 1.83 1.82 1.86 1.89
*Marketing loan benefits and insurance net indemnities are averaged across all acres. PLC and ARC payments are per participating acre.
All projections are averages across 500 stochastic outcomes.

FAPRI-MU AMAP | 2017 U.S. Baseline
35
Soybean oil supply and use
October-September year 16/17 17/18 18/19 19/20 20/21 21/22 22/23 23/24 24/25 25/26 26/27
(Million pounds)
Supply 24,419 24,416 24,364 24,388 24,414 24,615 24,869 25,122 25,342 25,641 25,902
Beginning stocks 1,687 1,663 1,681 1,689 1,703 1,748 1,798 1,847 1,896 1,979 2,010
Production 22,458 22,479 22,408 22,424 22,437 22,592 22,796 23,000 23,171 23,387 23,617
Imports 275 275 275 275 275 275 275 275 275 275 275
Domestic use 20,600 20,794 20,940 20,940 20,870 20,950 21,091 21,077 21,304 21,384 21,402
Biodiesel 6,289 6,542 6,695 6,671 6,512 6,476 6,488 6,368 6,464 6,446 6,373
Food and other 14,311 14,252 14,246 14,269 14,358 14,474 14,603 14,709 14,840 14,938 15,029
Exports 2,157 1,942 1,735 1,745 1,796 1,868 1,931 2,149 2,059 2,246 2,476
Total use 22,757 22,735 22,675 22,685 22,666 22,817 23,021 23,226 23,363 23,630 23,878
Ending stocks 1,663 1,681 1,689 1,703 1,748 1,798 1,847 1,896 1,979 2,010 2,024
Price (Cents per pound)
Decatur 35.03 35.87 37.44 38.70 39.01 38.59 38.64 38.79 37.73 37.95 38.61
All projections are averages across 500 stochastic outcomes.
Soybean meal supply and use
October-September year 16/17 17/18 18/19 19/20 20/21 21/22 22/23 23/24 24/25 25/26 26/27
(Thousand tons)
Supply 46,137 46,449 46,312 46,343 46,375 46,702 47,121 47,542 47,893 48,336 48,809
Beginning stocks 264 291 297 297 303 311 317 320 323 326 329
Production 45,548 45,833 45,690 45,721 45,748 46,065 46,479 46,897 47,245 47,685 48,154
Imports 325 325 325 325 325 325 325 325 325 325 325
Domestic use 34,358 35,013 35,578 36,006 36,432 36,775 37,077 37,270 37,348 37,380 37,414
Exports 11,488 11,139 10,437 10,034 9,632 9,610 9,724 9,949 10,219 10,626 11,061
45,846 46,152 46,015 46,041 46,064 46,385 46,801 47,219 47,567 48,007 48,475 Total use
Ending stocks 291 297 297 303 311 317 320 323 326 329 333
Price (Dollars per ton)
Decatur, 48% protein 317.43 314.86 319.24 316.06 306.44 301.99 302.32 304.30 306.42 304.89 301.80
All projections are averages across 500 stochastic outcomes.

FAPRI-MU AMAP | 2017 U.S. Baseline
36
Peanut supply and use
August-July year 16/17 17/18 18/19 19/20 20/21 21/22 22/23 23/24 24/25 25/26 26/27
Area (Million acres)
Planted area 1.67 1.61 1.63 1.62 1.61 1.60 1.58 1.57 1.55 1.55 1.54
Harvested area 1.55 1.54 1.56 1.55 1.54 1.53 1.51 1.50 1.49 1.48 1.47
(Pounds per harvested acre)
Yield 3,675 3,943 4,001 4,060 4,117 4,171 4,222 4,272 4,325 4,377 4,432
(Million pounds) Supply and use
Production 5,685 6,076 6,245 6,283 6,331 6,383 6,375 6,393 6,439 6,492 6,522
Imports 110 100 100 100 100 100 100 100 100 100 100
Domestic use 4,567 4,666 4,761 4,834 4,893 4,952 4,983 5,022 5,051 5,093 5,128
Exports 1,354 1,374 1,423 1,452 1,469 1,478 1,479 1,475 1,470 1,471 1,473
Ending stocks 1,665 1,800 1,961 2,058 2,127 2,180 2,193 2,188 2,206 2,234 2,255
Prices, returns and payments (Dollars)
Farm price/ton 374.78 374.55 366.07 362.58 359.92 353.33 355.08 356.68 358.68 355.27 358.87
Reference price/ton 535.00 535.00 535.00 535.00 535.00 535.00 535.00 535.00 535.00 535.00 535.00
Market net return/a. 190.35 235.96 228.30 223.91 214.76 195.95 192.54 189.48 188.79 179.85 187.76
Marketing loan benefits/a.* 9.49 46.05 59.08 67.49 73.45 77.04 78.96 78.26 81.30 82.67 85.68
Payments to participants
PLC/base a.* 209.50 197.96 204.51 204.08 205.47 212.95 209.02 207.93 204.83 209.07 204.04
ARC/base a.* 76.52 61.42 57.39 52.60 50.90 55.14 58.94 59.71 59.01 61.44 60.59
*Marketing loan benefits and insurance net indemnities are averaged across all acres. PLC and ARC payments are per participating acre.
All projections are averages across 500 stochastic outcomes.
Sunflower seed supply and use
September-August year 16/17 17/18 18/19 19/20 20/21 21/22 22/23 23/24 24/25 25/26 26/27
Area (Million acres)
Planted area 1.60 1.61 1.56 1.52 1.51 1.50 1.50 1.50 1.50 1.49 1.48
1.53 1.51 1.46 1.42 1.41 1.40 1.40 1.40 1.40 1.39 1.38 Harvested area
(Pounds per harvested acre)
Yield 1,731 1,571 1,574 1,581 1,591 1,596 1,599 1,607 1,614 1,621 1,629
Supply and use (Million pounds)
Production 2,655 2,375 2,299 2,254 2,246 2,243 2,242 2,252 2,256 2,251 2,258
Imports 159 159 159 159 159 159 159 159 159 159 159
Domestic use 2,693 2,376 2,274 2,222 2,218 2,216 2,214 2,217 2,187 2,189 2,207
Exports 198 189 192 193 179 176 180 186 222 212 207
Ending stocks 335 304 295 292 301 309 315 323 329 338 341
Prices, returns and payments (Dollars)
Farm price/lb. 0.169 0.174 0.175 0.177 0.175 0.173 0.173 0.172 0.172 0.168 0.169
Market net return/a. 152.40 131.19 133.71 137.59 133.95 127.38 124.27 121.43 118.64 111.57 110.80
Marketing loan benefits/a.* 0.00 0.06 0.07 0.13 0.12 0.44 0.34 0.21 0.57 0.44 0.61
Payments to participants
PLC/base a.* 33.78 31.04 29.92 28.38 30.85 32.09 32.21 32.78 33.37 36.19 36.08
ARC/base a.* 7.29 10.70 9.43 10.38 11.05 11.61 10.27 10.36 10.48 11.61 11.29
*Marketing loan benefits and insurance net indemnities are averaged across all acres. PLC and ARC payments are per participating acre.
All projections are averages across 500 stochastic outcomes.

FAPRI-MU AMAP | 2017 U.S. Baseline
37
Cottonseed and canola production and prices
Marketing year 16/17 17/18 18/19 19/20 20/21 21/22 22/23 23/24 24/25 25/26 26/27
Production (Thousand tons, Aug.-Jul. year)
Cottonseed 5,418 5,168 5,181 5,212 5,120 5,120 5,143 5,149 5,198 5,272 5,337
(Million pounds, Jul.-Jun. year)
Canola 3,075 2,947 2,911 2,895 2,902 2,906 2,911 2,929 2,946 2,962 2,983
Prices (Dollars per ton, Aug.-Jul. year)
Cottonseed 193 196 202 203 203 201 201 201 200 199 197
Canola (Cents per pound, Jul.-Jun. year)
Farm price 16.2 16.2 16.5 16.8 16.8 16.5 16.5 16.5 16.4 16.2 16.2
Reference price 20.2 20.2 20.2 20.2 20.2 20.2 20.2 20.2 20.2 20.2 20.2
Cottonseed production, cottonseed prices and canola farm prices are averages across 500 stochastic outcomes.

FAPRI-MU AMAP | 2017 U.S. Baseline
38

Oth
er cr
ops

FAPRI-MU AMAP | 2017 U.S. Baseline
40
Upland cotton
China continues to be the main
source of uncertainty in world cot-
ton markets. Policy choices have
led to very large Chinese stocks,
which are over one year’s worth of
domestic use. This inventory has
hung over world prices for several
years. Recently, China has begun a
drawdown of stocks which has
helped alleviate the low prices.
The pressure on upland cotton
prices led to tight margins for cot-
ton producers for the past several
years. For example, 2015/16 mar-
ket revenues less variable costs
were $65 per acre. The recent price
strength helps to improve returns
in the projection period, although
on average they never reach
2013/14 levels. Upland cotton is
not a Title I commodity which pre-
cludes it from ARC and PLC pay-
ments. It can still receive market-
ing loan benefits and has a special
insurance policy. These do help
operating margins, although they
are expected to remain tight.
Cotton acreage declined sharply
from 2011 to 2015 as cotton returns
were weak relative to competing
crops. Stronger relative returns re-
sult in more cotton acreage in 2016
and 2017. Texas accounted for 57
percent of the upland cotton area
planted in the U.S. for 2016. Deci-
sions by producers in that state
have a strong influence on national
totals.
8
9
10
11
12
13
14
15
2 0 1 0 2 0 1 2 2 0 1 4 2 0 1 6 2 0 1 8 2 0 2 0 2 0 2 2 2 0 2 4 2 0 2 6
Mill
ion
acr
es
Calendar year
Upland cotton planted area driven by returns
30
50
70
90
110
130
150
1 0 / 1 1 1 2 / 1 3 1 4 / 1 5 1 6 / 1 7 1 8 / 1 9 2 0 / 2 1 2 2 / 2 3 2 4 / 2 5 2 6 / 2 7C
ents
per
po
un
dAugust-July marketing year
Upland cotton prices experience some recovery
Farm price Adjusted world price Loan rate
400
500
600
700
800
900
1000
1100
1 0 / 1 1 1 2 / 1 3 1 4 / 1 5 1 6 / 1 7 1 8 / 1 9 2 0 / 2 1 2 2 / 2 3 2 4 / 2 5 2 6 / 2 7
Do
llars
per
acr
e
August-July marketing year
Upland cotton returns reflect price improvement
Market Program payments Ins. net indemnities Variable expenses

FAPRI-MU AMAP | 2017 U.S. Baseline
41
Sugar
Raw and refined sugar prices in-
crease modestly in 2017/18 to 29
and 34 cents per pound, respective-
ly, before leveling off beyond the
2018/19 marketing year. Average
prices remain above the loan rates
but are well below the prices expe-
rienced in 2010/11.
Domestic sugar use in total is pro-
jected to reach 13.3 million tons by
2026/27. Sugar imports remain
fairly flat assuming no major
changes to current trade policy.
This leaves rising domestic produc-
tion to fill consumer demand.
Per capita sugar demand is esti-
mated to rise over the projection
period. The increase in sugar use
per capita comes at the expense of
high fructose corn syrup (HFCS),
which is projected to decrease
slightly.
0
10
20
30
40
50
60
1 0 / 1 1 1 2 / 1 3 1 4 / 1 5 1 6 / 1 7 1 8 / 1 9 2 0 / 2 1 2 2 / 2 3 2 4 / 2 5 2 6 / 2 7
Cen
ts p
er p
ou
nd
October-September marketing year
Sugar prices hold steady
Raw cane sugar Refined beet sugar
0
2
4
6
8
10
12
14
16
1 0 / 1 1 1 2 / 1 3 1 4 / 1 5 1 6 / 1 7 1 8 / 1 9 2 0 / 2 1 2 2 / 2 3 2 4 / 2 5 2 6 / 2 7
Mill
ion
to
ns
October-September marketing year
Sugar supply keeping pace with domestic use
Production Net imports Domestic use
0
20
40
60
80
100
120
140
160
1 0 / 1 1 1 2 / 1 3 1 4 / 1 5 1 6 / 1 7 1 8 / 1 9 2 0 / 2 1 2 2 / 2 3 2 4 / 2 5 2 6 / 2 7
Po
un
ds
per
per
son
October-September marketing year
Per capita sugar use increases modestly
Sugar HFCS

FAPRI-MU AMAP | 2017 U.S. Baseline
42
Potato, fresh vegetables, fruits
and nuts
Since a peak in marketing year
2012/13, potato area planted has
been on a downward trend. Area
planted declined by three percent
in 2016/17 compared to the previ-
ous year, and is expected to decline
slightly in 2017/18. Despite a
steady decline in domestic con-
sumption since 2012/13, strong
exports are expected to keep pro-
jected potato prices around $9 per
hundredweight.
Total cash receipts for fresh vegeta-
bles and melons continue to in-
crease steadily. Cash receipts for
2016 are estimated at $18.7 billion.
Imports remain strong in response
to growth in domestic consump-
tion. While area planted has been
on a decline since 2000, higher
yield keeps production stable.
Cash receipts for fruits and nuts for
2016 were estimated at $25.2 bil-
lion. Domestic consumption con-
tinues to increase, leading to
strong growth in imports. Expected
near-record almond production in
2016/17 may put downward pres-
sure on almond prices and cash
receipts. The projected cash re-
ceipts for the industry, however,
are still uncertain as they depend
on how other fruit and tree nut
crops perform.
20
22
24
26
28
30
32
34
2010 2012 2014 2016 2018 2020 2022 2024 2026
Bill
ion
do
llars
Calendar year
Fruit and nuts cash receipts far below 2014 peak
14
16
18
20
22
24
2010 2012 2014 2016 2018 2020 2022 2024 2026
Bill
ion
do
llars
Calendar year
Fresh vegetable and melon cash receipts rising
0.0
0.2
0.4
0.6
0.8
1.0
1.2
10/11 12/13 14/15 16/17 18/19 20/21 22/23 24/25 26/27M
illio
n a
cres
August-July marketing year
Potato area planted continues to decline

FAPRI-MU AMAP | 2017 U.S. Baseline
43
Hay
Some recovery in hay prices is ex-
pected to start in 2017/18 as cattle
numbers increase. The change in
prices entices some acres back into
hay that had left with falling prices.
The increase levels out in 2019 and
remains flat thereafter.
52
53
54
55
56
57
58
59
60
2 0 1 0 2 0 1 2 2 0 1 4 2 0 1 6 2 0 1 8 2 0 2 0 2 0 2 2 2 0 2 4 2 0 2 6
Mill
ion
acr
es
Some recovery expected in hay harvested area

FAPRI-MU AMAP | 2017 U.S. Baseline
44
Upland cotton supply and use
August-July year 16/17 17/18 18/19 19/20 20/21 21/22 22/23 23/24 24/25 25/26 26/27
Area (Million acres)
Planted area 9.88 10.47 10.49 10.43 10.21 10.13 10.09 10.04 10.06 10.09 10.16
Harvested area 9.33 8.93 8.93 8.89 8.69 8.63 8.61 8.55 8.57 8.62 8.66
(Pounds per harvested acre)
Yield 844 820 827 837 844 851 858 866 875 884 892
(Million bales)
Supply 20.08 20.27 20.61 20.80 20.77 20.84 20.95 21.00 21.16 21.37 21.59
Beginning stocks 3.66 4.98 5.17 5.25 5.46 5.49 5.51 5.52 5.51 5.46 5.45
Production 16.40 15.29 15.43 15.54 15.30 15.34 15.43 15.48 15.65 15.91 16.13
Imports 0.01 0.01 0.01 0.01 0.01 0.01 0.01 0.01 0.01 0.01 0.01
Domestic mill use 3.29 3.21 3.17 3.17 3.17 3.18 3.19 3.19 3.18 3.17 3.16
Exports 11.81 11.89 12.20 12.17 12.10 12.15 12.25 12.31 12.52 12.75 12.99
Total use 15.10 15.10 15.37 15.34 15.28 15.33 15.44 15.50 15.71 15.92 16.15
Ending stocks 4.98 5.17 5.25 5.46 5.49 5.51 5.52 5.51 5.46 5.45 5.44
CCC inventory 0.00 0.00 0.00 0.00 0.00 0.00 0.00 0.00 0.00 0.00 0.00
Other stocks 4.98 5.17 5.25 5.46 5.49 5.51 5.52 5.51 5.46 5.45 5.44
Prices, program provisions (Cents per pound)
Farm price 66.7 63.3 63.7 62.3 62.2 62.4 63.3 64.1 65.4 66.2 67.4
Adjusted world price 59.9 56.1 56.8 55.4 55.4 55.7 56.8 57.9 59.5 60.5 62.2
Loan rate 52.0 49.4 52.0 51.1 50.4 50.2 50.2 50.0 50.3 50.5 50.7
(Dollars per ton)
Cottonseed price 192.63 195.92 201.75 202.72 202.84 200.92 200.66 200.83 199.56 198.64 197.17
(Million acres)
Base area n.a. n.a. n.a. n.a. n.a. n.a. n.a. n.a. n.a. n.a. n.a.
Returns and payments (Dollars)
Gross market revenue/a. 674.15 630.23 640.13 636.47 641.04 646.21 659.52 671.69 689.16 702.65 719.98
Variable expenses/a. 497.62 505.45 507.01 515.61 530.32 545.34 562.43 580.41 596.89 611.47 624.29
Market net return/a. 176.52 124.78 133.12 120.87 110.73 100.87 97.09 91.28 92.27 91.18 95.69
Marketing loan benefits/a.* 0.00 30.08 39.80 43.47 39.99 35.70 33.83 32.53 25.37 26.94 22.55
Insurance net indemnities/a. 13.09 50.96 52.69 51.07 52.60 52.99 53.33 54.08 55.47 56.71 58.88
*Marketing loan benefits, transition payments and insurance net indemnities are averaged across all acres. All projections are averages across 500 stochastic outcomes.

FAPRI-MU AMAP | 2017 U.S. Baseline
45
Sugar supply and use
October-September year 15/16 16/17 17/18 18/19 19/20 20/21 21/22 22/23 23/24 24/25 25/26
Area (Million acres)
Sugar cane harvested 0.866 0.880 0.901 0.909 0.905 0.901 0.893 0.887 0.882 0.877 0.872
Sugar beet planted 1.163 1.236 1.280 1.286 1.278 1.285 1.287 1.297 1.304 1.313 1.321
Sugar beet harvested 1.126 1.212 1.255 1.262 1.254 1.260 1.263 1.272 1.279 1.288 1.295
Yield (Tons per harvested acre)
Cane sugar 4.49 4.43 4.45 4.48 4.51 4.53 4.55 4.57 4.60 4.62 4.64
Beet sugar 4.82 4.50 4.58 4.66 4.75 4.82 4.90 4.98 5.07 5.16 5.25
Supply and use (Thousand tons)
Production 9,318 9,351 9,756 9,956 10,031 10,153 10,248 10,386 10,543 10,700 10,854
Cane sugar 3,891 3,898 4,012 4,077 4,081 4,080 4,059 4,052 4,054 4,053 4,050
Beet sugar 5,427 5,453 5,744 5,879 5,950 6,074 6,190 6,334 6,489 6,647 6,804
Imports 2,646 2,598 2,633 2,580 2,597 2,631 2,661 2,655 2,627 2,601 2,583
Domestic use 12,087 12,184 12,324 12,486 12,584 12,736 12,864 12,998 13,129 13,258 13,393
Exports 34 31 31 30 29 29 27 26 25 24 24
Ending stocks 1,897 1,631 1,665 1,686 1,701 1,720 1,738 1,757 1,773 1,791 1,811
Prices (Cents per pound)
N.Y. spot raw sugar 28.07 28.52 29.22 28.79 29.06 28.87 29.06 29.13 29.26 29.35 29.32
32.12 32.68 33.60 32.94 33.25 32.93 33.13 33.18 33.29 33.36 33.26 Refined beet sugar
All projections are averages across 500 stochastic outcomes.
Hay supply and use
May-April year 16/17 17/18 18/19 19/20 20/21 21/22 22/23 23/24 24/25 25/26 26/27
(Million acres)
Harvested area 53.5 54.5 55.6 55.9 56.1 56.1 56.0 56.0 55.9 55.9 55.9
(Tons per acre)
Yield 2.52 2.41 2.42 2.43 2.44 2.45 2.46 2.46 2.47 2.47 2.48
Supply and use (Million tons)
Production 134.8 131.1 134.5 135.9 136.8 137.3 137.6 137.8 137.9 138.2 138.5
Disappearance 130.1 128.4 129.7 130.8 131.3 131.7 131.9 132.0 132.1 132.2 132.4
Ending stocks 25.1 23.0 23.0 23.2 23.6 24.0 24.3 24.7 24.9 25.3 25.6
(Dollars per ton)
131.75 146.35 150.78 151.61 151.84 150.30 150.25 149.97 150.04 150.31 149.53 All hay farm price
All projections are averages across 500 stochastic outcomes.

FAPRI-MU AMAP | 2017 U.S. Baseline
46
Potato supply and utilization
August-July year 16/17 17/18 18/19 19/20 20/21 21/22 22/23 23/24 24/25 25/26 26/27
Area (Thousand acres)
Planted area 1,034 1,023 998 993 969 964 942 939 918 917 897
Harvested area 1,008 1,009 984 979 955 951 929 926 906 905 885
(Hundredweight per harvested acre)
Yield 437 436 440 445 450 455 459 464 469 474 478
(Million hundredweight)
Supply 494 493 488 491 487 490 486 490 486 490 487
Production 441 439 433 435 430 432 427 430 425 428 423
Imports 53 54 55 56 57 58 59 60 61 62 63
Domestic use 442 436 429 430 423 424 417 418 411 413 406
Exports 75 76 78 81 83 86 89 91 94 97 100
Total use 517 513 508 511 506 510 505 509 506 510 506
Prices (Dollars per hundredweight)
Farm price 8.90 9.02 9.20 9.00 9.27 9.12 9.41 9.23 9.50 9.28 9.55
(Percent of acreage)
Crop insurance participation 81.2 81.2 81.2 81.2 81.2 81.2 81.2 81.2 81.2 81.2 81.2
Returns and payments (Dollars)
Gross market revenue/a. 3,889 3,929 4,052 4,004 4,171 4,146 4,321 4,284 4,454 4,398 4,572
Variable expenses/a. 2,228 2,273 2,318 2,365 2,412 2,460 2,509 2,559 2,611 2,663 2,716
Market net return/a. 1,661 1,656 1,734 1,639 1,759 1,686 1,812 1,725 1,844 1,735 1,856
Premium subsidy/a. 62 65 66 69 68 71 71 74 73 77 75
Fresh vegetable supply and utilization
2016 2017 2018 2019 2020 2021 2022 2023 2024 2025 2026
Area (Million acres)
Planted area 2.69 2.65 2.62 2.59 2.57 2.55 2.53 2.51 2.48 2.46 2.44
Harvested area 2.57 2.54 2.51 2.49 2.47 2.45 2.43 2.41 2.39 2.37 2.35
(Quantity index per acre)
Yield 50 50 51 51 52 53 54 54 55 56 56
(Quantity index)
Supply 209 207 210 213 216 219 222 225 227 230 233
Production 128 127 128 128 129 129 130 131 132 132 133
Imports 81 80 82 85 87 89 91 94 96 98 101
Domestic use 185 183 185 188 190 193 196 198 200 203 205
Exports 24 24 24 25 25 26 26 27 27 28 28
Total use 209 207 210 213 216 219 222 225 227 230 233
Prices (Price index, 2011=100)
Producer price 102 108 110 112 114 115 117 118 120 122 124
Cash receipts (Million dollars)
Vegetables 13,128 13,782 14,085 14,376 14,648 14,927 15,215 15,504 15,802 16,103 16,398
Other vegetables 5,641 5,653 5,667 5,680 5,691 5,702 5,713 5,723 5,735 5,746 5,757
Total receipts 18,770 19,435 19,752 20,056 20,339 20,629 20,928 21,227 21,537 21,849 22,155

FAPRI-MU AMAP | 2017 U.S. Baseline
47
Non-citrus fruit supply and utilization
2016 2017 2018 2019 2020 2021 2022 2023 2024 2025 2026
(Million acres)
Bearing area 2.06 2.05 2.05 2.05 2.04 2.04 2.04 2.04 2.03 2.03 2.03
(Quantity index per acre)
Yield 57 67 68 69 70 71 72 73 74 75 76
(Quantity index)
Supply 188 211 215 219 223 228 232 236 240 244 249
Production 117 137 138 140 142 144 146 148 149 151 153
Imports 71 74 76 79 81 84 86 88 91 93 95
Domestic use 162 184 188 192 195 199 202 205 209 212 215
Exports 3,356 2,998 3,072 3,154 3,221 3,301 3,395 3,494 3,608 3,728 3,845
Total use 3,518 3,182 3,260 3,345 3,416 3,499 3,597 3,700 3,817 3,940 4,060
Prices (Price index, 1982=100)
Producer price 127 113 114 115 114 114 114 114 114 115 115
Cash receipts (Million dollars)
Non-citrus fruits 14,890 15,427 15,772 16,074 16,234 16,407 16,621 16,836 17,107 17,395 17,662
Other fruits 10,216 10,598 10,807 10,978 11,021 11,075 11,168 11,260 11,403 11,561 11,701
Total receipts 25,106 26,025 26,579 27,052 27,254 27,482 27,789 28,097 28,510 28,956 29,363

FAPRI-MU AMAP | 2017 U.S. Baseline
48

Bio
fuel
s

FAPRI-MU AMAP | 2017 U.S. Baseline
50
Ethanol
Ethanol rack prices are projected
to increase slowly, eventually
reaching $2.00 per gallon by 2026.
As corn prices remain flat through
the period, dry-mill net returns
experience modest gains.
Rising net returns lead to contin-
ued growth in ethanol production.
Conventional ethanol production is
projected to reach nearly 17 billion
gallons by 2026, with non-corn
sources adding an additional 0.4
billion gallons. Domestic ethanol
disappearance sees some growth
initially before leveling off around
15 billion gallons.
In order to meet rising RFS re-
quirements, there is a substitution
toward higher level ethanol blends
(e.g. E15 and E85) at the expense
of E10. As a result, the average in-
clusion rate of ethanol increases
beyond the 10 percent level as early
as 2018 and remains higher
through the projection period.
-3.00
-2.00
-1.00
0.00
1.00
2.00
3.00
2 0 1 0 2 0 1 2 2 0 1 4 2 0 1 6 2 0 1 8 2 0 2 0 2 0 2 2 2 0 2 4 2 0 2 6D
olla
rs p
er g
allo
n
Ethanol net returns recover slowly...
Ethanol revenue Corn cost Net returns, dry-mill
0
5
10
15
20
2 0 1 0 2 0 1 2 2 0 1 4 2 0 1 6 2 0 1 8 2 0 2 0 2 0 2 2 2 0 2 4 2 0 2 6
Bill
ion
gal
lon
s
...leading to rising ethanol production
Corn starch ethanol Other ethanol Disappearance
0
5
10
15
20
2 0 1 0 2 0 1 2 2 0 1 4 2 0 1 6 2 0 1 8 2 0 2 0 2 0 2 2 2 0 2 4 2 0 2 6
Bill
ion
gal
lon
s
Growth in ethanol blend rates beyond 10%
10% blends Beyond 10% blends 10% blend level

FAPRI-MU AMAP | 2017 U.S. Baseline
51
The increasing gap between etha-
nol supply and domestic disap-
pearance implies additional growth
in ethanol exports. Export demand
is also supported by rising crude oil
prices. Ethanol imports remain low
as the RFS requirements for ad-
vanced biofuels are expected to be
met with additional biomass-based
diesel.
Biomass-based diesel
The expired blenders tax credit for
biodiesel and rising soybean oil
prices more than offset a slight rise
in biodiesel prices in the first year
of the projection, which leads to a
slight dip in 2017 net returns. Net
returns recover in later years, even-
tually reaching $0.29 per gallon by
2026.
As biodiesel prices recover, bio-
diesel production increases, in to-
tal, to over 2.5 billion gallons. Bio-
diesel production from soybean oil
remains fairly level, with modest
growth in biodiesel from corn oil,
other fats and oils, and renewable
diesel.
0.0
0.5
1.0
1.5
2.0
2.5
3.0
2 0 1 0 2 0 1 2 2 0 1 4 2 0 1 6 2 0 1 8 2 0 2 0 2 0 2 2 2 0 2 4 2 0 2 6
Bill
ion
gal
lon
s
Ethanol exports continue upward trend
Imports Exports
-6.00
-4.00
-2.00
0.00
2.00
4.00
6.00
2 0 1 0 2 0 1 2 2 0 1 4 2 0 1 6 2 0 1 8 2 0 2 0 2 0 2 2 2 0 2 4 2 0 2 6
Do
llars
per
gal
lon
Biodiesel prices recover relative to soybean oil
Biodiesel revenue Soybean oil cost Net returns
0.0
0.5
1.0
1.5
2.0
2.5
3.0
3.5
2 0 1 0 2 0 1 2 2 0 1 4 2 0 1 6 2 0 1 8 2 0 2 0 2 0 2 2 2 0 2 4 2 0 2 6
Bill
ion
gal
lon
s
Biodiesel production increases steadily
Soybean oil Corn oil Other fats and oils
Renewable diesel Cellulosic diesel Domestic use

FAPRI-MU AMAP | 2017 U.S. Baseline
52
Biomass-based diesel imports rose
sharply in 2016, and we project a
small increase in 2017 before im-
ports level out just below 0.8 bil-
lion gallons per year. Biodiesel ex-
ports have remained fairly flat the
last few years and are expected to
remain flat for the projection peri-
od. The status of the biodiesel
blenders credit remains a key un-
certainty and could change the
trade situation dramatically.
Renewable Fuel Standard
In 2016, biomass-based diesel (D4)
RIN generation exceeded its RFS
requirement for by a sizable mar-
gin. We project this gap to increase
slightly in 2017 and grow slightly
each year after, eventually reaching
nearly 1 billion RINs. These excess
RINs are projected to be applied
toward the broader RFS require-
ments.
In recent years, D4 and D5 RIN
prices have been within a few cents
of each other. Going forward, we
project those prices to remain
equivalent as the excess D4 RINs
are used to meet the D5 require-
ments. As markets adjust to rising
RFS requirements, the RIN prices
decline.
0.0
0.2
0.4
0.6
0.8
1.0
2 0 1 0 2 0 1 2 2 0 1 4 2 0 1 6 2 0 1 8 2 0 2 0 2 0 2 2 2 0 2 4 2 0 2 6B
illio
n g
allo
ns
Biodiesel imports remain strong
Imports Exports
0
1
2
3
4
5
2 0 1 2 2 0 1 4 2 0 1 6 2 0 1 8 2 0 2 0 2 0 2 2 2 0 2 4 2 0 2 6
Bill
ion
RIN
s
Biomass-based diesel RINs exceed RFS mandates
Biomass-based diesel RFS requirement Biomass-based diesel RIN generation
0.00
0.25
0.50
0.75
1.00
1.25
1.50
2 0 1 2 2 0 1 4 2 0 1 6 2 0 1 8 2 0 2 0 2 0 2 2 2 0 2 4 2 0 2 6
Do
llars
per
RIN
RIN prices decline gradually beyond 2019
Conventional (D6) Advanced (D5) Biodiesel (D4)

FAPRI-MU AMAP | 2017 U.S. Baseline
53
Ethanol supply and use
Calendar year
2016 2017 2018 2019 2020 2021 2022 2023 2024 2025 2026
Petroleum fuel prices (Dollars per barrel)
Petroleum, W. Texas Interm. 43.17 53.20 55.64 62.30 69.33 76.59 83.81 90.52 96.66 102.24 106.74
Petroleum, refiners' acquis. 40.05 47.89 50.64 57.35 64.66 72.02 79.16 85.83 91.80 97.29 102.00
(Dollars per gallon) Unl. gasoline, FOB Omaha 1.56 1.78 1.85 2.02 2.23 2.43 2.64 2.83 2.98 3.13 3.25
Unleaded gasoline, retail 2.14 2.36 2.39 2.55 2.75 2.95 3.16 3.34 3.50 3.64 3.77
(Million gallons)
Motor gasoline use* 143,664 144,261 144,451 144,481 144,283 143,695 142,779 141,670 140,535 139,470 138,543
Ethanol supply and use Production 15,255 15,550 15,896 15,862 15,920 16,042 16,230 16,474 16,734 17,042 17,333
From corn 14,927 15,203 15,542 15,517 15,579 15,702 15,884 16,118 16,366 16,662 16,943
Other conventional 325 337 332 322 316 312 315 323 333 341 349
Cellulosic 3 11 21 23 26 28 30 33 36 38 42
Imports 57 111 116 141 140 128 120 128 117 112 115
Domestic disappearance 14,306 14,572 14,799 14,797 14,781 14,760 14,766 14,791 14,814 14,861 14,929
Exports 1,041 1,119 1,237 1,228 1,298 1,427 1,598 1,822 2,045 2,297 2,521
Ending stocks 865 836 812 790 771 754 741 730 723 718 716
Ethanol prices (Dollars per gallon)
Conventional rack, Omaha 1.55 1.68 1.76 1.79 1.81 1.81 1.85 1.90 1.94 1.97 1.99
Other advanced rack 1.63 1.88 1.98 2.28 2.35 2.37 2.40 2.40 2.40 2.39 2.42
Effective retail 1.31 1.40 1.39 1.60 1.69 1.78 1.90 1.99 2.06 2.13 2.18
Ethanol/gasoline retail 61% 59% 58% 63% 61% 60% 60% 60% 59% 59% 58%
RIN values
Conventional ethanol 0.82 0.87 0.91 0.72 0.64 0.55 0.47 0.42 0.39 0.36 0.32
Advanced ethanol 0.90 1.07 1.14 1.22 1.19 1.11 1.01 0.93 0.85 0.78 0.75
* Includes fuel ethanol All projections are averages across 500 stochastic outcomes.
Renewable Fuel Standard
Calendar year 2016 2017 2018 2019 2020 2021 2022 2023 2024 2025 2026
Applicable percent standard
Overall 10.10% 10.70% 10.80% 10.90% 11.00% 11.10% 11.20% 11.30% 11.40% 11.50% 11.60%
Advanced biofuels 2.01% 2.38% 2.43% 2.48% 2.53% 2.58% 2.63% 2.68% 2.73% 2.78% 2.83%
Cellulosic biofuel 0.13% 0.17% 0.22% 0.27% 0.32% 0.37% 0.42% 0.47% 0.52% 0.57% 0.62%
Biomass-based diesel 1.59% 1.67% 1.70% 1.72% 1.75% 1.77% 1.80% 1.82% 1.85% 1.87% 1.90%
Required volume (Million gallons)
Overall 18,292 19,347 19,456 19,561 19,660 19,749 19,830 19,905 19,981 20,058 20,138
Advanced biofuels 3,640 4,347 4,456 4,561 4,660 4,749 4,830 4,905 4,981 5,058 5,138
Cellulosic biofuel 162 171 183 187 191 195 199 203 207 212 217
Biomass-based diesel 2,882 3,053 3,111 3,166 3,217 3,261 3,299 3,334 3,369 3,405 3,444
14,651 15,000 15,000 15,000 15,000 15,000 15,000 15,000 15,000 15,000 15,000 Gaps: Conventional
Advanced 596 1,123 1,162 1,208 1,252 1,294 1,332 1,368 1,405 1,441 1,478

FAPRI-MU AMAP | 2017 U.S. Baseline
54
Biomass-based diesel sector
Calendar year 2016 2017 2018 2019 2020 2021 2022 2023 2024 2025 2026
Biomass-based diesel supply (Million gallons)
Production 1,906 2,062 2,181 2,290 2,347 2,363 2,410 2,450 2,453 2,519 2,538
From soybean oil 775 831 856 875 861 837 840 841 820 843 833
From corn oil 164 202 236 267 293 304 318 331 337 351 357
From other fats and oils 612 640 675 708 731 743 760 774 782 801 813
From cellulosic diesel 1 1 1 2 2 3 3 4 4 5 5
Renewable diesel 354 388 414 438 460 476 488 500 510 519 529
Net imports 551 712 662 664 653 681 667 652 679 648 660
Biomass-based diesel use
Domestic disappearance 2,431 2,760 2,835 2,950 2,997 3,042 3,076 3,101 3,132 3,166 3,198
Ending stocks 186 200 208 213 216 217 218 219 219 220 221
Fuel prices and tax credit (Dollars per gallon)
Biodiesel, rack 3.22 3.41 3.52 3.66 3.75 3.77 3.77 3.80 3.79 3.77 3.81
#2 Diesel, refiner sales 1.37 1.70 1.78 1.95 2.15 2.36 2.57 2.76 2.91 3.06 3.18
#2 Diesel, retail 2.31 2.72 2.81 2.99 3.20 3.40 3.61 3.79 3.94 4.09 4.21
Biodiesel tax credit 1.00 0.00 0.00 0.00 0.00 0.00 0.00 0.00 0.00 0.00 0.00
RIN values
Per RIN gallon 0.91 1.07 1.14 1.22 1.19 1.11 1.01 0.93 0.85 0.78 0.75
Per physical gallon 1.37 1.60 1.70 1.83 1.78 1.66 1.51 1.39 1.28 1.17 1.13
All projections are averages across 500 stochastic outcomes.
Biofuel plant returns
Calendar year 2016 2017 2018 2019 2020 2021 2022 2023 2024 2025 2026
Biodiesel costs and returns (Dollars per gallon)
Biodiesel value 3.22 3.41 3.52 3.66 3.75 3.77 3.77 3.80 3.79 3.77 3.81
Glycerin value 0.06 0.06 0.06 0.06 0.06 0.06 0.06 0.06 0.06 0.06 0.06
Soyoil cost -2.43 -2.71 -2.79 -2.91 -2.98 -2.99 -2.97 -2.98 -2.97 -2.91 -2.94
Other operating costs -0.58 -0.59 -0.59 -0.60 -0.61 -0.61 -0.62 -0.63 -0.63 -0.64 -0.65
Net operating return 0.27 0.17 0.19 0.22 0.22 0.22 0.24 0.25 0.25 0.28 0.29
Corn milling for ethanol (Million bushels)
Corn wet milled for ethanol 552 597 594 588 587 585 586 590 593 595 597
Corn dry milled for ethanol 4,684 4,877 4,993 4,980 4,994 5,031 5,085 5,156 5,232 5,326 5,414
(Share de-oiling DDGS) 86% 88% 89% 91% 92% 94% 96% 97% 98% 98% 98%
Dry mill ethanol costs, returns (Dollars per gallon)
Ethanol value 1.55 1.68 1.76 1.79 1.81 1.81 1.85 1.90 1.94 1.97 1.99
Distillers grains value 0.39 0.37 0.39 0.40 0.39 0.39 0.39 0.39 0.39 0.39 0.39
Corn oil value* 0.11 0.11 0.12 0.13 0.13 0.13 0.12 0.12 0.11 0.11 0.11
Corn cost -1.26 -1.23 -1.30 -1.34 -1.33 -1.31 -1.31 -1.31 -1.30 -1.30 -1.29
Fuel and electricity cost -0.10 -0.15 -0.13 -0.13 -0.14 -0.14 -0.16 -0.18 -0.19 -0.19 -0.20
Other operating costs -0.38 -0.38 -0.39 -0.39 -0.39 -0.40 -0.40 -0.41 -0.41 -0.42 -0.42
Net operating return 0.32 0.41 0.46 0.46 0.47 0.48 0.50 0.52 0.54 0.56 0.58
* Weighted by share of dry mills de-oiling DDGs All projections are averages across 500 stochastic outcomes.

Live
stoc
k &
dai
ry

FAPRI-MU AMAP | 2017 U.S. Baseline
56
Cattle and hogs
Cattle prices continue to be pres-
sured by higher inventory levels
and larger meat supplies. The beef
cow herd has grown nearly six per-
cent over the past three years, with
further expansion likely in 2017.
Even though prices have retreated
sharply from the levels of 2014-15
which helped to fuel the expansion,
it will take time for cattle and beef
supplies to adjust to weaker re-
turns and to curtail output.
Hog slaughter capacity is increas-
ing in response to record high pork
packer margins in recent years.
The fourth quarter of 2016 includ-
ed several weeks when slaughter
facilities were operating at or near
their maximum capability. This led
to reduced bid prices for hogs, and
allowed the wholesale to farm price
spread to achieve record highs. As
new slaughter facilities begin oper-
ation later this year and in 2018,
competition for available hogs will
increase, and wholesale to farm
spreads will tighten.
With reduced feed costs for the
third consecutive year in 2016, far-
row-finish producer returns were
near breakeven levels. As sow in-
ventories continue to grow, hog
prices are not expected to post
much recovery in the next two
years. This will keep financial pres-
sure on hog producers. Other live-
stock producers will also struggle
to maintain profitability.
80
100
120
140
160
180
200
220
240
2 0 1 0 2 0 1 2 2 0 1 4 2 0 1 6 2 0 1 8 2 0 2 0 2 0 2 2 2 0 2 4 2 0 2 6D
olla
rs p
er c
wt
Cattle price declines continue as supplies grow
Fed steer Feeder steer
105
110
115
120
125
130
135
2 0 1 0 2 0 1 2 2 0 1 4 2 0 1 6 2 0 1 8 2 0 2 0 2 0 2 2 2 0 2 4 2 0 2 6
Mill
ion
hea
d
New capacity allows for record hog slaughter
0
10
20
30
40
50
60
70
80
90
2 0 1 0 2 0 1 2 2 0 1 4 2 0 1 6 2 0 1 8 2 0 2 0 2 0 2 2 2 0 2 4 2 0 2 6
Do
llars
per
cw
t
Hog returns remain tight amid heavy supplies
Feed costs Non-feed costs Receipts

FAPRI-MU AMAP | 2017 U.S. Baseline
57
Meat
Retail meat prices have been de-
clining, though not as rapidly as
wholesale and farm meat and ani-
mal prices. Retail prices tend to
exhibit less volatility than other
segments of the marketing chain.
When meat supplies are large, pro-
ducers typically receive a lower
percentage of consumer dollars
spent for meat. However, new pork
processing facilities should allow
hog farmers to increase their share
of industry returns in late 2017 and
2018.
After remaining fairly steady from
2008-2014, total U.S. meat pro-
duction began increasing sharply in
2015. Reductions in feed costs and
good demand strength in domestic
and international markets have
factored into recent growth. With
relatively stable feed costs project-
ed for the next couple of years, sup-
plies of all meat products will con-
tinue to increase faster than the
rate of U.S. population growth
through 2018.
As increases in meat production
outpace increases in meat exports,
the domestic market will have
more meat available. This will limit
the volatility in projected prices
relative to the volatility exhibited
between 2013 and 2016. If demand
strength deteriorates or feed prices
rise unexpectedly, the financial sit-
uation for livestock producers
could become very difficult in a
short amount of time.
90
100
110
120
130
140
150
160
170
180
2 0 1 0 2 0 1 2 2 0 1 4 2 0 1 6 2 0 1 8 2 0 2 0 2 0 2 2 2 0 2 4 2 0 2 6
Ind
ex, 2
00
0-0
9 =
10
0
Price adjustments vary by stage of processing
Barrow & gilt price Wholesale pork price Retail pork price
195
198
201
204
207
210
213
216
219
2 0 1 0 2 0 1 2 2 0 1 4 2 0 1 6 2 0 1 8 2 0 2 0 2 0 2 2 2 0 2 4 2 0 2 6
Po
un
ds
per
per
son
More meat available to domestic consumers
-6
-4
-2
0
2
4
6
8
2 0 1 0 2 0 1 2 2 0 1 4 2 0 1 6 2 0 1 8 2 0 2 0 2 0 2 2 2 0 2 4 2 0 2 6
Per
cen
tage
ch
ange
in p
rod
uct
ion
Growth to continue for all major meat sectors
Beef Pork Chicken
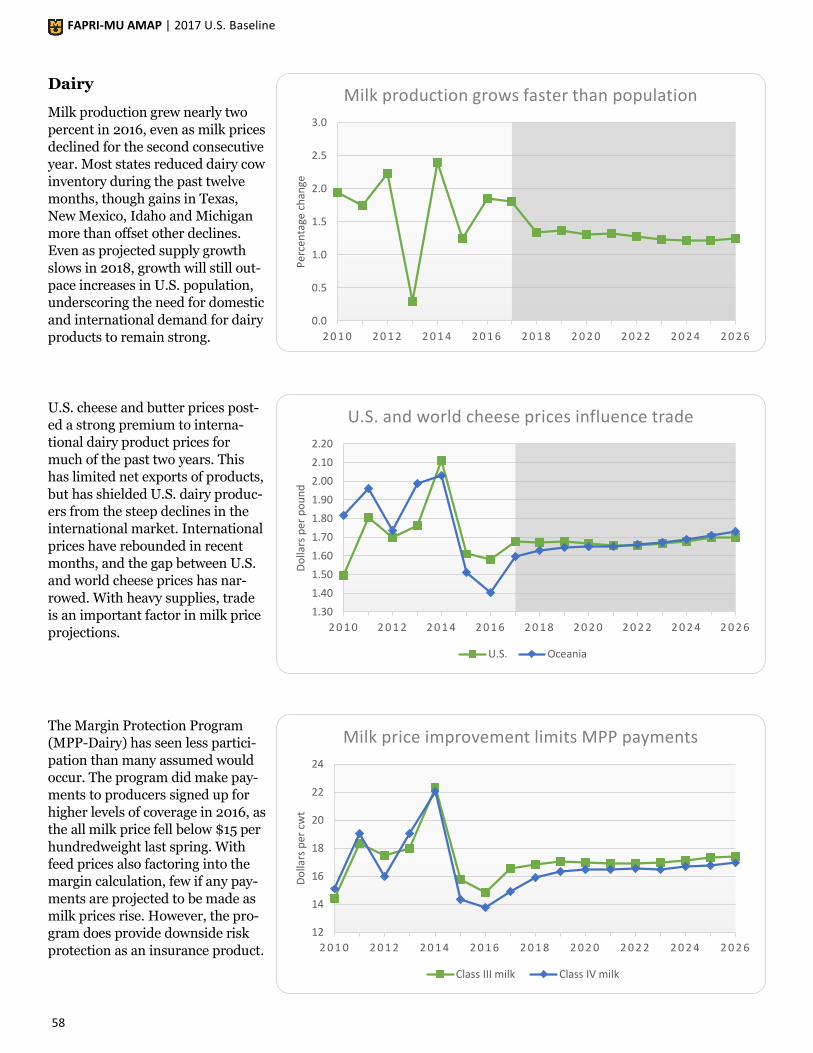
FAPRI-MU AMAP | 2017 U.S. Baseline
58
Dairy
Milk production grew nearly two
percent in 2016, even as milk prices
declined for the second consecutive
year. Most states reduced dairy cow
inventory during the past twelve
months, though gains in Texas,
New Mexico, Idaho and Michigan
more than offset other declines.
Even as projected supply growth
slows in 2018, growth will still out-
pace increases in U.S. population,
underscoring the need for domestic
and international demand for dairy
products to remain strong.
U.S. cheese and butter prices post-
ed a strong premium to interna-
tional dairy product prices for
much of the past two years. This
has limited net exports of products,
but has shielded U.S. dairy produc-
ers from the steep declines in the
international market. International
prices have rebounded in recent
months, and the gap between U.S.
and world cheese prices has nar-
rowed. With heavy supplies, trade
is an important factor in milk price
projections.
The Margin Protection Program
(MPP-Dairy) has seen less partici-
pation than many assumed would
occur. The program did make pay-
ments to producers signed up for
higher levels of coverage in 2016, as
the all milk price fell below $15 per
hundredweight last spring. With
feed prices also factoring into the
margin calculation, few if any pay-
ments are projected to be made as
milk prices rise. However, the pro-
gram does provide downside risk
protection as an insurance product.
0.0
0.5
1.0
1.5
2.0
2.5
3.0
2 0 1 0 2 0 1 2 2 0 1 4 2 0 1 6 2 0 1 8 2 0 2 0 2 0 2 2 2 0 2 4 2 0 2 6
Per
cen
tage
ch
ange
Milk production grows faster than population
12
14
16
18
20
22
24
2 0 1 0 2 0 1 2 2 0 1 4 2 0 1 6 2 0 1 8 2 0 2 0 2 0 2 2 2 0 2 4 2 0 2 6
Do
llars
per
cw
t
Milk price improvement limits MPP payments
Class III milk Class IV milk
1.30
1.40
1.50
1.60
1.70
1.80
1.90
2.00
2.10
2.20
2 0 1 0 2 0 1 2 2 0 1 4 2 0 1 6 2 0 1 8 2 0 2 0 2 0 2 2 2 0 2 4 2 0 2 6
Do
llars
per
po
un
d
U.S. and world cheese prices influence trade
U.S. Oceania

FAPRI-MU AMAP | 2017 U.S. Baseline
59
Cattle and hogs
Calendar year 2016 2017 2018 2019 2020 2021 2022 2023 2024 2025 2026
(Million head) CATTLE
Beef cows (Jan. 1) 30.3 30.8 31.0 31.1 31.0 30.8 30.6 30.4 30.2 30.1 29.8
Dairy cows (Jan. 1) 9.3 9.3 9.3 9.3 9.3 9.3 9.3 9.4 9.4 9.4 9.4
Cattle and calves (Jan. 1) 92.0 93.4 94.2 94.4 94.1 93.7 93.3 92.9 92.6 92.3 92.0
Cattle on feed (Jan. 1) 13.2 12.9 13.5 13.8 13.9 13.8 13.9 13.8 13.8 13.8 13.8
Calf crop 35.1 35.4 35.6 35.6 35.5 35.3 35.1 34.9 34.7 34.6 34.4
Cattle slaughter 31.2 32.1 32.9 33.4 33.5 33.3 33.2 33.0 32.8 32.7 32.5
Cattle imports 1.7 1.7 1.7 1.8 1.9 2.0 2.0 2.0 2.0 2.0 2.0
Cattle exports 0.1 0.1 0.1 0.1 0.1 0.1 0.1 0.1 0.1 0.1 0.1
Prices
Total all grades, (Dollars per hundredweight)
5-Area direct steers 120.86 110.66 105.86 105.38 105.64 108.71 111.43 112.82 114.13 115.51 117.87
600 - 650 #, Oklahoma City
Feeder steers 153.72 134.37 127.66 127.06 130.67 138.03 144.50 147.50 150.76 154.41 159.74
Utility cows, Sioux Falls 71.45 63.83 62.35 62.15 62.69 65.32 67.67 68.84 69.91 71.09 73.02
Cow-calf returns (Dollars per cow)
Receipts 708.22 680.83 658.18 661.93 685.25 722.81 753.37 771.29 790.28 812.69 842.24
Feed expenses 386.91 386.14 388.65 388.15 383.45 380.04 377.99 378.82 380.83 383.23 385.41
Non-feed expenses 282.07 281.27 285.37 293.74 302.61 312.55 322.42 330.59 338.82 347.31 356.92
Net returns 39.25 13.43 -15.83 -19.96 -0.80 30.22 52.96 61.89 70.63 82.15 99.91
HOGS (Million head)
Hogs for breeding (Dec. 1*) 6.00 6.09 6.08 5.98 5.84 5.74 5.71 5.76 5.80 5.79 5.73
Market hogs (Dec. 1*) 62.9 65.4 66.4 66.6 66.3 66.0 66.0 66.8 67.9 68.7 69.1
Sows farrowed 11.96 12.09 12.03 11.83 11.61 11.48 11.49 11.60 11.66 11.62 11.51
Pig crop 125.6 128.6 129.6 129.2 128.6 128.8 130.7 133.7 136.1 137.4 137.8
Barrow and gilt slaughter 115.0 119.2 120.9 121.1 120.6 120.5 121.5 124.0 126.4 128.0 128.6
Hog imports 5.7 5.8 5.9 5.9 6.0 6.0 6.0 6.0 6.0 6.0 6.0
Hog exports 0.0 0.0 0.0 0.0 0.0 0.0 0.0 0.0 0.0 0.0 0.0
Prices
Natl. base 51-52% lean equiv. (Dollars per hundredweight)
Barrows & gilts 46.16 43.64 44.69 47.75 51.43 53.72 54.34 52.40 50.36 49.43 49.76
Farrow-finish returns
Receipts 47.01 45.20 46.67 49.77 53.51 55.83 56.45 54.48 52.42 51.47 51.81
Feed expenses 27.59 26.79 28.19 28.91 28.68 28.23 28.06 28.11 28.18 28.19 28.06
Non-feed expenses 19.88 20.66 20.87 21.27 21.69 22.09 22.52 22.94 23.31 23.67 24.00
Net returns -0.47 -2.24 -2.39 -0.40 3.15 5.51 5.87 3.44 0.93 -0.40 -0.25
* Preceding year
All projections are averages across 500 stochastic outcomes.

FAPRI-MU AMAP | 2017 U.S. Baseline
60
Meat sector
Calendar year 2016 2017 2018 2019 2020 2021 2022 2023 2024 2025 2026
Beef (Million pounds)
Production 25,289 26,170 26,980 27,449 27,641 27,591 27,532 27,438 27,382 27,352 27,293
Imports 3,006 2,779 2,699 2,644 2,672 2,721 2,755 2,809 2,857 2,898 2,940
Domestic use 25,769 26,347 26,907 27,171 27,293 27,260 27,232 27,206 27,204 27,216 27,204
Exports 2,519 2,628 2,756 2,906 3,010 3,048 3,050 3,035 3,029 3,028 3,025
Ending stocks 690 665 680 697 708 712 716 721 727 732 736
Pork
Production 24,952 25,951 26,386 26,535 26,561 26,645 26,974 27,606 28,246 28,686 28,919
Imports 1,096 1,091 1,080 1,053 1,034 1,036 1,034 1,036 1,041 1,047 1,057
Domestic use 20,848 21,589 21,900 21,891 21,712 21,653 21,819 22,264 22,744 23,067 23,215
Exports 5,229 5,365 5,548 5,694 5,885 6,026 6,176 6,352 6,516 6,647 6,752
Ending stocks 560 649 667 670 669 671 683 709 736 754 763
Broiler
Production 40,240 41,162 41,915 42,636 43,318 44,042 44,728 45,400 46,087 46,743 47,437
Domestic use 33,797 34,388 34,806 35,214 35,673 36,201 36,731 37,234 37,752 38,259 38,799
Exports 6,626 6,928 7,247 7,560 7,784 7,980 8,139 8,310 8,481 8,634 8,788
Ending stocks 780 766 770 776 783 792 801 809 818 825 833
Turkey
Production 5,985 6,156 6,253 6,301 6,346 6,401 6,449 6,485 6,520 6,552 6,589
Domestic use 5,423 5,544 5,630 5,676 5,703 5,742 5,775 5,797 5,818 5,835 5,856
Exports 570 630 651 663 682 698 714 730 746 762 778
Ending stocks 245 268 280 283 286 289 291 292 293 292 292
(Dollars per hundredweight) Wholesale prices
Boxed beef cutout 206.62 187.46 179.64 178.80 180.62 185.06 189.10 191.27 193.61 196.12 199.86
Pork cutout 78.33 74.28 74.10 77.35 81.47 84.65 85.11 82.45 79.50 78.33 79.41
National wholesale broiler 84.30 83.48 85.60 87.81 89.02 89.55 89.98 90.34 90.80 91.28 91.76
Natl. wholesale turkey hens 117.10 107.39 103.51 103.58 103.56 103.59 103.57 103.91 104.56 105.38 106.10
Retail prices (Dollars per pound)
Beef 5.96 5.60 5.44 5.42 5.47 5.62 5.81 5.97 6.10 6.24 6.40
Pork 3.75 3.67 3.67 3.79 3.93 4.07 4.13 4.10 4.05 4.03 4.05
Broiler 1.90 1.90 1.93 1.97 2.00 2.03 2.06 2.09 2.11 2.14 2.17
Turkey 1.55 1.54 1.53 1.55 1.57 1.59 1.61 1.64 1.67 1.70 1.73
Per capita consumption (Pounds, retail)
Beef 55.6 56.4 57.2 57.3 57.1 56.6 56.1 55.6 55.2 54.8 54.4
Pork 49.9 51.3 51.6 51.1 50.3 49.8 49.8 50.4 51.2 51.5 51.5
Broiler 89.5 90.4 90.7 91.1 91.5 92.2 92.8 93.4 94.0 94.6 95.2
Turkey 16.7 17.0 17.1 17.1 17.0 17.0 17.0 16.9 16.9 16.8 16.7
Total 211.8 215.0 216.6 216.6 216.0 215.6 215.7 216.4 217.2 217.7 217.8
All projections are averages across 500 stochastic outcomes.

FAPRI-MU AMAP | 2017 U.S. Baseline
61
Dairy sector
Calendar year 2016 2017 2018 2019 2020 2021 2022 2023 2024 2025 2026
Milk supply
Dairy cows (thou. head) 9,329 9,336 9,317 9,316 9,328 9,339 9,349 9,357 9,363 9,370 9,380
California 1,769 1,764 1,754 1,748 1,745 1,743 1,741 1,741 1,740 1,740 1,741
Wisconsin 1,278 1,277 1,272 1,270 1,270 1,270 1,270 1,269 1,268 1,267 1,266
New York 620 620 617 615 614 614 613 612 610 609 608
Idaho 595 605 612 620 628 636 642 649 654 659 665
Pennsylvania 529 526 521 518 516 513 511 509 507 505 504
Minnesota 461 461 459 458 457 455 454 452 451 449 447
Texas 474 481 485 490 495 499 504 507 511 515 519
Michigan 419 427 433 440 447 453 459 465 471 476 482
New Mexico 315 310 307 304 302 299 297 296 294 293 292
Ohio 265 263 261 260 259 258 257 255 254 252 251
Rest of U.S. 2,605 2,602 2,595 2,594 2,597 2,598 2,600 2,601 2,602 2,604 2,607
Milk yield (lbs. per cow) 22,777 23,172 23,531 23,854 24,135 24,426 24,710 24,993 25,280 25,571 25,862
Milk production (bil. lbs.) 212.5 216.3 219.2 222.2 225.1 228.1 231.0 233.9 236.7 239.6 242.6
Min. FMMO class prices (Dollars per hundredweight)
Class I mover 14.80 16.88 17.54 17.99 18.03 18.06 18.11 18.17 18.36 18.69 18.72
Class II 14.35 15.60 16.58 17.03 17.19 17.20 17.24 17.19 17.41 17.50 17.65
Class III 14.87 16.58 16.83 17.03 16.98 16.88 16.92 16.97 17.12 17.37 17.42
Class IV 13.77 14.90 15.88 16.33 16.49 16.50 16.54 16.49 16.71 16.80 16.95
All milk price 16.20 17.76 18.31 18.63 18.66 18.63 18.67 18.69 18.87 19.09 19.16
Actual dairy prod. margin 8.18 9.89 10.02 9.98 10.00 10.09 10.19 10.21 10.39 10.59 10.68
Wholesale prices (Dollars per pound)
Butter, CME 2.08 2.06 1.95 1.90 1.86 1.89 1.89 1.88 1.90 1.90 1.90
Cheese, Amer., 40#, CME 1.58 1.68 1.67 1.68 1.67 1.66 1.66 1.67 1.68 1.70 1.70
Nonfat dry milk, AA 0.85 0.98 1.15 1.23 1.27 1.25 1.26 1.26 1.27 1.28 1.30
Dairy product production (Million pounds)
American cheese 4,729 4,803 4,856 4,917 4,984 5,055 5,124 5,186 5,250 5,311 5,377
Other cheese 7,366 7,560 7,688 7,806 7,925 8,052 8,178 8,296 8,417 8,537 8,660
Butter 1,907 1,942 1,974 2,014 2,046 2,084 2,113 2,148 2,183 2,220 2,257
Nonfat dry milk 2,303 2,395 2,481 2,546 2,591 2,640 2,695 2,744 2,797 2,863 2,929
Dairy product exports
American cheese 114 137 154 164 174 179 183 185 186 186 187
Other cheese 513 543 544 550 563 573 581 589 596 603 610
Butter 31 49 45 49 59 63 68 73 76 79 82
Nonfat dry milk 1,257 1,307 1,370 1,425 1,454 1,483 1,520 1,552 1,589 1,623 1,660
Per capita consumption (Pounds)
Butter 5.8 6.0 6.0 6.0 6.1 6.1 6.1 6.2 6.2 6.3 6.3
Nonfat dry milk 3.2 3.3 3.4 3.4 3.4 3.4 3.4 3.5 3.5 3.6 3.6
Total cheese 36.3 36.8 36.9 37.1 37.3 37.6 37.8 38.0 38.3 38.5 38.8
American 14.2 14.4 14.4 14.4 14.4 14.5 14.6 14.7 14.7 14.8 14.9
Other 22.1 22.4 22.6 22.7 22.9 23.0 23.2 23.4 23.5 23.7 23.9
173.1 170.6 169.0 167.7 166.4 165.0 163.6 162.3 160.9 159.5 158.2 Total fluid milk
All projections are averages across 500 stochastic outcomes.

FAPRI-MU AMAP | 2017 U.S. Baseline
62

Agg
rega
te in
dica
tors

FAPRI-MU AMAP | 2017 U.S. Baseline
64
Government costs
Net CCC outlays are expected to
increase in fiscal year (FY) 2017,
when the large ARC and PLC pay-
ments associated with the 2015/16
marketing year are made. Project-
ed outlays decline in FY 2019 and
2020, with lower ARC payments,
but then rebound in FY 2021 given
the assumption that farmers will be
able to shift their ARC-PLC elec-
tion under a new farm bill. Be-
tween FY 2018 and FY 2027,
spending on major commodity pro-
grams totals $69 billion and net
CCC outlays total $99 billion.
Mandatory government outlays
under the crop insurance program
and certain conservation and disas-
ter programs are not included in
the CCC account. Crop insurance
net outlays total $79 billion be-
tween FY 2018 and FY 2027. Total
mandatory outlays for these ac-
counts total $217 billion over that
same ten-year period.
Livestock forage assistance ac-
counted for a large spike in disaster
aid in FY 2014 and FY 2015. CBO
projects that livestock aid and the
non-insured assistance program
(NAP) will average less than $500
million per year from FY 2018 to
FY 2027. Other disaster aid from
FY 2008-FY 2013 was provided
from non-CCC accounts.
0
2
4
6
8
10
12
14
2 0 1 1 2 0 1 3 2 0 1 5 2 0 1 7 2 0 1 9 2 0 2 1 2 0 2 3 2 0 2 5 2 0 2 7B
illio
n d
olla
rsFiscal year
CCC outlays total $99 billion over FY 2018-27
Major commodities Conservation All other
0
5
10
15
20
25
30
2 0 1 1 2 0 1 3 2 0 1 5 2 0 1 7 2 0 1 9 2 0 2 1 2 0 2 3 2 0 2 5 2 0 2 7
Bill
ion
do
llars
Fiscal year
Crop insurance totals $79 billion over FY 2018-27
Net CCC Crop insurance NRCS conservation Other
0.0
0.5
1.0
1.5
2.0
2.5
3.0
3.5
2 0 1 1 2 0 1 3 2 0 1 5 2 0 1 7 2 0 1 9 2 0 2 1 2 0 2 3 2 0 2 5 2 0 2 7
Bill
ion
do
llars
Fiscal year
Disaster aid remains well below FY 2015 level
CCC disaster and NAP Other disaster & emergency

FAPRI-MU AMAP | 2017 U.S. Baseline
65
Crop insurance
Crop insurance net indemnities are
indemnities minus producer paid
premiums. In 2012/13 net indem-
nities topped $13 billion with over
$10 billion from corn alone. This
was the result of a drought. Better
growing conditions have led to de-
creased net indemnities with corn
and soybeans even having negative
expectations in 2016/17. Going for-
ward, corn and soybeans account
for the majority of the crop insur-
ance costs.
For crops harvested in 2015 and
2016, Title I payments (mostly
from ARC, PLC and marketing
loans benefits) far exceeded crop
insurance net indemnities. In the
projection period, net indemnities
average between $5 billion and $6
billion per year, a little less than
Title I payments. In past baselines,
crop insurance net indemnities
often exceeded Title I payments.
However, projected crop prices in
this baseline reduce crop insurance
benefits and increase Title I pay-
ments.
Farm receipts, expenses
In 2016 lower fertilizer, seed and
fuel prices resulted in the lowest
farm production expenses since
2012. Projected increases in petro-
leum prices drive higher fuel costs.
Feed and fertilizer costs rebound
after 2017, but both remain below
the 2014 level.
0
2
4
6
8
10
12
14
1 0 / 1 1 1 2 / 1 3 1 4 / 1 5 1 6 / 1 7 1 8 / 1 9 2 0 / 2 1 2 2 / 2 3 2 4 / 2 5 2 6 / 2 7
Bill
ion
do
llars
Marketing year
Title I payments exceed crop insurance
Crop insurance net indemnities Select Title I payments
-2
0
2
4
6
8
10
12
14
1 0 / 1 1 1 2 / 1 3 1 4 / 1 5 1 6 / 1 7 1 8 / 1 9 2 0 / 2 1 2 2 / 2 3 2 4 / 2 5 2 6 / 2 7
Bill
ion
do
llars
Marketing year
Crop insurance net indemnities
Corn Soybeans Wheat Upland cotton All other
0
10
20
30
40
50
60
70
2010 2012 2014 2016 2018 2020 2022 2024 2026
Bill
ion
do
llars
Calendar year
Production expenses resume growth after 2017
Feed Fertilizer & chemicals Fuel & electricity

FAPRI-MU AMAP | 2017 U.S. Baseline
66
Farm income
After reaching record levels in
2013, nominal farm income has
been on the decline since 2014. It is
projected that in 2017 it will be 48
percent lower than 2013 record.
Nominal net farm income from
2017-2026 is projected to average
about $85 billion per year. Adjust-
ed for inflation, real net income in
2016 dollars is projected to average
about $75 billion per year in the
same period.
After reaching record levels in
nominal terms in 2014, gross cash
income sharply declined in 2015
and 2016 due to lower prices for
many agricultural commodities.
Starting in 2017 gross cash income
is projected to grow. The accelerat-
ed growth in cash expenses be-
tween 2017 and 2026 limits the
increase in net cash income.
Farm real estate values
The reduction in farm income and
forecasted increases in interest
rates both put pressure on farm
real estate values. Projected farm
real estate values decline by $339
per acre (11 percent) between 2016
and 2020. Actual results will differ
across the country and will be sen-
sitive to developments in agricul-
tural markets and the economy.
0
20
40
60
80
100
120
140
2010 2012 2014 2016 2018 2020 2022 2024 2026B
illio
n d
olla
rs
Farm income remains far below 2011-13 peak
Real net farm income (2016 dollars) Nominal net farm income
0
50
100
150
200
250
300
350
400
450
500
2010 2012 2014 2016 2018 2020 2022 2024 2026
Bill
ion
do
llars
Cash income and expenses to regain growth
Gross cash income Cash expenses Net cash income
2150
3020
2671 2640
0
500
1000
1500
2000
2500
3000
3500
2010 2012 2014 2016 2018 2020 2022 2024 2026
Do
llars
per
acr
e
Farmland values decline, reducing farm assets
Average value of U.S. farm real estate

FAPRI-MU AMAP | 2017 U.S. Baseline
67
Farm debt
Farm debt has been steadily in-
creasing. Real estate debt that
reached historic highs in 2016 has
been the major driver behind the
overall farm debt.
0
50
100
150
200
250
300
350
400
450
2010 2012 2014 2016 2018 2020 2022 2024 2026
Bill
ion
do
llars
Farm debt continues to rise
Real estate debt Other debts

FAPRI-MU AMAP | 2017 U.S. Baseline
68
Net government outlays
Fiscal year 2017 2018 2019 2020 2021 2022 2023 2024 2025 2026 2027
Feed grains (Million dollars)
Corn 4,508 3,492 1,572 1,262 2,539 2,679 2,605 2,592 2,754 2,729 2,794
Sorghum 252 421 292 243 317 323 315 323 317 317 326
Barley 3 25 111 103 100 96 95 98 104 111 117
Oats 19 26 20 15 24 25 24 24 25 25 25
Food grains
Wheat 1,205 2,331 1,662 1,180 1,361 1,290 1,245 1,292 1,330 1,355 1,380
Rice 482 823 638 607 625 588 534 489 480 436 430
Oilseeds
Soybeans 1,231 359 861 500 435 466 556 563 625 629 618
Peanuts 565 687 665 696 700 707 728 714 714 706 721
Other oilseeds 85 112 116 110 110 115 120 120 122 125 133
Other selected commodities
Upland cotton 62 318 417 445 404 370 349 340 274 291 249
Dairy 26 98 116 113 123 83 219 231 240 262 262
Subtotal, selected commodities 8,439 8,693 6,469 5,275 6,739 6,742 6,790 6,787 6,985 6,986 7,055
CCC conservation
Conservation reserve 1,891 1,960 1,944 1,924 1,987 2,047 2,047 2,027 1,955 1,937 1,937
Other CCC conservation 5 1 1 1 1 1 1 1 1 1 1
Other CCC
Disaster payments, NAP 504 491 460 465 468 466 461 457 459 460 473
Other net costs 497 550 594 601 596 594 591 589 588 589 589
Net CCC outlays 11,335 11,695 9,469 8,266 9,791 9,850 9,890 9,860 9,989 9,973 10,055
NRCS conservation 3,286 3,723 3,823 4,006 3,928 3,920 4,012 3,956 4,030 4,001 4,009
Crop insurance 2,917 7,522 7,486 7,710 7,770 7,820 7,902 8,035 8,150 8,160 8,196
Total mandatory outlays 17,538 22,939 20,778 19,982 21,490 21,590 21,804 21,851 22,169 22,134 22,260
Note: "NRCS Conservation" denotes mandatory spending on conservation programs authorized by the 2002, 2008 and 2014 farm bills that is not
included in reported CCC outlays. Fiscal years begin on Oct.1 of the previous calendar year (FY 2017: Oct. 1, 2016-Sep. 30, 2017).
All projections are averages across 500 outcomes.

FAPRI-MU AMAP | 2017 U.S. Baseline
69
Selected direct government payments
Marketing year 16/17 17/18 18/19 19/20 20/21 21/22 22/23 23/24 24/25 25/26 26/27
(Million dollars)
ARC payments 4,517 2,898 1,953 639 665 747 765 801 803 831 830
PLC payments 3,634 2,861 2,537 5,339 5,366 5,208 5,166 5,397 5,385 5,468 5,923
Marketing loans 141 400 525 596 559 544 522 542 469 456 414
Total 8,293 6,159 5,016 6,574 6,590 6,498 6,452 6,740 6,657 6,755 7,167
Note: Includes selected payments for feed grains, food grains, oilseeds, and upland cotton. All projections are averages across 500 outcomes.
Crop insurance
Year 2016 2017 2018 2019 2020 2021 2022 2023 2024 2025 2026
(Million dollars, crop year)
Total premiums 9,310 9,967 9,813 10,065 10,138 10,191 10,309 10,544 10,652 10,705 10,765
Producer-paid premiums 3,458 3,686 3,623 3,723 3,749 3,770 3,815 3,904 3,943 3,961 3,979
Premium subsidies 5,853 6,281 6,190 6,342 6,389 6,421 6,494 6,639 6,709 6,744 6,786
Total indemnities 3,816 9,017 8,928 9,215 9,288 9,347 9,447 9,620 9,763 9,776 9,830
0.41 0.90 0.91 0.92 0.92 0.92 0.92 0.91 0.92 0.91 0.91 Loss ratio
(Million dollars, crop year)
Net indemnities 358 5,331 5,305 5,492 5,539 5,576 5,632 5,716 5,820 5,815 5,851
Corn -199 1,978 1,910 2,018 2,016 2,039 2,069 2,111 2,153 2,137 2,129
Soybeans -296 1,379 1,324 1,362 1,371 1,362 1,369 1,389 1,421 1,405 1,413
Wheat 81 461 529 589 624 636 641 638 643 654 655
Upland cotton 129 533 553 533 537 537 538 543 558 572 598
All other 644 979 989 990 991 1,002 1,015 1,035 1,044 1,047 1,056
(Million dollars, fiscal year)
Net outlays 4,239 2,917 7,522 7,486 7,710 7,770 7,820 7,902 8,035 8,150 8,160
All projections are averages across 500 outcomes.

FAPRI-MU AMAP | 2017 U.S. Baseline
70
Farm cash receipts
Calendar year 2016 2017 2018 2019 2020 2021 2022 2023 2024 2025 2026
(Billion dollars)
Feed grains 56.01 56.58 59.25 61.33 62.00 62.36 63.11 63.78 64.39 65.20 65.71
Food grains 11.08 10.86 11.50 12.16 12.42 12.58 12.60 12.62 12.65 12.70 12.66
Oilseeds 41.22 40.35 40.59 40.78 40.72 40.25 39.95 40.15 40.40 40.59 40.84
Cotton 5.92 6.02 6.03 6.10 6.03 6.00 6.06 6.14 6.25 6.40 6.56
Sugar 2.54 2.66 2.78 2.84 2.87 2.90 2.93 2.97 3.01 3.06 3.10
Other crops 70.96 72.55 73.99 75.33 76.34 77.39 78.54 79.69 80.97 82.28 83.53
Cattle 67.56 62.31 61.08 61.50 62.40 64.81 66.80 67.65 68.57 69.63 71.31
Hogs 19.72 18.91 19.65 21.04 22.62 23.66 24.20 23.89 23.51 23.43 23.77
Dairy products 34.21 38.17 39.87 41.12 41.73 42.21 42.83 43.43 44.38 45.43 46.17
Poultry, eggs 39.71 40.82 42.73 44.51 45.62 46.44 47.23 48.04 48.89 49.77 50.60
Other livestock 6.94 6.98 7.13 7.35 7.58 7.83 8.05 8.23 8.42 8.62 8.85
Total cash receipts 355.86 356.21 364.59 374.09 380.34 386.41 392.32 396.60 401.44 407.11 413.09
All projections are averages across 500 outcomes.
Farm production expenses
Calendar year 2016 2017 2018 2019 2020 2021 2022 2023 2024 2025 2026
(Billion dollars)
Feed 59.16 58.36 59.80 61.09 61.18 60.86 60.98 61.28 61.59 61.88 61.85
Purchased livestock 23.46 21.88 21.12 21.06 21.52 22.62 23.45 23.78 24.17 24.60 25.30
Seed 20.82 20.40 20.31 20.44 20.65 20.92 21.19 21.44 21.70 21.97 22.23
Fertilizer and chemicals 36.07 34.99 35.24 35.62 36.37 37.22 38.08 39.07 40.06 40.78 41.20
Fuels and electricity 17.38 18.48 18.94 19.77 20.76 21.76 22.81 23.81 24.69 25.52 26.27
Interest 16.55 18.28 19.40 20.62 21.49 22.09 22.59 23.01 23.37 23.70 23.99
Contract and hired labor 33.93 35.26 35.96 36.60 37.04 37.52 38.07 38.61 39.24 39.90 40.54
Capital consumption 40.20 39.69 39.30 38.96 38.73 38.67 38.73 38.83 38.95 39.08 39.23
Rent to landlords 19.64 19.81 19.65 19.52 19.52 19.62 19.63 19.58 19.52 19.45 19.41
All other 82.70 83.26 84.19 85.55 86.94 88.40 89.96 91.59 93.16 94.70 96.16
Total production expenses 349.91 350.41 353.89 359.22 364.20 369.68 375.48 381.00 386.45 391.58 396.18
All projections are averages across 500 outcomes.
FAPRI-MU AMAP | 2017 U.S. Baseline
71
Farm income statistics
Calendar year 2016 2017 2018 2019 2020 2021 2022 2023 2024 2025 2026
(Billion dollars)
1. Farm receipts 386.54 390.69 400.99 411.47 418.62 425.51 432.28 437.51 443.31 449.87 456.77
Crops 187.72 189.03 194.13 198.55 200.39 201.47 203.20 205.36 207.67 210.24 212.39
Livestock 168.14 167.19 170.46 175.53 179.95 184.94 189.12 191.25 193.76 196.87 200.70
Farm-related 30.68 34.47 36.40 37.38 38.28 39.10 39.96 40.91 41.88 42.77 43.67
2. Government payments 13.00 13.41 11.23 10.05 11.68 11.71 11.59 11.64 11.77 11.75 11.81
3. Gross cash income 399.54 404.10 412.22 421.51 430.31 437.22 443.87 449.15 455.08 461.62 468.58
(1 + 2)
4. Nonmoney income 18.81 19.51 20.04 20.40 20.67 20.84 20.92 20.93 20.92 20.91 20.91
5. Value of inventory
Change -0.15 -9.46 0.37 0.02 -0.10 -0.17 0.18 0.06 0.19 0.13 0.13
6. Gross farm income 418.20 414.15 432.63 441.94 450.88 457.89 464.97 470.14 476.20 482.67 489.62
(3 + 4 + 5)
7. Cash expenses 307.63 308.46 312.09 317.59 322.68 328.13 333.81 339.18 344.50 349.49 353.94
8. Total expenses 349.91 350.41 353.89 359.22 364.20 369.68 375.48 381.00 386.45 391.58 396.18
9. Net cash income 91.90 95.64 100.13 103.92 107.63 109.09 110.06 109.96 110.58 112.13 114.64
(3 - 7)
10. Realized net farm inc 68.44 73.20 78.37 82.70 86.78 88.38 89.31 89.08 89.55 90.95 93.31
(3 + 4 - 8)
11. Net farm income 68.29 63.74 78.74 82.72 86.68 88.21 89.49 89.14 89.74 91.09 93.44
(6 - 8)
68.29 62.90 75.94 78.11 80.17 79.89 79.31 77.28 76.05 75.45 75.63 Deflated (2016 $)
All projections are averages across 500 outcomes.
Land rental rates and real estate values
Year 2016 2017 2018 2019 2020 2021 2022 2023 2024 2025 2026
Rental rates (Dollars per acre)
Cropland 136.00 132.66 131.91 131.19 131.15 131.71 131.64 131.23 130.75 130.29 129.94
Pasture 13.00 12.51 12.19 12.05 12.05 12.16 12.28 12.39 12.44 12.48 12.54
Value of farm real estate 3,010 2,916 2,826 2,730 2,671 2,664 2,665 2,660 2,652 2,645 2,640
All projections are averages across 500 outcomes.

FAPRI-MU AMAP | 2017 U.S. Baseline
72
Land use for major crops and the conservation reserve
Marketing year 16/17 17/18 18/19 19/20 20/21 21/22 22/23 23/24 24/25 25/26 26/27
Planted area (Million acres)
Corn 94.00 92.15 92.93 93.59 93.43 93.29 93.53 93.55 93.59 93.69 93.67
Soybeans 83.43 87.06 85.11 84.48 84.47 84.25 83.95 84.01 84.08 84.03 84.03
Wheat 50.15 46.18 46.76 47.14 47.46 47.56 47.35 47.03 46.80 46.54 46.27
Upland cotton 9.88 10.47 10.49 10.43 10.21 10.13 10.09 10.04 10.06 10.09 10.16
Sorghum 6.69 6.92 6.93 6.91 6.91 6.92 6.93 6.95 6.96 6.96 6.97
Barley 3.05 3.14 2.90 2.87 2.84 2.77 2.69 2.61 2.50 2.40 2.31
Oats 2.83 2.91 2.91 2.88 2.87 2.90 2.91 2.93 2.93 2.94 2.95
Rice 3.15 2.92 3.01 2.98 2.97 2.99 3.02 3.02 3.02 3.04 3.04
Sunflowers 1.60 1.61 1.56 1.52 1.51 1.50 1.50 1.50 1.50 1.49 1.48
1.67 1.61 1.63 1.62 1.61 1.60 1.58 1.57 1.55 1.55 1.54 Peanuts
Sugar beets 1.16 1.24 1.28 1.29 1.28 1.28 1.29 1.30 1.30 1.31 1.32
Sugar cane (harvested) 0.92 0.93 0.95 0.96 0.96 0.95 0.95 0.94 0.93 0.93 0.92
12 crop planted area 258.54 257.15 256.48 256.68 256.51 256.16 255.78 255.45 255.23 254.97 254.66
Hay (harvested) 53.46 54.45 55.57 55.94 56.05 56.05 56.00 55.95 55.90 55.88 55.87
12 crops + hay 312.00 311.61 312.06 312.62 312.56 312.21 311.78 311.40 311.13 310.85 310.53
Conservation reserve (CRP) 23.88 23.40 23.00 23.00 23.00 23.00 23.00 23.00 23.00 23.00 23.00
12 crops + hay + CRP 335.88 335.01 335.06 335.62 335.56 335.21 334.78 334.40 334.13 333.85 333.53
Double-crop soybeans 3.86 3.76 3.72 3.77 3.79 3.77 3.72 3.70 3.68 3.66 3.63
12 crops + hay + CRP 332.02 331.25 331.33 331.85 331.77 331.44 331.06 330.70 330.45 330.19 329.90
- double-crop soybeans
All projections are averages across 500 stochastic outcomes.
Balance sheet of the farm sector
Year 2016 2017 2018 2019 2020 2021 2022 2023 2024 2025 2026
(Dollars per acre)
Assets 2,868 2,789 2,732 2,669 2,630 2,626 2,627 2,621 2,615 2,610 2,607
Real estate 2,388 2,326 2,259 2,188 2,144 2,139 2,139 2,135 2,130 2,124 2,120
Other assets 480 462 473 482 486 487 488 486 485 486 487
Debts 376 387 394 400 404 407 409 411 414 415 417
Real estate 224 233 237 237 236 235 235 234 234 233 233
Other debts 151 154 157 163 168 172 175 177 180 182 184
13.1% 13.9% 14.4% 15.0% 15.4% 15.5% 15.6% 15.7% 15.8% 15.9% 16.0% Debt-to-asset ratio
All projections are averages across 500 outcomes.

FAPRI-MU AMAP | 2017 U.S. Baseline
73
Consumer price indices for food
Calendar year 2016 2017 2018 2019 2020 2021 2022 2023 2024 2025 2026
(1982-84=100)
Total food 247.9 252.2 258.5 265.3 272.2 279.2 286.3 293.4 300.5 307.8 315.3
(Inflation rate) 0.3% 1.7% 2.5% 2.6% 2.6% 2.6% 2.5% 2.5% 2.4% 2.4% 2.4%
Food at home 239.1 241.7 247.3 253.5 259.8 266.3 272.9 279.3 285.9 292.7 299.6
Cereal and bakery 273.1 275.2 281.4 287.9 294.2 300.6 307.1 313.8 320.7 327.8 334.9
Meat 247.7 244.3 247.6 253.7 260.6 267.9 275.2 281.9 288.4 295.2 302.5
Dairy 217.3 224.0 230.8 236.8 242.4 248.0 253.9 259.9 266.3 272.9 279.4
Fruit and vegetables 296.3 303.8 311.7 319.5 327.3 335.2 343.2 351.3 359.6 368.0 376.5
Other food at home 209.5 213.1 218.4 223.7 228.8 233.9 239.1 244.4 249.9 255.3 260.9
215.3 219.8 226.7 233.3 238.5 244.0 249.5 255.3 261.3 267.3 273.4 Sugar and sweets
Fats and oils 225.9 231.7 237.7 244.2 251.1 258.0 264.6 271.5 278.6 285.5 292.8
Other prepared items 224.1 227.4 233.4 239.5 245.5 251.6 257.8 264.0 270.5 276.9 283.5
Non-alc. beverages 167.3 170.3 173.9 177.4 180.4 183.5 186.6 189.8 193.1 196.5 199.9
Food away from home 262.7 269.2 276.6 284.1 291.8 299.6 307.5 315.4 323.3 331.4 339.6
All projections are averages across 500 stochastic outcomes.
Consumer expenditures for food
Calendar year 2016 2017 2018 2019 2020 2021 2022 2023 2024 2025 2026
(Dollars per person)
4,535 4,694 4,864 5,040 5,211 5,378 5,547 5,714 5,884 6,057 6,229 Total food per capita
Food at home 2,230 2,286 2,352 2,420 2,486 2,553 2,620 2,687 2,756 2,826 2,897
Food away from home 2,304 2,408 2,512 2,621 2,725 2,825 2,926 3,027 3,128 3,230 3,333
Multiply by population for: (Billion dollars)
Total U.S. food expenditures 1,470 1,534 1,603 1,674 1,744 1,814 1,885 1,957 2,030 2,105 2,180
All projections are averages across 500 stochastic outcomes.

FAPRI-MU AMAP | 2017 U.S. Baseline
74
Stochastic results
Marketing year 16/17 17/18 18/19 19/20 20/21 21/22 22/23 23/24 24/25 25/26 26/27
Corn price (Dollars per bushel)
90th percentile 3.50 4.45 4.94 4.85 4.79 4.78 4.74 4.78 4.74 4.73 4.70
Expectation 3.38 3.60 3.77 3.76 3.71 3.70 3.71 3.70 3.70 3.69 3.65
10th percentile 3.27 2.83 2.72 2.71 2.70 2.76 2.75 2.72 2.68 2.68 2.69
Soybean price (Dollars per bushel)
90th percentile 9.82 12.28 12.76 12.96 12.43 12.35 12.59 12.73 12.43 12.50 12.18
Expectation 9.46 9.57 9.84 9.91 9.79 9.57 9.53 9.57 9.51 9.47 9.43
10th percentile 9.13 7.31 7.28 7.27 7.10 7.04 6.99 6.73 6.71 6.78 6.72
Wheat price (Dollars per bushel)
90th percentile 3.85 5.53 6.33 6.93 6.93 6.71 6.67 6.69 6.62 6.69 6.63
Expectation 3.79 4.44 4.90 5.15 5.20 5.20 5.13 5.14 5.11 5.09 5.02
10th percentile 3.74 3.39 3.43 3.55 3.60 3.71 3.72 3.59 3.49 3.53 3.56
PLC payments (Million dollars)
90th percentile 3,802 4,612 4,687 12,557 12,565 12,104 11,992 13,283 12,903 12,937 13,590
Expectation 3,634 2,861 2,537 5,339 5,366 5,208 5,166 5,397 5,385 5,468 5,923
10th percentile 3,443 1,204 870 860 922 894 851 832 714 794 829
ARC payments (Million dollars)
90th percentile 5,118 5,532 4,510 1,514 1,649 1,816 1,814 1,955 1,865 1,963 1,940
Expectation 4,517 2,898 1,953 639 665 747 765 801 803 831 830
10th percentile 3,825 820 248 47 57 92 69 64 68 69 71
Crop ins. net indemnities (Million dollars)
90th percentile 461 8,642 9,608 9,782 10,048 10,303 9,940 9,631 10,189 9,868 9,994
Expectation 358 5,331 5,305 5,492 5,539 5,576 5,632 5,716 5,820 5,815 5,851
10th percentile 243 3,063 2,141 2,054 2,124 2,350 2,562 2,701 2,451 2,741 2,773