university of oklahoma reservoir quality …
TRANSCRIPT

UNIVERSITY OF OKLAHOMA
GRADUATE COLLEGE
RESERVOIR QUALITY EVALUATION OF THE MERAMEC AND UPPER OSAGE
UNITS IN THE ANADARKO BASIN
A THESIS
SUBMITTED TO THE GRADUATE FACULTY
in partial fulfillment of the requirements for the
Degree of
MASTER OF SCIENCE
By
JEFFREY HARDWICK
Norman, Oklahoma
2018
RESERVOIR QUALITY EVALUATION OF THE MERAMEC AND UPPER OSAGE
UNITS IN THE ANADARKO BASIN
A THESIS APPROVED FOR THE
CONOCOPHILLIPS SCHOOL OF GEOLOGY AND GEOPHYSICS
BY
Dr. R. Douglas Elmore, Chair
Dr. Shannon Dulin
Dr. Zulfiquar Reza

© Copyright by JEFFREY HARDWICK 2018
All Rights Reserved.

iv
ACKNOWLEDGEMENTS
First, I would like to thank Dr. Elmore for the opportunity to join his research group at
OU. His constant guidance and direction throughout this project were instrumental to the
quality of work produced. I would also like to thank Dr. Shannon Dulin and Zulfiquar Reza
for the insight each of you provided in the review and discussion of my thesis. Thank you to
Devon Energy for the data provided in this study, as well as Katie Garrett, Jason Currie,
David Hull, and Tom Peryam for facilitating the project that significantly added to my
professional development. I would also like to thank my friends and colleagues that have
contributed to my work in various fashions, including: Gerhard Heij, Cory Terrell, Matt
Hamilton, Christina Hamilton, and the numerous undergraduates that have worked long hours
in the paleomagnetism lab. Lastly, I would like to thank my family, specifically, my dad and
grandfather for the constant drive and support to reach my goals.

v
Table of Contents
ACKNOWLEDGEMENTS ............................................................................................ iv
LIST OF FIGURES ........................................................................................................ vii
ABSTRACT ................................................................................................................... xii
INTRODUCTION ............................................................................................................ 1
GEOLOGIC SETTING AND PREVIOUS WORK ......................................................... 5
DATA AND METHODS ............................................................................................... 11
Petrography ............................................................................................................... 11
Petrophysics .............................................................................................................. 12
Mapping ............................................................................................................. 12
Hierarchal Clustering Analysis .......................................................................... 13
Total Porosity and Fluid Saturation Models ...................................................... 14
Paleomagnetism ........................................................................................................ 16
RESULTS AND INTERPRETATIONS ........................................................................ 17
Osage Microfacies .................................................................................................... 17
NW STACK ...................................................................................................... 17
STACK .............................................................................................................. 18
Osage Diagenesis/Paragenesis .................................................................................. 22
Fractures ............................................................................................................ 22
Matrix ............................................................................................................... 22
Meramec Microfacies ............................................................................................... 25
Meramec Diagenesis/Paragenesis ............................................................................ 30

vi
Mapping .................................................................................................................... 32
Hierarchal Clustering Analysis (HRA) .................................................................... 35
Total Porosity and Fluid Saturation Models ............................................................. 37
Paleomagnetism ........................................................................................................ 42
DISCUSSION ................................................................................................................. 44
Osage Diagenesis ...................................................................................................... 44
Meramec Diagenesis ................................................................................................ 49
Reservoir Quality ...................................................................................................... 52
Paleomagnetism ........................................................................................................ 53
CONCLUSION .............................................................................................................. 56
REFERENCES ............................................................................................................... 58
vii
LIST OF FIGURES
Figure 1: Base map showing the outline of the study area with the STACK play in yellow
(modified from Cullen, 2017), and the NW STACK inferred from IHS Enerdeq (October
2018). The red solid line from A to A’ defines the transect for the cross section in Figure 7
and B to B’ defines the transect for Figure 9. ............................................................................. 4
Figure 2: Geologic provinces within the state of Oklahoma. The study area is outlined by the
dashed oval and the geologic provinces such as a basin or uplift are outlined by a black line.
Modified from Northcutt and Campbell (1998). ........................................................................ 6
Figure 3: (Left Track) – Stratigraphic nomenclature for the study area (modified from Boyd,
2008). (Middle and Right Track) – Type logs the NW STACK and STACK illustrating the
top of the Meramec, Osage and the lower portion of the Chester interval with gamma ray (left
track) and deep resistivity wireline logs (right track). The NW STACK type log is from
Dewey county and the STACK type log is from Canadian county. ........................................... 8
Figure 4: An example of clusters projected along each principal component axis from one of the
cored wells ................................................................................................................................ 15
Figure 5: NW STACK Osage microfacies. PPL photomicrographs A-F. Calcite is stained red.
Yellow arrows indicate porosity. (A) Chert (Cht.) microfacies showing oil staining and patchy
amounts of calcite remaining in various allochems. (B) Chert microfacies showing porosity
development in spicules (Spi.) in the silica matrix. (C) Chert nodule bounded by stylolite. (D)
Chert nodule with bitumen (Bit.) in the outer portions. (E) Grainstone microfacies with a
moldic pore. (F) Grainstone with porosity along a subtle dissolution seam (arrow). Dark
material in the seam is bitumen. ............................................................................................... 19

viii
Figure 6: STACK Osage microfacies. PPL photomicrographs A-F. Calcite is stained red.
Yellow arrows indicated porosity. Ferroan dolomite is stained blue (E). (A) Chert microfacies
with silica matrix and porosity concentrating spicules (Spi.). (B) Packstone microfacies with
pervasive dissolution and oil staining of the pores. (C) Muddy wackestone microfacies with
an assortment of spicules and other skeletal fragments in a micritc (Mic.) matrix. (D) Calcitic
siltstone microfacies with silt and skeletal fragments (frag). (E) Spiculite. (F) Siltstone with
minor silica replacement in the matrix. .................................................................................... 21
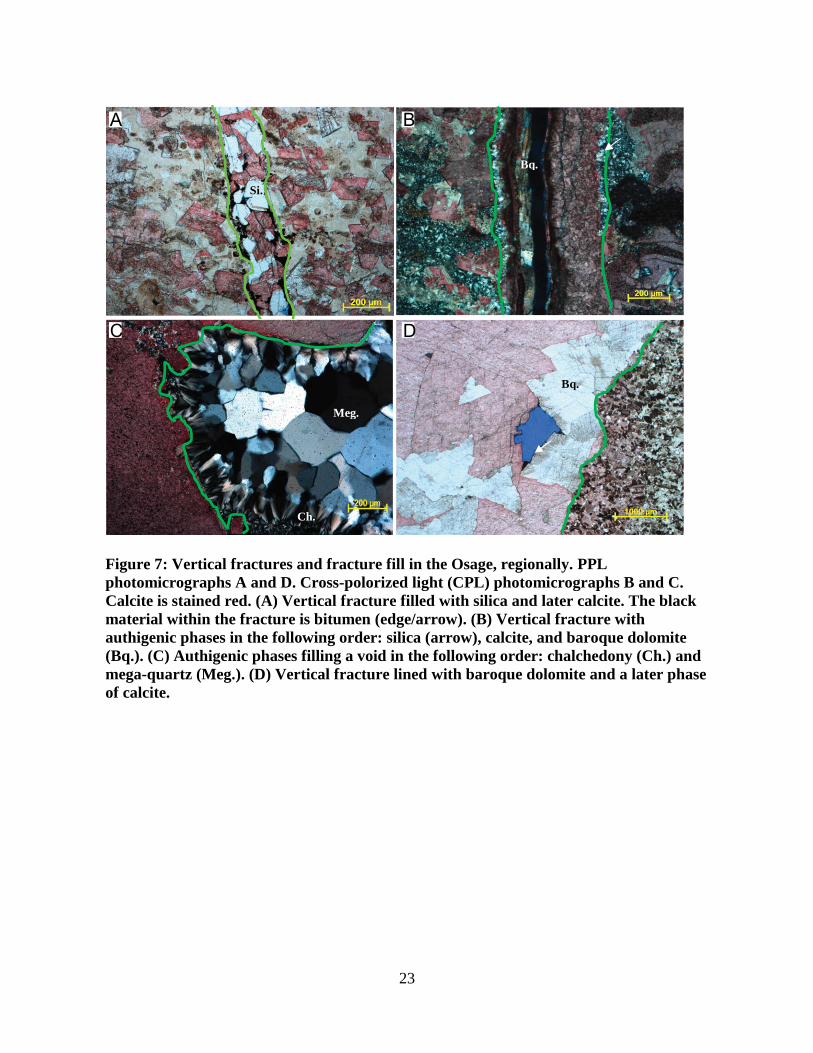
Figure 7: Vertical fractures and fracture fill in the Osage, regionally. PPL photomicrographs A
and D. Cross-polorized light (CPL) photomicrographs B and C. Calcite is stained red. (A)
Vertical fracture filled with silica and later calcite. The black material within the fracture is
bitumen (edge/arrow). (B) Vertical fracture with authigenic phases in the following order:
silica (arrow), calcite, and baroque dolomite (Bq.). (C) Authigenic phases filling a void in the
following order: chalchedony (Ch.) and mega-quartz (Meg.). (D) Vertical fracture lined with
baroque dolomite and a later phase of calcite. ......................................................................... 23
Figure 8: Paragenetic sequence for the Osage showing the relative timing of diagenetic events
observed petrographically. The timing of events are constrained by cross-cutting
relationships. The boundary between near surface events and shallow burial is defined by the
transtion from mechanical to chemical compaction during progressive burial. ....................... 24
Figure 9: Petrographic (left) and core (right) expression of the primary Meramec microfacies.
PPL photomicrographs A-D. Calcite is stained red. (A) Peloidal calcareous siltstone
microfacies. (B) Calcitic siltstone microfacies. (C) Siltstone microfacies. (D) Argillaceous
siltstone microfacies. ................................................................................................................ 27

ix
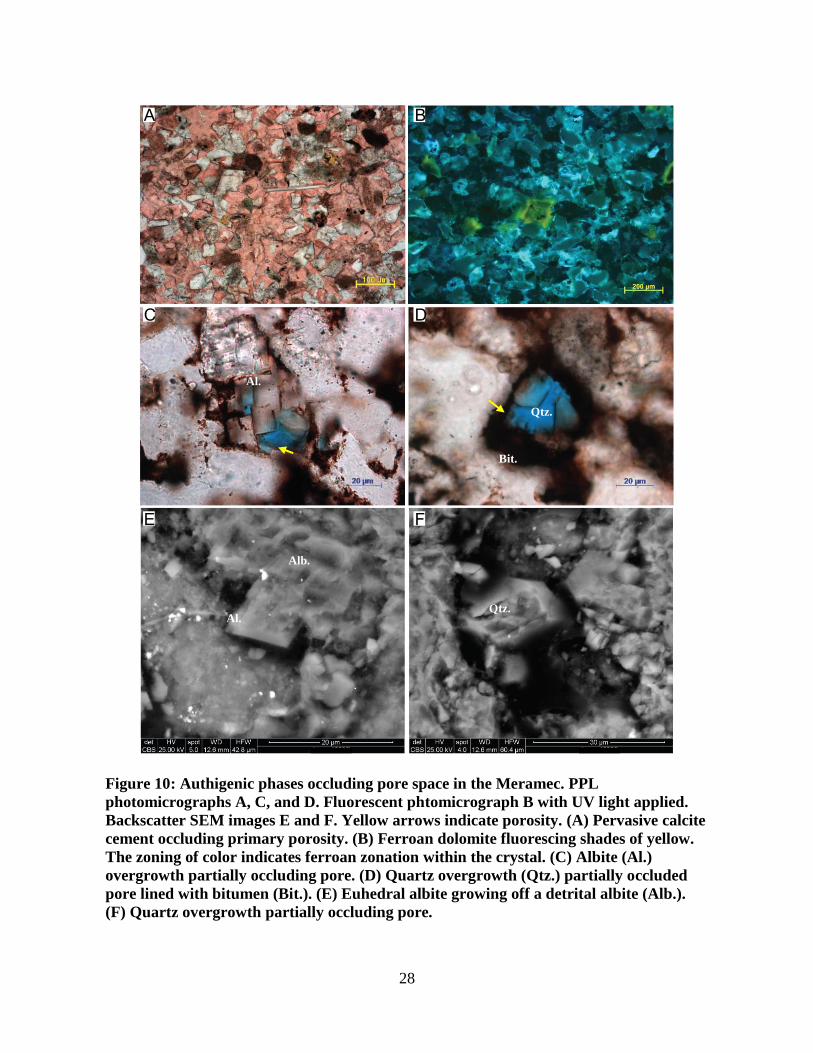
Figure 10: Authigenic phases occluding pore space in the Meramec. PPL photomicrographs A,
C, and D. Fluorescent phtomicrograph B with UV light applied. Backscatter SEM images E
and F. Yellow arrows indicate porosity. (A) Pervasive calcite cement occluding primary
porosity. (B) Ferroan dolomite fluorescing shades of yellow. The zoning of color indicates
ferroan zonation within the crystal. (C) Albite (Al.) overgrowth partially occluding pore. (D)
Quartz overgrowth (Qtz.) partially occluded pore lined with bitumen (Bit.). (E) Euhedral
albite growing off a detrital albite (Alb.). (F) Quartz overgrowth partially occluding pore. ... 28
Figure 11: Common pore-types in the Meramec. PPL phtomicrographs A-F. Half UV light and
half plain light were applied to photomicrograph F. Porosity indicated by yellow arrows. (A)
Intragranular pore in a dissolved feldspar with some bitumen. (B) Dissolved feldspar. (C)
Intergranular pore between framework quartz grains. (D) Intergranular pore partially occluded
by quartz overgrowths and lined with bitumen. (E) Partial dissolution of the grain in the
bottom left. The top right arrow indicates a pore that resides where a cement appears to have
once been. Many other pores such as this one occur within this photomicrograph. (F) UV light
highlighting microporosity. ...................................................................................................... 29
Figure 12: Common pore-types in the Meramec. Backscatter SEM images A-C, E-F. Secondary
electron image D. Yellow arrows indicate porosity (A) Partially dissolved feldspar with
intragranular pores. (B) More extensively dissolved feldspar with intragranular porosity. (C)
Interstital clay porosity. (D) Interstitial clay pores showing the organization of clays influence
on pore location. (E) Slot pore within clay and bitumen. (F) Intergranular pore between
framework grains also filled with bitumen. .............................................................................. 31
Figure 13: Paragenetic sequence for the Meramec showing the relative timing of diagenetic
events observed petrographically. The timing of events are constrained by cross-cutting

x
relationships. The boundary between near surface events and shallow burial is defined by the
transtion from mechanical to chemical compaction during progressive burial. ....................... 33
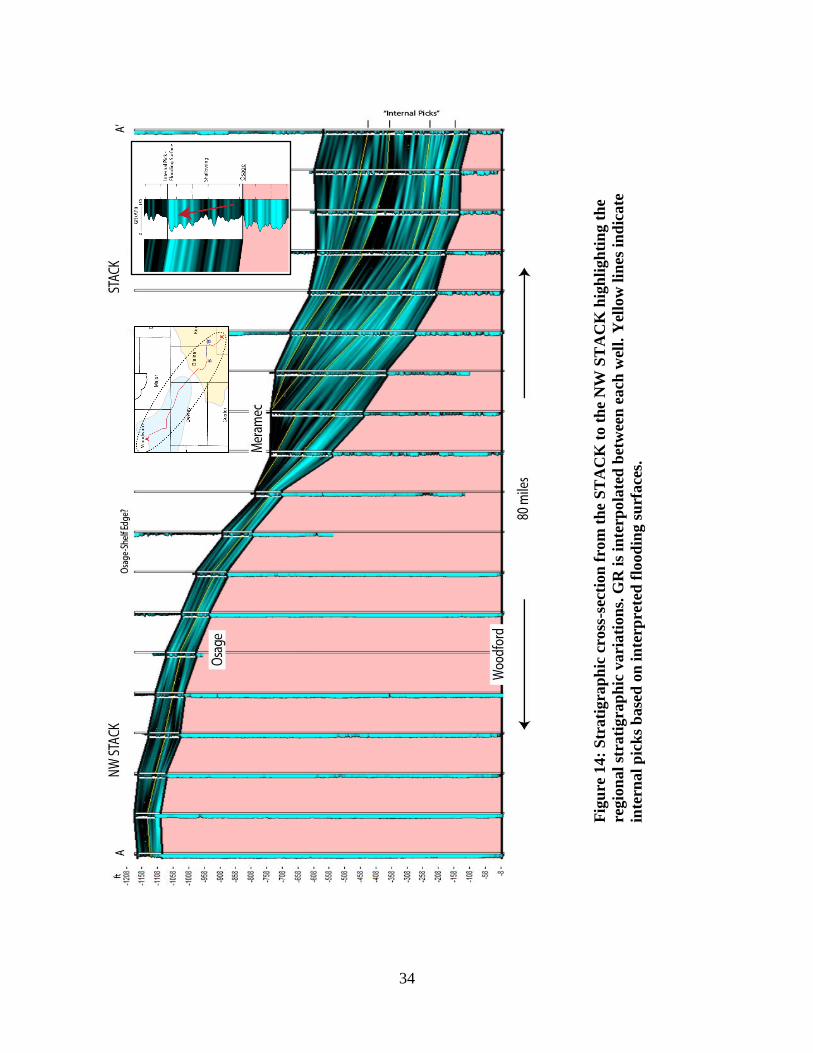
Figure 14: Stratigraphic cross-section from the STACK to the NW STACK highlighting the
regional stratigraphic variations. GR is interpolated between each well. Yellow lines indicate
internal picks based on interpreted flooding surfaces. ............................................................. 34
Figure 15: Wireline log from Kingfisher county showing the relationship of the electrofacies
(left) to the microfacies (right). Left track is GR, the middle-left is AT90, the middle-right is
NPHI/DPHI, and the far-right is the electrofacies output. Notice that there is one more
electrofacies than microfacies. ................................................................................................. 36
Figure 16: Crossplot of bulk density versus neutron porosity. The trend line that is labeled
depostional illustrates the influence of clay versus calcite and the primary microfacies on
petrophyscial properties. Notice that each of the four microfacies fall along this trend. The
fifth electrofacies falls along an alternative trend that transtions from calcitic siltstone to a
calcitic siltstone with enhanced dissolution resulting in the lower bulk density. ..................... 38
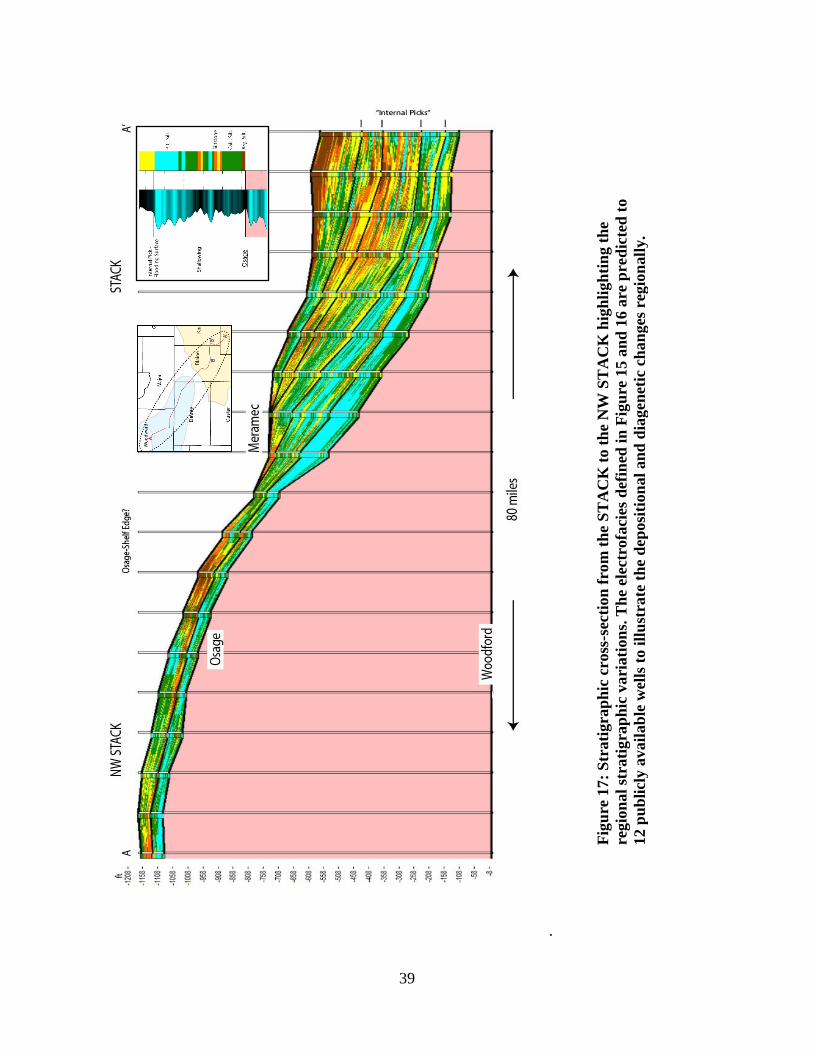
Figure 17: Stratigraphic cross-section from the STACK to the NW STACK highlighting the
regional stratigraphic variations. The electrofacies defined in Figure 15 and 16 are predicted
to 12 publicly available wells to illustrate the depositional and diagenetic changes,
respectively. .............................................................................................................................. 39
Figure 18: An example of the BVH and PHIT model applied (right track) to a well from
Kingfisher county. Notice the electrofacies dependency of the models. ................................. 40
Figure 19: Cross section through portions of Blaine and Kingfisher counties. (Top) Electrofacies
predicted and interpolated between wells. (Middle) PHIT is predicted and interpolated

xi
between wells. Warm colors indicate high PHIT. (Bottom) BVH is predicted and interpolated
between wells. Warm colors indicate high BVH. .................................................................... 41
Figure 20: (Top) Representative Zijderveld diagrams for thermal demagnetization in the
Meramec and Osage. (Bottom) Representative NRM versus temperature plots from the
Meramec and Osage. High temperature steps were removed from the Zijderveld diagrams for
illustration purposes. ................................................................................................................. 43
Figure 21: (Top) Representative Zijderveld diagrams for alternating field (AF) demagnetization
in the Meramec and Osage. (Bottom) Represenative NRM versus applied field plots from the
Meramec and Osage. ................................................................................................................ 45
Figure 22: Histogram of the inclination for ChRM from the thermal demagnetization
experiments in the Meramec and Osage. .................................................................................. 46
Figure 23: Expected inclination through geologic time plot used to date the characterstic
remanent magnetization (ChRM). The dark red is line is the mean inclination and the light red
lines are the associated error. The purple box shows the age range for both units and the green
box shows the error for the mean inclation (solid green) of the ChRM. .................................. 47
Figure 24: Basin model (modified from Carter et al., 1998) for the study area near the core
provided for the paleomagnetic study. ..................................................................................... 55

xii
ABSTRACT
The objective of this study is to provide a comparative look at the diagenetic evolution
and reservoir quality characteristics of the Meramec and Upper Osage units in the STACK
(Sooner Trend Anadarko Basin of Canadian and Kingfisher counties) and NW STACK
(extension of the STACK, to the northwest, into portions of Dewey, Blaine, Woodward, and
Major counties, Oklahoma). Both are hybrid unconventional plays in the Anadarko Basin of
Oklahoma and consists of a complex depositional sequence of Middle Mississippian
siliciclastics and carbonates of Meramecian and Osagean age as well as the Late Devonian to
Early Mississippian organic-rich Woodford Shale.
Unsupervised Hierarchical Clustering Analysis (HRA) was performed to connect
reservoir-scale petrophysical observations with micro-scale petrographic observations. The
clustering analysis yielded five distinct electrofacies in the Meramec that represent
depositional trends in mineralogy and diagenetically enhanced intervals of anomalous
feldspar dissolution. Implementing HRA provided a genetic-based workflow for reservoir
quality prediction and understanding. Wireline data from twelve publicly available wells with
core and wireline data from seven other wells provided the framework to demonstrate the
predictive workflow presented in this study.
Paleomagnetic and petrographic data were integrated to discern the diagenetic
evolution of each unit. Petrographic analysis revealed a pervasive marine calcite cement in
silt-dominated microfacies of the Osage and Meramec. The calcite cement significantly
occluded primary porosity and created baffles for vertical fluid flow. The terrigenous input of
clay partially protected primary porosity enhancing fluid flow in the more framework
dominated microfacies. The primary pore-types observed in good reservoir quality

xiii
microfacies include: intragranular pores in feldspars, interstitial porosity in clay, and
intergranular pores in between other framework grains such as silt. Thermal demagnetization
revealed a characteristic remanent magnetization (ChRM) removed at unblocking
temperatures ranging from 250°C to 450°C. The ChRM displayed shallow inclinations
consistent with an acquisition of approximately 300 Ma. The ChRM is interpreted as a
chemical remanent magnetization (CRM) related to the emplacement of hydrocarbons; thus,
providing a critical temporal component on the evolution of the petroleum system.

1
INTRODUCTION
The integration of advanced drilling and completion designs have revolutionized our
ability to extract hydrocarbons from unconventional oil and gas reservoirs. While much
attention has been placed on developing primary self-sourced shale reservoirs, hybrid tight oil
and gas reservoirs are proving economically viable under the appropriate geologic conditions
and commodity prices. The STACK (Sooner Trend Anadarko Basin of Canadian and
Kingfisher counties (Miller, 2018)) is one such hybrid play in the Anadarko Basin of
Oklahoma. The STACK is comprised of a complex depositional sequence of Middle
Mississippian siliciclastics and carbonates of Meramecian (Meramec-Unit) and Osagean
(Osage-Unit) age as well as the underlying Late Devonian to Early Mississippian Woodford
Shale (Price, 2017). The Woodford Shale acts a vital source rock in the Anadarko Basin
(Johnson et al., 1992) and the overlying Meramec and Osage units are low permeability
reservoirs that likely rely on charging from the Woodford Shale to be economically
producible.
Of the many criteria involved in the migration and subsequent charging of reservoirs
by hydrocarbons; the evolution of the pore system is one that requires diligent
characterization. Diagenetic processes such as cementation, illitization, and albitization are a
few of the processes that can have a strong influence on the dynamic evolution of a pore
system (Morad, 2010). Diagenesis encompasses any process from deposition to
metamorphism (Ali et al., 2010). Conventional wisdom from Hayes (1979) provides four key
fundamentals on diagenetic interactions in sandstones. They are: primary intergranular
porosity and associated permeability are significantly reduced during burial due to
compaction, cementation, and a number of other mechanisms; secondary porosity can be

2
created at depth from the dissolution of unstable framework grains; chemical processes are
kinetically controlled and the pore fluid acts as the operating medium; and finally, the given
path of a lithotype from source to sink presets the diagenetic reactions during progressive
burial. These fundamental concepts of sandstone diagenesis are most viable in a principally
siliciclastic depositional environment. Mixed siliciclastic-carbonate sequences can comprise a
much different style of diagenesis because calcite is hundreds of times more soluble than
quartz in near-surface conditions (Ali, 2010). Therefore, a number of modifications can occur
that are associated with the mobilization of calcite into the pore fluid. In a shallow marine
setting, seawater is the initial fluid in primary pore space. This can result in the precipitation
of marine carbonate cements occluding a significant volume of the initial porosity (Ali, 2010).
In a mixed siliciclastic-carbonate depositional setting both sediment types can be cemented by
marine seawater because each may have sufficient primary porosity to accommodate flow
near the sediment water interface (Morad, 2010).
This project aims to investigate the diagenesis and reservoir quality of one such mixed
siliciclastic-carbonate sequence defined by the Meramec and Upper Osage units in the
STACK and NW STACK (North West extension of STACK). The study area covers portions
of Woodward, Dewey, Major, Blaine, Canadian, and Kingfisher counties in Oklahoma, as
outlined in Figure 1. The project contributes to the understanding of how micro-scale textural
fabrics (diagenetic and depositional) relate to storage and flow property variations while also
adding insight into the diagenetic evolution of the Meramec and Osage. These contributions
were accomplished through the integration of petrography, petrophysics and paleomagnetism
utilizing seven cores and twelve publicly available wells. The principal goals of this study
were to:

3
1. Identify the diagenetic or depositional control on reservoir quality.
2. Connect micro-scale observations to reservoir-scale observations.
3. Devise a petrophysical workflow for predicting reservoir quality.
4. Define the paragenesis of the Meramec and Osage.
5. Test for a secondary magnetization that may date diagenetic events.
Achieving these goals will prove the hypothesis that the reservoir quality of the mixed
siliciclastic-carbonate depositional sequence of the Meramec and Osage is strongly connected
to depositional facies. It will also allow for the integration of micro-scale and reservoir-scale
observations creating a genetic petrophysical workflow for reservoir quality prediction and
understanding. A second hypothesis to test is that the Meramec and Osage were diagenetically
influenced by hydrothermal fluids and contain a chemical remanent magnetization (CRM) as
a result.

4
Figure 1: Base map showing the outline of the study area with the STACK play in yellow
(modified from Cullen, 2017), and the NW STACK inferred from IHS Enerdeq
(October 2018). The red solid line from A to A’ defines the transect for the cross section
in Figure 7 and B to B’ defines the transect for Figure 9.
5
GEOLOGIC SETTING AND PREVIOUS WORK
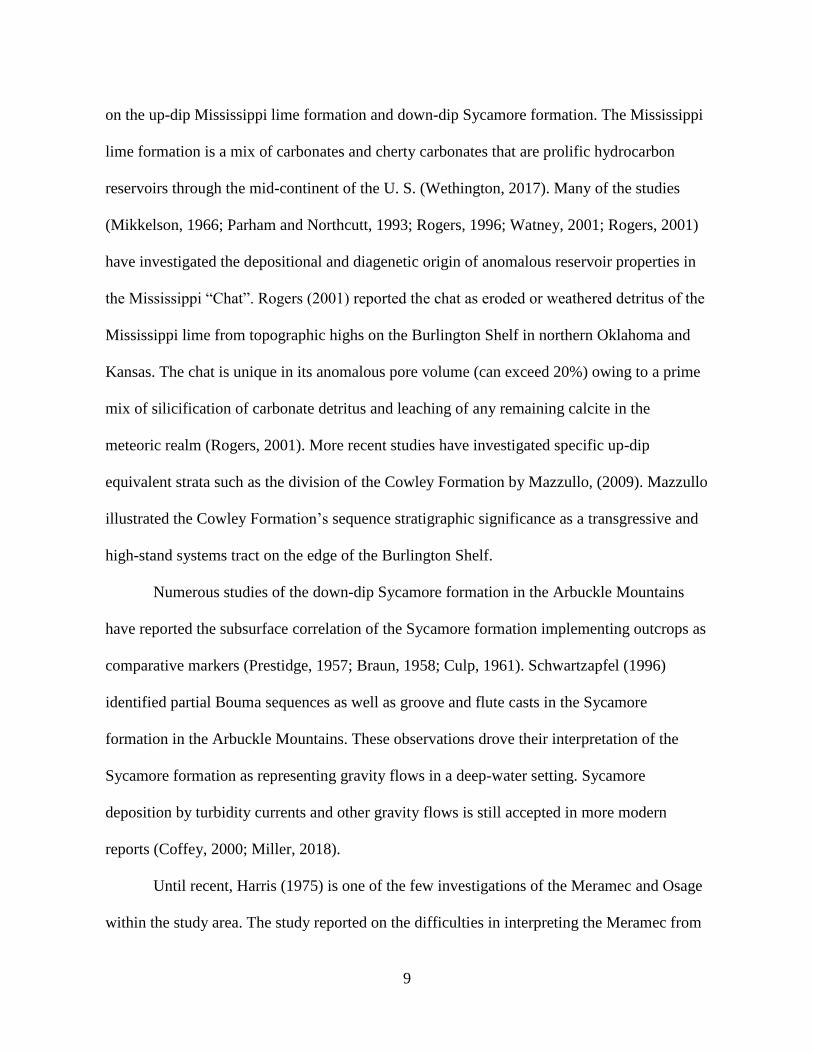
The study area for the Meramec and Osage is situated on the northeastern margin of
the Anadarko Basin (Figure 2). The Meramec and Osage sediments were deposited in the
predecessor Oklahoma Basin, which was the regional depocenter that defined the paleo-
bathymetry throughout Osagean and Meramecian time (Johnson, et al., 1989). The Oklahoma
Basin covered a large portion of the Southern Midcontinent, extending from Oklahoma to
Arkansas and smaller portions of Kansas, Colorado, and Texas (Johnson et al., 1989). It
developed in response to broad subsidence and epeirogenic movements acting on the
lithosphere during the Late Cambrian though Mississippian, similar to a passive margin, as
referred to by Nicholas and Rozendal (1975); and Keller et al. (1983). Johnson et al. (1989)
described the basin as having a shelf geometry with a significant volume of marine deposits
that thicken into proto-basins such as the Anadarko Basin. Within the Oklahoma Basin, the
Southern Oklahoma Aulacogen acted as the primary depocenter (Ham and Wilson, 1967;
Gilbert, 1983). The aulacogen is the site of the failed arm of a continental rift from the
Cambrian (Wickham, 1978). Extensive magmatic overprinting of the upper lithosphere and
the subsequent cooling phase initiated the subsidence that provided the accommodation space
for the aulacogen to act as the primary depocenter in the Oklahoma Basin (Feinstein, 1981;
Carter et al., 1998; Keller, 2014).
The Anadarko Basin (see Figure 2) is referred to by Perry (1989) as the deepest
sedimentary basin within the North American continent. It is bounded to the east by the
Nemaha Uplift, to the south by the Wichita Uplift, and to the west by the Cimarron Arch
(Johnson et al., 1989). In the southern portions of the basin, near the margin with the Wichita
Uplift, Paleozoic sedimentary strata can be as thick as 40,000 feet (12,000 meters). The

6
Figure 2: Geologic provinces within the state of Oklahoma. The study area is outlined by
the dashed oval and the geologic provinces such as a basin or uplift are outlined by a
black line. Modified from Northcutt and Campbell (1998).
Fig
ure
2:
Geo
logic
pro
vin
ces
wit
hin
th
e st
ate
of
Ok
lah
om
a.
Th
e st
ud
y a
rea
is
ou
tlin
ed b
y t
he
dash
ed o
val
an
d t
he
geo
logic
pro
vin
ces
such
as
a b
asi
n o
r u
pli
ft a
re o
utl
ined
by a
bla
ck l
ine.
Mod
ifie
d f
rom
No
rth
cutt
an
d C
am
pb
ell
(1998).

7
northern reaches of the basin, nearing the shelf, exhibit significant asymmetry resulting in a
much thinner package of sedimentary strata nearing 10,000 feet (3,000 meters) (Johnson et
al., 1989).
Through much of the Early and Middle Paleozoic the Anadarko Basin and adjacent
Wichita-Amarillo crustal blocks were coupled and gently subsided in the Oklahoma Basin.
Late Morrowan time punctuated the most rapid subsidence due to a collisional event between
the North American and Gondwanan lithospheric plates, referred to as the Ouachita orogeny
(Johnson et al., 1989; Perry, 1989). The orogeny inverted the Cambrian rift providing a
structural boundary for the Anadarko Basin. It also uplifted and detached the Wichita-
Amarillo block from the Anadarko block nearly 40,000 feet (12,000 meters) along regional
reverse faults (Johnson et al., 1989).
Within the study area, the Meramec is underlain by variably thick intervals of Osage
carbonates and Upper Devonian to Early Mississippian Woodford Shale (Figure 3). Overlying
the Meramec is Chesterian associated strata of the Chester Shale and Springer Group (Figure
3). The Meramec and Osage within the study area do not have a biostratigraphic constraint,
rather each are defined by their unique log characteristics (Figure 3) and correlations between
the STACK and NW STACK. The top of the Meramec is defined by an abrupt decrease in
resistivity and increase in gamma ray associated with the increased clay content of the Chester
Shale. The top of the Osage (or base of Meramec) is generally defined by a sudden increase in
resistivity and decrease in gamma ray due to tight carbonates in the section. Locally, within
the NW STACK, the resistivity may be lower and more variable at this boundary because of
lenticular or brecciated diagenetically altered chert.
Previous studies of Osagean and Meramecian associated strata have focused primarily

8
Figure 3: (Left Track) – Stratigraphic nomenclature for the study area (modified from
Boyd, 2008). (Middle and Right Track) – Type logs the NW STACK and STACK
illustrating the top of the Meramec, Osage and the lower portion of the Chester interval
with gamma ray (left track) and deep resistivity wireline logs (right track). The NW
STACK type log is from Dewey county and the STACK type log is from Canadian
county.
9
on the up-dip Mississippi lime formation and down-dip Sycamore formation. The Mississippi
lime formation is a mix of carbonates and cherty carbonates that are prolific hydrocarbon
reservoirs through the mid-continent of the U. S. (Wethington, 2017). Many of the studies
(Mikkelson, 1966; Parham and Northcutt, 1993; Rogers, 1996; Watney, 2001; Rogers, 2001)
have investigated the depositional and diagenetic origin of anomalous reservoir properties in
the Mississippi “Chat”. Rogers (2001) reported the chat as eroded or weathered detritus of the
Mississippi lime from topographic highs on the Burlington Shelf in northern Oklahoma and
Kansas. The chat is unique in its anomalous pore volume (can exceed 20%) owing to a prime
mix of silicification of carbonate detritus and leaching of any remaining calcite in the
meteoric realm (Rogers, 2001). More recent studies have investigated specific up-dip
equivalent strata such as the division of the Cowley Formation by Mazzullo, (2009). Mazzullo
illustrated the Cowley Formation’s sequence stratigraphic significance as a transgressive and
high-stand systems tract on the edge of the Burlington Shelf.
Numerous studies of the down-dip Sycamore formation in the Arbuckle Mountains
have reported the subsurface correlation of the Sycamore formation implementing outcrops as
comparative markers (Prestidge, 1957; Braun, 1958; Culp, 1961). Schwartzapfel (1996)
identified partial Bouma sequences as well as groove and flute casts in the Sycamore
formation in the Arbuckle Mountains. These observations drove their interpretation of the
Sycamore formation as representing gravity flows in a deep-water setting. Sycamore
deposition by turbidity currents and other gravity flows is still accepted in more modern
reports (Coffey, 2000; Miller, 2018).
Until recent, Harris (1975) is one of the few investigations of the Meramec and Osage
within the study area. The study reported on the difficulties in interpreting the Meramec from

10
the Osage in subsurface correlations and described the variations of facies present from silty
carbonates to more clay dominated intervals through the section. With the recent increase in
operations in the STACK play, a revived interest has developed on revisiting the fundamental
understanding of these units. An emphasis has been placed on providing insight into the
depositional system and sequence stratigraphic hierarchy. A series of retrogradational and
progradational parasequence sets defined by northeast-southwest strike-elongate clinoforms
have been identified by Price et al. (2017) and Miller (2018). The Meramec has been
proposed by Price et al. (2017) to represent strata influenced by basinal currents in a
subaqueous delta setting with deposition below storm-weather wave base. Miller (2018)
postulates for deposition on a shallow ramp between fair-weather wave base and just below
storm-weather wave base with reworking by storms and basinal currents.
Regional diagenesis work of Meramecian and Osagean correlative strata in
northcentral Oklahoma by Dehcheshmehi (2016) found homogenization temperatures greater
than 140°C in carbonate and quartz cements which is nearly ~50°C higher (Cardott, 2014)
than the burial temperature for the area. Dehcheshmehi (2016) suggested the dispersion of
these temperatures may be related to pulses of thermal anomalies from deeper basinal fluids
in Ordovician and Cambrian strata. Further postulating, the migration of these fluids may be
related to basinal fluid flow activity during the Ouachita and Appalachian orogenies
(Dehcheshmehi, 2016). A diagenetic study of the Woodford Shale in the southeastern
Anadarko Basin by Roberts (2017) also postulated a relationship between hydrothermal fluids
and the Ouachita orogeny. Therefore, the regional paleo-plumbing system that seems to have
diagenetically altered Mississippian strata may also influence the diagenesis within the study
area.
11
DATA AND METHODS
Seven vertical, un-oriented cores from the northern margin of the Anadarko Basin
were provided by Devon Energy for the study. The data provided with each core is as follows:
thin sections at a variable sampling rate of a 1-2 feet, with a total of seven hundred and fifty-
six between all cores; triple-combo wireline logs which include gamma ray (GR), deep –
resistivity (AT90), neutron porosity (NPHI), and bulk density (RHOB); core gamma ray; x-
ray diffraction mineralogical analysis (only in the Meramec); and core photos.
Petrography
Seven hundred and fifty-six thin sections were impregnated with blue epifluorescent
epoxy and polished to a thickness of thirty microns. The epoxy helps with the identification of
micropores under ultraviolet light that may not protrude completely through the thin section
because of their small size or asymmetry. Thin sections were also stained with a mixed
concentration of alizarin red and potassium ferricyanide; calcite is stained red, potassium
feldspars are stained yellow, and ferroan carbonates or zoned ferroan carbonates are stained
blue. Thin section analysis was performed under plane-polarized, cross-polarized, reflected,
and ultraviolet light on a Zeiss AxioImager.Z1m. Photomicrographs were captured with a
linked AxioVision microscope camera attachment. The analysis focused on organizing each
thin section into a microfacies classification scheme, to characterize the regional variability of
depositional and/or diagenetic alteration within the study area. The microfacies classification
was based on grain size, sorting, volume proportion of primary framework grains to
secondary authigenic components, and the common pore – types present. An emphasis was

12
also placed on determining the interplay of the depositional texture and diagenetic overprint
on the evolution of the pore system. Quantitative mineral volume determinations via point
counting were not carried out due to the number of thin sections; however, upon the adequate
classification of microfacies for a given core, the x-ray diffraction data was used to
supplement the microfacies classification scheme. The x-ray diffraction data was integrated
after the thin section analysis to avoid bias in the microfacies classification scheme. Core
photos provided supplemental observations to confirm thin section observations, but a
conventional core description was not utilized in this study for microfacies identification. A
core description was not performed because of the densely spaced thin sections made
available and the microscale stratigraphic variability that is present in core requiring thin
section confirmation.
A FEI Quanta 250 scanning electron microscope (SEM) and Bruker XFlash 6I100 x-
ray detector (EDX) were utilized in imaging pore-types across microfacies to provide a
supplemental micro-scale in determining pore-sizes and potential overgrowths. The EDX also
provided a quantitative means for determining elemental analysis of detrital, authigenic, and
other phases unidentifiable or with otherwise ambiguous optical properties. Image
segmentation was attempted; however, the polishing of the thin sections did not allow for
successful results. SEM analysis was pivotal in confirming the observations made on the
petrographic microscope and bridged the rest of the study in comparing the variety of scales
integrated in the study to characterize the reservoir quality of the Meramec and Osage.
Petrophysics
Mapping
To establish a framework that provided a regional comparison between the STACK

13
and NW STACK an effort was placed on adding extra stratigraphic information between each
core with publicly available wells. Therefore, approximately one thousand five hundred well
logs across Woodward, Major, Dewey, Blaine, Kingfisher, and Canadian counties were
acquired from IHS Enerdeq. Mapping and correlation of the Meramec and Osage intervals
followed in IHS Petra on the wells that had the intervals present and the log suites that made
the picks allowable. The subsurface mapping culminated in a regional stratigraphic
comparison through a cross-section from the NW STACK to STACK instead of regional
isopachs or reservoir models. Twelve publicly available wells with the accompanying log
suites of GR, AT90, DPHI, and NPHI were digitized in Petra’s digitizing module to integrate
in the cross section. Finally, within the Meramec interval additional internal picks were made
based on interpreted flooding surfaces and shallowing depositional sequences.
Hierarchal Clustering Analysis
A principal goal of this study was to make an asserted effort to complement the
petrographic work at the micro and nano-scale to a more practical reservoir scale with log
responses. To achieve this, unsupervised Hierarchal Clustering Analysis (HRA) was
implemented to organize the available log suites into similar responses. The term
“electrofacies” is used to describe the output of HRA into clusters of data by well log
responses. These clusters are ideally defined by variations in mineralogy, fabric, thickness,
and petrophysical properties that potentially relate to diagenetic or depositional processes
(AlBahadily and Nasser, 2017).
The inputs to the HRA were GR, AT90, RHOB, and NPHI. For each of the nineteen
wells used in the HRA workflow, the GR log was normalized with a cumulative histogram
over the Meramec interval. Minimum and maximum percentiles of five and ninety-five,

14
respectively, transformed the magnitudes within the Meramec of the publicly available wells.
RHOB and NPHI were normalized in a similar fashion. The STACK and NW STACK
associated well logs were separated during normalization to achieve calibration from
geologically similar areas.
Log normalization was followed by numerous clustering runs each with a different
number of defined modes. Each mode configuration was projected in principal component
space (as in Figure 4) to deem the range of statistically viable mode configurations. The range
of mode configurations were also plotted in petrophysical space. This allows the user to
consider the practicality of a given mode definition to the goal of clustering itself. Finally, the
microfacies of the seven cored wells were plotted next to the electrofacies to compare the
representation of the variability observed petrographically to the responses of the well logs.
HRA was applied exclusively to the cored wells due to the constraint of the thin sections.
Core images with each of these wells also allowed for the consideration of the sampled
interval thickness to the corresponding log resolution. The centroids of the final clustering
output also detailed the association of the data in the publicly available wells to a specific
cluster based on its Euclidian distance. In turn, allowing for the ability to predict the
electrofacies defined by the microfacies to the publicly available wells.
Total Porosity and Fluid Saturation Models
To supplement the interpreted storage capacity and hydrocarbon potential for specific
intervals in the Meramec models for both total porosity (no core porosity available) and fluid
saturation were developed. The total porosity was calculated from cross-plot porosity of NPHI
and DPHI. This method incorporates a shale volume (VSHALE) correction. VSHALE was
calculated and normalized to clay volume from XRD data throughout the Meramec. Due to

15
Figure 4: An example of clusters projected along each principal component axis from
one of the cored wells
16
the clay content in the Meramec and concern for overestimated water saturation a dual water
saturation method was used that would account for clay distribution with VSHALE as an
input. The other inputs to the water saturation model were a formation water resistivity of .05,
a cementation exponent of 1.77, and saturation exponent of 1.77 (Puzin, 1951). The purpose
of the fluid saturation and total porosity models was to define how each parameter varies
though the section. It is quite possible that the magnitudes predicted in each of these models
could be quite different than actual reservoir conditions, but the trends should be similar.
Paleomagnetism
Samples from an un-oriented core in Dewey county were collected for the
paleomagnetic portion of the study. The samples were oriented relative to a scribe line and cut
by a water-cooled drill press at the University of Oklahoma. All samples were cut further into
(2.2-centimeter length) specimens to have multiple data points for each stratigraphic sampling
interval. Two demagnetization methods were applied: alternating field (AF) and thermal
demagnetization. Fifteen specimens were demagnetized by AF in steps of 10 mT up to 120
mT. The remaining sixty-two were thermally demagnetized in steps of 100°C from natural
remanent magnetization (NRM) 200°C and 25°C from 200°C to 700°C. At each step the
NRM was measured in a 2G Enterprises three-axis cryogenic magnetometer with DC
SQUIDS. Analysis of the paleomagnetic data was performed in the SuperIAPD program
picking principal components as defined by Krischvink (1980) on plots of the orthogonal
projections of inclination and declination (Zijederveld, 1967). Mean angle of deviation
(MAD) was below fifteen degrees for each component. Inclination only values were
calculated (Aronson and Levy., 2010) and used to determine the age of magnetizations by
comparison to expected inclinations for the study area.
17
RESULTS AND INTERPRETATIONS
To logically organize the observations of the petrography in the Meramec and Osage
the two will be subdivided in the following section. The primary microfacies of each unit in
the STACK and NW STACK will be defined and the more local secondary microfacies that
are diagenetically significant will also be described.
Osage Microfacies
The Osage consists of differing microfacies in the NW STACK as compared to the
STACK. The NW STACK is comprised of two primary microfacies: chert and skeletal
grainstone (Figure 5). The STACK consists of six primary microfacies, each of which are
more diluted by silt than the NW STACK. They are: skeletal packstone, muddy wackestone,
siltstone, fossiliferous siltstone, spiculite, and chert (Figure 6).
NW STACK
Chert (Figure 5-A): The chert microfacies is most common in the uppermost part of
the section and is observed in forms of lenticular and nodular chert as a replacement of a
previous carbonate depositional fabric by microcrystalline silica. Calcite, dolomite and de-
dolomite are also authigenic and are locally present throughout. The microcrystalline silica
matrix preserves ghost fabrics of the previous allochems through the overall geometry and
subtle crystal size variations. These fabrics are most prevalent in sponge spicules along
transects and horizontal slices. Locally, dissolution of the silica matrix is present, and the
dissolution seems to preferentially dissolve sponge spicules (Figure 5-B). These pores can
range from a few microns to twenty microns and can locally exceed ten volume percent pore
space. The chert microfacies are often bound by dissolution seams. The seams accumulate

18
insoluble material such as clay and solid bitumen (Figure 6-C). Bitumen is often present on
the outer rim of chert nodules adjacent to dissolution seams (Figure 6-D). The chert also
contains vertical fractures filled with authigenic phases such as silica, calcite, baroque
dolomite, and mega-quartz partially filling the fractures (Figure 7). The fractures occur in
intervals with abundant authigenic chert.
Skeletal Grainstone (Figure 5-E): The skeletal grainstone microfacies consists of a
diverse fossil assemblage including crinoids, brachiopods, echinoids, bryozoans, ostracods
and other disarticulated skeletal fragments. Minor amounts of authigenic dolomite, sparite
(sparry calcite cement), idiomorphic quartz, and pyrite (framboidal and cubic) are also
present. Extensive chemical compaction has resulted in a pervasive fabric of sutured grain to
grain contacts, subtle dissolution seams, and pronounced stylolites. The extensive nature of
the chemical compaction may mask the true depositional fabric of more muddy intervals
because of micrite solubility, such that packstone intervals could be completely removed at
dissolution seams leaving little evidence of their stratigraphic position. Many of the larger
crinoid grains (>20 microns) contain intragranular micro-porosity. Other more local porosity
includes moldic dissolution pores of various allochems (Figure 5-E) and intercrystalline pores
adjacent to idiomorphic quartz. Many of the subtle stylolites also contain segments of
dissolution with bitumen in the pore space (Figure 5-F).
STACK
Chert (Figure 6-A): The chert microfacies of the STACK is similar to the NW STACK
chert microfacies in the sense of the observed replacement of a previous carbonate by
authigenic silica. However, there is a higher volume of spicules in the silica matrix and the
replacement is more patchy and as a result many partially replaced crinoids are observed.

19
Figure 5: NW STACK Osage microfacies. PPL photomicrographs A-F. Calcite is stained
red. Yellow arrows indicate porosity. (A) Chert (Cht.) microfacies showing oil staining
and patchy amounts of calcite remaining in various allochems. (B) Chert microfacies
showing porosity development in spicules (Spi.) in the silica matrix. (C) Chert nodule
bounded by stylolite. (D) Chert nodule with bitumen (Bit.) in the outer portions. (E)
Grainstone microfacies with a moldic pore. (F) Grainstone with porosity along a subtle
dissolution seam (arrow). Dark material in the seam is bitumen.
Cht.
Cal.
Sta.
. Cht.
Spi.
Cal.
Cht.
Bit.
Cht.
Cal.
Sty.

20
Dissolution targets sponge spicules within the silica matrix. The occurrence of the chert
microfacies in the STACK is less abundant than the NW STACK and is commonly
interbedded with silt-dominated microfacies.
Skeletal Packstone (Figure 6-B): The skeletal packstone microfacies consists of a
fossil assemblage of crinoids, bryozoans, brachiopods, ostracods, and other skeletal
fragments. The microfacies also contains detrital silt, with authigenic sparite, pyrite and rare
dolomite. Some dissolution seams are present, but they are sparse in comparison to the
magnitude observed in the NW STACK. Locally, pervasive dissolution of various allochems
is observed with significant oil staining at the core scale.
Muddy Wackestone (Figure 6-C): The muddy wackestone microfacies predominantly
consists of micrite, detrital silt, sponge spicules, brachiopod spines, disarticulated crinoids,
sparite, and pyrite (framboidal and cubic). Little to no porosity is observed in this fine-grained
carbonate microfacies. Locally, spicules and brachiopod spines have been replaced by sparite.
Calcitic Siltstone (Figure 6-D): The calcitic siltstone microfacies is poorly sorted and
contains moderate to coarse, sub-angular silt, peloids, potassium feldspars, skeletal fragments,
pyrite, clay, sparse muscovite, and calcite cement (marine). Little to no porosity was observed
during thin section analysis.
Spiculite (Figure 6-E): The spiculite microfacies consists of a configuration of
randomly oriented sponge spicules within a matrix of clay. Other grains include detrital silt,
potassium feldspar, pyrite and ferroan dolomite (stained blue). Sparse and isolated amounts of
moldic pores in spicules are also observed.
Siltstone (Figure 6-F): The siltstone microfacies is defined by a moderately sorted
fabric of silt, clay, potassium and plagioclase feldspars, calcite and silica cement, pyrite, and

21
Figure 6: STACK Osage microfacies. PPL photomicrographs A-F. Calcite is stained red.
Yellow arrows indicated porosity. Ferroan dolomite is stained blue (E). (A) Chert
microfacies with silica matrix and porosity concentrating spicules (Spi.). (B) Packstone
microfacies with pervasive dissolution and oil staining of the pores. (C) Muddy
wackestone microfacies with an assortment of spicules and other skeletal fragments in a
micritc (Mic.) matrix. (D) Calcitic siltstone microfacies with silt and skeletal fragments
(frag). (E) Spiculite. (F) Siltstone with minor silica replacement in the matrix.
Cht.
Spi.
Mic.
Silt
Frag.
Spi.
Sil.
Spi..
22
sparse muscovite. The calcite cement occludes primary pore space and the authigenic silica is
locally replacing the matrix. Little to no pores are observed in the siltstone microfacies.
Osage Diagenesis/Paragenesis
Fractures
There are two primary vertical fracture sets that have cross-cutting
relationships to constrain the timing of one relative to the other. However, these fracture sets
do not contain any cross-cutting interaction with the authigenic phases present in the matrix to
constrain the timing of the fractures relative to matrix diagenesis. The earlier fracture set is
filled with silica and a later calcite (Figure 7-A). The later fracture set is locally composed of
chalcedony on the boundaries and mega-quartz nearing the center (Figure 7-C). The more
commonly observed fill is comprised of baroque dolomite on the edges and large syntaxial
calcite in the center (Figure 7-A/D). Both fracture sets have evidence for late hydrocarbon
migration in the form of solid bitumen present on fracture boundaries and at triple junctions of
grain boundaries within the fracture fill.
Matrix
Micritization of various skeletal fragments represents the first diagenetic event in the
near-surface environment (Figure 8). The calcite cement that has replaced many crinoids and
bryozoan in the matrix of silica is observed with patches of silica replacement suggesting the
silicification post-dated the calcite cementation. The phases of dolomite and de-dolomite also
within the silica matrix do not have patches of silica replacement indicating the dolomitization
events occurred later than silicification. Many silica nodules are bounded by draping
stylolites, which constrain the diagenetic events that occur within the silica matrix as early
23
Figure 7: Vertical fractures and fracture fill in the Osage, regionally. PPL
photomicrographs A and D. Cross-polorized light (CPL) photomicrographs B and C.
Calcite is stained red. (A) Vertical fracture filled with silica and later calcite. The black
material within the fracture is bitumen (edge/arrow). (B) Vertical fracture with
authigenic phases in the following order: silica (arrow), calcite, and baroque dolomite
(Bq.). (C) Authigenic phases filling a void in the following order: chalchedony (Ch.) and
mega-quartz (Meg.). (D) Vertical fracture lined with baroque dolomite and a later phase
of calcite.
Si.
Bq.
Ch.
Meg.
Bq..

24
Figure 8: Paragenetic sequence for the Osage showing the relative timing of diagenetic
events observed petrographically. The timing of events are constrained by cross-cutting
relationships. The boundary between near surface events and shallow burial is defined
by the transtion from mechanical to chemical compaction during progressive burial.

25
near-surface events because they pre- date chemical compaction initiated in the shallow burial
regime (Figure 8). There are two dissolution events: the first event dissolved portions of the
silica matrix and the second dissolved segments of dissolution seams. There is no direct
evidence as to the composition of the soluble material for the second dissolution event, but the
fact that the pores match the morphology of the dissolution seams indicates a different genesis
that is cotemporaneous with chemical compaction. The relative timing of each diagenetic
event is summarized in Figure 8.
Meramec Microfacies
The Meramec in the NW STACK and STACK consists of four primary microfacies,
from a reservoir quality perspective (Figure 9). They are: peloidal calcareous siltstone, calcitic
siltstone, siltstone, and argillaceous siltstone. Each are defined by volume proportions of
framework grains to authigenic phases (Figure 10), pore-types (Figure 11-12) and their
relative distribution, and inferred storage and flow capacities.
Peloidal Calcareous Siltstone (Figure 9-A): The peloidal calcareous siltstone consists
of sub-angular to sub-rounded, medium to coarse, silt (~35%), calcite (~45%), clay (8%),
plagioclase and potassium feldspar (~11%), ferroan dolomite (~3%), and lesser proportions of
pyrite and muscovite. These proportions were petrographically estimated and confirmed by
XRD analysis. In core, the peloidal calcareous siltstone microfacies is observed in massive,
bioturbated, and low angle laminated light gray beds. Calcite is present in peloids, other small
skeletal fragments (~<20 microns) and pervasive calcite cement (Figure 10-A). Ferroan
dolomite is observed in replacement and cement forms (Figure 10-B). Each of the authigenic
dolomite and calcite phases significantly reduce primary porosity. Burrowing commonly
reworks the peloidal calcareous siltstone microfacies with clay rich material. Little to no

26
porosity is observed at the petrographic or SEM scale. This is a result of the pervasive nature
of the calcite and dolomite cements; therefore, the intervals with this microfacies are well
indurated with little storage or flow capacity.
Calcitic Siltstone (Figure 9-B): The calcitic siltstone microfacies is characterized by
sub-angular to sub-rounded, coarse, silt (~43%), calcite (~28%), clay (~13%), plagioclase and
potassium feldspar (~12%), ferroan dolomite (~3%), and lesser proportions of pyrite and
muscovite. In core this microfacies is variably bioturbated, massive, and locally
heterolithically bedded with peloidal calcareous siltstone microfacies (Figure 9-B). The form
of the authigenic phases of calcite and dolomite is similar to the peloidal calcareous siltstone
microfacies, except the overall volume is less, with more clay in the matrix. The common
pore types observed are secondary inragranular pores in dissolved feldspars (Figure 11-A/B,
Figure 12-A/B) and secondary intergranular pores between framework grains such as quartz.
Each of these pore types range in size from fifteen to fifty microns. Many of the pores are
lined with solid bitumen and some are partially occluded by quartz and albite overgrowths
(Figure 10-C-F). Stratigraphically, the dissolution within this microfacies is quite variable.
Figure 11 E/F highlights portions of the section with enhanced dissolution of an additional
cement that is not observed. The intervals with enhanced dissolution are generally
accompanied by increased amounts of pores lined with bitumen in thin section and oil
staining in core.
Siltstone (Figure 9-C): The siltstone microfacies is defined by sub-angular to sub-
rounded, medium to coarse, silt (~46%), clay (~22%), calcite (~15%), plagioclase and
potassium feldspar (~14%), ferroan dolomite (~3%), and lesser volumes of pyrite and
muscovite. Much of the calcite is in the form of skeletal fragments as opposed to calcite

27
Figure 9: Petrographic (left) and core (right) expression of the primary Meramec
microfacies. PPL photomicrographs A-D. Calcite is stained red. (A) Peloidal calcareous
siltstone microfacies. (B) Calcitic siltstone microfacies. (C) Siltstone microfacies. (D)
Argillaceous siltstone microfacies.
28
Figure 10: Authigenic phases occluding pore space in the Meramec. PPL
photomicrographs A, C, and D. Fluorescent phtomicrograph B with UV light applied.
Backscatter SEM images E and F. Yellow arrows indicate porosity. (A) Pervasive calcite
cement occluding primary porosity. (B) Ferroan dolomite fluorescing shades of yellow.
The zoning of color indicates ferroan zonation within the crystal. (C) Albite (Al.)
overgrowth partially occluding pore. (D) Quartz overgrowth (Qtz.) partially occluded
pore lined with bitumen (Bit.). (E) Euhedral albite growing off a detrital albite (Alb.).
(F) Quartz overgrowth partially occluding pore.
Al.
Al.
Alb.
Qtz.
Qtz.
Bit.

29
Figure 11: Common pore-types in the Meramec. PPL phtomicrographs A-F. Half UV
light and half plain light were applied to photomicrograph F. Porosity indicated by
yellow arrows. (A) Intragranular pore in a dissolved feldspar with some bitumen. (B)
Dissolved feldspar. (C) Intergranular pore between framework quartz grains. (D)
Intergranular pore partially occluded by quartz overgrowths and lined with bitumen.
(E) Partial dissolution of the grain in the bottom left. The top right arrow indicates a
pore that resides where a cement appears to have once been. Many other pores such as
this one occur within this photomicrograph. (F) UV light highlighting microporosity.
30
cement due to the increase in clay volume decreasing primary porosity for early calcite
cementation. There are lesser amounts of dissolved feldspars as compared to the calcitic
siltstone facies, but an additional slot-pore is observed in clay, likely illite as illustrated in
Figure 12-E. The slot-pore size ranges from 2-20 microns, which is smaller than the range of
pore sizes observed in the dissolved feldspars (15-50 microns). In core, the siltstone
microfacies is observed in massive, bioturbated, and laminated beds. Bioturbation is most
prevalent in the siltstone microfacies as compared to the other microfacies in the Meramec,
but the degree of bioturbation is not observed as having a clear correlation to enhanced or
decreased porosity.
Argillaceous Siltstone (Figure 9-D): The argillaceous siltstone is characterized by
moderate to coarse, silt (~40%), calcite (~10%), clay (~31%), plagioclase and potassium
feldspar (~12%), ferroan dolomite (~4%), and smaller amounts of pyrite and muscovite.
Small amounts of calcite cement are due to the fact that most primary pore space was likely
occluded by clay that the calcite would potentially precipitate in. The argillaceous siltstone is
common in laminated beds with rare bioturbation as observed in core. Little to no porosity is
observed at the petrographic microscope scale. However, the SEM reveals interstitial nano-
porosity within the structure of the clay matrix (Figure 12-C/D). The high abundance of clay-
associated interstitial porosity provides enhanced storage capacity, but poor flow properties.
Meramec Diagenesis/Paragenesis
Of the four microfacies defined, the argillaceous, calcitic, and siltstone microfacies
contain porosity petrographically observed at the micro and nano-scale. The pore system of
the argillaceous siltstone is interpreted to have the greatest pore volume because of the
abundance of interstitial porosity held in clay, but it is likely not as effective as the larger

31
Figure 12: Common pore-types in the Meramec. Backscatter SEM images A-C, E-F.
Secondary electron image D. Yellow arrows indicate porosity (A) Partially dissolved
feldspar with intragranular pores. (B) More extensively dissolved feldspar with
intragranular porosity. (C) Interstital clay porosity. (D) Interstitial clay pores showing
the organization of clays influence on pore location. (E) Slot pore within clay and
bitumen. (F) Intergranular pore between framework grains also filled with bitumen.
32
dissolved pores in the calcitic siltstone microfacies. Thus, the argillaceous siltstone should
have the best storage capacity and the intervals with greatest dissolution in the calcitic
siltstone microfacies should have the best flow properties.
Locally, skeletal fragments display a micritized texture representing the
earliest diagenetic event within the near surface environment (Figure 13). “Floating” like silt
grains in pervasively calcite cemented microfacies suggest the cementation occurred soon
after deposition during the initial stages of mechanical compaction. Framboidal pyrite is
interpreted as an early diagenetic event related to sulfate reduction as proposed by Schieber
(2011). The secondary pore-types are interpreted to have formed after the near surface
diagenetic events, because any coeval pore development would not have been preserved due
to the pervasive calcite cementation. Many of the albite and quartz overgrowths cross-cut
bitumen lining in various pores suggesting concurrent and continued development during the
migration of hydrocarbons.
Mapping
The subsurface correlation of the Meramec, Osage, and Woodford through
Woodward, Major, Dewey, Blaine, Kingfisher, and Canadian counties culminated in the
stratigraphic interpretation (Figure 14). In the STACK portion of the study area, the Meramec
was subdivided into five individual parasequences based on shallowing upward cycles. Each
of these parasequences represent regressive facies transitions, except for the observed
transgressive cycle in the middle Meramec that is punctuated by an interpreted maximum
flooding surface. The overall geometry of the Osage unit resembles a shelf to slope profile
(Figure 14) from the NW STACK to STACK. The geometry of the Meramec in the STACK is
similar to the proximal topset position of the clinoforms described by Miller (2018) and Price

33
Figure 13: Paragenetic sequence for the Meramec showing the relative timing of
diagenetic events observed petrographically. The timing of events are constrained by
cross-cutting relationships. The boundary between near surface events and shallow
burial is defined by the transtion from mechanical to chemical compaction during
progressive burial.
34
Figure 14: Stratigraphic cross-section from the STACK to the NW STACK highlighting the regional stratigraphic variations. GR is
interpolated between each well. Yellow lines indicate internal picks based on interpreted flooding surfaces.
Fig
ure
14
: S
trati
gra
ph
ic c
ross
-sec
tion
fro
m t
he S
TA
CK
to t
he
NW
ST
AC
K h
igh
ligh
tin
g t
he
regio
nal
stra
tigra
ph
ic v
ari
ati
on
s. G
R i
s in
terp
ola
ted
bet
wee
n e
ach
wel
l. Y
ello
w l
ines
in
dic
ate
inte
rnal
pic
ks
ba
sed
on
in
terp
rete
d f
lood
ing s
urf
ace
s.

35
et al. (2017) with an average thickness of five hundred and twenty feet. The transition of the
Meramec to the NW STACK exhibits terminations of the upper three parasequences near the
shelf edge and as a result the Meramec is locally as thin as fifty feet. The top of the Meramec
is regionally expressed as an abrupt increase in resistivity related to the lower conductive clay
volume. The termination of individual parasequences in the upper Meramec suggests the top
of the Meramec boundary is an unconformable time transgressive surface. At present, this
correlation is constrained to log signatures; therefore, an additional chronostratigraphic
constraint will add value to the subsurface interpretation.
Hierarchal Clustering Analysis (HRA)
The strategies applied with HRA in the Meramec provided five statistically unique
electrofacies (modes) that represent variations in volumetric mineralogy and petrophysical
properties. The electrofacies are illustrated stratigraphically in a well from Kingfisher county
in Figure 15. Stratigraphic comparison of each microfacies to the equivalent electrofacies
found that four of the five electrofacies correlate with the primary microfacies defined for the
Meramec (Figure 15). Early petrographic comparisons of the additional electrofacies
(illustrated as mode three in Figure 15) yielded little contrasting characteristics with the
calcitic siltstone microfacies. However, additional petrophysical analysis (Figure 16) provided
insight into the fundamental difference between modes two and three. Mode two displays
higher bulk density than mode three, but each possess a similar range of values in neutron
porosity. This is interpreted to be a result of locally enhanced dissolution within the calcitic
siltstone microfacies. These intervals are characterized by an increased volume of dissolved
feldspars as well as more pores lined with solid bitumen. In core, more extensive oil staining
is also observed. The difference in bulk density is interpreted to be related to the variations in

36
Figure 15: Wireline log from Kingfisher county showing the relationship of the
electrofacies (left) to the microfacies (right). Left track is GR, the middle-left is AT90,
the middle-right is NPHI/DPHI, and the far-right is the electrofacies output. Notice that
there is one more electrofacies than microfacies.

37
pore volume. The similar range in neutron porosity is likely connected to a lower gas density
and greater gas in place in the porous intervals masking the true value of the pore volume
indicated by neutron porosity. The electrofacies respond to subtle changes in mineralogy and
petrophysical properties (Figure 16). Therefore, successful definition of electrofacies provided
the ability to predict diagenetic and mineralogic variations through the STACK and NW
STACK. Figure 17 highlights the prediction of each of the five electrofacies to thirteen
publicly available wells in the STACK and NW STACK. Notice that the STACK contains the
greatest volume of the porous calcitic siltstone electrofacies. Each of the lower two
parasequences exhibit depositional cycles capped by pervasively cemented peloidal
calcareous siltstones. The transition of the lower parasequences to the NW STACK is
characterized by less stratigraphic continuity of the electrofacies, representing the proximal
shift in the depositional style. The termination of the upper three parasequences near the shelf
edge lead to an overall decrease in storage and flow capacities due to the stratigraphic
thinning and the loss of effective pore volume held in electrofacies such as the siltstone or
porous calcitic siltstone.
Total Porosity and Fluid Saturation Models
The development of the porosity and fluid saturation models helped to confirm the
reservoir quality interpretations made within the petrographic portion of the study.
Peloidal calcareous siltstone intervals have an average total porosity of two volume
percent which results in negligible fluid saturations (Figure 18). These intervals are tight and
mechanically indurated as a result of the pervasive calcite cement. The calcitic siltstone
intervals contain an average of three percent total pore volume (PHIT) and an additional four
percent bulk volume hydrocarbon (BVH). The petrographically similar, but more porous

38
Figure 16: Crossplot of bulk density versus neutron porosity. The trend line that is
labeled depostional illustrates the influence of clay versus calcite and the primary
microfacies on petrophyscial properties. Notice that each of the four microfacies fall
along this trend. The fifth electrofacies falls along an alternative trend that transtions
from calcitic siltstone to a calcitic siltstone with enhanced dissolution resulting in the
lower bulk density.
39
Figure 17: Stratigraphic cross-section from the STACK to the NW STACK highlighting the regional stratigraphic variations. The electrofacies defined in Figure
15 and 16 are predicted to 12 publicly available wells to illustrate the depositional and diagenetic changes, respectively.
Fig
ure
17
: S
trati
gra
ph
ic c
ross
-sec
tion
fro
m t
he S
TA
CK
to t
he
NW
ST
AC
K h
igh
ligh
tin
g t
he
regio
nal
stra
tigra
ph
ic v
ari
ati
on
s. T
he
elec
trofa
cies
def
ined
in
Fig
ure
15 a
nd
16 a
re p
red
icte
d t
o
12 p
ub
licl
y a
vail
ab
le w
ells
to i
llu
stra
te t
he
dep
osi
tion
al
an
d d
iagen
etic
ch
an
ges
reg
ion
all
y.

40
Figure 18: An example of the BVH and PHIT model applied (right track) to a well from
Kingfisher county. Notice the electrofacies dependency of the models.

41
Figure 19: Cross section through portions of Blaine and Kingfisher counties. (Top)
Electrofacies predicted and interpolated between wells. (Middle) PHIT is predicted and
interpolated between wells. Warm colors indicate high PHIT. (Bottom) BVH is
predicted and interpolated between wells. Warm colors indicate high BVH.
Meramec
Osage
B B’
B B’
B B’
Meramec
Osage
Meramec
Osage

42
calcitic siltstone is characterized by a six percent average PHIT and five percent BVH.
Comparatively, the siltstone microfacies also has an average BVH of six percent and a PHIT
of five percent. It is interpreted that the subtle variation in porosity between the siltstone and
porous calcitic siltstone is due to the additional mode of pores provide by the increased
amount of interstitial clay porosity in the siltstone microfacies. However, the BVH between
the two is equal; this likely represents the more effective pore network present in the
dissolved feldspars of the porous calcitic siltstone. The difference in effective porosity could
account for equal fluid saturations with varying PHIT. The argillaceous siltstone represents
the microfacies with the highest PHIT of nine percent and a BVH of seven percent. The
highest BVH and PHIT present in the argillaceous siltstone suggest quality storage and flow
potential, but successfully moving hydrocarbons through interstitial clay nano-porosity
remains uncertain. Figure 19 shows a transect through Blaine and Kingfisher counties with
the application of the electrofacies, PHIT, and BVH models developed. The internal picks
of the Meramec bound the interpolation of the petrophysical properties from well to
well. The transitions of electrofacies from Blaine to Kingfisher counties result in enhanced
reservoir quality characteristics at B’ as compared to B.
Paleomagnetism
Thermal demagnetization of the Meramec and Osage units from a core in Dewey
County reveals two magnetic components. A steep component is removed at low temperatures
ranging from the NRM (measured at room temperature) to 200°C (Figure 20) and is
interpreted as a viscous remanent magnetization (VRM). The steep magnitude of the vertical
component (~85°) relative to the modern (~65°) field indicates the VRM may be overlapping
with a drilling induced magnetization (Burmester, 1977; Audunsson and Levi, 1989). A

43
Figure 20: (Top) Representative Zijderveld diagrams for thermal demagnetization in
the Meramec and Osage. (Bottom) Representative NRM versus temperature plots from
the Meramec and Osage. High temperature steps were removed from the Zijderveld
diagrams for illustration purposes.
44
characteristic remanent magnetization (ChRM) with shallow inclinations is revealed at
unblocking temperatures ranging from 250 to 450°C (Figure 20). The average inclination of
the ChRM in both units is -12°. At higher temperatures the magnetic intensity increases as a
result of pyrite oxidizing to authigenic magnetite (Figure 20) in some specimens. Alternating
Field (AF) demagnetization reveals a similar shallow ChRM at an applied field ranging from
30 – 100 millitesla (mT) (Figure 21). However, the average inclination for the ChRM is +14
(Figure 22). It is interpreted that the AF demagnetization did not completely remove the
modern component contaminating the ChRM. Therefore, the inclinations from the AF ChRM
are not incorporated into the average for the vertical component of the ChRM.
The inclination-only mean (Arason and Levi, 2010) is -12°, with a precision parameter
of 28, an alpha 95 (a95) of 6° and an N of 23 samples of both the Meramec and Osage. The
mean inclination was compared to the expected inclinations for the study area to date the
ChRM (Figure 23). Plotting the a95 values a date ranging from 305 Ma to 295 Ma for the
ChRM was identified.
DISCUSSION
Osage Diagenesis
Early paragenesis in the Osage includes pyrite, sparite, silicification, dolomite, and de-
dolomite. The chert associated alteration in the Osage indicates that the majority of the early
authigenic phases formed during early diagenesis in the near surface with an influence by
meteoric processes. The timing of these diagenetic events is constrained by stylolites that
often bound the silica matrix. This indicates that the diagenetic events within the silica matrix
pre-date chemical compaction and occur in the near-surface

45
Figure 21: (Top) Representative Zijderveld diagrams for alternating field (AF)
demagnetization in the Meramec and Osage. (Bottom) Represenative NRM versus
applied field plots from the Meramec and Osage.

46
Figure 22: Histogram of the inclination for ChRM from the thermal demagnetization
experiments in the Meramec and Osage.

47
Figure 23: Expected inclination through geologic time plot used to date the characterstic
remanent magnetization (ChRM). The dark red is line is the mean inclination and the
light red lines are the associated error. The purple box shows the age range for both
units and the green box shows the error for the mean inclation (solid green) of the
ChRM.
48
environment. A meteoric origin is also favored by variable amounts of silicification observed
that would be difficult to explain without a strong influence by acidic meteoric fluids.
Locally, the leaching of sponge spicules serves as evidence to suggest the spicules provided
the silica for the variable silicification observed in the STACK and more so in the NW
STACK.
The chertification style of diagenesis observed here is consistent with the
characteristics of the Mississippian Chat (Rogers, 2001; Watney, 2001) such that significant
amounts of calcite were replaced by silica. However, porosity development depends on calcite
dissolution in the Mississippian Chat (Rogers, 2001), whereas the chert in this study is
preferentially dissolved. This could reflect a fundamentally different groundwater fluid
chemistry and depositional setting between the two study localities.
The STACK is in a more distal setting, diluted by clastic detritus, and as a result
exhibits a higher volume of silt dominated facies than the NW STACK. Each of the silt
dominated facies contain an early marine calcite cement. The alternating styles of marine and
meteoric diagenesis along with the mixed carbonate -clastic sequence in the Osage section of
the STACK suggest sea level had a major control on the depositional and diagenetic settings.
Mineralized fracture development during burial suggests precipitation of authigenic
phases that collectively indicate hydrothermal activity. The phases include authigenic mega-
quartz, baroque dolomite, and later calcite in fracture fill. These coincide with hydrothermal
phases outlined by Goldstein and King (2014) as representing localized hydrothermal fluid
flow that may be related to Laramide structural development. These fracture fill phases are
not present within the matrix; therefore, sub-vertical fractures probably provided the principal
conduit for fluid flow and stratiform hydrothermal fluid flow was unlikely. The variation in
49
orientation of these fracture sets could be related to subtle rotations of the stress field during
progressive burial.
Much of the porosity in the Osage is secondary in origin, in spicule-rich intervals, and
depends on the influence of meteoric groundwater during early diagenesis. This results in
moldic porosity in spicules and intercrystalline porosity within the microcrystalline silica
matrix. Local grainstone intervals also suggest an episode of much later dissolution where
porosity is developed along stylolites and as molds within various skeletal fragments. The
dissolution along the stylolites indicates the material accumulated along the seam and was
later dissolved. The only evidence for the source of later dissolving fluids is in an interval
where a sub-vertical fracture cross-cuts the porous grainstone section. This fracture contains
hydrothermal baroque dolomite and calcite suggesting the hydrothermal fluids may have been
corrosive enough to result in locally enhanced porosity. Although this later event resulted in
anomalous pore volumes (visually estimated <10%) the distribution is significantly less
consistent than the meteoric fluid originated porosity in chert.
Meramec Diagenesis
The Meramec represents a different depositional setting as compared to the Osage
with a more direct input of clastic detritus near fair-weather to below storm wave base (Price
et al., 2017; Miller, 2018). As a result, the near surface style of diagenesis transitions from the
meteoric to marine realm with fewer early authigenic phases present. The primary early
authigenic phase variably occurring across each microfacies is a marine calcite cement. The
early and pervasive nature of the cement as observed in this study and documented in other
marine settings is significantly detrimental to primary porosity and permeability (Fontana et
al., 1986; James, 1992; Mansurbeg et al., 2009). The presence of floating like silt grains

50
within the cement suggest an early and syn-sedimentary origin (Ulmer-Scholle et al., 2015).
The calcite cement is likely the low-magnesium end-member of calcite as high-magnesium
calcite is relatively unstable past surface conditions (Molenaar, 1990). Although there is no
direct textural evidence for the inversion or replacement of aragonite with low-magnesium
calcite, the high-magnesium seawater present during the time of deposition (Stanley et al.,
2002) suggests the replacement most likely occurred.
The shallowing upward parasequences (Figure 17) also exhibit an increased volume of
skeletal fragments as the microfacies transition from clay dominated argillaceous siltstones to
peloidal calcareous siltstones. The shallow peloidal calcareous siltstone is characterized by
the most pervasive calcite cement of the primary microfacies in the Meramec. This is a result
of high initial primary porosity and an abundance of intra-basinal skeletal fragments. The
skeletal fragments can (1) provide a nucleation surface for calcite cementation (Carvalho et
al., 1995; Morad, 2010) and (2) can act as a direct source for calcite cementation if dissolved
during the diagenetic evolution of the sediment (Al-Ramadan et al., 2005; Morad, 2010).
Calcite cementation is common below flooding surfaces (or upper portion of a shallowing
parasequence as the section can be comprised of lag deposits rich in bioclasts (Ketzer et al.,
2002; Ketzer and Morad, 2006; Morad, 2010). These deposits in the Meramec may represent
reworking of the carbonate substratum by storms (Miller, 2018).
Burial diagenesis in the Meramec is characterized by variable dissolution of feldspars
in the primary microfacies. The dissolution event is identified as burial in origin as any
dissolution in the near-surface environment would likely be occluded by calcite cement.
Potential mechanisms for the source of the dissolving fluids could be illitization (Ulmer-
Scholle et al., 2015) or early oil maturation (Welch and Ullman., 1996; Ehrenberg et al.,

51
2001). Quartz and albite overgrowths are observed partially occluding pores in between
framework grains. Many of the overgrowths are hosted on a detrital framework grain with
syntaxial monocrystalline overgrowths. Quartz overgrowths are more common and generally
form above 60-80 °C (Ulmer-Scholle et al., 2015, Bjorlykke and Jakobsen, 1993;
Walderhaug, 2000), whereas albite overgrowths are more locally observed and reported in the
North Sea to have formed coeval with quartz overgrowths around 110 °C (Nedkvitne et al.,
1993). The source of the elements in the overgrowths could be derived from the products of
feldspar dissolution (Ulmer-Scholle et al., 2015). Some overgrowths display growth in the
pore cross-cutting the bitumen lining and others display bitumen lining the growth, thus,
suggesting each are relatively coincident with hydrocarbon migration.
Apart from interstitial clay porosity primarily observed in the argillaceous siltstone
microfacies, much of the remaining porosity is secondary in origin and related to the later
burial dissolution event. The magnitude of dissolution is greatest in feldspars of the calcitic
siltstone microfacies. It is interpreted that this is a result of adequate clay volume that partially
protected primary porosity from cementation. However, the volume of clay is low enough to
still have a sufficient quartz silt to clay ratio to promote a framework with less tortuosity, for
later fluid flow, as opposed to the clay dominated argillaceous siltstone. Therefore, there is a
clear correlation between the magnitude of secondary porosity development and the volume
of clay to calcite as controlled by the depositional facies.
The style of diagenesis observed in the Meramec suggests the fundamentals of
sandstone diagenesis as proposed by Hayes (1979) do not wholly apply to a mixed carbonate-
siliciclastic depositional setting. As opposed to the loss of primary porosity and permeability
by compaction, the Meramec loses primary porosity and permeability by marine calcite

52
cementation. This style of primary porosity loss highlights the significance of calcite
solubility as providing a readily available source for pervasive calcite cementation.
Additionally, it seems as if the principal control of diagenetic reactions within the Meramec is
not simply the given path of sediments from source to sink, but rather a first-order control by
sea-level fluctuations influencing the volume of terrigenous input by silt and clay. The most
applicable fundamental process of sandstone diagenesis aligned with the characteristics of the
Meramec is the development of secondary porosity at depth.
Reservoir Quality
The correlation of microfacies stratigraphic occurrence to electrofacies represented a
unique strategy of connecting scales of observation petrographically and petrophysically.
Each facilitated insightful observations of the mineralogy, porosity, and hydrocarbon
potential. The following is a ranking of electrofacies from low to high reservoir quality
through the interpretation of results from the petrography and HCA, as well as the porosity
and fluid saturation models.
Peloidal Calcareous Siltstone: The peloidal calcareous siltstone displays very low
volumes of porosity due to pervasive calcite cementation. The pervasive nature of the cement
suggests high primary porosity and added nucleation sites by skeletal fragments may have had
an influence. At the reservoir scale, these intervals may have stagnated vertical flow during
hydrocarbon migration and may presently suppress fracture propagation heights during
hydraulic fracturing.
Calcitic Siltstone: The calcitic siltstone represents the standard magnitude of
dissolution porosity in feldspars and intergranular porosity between framework grains. The
standard amount of dissolution results in low storage capacity; therefore, small amounts of

53
hydrocarbons are present in this microfacies.
Argillaceous Siltstone: The argillaceous siltstone has an abundance of storage capacity
held in interstitial clay porosity. However, the observed nano and micro-scale size of the clay
associated porosity is concerning for the overall movability of hydrocarbons.
Porous Calcitic Siltstone: The porous calcitic siltstone displays the largest amount of
dissolved feldspars and contains pervasive oil staining. This electrofacies is inferred to have
the best flow capacity as a result of the larger pore sizes provided by enhanced dissolution.
Siltstone: The siltstone is characterized by a mix of clay associated porosity and
dissolution pores in feldspars. The mix provides a bi-modal pore system that will benefit the
storage capacity and movability of hydrocarbons. Therefore, it is interpreted that the siltstone
will have the greatest drained volume of hydrocarbons during production in the Meramec,
both as a flow unit and a carrier bed.
The primary microfacies and diagenetically enhanced intervals of the Meramec are
recorded in the response of wireline logs. HCA application revealed the grouping of such
responses into electrofacies providing a robust petrophysical characterization of rock to log
interactions. The electrofacies were predicted to publicly available wells to highlight the
potential for predicting reservoir quality. The electrofacies prediction could also provide the
basis for other studies incorporating three-dimensional reservoir models and simulations.
Paleomagnetism
The maximum unblocking temperatures of the ChRM indicate the magnetization
resides in magnetite. The AF demagnetization of the ChRM are consistent with this
interpretation. The statistical overlap of inclinations between the Meramec (12.6°) and Osage
(10.6°) suggest the ChRM is not unit or facies specific. However, the ChRM is not commonly

54
observed in the Meramec because it is obscured by the creation of new magnetite from pyrite
during thermal demagnetization. Within the study area, the temperature reached by the
Meramec and Osage associated deposits during the acquisition of the ChRM was around 90
°C (Figure 24). A thermo- viscus remanent magnetization would require maximum
unblocking temperatures of around 330 °C for single domain magnetite (Pullajah et al., 1975)
and 350 – 400°C for multidomain magnetite (e.g., Kent, 1986). Both are lower than the
unblocking temperatures of the ChRM. Therefore, the ChRM is interpreted as a chemical
remanent magnetization (CRM).
The CRM was acquired during a time of rapid subsidence (~300 Ma) related to
Ouachita orogeny (Figure 24). Hydrothermal fluids related to the Ouachita orogeny have been
reported from the Woodford Shale in the Anadarko Basin and interpreted to have caused the
acquisition of a CRM in the Ardmore Basin (Roberts, 2017). In this study,
hydrothermal alteration is specific to the Osage, so orogenic activity is not a likely origin for
the CRM in both units. Therefore, a burial mechanism is more likely to have caused the CRM.
Burial mechanisms such as illitization, (Hirt et al., 1993; Katz et al., 1998; Kennedy et al.,
2002; Woods et al, 2002) and hydrocarbon emplacement (Elmore and Crawford, 1990;
Elmore et al., 1993) have been cited as forming CRMs held in magnetite. Smectite and illite
are variably present in the Meramec, but clay is rare in the Osage. Thus, the most appropriate
mechanism to support the origin of the CRM is hydrocarbon emplacement as both the Osage
and Meramec have solid bitumen in pore space indicating the migration of hydrocarbons
through each unit.
Based on the thermal evolution of the Meramec and Osage (Figure 24), the earliest oil
generation was probably around 310 Ma (60 °C). The CRM is approximately 300 Ma;

55
Figure 24: Basin model (modified from Carter et al., 1998) for the study area near the
core provided for the paleomagnetic study.
56
therefore, sufficient thermal conditions were present to source a CRM originated by
hydrocarbons. Presently, the paleomagnetism offers a critical temporal component on the
petroleum system evolution, additional paleotemperature data would help to validate the
CRM origin and basin understanding.
CONCLUSION
The Meramec and Osage deposits of the STACK and NW STACK in the Anadarko
Basin record a number of auto and allo-cyclic controls on diagenesis; such as storms and sea
level fluctuations, respectively. The unveiling of the diagenetic history and reservoir quality
controls of the Meramec and Osage were evaluated through the novel integration of
petrography, petrophysics, and paleomagnetism. The principal findings of the study are:
1. The Osage of the STACK and NW STACK contain authigenic fracture fill of mega-
quartz, baroque dolomite, and calcite characteristic of hydrothermal fluid flow in the
Anadarko Basin.
2. Meteoric diagenesis in the Osage enhanced porosity development in the form of
moldic pores in leached sponge spicules and intercrystalline porosity in silicified
matrix.
3. A strong correlation between sequence stratigraphy and diagenesis is observed in the
Meramec. Flooding surfaces are often the upper bound of shallowing parasequences
rich in skeletal fragments and high primary porosity, resulting in pervasive marine
calcite cementation. Clay in more argillaceous microfacies partially protects primary
porosity and can enhance later secondary dissolution.

57
4. The primary pore-types observed in the Meramec are dissolution pores in feldspars,
interstitial pores in clay, and intergranular pores between framework grains. These
pore-types are variably distributed across each microfacies. The interstitial clay
associated porosity is most abundant in the argillaceous siltstone, and the dissolved
pores are most abundant in the calcitic siltstone.
5. Log responses can be grouped in the Meramec to provide a framework for defining the
mineralogical and reservoir property trends through the section. Hierarchal clustering
analysis identified the intervals of greatest dissolution in the calcitic siltstone
microfacies and confirmed the storage capacity of the argillaceous siltstone
microfacies.
6. Paleomagnetic results illustrate a CRM held in magnetite that formed at approximately
300 Ma. The secondary remagnetization is interpreted to be a result of hydrocarbon
emplacement; thereby, providing a temporal component in the diagenetic evolution of
the Meramec and Osage deposits.
58
REFERENCES
AlBahadily, J. K. R., & Nasser, M. E. (2017). Role of the Cluster Analysis in Logfacies and
Depositional Environments Recognition from Well Log Response for Mishrif
Formation in Southeast Iraq.
Al-Ramadan, K., S. Morad, J. N. Proust, and I. S. Al-Aasm (2005) Distribution of diagenetic
alterations in siliciclastic shoreface deposits within a sequence stratigraphic
framework: Evidence from the Upper Jurassic, Boulonnais, NW France: Journal of
Sedimentary Research, v. 75, p. 943–959, doi:10.2110/jsr.2005.072.
Ali, S. A., Clark, W. J., Moore, W. R., & Dribus, J. R. (2010). Diagenesis and reservoir
quality. Oilfield Review, 22(2), 14-27.
Arason, Þ., & Levi, S. (2010). Maximum likelihood solution for inclination-only data in
paleomagnetism. Geophysical Journal International, 182(2), 753-771.
Audunsson, H., & Levi, S. (1989). Drilling‐induced remanent magnetization in basalt drill
cores. Geophysical Journal International, 98(3), 613-622. Bjorlykke, K., & Egeberg, P. K. (1993). Quartz cementation in sedimentary basins. AAPG
bulletin, 77(9), 1538-1548.
Boyd, D. T. (2008). Stratigraphic guide to Oklahoma oil and gas reservoirs: Oklahoma
Geological Society, Special Publication 2008-1, 2 p.
Braun, J. C. (1959). A Stratigraphic Study of the Sycamore and Related Formations in the
Southeastern Anadarko Basin. Shale Shaker, September 1959, pp. 150-164.
Burmester, R. F. (1977). Origin and stability of drilling induced remanence. Geophysical
Journal of the Royal Astronomical Society, 48(1), 1-14.
Cardott, B. J. (2014, May). Woodford shale play update: expanded extent in the oil window.
In AAPG education directorate Woodford shale forum. American Association of
Petroleum Geologists, Oklahoma City, OK, USA (Vol. 29).
Carter, L. S., Kelley, S. A., Blackwell, D. D., and Naeser, D. N. (1998). Heat flow and
thermal history of the Anadarko Basin, Oklahoma, AAPG Bulletin, V. 82, No. 2, p.
291-316.
Carvalho, M. V. F., L. F. De Ros, and N. S. Gomes (1995). Carbonate cementation patterns
and diagenetic reservoir facies in the Campos Basin Cretaceous turbidites, offshore
eastern Brazil: Marine and Petroleum Geology, v. 12, p. 741–758, doi:10.1016/0264-
8172(95)93599-Y.

59
Coffey, W. S. (2000) The diagenetic history and depositional system of the Sycamore
Formation (Mississippian), Carter-Knox Field, Grady and Stephens Counties,
Oklahoma: Doctorale dissertation, Oklahoma State University, Stillwater, Oklahoma.
167p.
Cullen, A. (2017). Devonian-Mississippian Petroleum Systems of Southern Laurasia: What
Makes the STACK-Merge-SCOOP Play in Oklahoma so Special: Devonian-
Mississippian Petroleum Systems of Southern Laurasia: What Makes the STACK-
MERGE-SCOOP in Oklahoma so Special? AAPG Playmaker Forum Oklahoma City,
OK 2017.
Culp, C. K. (1961). Stratigraphic relations of the Sycamore limestone (Mississippian) in
southern Oklahoma: Oklahoma City Geological Society, The Shale Shaker Digest V,
V. IX-XI, No. 3, p. 446- 457.
Dehcheshmehi, S. M. (2016). Regional Diagenesis of Mississippian Strata of the Southern
Mid-Continent, USA (Doctoral dissertation, Oklahoma State University).
Ehrenberg, S. N., & Jakobsen, K. G. (2001). Plagioclase dissolution related to biodegradation
of oil in Brent Group sandstones (Middle Jurassic) of Gullfaks Field, northern North
Sea. Sedimentology, 48(4), 703-721.
Elmore, R. D., & Crawford, L. (1990). Remanence in authigenic magnetite: Testing the
hydrocarbon‐magnetite hypothesis. Journal of Geophysical Research: Solid
Earth, 95(B4), 4539-4549.
Elmore, R. D., London, D., Bagley, D., Fruit, D., & Gao, G. (1993). Remagnetization by
basinal fluids: testing the hypothesis in the Viola Limestone, southern
Oklahoma. Journal of Geophysical Research: Solid Earth, 98(B4), 6237-6254.
Feinstein, S. (1981). Subsidence and thermal history of Southern Oklahoma Aulocogen:
Implications for petroleum exploration, AAPG Bulletin, V. 65, No. 12, p. 2521-2533.
Fontana, D., E. F. McBride, and R. Kluger (1986). Diagenesis and porosity evolution of
submarine-fan and basin-plain sandstones, Marnoso-Arenacea Formation, northern
Apennines, Italy: Bulletin of Canadian Petroleum Geology, v. 34, p. 313–328.
Gilbert, M. C. (1983). Timing and chemistry of igneous events associated with the southern
Oklahoma aulacogen. In Developments in Geotectonics (Vol. 19, pp. 439-455).
Elsevier.
60
Goldstein, R., & King, B. (2014). History of hydrothermal fluid flow in the Midcontinent: A
key to understanding the origin and distribution of porosity. In AAPG Mississippian
Lime Forum, February (Vol. 20, p. 2014).
Ham, W. E., & Wilson, J. L. (1967). Paleozoic epeirogeny and orogeny in the central United
States. American Journal of Science, 265(5), 332-407.
Harris, S. A. (1975). Hydrocarbon accumulation in “Meramec-Osage” (Mississippian) rocks,
Sooner Trend, northwest-central Oklahoma: AAPG Bulletin, v. 59, p. 633–664.
Hayes J.B. (1979). Sandstone diagenesis-whole truth. In: Aspect of Diagenesis (ed. Scholle
P.A. and Schluger P.R) Specs. Soc. Econ. Paleont. Miner. Tulsa,26, 127-140.
Hirt, A. M., Banin, A. & Gehring, U. A. (1993). Thermal generation of ferromagnetic
minerals from iron enriched smectites. Geophysical Journal International, 115, 1161–
1168.
James, W. C. (1992). Sandstone diagenesis inmixed siliciclastic carbonate sequences:
Quadrant and Tensleep formations (Pennsylvanian), northern Rocky Mountains:
Journal of Sedimentary Petrology, v. 62, p. 810–824.
Johnson, K. S., Amsden, T. W., Denison, R. E., Dutton, S. P., Goldstein, A. G., Rascoe, B., ...
& Thompson, D. M. (1989). Geology of the southern Midcontinent. Oklahoma
Geological Survey Special Publication, 89(2), 53.
Johnson, K.S., Cardott, B.J. (1992). Geologic Framework and Hydrocarbon Source Rocks of
Oklahoma. In: Johnson, K.S., Cardott, B.J. (Eds.), Source Rocks in the Southern
Midcontinent, 1990 Symposium: Oklahoma Geological Survey Circular, 93, pp. 21–
37.
Katz, B., Elmore, R. D., Cogoini, M. & Ferry, S. (1998). Widespread chemical
remagnetization: orogenic fluids or burial diagenesis of clays? Geology, 23, 603–606.
Keller, G. R., Lidiak, E. G., Hinze, W. J., & Braile, L. W. (1983). The role of rifting in the
tectonic development of the midcontinent, USA. In Developments in
Geotectonics (Vol. 19, pp. 391-412). Elsevier.
Keller, G.R. (2014). The southern Oklahoma aulacogen: It’s a classic. In Suneson, N. (ed.),
Igneous and Tectonic History of the Southern Oklahoma Aulacogen: Oklahoma
Geological Survey Guidebook (Vol. 38, pp. 389-391).
Kennedy, M. J., Pevear, D. R. & Hill, R. J. (2002). Mineral surface control of organic carbon
in black shale. Science, 295, 657– 660.

61
Kent, D.V. (1985). Thermoviscous remagnetization in some Appalachian limestones:
Geophysical Research Letters, v. 12, p. 805–808, doi: 10.1029/GL012i012p00805.
Ketzer, J. M., S. Morad, R. Evans, and I. Al-Aasm (2002). Distribution of diagenetic
alterations in fluvial, deltaic, and shallow marine sandstones within a sequence
stratigraphic framework: Evidence from the Mullaghmore Formation (Carboniferous),
NWIreland: Journal of Sedimentary Research, v. 72, p. 760–774,
doi:10.1306/042202720760.
Ketzer, J. M., and S. Morad (2006). Predictive distribution of shallow marine, low-porosity
(pseudomatrix -rich) sandstones in a sequence stratigraphic framework—Example
from the Ferron Sandstone, Upper Cretaceous, U.S.A.: Maine and Petroleum
Geologists, v. 23, p. 29–36, doi: 10.1016/j.marpetgeo.2005.05.001.
Kirschvink, J.L., (1980). The least-squares line and plane and the analysis of palaeomagnetic
data. Geophysical Journal International, 62(3), pp.699-718.
Mansurbeg, H., M. A. Caja, R. M. Marfil, S., E. Remacha, D. Garcia, T. Martín-Crespo, M.
A. K. El-Ghali, and J. P. Nystuen (2009). Diagenetic evolution and porosity
destruction of turbiditic hybrid arenites and siliciclastic sandstones of foreland basins:
Evidence from the Eocene Hecho Group, Pyrenees, Spain: Journal of Sedimentary
Research, v. 79, p. 711–735, doi:10.2110/jsr.2009.060.
Mazzullo, S. J., Wilhite, B. W., & Woolsey, I. W. (2009). Petroleum reservoirs within a
spiculite-dominated depositional sequence: Cowley Formation (Mississippian: Lower
Carboniferous), south-central Kansas. AAPG bulletin, 93(12), 1649-1689.
Mikkelson, D. H. (1966). The origin and age of the Mississippian “chat” in north-central
Oklahoma: Oklahoma City Geological Society, Shale Shaker Digest, v. 5, p. 255–265.
Miller, J. (2018). Regional stratigraphy and organic richness of the Mississippian Meramec
and associated strata, Anadarko Basin, central Oklahoma: Master’s Thesis, University
of Oklahoma.
Molenaar, N. (1990). Calcite cementation in shallow marine Eocene sandstones and
constraints of early diagenesis. Journal of the Geological Society, 147(5), 759-768.
Morad, S., Al-Ramadan, K., Ketzer, J. M., & De Ros, L. F. (2010). The impact of diagenesis
on the heterogeneity of sandstone reservoirs: A review of the role of depositional
facies and sequence stratigraphy. AAPG bulletin, 94(8), 1267-1309.
Nedkvitne, T., Karlsen, D. A., Bjørlykke, K., & Larter, S. R. (1993). Relationship between
reservoir diagenetic evolution and petroleum emplacement in the Ula Field, North
Sea. Marine and Petroleum Geology, 10(3), 255-270.

62
Nicholas, R. L., & Rozendal, R. A. (1975). Subsurface positive elements within Ouachita
foldbelt in Texas and their relation to Paleozoic cratonic margin. AAPG
Bulletin, 59(2), 193-216.
Northcutt, R.A. and J.A. Campbell, (1998). Geologic Provinces of Oklahoma: Basement
Tectonics, 12, 29-37.
Parham, K. D., and R. A. Northcutt (1993). MS-3, Mississippian chert and carbonate and
basal Pennsylvanian sandstone—central Kansas uplift and northern Oklahoma, in D.
G. Bebout, W. A. White, T. F. Hentz, and M. K. Grasmick, eds., Atlas of major mid-
continent gas reservoirs: Gas Research Institute and Texas Bureau of Economic
Geology, p. 57–60.
Pullaiah, G., Irving, E., Buchan, K.L., and Dunlop, D.J. (1975). Magnetization changes
caused by burial and uplift: Earth and Planetary Science Letters, v. 28, p. 133-143,
doi: 10.1016/0012-821X (75)90221-6.
Perry, W. J. (1989). Tectonic evolution of the Anadarko Basin region, Oklahoma (No. 1866).
Department of the Interior, US Geological Survey.
Prestridge, J. D. (1957). A subsurface stratigraphic study of the Sycamore Formation in the
Ardmore Basin (Doctoral dissertation, University of Oklahoma).
Price, B., K. Haustveit, and A. Lamb (2017). Influence of stratigraphy on barriers to fracture
growth and completion optimization in the Meramec Stack Play, Anadarko Basin,
Oklahoma: Unconventional Resources Technology Conference (URTEC), Article
#2697585.
Puzin, L. A. (1951). A chart of connate water resistivity in Oklahoma and its application to
electric log interpretation: Petroleum Engineering, v. 24, no. 9, p. B67-B78. Roberts, J. (2017). A Diagenetic and Paleomagnetic Study of the Woodford Shale, Oklahoma,
USA (Doctoral dissertation, University of Oklahoma).
Rogers, S. M. (1996). Depositional and diagenetic history of the Mississippian chat, north-
central Oklahoma: Master’s thesis, University of Oklahoma, Norman, Oklahoma.
Rogers, S. M. (2001). Deposition and diagenesis of Mississippian chat reservoirs, north-
central Oklahoma: AAPG Bulletin, v. 85, no.1, p 115-129.
Schieber, J. (2011). Iron Sulfide Formation: Encyclopedia of Geobiology, 486-502, doi:
10.1007/978-1-4020-9212-1_118

63
Schwartzapfel, J. A. (1996). Upper Devonian and Mississippian radiolarian zonation and
biostratigraphy of the Woodford, Sycamore, Caney and Goddard formations,
Oklahoma. Cushman Foundation for Foraminiferal Research, Spec. Publ., 33, 1-275.
Stanley, S. M., Ries, J. B., & Hardie, L. A. (2002). Low-magnesium calcite produced by
coralline algae in seawater of Late Cretaceous composition. Proceedings of the
National Academy of Sciences, 99(24), 15323-15326.
Ulmer-Scholle, D. S., Scholle, P. A., Schieber, J., & Raine, R. J (2015). A Color Guide to the
Petrography of Sandstones, Siltstones, Shales and Associated Rocks. Tulsa, OK:
American Association of Petroleum Geologists.
Walderhaug, O. (2000). Modeling quartz cementation and porosity in Middle Jurassic Brent
Group sandstones of the Kvitebjørn field, northern North Sea. AAPG bulletin, 84(9),
1325-1339.
Watney, W. L., Guy, W. J., & Byrnes, A. P. (2001). Characterization of the Mississippian
chat in south-central Kansas. AAPG bulletin, 85(1), 85-113.
Welch, S. A., & Ullman, W. J. (1996). Feldspar dissolution in acidic and organic solutions:
Compositional and pH dependence of dissolution rate. Geochimica et Cosmochimica
Acta, 60(16), 2939-2948.
Wethington, N. (2017). Stratigraphic Architecture of the Mississippian Limestone Through
Integrated Electrofacies Classification, Hardtner Field Area, Kansas and Oklahoma:
Master’s thesis, University of Oklahoma, Norman, Oklahoma. 1 p.
Wickham, J. S. (1978). The southern Oklahoma aulacogen, Geological Society of America, In
structural style of the Arbuckle region, South-Central section Guidebook for field trip
3, p. 9-41.
Woods, S., Elmore, R. D. & Engel, M. (2002). Paleomagnetic dating of the smectite-to-illite
conversion: testing the hypothesis in Jurassic sedimentary rocks, Skye, Scotland.
Journal of Geophysical Research, 107, 2091, http://dx.doi.org/10.1029/2000JB000053
Zijderveld, J.D.A. (1967). A.C. demagnetization of rocks: Analysis of results. In: Collinson,
D. E., Creer, K. M. & Runcorn , S. K. (eds) 1967. Methods in Paleomagnetism, 254-
286.