university writing project report analysis of college ... · the university writing project is an...
TRANSCRIPT

UNIVERSITY WRITING PROJECT REPORT
Analysis of College-Level Writing Skills
Fall 2015 and Spring 2016

EXECUTIVE SUMMARY
The following report contains a summary of the results for the 2015-2016 University Writing
Project (UWP). The UWP collects authentic student writing samples in order to examine the
writing performance of college juniors and seniors. During the 2015-2016 academic year,
faculty from across the university, as well as a scoring team from the Department of English,
evaluated samples of student writing assignments using rubrics developed from the Written
Communication and Critical Thinking AAC&U VALUE rubrics. Because the number of faculty
scorers was very small (n= 4), their results were not included in the analysis.
This year a total of 663 writing samples from 712 students were scored. Each sample was rated
on seven criteria using a scale ranging from 1(developing) to 4 (proficient). Samples were also
rated for an overall, holistic score ranging from 1 (developing) to 4 (proficient). This report
contains a descriptive analysis of the English team’s scores. Of the 663 samples scored, 77.7
percent received an overall rating of 3 or higher, which indicated that most students within this
sample were writing at a progressing or proficient level.
Results from this assessment will be shared with university stakeholders in order to display
university writing performance in comparison to previous years. In addition, departments
received aggregated data regarding their students’ performance in written communication and
critical thinking skills relative to the rest of the university.

Table of Contents
Introduction ................................................................................................................................................... 1
Methods ........................................................................................................................................................ 1
Student Sample ......................................................................................................................................... 1
Writing Samples........................................................................................................................................ 3
Scoring Procedures ................................................................................................................................... 4
Results ....................................................................................................................................................... 5
University-level Student Writing Performance ......................................................................................... 5
College of Business Student Writing Performance ............................................................................... 7
College of Engineering & Engineering Technology Student Writing Performance ............................. 9
College of Health and Human Sciences Student Writing Performance .............................................. 11
College of Liberal Arts and Sciences Student Writing Performance .................................................. 13
College of Visual and Performing Arts Student Writing Performance ............................................... 15
Conclusions ................................................................................................................................................. 17
APPENDIX A - English Scoring Team Rubric 2015-2016 ........................................................................ 18
APPENDIX B - English Scoring Team Ratings 2014-2015 ....................................................................... 19
University-level....................................................................................................................................... 19
College of Business ............................................................................................................................. 20
College of Engineering & Engineering Technology ........................................................................... 21
College of Health and Human Sciences .............................................................................................. 22
College of Visual and Performing Arts ............................................................................................... 23
College of Liberal Arts and Sciences .................................................................................................. 24

1
Introduction
The University Writing Project is an assessment of college junior and senior level writing
performance based on an analysis of course-embedded writing assignments. For this project,
writing assignments were submitted by faculty from multiple departments across the five
colleges. Assignments were evaluated separately by an independent faculty group and a scoring
team from the Department of English. Each writing sample was evaluated using a rubric
developed from the Written Communication and Critical Thinking AAC&U VALUE rubrics;
written samples were rated on seven criteria including: Question/problem, thesis/position,
content development, sources/evidence, format/genre, conclusion, and syntax/editing. This
report provides an analysis of course writing assessments across seventeen departments for
academic year 2015-2016. Results are compared to the prior years for trends.
Methods
Student Sample
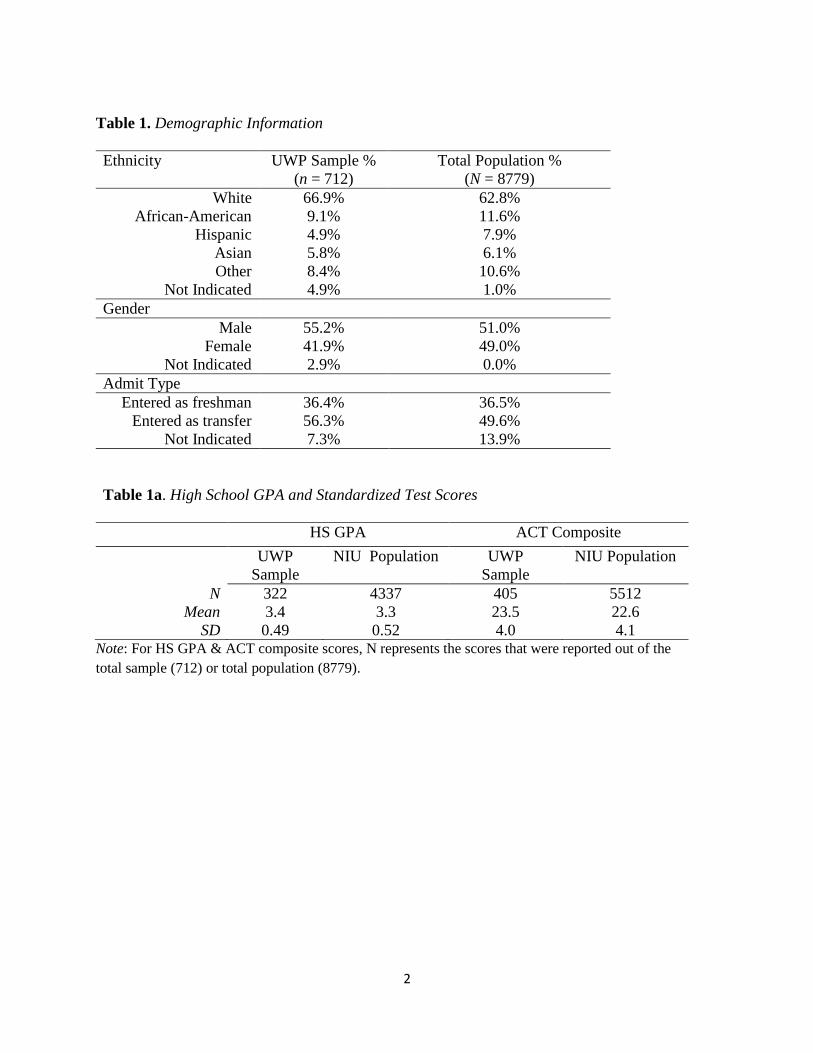
Writing samples from a total of 712 students were scored (some students completed group
papers). The sample characteristics and its comparison to the Northern Illinois University
population is described in Table 1. The current UWP sample included a lower percentage of
female students, students identifying as Hispanic, and overall had a slightly elevated mean ACT
score in comparison to NIU population. In terms of college representation, the current sample
was low of student writing assignments from colleges of Education, and Liberal Arts and
Sciences. (See Table 2).
2
Table 1. Demographic Information
Ethnicity UWP Sample %
(n = 712)
Total Population %
(N = 8779)
White 66.9% 62.8%
African-American 9.1% 11.6%
Hispanic 4.9% 7.9%
Asian 5.8% 6.1%
Other 8.4% 10.6%
Not Indicated 4.9% 1.0%
Gender
Male 55.2% 51.0%
Female 41.9% 49.0%
Not Indicated 2.9% 0.0%
Admit Type
Entered as freshman 36.4% 36.5%
Entered as transfer 56.3% 49.6%
Not Indicated 7.3% 13.9%
Table 1a. High School GPA and Standardized Test Scores
HS GPA ACT Composite
UWP
Sample
NIU Population UWP
Sample
NIU Population
N 322 4337 405 5512
Mean 3.4 3.3 23.5 22.6
SD 0.49 0.52 4.0 4.1 Note: For HS GPA & ACT composite scores, N represents the scores that were reported out of the
total sample (712) or total population (8779).

3
Table 2. Students’ Fields of Study
Academic Program-College (Major) UWP Sample
%
n = 712
NIU Population %
N= 8779
Business 18.8% 16.6%
Education 0.1% 9.1%
Engineering & Engineering Technology 30.5% 10.4%
Health and Human Sciences 27.9% 20.7%
Liberal Arts and Sciences 17.3% 38.3%
Visual and Performing Arts 5.3% 4.9%
Other (SAL, Undecided) 0.0% 0.1%
Academic Program-College (Course taken)* n = 712
Business 18.0% --
Education 0.0% --
Engineering & Engineering Technology 32.6% --
Health and Human Sciences 23.6% --
Liberal Arts and Sciences 19.9% --
Visual and Performing Arts 6.0% -- *Note: For Academic Program-College (Course taken), students could have taken more than one
course in different colleges
Writing Samples
A total of 747 student writing samples were received from seventeen departments in Fall 2015
and Spring 2016. Samples came from five colleges. Of these submitted writing samples, 663
were scored. Table 3 contains the number of writing samples scored from each college (noting
the number of group papers). Some students had multiple writing samples scored, either because
they had submissions from the same class or two different classes.
Table 3. Writing Samples
Academic Program-
College (Course taken)*
Have group paper? Total Number of
papers scored No Yes
Business 136 0 136 (20.5%)
Education 0 0 0 (0%)
Engineering &
Engineering Technology
127 30 157 (23.7%)
Health and Human
Sciences
178 0 178 (26.8%)
Liberal Arts and Sciences 142 5 147 (22.2%
Visual and Performing
Arts
45 0 45 (6.8%)
Total number of papers 628 35 663 *Note: For Academic Program-College (Course taken), students could have taken more than one course
in different colleges

4
Scoring Procedures
As in previous years, the student writing samples were scored by two separate teams of raters,
each using the same modified rubric developed from the Written Communication and Critical
Thinking AAC&U VALUE rubrics. Because only a small number of faculty scorers (n=4) scored
82 samples (representing four courses), their ratings were not considered in aggregating the
results. Instead, inter-rater agreement was considered within the English Team Scorers.
Evaluation of student writing samples are described below.
Faculty Raters
A group of faculty members were recruited to participate in a study which asked them to rate
their students’ writing samples using the modified AAC&U VALUE Rubric combining Written
Communication and Critical Thinking. This rubric was developed by Professor Brad Peters,
Director of Undergraduate Studies for the Department of English and Coordinator for the
Writing Across the Curriculum project. The rubric provides ratings on seven criteria using a
scale ranging from 1(developing) to 4 (proficient) (See Appendix A). The criteria include:
question or problem, thesis/position, content development, sources and evidence, format,
conclusions, and syntax and editing. Participating faculty attended an hour and a half long
workshop in which they discussed the rubric and scored sample student assignments as a team
for practice. Faculty were also given suggestions on how to incorporate the rubric into their
classroom assessment practices. Faculty then selected a writing assignment from one of their
course sections, rated these papers using the rubric, and submitted the papers and scores to
Accreditation, Assessment and Evaluation for processing. Because the number of faculty
participants was very small, their results were not included in this report.
English Scoring Team Raters
A team of scorers in the Department of English rated the student writing samples using the same
version of the modified the AAC&U VALUE Rubric described above. The English scoring team
consisted of eight raters who were trained together on how to score student assignments using
the modified rubric. The goal of the training was to calibrate scorers in order to reach the highest
level of inter-rater agreement. Training consisted of a discussion about the rubric, practice
ratings of student writing samples, and periodic check-ins throughout the scoring process. Each
student assignment was scored by two raters who compared ratings after scoring the same sets of
papers. In a few instances, a third rater was needed to resolve discrepancies. As part of their
process, the student writing samples received an overall holistic score that is indicative of the
overall quality of the writing sample per scorer judgement. The team held one scoring session
during the end of the spring semester in order to normalize the process. The total calibration and
scoring time lasted eight days. The average scores across all raters for each of the categories is
included in the results section.

5
Results
University-level Student Writing Performance
English Scoring Team Ratings
The English scoring team scored 663 student papers. Overall, the team rated 77.7 percent of the
student papers at a Progressing 3 level or higher. This is approximately four percent lower than
last year’s 81.8 percent in the number of students falling in the Progressing level 3 or higher
category. Comparison with 2013-2014 data indicates a 4.4 percent increase in the same category.
(See Figure 1).
Figure 1. University-level Writing Performance Levels-English Scoring Team
Writing Subscale Performance
Aggregated results from the 2015-2016 sample indicate the criteria with the highest ratings were:
question/problem (M = 3.11, SD = 0.57) and format (M = 3.05, SD = 0.59). The ratings are
lowest in thesis/position (M = 2.72, SD = 0.61) and conclusions (M = 2.72, SD = 0.68). The
current ratings were compared with the results from the 2013-2014 sample when the same rubric
was used to evaluate the writing of juniors and seniors (See Figure 1b). Effect sizes comparing
the two samples on the seven criteria were calculated and are listed in Table 4. In 2014-2015
the English scoring team used a rubric with slightly different dimensions, which does not allow
for a direct comparison of subscale scores across years. Aggregate ratings by subscales are
reported in Appendix B for the previous 2014-2015 scores.
12(2.2%)
133(24.5%)
308(56.6%)
91(16.7%)
4(0.8%)
88(17.5%)
343(68.1%)
69(13.7%)
3(0.5%)
145(21.9%)
413(62.3%)
102(15.4%)
0.0%
10.0%
20.0%
30.0%
40.0%
50.0%
60.0%
70.0%
80.0%
90.0%
100.0%
Developing (1) Progressing (2) Progressing (3) Proficient (4)
2013-2014 (n=544 papers) 2014-2015 (n=504 papers) 2015-2016 (n=663 papers)

6
Figure 1b. Performance on Writing Subscales -English Scoring Team (2015-2016)
Note: Since holistic scores were not reported in 2013-2014, they are not reported as comparisons
in the table above.
Table 4. University-level English Scoring Team Ratings - Writing Performance
2013-2014
(N=544)
2015-2016
(N=663)
Effect Size
(Cohen’s d)
Criteria Mean SD Mean SD
Question/Problem
**
2.96 0.67 3.11 0.57 0.241
Thesis/Position 2.69 0.70 2.72 0.61 0.456
Content
Development
2.92 0.72 2.90 0.64 0.029
Sources/Evidence 2.83 0.73 2.81 0.74 0.027
Format 2.85 0.69 3.05 0.59 0.311
Conclusions 2.65 0.76 2.72 0.68 0.097
Syntax & Editing 2.93 0.58 2.96 0.55 0.053
*Overall 2.83 0.58 2.89 0.53 0.108
Holistic -- -- 2.96 0.61
1.00 2.00 3.00 4.00
Overall
Question/Problem
Thesis/Position
Content Development
Sources/Evidence
Format
Conclusions
Syntax/Editing
2013-2014 (N=544 papers) 2015-2016 (N=663 papers)

7
College of Business Student Writing Performance
English Scoring Team Ratings
The English scoring team scored a total of 136 junior/senior writing samples from the College of
Business. Overall, the team rated 69.1 percent of the student papers at a Progressing 3 level or
higher. This is much less than last year’s 76.3 percent. (See Figure 2). There were no writing
samples collected from the college in 2013-2014.
Figure 2. College of Business Writing Performance Levels-English Scoring Team
Writing Subscale Performance
In the current sample, students performed best when addressing the question or problem (M =
2.92, SD = 0.47) and in their overall writing format (M = 2.89, SD = 0.46). Aggregate scores
were lowest in using and integrating sources (M = 2.35, SD =0.70). (See Table 5 and Figure 2b).
Source integration was also the lowest score the previous year (M = 2.38, SD = 0.56). (For 2014-
2015 subscale scores, please see Appendix B). Because a slightly different rubric was used in
2014, we were unable to make comparison for all subscales.
1(1.0%)
23(22.8%)
72(71.3%)
5(5.0%)0
(0.0%)
42(30.9%)
90(66.2%)
102(2.9%)
0.0%
10.0%
20.0%
30.0%
40.0%
50.0%
60.0%
70.0%
80.0%
90.0%
100.0%
Developing (1) Progressing (2) Progressing (3) Proficient (4)
2014-2015 (n=101) 2015-2016 (n=136)

8
Figure 2b. College of Business Writing Performance-English Scoring Team (2015-2016)
Note. n = 136
1.00 2.00 3.00 4.00
Overall
Holistic
Question/Problem
Thesis/Position
Content Development
Sources/Evidence
Format
Conclusions
Syntax/Editing
Table 5
2015-2016 College of Business English Scoring Team
Ratings - Writing Performance (n=136)
Criteria Mean SD
Question/Problem 2.92 0.47
Thesis/Position 2.52 0.51
Content Development 2.68 0.55
Sources/Evidence 2.35 0.70
Format 2.89 0.46
Conclusions 2.54 0.66
Syntax & Editing 2.83 0.46
*Overall 2.68 0.41
Holistic 2.76 0.53
9
College of Engineering & Engineering Technology Student Writing Performance
English Scoring Team Ratings
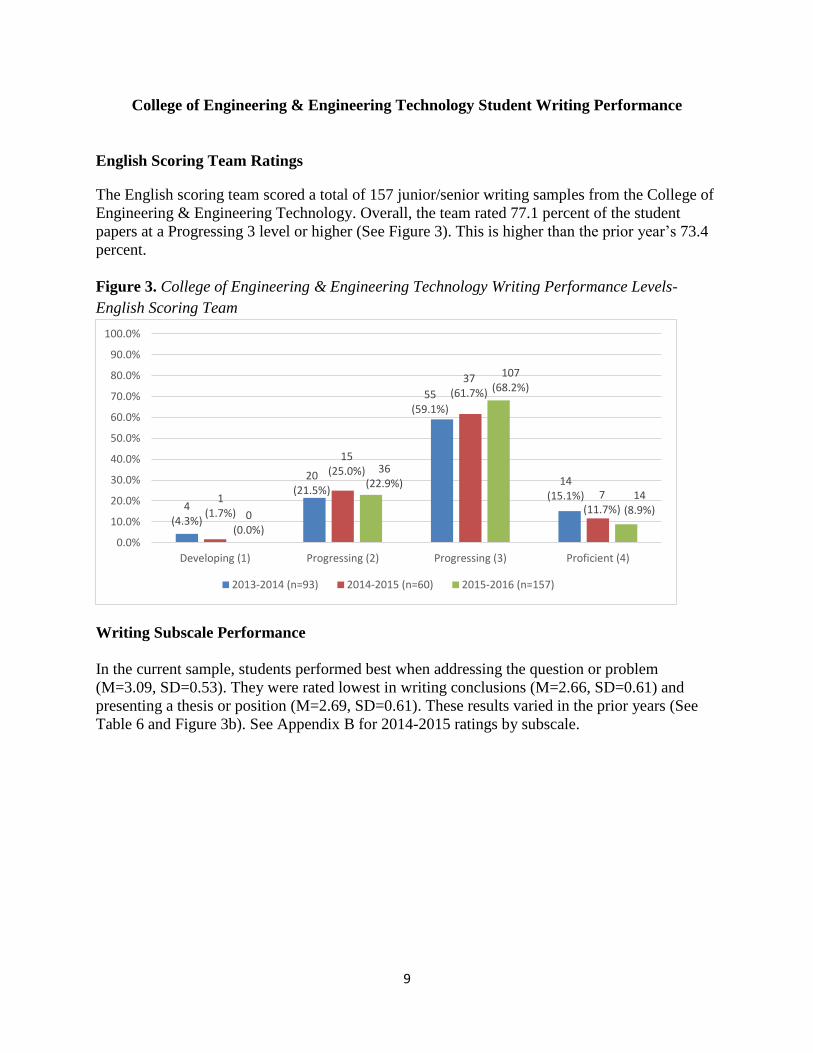
The English scoring team scored a total of 157 junior/senior writing samples from the College of
Engineering & Engineering Technology. Overall, the team rated 77.1 percent of the student
papers at a Progressing 3 level or higher (See Figure 3). This is higher than the prior year’s 73.4
percent.
Figure 3. College of Engineering & Engineering Technology Writing Performance Levels-
English Scoring Team
Writing Subscale Performance
In the current sample, students performed best when addressing the question or problem
(M=3.09, SD=0.53). They were rated lowest in writing conclusions (M=2.66, SD=0.61) and
presenting a thesis or position (M=2.69, SD=0.61). These results varied in the prior years (See
Table 6 and Figure 3b). See Appendix B for 2014-2015 ratings by subscale.
4(4.3%)
20(21.5%)
55(59.1%)
14(15.1%)1
(1.7%)
15(25.0%)
37(61.7%)
7(11.7%)0
(0.0%)
36(22.9%)
107(68.2%)
14(8.9%)
0.0%
10.0%
20.0%
30.0%
40.0%
50.0%
60.0%
70.0%
80.0%
90.0%
100.0%
Developing (1) Progressing (2) Progressing (3) Proficient (4)
2013-2014 (n=93) 2014-2015 (n=60) 2015-2016 (n=157)

10
Figure 3b. College of Engineering & Engineering Technology Writing Performance-English
Scoring Team (2015-2016)
Note: Since holistic scores were not reported in 2013-2014, they are not reported as comparisons
in the table above.
Table 6. College of Engineering & Engineering Technology English Scoring Team
Ratings - Writing Performance
2013-2014
(n = 93)
2015-2016
(n =157)
Criteria Mean SD Mean SD
Question/Problem 2.91 0.80 3.09 0.53
Thesis/Position 2.70 0.08 2.69 0.61
Content Development 3.06 0.08 2.91 0.62
Sources/Evidence 2.67 0.07 2.81 0.61
Format 2.84 0.07 2.96 0.56
Conclusions 2.61 0.08 2.66 0.61
Syntax & Editing 2.94 0.07 2.86 0.49
*Overall 2.80 0.06 2.86 0.48
Holistic --- --- 2.92 0.59
1.00 2.00 3.00 4.00
Overall
Question/Problem
Thesis/Position
Content Development
Sources/Evidence
Format
Conclusions
Syntax/Editing
2013-2014 (n=93) 2015-2016 (n=157)

11
College of Health and Human Sciences Student Writing Performance
English Scoring Team Ratings
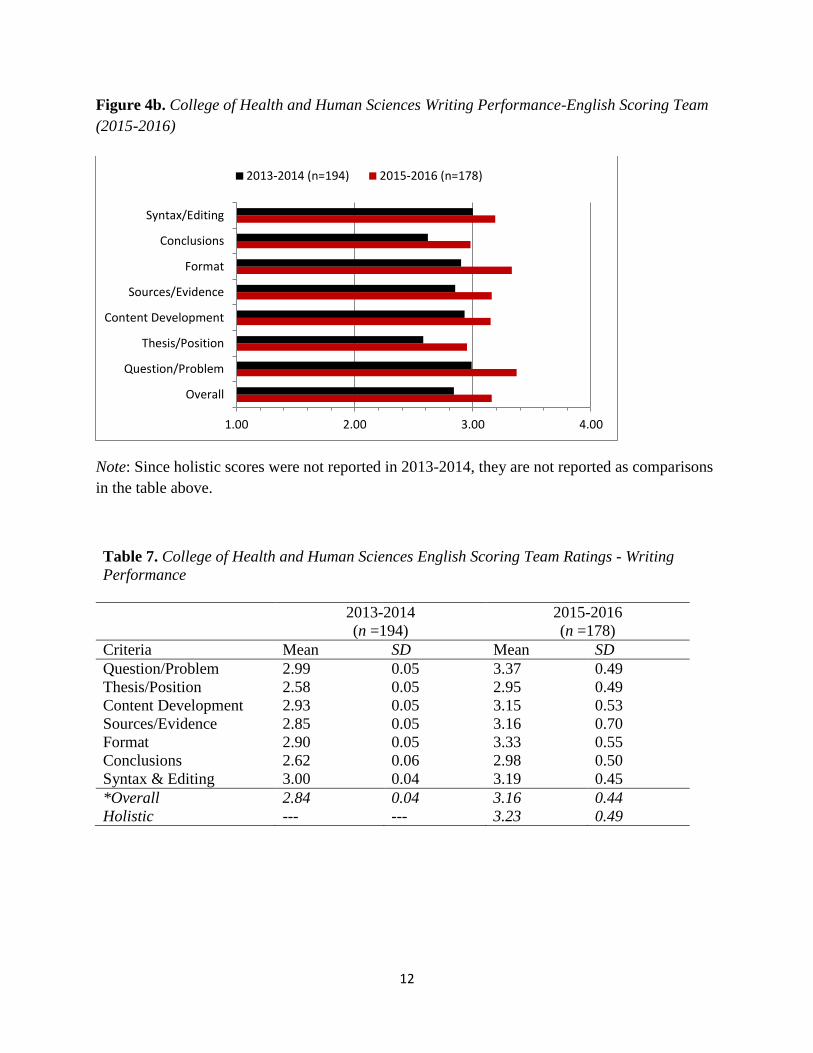
The English scoring team scored a total of 178 junior/senior writing samples from the College of
Health and Human Sciences. Overall, the team rated 91.6 percent of the student papers at a
Progressing 3 level or higher (See Figure 4). This is slightly lower than the prior year’s 94.2
percent.
Figure 4. College of Health and Human Sciences Writing Performance Levels-English Scoring
Team
Writing Subscale Performance
The criteria with the highest aggregate ratings were: question/problem (M=3.37, SD=0.49) and
format (M=3.33, SD=0.55). The ratings are lowest in thesis/position (M=2.95, SD=0.49) and
conclusions (M=2.98, SD=0.50). Thesis/position was also the lowest score in 2013-2014 when a
similar rubric was used. (See Table 7 and Figure 4b). See Appendix B for 2014-2015 ratings by
subscales.
3(1.5%)
50(25.8%)
108(55.7%)
33(17.0%)
0(0.0%)
8(5.8%)
112(81.2%)
18(13.0%)
0(0.0%)
15(8.4%)
115(64.6%)
48(27.0%)
0.0%
10.0%
20.0%
30.0%
40.0%
50.0%
60.0%
70.0%
80.0%
90.0%
100.0%
Developing (1) Progressing (2) Progressing (3) Proficient (4)
2013-2014 (n=194) 2014-2015 (n=138) 2015-2016 (n=178)
12
Figure 4b. College of Health and Human Sciences Writing Performance-English Scoring Team
(2015-2016)
Note: Since holistic scores were not reported in 2013-2014, they are not reported as comparisons
in the table above.
Table 7. College of Health and Human Sciences English Scoring Team Ratings - Writing
Performance
2013-2014
(n =194)
2015-2016
(n =178)
Criteria Mean SD Mean SD
Question/Problem 2.99 0.05 3.37 0.49
Thesis/Position 2.58 0.05 2.95 0.49
Content Development 2.93 0.05 3.15 0.53
Sources/Evidence 2.85 0.05 3.16 0.70
Format 2.90 0.05 3.33 0.55
Conclusions 2.62 0.06 2.98 0.50
Syntax & Editing 3.00 0.04 3.19 0.45
*Overall 2.84 0.04 3.16 0.44
Holistic --- --- 3.23 0.49
1.00 2.00 3.00 4.00
Overall
Question/Problem
Thesis/Position
Content Development
Sources/Evidence
Format
Conclusions
Syntax/Editing
2013-2014 (n=194) 2015-2016 (n=178)
13
College of Liberal Arts and Sciences Student Writing Performance
English Scoring Team Ratings
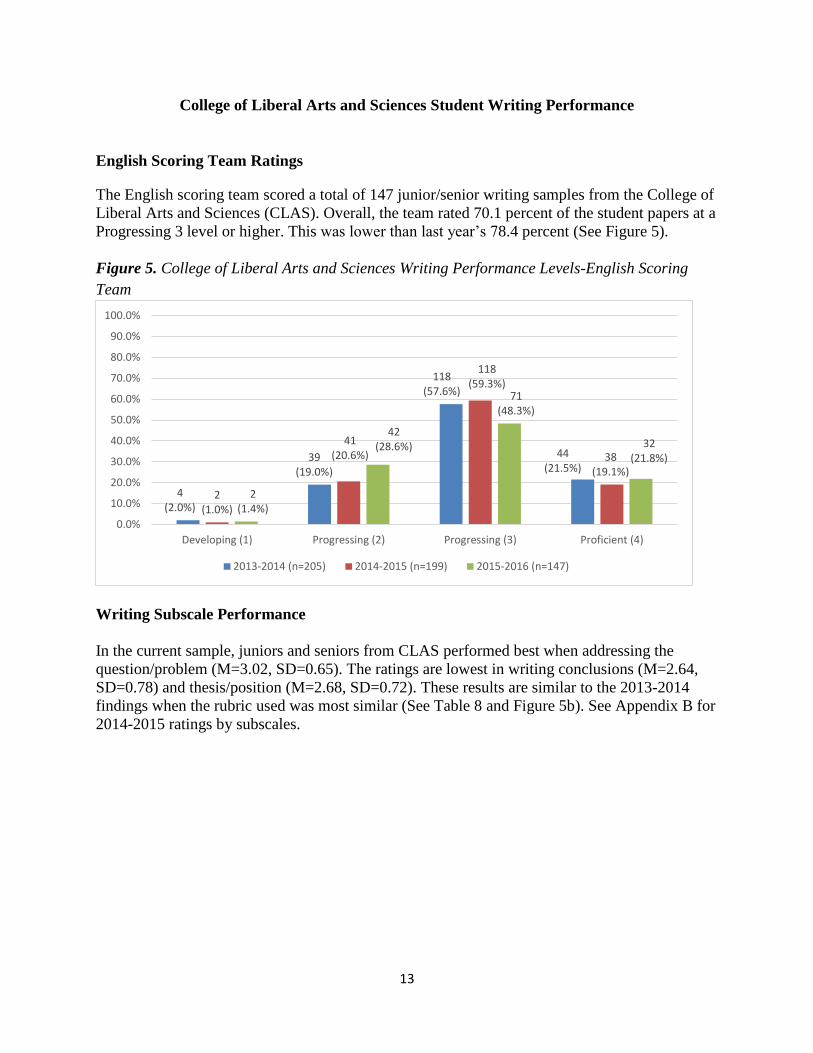
The English scoring team scored a total of 147 junior/senior writing samples from the College of
Liberal Arts and Sciences (CLAS). Overall, the team rated 70.1 percent of the student papers at a
Progressing 3 level or higher. This was lower than last year’s 78.4 percent (See Figure 5).
Figure 5. College of Liberal Arts and Sciences Writing Performance Levels-English Scoring
Team
Writing Subscale Performance
In the current sample, juniors and seniors from CLAS performed best when addressing the
question/problem (M=3.02, SD=0.65). The ratings are lowest in writing conclusions (M=2.64,
SD=0.78) and thesis/position (M=2.68, SD=0.72). These results are similar to the 2013-2014
findings when the rubric used was most similar (See Table 8 and Figure 5b). See Appendix B for
2014-2015 ratings by subscales.
4(2.0%)
39(19.0%)
118(57.6%)
44(21.5%)
2(1.0%)
41(20.6%)
118(59.3%)
38(19.1%)
2(1.4%)
42(28.6%)
71(48.3%)
32(21.8%)
0.0%
10.0%
20.0%
30.0%
40.0%
50.0%
60.0%
70.0%
80.0%
90.0%
100.0%
Developing (1) Progressing (2) Progressing (3) Proficient (4)
2013-2014 (n=205) 2014-2015 (n=199) 2015-2016 (n=147)

14
Figure 5b. College of Liberal Arts and Sciences Writing Performance-English Scoring Team
(2015-2016)
Note: Since holistic scores were not reported in 2013-2014, they are not reported as comparisons
in the table above.
Table 8. College of Liberal Arts and Sciences English Scoring Team Ratings - Writing
Performance
2013-2014
(n = 205)
2015-2016
(n =147)
Criteria Mean SD Mean SD
Question/Problem 3.05 0.04 3.03 0.65
Thesis/Position 2.86 0.04 2.68 0.72
Content Development 3.02 0.05 2.78 0.74
Sources/Evidence 2.96 0.05 2.79 0.75
Format 2.92 0.05 2.99 0.66
Conclusions 2.82 0.05 2.64 0.78
Syntax & Editing 2.96 0.04 2.92 0.70
*Overall 2.94 0.04 2.83 0.63
Holistic --- --- 2.89 0.71
1.00 2.00 3.00 4.00
Overall
Question/Problem
Thesis/Position
Content Development
Sources/Evidence
Format
Conclusions
Syntax/Editing
2013-2014 (n=205) 2015-2016 (n=147)

15
College of Visual and Performing Arts Student Writing Performance
English Scoring Team Ratings
The English scoring team scored a total of 45 junior/senior writing samples from the College of
Visual and Performing Arts (CVPA). Overall, the team rated 75.6 percent of the student papers
at a Progressing 3 level or higher. This is a much lower percentage than last year’s 83.4 percent;
however, it is most likely due to last year’s small sample size (See Figure 6).
Figure 6. College of Visual and Performing Arts Writing Performance Levels-English Scoring
Team
Writing Subscale Performance
In the current sample from CVPA, students performed best when providing a format (M = 2.99,
SD = 0.57), addressing the question/problem (M = 2.95, SD = 0.67), and in syntax & editing (M
= 2.95, SD = 0.58). They rated lowest in addressing a thesis/position (M = 2.63, SD = 0.68).
Results varied in prior years (See Table 9 and Figure 6b). See Appendix B for 2014-2015 ratings
by subscales.
1(4.2%)
9(37.5%)
10(41.7%)
4(16.7%)
0(0.0%)
1(16.7%)
4(66.7%)
1(16.7%)
1(2.2%)
10(22.2%)
30(66.7%)
4(8.9%)
0.0%
10.0%
20.0%
30.0%
40.0%
50.0%
60.0%
70.0%
80.0%
90.0%
100.0%
Developing (1) Progressing (2) Progressing (3) Proficient (4)
2013-2014 (n=24) 2014-2015 (n=6) 2015-2016 (n=45)

16
Figure 6b. College of Visual and Performing Arts Writing Performance-English Scoring Team
(2015-2016)
Note: Since holistic scores were not reported in 2013-2014, they are not reported as comparisons
in the table above.
Table 9. College of Visual and Performing Arts English Scoring Team Ratings - Writing
Performance
2013-2014
(n = 24)
2015-2016
(n = 45)
Criteria Mean SD Mean SD
Question/Problem 2.92 0.14 2.95 0.67
Thesis/Position 2.67 0.13 2.63 0.68
Content Development 2.65 0.15 2.92 0.71
Sources/Evidence 2.65 0.19 2.80 0.60
Format 2.75 0.15 2.99 0.57
Conclusions 2.40 0.15 2.70 0.77
Syntax & Editing 2.81 0.13 2.95 0.58
*Overall 2.69 0.13 2.85 0.56
Holistic 2.94 0.67
1.00 2.00 3.00 4.00
Overall
Question/Problem
Thesis/Position
Content Development
Sources/Evidence
Format
Conclusions
Syntax/Editing
2013-2014 (n=24) 2015-2016 (n=45)

17
Conclusions
This report provides comparisons of written skills over the last three academic years for a
combined sample of NIU juniors and seniors, as assessed using a modified version of the
AAC&U VALUE rubrics for Written Communication and Critical Thinking. Writing samples
were drawn from course-embedded assignments including individual and group papers. Samples
were collected from seventeen departments within five colleges. There were some indicators on
which the sample was not fully representative of the NIU population. In order to maintain
consistency across colleges, we used a trained group of English Team scorers who evaluated
writing samples using the modified AAC&U VALUE rubric. Rigor was maintained by deriving
inter-rater agreement from multiple scorer ratings. Trends in scores are reported by college. In
future years, we may consider using scorers that are discipline specific, categorizing results by
type of assignment (e.g., journal reflections, group papers etc.), and conducting appropriate
statistical analyses, as appropriate based on the sample drawn.

18
APPENDIX A - English Scoring Team Rubric 2015-2016
CRITERIA Proficient 4 3 Progressing 2 Developing 1
Question or
Problem Precise description of question/
problem & its relevant
contextual information.
Reasonable description of
question/ problem & its context.
Sketchy description of question/
problem, some contextual
information.
Incomplete or missing
description of question/
problem; little or no context.
Thesis/
Position Compelling thesis; examines its
complexities & limitations;
proposes to test assumptions.
Thoughtful thesis; acknowledges
its complexities & questions
assumptions.
Adequate thesis; touches on its
complexities & assumptions.
Unclear or inadequate thesis;
oversimplifies or overlooks its
complexities & assumptions.
Content
Development Original, well-conceived ideas
drawn from strong control of
disciplinary knowledge &
specialized terms.
Well-synthesized ideas based on
good control of disciplinary
knowledge & specialized terms.
Acceptable ideas, but they
reflect uneven control of
disciplinary knowledge &
specialized terms.
Fuzzy or misinformed ideas,
show very limited control of
disciplinary knowledge,
misuse of specialized terms.
Sources &
Evidence High-quality sources or
evidence, multiple views
represented, well-evaluated &
integrated; correct citation.
Reliable, balanced sources or
evidence, accurately represented &
integrated; minimal citation errors.
Relevant sources or evidence,
fairly represented, but in need
of better integration; citation
problems.
Minimal sources or evidence,
not always relevant or at times
misrepresented; incorrect
citations.
Format Logical format follows
disciplinary conventions.
Strategic placement of figures or
electronic links, if needed.
Organized format with orderly
transitions. Helpful placement of
figures or links, if needed.
Appropriate but disjointed
format. Figures or links, if
needed, could be better placed.
Disorganized or truncated
format. Figures or links, if
needed, not well placed or
relevant.
Conclusions
Insightful conclusion consistent
with content & thesis; reflects on
outcomes & implications.
Justified conclusion, connected to
development of content & thesis.
Predictable conclusion, drawn
to fit a desired end.
Conclusion inconsistent with
content, oversimplified, or too
abrupt.
Syntax &
Editing
Well-crafted, varied sentences;
grammatically fluent, carefully
edited.
Syntactically clear sentences; few
grammatical errors or typos.
Readable but sometimes
confusing sentences; distracting
errors or typos.
Unclear or poorly constructed
sentences; frequent errors or
typos that impede meaning.

19
APPENDIX B - English Scoring Team Ratings 2014-2015
University-level
Table 10
University-level 2014-2015 English Scoring Team
Ratings - Writing Performance (N=504)
Criteria Mean SD
Audience & Style 3.03 0.58
Focus & Development 2.89 0.60
Analysis 2.66 0.60
Source Integration 2.76 0.65
Format & Editing 2.90 0.62
*Overall 2.85 0.51
Holistic 3.04 0.59
Figure 7: University-level Writing Performance-English Scoring Team (2014-2015)
Note. N=504

20
College of Business
Table 11
College of Business 2014-2015 English Scoring Team
Ratings - Writing Performance (N=101)
Criteria Mean SD
Audience & Style 2.95 0.46
Focus & Development 2.78 0.53
Analysis 2.59 0.49
Source Integration 2.38 0.56
Format & Editing 2.78 0.53
*Overall 2.69 0.41
Holistic 2.86 0.50
Figure 8: College of Business Writing Performance-English Scoring Team (2014-2015)
Note. N=101

21
College of Engineering & Engineering Technology
Table 12
College of Engineering & Engineering Technology
2014-2015 English Scoring Team Ratings - Writing
Performance (N=60)
Criteria Mean SD
Audience & Style 2.99 0.60
Focus & Development 2.87 0.66
Analysis 2.64 0.68
Source Integration 2.63 0.61
Format & Editing 2.71 0.63
*Overall 2.77 0.55
Holistic 2.96 0.59
Figure 9: College of Engineering & Engineering Technology Writing Performance-English
Scoring Team (2014-2015)
Note. N=60

22
College of Health and Human Sciences
Table 13
College of Health and Human Sciences
2014-2015 English Scoring Team Ratings - Writing
Performance (N=138)
Criteria Mean SD
Audience & Style 3.12 0.48
Focus & Development 3.01 0.50
Analysis 2.75 0.53
Source Integration 2.96 0.53
Format & Editing 3.12 0.51
*Overall 2.99 0.39
Holistic 3.17 0.43
Figure 10: College of Health and Human Sciences Writing Performance-English Scoring Team
(2014-2015)
Note. N=138
23
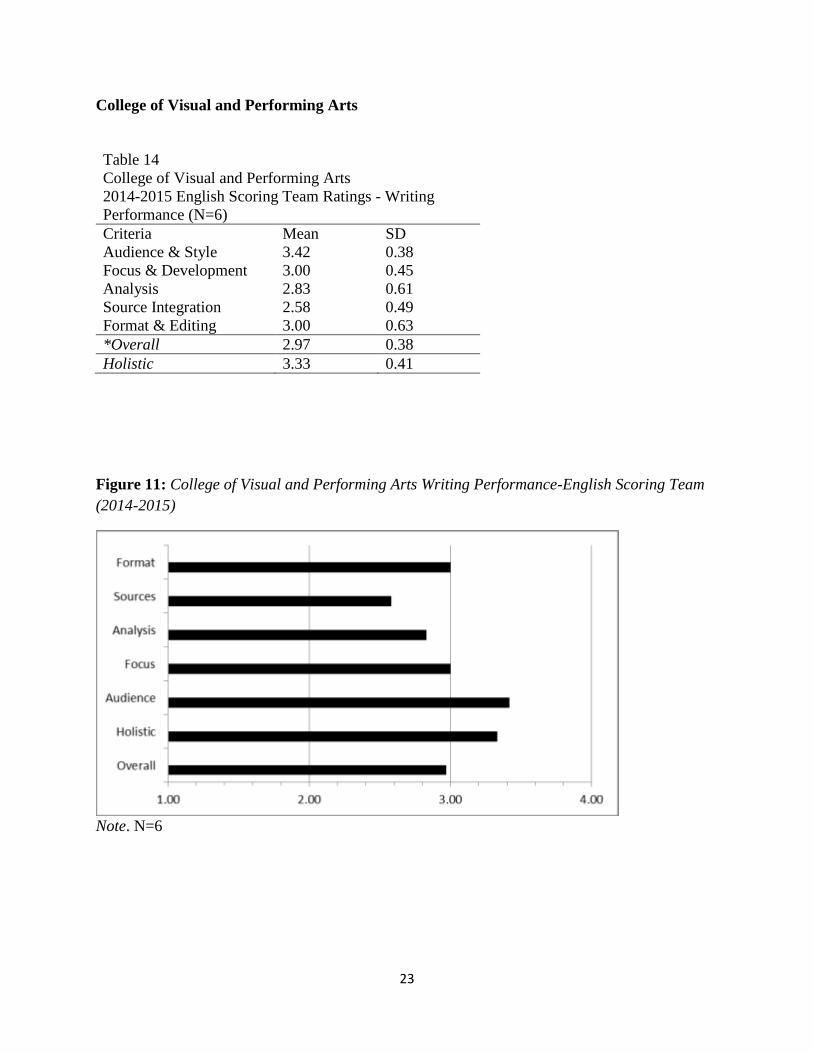
College of Visual and Performing Arts
Table 14
College of Visual and Performing Arts
2014-2015 English Scoring Team Ratings - Writing
Performance (N=6)
Criteria Mean SD
Audience & Style 3.42 0.38
Focus & Development 3.00 0.45
Analysis 2.83 0.61
Source Integration 2.58 0.49
Format & Editing 3.00 0.63
*Overall 2.97 0.38
Holistic 3.33 0.41
Figure 11: College of Visual and Performing Arts Writing Performance-English Scoring Team
(2014-2015)
Note. N=6

24
College of Liberal Arts and Sciences
Table 15
College of Liberal Arts and Sciences
2014-2015 English Scoring Team Ratings - Writing
Performance (N=199)
Criteria Mean SD
Audience & Style 3.01 0.67
Focus & Development 2.88 0.67
Analysis 2.64 0.66
Source Integration 2.86 0.70
Format & Editing 2.86 0.68
*Overall 2.85 0.59
Holistic 3.06 0.69
Figure 12. College of Liberal Arts and Sciences Writing Performance-English Scoring Team
(2014-2015)
Note. N=199