unleash the power of predictive analytics with the sap ... · unleash the power of predictive...
TRANSCRIPT
© 2
016
SAP
SE o
r an
SAP
affilia
te c
ompa
ny. A
ll rig
hts
rese
rved
.
SAP BusinessObjects Predictive Analytics
Unleash the Power of Predictive Analytics with the SAP HANA® Platform
3 Big Data, Big Challenges, and Big Opportunities
7 Examining SAP BusinessObjects Predictive Analytics
7 The Desktop
10 Integration with SAP Business Warehouse
10 Client-Server Predictive Analytics
11 Using SAP BusinessObjects Predictive Analytics and SAP HANA
12 SAP HANA As a Predictive Analytics Platform
13 Ease of Use
13 Speed and Efficiency
14 Simplicity and Automation
14 Operationalization
17 Real-Time Automated Predictive Analysis Use Cases
18 Additional Benefits of SAP BusinessObjects Predictive Analytics with SAP HANA
19 R Scripts
19 “Algorithmic” Predictive Capabilities of SAP HANA: R and PAL
21 Predictive Analysis Library: PAL
25 Automated Predictive Modeling Concepts
25 “Automated” Predictive Capabilities: Using APL
27 The Automated Predictive Library: APL
31 Algorithmic Versus Automated Predictive: R and PAL Versus APL
31 Comparing R, PAL, and APL Capabilities
32 PAL and APL Versus R
33 Why SAP BusinessObjects Predictive Analytics with SAP HANA
2 / 33
© 2016 SAP SE or an SAP affiliate company. All rights reserved.
Table of Contents
3 / 33
© 2016 SAP SE or an SAP affiliate company. All rights reserved.
Big Data, Big Challenges, and Big Opportunities
Traditional business intelligence (BI) tools provide limited explanations of why something happened, because most BI solutions are geared more for reporting and dashboarding workflows that focus on the past. As a result, users are left to create their own insights from slicing, dicing, and drilling through the data themselves.
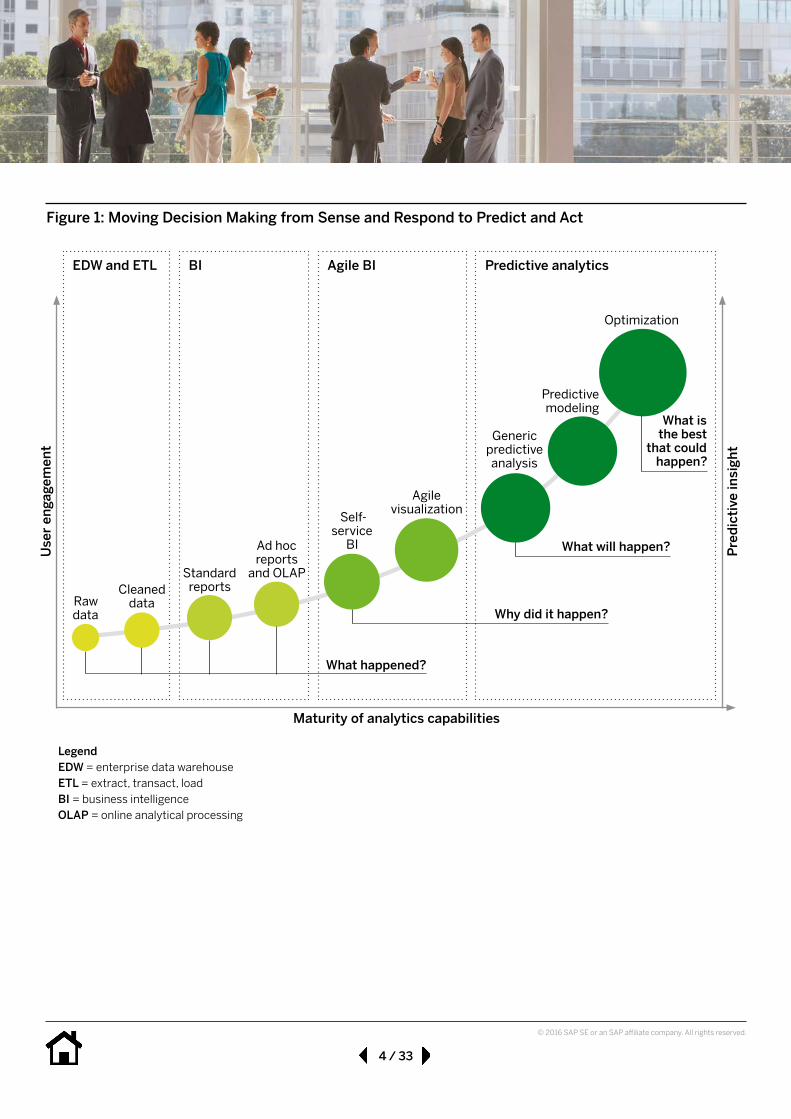
The left side of Figure 1 depicts the evolution of analytics from a pure presentation of raw data to today’s concept of descriptive analytics that helps users understand what their data says about the past. The right side of the figure shows the natural evolution of BI toward predictive analytics. Predictive analytics uses the under-standing of the factors influencing the past to determine what could happen next and even what could be done to positively influence future outcomes.
Predictive analytics algorithmically analyzes historical data to find trends and patterns to understand relationships between elements. By understanding these relationships, you can make better decisions. For example, knowing a particu-lar product generates more profit per unit versus other products may lead you to create a special promotion to increase sales.
Creating such predictive insight is key in Big Data scenarios where a single data row by itself may not have special significance, but its contribution to an overall trend, pattern, or calculation could be meaningful. These relationships are difficult to uncover through traditional BI techniques because they may be too subtle or too compli-cated to be visualized on a chart. Mathematical analysis using statistical techniques has proved to be significantly more effective at understand-ing complex patterns in very large volumes of disaggregated data.
Understanding what happened in the past can provide significant insights, but to truly benefit from your application and data infrastructure investments, you want to understand how to make better decisions to improve your future. Simply com-prehending how to avoid an unexpected turn of events could save a lot of money, just as knowing what you could do to increase revenues can make a huge differ-ence to your bottom line.
4 / 33
© 2016 SAP SE or an SAP affiliate company. All rights reserved.
Figure 1: Moving Decision Making from Sense and Respond to Predict and Act
EDW and ETL BI Agile BI Predictive analytics
Raw data
Cleaned data
Standard reports
Ad hoc reports
and OLAP
Self- service
BI
Agile visualization
Generic predictive analysis
Predictive modeling
Optimization
What happened?
Why did it happen?
What will happen?
What is the best
that could happen?
Use
r eng
agem
ent
Maturity of analytics capabilitiesPr
edic
tive
insi
ght
LegendEDW = enterprise data warehouseETL = extract, transact, loadBI = business intelligenceOLAP = online analytical processing

5 / 33
© 2016 SAP SE or an SAP affiliate company. All rights reserved.
The result of predictive analytics is not a BI arti-fact like a query or a report, but a mathematical representation (a “model”) of the relationships found between different elements in the data. You can then use this model to perform what-if analysis to maximize or minimize a value. Or you can apply the model against entirely new data to predict a future outcome such as “a customer’s probability to purchase” or “projected revenue for the next four quarters.”
Making predictions in real time is even more valu-able: rather than waiting until the end of the day or end of the week to run an analysis, you can make a decision as soon as data becomes avail-able. This can mean millions of dollars or, in some industries, could be the difference between life and death.
However, most organizations have many hetero-geneous technologies supporting legacy environ-ments, leading to inefficient data management and significant operational overhead. In addition, many organizational silos are common in larger organizations where multiple teams are responsi-ble for the data infrastructure. This is illustrated in Figure 2.
There is an ever-increasing set of technologies designed to make each of these steps faster. However, both the amount of data being gener-ated and the speed at which this data needs to be analyzed is growing exponentially so that traditional methods of analysis will soon no longer be viable.
Figure 2: Data Analysis – Multiple Silos Versus In-Memory Computing
Separated transactions + analysis + acceleration processes• Redundant data in and across applications• Inherent data latency
Transact Analyze
Cache
Accelerate
ETL ETL
VER
SUS
One in-memory atomic copy of data for transactions + analysis• Elimination of unnecessary complexity
and latency• Acceleration through simplification
SAP HANA®
LegendETL = extract, transact, load
6 / 33
© 2016 SAP SE or an SAP affiliate company. All rights reserved.
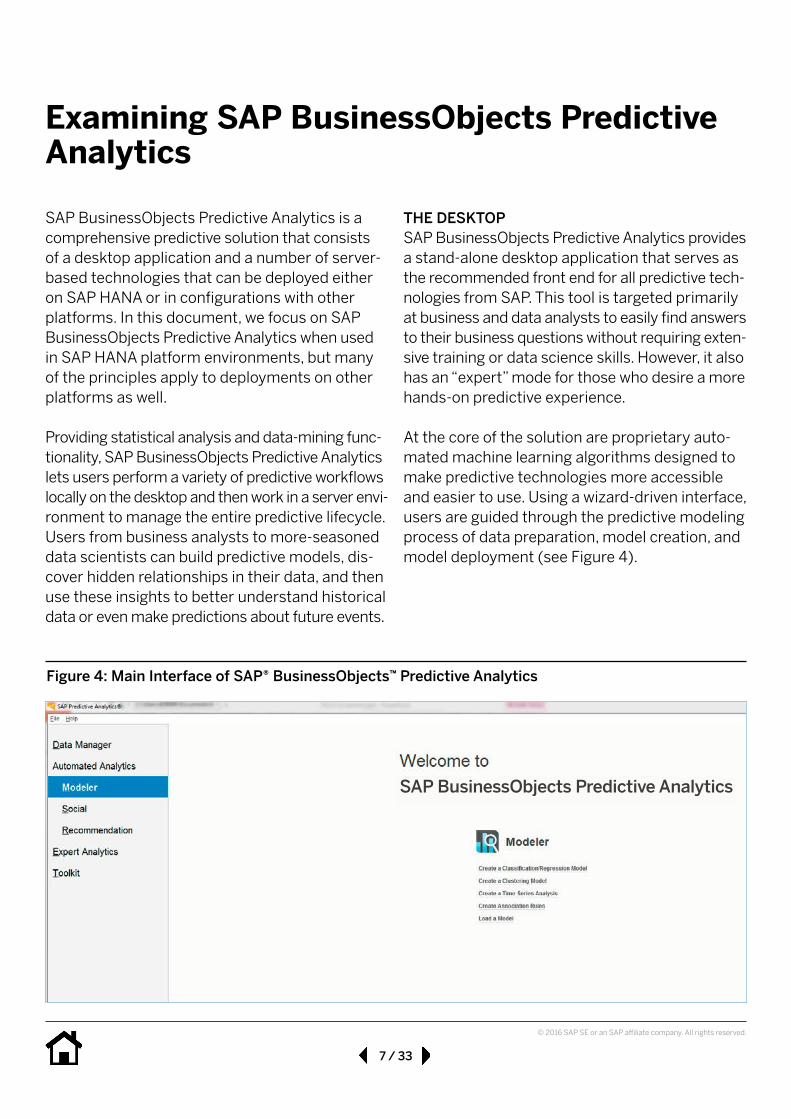
SAP HANA lets you move from descriptive analyt-ics to predictive analytics while taking advantage of the speed and scalability provided by a native in-memory solution. SAP® BusinessObjects™ Predictive Analytics software with SAP HANA further improves this value. It makes fully automated predictive capa-bilities accessible to a wider range of users without requiring them to have data science experience or a statistical background. This is accomplished through the automated predictive library (APL) for SAP HANA, which is a native implementation of our mature, proprietary, automated machine learning technology that can handle large volumes of data at lightning speed.
The industry is turning to in-memory technologies that not only store data within volatile memory but also perform computations on that data in place. Such a strategy brings the calculations to the data rather than the other way around. This avoids much of the data extraction, transfer, and duplication required in heterogeneous analytical environments. Using sophisticated onboard calcu-lation and prediction engines, in-memory plat-forms such as SAP HANA® are changing how we process, analyze, and act on the ever-increasing volume of data we create every day (see Figure 3).
Figure 3: Using In-Memory Technology to Process, Analyze, and Act on Big Data
What happened? Why did it happen? What will happen? How can I make it happen?
• Standard reports• Ad hoc reports• OLAP analysis
• Drill-down analysis• Data discovery
Predictive modeling Real-time automated predictive analysis
SAP HANA®Predict and actSense and respond
LegendOLAP = online analytical processing
7 / 33
© 2016 SAP SE or an SAP affiliate company. All rights reserved.
SAP BusinessObjects Predictive Analytics is a comprehensive predictive solution that consists of a desktop application and a number of server-based technologies that can be deployed either on SAP HANA or in configurations with other platforms. In this document, we focus on SAP BusinessObjects Predictive Analytics when used in SAP HANA platform environments, but many of the principles apply to deployments on other platforms as well.
Providing statistical analysis and data-mining func-tionality, SAP BusinessObjects Predictive Analytics lets users perform a variety of predictive workflows locally on the desktop and then work in a server envi-ronment to manage the entire predictive lifecycle. Users from business analysts to more-seasoned data scientists can build predictive models, dis-cover hidden relationships in their data, and then use these insights to better understand historical data or even make predictions about future events.
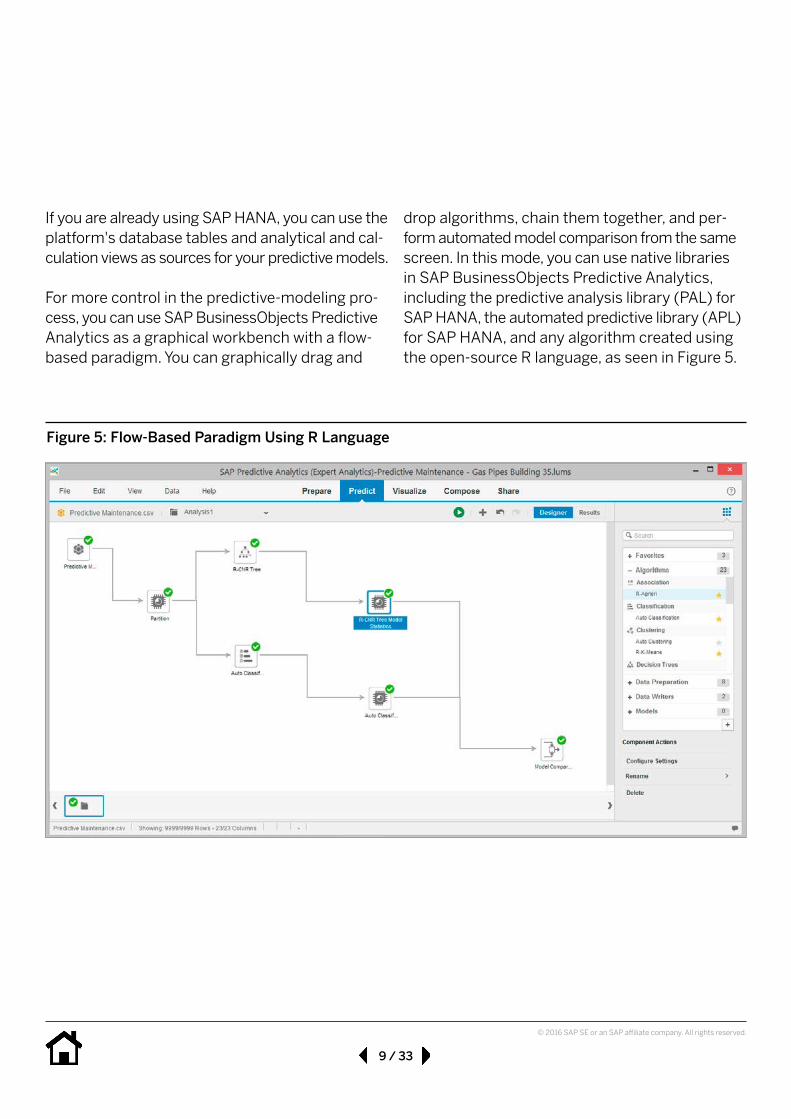
THE DESKTOPSAP BusinessObjects Predictive Analytics provides a stand-alone desktop application that serves as the recommended front end for all predictive tech-nologies from SAP. This tool is targeted primarily at business and data analysts to easily find answers to their business questions without requiring exten-sive training or data science skills. However, it also has an “expert” mode for those who desire a more hands-on predictive experience.
At the core of the solution are proprietary auto-mated machine learning algorithms designed to make predictive technologies more accessible and easier to use. Using a wizard-driven interface, users are guided through the predictive modeling process of data preparation, model creation, and model deployment (see Figure 4).
Examining SAP BusinessObjects Predictive Analytics
Figure 4: Main Interface of SAP® BusinessObjects™ Predictive Analytics
SAP BusinessObjects Predictive Analytics

8 / 33
© 2016 SAP SE or an SAP affiliate company. All rights reserved.
MAJOR FEATURES OF SAP® BUSINESSOBJECTS™ PREDICTIVE ANALYTICS
Prepare data: Define source data creation or manipulations Create persistent metadata definitions Enable the automatic creation of thousands of derived attributes
Perform automatic predictive modeling: Regression and classification Clustering Forecasting Association rules Social network analysis
Produce automatic analysis of models: Estimate predictive power and confidence Identify the most contributive attributes Produce statistical reports Create graphical analysis of results
Save, export, and apply results: Create and save persistent models Export scoring equations as structured query language (SQL) or code Apply predictive models directly to data sets and in your database (if applicable)
9 / 33
© 2016 SAP SE or an SAP affiliate company. All rights reserved.
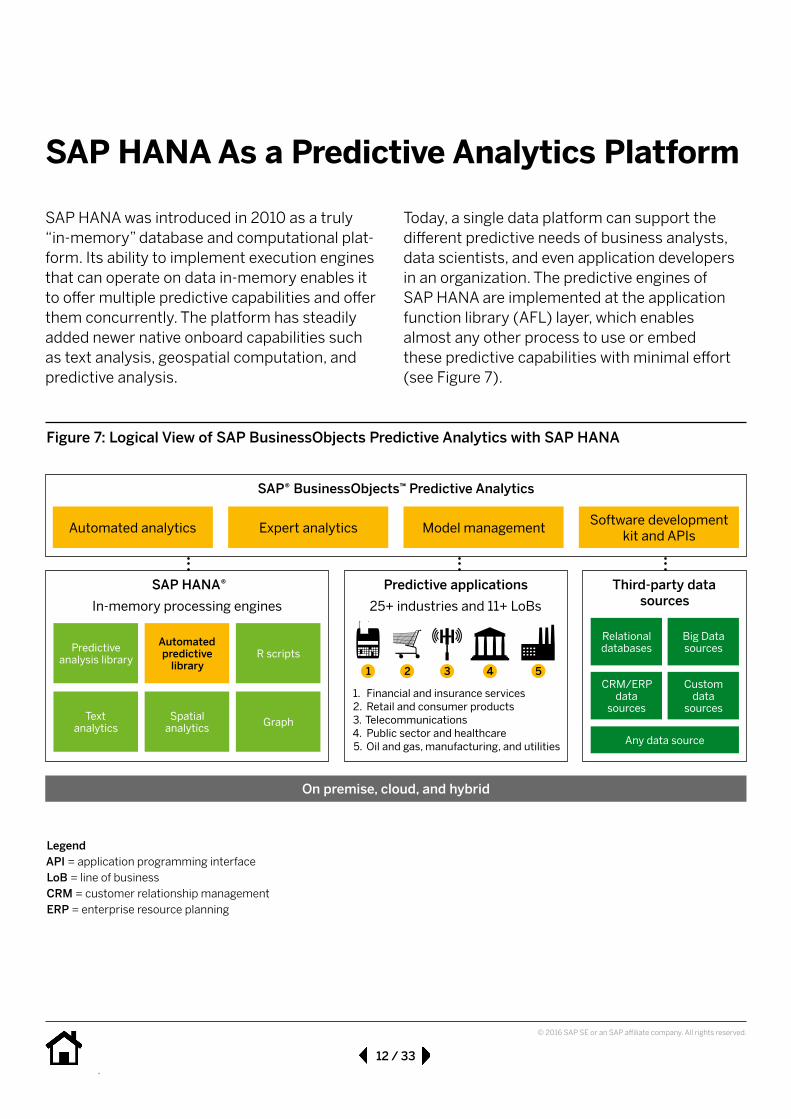
If you are already using SAP HANA, you can use the platform's database tables and analytical and cal-culation views as sources for your predictive models.
For more control in the predictive-modeling pro-cess, you can use SAP BusinessObjects Predictive Analytics as a graphical workbench with a flow-based paradigm. You can graphically drag and
drop algorithms, chain them together, and per-form automated model comparison from the same screen. In this mode, you can use native libraries in SAP BusinessObjects Predictive Analytics, including the predictive analysis library (PAL) for SAP HANA, the automated predictive library (APL) for SAP HANA, and any algorithm created using the open-source R language, as seen in Figure 5.
Figure 5: Flow-Based Paradigm Using R Language

10 / 33
INTEGRATION WITH SAP BUSINESS WAREHOUSEYou may be using the SAP Business Warehouse (SAP BW) application or SAP BW powered by SAP HANA for your warehousing needs. If so, you can use the expert interface to connect SAP BusinessObjects Predictive Analytics directly to SAP BW or SAP BW on SAP HANA using a native BI consumer services (BICS) connection. By connecting to info providers of SAP BW and executing SAP Business Explorer® (SAP BEx) tools queries, you can download data sets for offline model training (see Figure 6). You can even eliminate the need to manually export data to a file for predictive analysis.
CLIENT-SERVER PREDICTIVE ANALYTICSYou can deploy SAP BusinessObjects Predictive Analytics in a client-server configuration to create and process models remotely and publish them to a central repository for sharing with other users. The addition of a predictive analytics server in the environment enables you to move from exe-cuting a single model interactively to automating the creation, execution, and validation of thou-sands of models. And you can do this without needing to be in front of your desktop.
The user component of this server is model manager, a thin-client, Web-based application that allows all users to automate as much of the predictive lifecycle as possible, such as: • Retraining a model • Applying a model to a new data set • Detecting model deviations • Detecting deviation of a data set
In a database environment that is not using SAP HANA, the predictive analytics server extracts data from the source database and computes the models locally in the same manner as the desktop to perform its functions.
Note: When using a license for SAP BusinessObjects Predictive Analytics software for use with data-bases other than SAP HANA, you cannot use the software with SAP HANA without obtaining the corresponding license. In addition, you cannot use the desktop of SAP BusinessObjects Predictive Analytics with SAP HANA–specific features such as the predictive analysis library or integration to an external R server.
Figure 6: SAP BusinessObjects Predictive Analytics Connecting to SAP Business Warehouse Using BICS
SAP® BusinessObjects™ Predictive Analytics
BI consumer services (BICS)
SAP Business Warehouse
Info provider SAP Business Explorer® tools query
© 2016 SAP SE or an SAP affiliate company. All rights reserved.

11 / 33
USING SAP BUSINESSOBJECTS PREDICTIVE ANALYTICS AND SAP HANASAP BusinessObjects Predictive Analytics with SAP HANA provides the same capabilities as described in the previous section and much more. SAP BusinessObjects Predictive Analytics is opti-mized for SAP HANA to support huge data vol-umes and in-memory processing. You can connect to SAP HANA in an “online mode” that pushes calculation operations to the APL and PAL for SAP HANA. This means you do not need to extract the data and perform those same calculations on the desktop. In addition, there is no data move-ment required for SAP HANA–based predictive workflows, and only the predictive results are sent back to the desktop client after processing.
SAP BusinessObjects Predictive Analytics sup-ports the full range of predictive capabilities in SAP HANA, including creating multiple models using any combination of PAL, APL, and R server scripts. The solution also supports executing advanced functions from SAP HANA, such as unified demand forecast (UDF), sentiment analy-sis, and optimization function libraries (OFL).
In an SAP HANA platform environment, all model management functions in SAP BusinessObjects Predictive Analytics are performed with the pre-dictive analytics server. The ability to manage the models directly from an interface on SAP HANA is part of the longer-term road map.
Note: When using a license for SAP BusinessObjects Predictive Analytics with SAP HANA, you will not be able to use the automated analytics server with other databases without additional licensing.
© 2016 SAP SE or an SAP affiliate company. All rights reserved.
Using sophisticated onboard calculation and prediction engines, in-memory platforms such as SAP HANA are changing how we process, analyze, and act on the ever-increasing volume of data we create every day.
SAP HANA As a Predictive Analytics Platform
12 / 33
© 2016 SAP SE or an SAP affiliate company. All rights reserved.
Today, a single data platform can support the different predictive needs of business analysts, data scientists, and even application developers in an organization. The predictive engines of SAP HANA are implemented at the application function library (AFL) layer, which enables almost any other process to use or embed these predictive capabilities with minimal effort (see Figure 7).
SAP HANA was introduced in 2010 as a truly “in-memory” database and computational plat-form. Its ability to implement execution engines that can operate on data in-memory enables it to offer multiple predictive capabilities and offer them concurrently. The platform has steadily added newer native onboard capabilities such as text analysis, geospatial computation, and predictive analysis.
Predictive applications
Figure 7: Logical View of SAP BusinessObjects Predictive Analytics with SAP HANA
SAP® BusinessObjects™ Predictive Analytics
Automated analytics Expert analytics Model management Software development kit and APIs
SAP HANA® Third-party data sources
Predictive analysis library
Automated predictive
libraryR scripts
Text analytics
Spatial analytics Graph
1. Financial and insurance services2. Retail and consumer products3. Telecommunications4. Public sector and healthcare5. Oil and gas, manufacturing, and utilities
25+ industries and 11+ LoBs
1 2 3 4 5
Relational databases
Big Data sources
CRM/ERP data
sources
Custom data
sources
Any data source
On premise, cloud, and hybrid
In-memory processing engines
LegendAPI = application programming interfaceLoB = line of business CRM = customer relationship managementERP = enterprise resource planning
13 / 33
© 2016 SAP SE or an SAP affiliate company. All rights reserved.
SPEED AND EFFICIENCYThe SAP HANA platform’s unique ability to use native, onboard execution engines means you can perform predictive calculations for training, validating, and scoring without data extraction or even manipulation. Running predictive models in-memory results in dramatic performance improvements in addition to a more-efficient use of system resources. If you can make faster decisions based on real-time analysis of data, you can typically make better and more-informed decisions. When these execution engines are combined with the event-processing capabilities of the platform, you can be instantly alerted and take action as soon as a situation or opportunity is detected.
Consider a scenario where you are using millions of customer records in an analysis to determine clusters of attractive market segments within the population. Processing such a large number of records is already an expensive and time- consuming task. However, extracting and transferring these records to a separate analytics server also creates additional workload and cost for the rest of the IT infrastructure.
The ability of SAP HANA to perform predictive calculations directly from within SQLScript enables you to use existing SQL expertise in your organization while providing on-the-fly process-ing on compressed data with unmatched speed and efficiency.
The following sections discuss many of the benefits and considerations of using SAP BusinessObjects Predictive Analytics with SAP HANA as your data processing and analytical platform.
EASE OF USEThe desktop of SAP BusinessObjects Predictive Analytics is recommended for all deployments of SAP HANA because it provides a GUI for all pre-dictive technologies in SAP HANA such as the PAL and APL. The software includes a GUI for third-party technologies as well, such as scripts using the open-source R language. You can use any combi-nation of these technologies together while taking advantage of server-side processing and native support of database tables and calculation and analytical views of SAP HANA.
Providing all business analysts and data scien-tists with the desktop of SAP BusinessObjects Predictive Analytics helps ensure that they can access data and native predictive technologies of SAP HANA without having to acquire new skills. This includes not having to learn SQLScript of SAP HANA or use a more administratively focused tool such as the SAP HANA studio. This dramati-cally increases the number of people who can access predictive capabilities as well as the poten-tial return on your investment in SAP HANA.
14 / 33
© 2016 SAP SE or an SAP affiliate company. All rights reserved.
incorporate the incremental improvements in the model in real time, schedule model refreshes, manage models by exception, and deploy scores instantly.
When combined with other components from SAP BusinessObjects Predictive Analytics, SAP HANA becomes a single platform for all predic-tive workflows and automates the full predictive lifecycle from model creation to deployment and even ongoing model validation. The IT landscape becomes simpler, and users have a single analyt-ics platform regardless of the predictive technol-ogy they use.
OPERATIONALIZATIONWhen you operationalize a model, you use the predictive insights to improve a process, work-flow, or decision in a production environment. This is an often-overlooked aspect of predictive analytics; creating a model in a desktop tool may provide an interesting analysis but does not pro-vide much incremental business value.
You can maximize the return on your predictive investment by operationalizing your models and embedding them directly into your business processes. However, in traditional solutions, deploying a model is typically a manual step and may even require an additional predictive server to be configured.
SIMPLICITY AND AUTOMATIONIn most business scenarios, speed is not enough; if the power to achieve the benefits of predictive analytics at such speeds is limited to a handful of “experts,” the number of scenarios to which pre-dictive analytics can bring real business value will also be limited. The reality is that most organiza-tions have very few people with data science backgrounds and have even fewer data scien-tists. The traditional approach to solving this problem is to train more people and create an even greater investment in data science skills.
The automated predictive library for SAP HANA implements a sophisticated automated machine learning engine to provide a “data-scientist-in- a-box” solution that can generate complex pre-dictive models on its own without requiring the user to have deep data science knowledge. We will cover the APL in more detail in the section “Automated Predictive Library: APL.”
The model manager tool within SAP BusinessObjects Predictive Analytics provides automatic performance-tuning capabilities to help ensure that models are tuned to be operat-ing at peak performance at all times for optimal outcomes. The tool features a browser-based, single-sign-on environment and user-friendly scheduling interface designed for data analysts. As a result, you can try a variety of scenarios,
15 / 33
© 2016 SAP SE or an SAP affiliate company. All rights reserved.
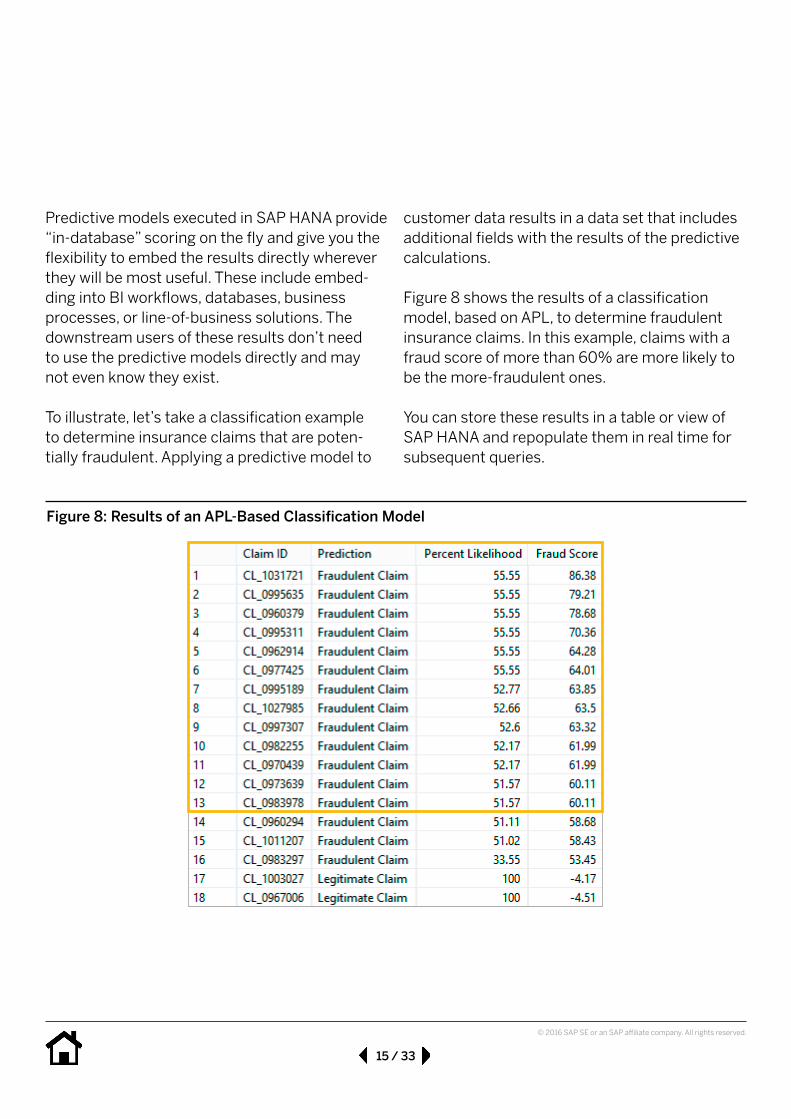
customer data results in a data set that includes additional fields with the results of the predictive calculations.
Figure 8 shows the results of a classification model, based on APL, to determine fraudulent insurance claims. In this example, claims with a fraud score of more than 60% are more likely to be the more-fraudulent ones.
You can store these results in a table or view of SAP HANA and repopulate them in real time for subsequent queries.
Predictive models executed in SAP HANA provide “in-database” scoring on the fly and give you the flexibility to embed the results directly wherever they will be most useful. These include embed-ding into BI workflows, databases, business processes, or line-of-business solutions. The downstream users of these results don’t need to use the predictive models directly and may not even know they exist.
To illustrate, let’s take a classification example to determine insurance claims that are poten-tially fraudulent. Applying a predictive model to
Figure 8: Results of an APL-Based Classification Model
16 / 33
© 2016 SAP SE or an SAP affiliate company. All rights reserved.
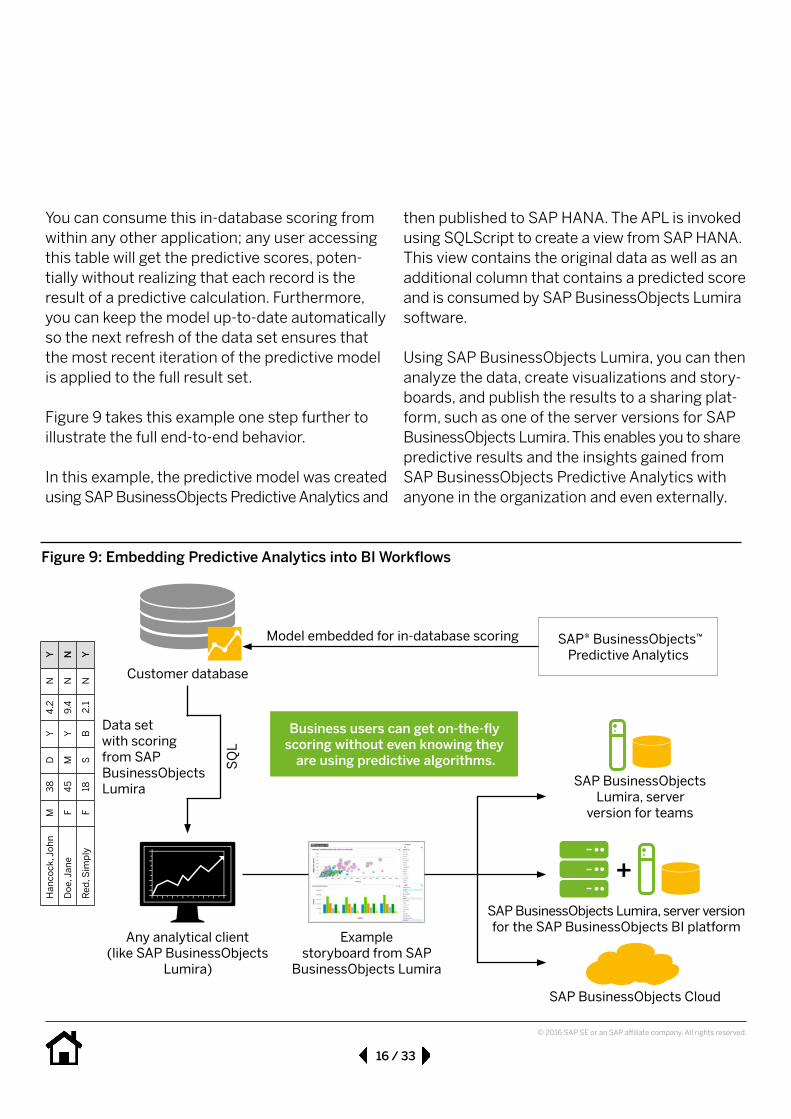
then published to SAP HANA. The APL is invoked using SQLScript to create a view from SAP HANA. This view contains the original data as well as an additional column that contains a predicted score and is consumed by SAP BusinessObjects Lumira software.
Using SAP BusinessObjects Lumira, you can then analyze the data, create visualizations and story-boards, and publish the results to a sharing plat-form, such as one of the server versions for SAP BusinessObjects Lumira. This enables you to share predictive results and the insights gained from SAP BusinessObjects Predictive Analytics with anyone in the organization and even externally.
You can consume this in-database scoring from within any other application; any user accessing this table will get the predictive scores, poten-tially without realizing that each record is the result of a predictive calculation. Furthermore, you can keep the model up-to-date automatically so the next refresh of the data set ensures that the most recent iteration of the predictive model is applied to the full result set.
Figure 9 takes this example one step further to illustrate the full end-to-end behavior.
In this example, the predictive model was created using SAP BusinessObjects Predictive Analytics and
Figure 9: Embedding Predictive Analytics into BI Workflows
Customer database
Han
cock
, Joh
nM
38D
Y4.
2N
Y
Doe
, Jan
eF
45M
Y9.
4N
N
Red,
Sim
ply
F18
SB
2.1
NY
Data set with scoring from SAP BusinessObjects Lumira
Any analytical client (like SAP BusinessObjects
Lumira)
SQL
Model embedded for in-database scoring
Business users can get on-the-fly scoring without even knowing they
are using predictive algorithms.
Example storyboard from SAP
BusinessObjects Lumira
SAP BusinessObjects Lumira, server
version for teams
+SAP BusinessObjects Lumira, server version for the SAP BusinessObjects BI platform
SAP BusinessObjects Cloud
SAP® BusinessObjects™ Predictive Analytics
17 / 33
© 2016 SAP SE or an SAP affiliate company. All rights reserved.
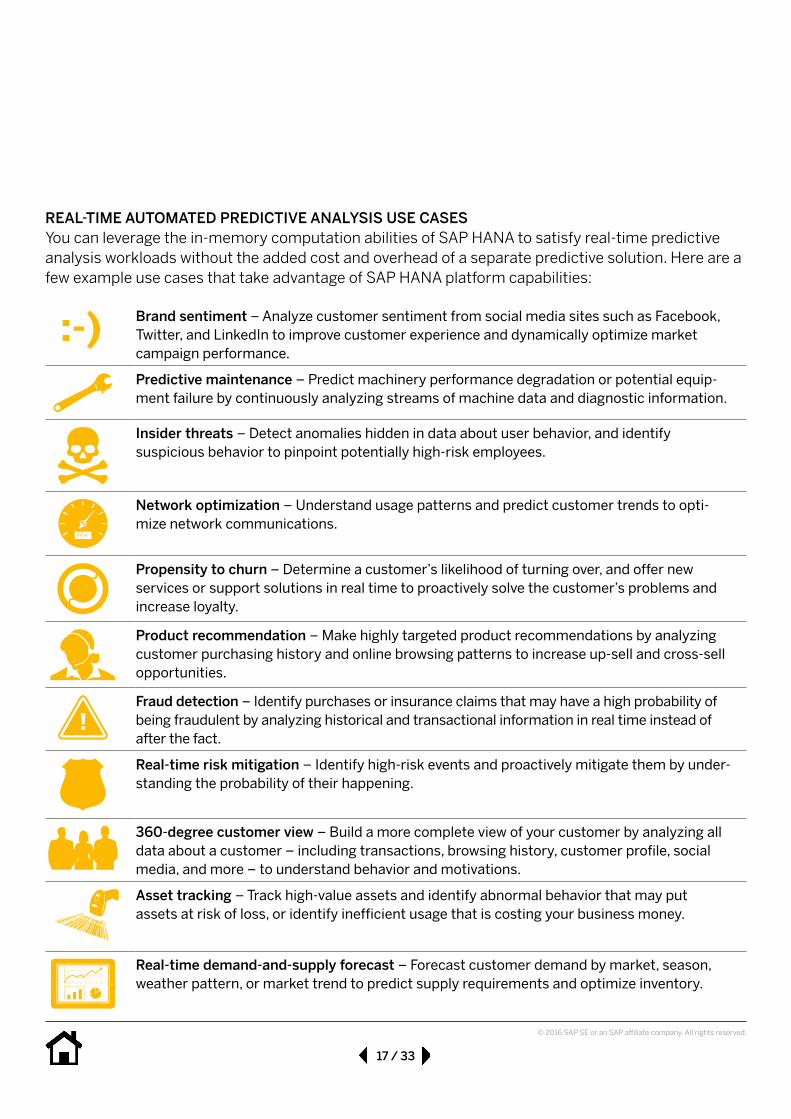
REAL-TIME AUTOMATED PREDICTIVE ANALYSIS USE CASES You can leverage the in-memory computation abilities of SAP HANA to satisfy real-time predictive analysis workloads without the added cost and overhead of a separate predictive solution. Here are a few example use cases that take advantage of SAP HANA platform capabilities:
:-) Brand sentiment – Analyze customer sentiment from social media sites such as Facebook, Twitter, and LinkedIn to improve customer experience and dynamically optimize market campaign performance.
Predictive maintenance – Predict machinery performance degradation or potential equip-ment failure by continuously analyzing streams of machine data and diagnostic information.
Insider threats – Detect anomalies hidden in data about user behavior, and identify suspicious behavior to pinpoint potentially high-risk employees.
Network optimization – Understand usage patterns and predict customer trends to opti-mize network communications.
Propensity to churn – Determine a customer’s likelihood of turning over, and offer new services or support solutions in real time to proactively solve the customer’s problems and increase loyalty.
Product recommendation – Make highly targeted product recommendations by analyzing customer purchasing history and online browsing patterns to increase up-sell and cross-sell opportunities.
Fraud detection – Identify purchases or insurance claims that may have a high probability of being fraudulent by analyzing historical and transactional information in real time instead of after the fact.
Real-time risk mitigation – Identify high-risk events and proactively mitigate them by under-standing the probability of their happening.
360-degree customer view – Build a more complete view of your customer by analyzing all data about a customer – including transactions, browsing history, customer profile, social media, and more – to understand behavior and motivations.
Asset tracking – Track high-value assets and identify abnormal behavior that may put assets at risk of loss, or identify inefficient usage that is costing your business money.
Real-time demand-and-supply forecast – Forecast customer demand by market, season, weather pattern, or market trend to predict supply requirements and optimize inventory.
18 / 33
© 2016 SAP SE or an SAP affiliate company. All rights reserved.
If you use SAP BW powered by SAP HANA, SAP S/4HANA software, SAP HANA Live offer-ings, or virtually any application hosted on the SAP HANA platform, you can immediately use the onboard predictive capabilities directly. Or you can embed predictive directives directly into the application’s views from SAP HANA, or embed predictive directives directly into an application.
ADDITIONAL BENEFITS OF SAP BUSINESSOBJECTS PREDICTIVE ANALYTICS WITH SAP HANAThe APL and PAL capabilities for SAP HANA are implemented as application function libraries, which allows these engines to take advantage of everything the platform offers. This includes unified access to the information views and tables of SAP HANA, automatic parallelizing of all predic-tive computations, and full support of any applica-tion that uses SAP HANA.
SAP BusinessObjects Predictive Analytics is a stand-alone solution that can also leverage SAP HANA to support huge data volumes and in-memory processing without requiring data extraction.
19 / 33
© 2016 SAP SE or an SAP affiliate company. All rights reserved.
SAP HANA supports multiple methods for using data science–specific algorithms in the predic-tive process. The following section discusses the benefits and challenges of each.
R SCRIPTSThe open-source language R is the most popular predictive-modeling environment in the world. As a language created by mathematicians for mathematicians, it was designed from the begin-ning to be easily extensible and supports people sharing what they have written with others to use in their own modeling tasks. At the time of this writing, there are more than 5,800 open-source algorithms publicly available and countless others that are considered the proprietary intel-lectual property of their creators.
Data scientists typically create predictive models on historical data sets by applying one or more mathematical algorithms to capture the implicit relationships within the data. Use of these algo-rithms requires a significant understanding of the data and a solid grasp of statistics and other mathematical concepts (see Figure 10).
It is not uncommon for a data scientist to spend days or weeks analyzing the data before creating a robust and stable predictive model. In some cases, the data scientist may even have to create his or her own algorithms to solve more-complex problems or create a predictive model that is specific to an industry.
“Algorithmic” Predictive Capabilities of SAP HANA: R and PAL
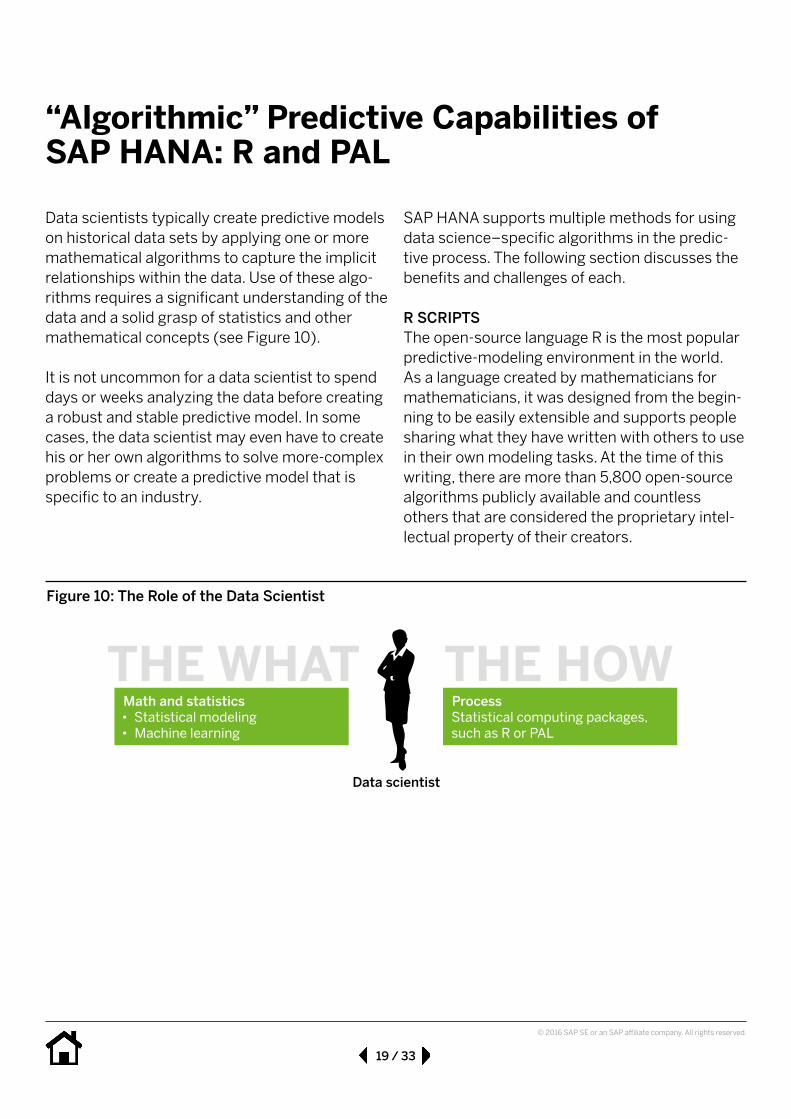
Figure 10: The Role of the Data Scientist
THE WHATMath and statistics• Statistical modeling• Machine learning
Data scientist
THE HOWProcessStatistical computing packages, such as R or PAL
20 / 33
© 2016 SAP SE or an SAP affiliate company. All rights reserved.
SAP BusinessObjects Predictive Analytics offers an expert mode to desktop users to let you use any combination of algorithms from a variety of libraries. Libraries include those in SAP HANA such as the PAL and APL, as well as an external R server.
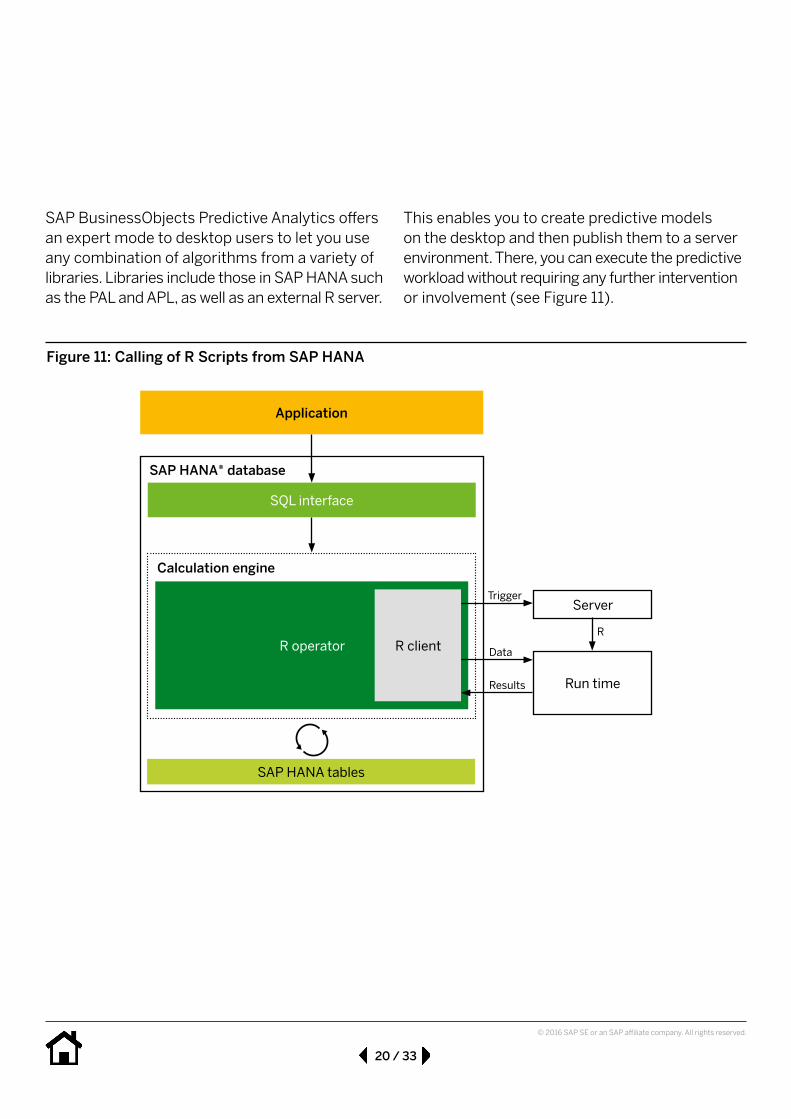
Figure 11: Calling of R Scripts from SAP HANA
Application
SAP HANA® database
SQL interface
Calculation engine
R operator R client
SAP HANA tables
ServerTrigger
Run time
Data
Results
R
This enables you to create predictive models on the desktop and then publish them to a server environment. There, you can execute the predictive workload without requiring any further intervention or involvement (see Figure 11).
21 / 33
© 2016 SAP SE or an SAP affiliate company. All rights reserved.
While the PAL cannot replicate all 5,800 algo-rithms that are available with R, the PAL contains the SAP native C++ implementations of the most commonly used algorithms. The number of algo-rithms supported in PAL has been growing with every service pack of SAP HANA.
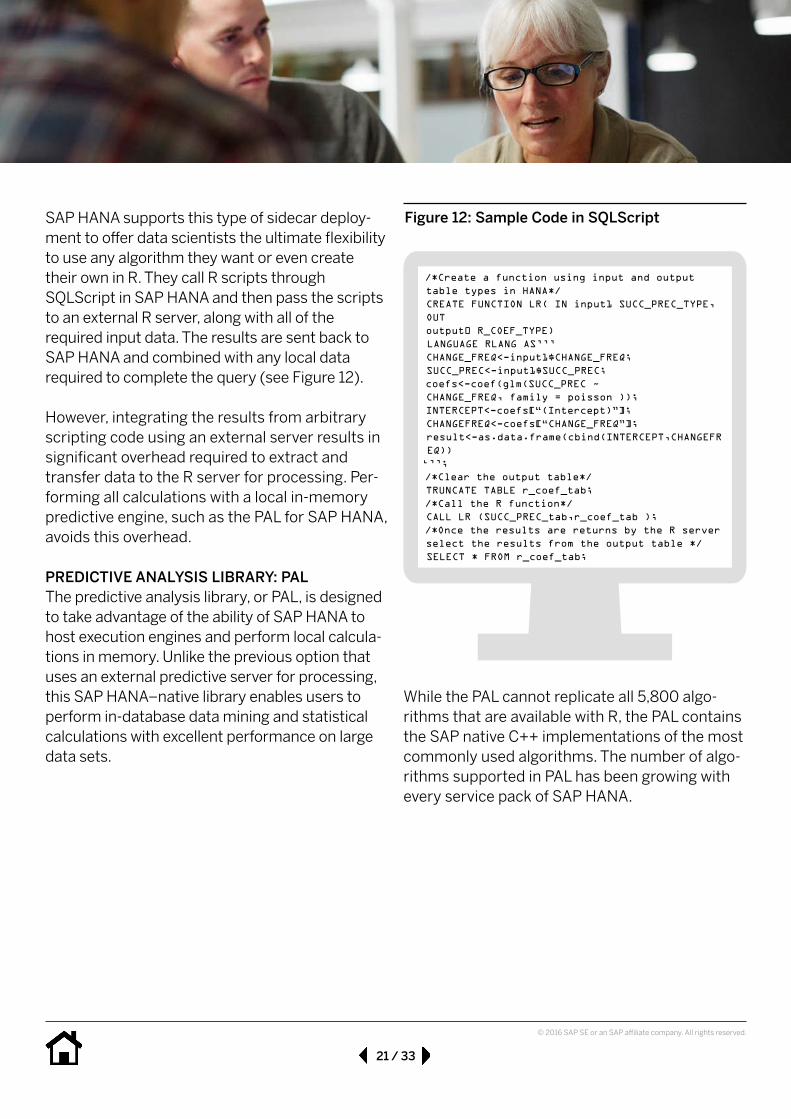
SAP HANA supports this type of sidecar deploy-ment to offer data scientists the ultimate flexibility to use any algorithm they want or even create their own in R. They call R scripts through SQLScript in SAP HANA and then pass the scripts to an external R server, along with all of the required input data. The results are sent back to SAP HANA and combined with any local data required to complete the query (see Figure 12).
However, integrating the results from arbitrary scripting code using an external server results in significant overhead required to extract and transfer data to the R server for processing. Per-forming all calculations with a local in-memory predictive engine, such as the PAL for SAP HANA, avoids this overhead.
PREDICTIVE ANALYSIS LIBRARY: PALThe predictive analysis library, or PAL, is designed to take advantage of the ability of SAP HANA to host execution engines and perform local calcula-tions in memory. Unlike the previous option that uses an external predictive server for processing, this SAP HANA–native library enables users to perform in-database data mining and statistical calculations with excellent performance on large data sets.
Figure 12: Sample Code in SQLScript
/*Create a function using input and output table types in HANA*/CREATE FUNCTION LR( IN input1 SUCC_PREC_TYPE, OUToutput0 R_COEF_TYPE)LANGUAGE RLANG AS’’’CHANGE_FREQ<-input1$CHANGE_FREQ;SUCC_PREC<-input1$SUCC_PREC;coefs<-coef(glm(SUCC_PREC ~CHANGE_FREQ, family = poisson ));INTERCEPT<-coefs[“(Intercept)”];CHANGEFREQ<-coefs[“CHANGE_FREQ”];result<-as.data.frame(cbind(INTERCEPT,CHANGEFREQ))‘’’;/*Clear the output table*/TRUNCATE TABLE r_coef_tab;/*Call the R function*/CALL LR (SUCC_PREC_tab,r_coef_tab );/*Once the results are returns by the R server select the results from the output table */SELECT * FROM r_coef_tab;
22 / 33
© 2016 SAP SE or an SAP affiliate company. All rights reserved.
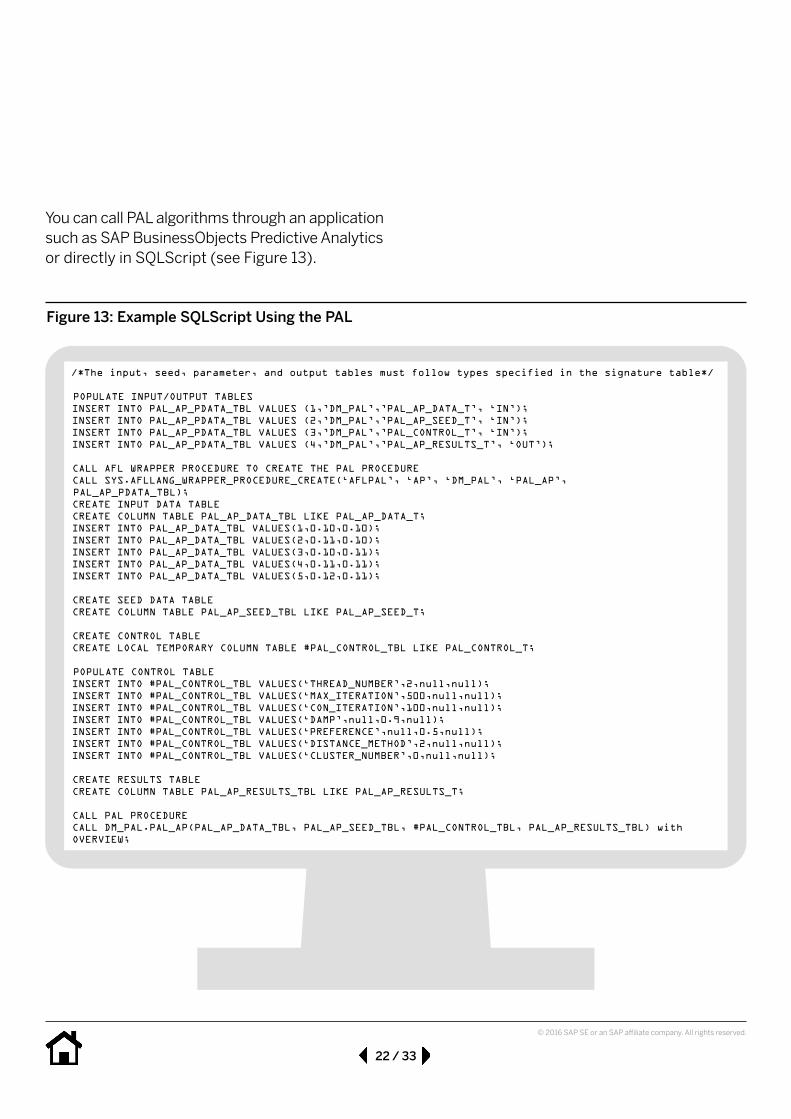
You can call PAL algorithms through an application such as SAP BusinessObjects Predictive Analytics or directly in SQLScript (see Figure 13).
Figure 13: Example SQLScript Using the PAL
/*The input, seed, parameter, and output tables must follow types specified in the signature table*/
POPULATE INPUT/OUTPUT TABLESINSERT INTO PAL_AP_PDATA_TBL VALUES (1,’DM_PAL’,’PAL_AP_DATA_T’, ‘IN’);INSERT INTO PAL_AP_PDATA_TBL VALUES (2,’DM_PAL’,’PAL_AP_SEED_T’, ‘IN’);INSERT INTO PAL_AP_PDATA_TBL VALUES (3,’DM_PAL’,’PAL_CONTROL_T’, ‘IN’);INSERT INTO PAL_AP_PDATA_TBL VALUES (4,’DM_PAL’,’PAL_AP_RESULTS_T’, ‘OUT’);
CALL AFL WRAPPER PROCEDURE TO CREATE THE PAL PROCEDURECALL SYS.AFLLANG_WRAPPER_PROCEDURE_CREATE(‘AFLPAL’, ‘AP’, ‘DM_PAL’, ‘PAL_AP’,PAL_AP_PDATA_TBL); CREATE INPUT DATA TABLECREATE COLUMN TABLE PAL_AP_DATA_TBL LIKE PAL_AP_DATA_T; INSERT INTO PAL_AP_DATA_TBL VALUES(1,0.10,0.10); INSERT INTO PAL_AP_DATA_TBL VALUES(2,0.11,0.10); INSERT INTO PAL_AP_DATA_TBL VALUES(3,0.10,0.11); INSERT INTO PAL_AP_DATA_TBL VALUES(4,0.11,0.11); INSERT INTO PAL_AP_DATA_TBL VALUES(5,0.12,0.11);
CREATE SEED DATA TABLECREATE COLUMN TABLE PAL_AP_SEED_TBL LIKE PAL_AP_SEED_T;
CREATE CONTROL TABLECREATE LOCAL TEMPORARY COLUMN TABLE #PAL_CONTROL_TBL LIKE PAL_CONTROL_T;
POPULATE CONTROL TABLEINSERT INTO #PAL_CONTROL_TBL VALUES(‘THREAD_NUMBER’,2,null,null); INSERT INTO #PAL_CONTROL_TBL VALUES(‘MAX_ITERATION’,500,null,null);INSERT INTO #PAL_CONTROL_TBL VALUES(‘CON_ITERATION’,100,null,null); INSERT INTO #PAL_CONTROL_TBL VALUES(‘DAMP’,null,0.9,null); INSERT INTO #PAL_CONTROL_TBL VALUES(‘PREFERENCE’,null,0.5,null);INSERT INTO #PAL_CONTROL_TBL VALUES(‘DISTANCE_METHOD’,2,null,null);INSERT INTO #PAL_CONTROL_TBL VALUES(‘CLUSTER_NUMBER’,0,null,null);
CREATE RESULTS TABLECREATE COLUMN TABLE PAL_AP_RESULTS_TBL LIKE PAL_AP_RESULTS_T;
CALL PAL PROCEDURECALL DM_PAL.PAL_AP(PAL_AP_DATA_TBL, PAL_AP_SEED_TBL, #PAL_CONTROL_TBL, PAL_AP_RESULTS_TBL) with OVERVIEW;
23 / 33
© 2016 SAP SE or an SAP affiliate company. All rights reserved.
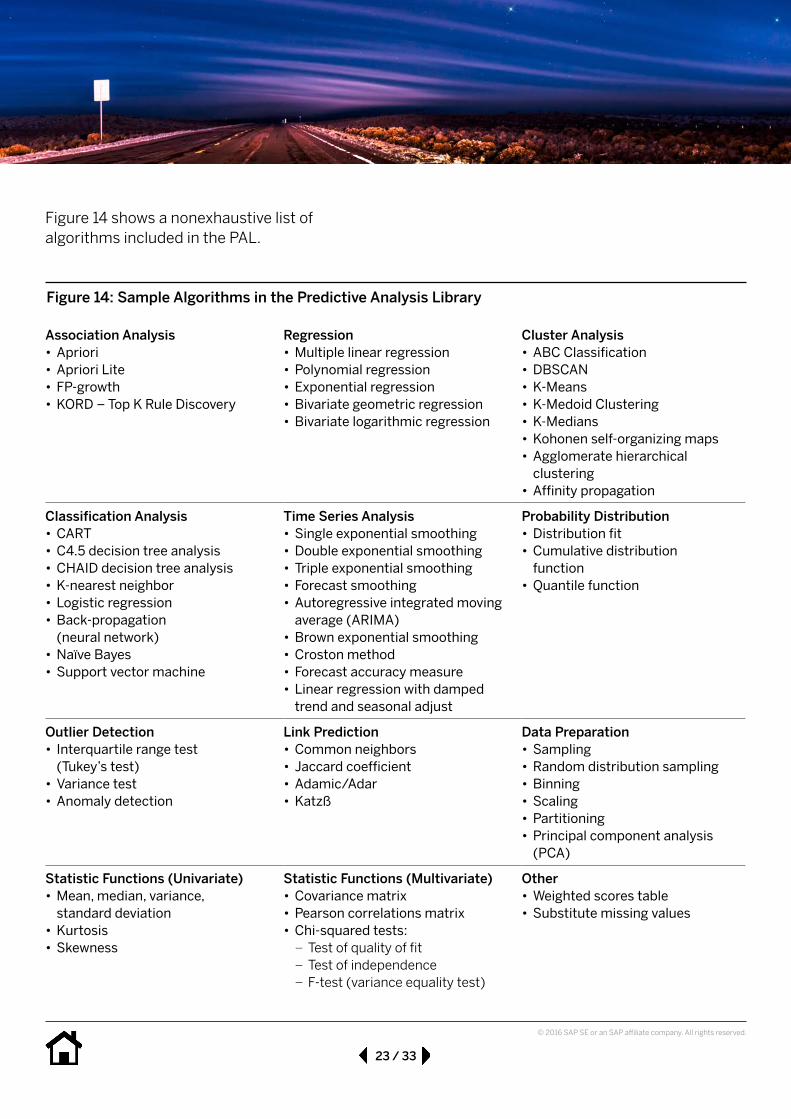
Figure 14: Sample Algorithms in the Predictive Analysis Library
Association Analysis• Apriori• Apriori Lite• FP-growth • KORD – Top K Rule Discovery
Regression• Multiple linear regression• Polynomial regression• Exponential regression• Bivariate geometric regression• Bivariate logarithmic regression
Cluster Analysis• ABC Classification• DBSCAN• K-Means• K-Medoid Clustering • K-Medians • Kohonen self-organizing maps• Agglomerate hierarchical
clustering• Affinity propagation
Classification Analysis• CART • C4.5 decision tree analysis• CHAID decision tree analysis• K-nearest neighbor• Logistic regression• Back-propagation
(neural network) • Naïve Bayes• Support vector machine
Time Series Analysis• Single exponential smoothing• Double exponential smoothing• Triple exponential smoothing• Forecast smoothing• Autoregressive integrated moving
average (ARIMA) • Brown exponential smoothing • Croston method • Forecast accuracy measure• Linear regression with damped
trend and seasonal adjust
Probability Distribution• Distribution fit • Cumulative distribution
function • Quantile function
Outlier Detection• Interquartile range test
(Tukey’s test)• Variance test• Anomaly detection
Link Prediction• Common neighbors• Jaccard coefficient• Adamic/Adar• Katzß
Data Preparation• Sampling• Random distribution sampling • Binning• Scaling• Partitioning• Principal component analysis
(PCA)
Statistic Functions (Univariate)• Mean, median, variance,
standard deviation• Kurtosis• Skewness
Statistic Functions (Multivariate)• Covariance matrix• Pearson correlations matrix• Chi-squared tests:
– Test of quality of fit – Test of independence – F-test (variance equality test)
Other• Weighted scores table• Substitute missing values
Figure 14 shows a nonexhaustive list of algorithms included in the PAL.

24 / 33
© 2016 SAP SE or an SAP affiliate company. All rights reserved.
SAP BusinessObjects Predictive Analytics provides a graphical expert mode to use PAL algorithms and supports the intermixing of PAL and R algo-rithms within the same workflow. It is therefore SAP’s recommended predictive analytics tool for data scientists using SAP HANA.
Note that data scientists are still free to use an external R server for algorithms or functions not included in the PAL. This enables any combina-tion of algorithms to help ensure that users are benefiting from the speed of SAP HANA as much as possible without giving up the flexibility and extensibility of algorithms in R.
SAP BusinessObjects Predictive Analytics is the recommended front end for all predictive technologies from SAP – including APL, PAL, and R.
“Automated” Predictive Capabilities: Using APL
25 / 33
© 2016 SAP SE or an SAP affiliate company. All rights reserved.
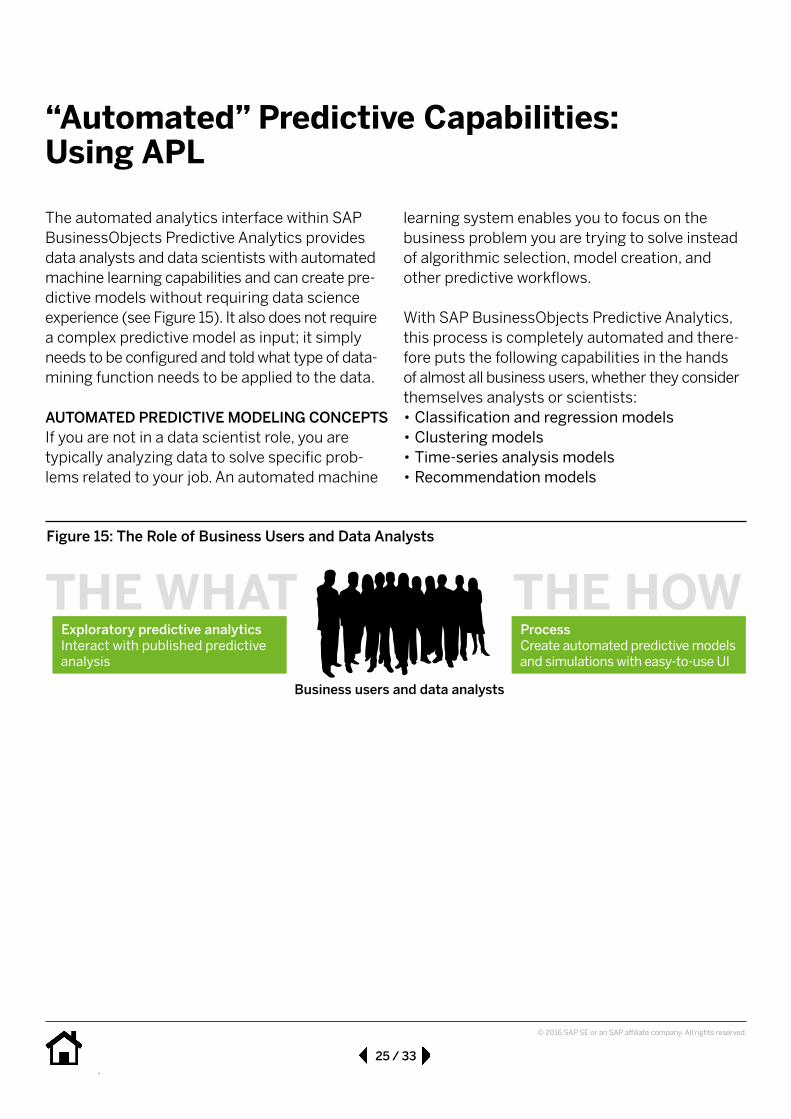
learning system enables you to focus on the business problem you are trying to solve instead of algorithmic selection, model creation, and other predictive workflows.
With SAP BusinessObjects Predictive Analytics, this process is completely automated and there-fore puts the following capabilities in the hands of almost all business users, whether they consider themselves analysts or scientists: • Classification and regression models • Clustering models • Time-series analysis models • Recommendation models
The automated analytics interface within SAP BusinessObjects Predictive Analytics provides data analysts and data scientists with automated machine learning capabilities and can create pre-dictive models without requiring data science experience (see Figure 15). It also does not require a complex predictive model as input; it simply needs to be configured and told what type of data-mining function needs to be applied to the data.
AUTOMATED PREDICTIVE MODELING CONCEPTSIf you are not in a data scientist role, you are typically analyzing data to solve specific prob-lems related to your job. An automated machine
Figure 15: The Role of Business Users and Data Analysts
THE WHATExploratory predictive analyticsInteract with published predictive analysis
Business users and data analysts
THE HOWProcessCreate automated predictive models and simulations with easy-to-use UI
26 / 33
© 2016 SAP SE or an SAP affiliate company. All rights reserved.
Automated Predictive Analysis for Data Scientists Data scientists may naturally be skeptical of a fully automated predictive process. Manual mod-eling using a traditional predictive analysis tool can provide a skilled data scientist with more flexi-bility and configurability. However, these manual methods also require a significant investment in time to profile the data, create analytical models, and validate the efficiency of these models. These are all things that SAP BusinessObjects Predictive Analytics can do within a few minutes.
For most predictive scenarios, automated predic-tive analytics typically has comparable accuracy to hand-coded models but requires a fraction of the time. Data scientists can use automated pre-dictive analytics to better understand their data, identify key influencers, and perform an analysis quickly. They can then decide if this level of anal-ysis is acceptable or can continue with a manual analysis in the predictive tool of their choice – but now with a benchmarked, automated predic-tive model to compare with.
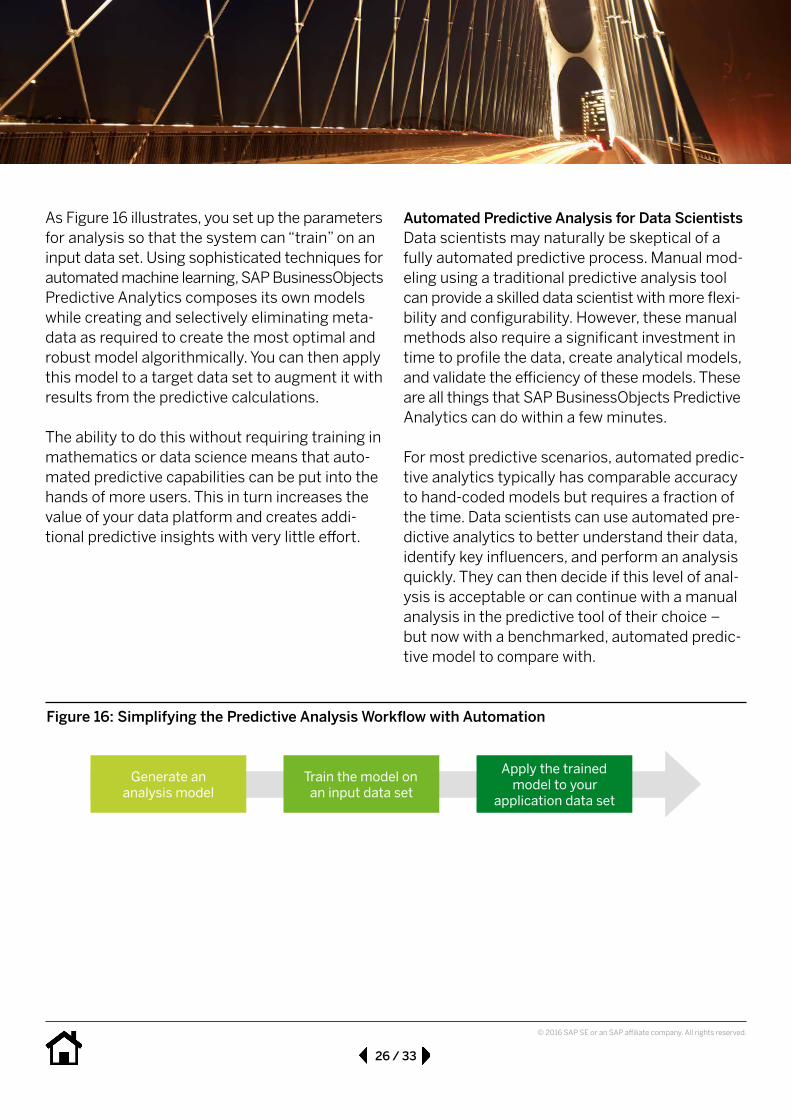
As Figure 16 illustrates, you set up the parameters for analysis so that the system can “train” on an input data set. Using sophisticated techniques for automated machine learning, SAP BusinessObjects Predictive Analytics composes its own models while creating and selectively eliminating meta-data as required to create the most optimal and robust model algorithmically. You can then apply this model to a target data set to augment it with results from the predictive calculations.
The ability to do this without requiring training in mathematics or data science means that auto-mated predictive capabilities can be put into the hands of more users. This in turn increases the value of your data platform and creates addi-tional predictive insights with very little effort.
Figure 16: Simplifying the Predictive Analysis Workflow with Automation
Generate an analysis model
Train the model on an input data set
Apply the trained model to your
application data set
27 / 33
© 2016 SAP SE or an SAP affiliate company. All rights reserved.
SAP BusinessObjects Predictive Analytics also has a server component that lets users publish their models and automate them to run without requiring the desktop tool. In this case, process-ing is done in the predictive server and therefore incurs the same data-transfer consequences as in the R server use case. However, this approach is database agnostic and does not rely on any calculation capabilities of the database itself.
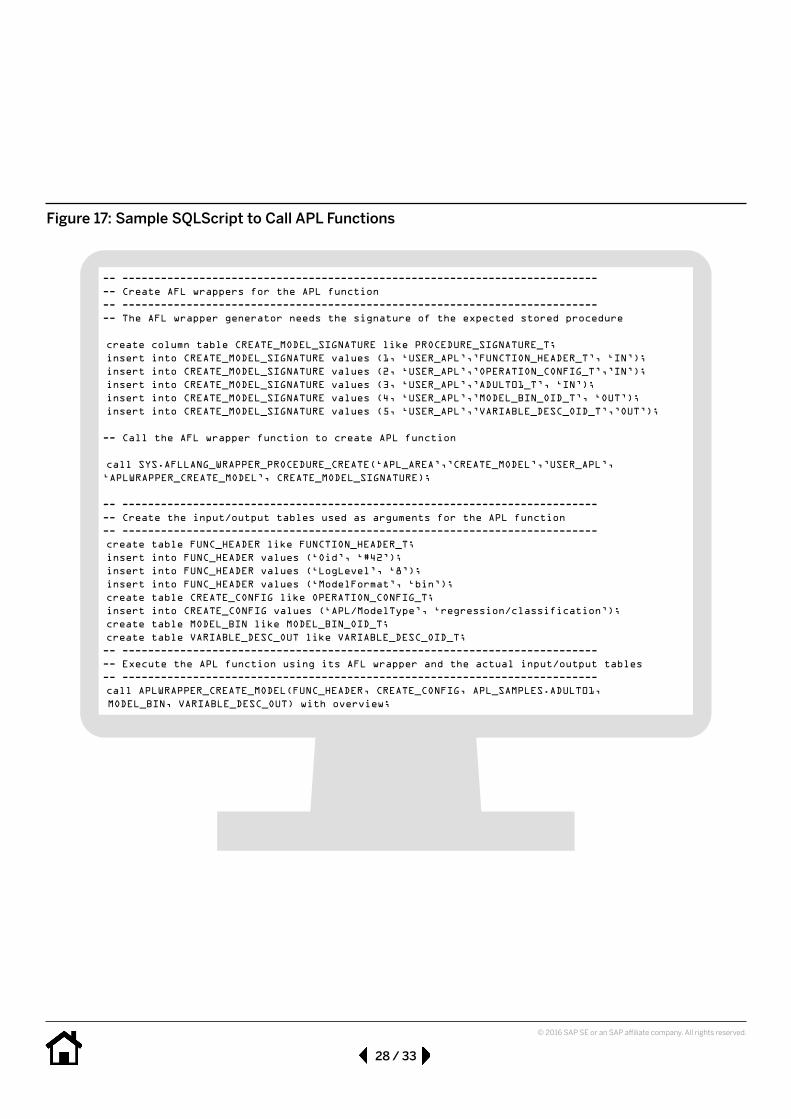
THE AUTOMATED PREDICTIVE LIBRARY: APLSince 2015 the APL has made these automated machine learning capabilities native to SAP HANA. Implemented as an SAP HANA–native C++ library sitting on top of the AFL, the APL features all the “automated” benefits described above but performs all calculations in-memory. This means that no data extraction is required. As part of a native library in SAP HANA, APL functions can also be called directly through SQLScript (see Figure 17).
Operationalizing Automated Predictive ModelsYou can export models generated from the auto-mated analytics interface of SAP BusinessObjects Predictive Analytics as coded scoring equations in vendor-specific SQL, JavaScript, C++, Java, and numerous other formats. When an SQL-formatted scoring equation is embedded within a database, any application accessing that database can get on-the-fly in-database predictive scoring without the users being aware that a predictive calculation was done. Accessing applications can include SAP BusinessObjects BI solutions, SAP BusinessObjects Lumira, or practically any application accessing the database.
This level of automation and operationalization is a boon for developers as well, because they can directly embed the autogenerated predictive code in their applications without any significant investment in data science skills.
SAP BusinessObjects Predictive Analytics speeds the creation of more accurate models by automating many of the steps typically performed by a data scientist.
28 / 33
© 2016 SAP SE or an SAP affiliate company. All rights reserved.
Figure 17: Sample SQLScript to Call APL Functions
-- ---------------------------------------------------------------------------- Create AFL wrappers for the APL function-- ---------------------------------------------------------------------------- The AFL wrapper generator needs the signature of the expected stored procedure
create column table CREATE_MODEL_SIGNATURE like PROCEDURE_SIGNATURE_T;insert into CREATE_MODEL_SIGNATURE values (1, ‘USER_APL’,’FUNCTION_HEADER_T’, ‘IN’);insert into CREATE_MODEL_SIGNATURE values (2, ‘USER_APL’,’OPERATION_CONFIG_T’,’IN’);insert into CREATE_MODEL_SIGNATURE values (3, ‘USER_APL’,’ADULT01_T’, ‘IN’);insert into CREATE_MODEL_SIGNATURE values (4, ‘USER_APL’,’MODEL_BIN_OID_T’, ‘OUT’);insert into CREATE_MODEL_SIGNATURE values (5, ‘USER_APL’,’VARIABLE_DESC_OID_T’,’OUT’);
-- Call the AFL wrapper function to create APL function
call SYS.AFLLANG_WRAPPER_PROCEDURE_CREATE(‘APL_AREA’,’CREATE_MODEL’,’USER_APL’,‘APLWRAPPER_CREATE_MODEL’, CREATE_MODEL_SIGNATURE);
-- ---------------------------------------------------------------------------- Create the input/output tables used as arguments for the APL function-- --------------------------------------------------------------------------create table FUNC_HEADER like FUNCTION_HEADER_T;insert into FUNC_HEADER values (‘Oid’, ‘#42’);insert into FUNC_HEADER values (‘LogLevel’, ‘8’);insert into FUNC_HEADER values (‘ModelFormat’, ‘bin’);create table CREATE_CONFIG like OPERATION_CONFIG_T;insert into CREATE_CONFIG values (‘APL/ModelType’, ‘regression/classification’);create table MODEL_BIN like MODEL_BIN_OID_T;create table VARIABLE_DESC_OUT like VARIABLE_DESC_OID_T;-- ---------------------------------------------------------------------------- Execute the APL function using its AFL wrapper and the actual input/output tables-- --------------------------------------------------------------------------call APLWRAPPER_CREATE_MODEL(FUNC_HEADER, CREATE_CONFIG, APL_SAMPLES.ADULT01,MODEL_BIN, VARIABLE_DESC_OUT) with overview;
29 / 33
© 2016 SAP SE or an SAP affiliate company. All rights reserved.
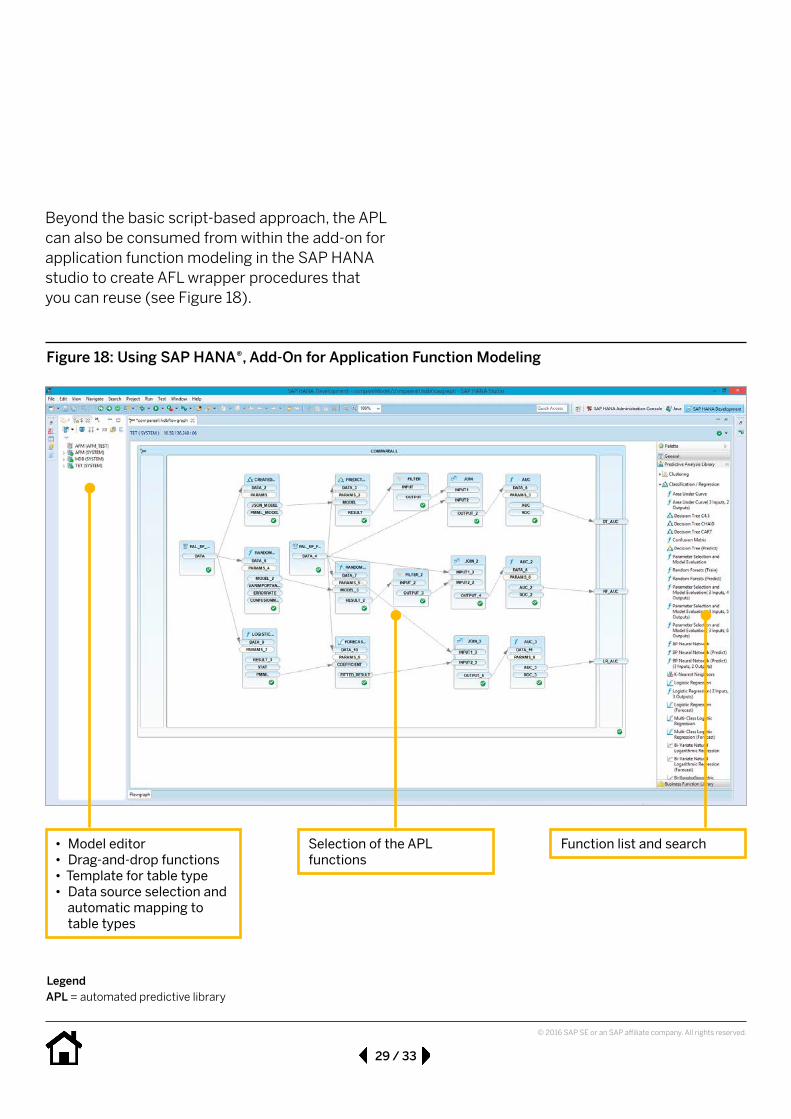
Beyond the basic script-based approach, the APL can also be consumed from within the add-on for application function modeling in the SAP HANA studio to create AFL wrapper procedures that you can reuse (see Figure 18).
Figure 18: Using SAP HANA®, Add-On for Application Function Modeling
• Model editor• Drag-and-drop functions• Template for table type• Data source selection and
automatic mapping to table types
Selection of the APL functions
Function list and search
LegendAPL = automated predictive library
30 / 33
© 2016 SAP SE or an SAP affiliate company. All rights reserved.
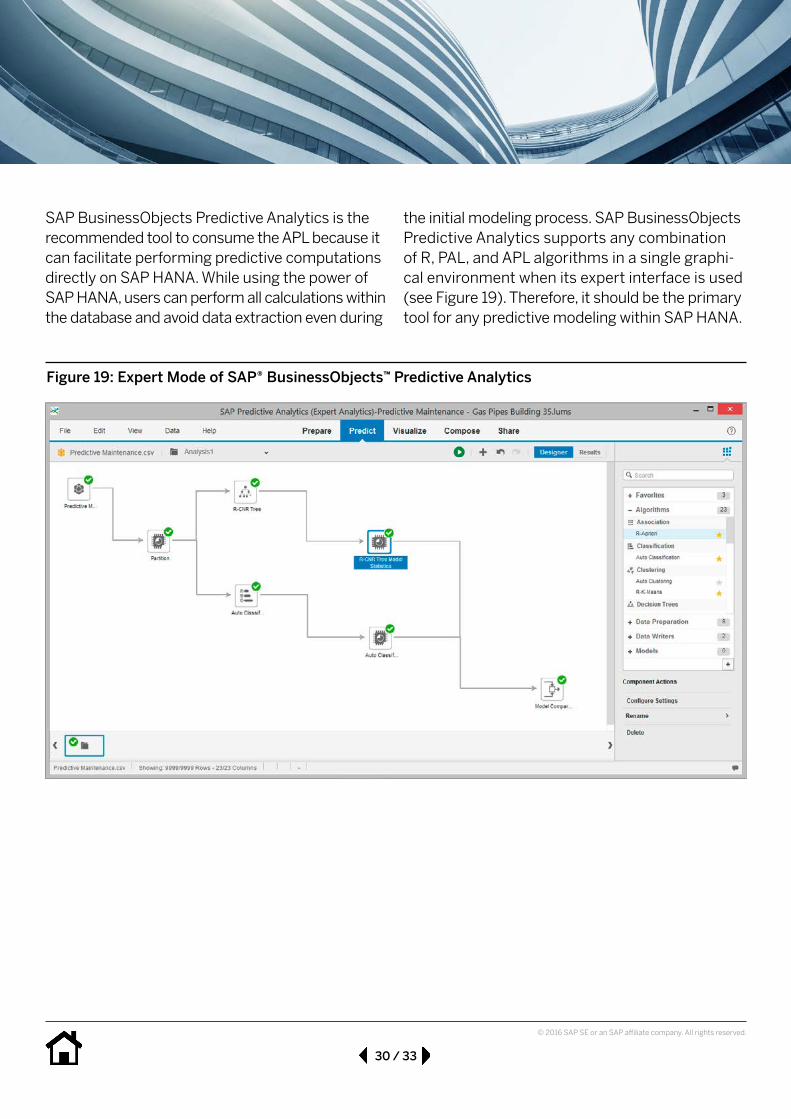
the initial modeling process. SAP BusinessObjects Predictive Analytics supports any combination of R, PAL, and APL algorithms in a single graphi-cal environment when its expert interface is used (see Figure 19). Therefore, it should be the primary tool for any predictive modeling within SAP HANA.
SAP BusinessObjects Predictive Analytics is the recommended tool to consume the APL because it can facilitate performing predictive computations directly on SAP HANA. While using the power of SAP HANA, users can perform all calculations within the database and avoid data extraction even during
Figure 19: Expert Mode of SAP® BusinessObjects™ Predictive Analytics
Comparing R, PAL, and APL Capabilities
31 / 33
© 2016 SAP SE or an SAP affiliate company. All rights reserved.
the results. Even seasoned data scientists work-ing on less-sophisticated analyses need to invest time to go through the full predictive analytics workflow on each problem when using algorith-mic techniques.
Automated analytics automates many of the predictive-modeling steps that a data scientist typically performs for common workflows like classification, regression, and association analy-sis, saving the user time and effort. The auto-mated machine learning engine still performs the full predictive analytics workflow but requires very little input from the user. The result is a signifi-cantly faster analysis that has fewer configuration parameters.
In general, both data scientists and business analysts should start their analysis by using the automated predictive capabilities of SAP HANA whenever possible. Automated machine learning can address a growing number of scenarios and typically can produce valid results in seconds or minutes. This enables those who are not data scientists to answer their own questions and quickly iterate on the results in a self-service manner while giving data scientists an auto-mated way of analyzing many problems quickly.
In some cases where a data scientist may want to create a more complex model or be in com-plete control of each algorithmic parameter, it is appropriate still to start with APL. That way, the data scientist can understand the data and create hypotheses before transitioning to an algorithmic method such as SAP HANA–native PAL or offboard R scripts.
Because SAP HANA supports multiple execution engines, users can choose the best predictive library for the task – and even combine usage of multiple libraries at once. It is important to realize that R, PAL, and APL are complementary technol-ogies to provide a choice in how to plan out proj-ects. The following sections discuss the decision criteria for choosing which library or combination of libraries would be most appropriate for a spe-cific use case.
Note: SAP recommends deploying APL and PAL in all SAP HANA platform deployments that require predictive functionality. Customers who need additional functionality beyond what PAL provides can also deploy an R server in a sidecar configuration.
ALGORITHMIC VERSUS AUTOMATED PREDICTIVE: R AND PAL VERSUS APLThe choice between algorithmic (R and PAL) and automated (APL) predictive capabilities largely is dependent on the target users and their needs. The APL provides flexibility to automate the pre-dictive analytics workflow without users needing knowledge of how to build complex data models from scratch. PAL or R typically requires a user to create procedures manually for each stage of the predictive modeling workflow.
Data scientists naturally tend to prefer algorith-mic techniques that offer a high degree of control and precision in the modeling process. This flexi-bility comes at a cost: both R and PAL require users to be properly trained in data science tech-niques, as they must understand what each algo-rithm does, how it works, and how to interpret
32 / 33
© 2016 SAP SE or an SAP affiliate company. All rights reserved.
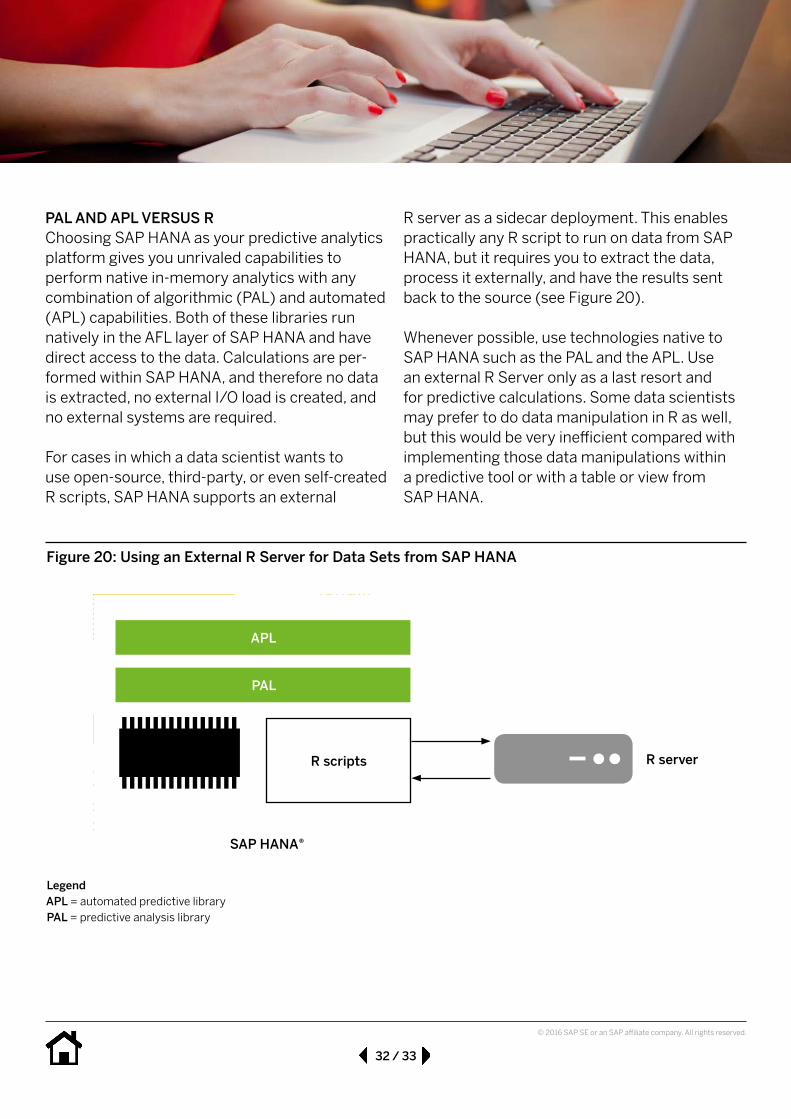
R server as a sidecar deployment. This enables practically any R script to run on data from SAP HANA, but it requires you to extract the data, process it externally, and have the results sent back to the source (see Figure 20).
Whenever possible, use technologies native to SAP HANA such as the PAL and the APL. Use an external R Server only as a last resort and for predictive calculations. Some data scientists may prefer to do data manipulation in R as well, but this would be very inefficient compared with implementing those data manipulations within a predictive tool or with a table or view from SAP HANA.
PAL AND APL VERSUS RChoosing SAP HANA as your predictive analytics platform gives you unrivaled capabilities to perform native in-memory analytics with any combination of algorithmic (PAL) and automated (APL) capabilities. Both of these libraries run natively in the AFL layer of SAP HANA and have direct access to the data. Calculations are per-formed within SAP HANA, and therefore no data is extracted, no external I/O load is created, and no external systems are required.
For cases in which a data scientist wants to use open-source, third-party, or even self-created R scripts, SAP HANA supports an external
Figure 20: Using an External R Server for Data Sets from SAP HANA
R server
PAL
APL
R scripts
LegendAPL = automated predictive libraryPAL = predictive analysis library
SAP HANA®
Why SAP BusinessObjects Predictive Analytics with SAP HANA
33 / 33
from SAP. It also ends the need to learn compli-cated SQLScript coding or use developer-level tools to analyze data in SAP HANA. In most scenarios, a user does not require a mathematical or data science background to start creating predictive models right away.
If you have predictive needs, start evaluating SAP BusinessObjects Predictive Analytics with SAP HANA. Take advantage of a solution that has a unique automated predictive library and model management capabilities.
Please contact your account executive for more information on how to evaluate SAP BusinessObjects Predictive Analytics, which is available for a 30-day trial at www.sap.com/trypredictive.
SAP BusinessObjects Predictive Analytics brings a new level of predictive analytics capabilities to your organization. A wide spectrum of users from business analysts to data scientists can quickly build automated predictive models to achieve on-the-fly scoring, perform real-time predictive anal-ysis, and embed models within BI workflows or any other business application. A single platform enables everyone to benefit from an automated predictive solution that encompasses the full pre-dictive lifecycle, from model creation to validation and deployment, without sacrificing speed, power, or scalability.
With SAP BusinessObjects Predictive Analytics on the desktop, you gain a graphical desktop envi-ronment that supports all predictive technologies
Review the blogs and tutorials on SAP® Community to get familiar with SAP BusinessObjects™ Predictive Analytics with SAP HANA®. In addition, visit http://help.sap.com/pa for the reference guide for the automated predictive library. For more information, visit www.sap.com/scn-predictive.
Studio SAP | 40850enUS (16/06) © 2016 SAP SE or an SAP affiliate company. All rights reserved.
© 2016 SAP SE or an SAP affiliate company. All rights reserved.
No part of this publication may be reproduced or transmitted in any form or for any purpose without the express permission of SAP SE or an SAP affiliate company.
SAP and other SAP products and services mentioned herein as well as their respective logos are trademarks or registered trademarks of SAP SE (or an SAP affiliate company) in Germany and other countries. Please see http://www.sap.com/corporate-en/legal/copyright/index.epx#trademark for additional trademark information and notices. Some software products marketed by SAP SE and its distributors contain proprietary software components of other software vendors.
National product specifications may vary.
These materials are provided by SAP SE or an SAP affiliate company for informational purposes only, without representation or warranty of any kind, and SAP SE or its affiliated companies shall not be liable for errors or omissions with respect to the materials. The only warranties for SAP SE or SAP affiliate company products and services are those that are set forth in the express warranty statements accompanying such products and services, if any. Nothing herein should be construed as constituting an additional warranty.
In particular, SAP SE or its affiliated companies have no obligation to pursue any course of business outlined in this document or any related presentation, or to develop or release any functionality mentioned therein. This document, or any related presentation, and SAP SE’s or its affiliated companies’ strategy and possible future developments, products, and/or platform directions and functionality are all subject to change and may be changed by SAP SE or its affiliated companies at any time for any reason without notice. The information in this document is not a commitment, promise, or legal obligation to deliver any material, code, or functionality. All forward-looking statements are subject to various risks and uncertainties that could cause actual results to differ materially from expectations. Readers are cautioned not to place undue reliance on these forward-looking statements, which speak only as of their dates, and they should not be relied upon in making purchasing decisions.