unlimited historical data guide
TRANSCRIPT
Product Guide/ Historical Data © Brandwatch.com | 1 © Brandwatch.com
Product Guide/
Historical Data
Product Guide/ Historical Data © Brandwatch.com | 2
Contents1.0 Introduction ......................................................................................................................3
1.1 The Value of Historical Data ...........................................................................................3
1.2 A New Landscape ...........................................................................................................4
2.0 Historical Data In Action ................................................................................................5
2.1 Five Ws of Research .......................................................................................................5
2.2 Consumer Insight ...........................................................................................................5
2.3 Campaign Measurement .............................................................................................10
2.4 Competitor Intelligence ...............................................................................................12
2.5 Product Development ...................................................................................................14
3.0 The Future for Historical Research Using Social Data ........................................ 16
3.1 How Brandwatch Can Help ..........................................................................................16
3.2 Listen, Analyze and Act with Confidence .....................................................................16
About Brandwatch ..............................................................................................................17
Product Guide/ Historical Data © Brandwatch.com | 3
1.0 Introduction
1.1 The Value of Historical DataHistorical context plays a fundamental role in shaping every aspect of the web.
Every tweet, post, article and comment is influenced by the context in which it is written and the wider issues that frame it. An opinion is always affected by seasonality, global events, the cultural climate and even the virality of a meme. Without fully understanding the historical context of a post online, social analysts will struggle to draw reliable meaning from their data.
In the absence of historical context, a number of assumptions must be made. These assumptions ultimately lead to biases that skew results and impair all insight.
Your company may receive a surge in positive mentions straight after the release of a new advert during the summer. Using real-time data, you may assume this increase was in direct response to the advert. Moreover, you may conclude that the advert is successful as it caused your largest spike in mentions.
However, with years worth of historical data, you could uncover a very different conclusion. You may discover that a surge in mentions always appears during the summer and the advert actually made no significant impact.
You could look back and see that past adverts generated far more mentions than your recent release, which in comparison, performed poorly.
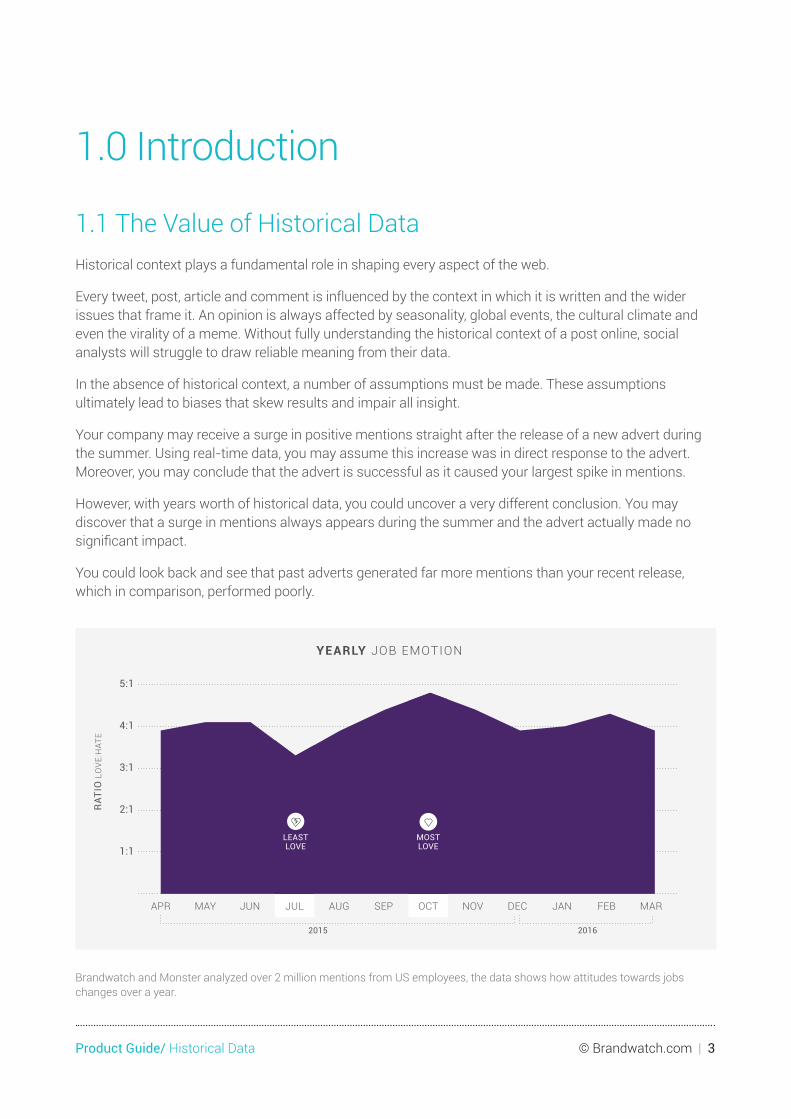
YEARLY JOB EMOTION
1:1
2:1
3:1
4:1
5:1
JUL AUG SEP OCT NOV DECJUNMAYAPR MARFEBJAN
2015 2016
RAT
IO L
OV
E:H
ATE
MOSTLOVE
LEASTLOVE
Brandwatch and Monster analyzed over 2 million mentions from US employees, the data shows how attitudes towards jobs changes over a year.
Product Guide/ Historical Data © Brandwatch.com | 4
Although this error feels elementary, it is not uncommon. The majority of brands still don’t use social data for research and those that do often don’t work with historical data.
In fact, Altimeter research shows that while marketing is represented in 70% of social business strategy meetings, market research is present just 15% of the time. That should not be the case. Data-driven insights should be foundational to business decisions1.
1.2 A New LandscapeIn the very early years of social media monitoring, historical analysis was impossible. Success depended on boosting the number of followers and likes for a single month. Organizations could only compare themselves to their competitors.
To-date, Brandwatch has collected six years of archived data, which can be quickly searched and analyzed. In addition, we've upgraded our historical features, letting users gather an unlimited number of historical insights at unprecedented speed.
The functionality is available, but why should you start using it for all of your analysis?
1 Altimeter. The 2015 State of Social Business: Priorities Shift from Scaling to Integrating. 2015.
Product Guide/ Historical Data © Brandwatch.com | 5
2.0 Historical Data In ActionAs social listening platforms cultivate growing archives of historical data, the applications of social data have become varied.
Use-cases which involve discovering consumer insights, measuring previous campaigns, benchmarking against competitors and fueling product development, can all be enhanced with the input of historical data. But before you embark on a detailed analysis of past conversations, you should first consider the research basics.
A starting point for all historical research should be the “five Ws”. This process helps focus your research and ensures you produce actionable results.
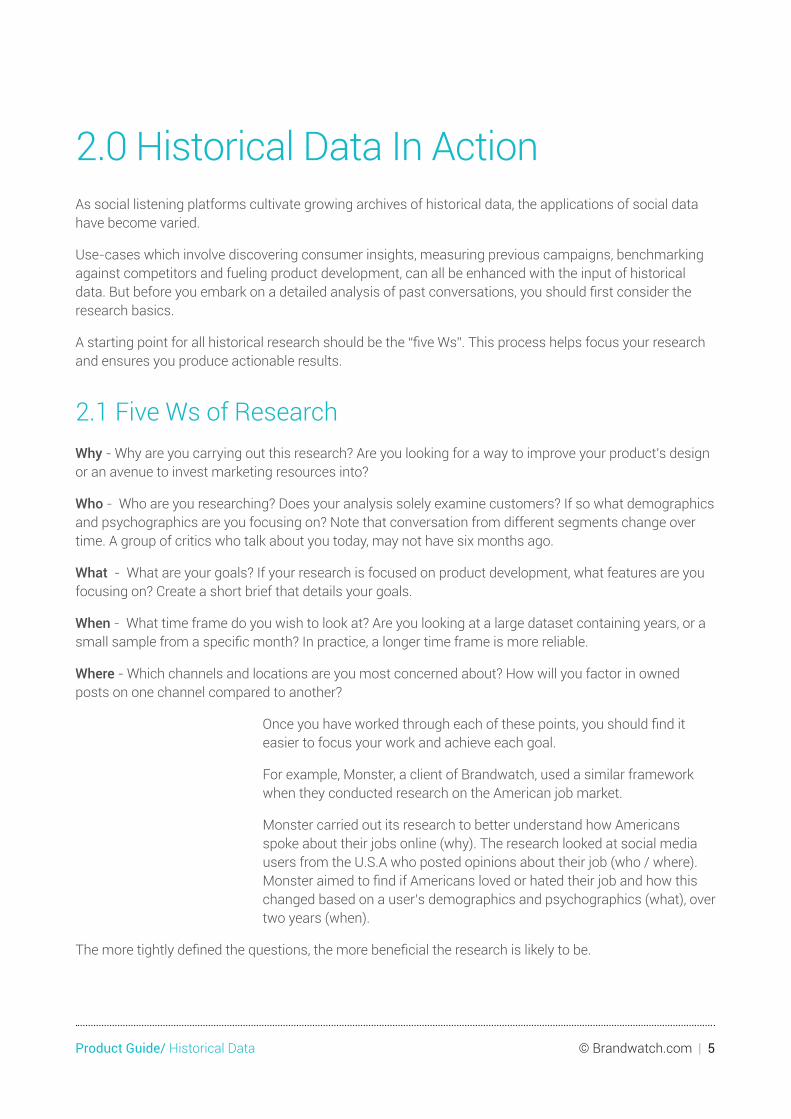
2.1 Five Ws of ResearchWhy - Why are you carrying out this research? Are you looking for a way to improve your product’s design or an avenue to invest marketing resources into?
Who - Who are you researching? Does your analysis solely examine customers? If so what demographics and psychographics are you focusing on? Note that conversation from different segments change over time. A group of critics who talk about you today, may not have six months ago.
What - What are your goals? If your research is focused on product development, what features are you focusing on? Create a short brief that details your goals.
When - What time frame do you wish to look at? Are you looking at a large dataset containing years, or a small sample from a specific month? In practice, a longer time frame is more reliable.
Where - Which channels and locations are you most concerned about? How will you factor in owned posts on one channel compared to another?
Once you have worked through each of these points, you should find it easier to focus your work and achieve each goal.
For example, Monster, a client of Brandwatch, used a similar framework when they conducted research on the American job market.
Monster carried out its research to better understand how Americans spoke about their jobs online (why). The research looked at social media users from the U.S.A who posted opinions about their job (who / where). Monster aimed to find if Americans loved or hated their job and how this changed based on a user’s demographics and psychographics (what), over two years (when).
The more tightly defined the questions, the more beneficial the research is likely to be.
Product Guide/ Historical Data © Brandwatch.com | 6
2.2 Consumer Insight
Case Study: Predicting Purchases
A full history of consumers’ online mentions will help any brand uncover actionable insights and ultimately make smarter business decisions.
One of our clients, a large beauty retailer in America, used historical data to look at how it distributed stock. The company had a niche issue. Its diverse product range contained high-value goods and the organization couldn’t always be sure it was distributing the right stock to the right stores.
In closed-locations, like American airports, the beauty retailer knew how important it was to fill the store with goods that would entice the footfall. However, the customer range at different airports was so varied, the retailer couldn’t pin down which products would work best.
Traditional means of matching sales with new stock did not work. Sales data showed demand varied greatly and no consistent themes prevailed. The beauty retailer turned to historical social data to find an answer.
The research team used search terms to collect geo-tagged social conversation from within each airport. Using Brandwatch classification options, the brand segmented this data and tracked the purchase intent for beauty products at each location.
#BrandwatchTips: The geo-tagged component in Brandwatch can reveal where a tweet was published right down to street-level.
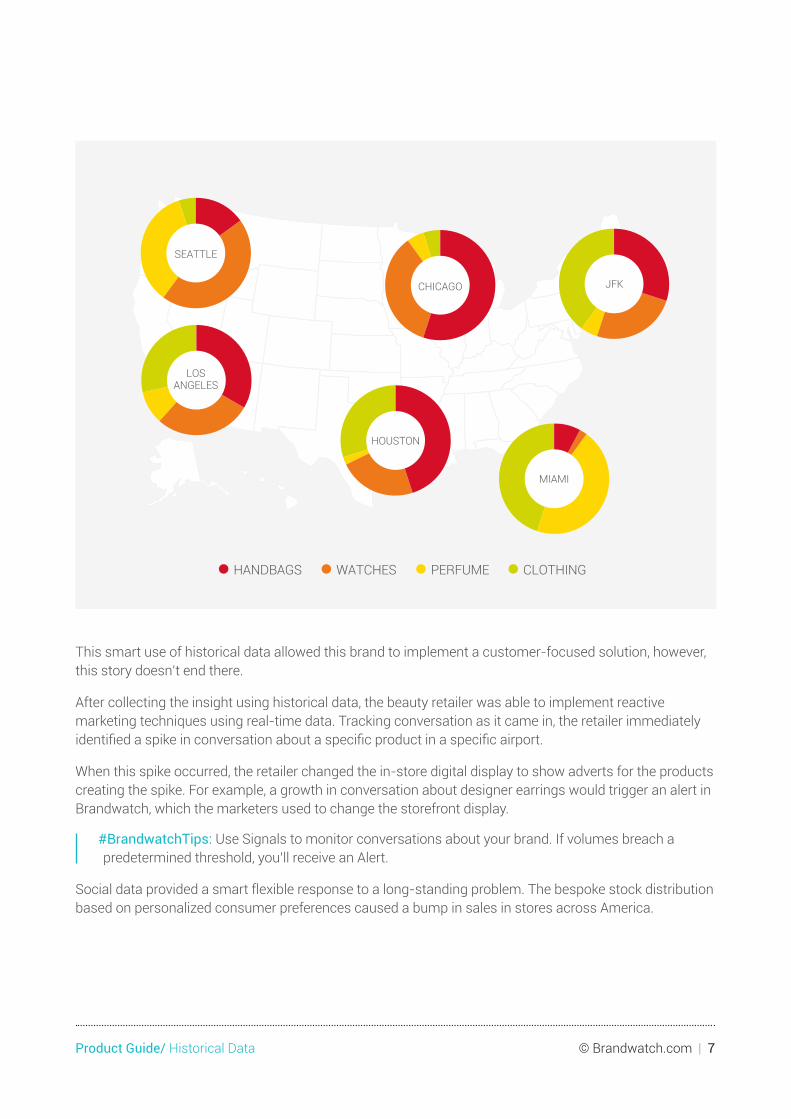
Backlogging this data over three years immediately revealed trends for each location. Some locations showed consistent conversation over time expressing a desire to purchase high-end handbags, while other airports provoked discussion about designer wristwatches.
Product Guide/ Historical Data © Brandwatch.com | 7
• HANDBAGS • WATCHES • PERFUME • CLOTHING
SEATTLE
HOUSTON
CHICAGO JFK
MIAMI
LOSANGELES
This smart use of historical data allowed this brand to implement a customer-focused solution, however, this story doesn’t end there.
After collecting the insight using historical data, the beauty retailer was able to implement reactive marketing techniques using real-time data. Tracking conversation as it came in, the retailer immediately identified a spike in conversation about a specific product in a specific airport.
When this spike occurred, the retailer changed the in-store digital display to show adverts for the products creating the spike. For example, a growth in conversation about designer earrings would trigger an alert in Brandwatch, which the marketers used to change the storefront display.
#BrandwatchTips: Use Signals to monitor conversations about your brand. If volumes breach a predetermined threshold, you’ll receive an Alert.
Social data provided a smart flexible response to a long-standing problem. The bespoke stock distribution based on personalized consumer preferences caused a bump in sales in stores across America.
Product Guide/ Historical Data © Brandwatch.com | 8
The Significance of Seasonality
All online conversation is affected by seasonality. To pull reliable consumer insights, you need to understand how seasonality will affect your data.
Although large seasonal events, like holidays, can produce predictable results at a large scale, determining the effect of seasonality isn’t always clean-cut. Your brand might buck the trend, or your product might deviate from expectations.
In the ice cream industry, sales tend to rise in summer and drop in winter. It is a seasonal industry and the majority of products follow this correlation.
It would be easy to assume that this is the same for all types of ice cream, and that your brand fits within the trend. But this assumption doesn’t stay true for everyone.
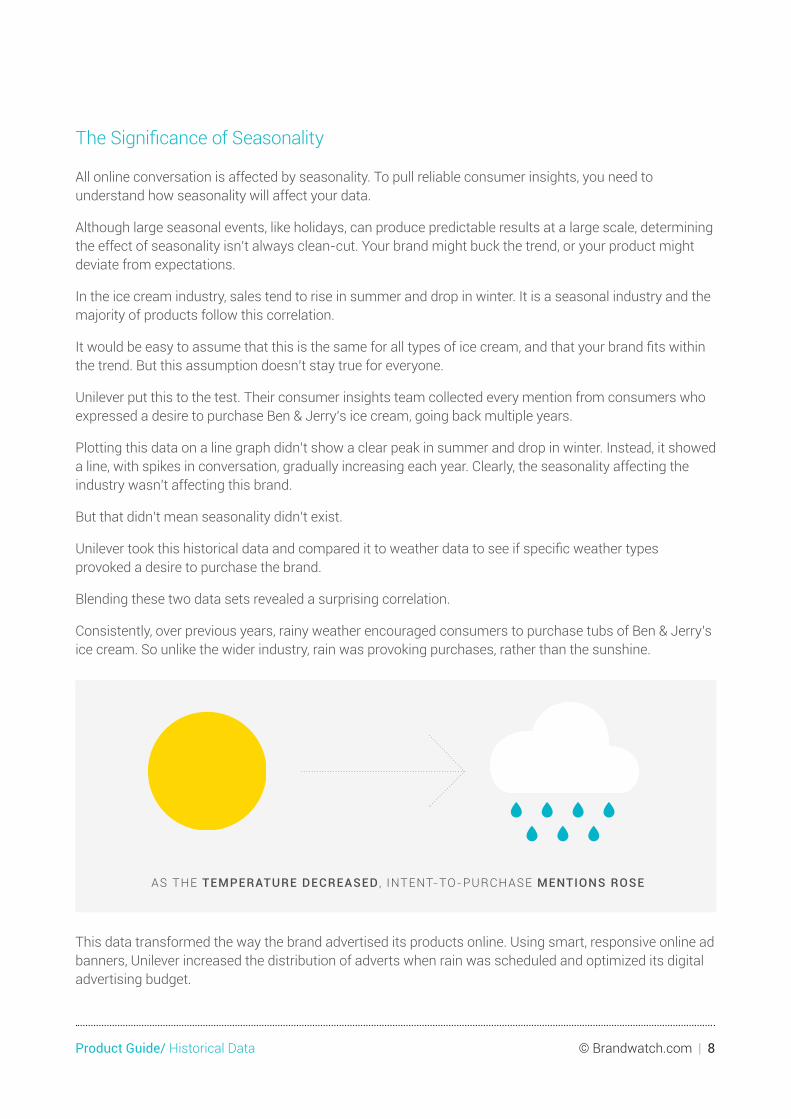
Unilever put this to the test. Their consumer insights team collected every mention from consumers who expressed a desire to purchase Ben & Jerry’s ice cream, going back multiple years.
Plotting this data on a line graph didn’t show a clear peak in summer and drop in winter. Instead, it showed a line, with spikes in conversation, gradually increasing each year. Clearly, the seasonality affecting the industry wasn’t affecting this brand.
But that didn’t mean seasonality didn’t exist.
Unilever took this historical data and compared it to weather data to see if specific weather types provoked a desire to purchase the brand.
Blending these two data sets revealed a surprising correlation.
Consistently, over previous years, rainy weather encouraged consumers to purchase tubs of Ben & Jerry’s ice cream. So unlike the wider industry, rain was provoking purchases, rather than the sunshine.
AS THE TEMPERATURE DECREASED , INTENT-TO-PURCHASE MENTIONS ROSE
This data transformed the way the brand advertised its products online. Using smart, responsive online ad banners, Unilever increased the distribution of adverts when rain was scheduled and optimized its digital advertising budget.
Product Guide/ Historical Data © Brandwatch.com | 9
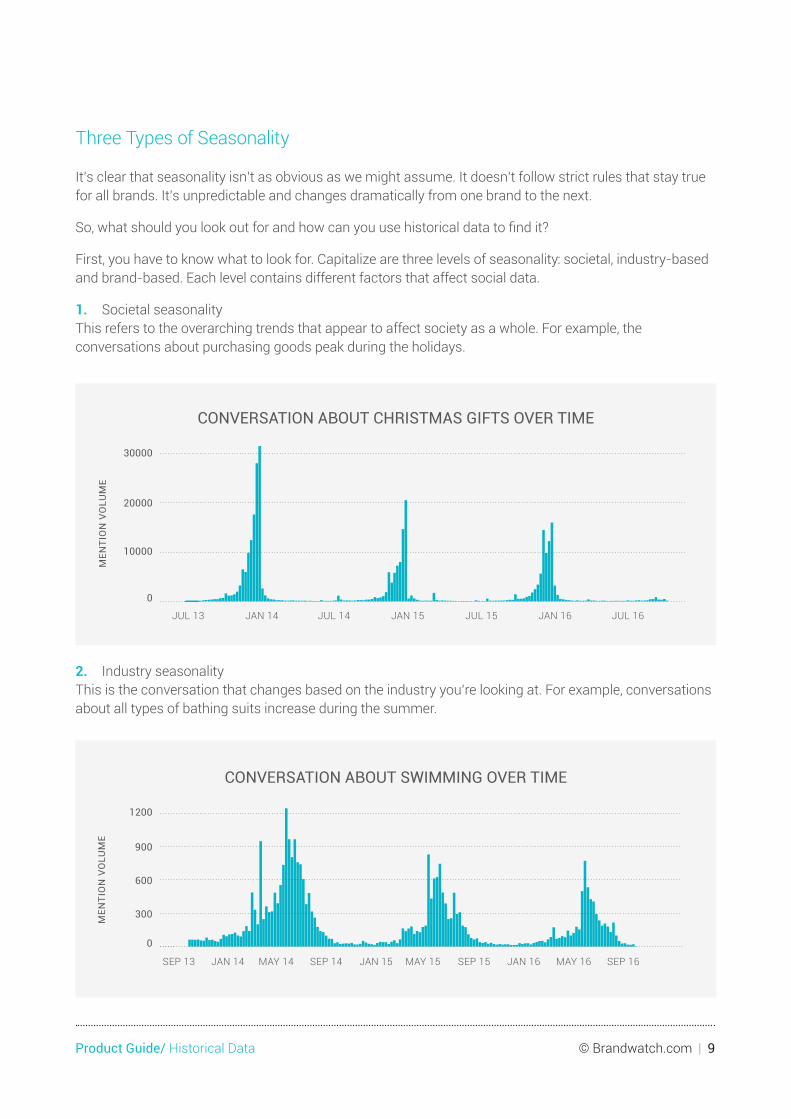
Three Types of Seasonality
It’s clear that seasonality isn’t as obvious as we might assume. It doesn’t follow strict rules that stay true for all brands. It’s unpredictable and changes dramatically from one brand to the next.
So, what should you look out for and how can you use historical data to find it?
First, you have to know what to look for. Capitalize are three levels of seasonality: societal, industry-based and brand-based. Each level contains different factors that affect social data.
1. Societal seasonality This refers to the overarching trends that appear to affect society as a whole. For example, the conversations about purchasing goods peak during the holidays.
0
10000
20000
30000
JAN 14 JUL 14 JAN 15 JUL 15 JUL 16JAN 16
MEN
TIO
N V
OLU
ME
JUL 13
CONVERSATION ABOUT CHRISTMAS GIFTS OVER TIME
2. Industry seasonalityThis is the conversation that changes based on the industry you’re looking at. For example, conversations about all types of bathing suits increase during the summer.
MEN
TIO
N V
OLU
ME
0
300
600
900
1200
SEP 13 JAN 14 MAY 14 SEP 14 JAN 15 MAY 15 SEP 15 JAN 16 MAY 16 SEP 16
CONVERSATION ABOUT SWIMMING OVER TIME
Product Guide/ Historical Data © Brandwatch.com | 10
3. Brand seasonalityEven brands experience seasonality. Here changes occur for companies that don’t affect the industry they’re part of. For example, Ben & Jerry’s generate intent to purchase conversation about its ice cream during the winter season as rain becomes more frequent.
Having an awareness of each type of seasonality lets you seek out predictable changes that recur in your data. Doing so will allow you to factor in fluctuations in data and collect reliable results from your social listening platform.
#BrandwatchTips: Chart mentions over time to look for seasonality factors like vacations, business cycles or national holidays.
Collect historical data for your wider industry, direct competitors, individual brand and owned products, and map it over a number of years. Analyze trends and look for peaks and troughs that affect every segment, showing societal or industry seasonality. Then search for recurring spikes in mentions for only your brand or products – these could indicate brand seasonality.
Document each of these and compare them to live data. That way you can see if fluctuations in conversation today are following clear seasonal trends, or if they are unique. Doing so will help reduce the margin of error in your analysis.
Social Platform Context
In addition to seasonality changes, brands on social media are also affected by slight changes to the networks themselves.
While your brand may grow in response to your marketing efforts, the platform you use to broadcast your message may grow as well.
Researchers should factor this in when assessing the growth of a brand. If conversation about your industry on Twitter is growing by 2% month on month, all conversation about the brand should grow by the same amount.
With historical data, you can compare the growth trend of your brand with the platform you're using.
2.3 Campaign Measurement
Case Study: Measuring Valuable Hype
With historical data, campaign measurement becomes more reliable and valuable. You can quickly compare a campaign to all your previous work to determine its success.
Product Guide/ Historical Data © Brandwatch.com | 11
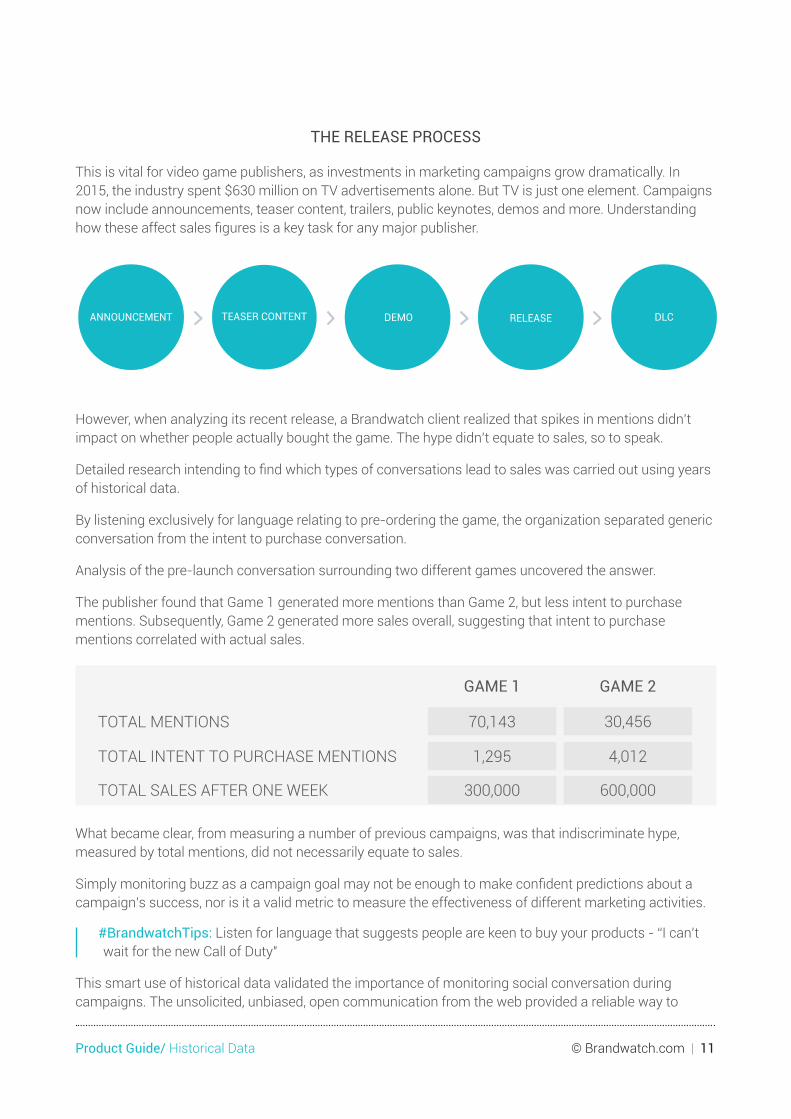
THE RELEASE PROCESS
This is vital for video game publishers, as investments in marketing campaigns grow dramatically. In 2015, the industry spent $630 million on TV advertisements alone. But TV is just one element. Campaigns now include announcements, teaser content, trailers, public keynotes, demos and more. Understanding how these affect sales figures is a key task for any major publisher.
ANNOUNCEMENT TEASER CONTENT DEMO DLCRELEASE
However, when analyzing its recent release, a Brandwatch client realized that spikes in mentions didn’t impact on whether people actually bought the game. The hype didn’t equate to sales, so to speak.
Detailed research intending to find which types of conversations lead to sales was carried out using years of historical data.
By listening exclusively for language relating to pre-ordering the game, the organization separated generic conversation from the intent to purchase conversation.
Analysis of the pre-launch conversation surrounding two different games uncovered the answer.
The publisher found that Game 1 generated more mentions than Game 2, but less intent to purchase mentions. Subsequently, Game 2 generated more sales overall, suggesting that intent to purchase mentions correlated with actual sales.
TOTAL MENTIONS
TOTAL INTENT TO PURCHASE MENTIONS
TOTAL SALES AFTER ONE WEEK
70,143
GAME 1
1,295
300,000
GAME 2
30,456
4,012
600,000
What became clear, from measuring a number of previous campaigns, was that indiscriminate hype, measured by total mentions, did not necessarily equate to sales.
Simply monitoring buzz as a campaign goal may not be enough to make confident predictions about a campaign’s success, nor is it a valid metric to measure the effectiveness of different marketing activities.
#BrandwatchTips: Listen for language that suggests people are keen to buy your products - “I can’t wait for the new Call of Duty"
This smart use of historical data validated the importance of monitoring social conversation during campaigns. The unsolicited, unbiased, open communication from the web provided a reliable way to
Product Guide/ Historical Data © Brandwatch.com | 12
measure demand.
2.4 Competitor Intelligence
Case Study: Exploring New Markets
In the last 15 years, 52% of the Fortune 500 have disappeared from the list.
Simply put, competition is harsher than ever. Having a clear awareness of your competitor’s actions and how customers react is paramount.
Almost every brand is interested in learning how competitors have performed and how its performance rates in comparison. Figures mean nothing in a vacuum, so benchmarking can be crucial to getting a true understanding of success.
With historical data, you can capitalize on the same insights you’ve found for your brand by applying them to your direct competition.
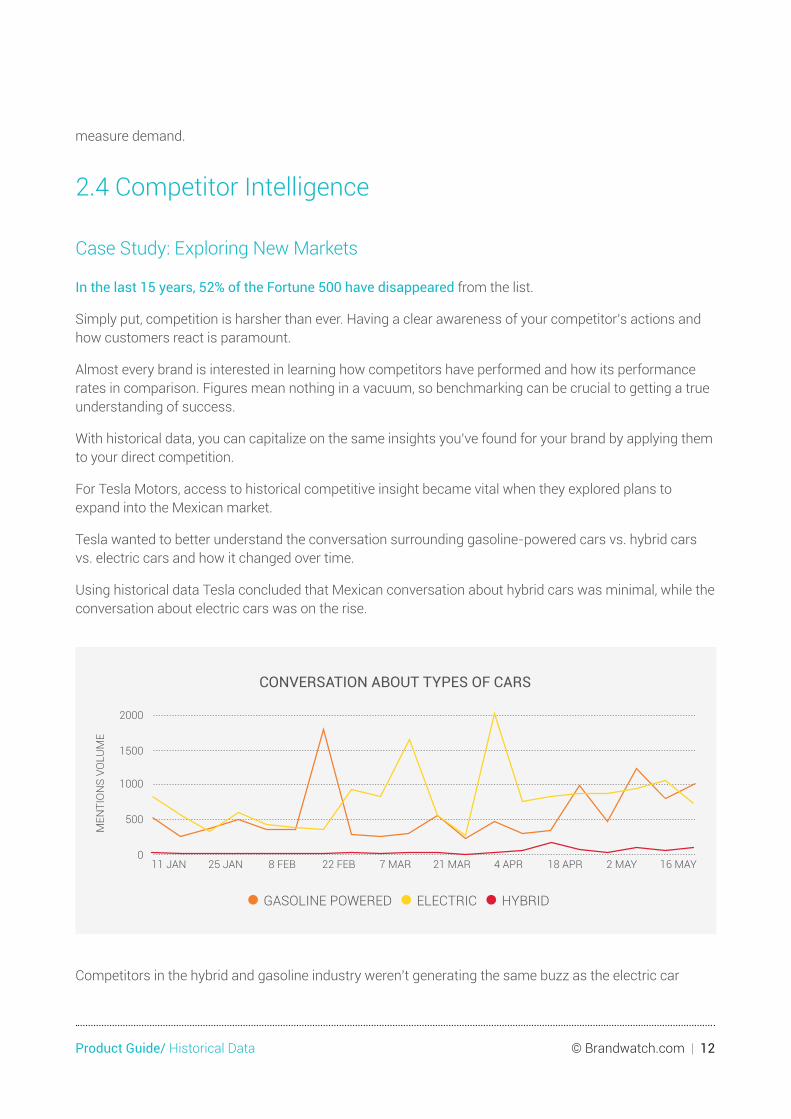
For Tesla Motors, access to historical competitive insight became vital when they explored plans to expand into the Mexican market.
Tesla wanted to better understand the conversation surrounding gasoline-powered cars vs. hybrid cars vs. electric cars and how it changed over time.
Using historical data Tesla concluded that Mexican conversation about hybrid cars was minimal, while the conversation about electric cars was on the rise.
1500
1000
2000
500
011 JAN 25 JAN 8 FEB 22 FEB 7 MAR 21 MAR 4 APR 18 APR 2 MAY 16 MAY
CONVERSATION ABOUT TYPES OF CARS
• GASOLINE POWERED • ELECTRIC • HYBRID
MEN
TIO
NS
VOLU
ME
Competitors in the hybrid and gasoline industry weren’t generating the same buzz as the electric car
Product Guide/ Historical Data © Brandwatch.com | 13
industry. This suggested that Tesla’s products might fit the market. But the automotive manufacturer didn’t stop there.
With access to historical data, Tesla was able to listen to the unfiltered opinion of thousands of prospective clients and competitors' clients over the past three years.
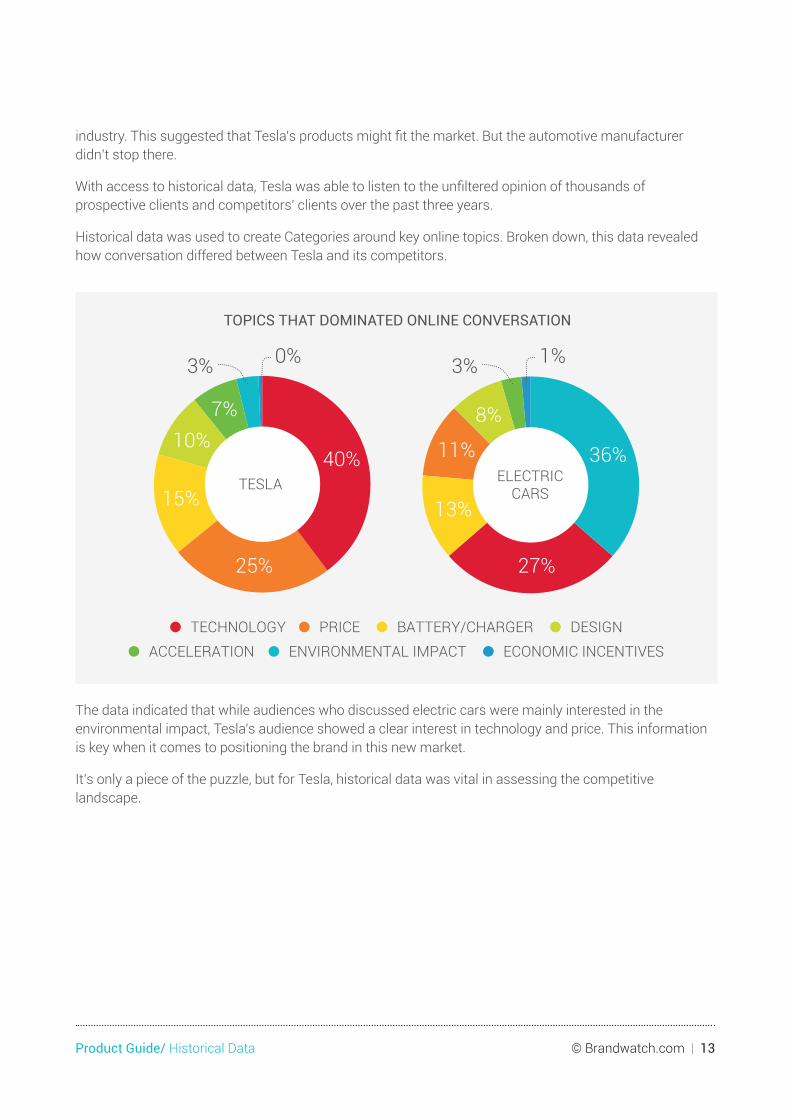
Historical data was used to create Categories around key online topics. Broken down, this data revealed how conversation differed between Tesla and its competitors.
• TECHNOLOGY • PRICE • BATTERY/CHARGER • DESIGN
• ACCELERATION • ENVIRONMENTAL IMPACT • ECONOMIC INCENTIVES
25%
15%
40% 36%
27%
13%
11%
8%10%
7%
3% 0% 3% 1%
TESLA ELECTRICCARS
TOPICS THAT DOMINATED ONLINE CONVERSATION
The data indicated that while audiences who discussed electric cars were mainly interested in the environmental impact, Tesla’s audience showed a clear interest in technology and price. This information is key when it comes to positioning the brand in this new market.
It’s only a piece of the puzzle, but for Tesla, historical data was vital in assessing the competitive landscape.
Product Guide/ Historical Data © Brandwatch.com | 14
2.5 Product Development
Case Study: Profitable Product Feedback
For many brands, fast product development is required to meet consumer needs and keep up with agile competitors.
However, identifying exactly what consumers want can be a slow and painstaking process.
Let’s say you work for a fitness technology company. You’re desperate to find the next big thing so you commission a market research agency. It promises to provide a wealth of consumer feedback for a sizeable sum. You agree.
In the following months, you define objectives, build a plan, refer it to an ethics committee, find a sample audience, collect data through focus groups, phone interviews, and online surveys, before sending it off to be analyzed.
The result? Customers want your product to be faster. Essentially, after six months you are left with obvious conclusions.
Of course, not all traditional research works this way. Most endeavors deliver tangible and valuable results. But it’s undeniably slow. At the speed your competitors move, waiting more than a month for an insight can be debilitating.
Fortunately, social data can offer instant insight on consumers at an unparalleled scale. It may not be the sole contributor for product development ideas, but it’s quickly becoming a vital part of the research armory.
One company has made a success of developing product purely on the back of social media feedback.
By scouring historical eBay and Amazon reviews, C&A Marketing developed products that answer the frustrations of consumers and include most requested features.
C&A collects reviews on thousands of products to discover what consumers want. One of the many products it creates is a waterproof radio. By monitoring social, they saw a significant amount of people wanted a rechargeable version. The team then built a rechargeable version and linked potential buyers to their updated version.
This strategy may seem simple, but it’s successful. The team collects nine-figure sales annually, growing at 30% year on year.
But historical data reveals far more than simply the volume of people discussing your product. Metadata attached to each mention shows sentiment, author demographics, key topics of conversation and much more.
This means you can pull granular insights about the specific components of your product. For example, Amazon’s Kindle range can be analyzed by looking at the net positivity of different features on each Kindle Model.
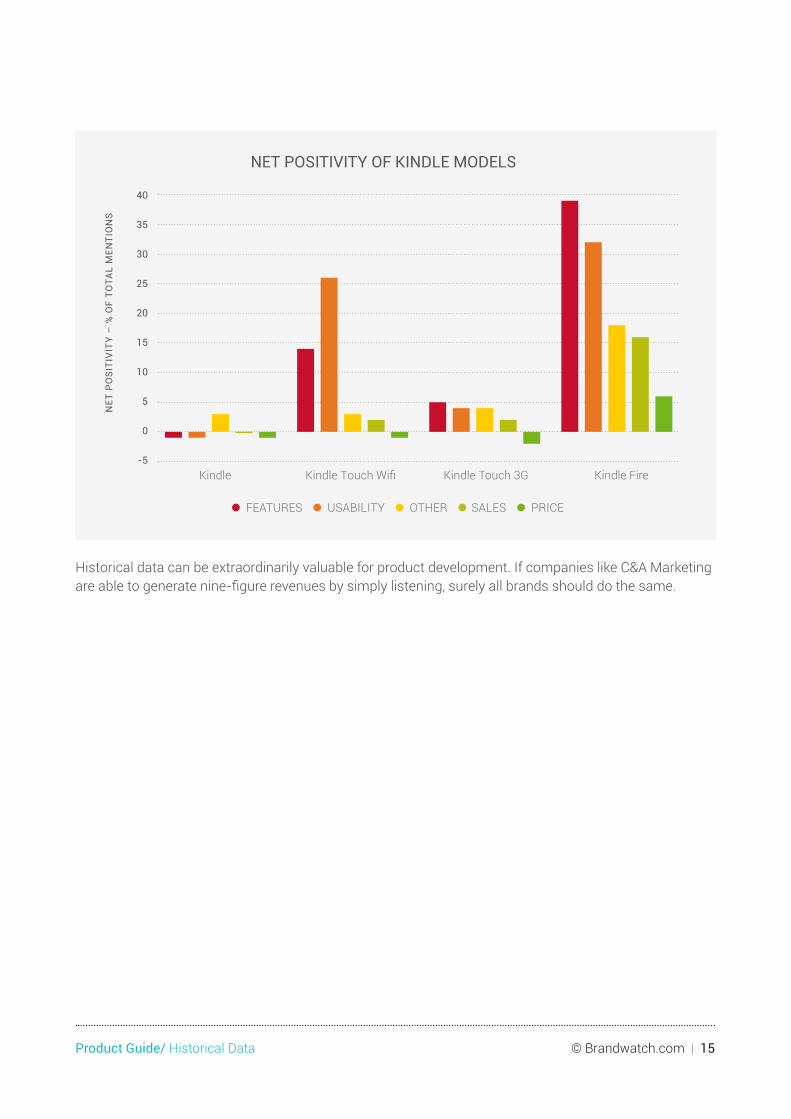
Product Guide/ Historical Data © Brandwatch.com | 15
Kindle Kindle Touch Wifi Kindle Touch 3G Kindle Fire
NET POSITIVITY OF KINDLE MODELS
NET
PO
SITI
VIT
Y –
% O
F TO
TAL
MEN
TIO
NS
40
35
30
25
20
15
10
5
0
-5
• FEATURES • USABILITY • OTHER • SALES • PRICE
Historical data can be extraordinarily valuable for product development. If companies like C&A Marketing are able to generate nine-figure revenues by simply listening, surely all brands should do the same.
Product Guide/ Historical Data © Brandwatch.com | 16
3.0 The Future for Historical Research Using Social DataAll of the use-cases described throughout this guide can be implemented today.
As leaders in social listening, Brandwatch has developed greater historical functionality over the years and possesses a rich backlog of historical data.
But as the functionality of listening platforms grow, access to historical data will continue to increase. Clients should demand instant access to years of historical data, today. In the future, they can expect machine-assisted analysis, to quickly interpret the data and pull insight.
3.1 How Brandwatch Can Help Brandwatch, the leader in social listening, now provides unlimited historical data, going back three years.
The offer uses historical Twitter data, plus the full Brandwatch archive, to find reliable and valuable insight. Unlike other vendors, Brandwatch collects and displays years of historical data in seconds, allowing you to quickly uncover insight and iterate your search.
You can find out more about Brandwatch’s unparalleled historical offering by requesting a demo here.
3.2 Listen, Analyze and Act with ConfidenceFind more value in the social data that’s important to your business with an advanced social media monitoring and analytics platform.
We hope that you’ve found this guide useful.
In this guide and the others in the Social Listening in Practice series, we used Brandwatch Analytics for the examples we gave you.
You can find out more and request a demo by visiting brandwatch.com/demo
Product Guide/ Historical Data © Brandwatch.com | 17
About BrandwatchBrandwatch is the world’s leading social intelligence company. Brandwatch Analytics and Vizia products fuel smarter decision making around the world.
The Brandwatch Analytics platform gathers millions of online conversations every day and provides users with the tools to analyze them, empowering the world’s most admired brands and agencies to make insightful, data-driven business decisions. Vizia distributes visually-engaging insights to the physical places where the action happens.
The Brandwatch platform is used by over 1,200 brands and agencies, including Unilever, Cisco, Whirlpool, British Airways, Heineken, Walmart and Dell. Brandwatch continues on its impressive business trajectory, recently named a global leader in enterprise social listening platforms by the latest reports from several independent research firms. Increasing its worldwide presence, the company has offices around the world including Brighton, New York, San Francisco, Berlin, Stuttgart, Paris and Singapore.
Brandwatch. Now You Know.
www.brandwatch.com | @Brandwatch | press office | contact
Contact/ Email [email protected] brandwatch.comTwitter @brandwatch
TelephoneUS +1 212 229 2240UK +44 (0)1273 234290DE +49 (0)30 5683 7004-0
© Brandwatch.com