unmet social care needs in england - lse home
TRANSCRIPT

December 2020
Care Policy and EvaluationCentre, LSE
Economics of Social and HealthCare Research Unit
Unmet social careneeds in EnglandA scoping study for evaluating supportmodels for older people with low andmoderate needs
CARE POLICY AND EVALUATION CENTRECPEC
Research at LSE
CPEC Working Paper 6
Jose-Luis Fernandez, Juliette Malley, Joanna Marczak, TomSnell, Raphael Wittenberg, Derek King and Gerald Wistow

DISCLAIMER
This report is based on independent research commissioned and funded by the National Institute for HealthResearch (NIHR) Policy Research Programme through its core support to the Economics of Health Systemsand Interface with Social Care Research Unit. The views expressed are those of the authors and are notnecessarily those of the NIHR or the Department of Health and Social Care.

INTRODUCTION
n There is little quantitative evidence whichenables us to interpret the nature ofrecent changes in social care levels ofprovision, and the extent to which theyindicate the success of local strategiesfor promoting independence amongstthe older population and thus reducingthe need for ongoing social care support,or whether they highlight “retrenchment”of state funded social care. There is evenless evidence about the consequencesof those changes on the quality of life ofpeople with social care needs and theircarers, and their wider impact on other
parts of the welfare system such as theNHS and the benefit system.
n The aim of this scoping study is toconsider how to design a possible “mainstudy” that would evaluate theconsequences on outcomes for olderpeople with social care needs, theircarers and the wider care system ofrecent changes in the support offered bycouncils, focusing on older people at theedges of current eligibility criteria(referred to in the report as older peoplewith low/moderate needs).
EVALUATION APPROACHES CONSIDERED
n The study has considered a number ofmethodological approaches fordesigning the main study, including theuse of existing publicly available datasources and the collection of primarydata.
n Our analysis has found that it would notbe possible to base the main study ondata from existing national surveys or onadministrative data records, because ofdata shortfalls such as insufficientlylarge samples of people with social careneeds in national surveys, lack ofcomparable data across localadministrative systems and lack ofevidence regarding care outcomes andthe use of universal services, which are
key in the new support models for peoplewith low/moderate needs.
n This scoping study has focussedtherefore on the methodology forconducting a survey of older people andtheir carers, collecting dataprospectively. We have explored thepotential for examining the impact ofrecent changes in social care support byexploiting the local variability in the typeand intensity of support provided.
n As a result, the objective of this reportbecame how to evaluate theconsequences on costs and outcomesof different models for supporting olderpeople with low/moderate needs inEngland.
SCOPING STUDY METHODS
n The scoping study has used a number ofdata sources and research methods,including a rapid review of the literature,
a review of local authority systems,statistical analyses and interviews withkey local stakeholders.
iii
EXECUTIVE SUMMARY

IDENTIFYING LOCAL SOCIAL CARE MODELS FOR SUPPORTING OLDER PEOPLE WITHLOW/MODERATE NEEDS
n A detailed understanding of the differentlocal care systems and approaches willbe essential to maximise the impact ofthe main study as it will inform thetransferability of its findings.
n Some information on care systems ispublicly available. For instance, mostauthorities have online assessmentforms and provide website informationabout their assessment process.However, online information describinglocal arrangements for processingrequests for social care support islimited. To gain a thoroughunderstanding of local care processeswe expect that a qualitative processevaluation will be necessary, includinginterviews with key stakeholders and adocument review.
n Local authorities used web-basedinterfaces to provide information andadvice and signpost individuals toservices in the community. To someextent, these strategies are intended tohelp manage social care demand. Themain study might want to explorevariations in the use of web-based toolsacross localities, how these interact with
the multi-stage assessment process,their likely impact on the volume andtypes of contacts made with the localauthority and on the targeting of careand support for people withlow/moderate needs.
n The main study will want to discuss withthe local authorities participating in theresearch ways to capture informationabout the full range of individualscontacting the council for social caresupport, including those that aresignposted to other services afterreading the online advice provided by thecouncil.
n A variety of models exist for assessingthe needs of individuals approachinglocal councils. It seems likely that thesemodels may themselves have an impacton the effectiveness and the targeting ofcare and support for people withlow/moderate needs. The main studywill want to collect information regardingthe local assessment processes used inorder to explore their impact on thetargeting of support and on outcomesfor service users and their carers.
SEQUELS FOLLOWING CONTACT WITH SERVICES FOR PEOPLE WITH LOW/MODERATENEEDS
n The core “service offer” to people withlow/moderate needs is relativelyconsistent across councils, and includesinformation and advice, signposting tovoluntary sector services and short-termtargeted interventions, includingreablement, equipment, telecare andadaptations. However, the coverage ofthese types of support varies acrossauthorities. Understanding the role ofthese services in supporting people withlow/moderate needs will be of centralimportance to the main study.
n There seems to be great variability in theavailability of innovative and voluntary
sector schemes across local authorities.The extent and effectiveness of suchschemes will be critical to the impact ofsignposting activities by localauthorities. It will be important, butchallenging, to map and record thesemore innovative and variable ‘services’ inthe main study.
n Low-level services are also important forpeople with low/moderate needs. Theyare likely to be offered in different waysby local authorities and this variation aswell as the use of these services shouldbe mapped and recorded in the mainstudy.
DATA COLLECTED BY LOCAL AUTHORITIES ABOUT PEOPLE CONTACTING THEM
n It will be important for the main study toascertain whether authorities involved inthe study collect data about those whocontact their website. This is importantbecause a potentially large proportion of
older people with low/moderate needsmight just receive advice from thecouncil by visiting the authority’swebsite.
iv

n Most authorities collect data aboutindividuals who make contact with thefirst contact team. However, this datamight not contain the informationnecessary for the triaging of cases intothe main study, and therefore additionalinformation collection by the council atthe point of first contact would need tobe agreed with the participating areas inthe study.
n Individual-level information regarding theutilisation of certain services is collectedby councils, and might complement anyprimary data collection by the mainstudy. The main study should thinkabout how to collect and use thisinformation in the quantitativeevaluation.
IDENTIFYING TYPOLOGIES OF SUPPORT MODELS
n It would be useful to identify a number oftypologies of support models tostructure the main evaluation. In theabsence of a theoretical framework forgrouping local authorities in England intocare models, a statistical approach couldbe used to identify typologies of broadcare models. These typologies couldinform the selection of authorities intothe main study.
n A number of indicators exist for allauthorities in England that describeaspects of the coverage and intensity ofsocial care support. These indicators canbe used to describe differences in localsocial care practice. It is important,however, that these indicators arestandardised to control for variations
simply linked to differences in social careneed and service prices.
n Statistical techniques such as latentclass analysis can then be applied toderive typologies of local authorities,which in turn can inform the sampling ofauthorities into the main study.
n Given the lack of indicators of social caresupport looking specifically at peoplewith low/moderate needs, the analysis ofLA typologies using the approachoutlined above should be complementedwith further evidence about local carepractice collected from localdocument/policies and directdiscussions with local authorityprofessionals.
SURVEY CONTENT
The scoping study has explored whichinformation about needs, services andoutcomes should be collected by the mainstudy evaluation.
Indicators of need
n Activities of Daily Living (ADLs) andInstrumental Activities of Daily Living(IADLs) are the most frequently usedmeasures of care need and are usefulmeasures for distinguishing the degreeand type of care needs. The main studyshould consider using IADLs and ADLsto capture low/moderate needs.
n Both literature review and interviewshighlight the limitations of focusingsolely on ADLs/IADLs to establish careneeds, particularly in areas such associal participation. The main study willwant to consider indicators coveringcare and support needs in this area.
n Indicators of living arrangements havebeen found to be useful for predicting
care needs. The main study will want tocollect indicators of living arrangements.
n Frailty is an important factor leading toADL disability. A number of risk factorshave been identified as having strongpredictive evidence of frailty. The mainstudy should explore collecting some ofthese indicators to standardise for frailtyrisk among older people.
n There is overlap between risk factors forfalls and frailty. Key need indicators ofrisk of falls include those related tophysical weakness, cognitive deficits,clinical conditions and previous historyof falls. This supports the value inincluding a measure of frailty in the mainstudy.
n The importance of environmentalhazards as risk factors for falls is notableand given the relationship between theenvironment and functional ability, itseems important for the main study toconsider measuring this aspect.
v

n The indicators used by local authoritiesto measure these care and supportneeds, however, are hugely variable.These data are therefore very unlikely tobe comparable across areas in the mainstudy.
n Local administrative records couldhowever be used to explore therepresentativeness of the achievedsample for the main study.
Service indicators
n Standardised sets of questions forcapturing the amount and nature ofsocial care provision for older people areavailable and included for instance insurveys such as ELSA and HSE. Thesequestion sets could form the basis of amodule for capturing data on servicesand unmet needs in the main study, butthey would need to be complemented toensure all services relevant to peoplewith low/moderate needs were captured.
n Specifically, it would be important for themain study to capture additionalservices such as (hours of) reablement,equipment, telecare (e.g. alarms) andsome minor adaptations provided.Batteries of questions exist to capturesome of the more common low-levelservices including (hours of andfrequency of use) of day centreprovision.
n The current questions available tocapture support from the voluntarysector are unlikely to be adequate. Wedid not find any standard questions formeasuring provision of information,advice and signposting services. Themain study will need to develop and testquestions to capture information, adviceand signposting inputs and the nature ofintensity of more innovative forms ofsupport from the voluntary sector.
Outcome indicators
n There is evidence to suggest that theASCOT measure will be sensitive tooutcomes among older people withlow/moderate needs and should beconsidered as the primary outcome forolder people in the main study. An
alternative primary outcome measure isthe ICECAP-O, but it has not yet beenused to evaluate services for olderpeople with low/moderate needs inEngland.
n Secondary outcome measures should beconsidered for older people in the mainstudy, including the EQ-5D andmeasures of psychological wellbeingsuch as the WEMWEBS or GHQ-12,which may be particularly importantwhere services have rehabilitative ormore health-oriented aims.
n The ASCOT-Carer and CES may beappropriate measures for estimating theimpact of care interventions for olderpeople with low/moderate needs on theircarers, but neither of these measureshave yet been used extensively inresearch. For the main study theresearch team may want to supplementthese measures with more widely usedmeasures of carer burden or broaderhealth-related quality of life andwellbeing measures (e.g. EQ-5D andWEMWEBS).
n Intermediate outcomes measures, forexample measures of the use ofhealthcare services, are likely to beimportant indicators for the main study.It would be important to explore thepotential for data linkage to health andsocial care administrative records viaNHS numbers. Indicators of re-contactswith the local authority should also beconsidered for the main study. Theresearch team should take steps toensure data linkage with local authorityrecords is possible.
n There is little evidence to supportdecisions about appropriate follow-upintervals. Studies commonly have usedfollow-ups at a year, but discussionswith local authorities seemed to suggestthat shortened periods may be moreappropriate for this group of olderpeople. For the main study, 6-month, 18-month and possibly 30-monthfollow-ups should be considered.However, the number of follow-ups willaffect very significantly the costs of themain study.
vi

SAMPLE SIZES
n The number of ‘care models’to becompared will need to be kept to aminimum for the study to have a realisticchance to achieve adequate power todetect outcome differences betweenmodels. The statistical analyses carriedout suggested three care models couldbe defined. Sample sizes reportedtherefore correspond to the samplesrequired to detect differences betweenthree groups. To compare more thanthree care models, larger samples will berequired.
n Due to the variability in care receiptbetween care users and the cost oflarger study samples, it is unlikely thatthe main study will be powered to detecteven a 10% difference in costs betweencare models at the 5% confidence level.
n It is unlikely that the main study will bepowered to detect a 5% difference in theASCOT-Carer measure at the 5%confidence level, as only a proportion of
older people – we estimate aroundthree-fifths to two-thirds – are likely tohave a carer. Larger differences in theASCOT-Carer measure are likely to bedetectable.
n The power calculations assume simplemethods of analysis, and regression-based methods would have greaterpower to detect differences. However,subgroup analyses would reducesignificantly the power of statisticalanalyses.
n The lack of clinically meaningfuldifferences in key social care outcomescomplicates the calculation of samplesizes. Detecting a 0.03 difference inASCOT scale at the 5% confidence level,assuming three care models wouldrequire approximately 2,200 interviews atfollow-up. Assuming a 75% follow-uprate, this implies 3,000 baselineinterviews.
REQUIRED NUMBER OF AUTHORITIES FOR THE MAIN STUDY
n The number of authorities required toparticipate in the main study will dependon the total number of interviews sought,the timescales for data collection, therate of cases approaching authorities forsupport with their social care needs, andthe success of the study in recruitingthose cases into the study.
n Achieving the large number of interviewsrequired to power the study is likely toneed that a significant number ofauthorities (approximately 20) areinvolved in the study, and that the
recruitment phase is extended over atleast 6 months.
n Authorities able to achieve 150interviews over 6 months are welldistributed across most localcharacteristics, including the three localclasses associated with different caremodels.
n The one exemption are Londonauthorities, which due to their small sizewould need to be oversampled in orderto contribute sufficient cases to thestudy.
PRACTICALITIES OF THE IMPLEMENTATION OF THE MAIN STUDY
Analytical approach
n The study should use a combination ofquantitative and qualitative analyticalmethods to ensure that estimates of thecosts and outcomes of the different caremodels can be obtained, gain an in-depth understanding of the factorsexplaining such differences, and drawlessons about how to structure supportservices for people with low/moderateneeds across all English authorities.
n Given the unlikely availability ofexperimental data, the study should use
statistical methods such as matchingtechniques and multivariate regressionmodels in order to control for potentialdifferences in the samples of olderpeople from the different care modelsevaluated.
n A process evaluation should be carriedout to examine the appropriateness ofthe statistically-led grouping ofauthorities into care models, the natureof the differences between localarrangements for supporting people withlow/moderate needs, and to support the
vii

specification of hypotheses for, and theinterpretation of results from, thequantitative analyses of costs andoutcomes.
Recruitment of study participants
n The proposed recruitment method relieson members of the First Contact Teamwithin each local authority inviting olderpeople and their carers to take part in thestudy.
n The study would therefore involve allolder people who contact the localauthorities in the study seeking socialcare support over a specified period asits sampling frame. The study wouldfollow older people with low/moderatesocial care needs who have both goneon and not gone on to receive long-termsocial care support, but it would excludepeople who do not approach the localauthority and arrange care privately orcarry on managing without formalsupport.
n The recruitment of a representativesample of consistently defined olderpeople and their carers into the study isimportant for its success, as it will affectthe comparability of the findings acrosscare models. The study should useeligibility criteria for the recruitment ofolder people with low needs that arebased on a clearly defined needs profileand ensure that they are appliedconsistently across all local authoritysites.
n The evaluation should attempt to coverall mechanisms involved in the first pointof contact process (e.g. web-based toolsfor triaging cases) and all agencies withdelegated responsibility from the councilfor handling first contact.
n Carers could be defined as peopleproviding social care support on anunpaid and informal or semi-formalbasis to someone with whom they havea pre-existing relationship, e.g. becausethey are family, friends or neighbours.When multiple carers exist for the sameperson, we suggest that only the maincarer, defined as the person providing thegreatest number of hours of care perweek, should be invited to participate inthe study.
n Carers will be recruited into the study byfieldworkers via contact with the olderperson.
Management of the fieldwork
n The research team will need to be awareof the effects of slow recruitment intothe study and ensure that the fieldworkis managed appropriately. The researchteam will need to explore carefully howbest to meet ethical and legalrequirements regarding informedconsent in the context of this study.
n To ensure that the baseline interviewscapture the situation at the time theperson contacts their council, the timebetween contact with the local authorityand the baseline interview will need to bekept to a minimum. The fieldworkcompanies interviewed felt that theminimum time between recruitment intothe study and baseline interview waslikely to be between four to six weeks.
n The research team may need to considerwhether to place a restriction on the timeto baseline interview, bearing in mind theconsequences this is likely to have onthe sample size and the quality of theinformation gathered.
n We recommend that interviews shouldbe administered using computer-assisted personal interviewing software.They should involve face to faceinterviews with people with social careneeds, but telephone interviews might beused for interviews with carers.
Timing of interview waves
n A baseline and first follow-up waves willbe essential, as without them the studywill be unable to explore any of thecausal effects on outcomes and costs ofthe different care models investigated.
n A first follow-up of 6 months wassuggested by local authorityprofessionals involved with the first pointof contact systems.
n Longer follow-up periods (e.g. 18 and 30months) would be important as theywould enable the study to exploredifferences in longer-term outcomes. Itmight be advisable to assess thesuitability of funding waves 3 and 4
viii

depending on whether sufficientnumbers of interviews were achieved atwave 2 and that the quality of theevidence emerging was high.
n It is likely that a stream of outputs wouldbe produced throughout the life of theproject, coinciding with the availability ofadditional waves of data.
Response rates and attrition
n The cost of the fieldwork will dependheavily on achieved response rates foreach wave.
n The survey companies contacted haveused assumptions based on previousstudies with similar populations and withsimilar gaps between waves of fieldwork.The consensus view, however, was thatthe likely response rates at each stage ofthe survey were difficult to predict andwould benefit from testing in the fieldusing a pilot.
n The survey companies suggestedrecruitment to interview conversion ratesof between two-thirds to three-quarters,with the lower of these estimates beingclosest to the conversion rate achieved(69%) for a recent study of social careusers and the middle estimate beingclosest to the conversion rate for carers(76%).
n Our assumptions about attrition ratesbetween data collection waves are basedon the experience of survey companieswith longitudinal surveys for similarpopulations and similar gaps betweenthe fieldwork stages. The rates ofattrition suggested by survey companieswere broadly similar – in the region ofone-third to a quarter of cases lost ateach stage.
n It will be important for the research teamto consider multiple strategies tomaximise response rates to each wave,including for instance incentives forstudy participants; ensuring accessibilityand attractiveness of advance materials;strategies to build a rapport betweeninterviewer and participants; andactivities designed to keep in touchbetween waves to provide the researchteam with a means of identifyingpossible changes of address orcircumstances.
Questionnaires and their mode of administration
n Based on previous experience we expecteach questionnaire to take between 45mins to 1 hr to administer.
n We recommend that the research teamuse face-to-face interviews as theprimary mode of data collection dueprimarily to the length of the interview,but also to build rapport between theinterviewers and participants which isimportant for a multi-wave study.
n The research team may want to considerusing telephone interviews for carers,particularly for follow-up waves of thestudy. They may also want to consideroptions for ensuring interviews can beconducted in private where necessary.
n We would recommend that the researchteam include some capacity andresources for testing and developingquestions in the budget.
Data representativeness
n The representativeness of the mainstudy and the transferability of its resultswill be affected by therepresentativeness of the sample ofparticipants relative to the population ofolder people with low/moderate needs;the representativeness of the caremodels the local authorities in the studyand the inclusion of a broad range ofcouncils.
n The study should attempt to collectevidence about the representativeness ofthe sample of users interviewed relativeto the population of older people withlow/moderate needs contactingauthorities for support. This informationcould be used subsequently to identifypossible biases in the sample of casesinterviewed, and to reweight the samplesobtained during the analysis in order toattempt to correct for any such biases.
n The typologies of local care modelsdeveloped statistical methods, combinedwith information about localcharacteristics (e.g. LA type) shouldallow the reweighting of the studysample to English-level patterns.
ix

The role of a pilot
n Given the uncertainties in the design ofthe main study, the research team maywant to consider a pilot study whichwould (i) inform the research team aboutlikely recruitment and response rates, theproportion of older people who are likelyto have a main carer who is co-residentor extra-resident, and the proportion whoare happy to be contacted again at sixmonths, (ii) examine ways of maximisingrecruitment and response rates for botholder people and carers, looking atoptions for processes and screening andrecruitment materials, and (iii) refine inpartnership with local authorityprofessionals the definition of the criteriato be applied across collaboratingauthorities for selecting cases into thestudy.
n The pilot should also help specify thedetailed arrangements between theresearch team (including fieldworkorganisation) and the local authority forprocessing participants.
Costs of the study
n Broadly, it would not be possible todeliver the fieldwork for a baselinesample of much more than a 1,000 olderpeople for under £1m (including VAT)
assuming three follow-up waves of datacollection. Even assuming two follow-upwaves of data collection a baselinesample of 1,500 older people will cost inthe region of £1.1m to £1.5m (includingVAT). Further follow-up waves couldincrease costs to between £1.5 and£1.9m (including VAT). A baselinesample of 3,000 older people, whichwould have the greatest power to detectdifferences between groups of peoplereceiving different care models,especially given likely rates of attrition,would cost in the region of £2m(including VAT) for a study with 2 follow-up waves and significantly over £2m forthree follow-up waves. The fairly widevariability in costs depends on theassumptions applied about the likelyrecruitment, conversion and attritionrates for older people and their carers.
n In addition to the fieldwork costs, theevaluation will incur other significantcosts, including in particular the analysiscosts, any incentives that might beoffered to increase local authorityparticipation and individuals’ recruitmentrates into the study and the costs ofpurchasing any linked data.
n The costs of a pilot would be a fractionof the costs of the main survey
SUMMARY OF EXPECTED OUTCOMES FROM THE MAIN STUDY
Key study outputs will include:
n A detailed picture of the characteristicsof people with low/moderate care needsapproaching their local council forsupport and their carers.
n A detailed understanding of the nature ofdifferent care models for supportingindividuals with low/moderate socialcare needs.
n A comparative analysis of the costs andoutcomes of alternative care models.
n An analysis of differences in the cost-effectiveness of specific services fordifferent individuals with low/moderatecare needs.
n An analysis of the likely effects of recentchanges in social care provision.
n Evidence to support the development ofrecommendations about the most cost-effective strategy for supporting olderpeople with low/moderate care needs.
Other uses of the main study evidenceinclude the analysis of:
n Changes in the needs profile of peoplewith low/moderate needs over time, andrates of transition between disabilitystates.
n Lifetime patterns of care costs.
n The causal relationship between needs,services and outcomes, including of theinterdependencies between formalhealth and social care.
n The interrelationship through timebetween formal and unpaid care.
n The causal relationship between formalcare services and outcomes for unpaidcarers
n The quantification of unmet needs.
n The appropriateness of differentmeasures for capturing serviceoutcomes for older people withlow/moderate care needs.
x

xi
EXECUTIVE SUMMARY iii
LIST OF TABLES xiv
LIST OF FIGURES xv
1 INTRODUCTION 1
1.1 Study background 1
1.2 Study objectives 1
2 EVALUATION APPROACHES CONSIDERED 4
2.1 Scoping study methods 6
2.2 Ethical considerations 6
3 IDENTIFYING LOCAL SOCIAL CARE MODELS FOR SUPPORTING OLDER PEOPLE 7WITH LOW/MODERATE NEEDS
3.1 Strategy for reviewing local websites and local policy documents 7
3.2 Interviews with key experts 9
3.3 How do local authorities identify and support people with low needs 10
3.3.1 Local policies to support people with low/moderate needs 10
3.3.2 From first contact with the local authority to assessment 12
3.3.3 Sequels following contact with services for people with low/moderate needs 14
3.3.4 Data collected by local authorities about people contacting them 16
3.4 Identifying support model typologies: analysis of local authority contacts, activity and 18 support patterns
3.4.1 Local social care variability 18
3.4.2 Standardising indicators of social care activity 19
3.4.3 Using latent class analysis to derive local typologies 24
CONTENTS

4 SURVEY CONTENT 27
4.1 Rapid review of social care evaluations and frailty literature 27
4.2 key need-related characteristics of the main study population 28
4.2.1 General indicators of need for care and support 28
4.2.2 The concept of frailty and its measurement 29
4.2.3 Risk factors associated with falls 32
4.2.4 Assessment of care and support needs by social work professionals 33
4.3 Service indicators 36
4.4 Outcome indicators 37
4.4.1 Outcomes for older people with low/moderate needs 37
4.4.2 Carers 40
4.4.3 Intermediate outcomes 41
4.4.4 Appropriate time intervals for capturing effects of support services 41
5 SAMPLE SIZES 43
5.1 Power calculations 43
5.1.1 Method for power calculation 43
5.1.2 Estimated required sample size 44
5.2 Required number of authorities for the main study 47
5.2.1 Recruitment rates for older people 47
5.2.2 Recruitment rates for carers of older people 47
5.2.3 Potential number of cases available for recruitment into the main study 48
5.2.4 Estimated local authority recruitment rates 49
5.2.5 Recruiting authorities into the study 53
6 PRACTICALITIES OF THE IMPLEMENTATION OF THE MAIN STUDY 55
6.1 Analytical approach 55
6.1.1 Quantitative analyses 55
6.1.2 Process evaluation 55
6.2 Recruitment of study participants 56
6.2.1 Sampling frame 56
6.2.2 Study eligibility criteria 57
6.2.3 Carers in the study 59
6.3 Management of the fieldwork 60
6.3.1 Data collection strategy 60
6.3.2 Timing of interview waves 60
6.3.3 Informed consent 62
xii

6.4 Response rates and attrition 62
6.4.1 Conversion rate 62
6.4.2 Attrition rates 63
6.4.3 Sample retention at follow-up waves 63
6.5 Questionnaires and their mode of administration 64
6.5.1 Development and testing of the questionnaires 64
6.6 Data representativeness 65
6.6.1 Correcting for biases in the sample of individuals sampled 65
6.6.2 Testing for the representativeness of participating authorities and grossing up to 65 national levels
6.7 The role of a pilot 66
7 COSTS OF THE STUDY 67
8.1 Key study outputs 69
8 SUMMARY OF EXPECTED OUTCOMES FROM THE MAIN STUDY 69
8.2 Other uses of the main study evidence 70
9 REFERENCES 72
ANNEX 1: RANKINGS OF LOCAL AUTHORITY CHARACTERISTICS BY YEAR 78Distributions of local authority characteristics by latent class 83
ANNEX 2: TEMPLATE FOR THE EXTRACTION OF KEY INFORMATION FROM 87SOCIAL CARE EVALUATIONSStudy 1: Bauer et al 2017 87
Study 2: Caiels et al 2010 88
Study 3: Forder et al 2016 90
Study 4: Glendinning et al 2010 90
Study 5: Ipsos Dunatchik 2016 92
Study 6: Kingston et al 2017 93
Study 7: Vlachantoni et al 2011 94
Study 8: Windle et al 2009 95
Study 9: Glendinning et al 2008 98
Study 10: Forder et al 2012 100
Study 11: Armstrong et al 2016 102
Study 12: Davis et al 2013 103
Study 13: Flynn et al 2011 104
xiii

Table 1: Sample sizes stratified by numbers of ADL difficulties and informal care receipt (older people) 5
Table 2: Local Authorities in the study: rank of observed expenditure per capita – relative to predicted levels 8given local characteristics
Table 3: Sampled local authorities and informants’ characteristics 9
Table 4: Regression models for net current expenditure on older people’s adult social care, 20per population aged 65+
Table 5: Regression models for number of older people receiving adult social care at 31 March, 20per population aged 65+
Table 6: Regression models for number of requests for support at 31 March, per population aged 65+ 21
Table 7: Regression models for number of older people in residential or nursing care at 31 March, 21per population aged 65+
Table 8: Mean rank of relative to predicted values for selected service measures (2015/16) and 24change in rank from 2010/11 to 2015/16
Table 9: Class membership by local authority type and ONS family 25
Table 10: Measures of the components of frailty 30
Table 11: Domains of risk factors for frailty 31
Table 12: Risk factors for falls among older people 32
Table 13: Areas of needs covered in assessment forms 34
Table 14: Well-being measures, ELSA W6 and HSE 2011–2013, adults aged 65 and over 39
Table 15: Estimates of mean and standard deviations (in brackets) of user and carer outcomes and 44costs used in sample size calculations
Table 16: Required sample size at first follow-up for precision of various outcome indicators under 45different assumptions regarding the detectable difference
Table 17: Required sample size at follow-up for precision of carer outcome indicators under 45different assumptions regarding the MCID and detectable percentage differences
Table 18: Required sample size at follow-up for precision of costs under different assumptions regarding the MCID 46
Table 19: Proportions of new requests for support assumed to meet client profile requirements, 48by sequel to request
Table 20: Number and proportion of authorities expected to achieve 150 interviews over six months 51by local authority type and recruitment-to-interview conversion rate
Table 21: Number and proportion of authorities expected to achieve 300 interviews over six months 52by local authority type and recruitment-to-interview conversion rate
Table 22: Average number of monthly recruitments per local authority required to achieve a total of 3,000 53baseline interviews, by number of participating authorities and length of data collection period
Table 23: Number of required referrals associated with different target samples and conversion rates 62
Table 24: Response rates at each survey wave 63
xiv
LIST OF TABLES

Figure 1: Summary of the steps involved in the receipt of care and support 2
Figure 2: Stages of assessment process in sampled councils 13
Figure 3: Distribution of local authority client numbers and expenditure relative to national average – 18ranked independently by local authority (2015/16)
Figure 4: Distribution of local authority proxies of social care need and deprivation relative to 19national average – ranked independently by local authority (2015/16)
Figure 5: Distributions of local authority proportional deviations in standardised social care activity (2015/16) 22
Figure 6: Residual relative to predicted net current expenditure per capita on older people’s adult 23social care, selected years
Figure 7: Map of local authorities by class membership 26
Figure 8: Local authorities ranked by expected monthly recruitments, (2016/17-based estimates) and targets 49associated with 3,000 interviews in 20 local authorities or 1,500 interviews on 10 local authorities
Figure 9: Local authorities ranked by expected monthly recruitments, (2016/17-based estimates) and 50targets associated with 3,000 interviews in 10 local authorities
Figure 10: Illustration of minimum thresholds for numbers of participating authorities, length of data collection 54period and average number of monthly recruitments required to achieve a total of 3,000 baseline interviews
Figure 11: Illustrative sample recruitment flowchart 58
Figure 12: Possible study timeline, assuming two follow-up periods at 6 and 18 months post-baseline 61
Figure 13: Residual relative to predicted net current expenditure per capita on older people’s adult social 79care (selected years)
Figure 14: Residual relative to predicted number of older people receiving adult social care per capita 80(selected years)
Figure 15: Residual relative to predicted number of older people receiving residential/nursing care 81per capita (selected years)
Figure 16: Residual relative to predicted number of requests for support from older people per capita (2015/16) 82
Figure 17: Histograms and mean values by year and class: rank of residual relative to expected expenditure 83(low to high)
Figure 18: Histograms and mean values by year and class: rank of residual relative to expected total 84client coverage (low to high)
Figure 19: Histograms and mean values by year and class: rank of residual relative to expected residential 85client coverage (low to high)
Figure 20: Histograms and mean values by class: rank of residual relative to expected numbers of requests 86for support (low to high, 2015/16)
xv
LIST OF FIGURES

1.1 STUDY BACKGROUND Local authority returns indicate asignificant drop over the last ten years inthe proportion of older people receivinglocal authority (LA) social care (Fernandez,Snell and Wistow, 2013). These reductionsin coverage, which appear to have affectedin particular older people with relatively lowneeds, reflect important changes in thetype of social care support offered by LAsas well as changes in the needs eligibilityfor social care.
LAs’ approach to demand management ischanging. Increasingly, LAs areimplementing ‘front doors’ aimed atdiverting people to other forms of support,e.g. voluntary services contracted bycouncils to provide information and adviceand a wide variety of services, including ifneeded referral back to the council forformal care. Social work is also being
refocused to help people live independentlyfor longer, and short periods of intensivecare (reablement) are being offered toreduce longer term care needs, for instancefollowing hospital discharge.
At the same time as services are beingreconfigured, social care expenditure andthe numbers of care packages provided toolder people in England have not kept upwith the growth in social care demand. Thishas resulted in a significant drop in theproportion of older people with social careneeds receiving state-brokered care(Fernandez, Snell and Wistow, 2013).
There is little quantitative evidence whichenables us to interpret the nature of recentchanges in social care activity, and theextent to which they indicate the successof local strategies for maintainingindependence and thus reducing the needfor ongoing social care support, or whetherthey highlight ‘retrenchment’ of statefunded social care. There is even lessevidence about the consequences of thosechanges on the quality of life of people withsocial care needs and their carers, and theirwider impact on other parts of the welfaresystem such as the NHS and the benefitsystem.
The aim of this study is to inform a possibleresearch strategy for developing thisevidence.
1.2 STUDY OBJECTIVESThe aim of this scoping study is to considerhow to design a possible ‘main study’ thatwould evaluate the consequences onoutcomes for older people with social careneeds, their carers and the wider care
system of recent changes in the supportoffered by councils, focusing on olderpeople at the edges of current eligibilitycriteria (this group will be referred tohereafter as older people with
1
KEY DEFINITIONS
Low/moderate needs: we use this expression in the report to refer toolder people at the edges of the social care eligibility criteria.
Scoping study vs. main study: we refer to the scoping study as thepresent study, which aims to explore key strategies andmethodologies for a possible main study evaluating theconsequences on outcomes and costs of different models forsupporting older people with low/moderate needs.
1 INTRODUCTION

low/moderate needs1). In terms of Figure 1,the main study would evaluate changes inthe care and support system once olderpeople with social care needs contact theircouncils, and therefore would focus on therelationships indicated in red.
This scoping study discusses a number ofalternatives for evaluation, and theadvantages and limitations of each ofthem, in particular in terms of the specificpolicy questions they might address mosteffectively, their cost, duration and the likelybreadth and robustness of the evidenceproduced.
The specific aims of this scoping study areto:
Consider the different strategies that the mainstudy could use to identify and recruit into theevaluation older people with low/moderateneeds who contact their local authority forsupport.
Consider alternative survey methods forcollecting data for the main study,including:
• the pros and cons of different strategiesfor the design and administration ofquestionnaires
• the choice of key indicators of needs,services and outcomes required for theevaluation Particular emphasis will beplaced on the impact on the health andwellbeing of the individuals with careneeds, of their family/carers, and on theimpact on the demand across the caresystem (NHS services, longer term trendof need for social care services)
• the length of follow-up required toobserve meaningful changes inwellbeing and resource use
• choices about the frequency ofmeasurement given expected drop-outrates
• methods to maximise participation byharder to reach groups
• implications on numbers and samplerepresentativeness of data linkages.
Estimate statistical power, to illustrate thelikely sample sizes required to identify witha given statistical confidence meaningfuldifferences in the outcomes of interest.
Identify candidate authorities for theevaluation, for instance in terms of theirdifferent care models for supporting peoplewith low/moderate needs, and theircapacity to track individuals through timeand across health and social careinformation systems. The aim here, ratherthan recruiting specific areas for thesubsequent study, was to scope caremodel options for evaluation, and to assessbroad membership of different areas tothese models.
1 Our use of the term is unrelated to the formaldefinitions used in the Fair Access to Care Servicesregulations.
2
FIGURE 1: SUMMARY OF THE STEPS INVOLVED IN THE RECEIPT OF CARE AND SUPPORTIndivid
ual w
ith ca
re needs Approaches
social care
No formalsocial care
User: healthstatus/qualityof life
Carer: qualityof life/health/employment
Social careassessment
Health caresupport
Social carepackage
Other formsof demandmanagement
Impact onwider system:e.g. NHS
Unpaid caresupport
1
3
2 Arrangesformal careprivately
Firstpoint ofcontact

Because it focusses on people once theyapproach councils for social care support,the scoping study does not consider how toinclude into the main study people whonever approach the system, or addressquestions related to the reasons why someindividuals contact LAs for support as
opposed to arranging their care privately,relying on informal care, or going withoutany care. These are important policyquestions, but they lie outside of the remitof the scoping study and could not beaddressed on the basis of the approachproposed below.
3

Ideally, the evaluation of the recent changesin social care support would compare pastevidence about care needs, care use andassociated outcomes against similarevidence relating to the present. Thiscomparison could be based on:
• Evidence from the literature describingthe social care system at different pointsin time.
• Evidence from national surveys coveringolder people with social care needs overthe recent past.
• Longitudinal evidence produced fromwithin the social care system.
Previous discussions and a rapid review ofevidence identified a lack of detailedpublished quantitative evidence on thenature and consequences of the changes insupport for older people with social careneeds. It was therefore agreed with theDepartment of Health and Social Care thatan evidence synthesis approach would beruled out from the start.
We have considered whether it would bepossible to carry out the main study usingdata from national surveys such as theEnglish Longitudinal Study of Ageing(ELSA), the Health Survey for England (HSE)and Understanding Society (US). Thesesurveys contain indicators of social careneeds and care use for representativesamples of older people over a number ofyears, and have been used for the analysisof broad patterns of unmet social careneeds (NatCen Social Research and IpsosMORI, 2017). However, basing the mainstudy exclusively on these data sourceswas considered to be unfeasible becauseof:
• The limited number of cases with socialcare needs, which would not allow adetailed analysis of changes in supportfor different groups of individuals. Multi-
purpose surveys tend to boast largeoverall sample sizes and in certaininstances (such as UnderstandingSociety) allow for authority-levelanalysis. However, adults with socialcare needs tend to make up only a verysmall proportion of the total sample:within the latest wave of UnderstandingSociety, only 630 older people with threeor more ADL difficulties were identified,before stratifying by informal care receiptand geographical identifier. Sample sizesfor similar groups (3+ ADLs; regardlessof informal care receipt) in the latestavailable waves of ELSA and HSE were369 and 152, respectively (see Table 1for further information about samplesizes in key national surveys). Thelimited number of relevant cases perlocal authority would be a further limitingfactors for the main study, in terms of itspotential to compare the costs andoutcomes of different local supportmodels.
• The lack of information in these surveysregarding access to universal services(e.g. support services organised by thevoluntary sector), which are a keycomponent of the new support modelsfor people with low/moderate needs.
• The cross-sectional nature of some ofthe surveys (e.g. HSE) which limits theanalysis of causal relationships betweenneeds, services and outcomes.
• The lack of information in these surveysdescribing whether, when and howindividuals approach their councils forsocial care support.
The administrative data held by localauthorities was also identified early on asinsufficient for addressing the aims of themain study (see Fernandez and Zigante(2017) for a description of key strengthsand limitations of LA administrative data).Key limitations of local administrative
4
2 EVALUATION APPROACHESCONSIDERED

systems for the main study include the lackof information about quality-of-lifeoutcomes for service users and carers, thelimited information collected about theneeds of individuals at first point of contactwith the council, and the lack of informationabout the support received by those that donot go on to receive core social carepackages. These limitations wereconfirmed during our discussions with localauthorities in the context of this scopingstudy.
The limitations of national surveys andadministrative records outlined abovesuggest that some form of new datacollection would be required to address theresearch questions of the main study. Thisscoping study focussed therefore on themethodology for conducting a survey ofolder people and their carers.
The need for primary data collection meantthat the main study would have to rely onprospective evidence, and therefore that itcould not evaluate the consequences ofrecent changes in the social care system bycomparing past and present data. Instead,we have explored the potential for carryingout such evaluation by exploiting thesignificant variability in the type andintensity of support provided in differentlocal authorities in England. Thesevariations could be used in order to ‘mimic’the impact of the changes in care forpeople with low and moderate care needsthat have taken place in recent years.
A key aim of this scoping study wastherefore to understand the variability inlocal support models, and to attempt toreduce this variability into a simple‘typology’ of authorities that couldsubsequently be used in the main study.Local variations in intensity, type andcoverage of local support and a possibletypology of local councils are explored inSection 3.4.
Implicitly, the objective of the study becametherefore to evaluate the consequences oncosts and outcomes of different models forsupporting older people with low/moderateneeds. Relative to a ‘narrow’ evaluation ofthe impact of recent changes in social caresupport, this research question has theadvantage that the main study wouldinform the development of future systemsfor supporting older people withlow/moderate needs, as well as exploringthe likely consequences of recent shifts inthe care and support models for this group.
The remainder of this report thereforefocusses on evaluation options involvingthe comparison of patterns of support,costs and care outcomes across differentlocal care models, assuming that someprimary data collection from users andcarers would be required. We explore inaddition how other data sources (e.g.national surveys and local administrativerecords) could complement this evidence inorder to address issues of data reliabilityand representativeness.
5
TABLE 1: SAMPLE SIZES STRATIFIED BY NUMBERS OF ADL DIFFICULTIES AND INFORMAL CARE RECEIPT (OLDER PEOPLE)
0 ADLs 1 ADL 2 ADLs 3+ ADLs
English Longitudinal Study of Ageing 2015
No informal care 3958 308 93 104
Informal care 408 256 196 265
Understanding Society 2015-17
No informal care 6,163 231 51 101
Informal care 1,164 380 216 529
Health Survey for England 2015
No informal care 979 40 15 37
Informal care 126 78 48 115

2.1 SCOPING STUDY METHODSThe scoping study has used a number ofdata sources and research methods,including:
• A rapid review of the literature, to collectevidence about methodologies and datacollection instruments used in previousrelevant social care evaluations, andevidence to use in the calculation ofsample sizes.
• A review of local authority systems,including policy documentation,information in local authority websites,and local authority assessmentmaterials.
• Statistical methods to explore localvariations in support models (including
the derivation of a typology ofauthorities) and to calculate thestatistical power associated withdifferent sample sizes.
• Interviews with key local stakeholdersthat might collaborate in the evaluationand in particular with LA professionals.As noted above, the evaluation is likely toinvolve the collaboration of localauthorities to identify cases at the firstpoint of contact.
• Interviews with fieldwork organisations(IPSOS/MORI, GfK and Natcen) to obtainestimates of costs of data collection fordifferent survey methods (e.g. face toface; telephone), and to discuss some ofthe practicalities of the main study.
2.2 ETHICAL CONSIDERATIONS The project received approval by theAssociation of Directors of Adult SocialServices (ADASS). The LSE Research EthicsReview Checklist and Data ManagementPlan were completed in accordance withThe LSE Research Ethics Committee’srequirements. After completing the reviewchecklist, it was deemed that adequatesafeguards in relation to any ethical issueswere in place and LSE information security
guidance were followed. Written and verbalinformation about the study was given tothe participants and written informedconsent was obtained from all informants.All participants were asked for permissionto record interviews and all agreed. Thenames of local authorities and intervieweeswere replaced by a code to protect theirconfidentiality.
6

At present, there is not an accepted typology of care models for individuals withlow/moderate social care needs in England. In the absence of such classification, we havesought to:
• Understand the way in which local authorities design and organise their systems foridentifying, assessing and supporting older people with low/moderate needs, therationale for such systems, and the mechanics involved. Here we summarise ourfindings from the reviews of websites, academic literature, policy documents andinterviews with key local stakeholders.
• Classify authorities into groups on the basis of their observed behaviour as revealed byindicators of expenditure and activity from local authority returns, conditional on theirlocal need. Section 3.4 explores key observed patterns of local authority contacts,service receipt and expenditure for older people, and develops a possible typology ofauthorities that could guide the selection of sites in the main evaluation study.
Sections 3.1 and 6.2 describe respectively the local review strategy, and key characteristicsof key experts interviewed for the study.
3.1 STRATEGY FOR REVIEWING LOCAL WEBSITESAND LOCAL POLICY DOCUMENTSLocal websites and assessment policies(where available) were examined in 22 localauthorities. The councils included in thestudy covered key groups of authorities inEngland such as metropolitan, inner andouter London boroughs and non-metropolitan counties (see Table 2 forfurther details about the councils in thestudy). Local websites were searched toexplore councils’ first contact practices,assessment processes, eligibilitydocuments and forms, local directory ofservices/providers, and any otherdocuments and leaflets that may be relatedto the assessment of need and eligibilitycriteria. Moreover, for a sub-group of 6 localauthorities, we examined in depth key localpolicy documents for descriptions of localapproaches to prevention and earlyintervention strategies for people withlow/moderate needs. The documentscovered included: Health and WellbeingBoard Strategies (HWBS), Better Care Fund(BCF) documents, Sustainability and
Transformation Plans (STP), and otherdocuments related to prevention and earlyintervention (e.g. prevention plans, or adultsocial care strategies if they includedinformation on prevention and/or earlyintervention). Websites of other relevantorganisations were also searched forinformation on needs assessment,eligibility and information on individualswith low/moderate needs.
Websites of other relevant organisationswere also searched for information onneeds assessments, eligibility and supportmodels for individuals with low/moderateneeds. We searched national organisationalwebsites to explore whether and whatguidelines and training for Local Authoritystaff were available regarding theimplementation of national eligibility criteriaand assessment processes, and for anyother relevant information for assessmentand care planning for people with low andmoderate needs level. Search sites/engines
7
3 IDENTIFYING LOCAL SOCIAL CAREMODELS FOR SUPPORTING OLDERPEOPLE WITH LOW/MODERATENEEDS

included: ADASS, LGA, CQC, SCIE, Age UK,Carers UK, Think Local Act Personal(TLAP), Skills for Care, NICE, Association forCare, Training & Assessment Networks(ACTAN), google. Search terms used in thesearch included: social care; unmet need;
low need; moderate need; long intervalneed; prevention; older people; eligibility;community care; little bit of help; low levelsupport; informal care, unpaid care, careassessment.
8
TABLE 2: LOCAL AUTHORITIES IN THE STUDY: RANK OF OBSERVED EXPENDITURE PER CAPITA – RELATIVE TO PREDICTEDLEVELS GIVEN LOCAL CHARACTERISTICS
Type of LA 2010 2013 2015
1 Non-metropolitan county 55 40 65
2 London borough 5 0 25
3 Non-metropolitan county 90 55 35
4 Non-metropolitan county 50 90 30
5 London borough (outer) 135 130 100
6 Non-metropolitan county 45 100 85
7 Non-metropolitan county 130 75 55
8 Non-metropolitan county 20 75 45
9 Non-metropolitan county 55 70 140
10 Unitary authority 85 80 95
11 Metropolitan borough 150 120 135
12 London borough 65 95 10
13 Unitary authority 75 70 50
14 London borough (outer) 70 30 50
15 London borough 135 100 70
16 Non-metropolitan borough 50 20 15
17 Non-metropolitan county 55 65 80
18 London borough (outer) 0 55 145
19 Non-metropolitan borough 30 20 90
20 Non-metropolitan borough 40 35 70
21 London borough (outer) 20 5 10
22 Non-metropolitan borough 70 110 40
Notes: figures are rounded to multiples of 5 to preserve the anonymity of the councils; Low rank indicates greater expenditure than expected in givenyear. The rankings were calculated on the basis of “standardised” measures of expenditure, which control for local levels of needs and prices, using themethods described in Section 3.4.2.

3.2 INTERVIEWS WITH KEY EXPERTSQualitative in-depth, semi-structuredinterviews with ten professionals wereconducted between October 2017 andJanuary 2018. Constrained by theavailability of respondents within thenarrow timeframe for data collection, wesought to capture a range of perspectivesacross all five councils which agreed totake part in the study. We conductedinterviews with local prevention leads orequivalent service leads, with lead dataanalysts and members of the first point ofcontact team. The interviews enabled us toask broad questions based on the researchobjectives, a question guide was used toensure that all the areas of interest werecovered in each interview, topics thatparticipants found relevant were followed indepth whether they were in the question
guide or not. Respondents were also askedat the end of each interview if they wantedto add any information to ensure that noissues were left uncovered that participantshad felt were important. The full interviewquestion guide is available from theauthors.
Table 3 describes key characteristics of theinformants in the study. To enhance thequality of collected interview data, allinterviews were recorded, transcribedverbatim and material was analysedsystematically by the authors across eachcouncil in case-study format by focusingon identification and reporting of patternsand themes across the interviews tointerpret the material.
9
TABLE 3: SAMPLED LOCAL AUTHORITIES AND INFORMANTS’ CHARACTERISTICS
LA1 Inner London borough Respondent 1 – Data analyst
Respondent 2 – Service manager for prevention
Respondent 3 – Social worker
LA 2 Outer London borough Respondent 1 – Service manager for prevention
Respondent 2 – Data analyst
LA 3 Non-metropolitan county Respondent 1 – Head of intelligence
Respondent 2 – Customer experience manager
LA 4 Non-metropolitan county Respondent 1 – Team manager, First point of contact team
LA 5 Unitary authority Respondent 1 – Head of commissioning (prevention)
Respondent 2 – Service manager

3.3 HOW DO LOCAL AUTHORITIES IDENTIFY ANDSUPPORT PEOPLE WITH LOW NEEDS
3.3.1 LOCAL POLICIES TO SUPPORT PEOPLE WITH LOW/MODERATE NEEDS
Local policies frame the way in whichcouncils identify and support people withlow/moderate needs. Services for peoplewith low/moderate needs are generallyconsidered in terms of the councils’prevention and early intervention agendaand the Care Act duty of promotingwellbeing when exercising community carefunctions. While local authorities have alldeveloped strategies for prevention, there iswide variation between them in how theyhave responded to this broad agenda.
Prevention and early intervention servicesare often described as belonging to one ofthree groups:
• Primary prevention, which might includeservices, facilities or resources designedto help a person avoid developingsupport needs by maintainingindependence, good health andpromoting wellbeing. A range of advice,information and services could fall withinthe remit of this approach, includingservices aimed at addressingaccommodation problems,neighbourhood safety, social isolationand healthy and active living.
• Secondary prevention or earlyintervention, which includes moretargeted interventions aimed at peoplewho are at greater risk of developingsupport needs that aim to reducedeterioration in their circumstances. Awide range of services are includedwithin this approach covering a range ofareas of people’s lives including fallsprevention, adaptations, equipment, etc.
• Tertiary prevention includesinterventions for people with establishedlong-term conditions that are designedto minimise the effect of their disabilityon their wellbeing, slow deterioration andsupport people to regain skills andconfidence where appropriate.Interventions associated with tertiaryprevention include rehabilitation,reablement, equipment and adaptations,the provision of support (not necessarilypersonal care) within the person’s home
to enable them to live in the communityand services to support informal carersto manage and balance the demands ofcaring (e.g. day centres/lunch clubs,respite care, peer support groups).
While it is difficult to establish clearboundaries between primary, secondaryand tertiary prevention, interventions aimedat individuals at the edge of the social careeligibility thresholds will generally fall withinthe latter two, given that considerable levelsof dependency are required to access coresocial care services in England (Fernandezet al., 2014).
The range of support available for peoplewith low/moderate needs will depend onthe local council’s service offer, theavailability of help from the local charitableand private sector, and the nature ofservices developed by NHS partners(including GPs and the acute sector) and bythe Housing Departments and providers(e.g. Housing Associations andhandyperson services). The extent to whichlocal authorities have embraced theirmarket management role, haveexperimented with new forms of provision(see for instance Shared Lives Plus, n.d.;Social Care Institute for Excellence, 2017,2018) or have been successful in bothstimulating and mapping local provisionalso has implications for the range andvolume of services available for people withlow/moderate needs.
The importance of prevention as a policyobjective, and the variability in localapproaches to prevention was evident fromthe review of local authority literature andwebsites. This review showed significantvariability in the service offer and in howthe options for support werecommunicated to people. For instance,while some local authorities provideddetailed listings of services that areavailable across the council from a range ofproviders, often through their online servicedirectories, other authorities gave only anoverview of the types of support that mightbe available.
10

The importance of partnerships indelivering the prevention agenda was alsoclear from the review. Joint Health andWellbeing Strategies (JHWS) tended to takea system-wide approach to prevention andearly intervention, reflecting the fact thatpromoting wellbeing for people withlow/moderate needs means in many casesaddressing and overcoming deficiencies inaccommodation, the local area and so onthat create health risks, affect people’ssense of safety, ability to get out and aboutand so on. For example, one area describeda “housing delivery plan” that aimed todeliver early intervention, prevention andindependence at home through servicessuch as handyperson or aids andadaptations schemes.
Some local authorities had streams withintheir Sustainability and TransformationPlans (STPs) dedicated to ‘ageing well’ andaddressing ‘frailty’ that described fundingarrangements for reablement services, fallsprevention services and schemes to reducesocial isolation.
The Better Care Fund (BCF) plans wereviewed often included streams forservices focused on promoting self-care,reablement, information and advice, fallsprevention, preventing social isolation (e.g.befriending, lunch clubs, support groups),reducing frailty levels (e.g. through sportsactivities, clubs for older adults), socialprescribing and telecare.
The role of these (JHWS, STP and BCF)plans in enabling partners from differentsectors to come together was emphasisedby interviewees from local authorities.Interviewees saw these plans as vehicles
for collaboration, and key to understandingthe availability of services for people withlow/moderate needs and to plan furtherservice development and commissioning.
The prevention agenda in general and theCare Act in particular suggest a need toidentify proactively, perhaps throughscreening activities, people who mightbenefit from prevention and earlyintervention services.
Based on the review of local authorityliterature and websites, it was unclearwhether and how councils identify peopleat risk of developing needs, what riskassessment tools they employ (includingfor individuals with rapidly changing needs),and how they ensure that universal orpreventative services reach people withlow/moderate needs that do not (yet) meeteligibility criteria.
Interviews indicated that some councils dotake active steps to identify people withlow/moderate needs, through utilisingvoluntary sector and NHS organisations(e.g. by placing social care professionals inGP practices) and their involvement withthe wider local population. This is not thecase in all areas, however, and someinterviewees did not identify active steps intheir area to identify individuals withlow/moderate needs that may benefit frompreventative services or early intervention.Indeed, some interviewees highlighted thatin the local authority they worked for, someof the first contact activity was designedspecifically to divert people away fromsocial services departments rather than toidentify possible cases suitable forpreventative interventions (see also Section3.3.2).
Overall, interviewees tended to confirmfindings in the literature that financialpressures pose a challenge to investmentin low-level, early intervention andpreventative services. This is apparent inthe 2016 Budget Survey of the Associationof Directors of Adult Social Services(ADASS), which despite emphasising theimportance of prevention in reducingdemand, reported that councils werereducing funding for prevention to meet thecosts of core statutory duties (ADASS,2017; see also Henwood, 2012; Humphrieset al., 2016). The extent to which this wasthe case varied across councils, and some
11
KEY MESSAGE
The support provided to older people with low/moderate social careneeds can involve a complex network of local authority, voluntaryand NHS organisations and professionals. The complex nature of thesupport models that are being implemented across English councils,and the involvement of multiple agencies in their design andprovision, highlights the need for the main study to “map” a widerange of services, including services provided through the localcouncil (including non-social care services such as support withhousing) and through other health care and voluntary sectoragencies. It also underlines the need for primary data collection,given the lack of existing sources of evidence that could be used todescribe fully at the individual level the support received.

informants reported that investment in low-level services, early intervention andprevention had been a priority in their localauthority, and that it was hoped that suchinvestment would reduce demand and
prevent, or at least delay, people’s entry intomainstream statutory social care services.Investing in early intervention was alsojustified as the “right thing to do” toimprove individuals’ wellbeing.
3.3.2 FROM FIRST CONTACT WITH THE LOCAL AUTHORITY TO ASSESSMENT
A key aim of the main study will be tounderstand how the social care systeminteracts with potential social carerecipients when they first approach thelocal authority.
All local authorities reviewed had firstcontact teams that responded to requestsfor support from local residents and servedto ‘triage’ entry to adult social careservices. These teams tended to be in-house, but some areas delegated thisfunction to other organisations. One LA wespoke to noted that the independentorganisation with responsibility forresponding to requests for support wouldtry to encourage people to access thirdparty providers before accessing statutoryservices.
In general, local authorities madeinformation available online explaining howto contact the authority (or delegatedorganisation) to discuss possible socialcare support. However, the available onlineinformation varied and was not alwayseasy to find. The types of contactinformation provided included onlinecontact forms, telephone numbers, emailaddresses, and fax numbers. We also foundinstances of text messages and Facebookbeing used for first contacts. Textmessages were reported to be used moreby people with sensory loss, and byyounger clients; for them text was often thepreferred method for communication (e.g.because of hearing problems) so textmessages were used to follow up and tocollect all necessary information. Contactinformation was not always provideddirectly on the website. In one authority, forexample, all people making enquiries hadfirst to complete an online self-assessmentof social care needs, the outcome of whichwould determine whether they wouldreceive further information about accessingsocial care services2. In other areas, online
self-assessment forms were just one routewith which to access social care, andtelephone contact information was alsoprovided.
Online self-assessment forms seem to begrowing in use and were often linked to theauthority’s online service directory (ADASSLGA and Socitm, 2017). One authority wespoke to confirmed that they are in theprocess of developing an online self-assessment form and we found variousexamples in our web-searches whereby theresponses the individual gave to the onlineself-assessment form were used to presenta filtered list of appropriate service optionsfrom the online service directory. Despiteinvestment in this area, some intervieweeswere sceptical about the ability to identifyindividuals’ needs through online self-assessment forms. One interviewee notedthat their authority would therefore alwaysfollow up online referrals with a phone call,regardless of the outcome of the onlineassessment. Interviewees also noted thatmany older people, particularly the oldest-old, were not always internet literate, andalthough the younger-old were reported tobe more capable of using the online form,they were often confused by the questionsasked and the information provided online.
The development of online self-assessment and care directories should beunderstood in the context of the increasingpressure on local resources. Intervieweesexplicitly talked about the directories andonline self-assessment forms as fulfilling ademand management function – itspurpose was to serve as an advice andinformation hub about various servicesavailable in the area, in order to reduce thenumbers of people who would ask forsocial care assessment and services fromthe LA.
From the point of view of the mainevaluation, the presence of online needsassessments acting as a gateway to fullneed-assessments and limiting access tothe first point of contact team could be
2 Although presumably people could still call thelocal authority’s main switchboard and be putthrough to the adult social care.
12

significant, as it might make it difficult forthe study to identify and contact thoseindividuals that seek support from the LAbut that fail the online eligibility test.
Examination of websites in differentauthorities suggested that the practice ofusing web-based tools to divert people tovoluntary organisations and alternativesupport options (e.g. advising people to doonline shopping instead of receiving moreconventional forms of assistance) was afairly common approach. Local authoritywebsites tended to navigate individuals tolocal independent and voluntary sectorservices rather than their first contactteams. Some websites indicated thatresidents should contact the local authorityif they cannot find what they were lookingfor in the online service directory. It is not
clear how successful these web-basedtools are in diverting people away fromsocial care, but one council reported that itundertook analyses of website hits andentry to other agencies’ websites,indicating that it may be possible to exploreactivity on these sites in some areas.
We observed in this study a number ofmodels of assessment following initialcontact with the local authority. In general,the assessment involved a multi-stageprocess with triaging of cases at variouspoints. The different approaches we found(which are unlikely to be exhaustive) areillustrated in Figure 2. In terms of the mainstudy, recruitment would be attempted atthe point individuals contacted the first ofpoint of contact team (indicated in red).
13
FIGURE 2: STAGES OF ASSESSMENT PROCESS IN SAMPLED COUNCILS
Online form Telephone Email/text/fax/Facebook
Information or signposting Reablement equipment/short-term support
Full eligibility assessmentNo services
Everybody passedto reablementteam assessment
First contact team assessment [RECRUITMENT INTO STUDY] Social workerassessment
n Green arrows: in this area, all individuals who contacted the local authority would be referred to thereablement team. This team would conduct an initial needs assessment where it would be decided whetherand which services would be provided, or whether full eligibility assessment for a package of long-termsupport would be needed. Individuals who received reablement would be re-assessed after the reablementperiod to decide whether they required further assistance.
n Purple arrows: in another local authority, the first contact team was reported to make the initial needsassessment and would make decisions regarding the provision of information and advice, signposting to otherproviders (e.g. voluntary sector), referral to other teams for support services (e.g. the equipment team), orreferral to full social care needs eligibility assessment.

14
RECOMMENDATIONS: FIRST POINT OF CONTACT AND ASSESSMENT
n Although most authorities had online assessment forms and provided some website information about the assessmentprocess, online information describing local arrangements for processing requests for social care support was often limited.Interviews (and forms) received directly from respondents provided a better insight into local authorities’ approaches. Togain a thorough understanding of local processes we expect that a qualitative strand of work will be necessary, includinginterviews with key stakeholders and a document review.
n Local authorities used web-based interfaces to provide information and advice and signpost individuals to services in thecommunity as a way of managing demand for social care resources. Although most councils used online assessmentsforms, it was not always felt these were entirely effective because a) older people were not always internet literate b) it waschallenging to assess individuals’ needs through an online form. The main study might want to explore variations in the useof web-based tools across localities, how these interact with the multi-stage assessment process, their likely impact on thevolume and types of contacts made with the local authority and on the targeting of care and support for people withlow/moderate needs.
n The main study will want to discuss with the authority ways to capture information about the full range of individualscontacting the council for social care support, including those that are signposted to other services after reading the onlineadvice provided by the council. This will be particularly important in areas in which online needs eligibility algorithms areused to restrict access to the telephone contact details of the first point of contact team.
n A variety of models exist for assessing the needs of individuals approaching local councils. It seems likely that thesemodels may themselves have an impact on the effectiveness and the targeting of care and support for people withlow/moderate needs. The main study will want to collect information regarding the local assessment processes used inorder to explore their impact on the targeting of support and on outcomes for service users and their carers.
n Yellow arrows: in other local authorities, first contact teams made certain decisions (e.g. regardinginformation and advice or signposting), but most cases would be passed to the duty care manager to makethe initial needs assessment. In such cases, the care manager would make decisions regarding provision ofinformation, signposting or short-term support, and if appropriate they would refer individuals for full socialcare needs eligibility assessment and long-term support decisions.
3.3.3 SEQUELS FOLLOWING CONTACT WITH SERVICES FOR PEOPLE WITHLOW/MODERATE NEEDS
Outcomes following initial contact wererelatively consistent across the authoritieswe spoke to. When asked about sequels tofirst contact for people with low/moderateneeds, the ‘services’ most frequentlymentioned by interviewees includedinformation and advice, signposting toother agencies/services, reablement,community equipment, minor houseadaptations and telecare. These ‘services’are found in all authorities. Information andadvice, often developed in partnership withthird sector organisations, is also identifiedin the literature as a central component ofthe universal offer provided by localauthorities (Henwood, 2012). Interventionssuch as reablement, equipment,
adaptations and telecare were consideredby local authorities as “targeted universalservices”, and a core part of the offer topeople whose needs were below eligibilitythresholds but for whom there was aconcern about the risk of deterioration inthe absence of support.
Interviewees frequently highlighted thatservices provided by the voluntary sectorwere seen as paramount for supportingpeople with low/moderate needs and it wasthese services that people were signpostedto. Key examples of these services includeschemes targeting loneliness, such asbefriending schemes and variouscommunity groups that are free of charge,
and chargeable schemes such ashandyman services. Exemplifying theimportance of the voluntary sector, onelocal authority reported that it haddeveloped a strength-based community-led support model, whereby they supportedand collaborated with numerous voluntaryorganisations to identify and supportpeople with low needs:
“we are looking at a far deeper level how wecan engage with local people andcommunities and community leaders, to reallyexplore the role of social action as a route tosolve some quite deep problems aroundhealth and social care [the goal is] to supportthem [people with social care needs] to staystrong in their communities and seekcommunity solutions …and connecting withmore local social networks and agenciesrather than coming into paid services”
[LA5, R1]
Interviewees reported “innovative”approaches to supporting people withlow/moderate needs and stressed theimportance of evaluating theireffectiveness. Services such as local areacoordinators and social prescribing wereseen as crucial to enabling access to thefull range of local support options and to
addressing low level non-medical needs.Other services mentioned included “familyplanning time”, organised and supported bysocial care practitioners to supportindividuals with low/moderate needs to livemore independently. This service involves apractitioner meeting the family, neighboursand/or unpaid carers to support them toplan how to meet the needs of anindividual. We came across a number ofother examples of innovative schemes onlocal authority websites, indicatingsignificant variety in the offer for supportacross local authorities.
The academic literature review, review oflocal authority documents and website andthe interviews also suggested that somelocal authorities continue to providepractical help, e.g. gardening, shopping orcleaning to some people withlow/moderate needs. Some localauthorities provide community transportand/or shop mobility schemes for olderand disabled people to enable them to takepart in activities available locally, healthcare visits or shopping, and other areascontinue to offer laundry and other low-level services, although all of these servicesmay involve user charges.
In addition, local authorities reported thatthere was help available for carers, often inthe form of information and advice, andreferral to community services.
15
RECOMMENDATIONS: SEQUELS TO CONTACT FOR PEOPLE WITH LOW NEEDS
n The core service offer to people with low/moderate needs is relatively consistent across councils, and includesinformation and advice, signposting to voluntary sector services and short-term targeted interventions, includingreablement, equipment, telecare and adaptations. Understanding the role of these services in supporting people withlow/moderate needs will be of central importance to the main study.
n There seems to be great variety in the availability of innovative and voluntary sector schemes across local authorities.The extent and effectiveness of such schemes will be critical to the effectiveness of signposting activities by localauthorities. It will be important, but challenging, to map and record these more innovative and variable ‘services’ in the mainstudy.
n Low-level services that may previously have been considered ‘home help’, transport and housing support / maintenanceservices are also important for people with low/moderate needs. They are likely to be offered in different ways by localauthorities and this variation as well as the use of these services should be mapped and recorded in the main study.

3.3.4 DATA COLLECTED BY LOCAL AUTHORITIES ABOUT PEOPLE CONTACTING THEM
The types of outcomes following an initialcontact with the local social care systemwere relatively consistent across theauthorities we spoke to, but the recordingof these outcomes and the levels ofprovision of different types of supportdiffered, reflecting the various assessmentarrangements described in 3.3.2. Forexample, reablement services were moreprevalent in areas that route individualsthrough these services as part of the initialassessment process. These variations incare models are reflected in nationalstatistics (see analyses of local authorityreturns in Section 3.4).
The degree of information recorded wasfound to vary depending on the extent towhich potential service users progressedthrough the various assessment levels anddepending on whether the sequel tocontact (and assessment) resulted in thereceipt of a service or in referral away fromsocial care services. All authorities reportedto collect information about people whocontacted them, although one informantnoted that the information on person’sneeds, type of information and advicereceived, and signposting would notnecessarily be recorded consistently. Othercouncils recorded a significant amount ofinformation on individuals’ needs. Mostlocal authorities we spoke to reported tohave standard procedures and forms toconduct the initial assessment and toprovide staff with regular training toundertake initial assessments. In suchcases, information about all contacts wasrecorded in the system with varyingdegrees of detail. Typically, initial contactsare recorded as a care episode, withsubsequent, linked care episodes recordedwhen individual contacts again theauthority at a later date. In one authority,respondents reported not to use astandardised form to conduct the initialassessment.
In terms of the evidence from the literature,earlier studies have reported that councilstend not to monitor what happens toindividuals signposted to other services(CSCI, 2008; Henwood, 2012). Generally,respondents confirmed that councils werenot able to track whether individuals weresignposted to other services, and if theywere, whether people followed the adviceand indeed received any services in the
community. However, one of the localauthorities interviewed reported to record ifand where an individual was signposted atthe first point of contact, and if the sameperson came back to the council within 6month-period they were able to link theirrecords. The same council produced amonthly document reporting thepercentage of people signposted to otherproviders who returned to the LA within sixmonths of contact.
Central government has set detailedrequirements for the recording of sequelsto first contact, as part of the Short AndLong-Term (SALT) data return. In addition,some authorities collect more detailedinformation than required for these returns.One of the local authorities we spoke to, forexample, recorded the followinginformation regarding sequel following firstcontact:
• No further action
• Information and advice only
• Signposted to health services
• Signposted to other external agencies
• Action required via CommunityEquipment Service
• Referral for assessment, which couldlead to: – Full social care eligibility assessment– Signposted to other services – OT/Sensory needs assessment only– Housing and outreach assessment only– No services provided
Whereas councils reported to provide arange of interventions to support peoplewith low and moderate needs, thecollection and evaluation of data aboutthese services are variable. For example,individuals who received reablement wereoften monitored to understand if theyreturned to social care within a short time-frame; similarly, information on equipmentprovided was also gathered. Data aboutresidents re-directed to other services andvoluntary organisations were however notalways monitored. One authority reportedto keep records of individuals with low levelneeds who were signposted to communityservices for two years. As a result, thecouncil was able to track whetherindividuals returned within that time period.
16

However, the informant mentioned thatalthough they record outcomes of an initialassessment (e.g. what information andadvice was provided), it was “difficult tocollect this information consistently... it is alittle bit of free text…” (LA3, R1). In general,these data would not be sufficient to carryout an evaluation of the costs and benefitsof the support provided to people with lowand moderate social care needs. Theymight, however, provide a useful additionalsource of evidence to complementpotential primary data collections.
Some of the sampled authorities monitoredthe volumes of customers classified ashaving low level needs coming fromspecific geographical areas and used thatinformation to plan the commissioning ofsupport. One council reported to conduct asurvey among a subsample of individualswho contacted the LA, including those whowere signposted to voluntary sectororganisations, hence the council was ableto track some of those individuals. Otherinformants reported to collect limited data
on services and outcomes in relation topeople with low-level needs, some reportedto collaborate with a number of Universitiesin order to evaluate services such as localarea collaborators or social prescribing. Itwas also noted that it is important tomeasure the impact of social care supportfor people with low level needs on healthcare resources such as hospital and A&Eadmissions, because older people tend tobe intensive users of health services;however it was often noted that local datacurrently does not allow for suchevaluations (partly because councils tendnot to share data with health partners).
Some respondents mentioned that theycollect NHS numbers at the first point ofcontact, other authorities however did notdo so systematically (some collected NHSnumbers only if the request for assessmentcame from a GP or hospital etc.). Overall,none of the sampled councils reported toevaluate the consequences of support forpeople with low level needs across healthand social care.
17
RECOMMENDATIONS: DATA ABOUT PEOPLE WHO CONTACT LOCAL AUTHORITIES
n It will be important for the main study to ascertain whether authorities involved in the study collect data about those whocontact the website, even if as a result they are signposted away from the council.
n Most authorities seemed to collect data about individuals who make contact with the first contact team (see Section3.3.4 for some examples of the type collected). However, this data might not contain the information necessary for thetriaging of cases into the main study, and therefore additional information collection by the council at the point of firstcontact would need to be agreed with the participating areas in the study.
n Individual-level information regarding the utilisation of certain services is collected by councils, and might complementany primary data collection by the main study.
n The study should aim to assess the impact of different sequels to contact for individuals and their carers. In somesituations, e.g. where people are signposted to other services (including voluntary sector and health), local authorities do nottrack what happens to the individuals. This may make it challenging to assess outcomes for these individuals withoutcollecting primary data directly from them.

3.4 IDENTIFYING SUPPORT MODEL TYPOLOGIES:ANALYSIS OF LOCAL AUTHORITY CONTACTS, ACTIVITY AND SUPPORTPATTERNS
The aim of this section is to understand, using local authority-level data, the extent ofdifferences in local types and levels of support for people with low/moderate needs. Itsfinal objective is to assess whether differences in ‘care models’ could be used to definetypologies which could guide the selection of authorities for the main study. The results ofthe analysis, and the extent to which they identify authorities with distinct approaches forsupporting people with low/moderate needs would need to be confirmed with key localstakeholders in the authorities identified for inclusion in the study during the early stagesof the selection process.
3.4.1 LOCAL SOCIAL CARE VARIABILITY
Though the increased concentration ofresources over time on the neediest casesis common across English local authorities,patterns of provision vary substantially, asillustrated using 2015/16 data in Figure 3.This significant variability in serviceprovision is important for the main study,as it means that different authorities mightbe identified to evaluate the consequencesof alterative care models, and in so doingunderstand the implications of the changesin service provision observed acrossEngland overall. Specifically, it would bepossible to compare patterns of supportand care outcomes between more/lessgenerous authorities, and betweenauthorities with different strategies forsupporting older people with low/moderate
care needs, in order to understand the likelyconsequences on the social care systemoverall of the observed reductions in coresocial care packages.
As the main study will involve only asample of the 152 CASSRs in England, theselection of authorities in the study shouldaim to illustrate a range models of support,for instance in terms of the proportion ofthe population that receives state-fundedsupport. Ideally, the selection criteria forlocal authorities should reflect their currenttargeting of resources – how ‘generous’they are in terms of care provision – butalso the extent to which their provision haschanged in recent years in response todemographic, political and fiscal pressures.
18
FIGURE 3: DISTRIBUTION OF LOCAL AUTHORITY CLIENT NUMBERS AND EXPENDITURE RELATIVE TO NATIONAL AVERAGE –RANKED INDEPENDENTLY BY LOCAL AUTHORITY (2015/16)
Net current expenditure on adult social care per capitaOlder clients (residential care) per capitaOlder clients (total) per capita
2.5
2.0
1.5
1.0
0.5
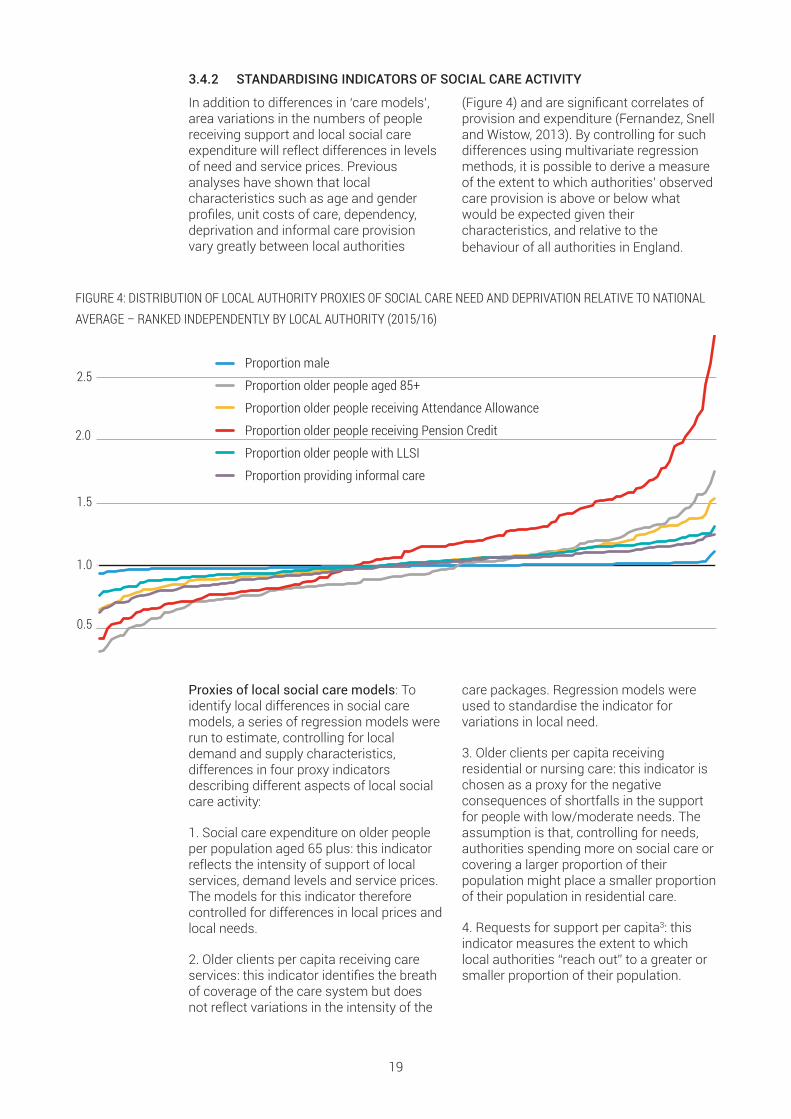
3.4.2 STANDARDISING INDICATORS OF SOCIAL CARE ACTIVITY
In addition to differences in ‘care models’,area variations in the numbers of peoplereceiving support and local social careexpenditure will reflect differences in levelsof need and service prices. Previousanalyses have shown that localcharacteristics such as age and genderprofiles, unit costs of care, dependency,deprivation and informal care provisionvary greatly between local authorities
(Figure 4) and are significant correlates ofprovision and expenditure (Fernandez, Snelland Wistow, 2013). By controlling for suchdifferences using multivariate regressionmethods, it is possible to derive a measureof the extent to which authorities’ observedcare provision is above or below whatwould be expected given theircharacteristics, and relative to thebehaviour of all authorities in England.
19
FIGURE 4: DISTRIBUTION OF LOCAL AUTHORITY PROXIES OF SOCIAL CARE NEED AND DEPRIVATION RELATIVE TO NATIONALAVERAGE – RANKED INDEPENDENTLY BY LOCAL AUTHORITY (2015/16)
Proxies of local social care models: Toidentify local differences in social caremodels, a series of regression models wererun to estimate, controlling for localdemand and supply characteristics,differences in four proxy indicatorsdescribing different aspects of local socialcare activity:
1. Social care expenditure on older peopleper population aged 65 plus: this indicatorreflects the intensity of support of localservices, demand levels and service prices.The models for this indicator thereforecontrolled for differences in local prices andlocal needs.
2. Older clients per capita receiving careservices: this indicator identifies the breathof coverage of the care system but doesnot reflect variations in the intensity of the
care packages. Regression models wereused to standardise the indicator forvariations in local need.
3. Older clients per capita receivingresidential or nursing care: this indicator ischosen as a proxy for the negativeconsequences of shortfalls in the supportfor people with low/moderate needs. Theassumption is that, controlling for needs,authorities spending more on social care orcovering a larger proportion of theirpopulation might place a smaller proportionof their population in residential care.
4. Requests for support per capita3: thisindicator measures the extent to whichlocal authorities “reach out” to a greater orsmaller proportion of their population.
Proportion providing informal care
Proportion older people receiving Attendance Allowance
Proportion older people with LLSI
Proportion older people receiving Pension Credit
Proportion older people aged 85+
Proportion male2.5
1.0
1.5
2.0
0.5
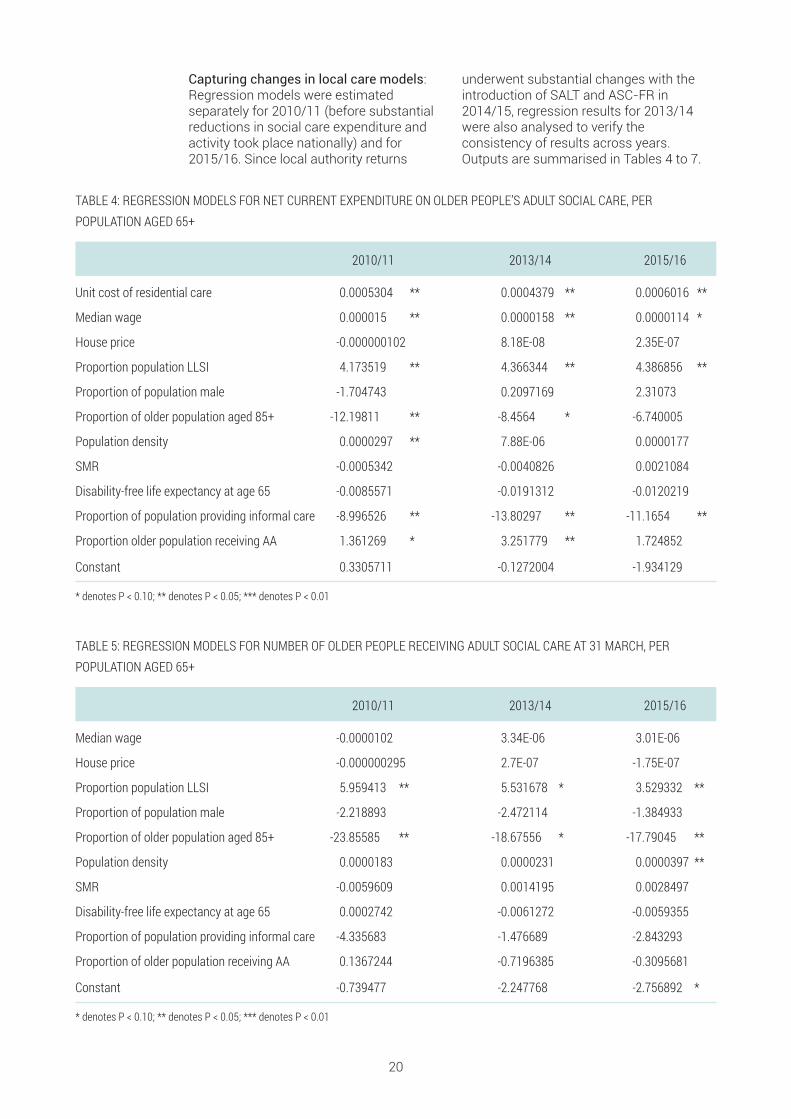
Capturing changes in local care models:Regression models were estimatedseparately for 2010/11 (before substantialreductions in social care expenditure andactivity took place nationally) and for2015/16. Since local authority returns
underwent substantial changes with theintroduction of SALT and ASC-FR in2014/15, regression results for 2013/14were also analysed to verify theconsistency of results across years.Outputs are summarised in Tables 4 to 7.
20
TABLE 5: REGRESSION MODELS FOR NUMBER OF OLDER PEOPLE RECEIVING ADULT SOCIAL CARE AT 31 MARCH, PERPOPULATION AGED 65+
2010/11 2013/14 2015/16
Median wage -0.0000102 3.34E-06 3.01E-06
House price -0.000000295 2.7E-07 -1.75E-07
Proportion population LLSI 5.959413 ** 5.531678 * 3.529332 **
Proportion of population male -2.218893 -2.472114 -1.384933
Proportion of older population aged 85+ -23.85585 ** -18.67556 * -17.79045 **
Population density 0.0000183 0.0000231 0.0000397 **
SMR -0.0059609 0.0014195 0.0028497
Disability-free life expectancy at age 65 0.0002742 -0.0061272 -0.0059355
Proportion of population providing informal care -4.335683 -1.476689 -2.843293
Proportion of older population receiving AA 0.1367244 -0.7196385 -0.3095681
Constant -0.739477 -2.247768 -2.756892 *
* denotes P < 0.10; ** denotes P < 0.05; *** denotes P < 0.01
TABLE 4: REGRESSION MODELS FOR NET CURRENT EXPENDITURE ON OLDER PEOPLE’S ADULT SOCIAL CARE, PERPOPULATION AGED 65+
2010/11 2013/14 2015/16
Unit cost of residential care 0.0005304 ** 0.0004379 ** 0.0006016 **
Median wage 0.000015 ** 0.0000158 ** 0.0000114 *
House price -0.000000102 8.18E-08 2.35E-07
Proportion population LLSI 4.173519 ** 4.366344 ** 4.386856 **
Proportion of population male -1.704743 0.2097169 2.31073
Proportion of older population aged 85+ -12.19811 ** -8.4564 * -6.740005
Population density 0.0000297 ** 7.88E-06 0.0000177
SMR -0.0005342 -0.0040826 0.0021084
Disability-free life expectancy at age 65 -0.0085571 -0.0191312 -0.0120219
Proportion of population providing informal care -8.996526 ** -13.80297 ** -11.1654 **
Proportion older population receiving AA 1.361269 * 3.251779 ** 1.724852
Constant 0.3305711 -0.1272004 -1.934129
* denotes P < 0.10; ** denotes P < 0.05; *** denotes P < 0.01

As expected, increased levels of limitinglong-standing illness (LLSI) and highconcentrations of older people aged 85 orabove are significantly correlated withincreased numbers of older clients percapita across all time points. Social careexpenditure was also found to increasewith unit costs (proxied by weekly costs ofresidential care), and median wage levels,while levels of informal care provision(using population-weighted Censusfigures) were negatively correlated withper-capita expenditure.
It is possible to define an indicator of thelocal authority proportional deviation instandardised social care activity as follows:
Equation 1
Dis = Ois– Pis –1Pis
where Ois represents the observed level ofsocial care activity for authority i and socialcare activity indicator s and Pis representsthe predicted level of social care activity for
21
TABLE 7: REGRESSION MODELS FOR NUMBER OF OLDER PEOPLE IN RESIDENTIAL OR NURSING CARE AT 31 MARCH, PERPOPULATION AGED 65+
2010/11 2013/14 2015/16
Median wage -0.00000238 9.26E-07 4.07E-06
House price -0.000000433 -3.24E-07 -9.83E-08
Proportion pop LLSI 7.05676 ** 6.885921 ** 5.871257 **
Proportion of older population aged 85+ -8.409454 -4.605904 -5.111056
Pop density 0.00000292 3.18E-06 2.57E-06
SMR 0.0024461 0.00615 * 0.0090616 **
Disability-free life expectancy at age 65 0.0028166 0.0149922 0.0170819
Proportion of population providing informal care -14.07065 ** -12.1217
Constant -3.727731 ** -4.685319 ** -5.37927
* denotes P < 0.10; ** denotes P < 0.05; *** denotes P < 0.01
TABLE 6: REGRESSION MODELS FOR NUMBER OF REQUESTS FOR SUPPORT AT 31 MARCH, PER POPULATION AGED 65+
2015/16
Median wage 3.68E-06
House price -1.56E-07
Proportion pop LLSI 3.443115 **
Proportion of older population aged 85+ -17.54111 **
Population density 0.0000396 **
SMR 0.0032267
Disability-free life expectancy at age 65 -0.0038021
Proportion of population providing informal care -2.821065
Constant -3.49789 **
* denotes P < 0.10; ** denotes P < 0.05; *** denotes P < 0.01
CAPITA?

authority i and social care activity indicators, controlling for local characteristics. Dtherefore indicates the proportional excess(for positive values) or shortfall (fornegative values) in social care activityrelative to the average behaviour inEngland. The distributions of local authorityproportional deviations in standardised
social care activity for the four social careindicators considered and using 2015/16data are shown in Figure 5. The figuresuggests significant local variability for thefour indicators considered, even afterstandardising for variations in local needsand unit costs.
22
FIGURE 5: DISTRIBUTIONS OF LOCAL AUTHORITY PROPORTIONAL DEVIATIONS IN STANDARDISED SOCIAL CARE ACTIVITY(2015/16)
Proportion providing informal care
Proportion older people receiving Attendance Allowance
Proportion older people with LLSI
Proportion older people receiving Pension Credit
Proportion older people aged 85+
Proportion male2.5
1.0
1.5
2.0
0.5
Note: Local authorities are ranked independently for each indicator.
An additional consideration that could betaken into account during the selection ofauthorities for the main study is the extentto which local authorities’ activity haschanged in recent years. Figure 6 reportsauthority-level values of in 2010/11,2013/14 and 2015/16 for the indicator ofnet current expenditure (equivalent tablesfor the other three indicators in the analysisare included in Annex 1). Values of arecolour-coded such that cells range fromred (negative values, denoting lower-than-expected activity) to green(higher-than-expected activity).
Figure 6 splits authorities into two columnsaccording to the absolute change in Dbetween 2010/11 and 2015/16. The left-hand column shows the 50% of authoritieswith the smallest change in D (the mostconsistent deviations) over the period.
Authorities are ordered according to theirmean value of D across years, such thatauthorities with consistently lower-than-expected expenditure (red) are located atthe top of the distribution and those withconsistently higher-than-expectedexpenditure (green) at the bottom. Theright-hand column shows the 50% ofauthorities with the highest absolutechange in D (the most variable deviations).Authorities in this column are orderedaccording to the difference in D betweentime points, whereby those at the top of thedistribution move from lower- to higher-than-expected activity, and those at thebottom from higher- to lower-thanexpected activity. The circles in Figure 6show how this approach could be used toidentify different types of authorities takingboth cross-sectional and longitudinalconsiderations into account.

23
FIGURE 6: RESIDUAL RELATIVE TO PREDICTED NET CURRENT EXPENDITURE PER CAPITA ON OLDER PEOPLE’S ADULT SOCIALCARE, SELECTED YEARS

3.4.3 USING LATENT CLASS ANALYSIS TO DERIVE LOCAL TYPOLOGIES
We have used latent class analysis (LCA) tocreate typologies of authorities whichsynthesise information regarding localsupport models from the four social careactivity indicators used in the analysis.
LCA is usually applied to identifyunobserved groups (in this case of localauthorities) based on commonalitiesacross a range of categorical indicators. Toachieve this, the values for each of the fourindicators were collapsed into terciles –broadly classing authorities as ‘lower thanexpected’, ‘similar to expected’ or ‘higherthan expected’ for each measure4. Thelatent class analysis was thereforeconducted using categorical indicatorswhich split local authorities into terciles forthe following measures:
Using these indicators , three classes oflocal authority were derived, eachcomprising 50 councils (City of London andthe Isles of Scilly were excluded because ofinsufficient sample sizes).
Table 8 summarises, for each of the servicemeasures included in the LCA process, themean rank within each class (whereby 1 –the minimum rank – denotes the authoritywith the lowest value relative to predictedand 150 – the maximum rank – the highestrelative to predicted). Also shown are themean differences in rank relative to2010/11, whereby positive numbersdenotes an increase in residual to expectedvalues relative to other authorities andnegative numbers a decrease.
4 Residual relative to predicted values werenormally distributed for all measures, such that aresidual of zero was closely aligned to the midpointof the central tercile.
24
Di for net expenditure in year 2015/16
Difference in the ranking of Di for net expenditure from 2010/11 to 2015/16
Di for total clients in year 2015/16
Difference in the ranking of Di for total clients from 2010/11 to 2015/16
Di for institutional clients in year 2015/16
Difference in the ranking of Di for institutional clients from 2010/11 to 2015/16
Di for requests for support in year 2015/16
For the change indicators, we used LA ranks of the indicators rather than the indicators directly in order to address changes inthe definition of the data between years.
TABLE 8: MEAN RANK OF RELATIVE TO PREDICTED VALUES FOR SELECTED SERVICE MEASURES (2015/16) AND CHANGE INRANK FROM 2010/11 TO 2015/16
Class 1 Class 2 Class 3
Expenditure Mean rank 2015/16 59 65 101 Mean change in rank 2010/11 to 2015/16 -4 -14 +18
Clients Mean rank 2015/16 25 75 125 Mean change in rank 2010/11 to 2015/16 -36 +1 +41
Residential clients Mean rank 2015/16 49 77 100 Mean change in rank 2010/11 to 2015/16 -16 +3 +13
Requests for support Mean rank 2015/16 25 75 125

Table 8 and the corresponding histogramsin Annex 1 show the composition ofclasses to reflect important differencesacross the four indicators of social careactivity used in the analysis, but particularlyin terms of the indicators of per capitanumbers of clients and of numbers ofrequests for support. Accordingly, it wouldbe possible to interpret the three classes ofauthorities as:
Class 1: Numbers of clients and requestsfor support LOWER than expected
Class 2: Numbers of clients and requestsfor support IN LINE WITH expectations
Class 3: Numbers of clients and requestsfor support HIGHER than expected
Table 9 shows the distribution ofauthorities in the three classes across localauthority type and ONS family of authority,and Figure 7 depicts their geographicaldistribution across England. Overall, theevidence suggests that the three types ofauthorities are fairly well distributedgeographically as well as across types ofareas.
25
TABLE 9: CLASS MEMBERSHIP BY LOCAL AUTHORITY TYPE AND ONS FAMILY
Class 1 Class 2 Class 3
Local authority type Inner London 3 6 4 Metropolitan district 15 10 11 Outer London 5 8 6 Shire County 12 11 6
Unitary Authority 15 15 23
ONS family Centres with Industry 6 7 5 Coastal and Countryside 2 4 3 Industrial Hinterlands 4 4 9 London Centre 2 2 3 London Cosmopolitan 1 4 2 London Suburbs 2 5 5 Manufacturing Towns 6 3 3 New and Growing Towns 2 3 3 Prospering Smaller Towns 12 10 9 Prospering Southern England 5 3 2
Regional Centres 5 3 5
Thriving London Periphery 3 2 1
Totals 50 50 50
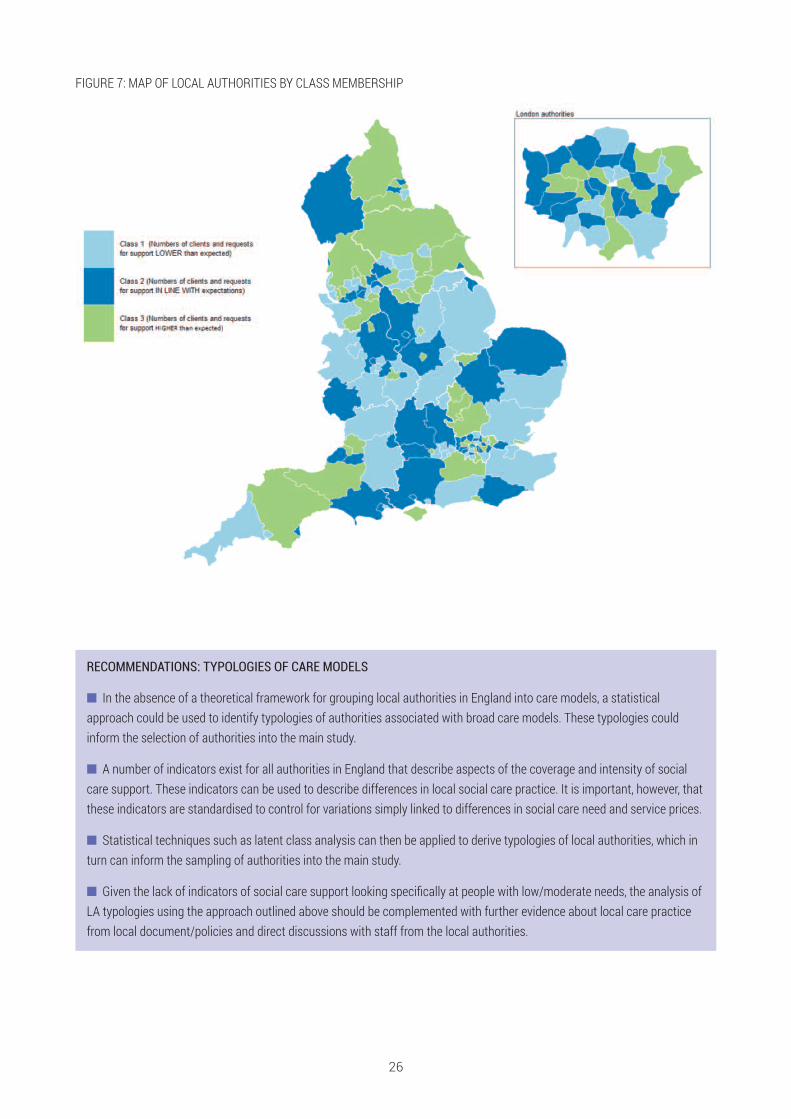
26
FIGURE 7: MAP OF LOCAL AUTHORITIES BY CLASS MEMBERSHIP
RECOMMENDATIONS: TYPOLOGIES OF CARE MODELS
n In the absence of a theoretical framework for grouping local authorities in England into care models, a statisticalapproach could be used to identify typologies of authorities associated with broad care models. These typologies couldinform the selection of authorities into the main study.
n A number of indicators exist for all authorities in England that describe aspects of the coverage and intensity of socialcare support. These indicators can be used to describe differences in local social care practice. It is important, however, thatthese indicators are standardised to control for variations simply linked to differences in social care need and service prices.
n Statistical techniques such as latent class analysis can then be applied to derive typologies of local authorities, which inturn can inform the sampling of authorities into the main study.
n Given the lack of indicators of social care support looking specifically at people with low/moderate needs, the analysis ofLA typologies using the approach outlined above should be complemented with further evidence about local care practicefrom local document/policies and direct discussions with staff from the local authorities.
The previous section reviews key indicators which would need to be collected in the mainstudy in order to evaluate the costs and benefits of different support models for peoplewith low/moderate social care needs. The review covers indicators of need, services andoutcomes for service users and outcomes. The discussion below is based on a review ofkey evaluations that have investigated similar groups of users to the proposed main study.Where relevant we have also included reflections on the suitability of different indicatorsprovided by interviewees from local authorities.
4.1 RAPID REVIEW OF SOCIAL CARE EVALUATIONSAND FRAILTY LITERATURE We conducted a rapid review of evaluationsof the impact of social care services onindividuals and carers using combinationsof the following search terms: evaluation;social care; unmet need; low need;moderate need; long interval need;prevention; older people; eligibility;community care; little bit of help; low levelsupport; informal care, unpaid care, careassessment, specific interventions (e.g.adaptations, reablement, information andadvice, social isolation, falls). Additionalsearches were conducted at later stages toexplore indicators of independence/abilityto cope using the following search terms:independence, strength-based, asset-based approaches, house of care model,coping indicators, capability measurement,capacity building. Literature andevaluations around local area coordinatorsand capacity building were also explored.
The search sites used in the reviewincluded: Google Scholar, Google, ADASS,LGA, Age UK, Carers UK, Think Local ActPersonal. The literature thus identified was
complemented with researchers’professional knowledge of existingliterature. A template was used to extractrelevant data on study design, indicators ofneeds outcomes, services and costs, andmethods of analyses. Overall, 13 relevantevaluation studies were explored using thetemplate.
For the review of the frailty literature,Google scholar and PubMed were initiallysearched, followed by hand-searches ofpublications identified in the first place. Keywords included: risk factors in frailty, frailtyin older adults, risk factors for falls in theelderly/older adults, risk factors infunctional status, risk factors for physicaldecline. Reviews of studies were searchedfor in the first instance, as they encompassand summarise evidence from a number ofstudies. Individual studies were searchedfor and added to the review to complementany findings from reviews. Twenty-sevenpapers, both reviews and individual studieson the topic were included in the final rapidreview presented here.
27
4 SURVEY CONTENT

4.2 KEY NEED-RELATED CHARACTERISTICS OFTHE MAIN STUDY POPULATIONWe approached the question of how best tomeasure low/moderate needs from anumber of angles.
1. We reviewed the academic literature tounderstand how evaluations andresearch studies in England ofcommunity-based social care hadconceptualised and measured socialcare need, and in particular we looked forevidence about how well thesemeasures distinguished and identifiedcare and support needs among peoplewith low/moderate needs.
2. We reviewed the concept of frailty, givenits relevance to the main studypopulation, how this has been measured
and its value for identifyinglow/moderate care needs.
3. examined the literature around falls,focusing particularly on risk factors forfalls, given the importance of falls as arisk factor for entry into the social caresystem.
4. We reviewed local authority assessmentforms to identify indicators used bysocial work professionals to assess andidentify care and support needs.
Each of these reviews are discussed in turnbelow. We conclude this section with somerecommendations for the measurement oflow/moderate needs for the main study.
4.2.1 GENERAL INDICATORS OF NEED FOR CARE AND SUPPORT
Overall, evaluations and research studies ofsocial care users tended to measure needin terms of functional ability, usuallycapturing functional ability in relation tospecific Activities of Daily Living (ADLs,such as getting dressed, in/out of a chair,washing, eating and walking) andInstrumental Activities of Daily Living(IADLs, such as ability to manage finances,shopping and housekeeping) (Kennedy,2001; Caiels et al., 2010; Vlachantoni et al.,2011, 2015; Thompson et al., 2014;Dunatchik et al., 2016; NatCen SocialResearch and Ipsos MORI, 2017).
Studies used different ways of measuringfunctional ability. Most studies used directmeasures of problems with ADLs andIADLs (e.g. Katz ADLs, Townsend, Barthel).Some studies estimated dependency usingIsaacs and Neville’s interval measures,which measure the frequency andpredictability of episodes of assistance withactivities of daily living (Isaacs and Neville,1975). The authors argue that this measureprovides greater insight into the level ofcare needs than a count of limitations with(I)ADLs. The interval measure produces atripartite scoring of dependency: lowdependency (care less than daily), mediumdependency (care at set times daily), highdependency (24-hour care) (Kingston et al.,2017).
Measures of functional ability are goodindicators of receipt of formal social careand informal support and the intensity ofthat support (Wittenberg and Hu, 2015).Vlachantoni et al. (2015) found that thenumber of ADLs and IADLs a person haddifficulty with were the strongest predictorsof receiving state supported social care andamong people who had difficulty with fourto six ADLs, the odds of receiving statesupport were three times the odds amongpeople experiencing no such difficulty.
It is also the case that measures offunctional ability can be used todifferentiate types of care received. Forexample, studies have found that peoplewho received state help were more likely toreport difficulties with ADLs, whereasindividuals with IADLs difficulties weremore likely to receive privately paid helpthan those with ADLs (NatCen SocialResearch and Ipsos MORI, 2017;Vlachantoni et al., 2011).
It was noted in the literature that reliance onADL and IADLs for identifying care needsmay exclude people who have needs forsupport around, for example, socialinteraction (NatCen Social Research andIpsos MORI, 2017; see also West SussexLINk, 2012). Interviews with local authoritystaff confirmed that needs for socialinteraction are important for older people
28

who do not receive statutory services andthat therefore this is an important additionalaspect of need to measure among peoplewith low/moderate needs. Other indicatorsmay be useful, and studies of social careusers have also included questionsdesigned to measure needs around safety
and occupation. Additionally, research hasindicated the value of measuring livingarrangements for predicting needs for careand support — being single was morestrongly associated with receiving statesupport than being married or widowed(Vlachantoni et al., 2015).
29
RECOMMENDATIONS: INDICATORS OF GENERAL NEED
n In the absence of a theoretical framework for grouping local authorities in England into care models, a statisticalapproach could be used to identify typologies of authorities associated with broad care models. These typologies couldinform the selection of authorities into the main study.
n A number of indicators exist for all authorities in England that describe aspects of the coverage and intensity of socialcare support. These indicators can be used to describe differences in local social care practice. It is important, however, thatthese indicators are standardised to control for variations simply linked to differences in social care need and service prices.
n Statistical techniques such as latent class analysis can then be applied to derive typologies of local authorities, which inturn can inform the sampling of authorities into the main study.
n Given the lack of indicators of social care support looking specifically at people with low/moderate needs, the analysis ofLA typologies using the approach outlined above should be complemented with further evidence about local care practicefrom local document/policies and direct discussions with staff from the local authorities.
4.2.2 THE CONCEPT OF FRAILTY AND ITS MEASUREMENT
Frailty is considered highly prevalentamong the older population and is likely tobe a key factor leading individuals to initiatea contact with their local council. It istherefore an important concept to measurein the main study. Below we provide a briefoverview of the different frailty indicatorswhich could be employed in a future study.
A recent study confirmed considerabledifferences in understandings of theconcept of frailty among social carepractitioners. For example, somepractitioners consider dementia as ‘mentalfrailty’. Conversely, the term ‘frail’ did notappear to be associated by social careprofessionals with alerts of risk of physicaldecline, which could have implications forassessment processes (Stevens et al.,2010; Manthorpe et al., 2018).
Although definitions of frailty are contested,overall the concept relates to fluctuatedfunction with minor environmentaldisturbances (e.g. physical andpsychosocial stresses), and risk of loss, orfurther loss, of function. A frail person is at
a higher risk of compromised function fromminor environmental changes, andtherefore, disability and death (Ambrose,Paul and Hausdorff, 2013). As theinteraction between the individual and theenvironment is vital to frailty, four essentialcomponents of frailty were suggested(Campbell and Buchner, 1997), for whichmeasures were developed accordingly(Table 10).
One of the most validated frailty models(Alexandre et al., 2016) defined frailty as“biologic syndrome of decreased reserveand resistance to stressors, resulting fromcumulative declines across multiplesystems, causing vulnerability to adverseoutcomes” (Espinoza and Fried, 2007). Themodel was cross-validated in a longitudinalstudy of older women (Bandeen-Roche etal., 2006) and by Woods et al. (2005), inwhich the definition was shown as stronglypredictive of ADLs disability,hospitalisation/ nursing home entry anddeath.

Another common measure is the frailtyindex developed by Rockwood et al (2005).Rockwood et al. (2007) compared thisphenotype-based definition to anothercommon definition of frailty, based on afrailty index (FI) score. Operationally, in thismodel individuals are identified as beingfrail if they meet more than two of thefollowing criteria (Fried et al., 2001; Xue,2011):
• Unintentional weight loss (no less than10 lbs or 5% of body weight in past year)
• Self-reported exhaustion
• Weakness (abnormal grip strength)
• Slow walking speed (TUG – Time Up andGo test >19 s)
• Low physical activity (unable to walk orneeds help to walk)
Instead of setting a single threshold forfrailty identification, a proxy measure offrailty (FI) has been proposed definedaround health status, and based on thecount of accumulated deficiencies such assymptoms and clinical impairments(Mitnitski, Mogilner and Rockwood, 2001).The two measures above have been foundto correlate moderately well with eachother (and with measures of function)(Rockwood, Andrew and Mitnitski, 2007).
De Vries et al. (2011) focused on thephysical, psychological and social domainsof frailty considering the following factors,which were assessed with frailtyinstruments: Nutritional status, Physical
activity, Mobility, Energy, Strength,Cognition, Mood, Social relations / socialsupport. By scoring the eight frailty factorsin three dimensions as listed above, DeVries et al assessed twenty frailtyinstruments including the frailty phenotype(Fried et al., 2001) and FI (Rockwood,Andrew and Mitnitski, 2007; De Vries et al.,2011). Clinical Global Impression of Changein Physical Frailty (CGIC-PF) included allfactors except for the cognition component(Studenski et al., 2004). This instrumentinvolves clinical judgement on 13 items(mobility, strength, social status, ADL,emotional status, perceived health,neuromotor, stamina, nutrition, balance,medical complexity, healthcare utilization,appearance) in multiple dimensions (DeVries et al., 2011).
There are several risk factors for functionaldecline in older people apart from ageing,e.g. obesity, alcohol consumption, socialisolation, low physical activity (Stuck et al.,1999). It has been shown that incidenceand determinants of the components offrailty are different between genders inolder adults. For example, unintentionalweight loss and slowness were the biggestcauses of frailty development for men up to74 years old; however, for women of all agegroups, exhaustion and low activity werethe most important factors (Alexandre etal., 2016).
Stuck et al. (1999) compiled 14 domains ofrisk factors for frailty and stratified them bystrength of evidence. Table 11 illustrates
30
TABLE 10: MEASURES OF THE COMPONENTS OF FRAILTY
Component Measurement
Musculoskeletal function Grip strength
Chair stand (Guralnik et al., 1994)
Aerobic capacity Sub-maximal treadmill
6 min walk (Guyatt et al., 1985)
Cognitive and integrative neurological function Mini-Mental State Examination (Folstein, Folstein and McHugh, 1975)
Static balance test (Guralnik et al., 1994)
Nutritional reserve Body mass index
Arm muscle area (Campbell et al., 1990)
Source: Campbell and Buchner (1997).
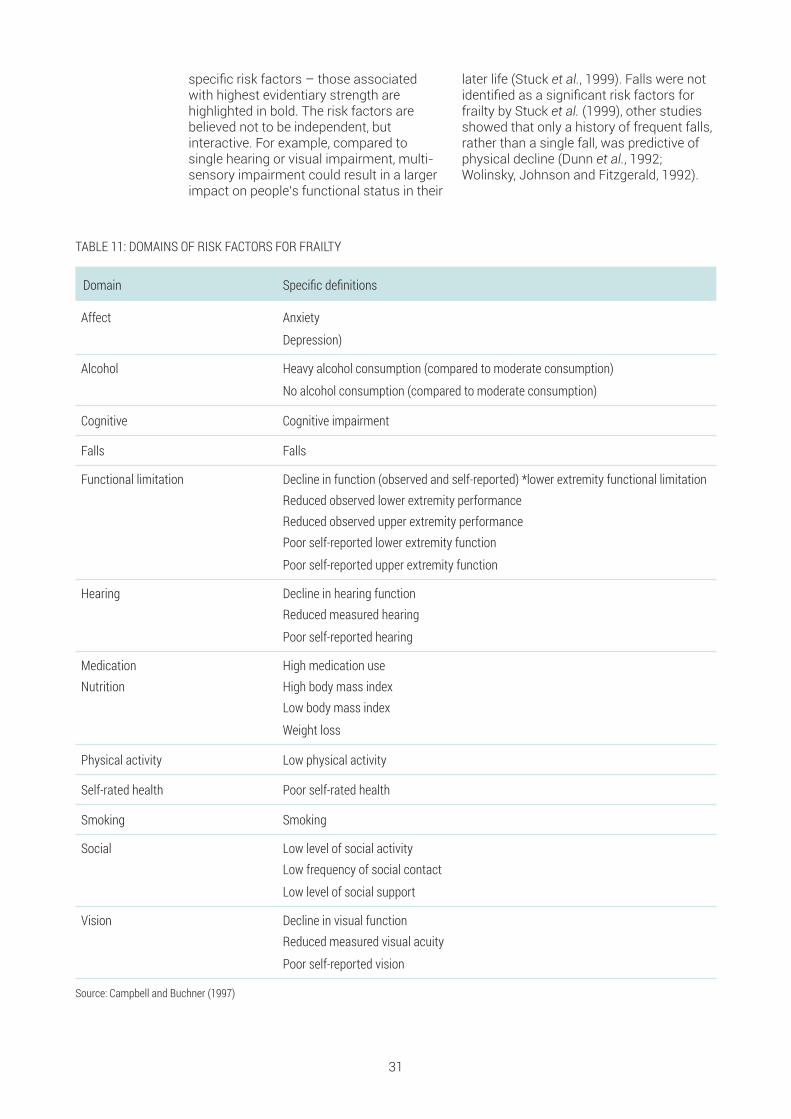
specific risk factors – those associatedwith highest evidentiary strength arehighlighted in bold. The risk factors arebelieved not to be independent, butinteractive. For example, compared tosingle hearing or visual impairment, multi-sensory impairment could result in a largerimpact on people’s functional status in their
later life (Stuck et al., 1999). Falls were notidentified as a significant risk factors forfrailty by Stuck et al. (1999), other studiesshowed that only a history of frequent falls,rather than a single fall, was predictive ofphysical decline (Dunn et al., 1992;Wolinsky, Johnson and Fitzgerald, 1992).
31
TABLE 11: DOMAINS OF RISK FACTORS FOR FRAILTY
Domain Specific definitions
Affect Anxiety
Depression)
Alcohol Heavy alcohol consumption (compared to moderate consumption)
No alcohol consumption (compared to moderate consumption)
Cognitive Cognitive impairment
Falls Falls
Functional limitation Decline in function (observed and self-reported) *lower extremity functional limitation Reduced observed lower extremity performance Reduced observed upper extremity performance Poor self-reported lower extremity function
Poor self-reported upper extremity function
Hearing Decline in hearing function Reduced measured hearing
Poor self-reported hearing
Medication High medication useNutrition High body mass index Low body mass index
Weight loss
Physical activity Low physical activity
Self-rated health Poor self-rated health
Smoking Smoking
Social Low level of social activity Low frequency of social contact
Low level of social support
Vision Decline in visual function Reduced measured visual acuity
Poor self-reported vision
Source: Campbell and Buchner (1997)

4.2.3 RISK FACTORS ASSOCIATED WITH FALLS
As noted above, history of falls can bepredictive of frailty and physical declineamong the older population. Overall, theacademic literature highlighted that fallswere characterised by multiple risk factors,and that both person-specific (intrinsic)
and environmental (extrinsic) factorsplayed a significant role, with the risk offalling increasing with the number of riskfactors present and with age (Ambrose,Paul and Hausdorff, 2013). The risk factorsare summarised in Table 12.
32
RECOMMENDATIONS: MEASURING FRAILTY
The literature review indicated that frailty is an important factor leading to ADL disability. A number of risk factors have beenidentified as having strong predictive evidence of frailty. The main study should explore collecting some of these indicatorsto standardise for frailty risk among older people. For example:
n Mini-Mental State Examination, BMI or ability to walk for 6 minutes, visual function etc. may be feasible to measure in themain study.
n However, physiological indicators such as grip strength may be challenging to measure as they would require aspecialised practitioner to carry out the assessment.
n The risk factors associated with frailty are interactive rather than independent, hence accounting for a number of riskfactors, rather than a single one, would provide a better predictive value for the study.
n Although falls were not found as significantly predictive of frailty by some studies, others highlighted that a history offrequent falls was predictive of physical decline.
TABLE 12: RISK FACTORS FOR FALLS AMONG OLDER PEOPLE
Risk factor Evidence
Demographicfactors
Age, gender and race are all identified as relevant to the risk of falling (Xue, 2011; Ambrose, Paul andHausdorff, 2013; Pfortmueller, Lindner and Exadaktylos, 2014).
The likelihood of falling increases with age due to physical decline and pathological changes. US datashows that the rate of fall-related injuries for adults aged 85 and over was almost four times that foradults aged 65–74 (Iinattiniemi, Jokelainen and Luukinen, 2009; Prevention, 2010).
In addition, men (relative to women) and white women (relative to other groups) had higher fatal injuries(Ambrose, Paul and Hausdorff, 2013).
Physical weakness:gait balance,muscle weakness
Physical weakness has been recognised as one of the most consistent, clinically important andstrongest risk factors for falls in older people (Rubenstein, 2006; Xue, 2011; Ambrose, Paul andHausdorff, 2013). It is usually characterised with, but not limited to, gait/balance disorders and lowerextremity/muscle weakness.
The presence of neurological gait abnormalities in older people, particularly unsteady and/orneuropathic gait, is a significant predictor of the risk of falls (Ambrose, Paul and Hausdorff, 2013).
Cognitive deficits Cognitive deficits, namely confusion, dizziness and depression, have also been widely recognised as arisk factor for falls (Stuck et al., 1999; Rubenstein, 2006; Xue, 2011; Ambrose, Paul and Hausdorff, 2013;Pfortmueller, Lindner and Exadaktylos, 2014). These symptoms can reflect diverse and often chronicclinical conditions such as dementia, cardiovascular disorders and certain medications and/or theirside effects.

4.2.4 ASSESSMENT OF CARE AND SUPPORT NEEDS BY SOCIAL WORKPROFESSIONALS
In general, local authorities usestandardised forms to assess the care andsupport needs and to identify desiredoutcomes of people approaching socialcare departments for support. We reviewedsingle assessment process (SAP) formsand assessment forms that were madeavailable to us, including online self-assessment forms, first contact/initialassessment forms received frominterviewees, and the full social careeligibility assessment forms, to explore theindicators that local authorities used toassess care and support needs. This reviewhas two purposes: (i) it provides someindication of data collected by localauthorities’ on low/moderate care andsupport needs, which could be used as asource of data for the main study; and (ii) it
provides further insight into the types ofindicators that are relevant for identifyinglow/moderate care and support needs.
Table 13 summarises the range of areas ofneeds included across the assessmentforms reviewed for this scoping study.Overall, the need information covered invarious forms across sampled councilsvaried considerably. Recent full eligibilityassessment forms as well as some onlineand first contact assessment forms closelyreflected dimensions of outcomes includedin the national eligibility criteria. Forexample, one sampled council in their firstcontact assessment form includedquestions on: ability to carry out activities ofdaily living such as washing/dressing;shopping; meals; housework; laundry. The
33
RECOMMENDATIONS: RISK FACTORS FOR FALLS
n There is overlap between risk factors for falls and frailty.
n Key need indicators include those related to physical weakness, cognitive deficits, clinical conditions and previous historyof falls. This supports the value in including a measure of frailty in the main study.
n The importance of environmental hazards as risk factors for falls is notable and given the relationship between theenvironment and functional ability, it seems important for the main study to consider measuring this aspect.
TABLE 12 (CONTINUED): RISK FACTORS FOR FALLS AMONG OLDER PEOPLE
Risk factor Evidence
Clinical conditions Multimorbidity, hypertension and COPD may be considered as particular warning signs for increasedrisk of falls (Pfortmueller, Lindner and Exadaktylos, 2014).
Additional risk factors include vision deficits, postural hypotension and vitamin D deficiency(Rubenstein, 2006; Ambrose, Paul and Hausdorff, 2013; Pfortmueller, Lindner and Exadaktylos, 2014).
History of falls, andwalking devices
Prior history of falls is a further risk factor as is use of a walking aid or assistive device (Rubenstein,2006; Ambrose, Paul and Hausdorff, 2013; Pfortmueller, Lindner and Exadaktylos, 2014).
Environmental fallshazards
Environmental fall hazards include house hazards such as poor fitting footwear, slippery floor or looserugs, tripping hazards, lack of stair railings or grab bars, unstable furniture, obstructed walkways andinadequate lighting.
Shoes with heels higher than 2.5cm were associated with a higher risk of falling compared to canvasshoes with an odds ratio of 1.9 (Ambrose, Paul and Hausdorff, 2013).

34
TABLE 13: AREAS OF NEEDS COVERED IN ASSESSMENT FORMS
Domain of need/life Indicators collected
Everyday tasks Food preparation, cooking Finances (e.g. managing/paying bills; social benefits uptake)Shopping Care of home/housework/laundry
Personal care Dressing Bathing and showering Personal hygiene (washing, shaving, hair washing) Dental and oral hygiene Eating and drinking, swallowing
Falls riskassessment
A history of any fall in the previous yearFour or more medications per dayA diagnosis of stroke or Parkinson’s DiseaseProblems with balance? Gait problemsAbility to rise from a chair of knee heightLow blood pressure If risks identified in following areas: alcohol, vision, hearing, mobility, environmental hazards
Mobility From independent (with equipment) to full time wheelchair user Transfers (bed, chair, toilet) Moving items around the house Use of stairs Access to property (get in and out of property) Mobility outside of house (e.g. getting into/out of car, short/long walks
Home environment/living conditions
Overall accommodation (e.g. appropriate, unsuitable)Poor lighting Inappropriate floor surface i.e., thick carpet with hoistRestricted space/obstacles/access difficultBed or chair either too high or too lowCold, hot or humid conditions, heating, water, gas, electricity Safety and risk (anything in your home that you worry about)
form also included questions on medicalhistory, ability to self-medicate, propertycharacteristics (e.g. bungalow, stairs,bathroom upstairs/downstairs), walkingaids used, transfers (bed, chair, toilet),sensory impairments, and other servicesinvolved in their care (e.g. district nurse, fallsteam etc). Other initial assessment formsincorporated questions on ability to carryout everyday tasks, mobility, nutrition, healthconditions, medication, sensory (particularlyvision and hearing) and history of falls.
Initial assessment forms tended to cover asubsection of outcomes based on socialcare eligibility regulations. Questions
around personal care, nutrition and beingable to use the adult’s home safely(mobility, access questions) were moreprevalent in the first assessment processrelative to these regarding, for example,maintenance of personal relationships ormaking use of necessary facilities in thecommunity.
Table 13 suggests that in some councils atleast, the assessment process involves thecollection of many of the relevant indicatorsof need for the main study. However,differences in the assessment tools meansthat these data would be difficult toaggregate across areas in the study.
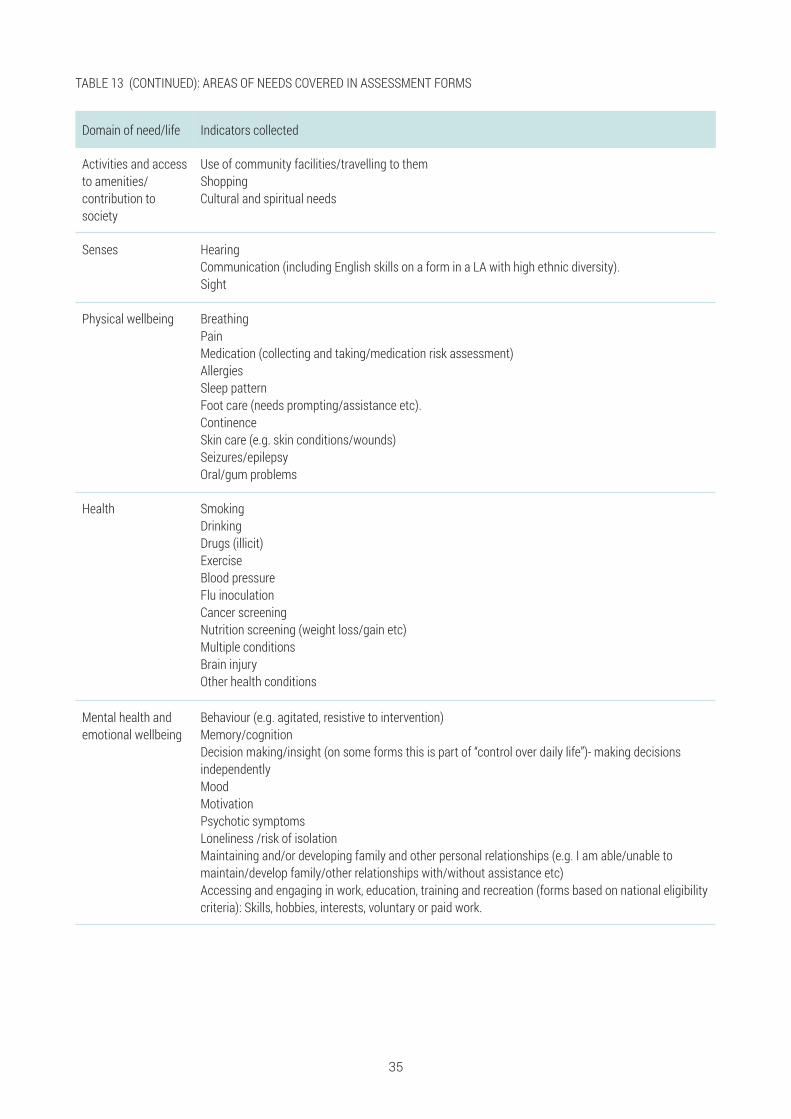
35
TABLE 13 (CONTINUED): AREAS OF NEEDS COVERED IN ASSESSMENT FORMS
Domain of need/life Indicators collected
Activities and accessto amenities/contribution tosociety
Use of community facilities/travelling to themShopping Cultural and spiritual needs
Senses Hearing Communication (including English skills on a form in a LA with high ethnic diversity). Sight
Physical wellbeing BreathingPain Medication (collecting and taking/medication risk assessment) Allergies Sleep pattern Foot care (needs prompting/assistance etc). Continence Skin care (e.g. skin conditions/wounds) Seizures/epilepsy Oral/gum problems
Health SmokingDrinking Drugs (illicit)ExerciseBlood pressureFlu inoculation Cancer screening Nutrition screening (weight loss/gain etc) Multiple conditions Brain injury Other health conditions
Mental health andemotional wellbeing
Behaviour (e.g. agitated, resistive to intervention)Memory/cognition Decision making/insight (on some forms this is part of “control over daily life”)- making decisionsindependently MoodMotivationPsychotic symptoms Loneliness /risk of isolation Maintaining and/or developing family and other personal relationships (e.g. I am able/unable tomaintain/develop family/other relationships with/without assistance etc)Accessing and engaging in work, education, training and recreation (forms based on national eligibilitycriteria): Skills, hobbies, interests, voluntary or paid work.

4.3 SERVICE INDICATORSIn general, evaluations of social careinterventions in the community havetended to capture information about unpaidcare and receipt of ‘standard’ social careservices, including (but not limited to) homecare/home help/personal assistant,voluntary worker, reablement/intermediatecare team, hospital services, nurse care,physiotherapist, cleaner, and handyman(Vlachantoni et al., 2011; Dunatchik et al.,2016). Where these studies are based onthe analysis of national surveys (notablythe Health Survey for England and theEnglish Longitudinal Study of Ageing) thesocial care data is often collected using thesocial care questions for over 65s module(King et al., 2011). This module has alsobeen used to evaluate social care initiatives(Forder et al., 2016).
A particular characteristic of the social carequestions module is the fact that in itreceipt of care and support is linked tofunctional need, and as a result the datacollected clearly identifies who providessupport for which functional limitations.Certain types of support are more difficultto capture using this approach, and forinstance community-based support (e.g.day centres), social work and use ofequipment are collected through a separateset of questions, i.e., use of these servicesis not linked to a particular functionallimitation or other needs. These areas can
be important forms of support for thetarget population of the main study. Theliterature has identified the followingprevalence levels for adaptations andmobility aids among people aged 50 plus(Dunatchik et al., 2016):
• Common home adaptations: e.g. bath orshower seat (~10–13%); alarm that cancall for help (~7–12%); stair lift (~5%);toilet equipment or commode (~6–7%);bed lever or bed rail (~3–4%).
• Common mobility aid use: e.g. cane orwalking stick (~22–24%); zimmer frameor walker (~5–6%); manual wheelchair(~4%).
Evaluations of care and support for peoplewith low/moderate needs have also soughtto collect more detailed data on the natureof services provided to this group:
• For help-at-home schemes, Bauer et al(2017) collected hours provided by staffand volunteers and number of peopleusing the scheme.
• For evaluation of low level services,focusing primarily on day centres, Caielset al. (2010) captured information aboutactivities in day care centres, such asnail cutting, hairdressing, lunch, activities(such as dancing, cards, bingo), bathingand cooking lessons. They also collectedintensity of use and frequency of visits.
36
RECOMMENDATIONS: INSIGHT FROM FORMAL ASSESSMENT OF SUPPORT AND CARE NEEDS
n During needs assessments, local authorities generally collect indicators covering the dimensions of need identified inprevious sections as important for the main study. Notably, they collect information on functional ability, data on history offalls, sensory problems, environmental hazards, medical conditions, medications.
n The indicators used by local authorities to measure these care and support needs, however, are hugely variable. Thesedata are therefore very unlikely to be comparable across areas in the main study.
n Local administrative records could however be used to explore the representativeness of the achieved sample for themain study.
n The variability in how care and support needs are assessed and recorded also suggests that there may be differences inhow people with low/moderate care and support needs move through the social care system in different areas. It will beimportant for the main study to develop a set of indicators to capture low/moderate care and support needs that can beused to define a consistent population across all case study sites.

• Glendinning et al (2010) in theirevaluation of re-ablement services,captured the use of re-ablement andother social care services, including thefrequency and intensity of each servicereceived.
An important challenge in terms of theidentification of the support used by peoplein the community is how to account forsupport through direct payments. Althoughit is relatively straightforward to quantifythe value of the direct payment received, itis often difficult to identify precisely the
nature of the support commissioned, andthere is a risk of biases in the quantificationof the support received if the value of thedirect payment is counted in addition tothat of services commissioned through it.
We found few studies that included costsand assessed cost-effectiveness. Wherestudies attempted to cost provision theytended to focus on the overall cost of theservice being studied or the total cost ofthe care package (Bauer et al. 2017; Caielset al., 2010; Glendinning et al., 2010; Windleet al., 2009).
37
RECOMMENDATIONS: INDICATORS OF SERVICES
n Standardised sets of questions for capturing the amount and nature social care provision for older people are available;however, these question sets capture the most common types of services and especially those provided as part of ongoingcare packages for people who meet social care needs eligibility criteria. These question sets could form the basis of amodule for capturing data on services and unmet needs in the main study, but they would need to be complemented toensure all services relevant to people with low/moderate needs were captured.
n Specifically, it would be important for the main study to capture additional services such as (hours of) reablement,equipment, telecare (e.g. alarms) and some minor adaptations provided. Batteries of questions exist to capture some of themore common low-level services including (hours of and frequency of use) of day centre provision.
n The current questions available to capture support from the voluntary sector are unlikely to be adequate. We did not findany standard questions for measuring provision of information, advice and signposting services. The main study will need todevelop and test questions to capture information, advice and signposting inputs and the nature of intensity of moreinnovative forms of support from the voluntary sector.
4.4 OUTCOME INDICATORSWe have reviewed social care evaluationsand research studies in order to provide anoverview of the types of indicatorsconsidered in previous research withsimilar populations and the likely periodsover which it would be appropriate toexplore the impact of care interventions.The intention has been to inform (i) the
selection of outcome indicators for themain study, (ii) the timing of outcomemeasurement and (iii) the powercalculations, discussed in Section 5.1.Since we expect the main study to exploreboth outcomes for older people and carerswe separate the discussion below for thetwo groups.
4.4.1 OUTCOMES FOR OLDER PEOPLE WITH LOW/MODERATE NEEDS
Local authority interviewees highlighted theimportance of collecting wellbeing andquality of life measures to evaluate theimpact of services on older people. Weconsider here the relative benefits of qualityof life measures that have been validatedfor use with older people and used among
populations with low/moderate needs.Given the concern around the potential forunmet needs among the population ofpeople with low/moderate needs we alsolook here at wellbeing indicators that havebeen used to explore the consequences ofunmet needs.

A popular measure of outcomes wherepeople are in receipt of social care andsupport services is the Adult Social CareOutcomes Toolkit (ASCOT), a multi-attribute utility measure with a number ofversions for use in different settings andwith different user groups (Netten et al.,2012). This measure has beenrecommended for use in economicevaluations of social care interventions bythe National Institute for Health and CareExcellence (2014) and a number of studieshave validated and recommended its useamong community-dwelling older people(Malley et al., 2012; Roalfe et al., 2012;Makai et al., 2014; Bulamu, Kaambwa andRatcliffe, 2015; Hackert, Exel and Brouwer,2017). ASCOT has also been used in anumber of social care evaluations tomeasure impact of social care services onpeople’s quality of life (Glendinning et al.,2008; Forder et al., 2016).
Importantly, ASCOT has been used in aresearch study evaluating the outcomes oflow-level services (Caiels et al., 2010).Alongside ASCOT5, the study collected twoalternative well-being measures: the EQ-5D-3L6, which is a measure ofhealth-related quality of life that isfrequently used to measure health benefitsfrom interventions in QALYs, and the GHQ127, a measure of psychological wellbeing.
Although the analysis showed that the EQ-5D-3L and GHQ12 are sensitive to theeffects of low-level services, overall ASCOTwas a more sensitive measure for thispopulation consistently measuring greaterdegrees of impact from low-level serviceson well-being than the EQ-5D-3L (Caiels etal., 2010).
The effectiveness of reablement was foundto be stronger when measured by EQ-5Dcompared with using ASCOT (Glendinninget al., 2010).
Another quality of life measure that hasbeen validated for use with community-dwelling older people is the ICECAP-O(Grewal et al., 2006; Coast et al., 2008;Kaambwa et al., 2008; Makai et al., 2014;Bulamu, Kaambwa and Ratcliffe, 2015;Hackert, Exel and Brouwer, 2017). ICECAP-O is a capability-based instrument thatdefines wellbeing in terms of an individuals’ability to ‘do’ and to ‘be’ the things that areimportant for a person. A set of indexvalues are available making the measuresuitable for use in economic evaluation.ICECAP-O has been used in studies toassess the quality of life of older people(Flynn et al., 2011; Davis et al., 2013).
Of particular relevance to this study, theICECAP-O was used by Davies et al (2013)in a Falls Prevention Clinical Setting forolder people in Canada. Davis et al (2013)compared ICECAP-O8 and the EQ-5D andconcluded that both indicators providecomplementary (rather than substitute)information in this setting. The mean (SD)age of the studied cohort was 79.3 (6.2)years (n=215). Most individuals were atmoderate risk for falling as indicated by aPPA score of 1.7 (±1.2).
Few studies have so far directly evaluatedthe impact of unmet need on older people’swellbeing. The existing studies have useddata from national surveys and havetherefore used the quality of life measurescollected in these surveys. A NatCen et al.
5 The ASCOT measure in the particular studyincluded nine domains. An overall score wascalculated by adding up the ratings in the ninedomains with each level weighted for relativeimportance.
6 EQ-5D-3L domains are: mobility; self-care, usualactivities (such as work, study, housework, familyor leisure activities), pain or discomfort, anxiety ordepression. Each domain has three levels rangingfrom no problems to extreme problems.
7 The GHQ includes 12 questions: (1) been able toconcentrate on whatever you’re doing? (2) lostmuch sleep over worry? (3) felt you were playing auseful part in things? (4) felt capable of makingdecisions about things? (5) felt constantly understrain? (6) felt you couldn’t overcome yourdifficulties? (7) been able to enjoy your normal day-to-day activities? (8) been able to face up to yourproblems? (9) been feeling unhappy anddepressed? (10) been losing confidence inyourself? (11) been thinking of yourself as aworthless person? (12) been feeling reasonablyhappy, all things considered? The health surveyalso asks people, on a yes-no scale, “Are youbasically satisfied with your life?” and “Do you feelhappy most of the time?”.
8 ICECAP-O is a measure of capability, specificallydeveloped for the older population for use ineconomic evaluation. It focusses on capabilityrather than functioning in the five domains ofstability, attachment, achievement, autonomy andenjoyment. For each attribute, people are asked torate their experience on a four-point scale from nocapability to full capability.
38
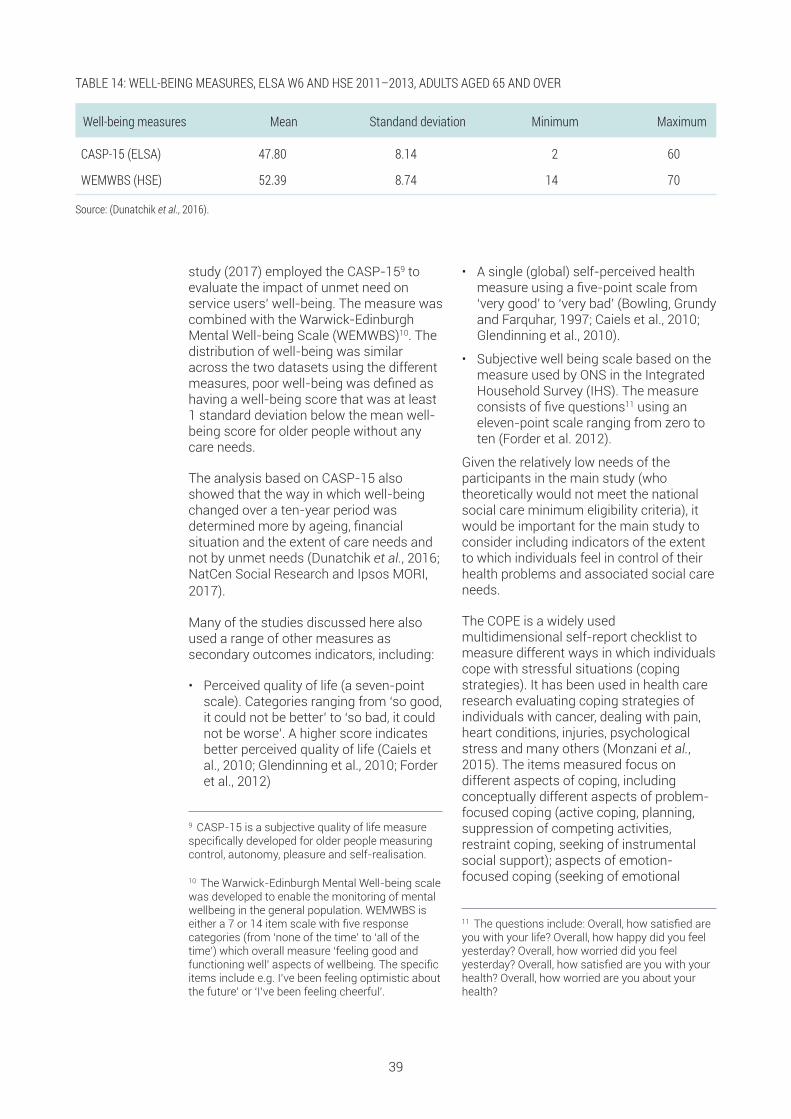
study (2017) employed the CASP-159 toevaluate the impact of unmet need onservice users’ well-being. The measure wascombined with the Warwick-EdinburghMental Well-being Scale (WEMWBS)10. Thedistribution of well-being was similaracross the two datasets using the differentmeasures, poor well-being was defined ashaving a well-being score that was at least1 standard deviation below the mean well-being score for older people without anycare needs.
The analysis based on CASP-15 alsoshowed that the way in which well-beingchanged over a ten-year period wasdetermined more by ageing, financialsituation and the extent of care needs andnot by unmet needs (Dunatchik et al., 2016;NatCen Social Research and Ipsos MORI,2017).
Many of the studies discussed here alsoused a range of other measures assecondary outcomes indicators, including:
• Perceived quality of life (a seven-pointscale). Categories ranging from ‘so good,it could not be better’ to ‘so bad, it couldnot be worse’. A higher score indicatesbetter perceived quality of life (Caiels etal., 2010; Glendinning et al., 2010; Forderet al., 2012)
• A single (global) self-perceived healthmeasure using a five-point scale from‘very good’ to ‘very bad’ (Bowling, Grundyand Farquhar, 1997; Caiels et al., 2010;Glendinning et al., 2010).
• Subjective well being scale based on themeasure used by ONS in the IntegratedHousehold Survey (IHS). The measureconsists of five questions11 using aneleven-point scale ranging from zero toten (Forder et al. 2012).
Given the relatively low needs of theparticipants in the main study (whotheoretically would not meet the nationalsocial care minimum eligibility criteria), itwould be important for the main study toconsider including indicators of the extentto which individuals feel in control of theirhealth problems and associated social careneeds.
The COPE is a widely usedmultidimensional self-report checklist tomeasure different ways in which individualscope with stressful situations (copingstrategies). It has been used in health careresearch evaluating coping strategies ofindividuals with cancer, dealing with pain,heart conditions, injuries, psychologicalstress and many others (Monzani et al.,2015). The items measured focus ondifferent aspects of coping, includingconceptually different aspects of problem-focused coping (active coping, planning,suppression of competing activities,restraint coping, seeking of instrumentalsocial support); aspects of emotion-focused coping (seeking of emotional
9 CASP-15 is a subjective quality of life measurespecifically developed for older people measuringcontrol, autonomy, pleasure and self-realisation.
10 The Warwick-Edinburgh Mental Well-being scalewas developed to enable the monitoring of mentalwellbeing in the general population. WEMWBS iseither a 7 or 14 item scale with five responsecategories (from ‘none of the time’ to ‘all of thetime’) which overall measure ‘feeling good andfunctioning well’ aspects of wellbeing. The specificitems include e.g. I’ve been feeling optimistic aboutthe future’ or ‘I’ve been feeling cheerful’.
11 The questions include: Overall, how satisfied areyou with your life? Overall, how happy did you feelyesterday? Overall, how worried did you feelyesterday? Overall, how satisfied are you with yourhealth? Overall, how worried are you about yourhealth?
39
TABLE 14: WELL-BEING MEASURES, ELSA W6 AND HSE 2011–2013, ADULTS AGED 65 AND OVER
Well-being measures Mean Standand deviation Minimum Maximum
CASP-15 (ELSA) 47.80 8.14 2 60
WEMWBS (HSE) 52.39 8.74 14 70
Source: (Dunatchik et al., 2016).

social support, positive reinterpretation,acceptance, denial, turning to religion); aswell as measuring coping responses thatmay be less useful (focus on and venting ofemotions, behavioural disengagement,mental disengagement)12 (Donoghue,2004).
Patient activation measures (PAM) is ascale of patient activation based on theirresponses to questions about knowledge,beliefs, confidence and self-efficacy tomanaging their own health and care. Theresulting score places a patient at one offour levels of activation:
1. Disengaged and overwhelmed;
2. Becoming aware, but still struggling;
3. Taking action;
4. Maintaining behaviours and pushingfurther.
PAM is commonly used as a tailoring tool
at individual patient level in health caresettings13, as a means of ensuring patientsare receiving the most appropriate types ofsupport for their level of activation althoughthe potential for PAM to be used as acombination of both an outcome measureand a tailoring tool within the same serviceor intervention appears to be growing(Armstrong et al., 2017). Researchsuggests that improvements in patientactivation levels are associated with betterself-management and lower use ofhealthcare services (Kinney et al., 2015).
Finally, it would be important for the mainstudy to collect evidence regardingloneliness, which has been found to affectsignificant wellbeing and physical andmental health of dependent older people(Luanaigh and Lawlor, 2008; Golden et al.,2009; Theeke and Mallow, 2013). Althoughthere is significant controversy surroundinghow best to measure loneliness amongolder people, a commonly used measure isthe UCLA loneliness scale (Russell, Peplauand Cutrona, 1980).
4.4.2 CARERS
There are few validated measures thatcapture carers’ wellbeing and those thatare available are relatively new. Historically,measures for carers have tended to focuson the more negative aspects of caring, forexample indicators of caregiver burden(Kosberg and Cairl, 1986; Molyneuxa et al.,2008). These types of measures have beenused previously in evaluations ofcommunity care services for older people(Davies, Fernández and Nomer, 2000).Since caregiving (and indeed services) canhave positive impacts, it is arguably moreappropriate to focus on wellbeing.
We discuss two new measures that havebeen developed and validated on UKpopulations and are designed to beappropriate for economic evaluation.
The ASCOT-carer measure is designed tocapture the impact of social care on carers’quality of life. It has been validated for usewith carers of people using social careservices (Leeuwen et al., 2015; Rand et al.,2015). A set of index values are availablemaking the measure suitable for use ineconomic evaluation are currently indevelopment14. It has been used in a studyof carers of community-dwelling peoplereceiving social care inputs that includedcarers of older people and has sensitivity tothe health condition, behaviours anddisability level of the social care user(Forder et al., 2016).
The Carer Experience Scale (CES) is ameasure of the caring experience that is
12 The COPE items are scored on a four-pointscale, with scores ranging from 1 (I don’t do this atall) to 4 (I do this a great deal) for the situationalform, and from 1 (I usually don’t do this at all) to 4(I usually do this a great dea)l for the dispositionalform. Items are summed to produce scale scores,with higher scores reflecting greater use of aparticular coping strategy.
13 PAM has been mostly used in the USA forpatients with long-term conditions, recently thetool has been validated for use in the UK andpiloted by the NHS.
14 See www.excelc.eu
40
suitable for use in economic evaluation (Al-Janabi, Flynn and Coast, 2011). The CEScomprises six attributes with three levels15
and has been validated for use on a sampleof 730 informal carers (mostly femalecarers (62.5 %), below the age of 65 (74 %),caring for older people (75.8%) (Goranitis,Coast and Al-Janabi, 2014). So far there areno results available from studies using thismeasure.
It will also be important for the study tomeasure employment related outcomes, interms of employment status of the carer,and potentially also including indicators ofquality of employment (e.g. salary,employment conditions), and of the extentto which the observed employment statusmight be the result of the presence/absence of support with caring duties.
4.4.3 INTERMEDIATE OUTCOMES
The main study should collect evidenceabout the intermediate outcomes ofdifferent support models. These indicatorsshould cover ‘destinational’ outcomes aswell as information about intensity ofhealth and social care use following initialcontact with social care department.
Destinational outcomes could be defined interms of:
• Institutionalisation (admission to carehome; nursing home)
• Hospitalisation (planned/unplanned)
• Length of time with/without social caresupport following initial contact withsocial care departments.
Collecting data on service use about all
forms of support that might be accessedby users and carers, including for instanceservices run by the voluntary sector, wouldrequire primary data collection from usersand carers in the study. However, it will beimportant for the main study to explorewith the councils and NHS organisations inthe study areas the possibility of matchingdata from the administrative records to thedata collected by the study. Administrativedata could provide a detailed andcontinuous picture of patterns of serviceuse for a subset of the services accessedby study participants.
The main study should therefore ensurethat the appropriate permissions for linkingthe study data to administrative records isgained from study participants.
4.4.4 APPROPRIATE TIME INTERVALS FOR CAPTURING EFFECTS OF SUPPORTSERVICES
Several respondents noted the importanceof tracking people’s journey over time tounderstand how the service inputs shapehealth and wellbeing trajectories. Previousevaluations of health and care interventionsfor similar groups of people have used 12-month follow-up periods (Glendinning et al.,2008; Forder et al., 2012). Whileinterviewees felt such a follow-up periodwould be appropriate, they also mentionedthat for this group of people theeffectiveness of the intervention,particularly advice, information and
signposting, is often apparent very quickly.One interviewee reported that peoplefrequently re-contacted them after veryshort time periods if the options presentedwere not working out for them. This sameinterviewee mentioned that to assess theeffectiveness of what they are doing for thisolder people with low/moderate needs theyare looking at whether people re-contactthe local authority for help within sixmonths. Interviewees also mentioned thatunderstanding the contribution of specificservices to outcomes becomes
15 The CES six attributes include: 1. Activities outside caring (a) you can do most of the other things you want to do outside caring(b) some (c) few; 2. Support from family and friends (a) You get a lotof support (b) some (c) little; 3. Assistance from organizations and thegovernment (a) a lot of assistance (b) someassistance (c) little assistance; 4. Fulfilment from caring (a) mostly find caringfulfilling (b) sometimes (c) rarely; 5. Control over the caring (a) You are in control ofmost aspects (b) some aspects (c) few aspects; 6. Getting on with the person you care for (a) mostly get on (b) sometimes (c) rarely.
41

increasingly difficult to measure over longertime horizons as many other externalfactors determine longer term outcomes.
Notwithstanding these considerations, therelatively low needs of the target populationfor the main study means that it would takesome time for certain outcomes to be
observed for significant numbers in thestudy sample (e.g. hospitalisation,deterioration in needs). The study wouldtherefore need to follow cases beyond sixmonths and is likely to benefit from havinga number of follow-up periods (e.g. 6months, 18 months and possibly 30months).
42
RECOMMENDATIONS: MEASURING SERVICE USER AND CARER OUTCOMES
n There is evidence to suggest that the ASCOT measure will be sensitive to outcomes among older people withlow/moderate needs and should be considered as the primary outcome for older people in the main study. An alternativeprimary outcome measure is the ICECAP-O, but this has not yet been used to evaluate services for older people withlow/moderate needs in England.
n Secondary outcome measures should be considered for older people in the main study, including the EQ-5D andmeasures of psychological wellbeing such as the WEMWEBS or GHQ-12, which may be particularly important whereservices have rehabilitative or more health-oriented aims.
n The ASCOT-Carer and CES may be appropriate measures for estimating the impact of care interventions for older peoplewith low/moderate needs on their carers, but neither of these measures have yet been used extensively in such research.For the main study the research team may want to supplement these measures with more widely used measures of carerburden or broader health-related quality of life and wellbeing measures (e.g. EQ-5D and WEMWEBS).
n Intermediate outcomes measures, for example, measures of the use of healthcare services are likely to be importantindicators for the main study. It would be important to explore the potential for data linkage via NHS numbers. Indicators ofre-contacts with the local authority should also be considered for the main study. The research team should take steps toensure data linkage with local authority records is possible.
n There is little evidence to support decisions about appropriate follow-up intervals. Studies commonly have used follow-ups at a year, but discussions with local authorities seemed to suggest that shorter periods may be more appropriate forthis group of older people. For the main study a 6-month, 18-month and possibly 30-month follow-ups should be considered.

The previous section has reviewed important indicators to be collected in the main study,including outcome indicators for older people with low/moderate needs and their carers.The aim of this section is to assess the sample sizes that would be required to enable thestudy to detect with reasonable precision outcome differences between different caremodels. Following the analysis in Section 3.4, we assume that three care models would becompared in the main study.
5.1 POWER CALCULATIONSThe aim of the power calculations is todetermine an appropriate range for thesample size of the study given the chosenoutcome measure(s). For powercalculations to be useful they need to bebased on evidence from previous studieswith similar populations. Studies wereidentified from the literature, and theirrelevance was assessed based on theinclusion criteria for the study and the levelof disability of the study population. Thecommon outcome measures used acrossthe studies identified from this process forpeople presenting with social care needs
were: ASCOT (Netten et al 2012; Malley et al2012), EQ5D (The EuroQol Group, 1990),GHQ-12 (Goldberg, 1992), ICECAP-O (Coastet al., 2008) and health or social care costs.For carers of people with social care needs,common outcome measures were: theASCOT- Carer (Rand, Malley and Netten,2012; Rand et al., 2015) and adevelopmental version of the ASCOT-Carerused in the biennial National English CarerExperience Survey – the carer social carerelated quality of life measure (Fox, Holderand Netten, 2010).
5.1.1 METHOD FOR POWER CALCULATION
Sample size calculations were made foreach relevant outcome measure in eachpaper reviewed. The calculation assumed atwo-sided test of means across threeindependent samples (each representing adifferent ‘care model’). A power of 0.80 anda significance level of 0.05 were used in thecalculations, in line with normal practice.Each of the papers listed above werereviewed and the mean and standarddeviation on each outcome measureincluded available noted. If the study wasan evaluation of an intervention, the controlgroup mean and standard deviation on theoutcome measure was used. These valueswere used in the sample size calculation asestimates of the ‘standard’ or ‘control’population.
The next key parameter in the sample sizecalculation is the size of the differencebetween the mean of the standardpopulation and the mean of a comparatorgroup which is deemed clinically important.A literature search was conducted todetermine if clinically important differenceshad been identified in the literature for eachof the outcome measures. Forder et al.(2012) used a 0.03 difference on the ASCOTscale, based on results from the IBSENstudy (Glendinning et al., 2008), for theirsample size calculation. No clinicallyimportant difference was identified in theliterature for EQ5D, GHQ-12 or ICECAP forthis population. For health or social carecosts there is no standard for determiningwhat constitutes an important difference.Therefore, in addition to the estimate of the
43
5 SAMPLE SIZES

minimum important difference for theASCOT measure from Forder et al (2012)and to facilitate comparison acrossindicators, the sample size calculations
were also conducted for each indicatorassuming the goal was to detect a 5%, 10%and 15% difference from the ‘standard’mean.
5.1.2 ESTIMATED REQUIRED SAMPLE SIZE
The results of the power calculations forthe costs and the various outcomeindicators identified from the literaturereview are shown in Tables 16 to 18. Sincethe estimates are based on evidence fromstudies where the target population weresimilar to the target population of the mainstudy the evidence for a number of theoutcomes indicators is fairly limited. Asdescribed above, the results are presented
using different assumptions about the sizeof a minimally clinically importantdifference (MCID).
The sample size at follow-up (whenoutcomes would be measured) required todetect a difference in the indicator scorebetween groups increases as the standarddeviation of a population or sampleincreases (Table 15 reports the mean and
44
TABLE 15: ESTIMATES OF MEAN AND STANDARD DEVIATIONS (IN BRACKETS) OF USER AND CARER OUTCOMES AND COSTSUSED IN SAMPLE SIZE CALCULATIONS
Source Sample characteristics Ascot EQ5D GHQ-12 SCRQoL ICECAP-O QoL
Costs
Bauer et al.(2017)
Mixed (age 55+) 0.73 (0.19)
Forder et al.(2016)
Mixed 0.74 (0.21)
137.66 (220.53)(SC/week)
Forder et al.(2012)
Mixed (PHB eligible) 0.61 (0.23)
0.549(0.265)
15.55(7.27)
15,800 (21,800)(HSC/year)
Caiels et al.(2010)
Mixed (age 65+) 0.74 (0.20)
0.41 (0.35)
Glendinning et al.(2010)
Mixed (reablementrecipients)
0.77(0.20*)
0.77(0.30*)
Glendinning et al.(2010)
Mixed (home carerecipients)
0.76(0.20*)
0.76(0.30*)
Windle et al.(2009)
Older adults (age 65+) 0.553(0.33)
Glendinning et al.(2008)
Mixed (eligible for IBs) 13.80(6.85)
296 (300*)(SC/week)
Flynn et al.(2011)
Older adults (age 65+) 0.832(0.123)
Davis et al (2013)
Older adults (age 65+) (fallsprevention intervention)
0.701(0.291)
0.815(0.177)
Forder et al.(2016)
Carers 13.43 (4.7)
8.55 (2.56)
* Assumed figure as no SD given.SC = social care; HSC = health and social care
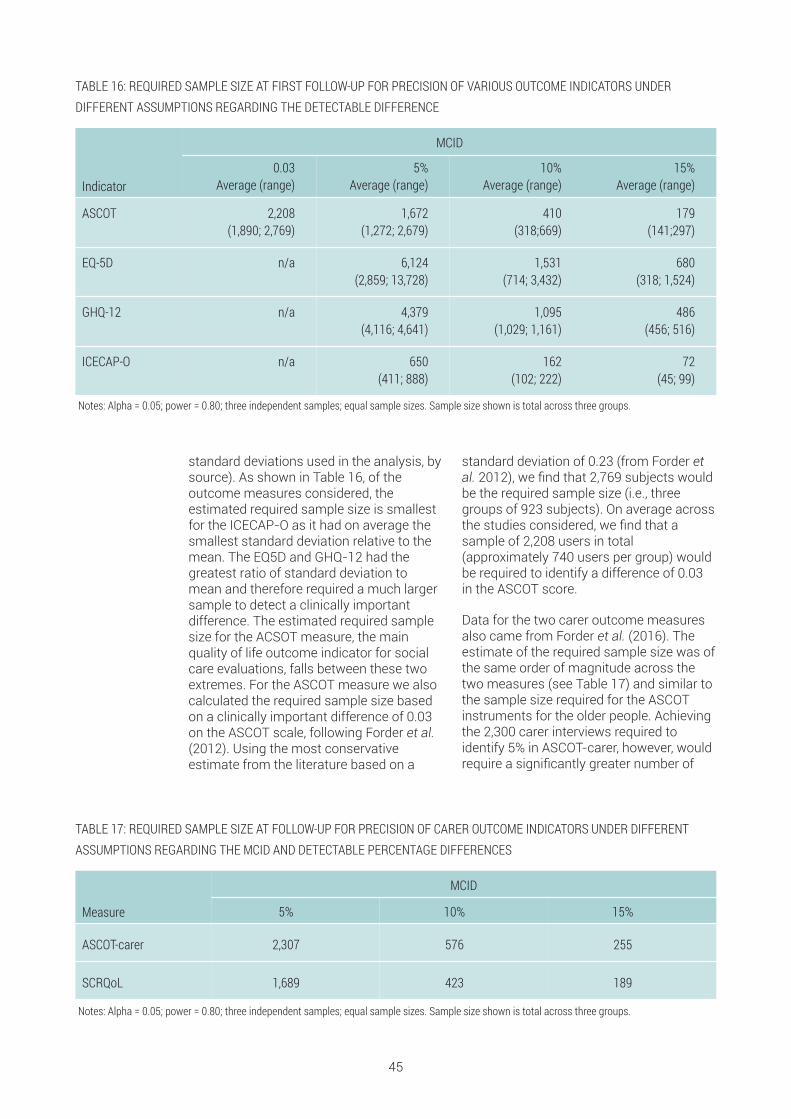
standard deviations used in the analysis, bysource). As shown in Table 16, of theoutcome measures considered, theestimated required sample size is smallestfor the ICECAP-O as it had on average thesmallest standard deviation relative to themean. The EQ5D and GHQ-12 had thegreatest ratio of standard deviation tomean and therefore required a much largersample to detect a clinically importantdifference. The estimated required samplesize for the ACSOT measure, the mainquality of life outcome indicator for socialcare evaluations, falls between these twoextremes. For the ASCOT measure we alsocalculated the required sample size basedon a clinically important difference of 0.03on the ASCOT scale, following Forder et al.(2012). Using the most conservativeestimate from the literature based on a
standard deviation of 0.23 (from Forder etal. 2012), we find that 2,769 subjects wouldbe the required sample size (i.e., threegroups of 923 subjects). On average acrossthe studies considered, we find that asample of 2,208 users in total(approximately 740 users per group) wouldbe required to identify a difference of 0.03in the ASCOT score.
Data for the two carer outcome measuresalso came from Forder et al. (2016). Theestimate of the required sample size was ofthe same order of magnitude across thetwo measures (see Table 17) and similar tothe sample size required for the ASCOTinstruments for the older people. Achievingthe 2,300 carer interviews required toidentify 5% in ASCOT-carer, however, wouldrequire a significantly greater number of
45
TABLE 17: REQUIRED SAMPLE SIZE AT FOLLOW-UP FOR PRECISION OF CARER OUTCOME INDICATORS UNDER DIFFERENTASSUMPTIONS REGARDING THE MCID AND DETECTABLE PERCENTAGE DIFFERENCES
Measure
MCID
5% 10% 15%
ASCOT-carer 2,307 576 255
SCRQoL 1,689 423 189
Notes: Alpha = 0.05; power = 0.80; three independent samples; equal sample sizes. Sample size shown is total across three groups.
TABLE 16: REQUIRED SAMPLE SIZE AT FIRST FOLLOW-UP FOR PRECISION OF VARIOUS OUTCOME INDICATORS UNDERDIFFERENT ASSUMPTIONS REGARDING THE DETECTABLE DIFFERENCE
Indicator
MCID
0.03 Average (range)
5%Average (range)
10%Average (range)
15% Average (range)
ASCOT 2,208(1,890; 2,769)
1,672(1,272; 2,679)
410 (318;669)
179(141;297)
EQ-5D n/a 6,124(2,859; 13,728)
1,531(714; 3,432)
680(318; 1,524)
GHQ-12 n/a 4,379(4,116; 4,641)
1,095(1,029; 1,161)
486(456; 516)
ICECAP-O n/a 650(411; 888)
162(102; 222)
72(45; 99)
Notes: Alpha = 0.05; power = 0.80; three independent samples; equal sample sizes. Sample size shown is total across three groups.

user interviews because only a proportionof them would have a carer. The similarsample requirements between the twocarer indicators are not surprising giventhat the SCRQoL indicator is an earlierversion of the ASCOT-Carer measure.
As expected, the required sample sizebased on health or social care costs farexceeds that calculated for the quality-of-life measures (see Table 18). This is largelydue to the wide variation in service usecosts across surveyed individuals.
46
TABLE 18: REQUIRED SAMPLE SIZE AT FOLLOW-UP FOR PRECISION OF COSTS UNDER DIFFERENT ASSUMPTIONS REGARDINGTHE MCID
Indicator
MCID
5%Average (range)
10%Average (range)
15% Average (range)
Costs 34,519(19,350; 48,345)
8,629(4,836; 12,087)
3,836(2,151; 5,373)
Notes: Alpha = 0.05; power = 0.80; three independent samples; equal sample sizes. Sample size shown is total across three groups.
RECOMMENDATIONS: REQUIRED SAMPLE SIZE
The following conclusions can be drawn from the results of the power calculations:
n The number of “care models” to be compared will need to be kept to a minimum for the study to have a realistic chanceto achieve adequate power to detect outcome differences between models. The sample sizes reported are the samplesrequired to detect differences between three groups. To compare more than three care models, larger samples will berequired.
n Due to the variability in care receipt between care users and the cost of larger study samples, it is unlikely that the mainstudy will be powered to detect even a 10% difference in costs between care models at the 5% confidence level.
n It is unlikely that the main study will be powered to detect a 5% difference in the ASCOT-Carer measure at the 5%confidence level, as only a proportion of older people – we estimate around three-fifths to two-thirds – are likely to have acarer. Larger differences in the ASCOT-Carer measure are likely to be detectable.
n The power calculations assume simple methods of analysis, and regression-based methods would have greater power todetect differences. However, subgroup analyses would reduce significantly the power of statistical analyses.
n The lack of clinically meaningful differences in key social care outcomes complicates the calculation of sample sizes.Detecting a 0.03 difference in ASCOT scale at the 5% confidence level, assuming three care models would requireapproximately 2,200 interviews at follow-up. Detecting a 5% difference in ASCOT would require approximately 1,700interviews at follow-up.
n Large samples are required in order to have precision in the statistical tests, but this has implications for costs of thefieldwork (see Section 7) and for the number of authorities, as we now turn to discuss.

5.2 REQUIRED NUMBER OF AUTHORITIES FORTHE MAIN STUDYThe number of authorities required to participate in the main study will depend on the totalnumber of interviews sought, the timescales for data collection, the rate of casesapproaching authorities for support with their social care needs, and the success of thestudy in recruiting those cases into the study. The aim of this section is to assess the likelynumber of councils that might be required to ensure that sufficient cases are recruited intothe study within a reasonable timeframe.
5.2.1 RECRUITMENT RATES FOR OLDER PEOPLE
A majority of older people approached willnot want to participate in the study, so weshould expect only a fraction of those whoare eligible to actually participate. Theresearch team will have limited control overrecruitment of older people, as this will becarried out by members of the First ContactTeam within local authorities (or delegatedagencies). As this method for recruitmenthas not been used previously, there isuncertainty over the recruitment rate for thestudy.
From experience we would anticipate thatrecruitment rates for older people will varyacross case study sites depending uponthe commitment and engagement of keylocal authority staff. Our assumption of10% recruitment is based on previousexperience with similar populations, albeitusing a different approach to recruitment(Forder et al 2016). Although this rateseems fairly low, this level of recruitmentmay not be achieved where local authoritystaff are not fully engaged with and
supportive of the study. The commitmentof staff may depend on the burden ofcomplying with the study requirements;equally their compliance with the studyrequirements may be affected by theircommitment to the study.
It will be important for the research teamto spend time engaging with localauthority staff, building trust anddeveloping a shared understanding of thestudy to maximise recruitment rates.
In line with the analysis in Section 5.1, weassume that the target sample at follow-upwould be either 1,500 users (assuming twocare models would be compared) or 2,250users (assuming three care models).Assuming a 25% drop out between baselineand follow-up interviews, these figureswould imply 2,000 and 3,000 interviews atbaseline (see Section 5.2 for furtherdiscussion of the likely referrals,recruitment, conversion and follow-up ratesfor older people and their carers).
5.2.2 RECRUITMENT RATES FOR CARERS OF OLDER PEOPLE
The proposed approach to the studysuggests recruiting informal carers into thestudy via older people. Previous experienceusing this method of recruitment suggeststhat it is a feasible method, but it can beparticularly challenging to recruit extra-resident carers. Our experience suggeststhat setting a target for carer interviewsmay bias the sample towards co-residentcarers who are easier to interview, so wewould advise against such a strategy(Forder et al. 2016). The research team willneed to consider appropriate methods formaximising the recruitment of carers andmay wish to explore methods for doing soin a pilot.
Recruitment rates for carers are a keyparameter in determining the costs offieldwork, and costs are likely to be higherfor extra-resident carers on the basis thatfewer of these interviews could beconducted at the same time as the co-resident carer interviews. Our analysis inSection 5 suggests that we might expectaround 60% to 66.6% of older people tohave a carer, of which around 50% could beco-resident carers. There is, however, someuncertainty around these estimates. As forolder people it is unlikely that all (main)carers of older people recruited to the studywill want to participate. Based onrecruitment rates for a previous study thatused this method for recruiting carers we
47

might expect a recruitment rate of around70%, but this is likely to be higher for co-resident carers and lower for extra-residentcarers (Forder et al 2016). Estimates oflikely recruitment rates for both groups ofcarers and the potential for conductinginterviews of older people and carers at the
same time are therefore important forproviding indicative costs of the fieldwork.
The research team may wish to explorelikely recruitment rates and how tomaximise them in a pilot to fine-tune themethods for the main stage of the study.
5.2.3 POTENTIAL NUMBER OF CASES AVAILABLE FOR RECRUITMENT INTO THE MAINSTUDY
An indication of the numbers of olderclients with low needs contacting localauthorities can be derived from SALT returnSTS001, which provides authority-levelinformation on requests for support overthe course of each financial year accordingto the sequel to request.
To estimate the number of older peoplewith relatively low needs (the target groupfor the main study), we excluded from thetotal numbers of contacts recorded withlocal authorities in England:
• older people recorded as going on toreceive institutional care (residential ornursing care),
• 60% of long-term community clients,assumed to meet social care needseligibility criteria (based on an analysis ofthe need distributions of older socialcare recipients from by the PSSRUaggregate model)
• those receiving end-of-life care
• individuals to whom no service orsignposting was provided, on theassumption that contacts with councilsrelated to the need for social caresupport would at least receiveinformation or signposting even if noteligible for ongoing care services.
A conservative recruitment rate of 10% oftargeted clients was assumed.
Table 19 summarises the assumptionsdescribed above regarding thebombardment rates of cases to authoritiesand the likely recruitment rates. To coverthe eventuality that interviews are notsecured for all clients recruited to the study,a 75% recruitment-to-interview ‘conversionrate’ was assumed on the basis of previoussimilar studies; this means that 4,000recruitments would be required to secure3,000 baseline interviews, and 2,700recruitments would be required to achieve2,000 interviews.
48
TABLE 19: PROPORTIONS OF NEW REQUESTS FOR SUPPORT ASSUMED TO MEET CLIENT PROFILE REQUIREMENTS, BYSEQUEL TO REQUEST
Sequel to request for support (and support setting) Proportion targeted Proportion recruited
Short-term support to maximise independence 100% 10%
Long-term support (nursing care) 0% 0%
Long-term support (residential care) 0% 0%
Long-term support (community services) 40% 4%
End of life 0% 0%
Ongoing low-level support 100% 10%
Short-term support (other) 100% 10%
Universal services/signposted to other services 100% 10%
No services provided – any reason 0% 0%

5.2.4 ESTIMATED LOCAL AUTHORITY RECRUITMENT RATES
On the basis of 2016/17 SALT data and theassumptions outlined in Table 19, a total of869,000 relevant requests for supportamong older people were recorded acrossEngland during the financial year. Assumingno seasonal effects, this equates to 72,260clients per month, or an average of 475potential clients per local authority.Applying a 10% recruitment rate, it isassumed that 48 recruitments per monthwould be achieved on average per Englishlocal authority (this would be expected totranslate into 36 interviews per authority,assuming a 75% conversion rate).
Based on average local authority clientnumbers in England, a total of 3,000interviews between 20 authorities (or 1,500interviews between 10 local authorities)could be achieved within four months.Realistically, however, the skew in the sizeof local councils and therefore in theirpotential throughput of new cases meansthat few authorities would be able to recruit48 new cases per month.
Figure 8 illustrates the distribution of localauthorities ranked according to theirexpected number of monthly recruitments(using the assumptions in Table 19). Thefigure also includes three horizontal lines,which signal the target monthly recruitmentrequired to achieve 3,000 interviews across20 local authorities (or 1,500 interviewsacross 10 local authorities) within 4, 6 and8 months recruitment periods. Equivalentthresholds assuming 300 interviews perauthority (e.g. 3,000 interviews across 10authorities) are shown in Figure 9.
Figures 8 and 9 suggest that achieving3,000 baseline interviews would requireinvolving approximately 20 authorities inthe study and extending the recruitmentperiod over at least 6 to 8 months. Thiswould require an average of 150 interviewsper authority over the recruitment period.Reducing the number of authorities or therecruitment period would be feasible onlyby concentrating the main study on verylarge authorities and would underminesignificantly the range of local caresystems explored.
49
FIGURE 8: LOCAL AUTHORITIES RANKED BY EXPECTED MONTHLY RECRUITMENTS, (2016/17-BASED ESTIMATES) ANDTARGETS ASSOCIATED WITH 3,000 INTERVIEWS IN 20 LOCAL AUTHORITIES OR 1,500 INTERVIEWS ON 10 LOCAL AUTHORITIES
Recruitment targets over 4-, 6- and 8-month periods, associated with 3,000 baseline interviews across 20 local authorities or1,500 baseline interviews across 10 local authorities.
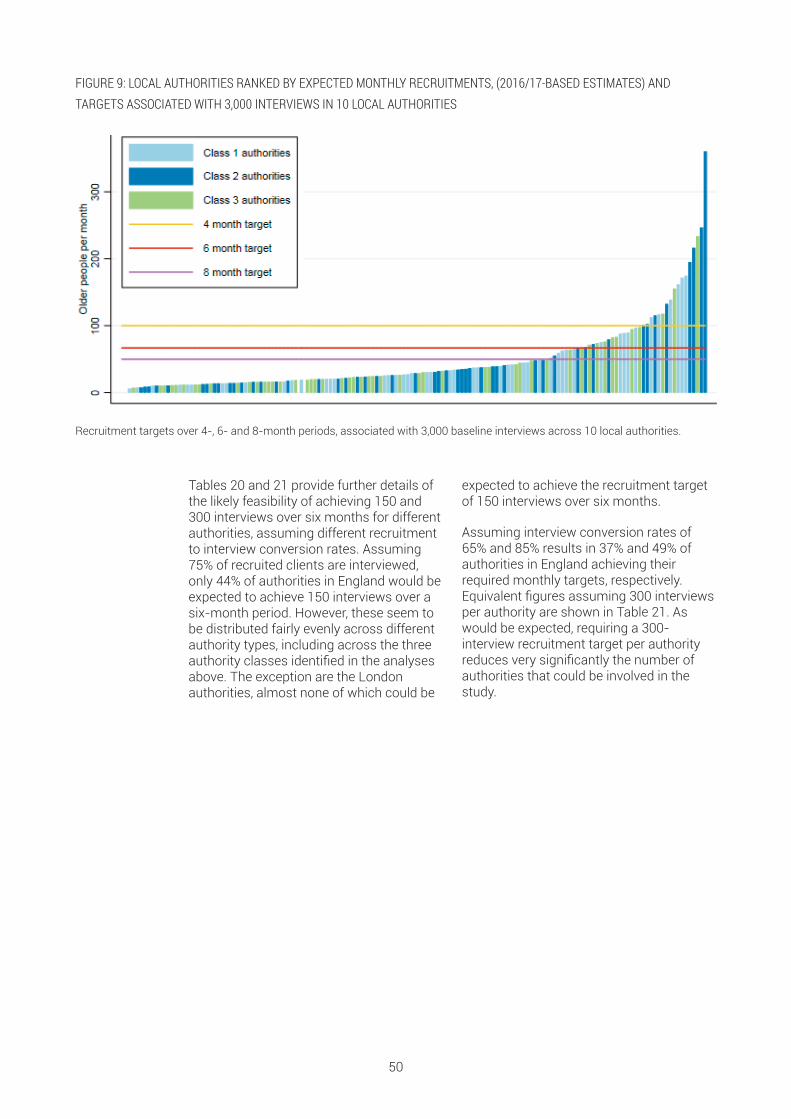
Tables 20 and 21 provide further details ofthe likely feasibility of achieving 150 and300 interviews over six months for differentauthorities, assuming different recruitmentto interview conversion rates. Assuming75% of recruited clients are interviewed,only 44% of authorities in England would beexpected to achieve 150 interviews over asix-month period. However, these seem tobe distributed fairly evenly across differentauthority types, including across the threeauthority classes identified in the analysesabove. The exception are the Londonauthorities, almost none of which could be
expected to achieve the recruitment targetof 150 interviews over six months.
Assuming interview conversion rates of65% and 85% results in 37% and 49% ofauthorities in England achieving theirrequired monthly targets, respectively.Equivalent figures assuming 300 interviewsper authority are shown in Table 21. Aswould be expected, requiring a 300-interview recruitment target per authorityreduces very significantly the number ofauthorities that could be involved in thestudy.
50
FIGURE 9: LOCAL AUTHORITIES RANKED BY EXPECTED MONTHLY RECRUITMENTS, (2016/17-BASED ESTIMATES) ANDTARGETS ASSOCIATED WITH 3,000 INTERVIEWS IN 10 LOCAL AUTHORITIES
Recruitment targets over 4-, 6- and 8-month periods, associated with 3,000 baseline interviews across 10 local authorities.

51
TABLE 20: NUMBER AND PROPORTION OF AUTHORITIES EXPECTED TO ACHIEVE 150 INTERVIEWS OVER SIX MONTHS BYLOCAL AUTHORITY TYPE AND RECRUITMENT-TO-INTERVIEW CONVERSION RATE
65% interview conversion rate 75% interview conversion rate 85% interview conversion rate
LAsachievingtarget
LAs notachievingtarget
% LAs
successful
LAsachievingtarget
LAs notachievingtarget
% LAs
successfu
LAsachievingtarget
LAs notachievingtarget
% LAs
successfu
Latent class
Class 1 22 28 44% 25 25 50% 28 22 56%
Class 2 18 32 36% 23 27 46% 26 24 52%
Class 3 16 34 32% 18 32 36% 20 30 40%
Local authority type
Inner London 0 13 0% 0 13 0% 1 12 8%
Metropolitan district 21 15 58% 25 11 69% 25 11 69%
Outer London 1 18 5% 1 18 5% 5 14 26%
Shire County 25 6 81% 26 5 84% 27 4 87%
Unitary Authority 9 44 17% 14 39 26% 16 37 30%
ONS family
Centres with Industry 9 9 50% 11 7 61% 12 6 67%
Coastal and Countryside 6 3 67% 7 2 78% 7 2 78%
Industrial Hinterlands 7 10 41% 8 9 47% 9 8 53%
London Centre 0 7 0% 0 7 0% 0 7 0%
London Cosmopolitan 0 7 0% 0 7 0% 2 5 29%
London Suburbs 1 11 8% 1 11 8% 2 10 17%
Manufacturing Towns 8 4 67% 8 4 67% 8 4 67%
New and Growing Towns 2 6 25% 3 5 38% 4 4 50%
Prospering Smaller Towns 15 18 45% 17 16 52% 18 15 55%
Prospering Southern England 5 5 50% 5 5 50% 5 5 50%
Regional Centres 3 10 23% 6 7 46% 7 6 54%
Thriving London Periphery 0 6 0% 0 6 0% 0 6 0%
Total 56 94 37% 66 84 44% 74 76 49%
Note: City of London and the Isles of Scilly excluded on the basis of insufficient sample size.

52
TABLE 21: NUMBER AND PROPORTION OF AUTHORITIES EXPECTED TO ACHIEVE 300 INTERVIEWS OVER SIX MONTHS BYLOCAL AUTHORITY TYPE AND RECRUITMENT-TO-INTERVIEW CONVERSION RATE
65% interview conversion rate 75% interview conversion rate 85% interview conversion rate
LAsachievingtarget
LAs notachievingtarget
% LAs
successful
LAsachievingtarget
LAs notachievingtarget
% LAs
successfu
LAsachievingtarget
LAs notachievingtarget
% LAs
successfu
Latent class
Class 1 10 40 20% 11 39 22% 15 35 30%
Class 2 9 41 18% 11 39 22% 12 38 24%
Class 3 7 43 14% 10 40 20% 12 38 24%
Local authority type
Inner London 0 13 0% 0 13 0% 0 13 0%
Metropolitan district 6 30 17% 7 29 19% 12 24 33%
Outer London 0 19 0% 0 19 0% 1 18 5%
Shire County 18 11 62% 21 8 72% 21 8 72%
Unitary Authority 2 51 4% 4 49 8% 5 48 9%
ONS family
Centres with Industry 3 15 17% 3 15 17% 7 11 39%
Coastal and Countryside 4 4 50% 6 2 75% 6 2 75%
Industrial Hinterlands 0 17 0% 2 15 12% 3 14 18%
London Centre 0 7 0% 0 7 0% 0 7 0%
London Cosmopolitan 0 7 0% 0 7 0% 0 7 0%
London Suburbs 0 12 0% 0 12 0% 1 11 8%
Manufacturing Towns 4 8 33% 5 7 42% 6 6 50%
New and Growing Towns 0 8 0% 0 8 0% 0 8 0%
Prospering Smaller Towns 9 22 29% 9 22 29% 9 22 29%
Prospering Southern England 3 7 30% 4 6 40% 4 6 40%
Regional Centres 3 10 23% 3 10 23% 3 10 23%
Thriving London Periphery 0 6 0% 0 6 0% 0 6 0%
Total 26 124 17% 32 118 21% 39 111 26%
Note: City of London and the Isles of Scilly excluded on the basis of insufficient sample size.

5.2.5 RECRUITING AUTHORITIES INTO THE STUDY
We expect that the research team will haveresponsibility for recruiting sites into thestudy.
The analysis above indicates that manyauthorities in England would struggle torecruit the number of cases per monthrequired to power the study, assuming asix-month fieldwork period. Theseconclusions depend on a number of criticalfactors, and in particular on the recruitmentrate achieved, which we have assumed (onthe basis of previous studies) to be 10%.
The research team will need to considerfrom the outset how to maximise thediversity of participating local authorities,and in particular to ensure that importantauthority types (e.g. London boroughs) arenot excluded because of their size.
Several options could be considered toinclude smaller local authorities, but theseall bring additional complications. Oneoption would be to include smallerauthorities and have a lower target forthese authorities or to extend the captureperiod for these authorities to make it
possible to meet the target sample. The lownumbers being recruited on a weekly basis,however, would make these authorities veryexpensive sites for data collection.Extending the capture period would haveconsequences for comparability andfieldwork costs (as the study would go onfor longer). It would also mean that six-month follow-ups would be happening atthe same time as the baseline interviews insome cases, which would increase thecomplexity of managing the survey.
To ensure that a diverse range of authoritytypes are represented, it may be necessaryto include a number of authorities that donot meet the average monthly interviewthresholds. This is likely to be particularlyrelevant to London boroughs, which are bydefinition much smaller than other Englishcouncils.
Table 22 shows the average number ofrecruitments per local authority required toachieve 3,000 interviews overall, accordingto recruitment timescales and numbers ofparticipating authorities.
53
Note: Total of 4,000 recruitments required assuming 75% of those recruited are interviewed (see Tables 24 and 25).
TABLE 22: AVERAGE NUMBER OF MONTHLY RECRUITMENTS PER LOCAL AUTHORITY REQUIRED TO ACHIEVE A TOTAL OF 3,000BASELINE INTERVIEWS, BY NUMBER OF PARTICIPATING AUTHORITIES AND LENGTH OF DATA COLLECTION PERIOD
12 333 167 111 83 67 56 48 42 37 33 30 28 26 24 22 21 20 19 18 17
11 364 182 121 91 73 61 52 45 40 36 33 30 28 26 24 23 21 20 19 18
10 400 200 133 100 80 67 57 50 44 40 36 33 31 29 27 25 24 22 21 20
9 444 222 148 111 89 74 63 56 49 44 40 37 34 32 30 28 26 25 23 22
8 500 250 167 125 100 83 71 63 56 50 45 42 38 36 33 31 29 28 26 25
7 571 286 190 143 114 95 82 71 63 57 52 48 44 41 38 36 34 32 30 29
6 667 333 222 167 133 111 95 83 74 67 61 56 51 48 44 42 39 37 35 33
5 800 400 267 200 160 133 114 100 89 80 73 67 62 57 53 50 47 44 42 40
4 1000 500 333 250 200 167 143 125 111 100 91 83 77 71 67 63 59 56 53 50
3 1333 667 444 333 267 222 190 167 148 133 121 111 103 95 89 83 78 74 70 67
2 2000 1000 667 500 400 333 286 250 222 200 182 167 154 143 133 125 118 111 105 100
1 4000 2000 1333 1000 800 667 571 500 444 400 364 333 308 286 267 250 235 222 211 200
1 2 3 4 5 6 7 8 9 10 11 12 13 14 15 16 17 18 19 20
Number of authorities
Number of m
onths

54
FIGURE 10: ILLUSTRATION OF MINIMUM THRESHOLDS FOR NUMBERS OF PARTICIPATING AUTHORITIES, LENGTH OF DATACOLLECTION PERIOD AND AVERAGE NUMBER OF MONTHLY RECRUITMENTS REQUIRED TO ACHIEVE A TOTAL OF 3,000BASELINE INTERVIEWS
Figure 10 illustrates the required monthlyrecruitment targets associated withdifferent combinations of recruitmenttimescales, number of participatingauthorities assuming a 3,000 overallinterview target.
Average number of requests per participating authority per month
Num
ber o
f aut
horit
ies
10 20 30 40 50 60 70 80 90 100
20
40
60
80
100
120
0
4 months
6 months
8 months
10 months
12 months
RECOMMENDATIONS: NUMBER OF CASE STUDY SITES
n Achieving the large number of interviews required to power the study is likely to require that a significant number ofauthorities (approximately 20) are involved in the study, and that the recruitment phase is extended over at least 6 months.
n Authorities able to achieve 150 interviews over 6 months are well distributed across most local characteristics, includingthe three local classes associated with different care models.
n The one exemption are London authorities, which due to their small size would need to be oversampled in order tocontribute sufficient cases to the study.
In this section, we set out a proposal for how the fieldwork element of the study could bedesigned. There are a number of practical challenges associated with the proposedapproach, which we discuss in some detail along with suggestions for how these could beaddressed by the research team. The discussion of the likely challenges draws on theissues identified in discussions with the survey organisations, the analysis concerninglikely numbers contacting local authorities on a monthly basis, and from the interviewswith local authority staff.
6.1 ANALYTICAL APPROACH
6.1.1 QUANTITATIVE ANALYSES
Overall, the aim of the main study will be toquantify the impact on outcomes and costsof different approaches for supporting olderpeople with low/moderate social careneeds. The study will therefore collect asignificant amount of quantitative data,focusing on the types of indicatorsdiscussed in previous sections. Given thenon-experimental nature of the evaluation,and in particular the lack of a randomprocess for allocating cases to caremodels, the evaluation will need to applystatistical methods for standardising thecharacteristics of individuals in the differentcare models. For instance, the main studyshould use matching techniques togenerate comparable groups of casesacross care models before testing for
differences in average costs and outcomes(see Stuart (2010) for a discussion of theuse of matching methods for causalinference). These matching techniquescould be complemented with multivariateregression methods to further control forthe effect of confounders in the analysis ofcosts and outcomes of different models fordifferent users. A particularly importantgoal for the analysis will be to usemultivariate regression methods to controlfor the effect of the need-related factorslisted in Section 4 on care outcomes. Anumber of social care evaluations haveused similar approaches (see for instanceDavies, Fernández and Nomer, (2000);Glendinning et al., (2008) and Rand, Malleyand Netten (2012)).
6.1.2 PROCESS EVALUATION
Equally important to the quantitativeanalysis for the success of the main studywill be a process evaluation. This willprovide a detailed understanding of thepolicy objectives, associated careprocesses and services for supportingpeople with low and moderate care needsin the participating authorities. The processcomponent of the evaluation shouldengage with local policy makers,professionals involved in the managementand running of first point of contact
systems, and with (health and social care)professionals from care servicessupporting the study’s target group. Inaddition, an analysis of relevant local(health and social care) policy documentsshould be carried out. The aim of thisprocess evaluation should be to:
Complement the statistical analysis of thespecification of care models by confirming,using local intelligence, the appropriatenessof the association between authorities inthe study and care model typologies.
55
6 PRACTICALITIES OF THEIMPLEMENTATION OF THE MAINSTUDY

Identifying specific local processes (e.g.different first contact arrangements) whichcould be used to derive indicators to beused in the quantitative analyses in order toexplore the link between costs, outcomesand different local care arrangements.
Gain an in-depth understanding of thenature of and reasons for differences in thesupport provided in the local authorities inthe study. This evidence should support thespecification of hypotheses to be tested inthe quantitative analysis as well as helpwith the interpretation of the resultsobtained.
56
RECOMMENDATIONS: ANALYTICAL APPROACH
n The study should use a combination of quantitative and qualitative analytical methods to ensure that estimates of thecosts and outcomes of the different care models can be obtained, gain an in-depth understanding of the factors explainingsuch differences, and draw lessons about how to structure support services for people with low/moderate needs across allEnglish authorities.
n Given the unlikely availability of experimental data, the study should use statistical methods such as matchingtechniques and multivariate regression models in order to control for potential differences in the samples of older peoplefrom the different care models evaluated.
n A process evaluation should be carried out to examine the appropriateness of the statistically-led grouping of authoritiesinto care models, the nature of the differences between local arrangements for supporting people with low/moderate needs,and to support the specification of hypotheses for, and the interpretation of results from, the quantitative analyses of costsand outcomes.
6.2 RECRUITMENT OF STUDY PARTICIPANTSThe proposed recruitment method relies onmembers of the First Contact Team withineach local authority inviting older peopleand their carers to take part in the study,using criteria defining the study eligibilitycriteria provided by the research team. Therecruitment of a representative sample ofconsistently defined older people and their
carers into the study is important for itssuccess, as it will affect the comparabilityof the findings across care models.Inconsistent application of the eligibilitycriteria or non-recruitment of people with aparticular set of characteristics will createbias in the study sample and the studyconclusions.
6.2.1 SAMPLING FRAME
National surveys were explored initially aspossible sources of sampling frames ofservice users into the main study. Usingsurveys such as HSE and ELSA for thispurpose would help ensure nationalrepresentativeness of the sample of olderpeople in the main study. However, thisoption was not found to be viable becauseof problems with very limited sample sizesof older people with social care needs insurveys such as Health Survey for Englandor ELSA. This problem is furthercompounded by the fact that they aredrawn from across England. They therefore
include a very small number of relevantcases per authority and would require thestudy to cover a very large number ofauthorities.
The proposed approach is therefore to useolder people who contact the localauthorities in the study seeking social caresupport over a specified period as thesampling frame for the study. As noted inSection 1, this approach would aim tofollow older people with low/moderatesocial care needs who have both gone onand not gone on to receive long-term socialcare support, but it would exclude people

who do not approach the local authorityand arrange care privately or carry onmanaging without formal support. Thepathways highlighted in red in Figure 1 (seepage 2) illustrate the group of people that
would be recruited into the main study, andthe range of possible service and careoutcomes following their contact with theCouncil.
6.2.2 STUDY ELIGIBILITY CRITERIA
Local authorities may exert some influenceover the numbers and types of people whoapproach them for support with their socialcare needs. The research team will need tobe aware of this limitation and use theprocess evaluation to determine therelationship between the care model ineach participating local authority and theprofile of people contacting them with arequest for social care support.Furthermore, the evaluation shouldattempt to cover all mechanisms involvedin the first point of contact process (e.g.web-based tools for triaging cases) andall agencies with delegated responsibilityfrom the council for handling first contact(e.g. organisations from the voluntarysector and the NHS involved in casefinding and signposting).
The study should use eligibility criteria forthe recruitment of older people with lowneeds that are based on a clearly definedneeds profile and ensure that they areapplied consistently across all localauthority sites. These study eligibility
criteria should be developed and pilotedwith the participating authorities, to ensurethat they describe accurately the relevantneeds of the target population and that thecriteria are interpreted and implementedconsistently across councils. Keysuggested principles for the study eligibilityalgorithm are shown in Box 1.
The national eligibility criteria introduced bythe Care Act 2014 still allow for somesubjectivity in their interpretation. Inaddition, local authorities are allowed toprovide support over and above theminimum national eligibility criteria. As aresult, even if the study’s eligibility criteriaexcluded in principle older people eligiblefor core social care support following theCare Act 2014 eligibility criteria, it is likelythat a number of the users in the studywould be in receipt of core social carepackages (in the more ‘generous’authorities). This should allow the study toexplore the relative costs and benefits ofcore vs. alternative forms of social caresupport.
57
BOX 1: PRINCIPLES FOR THE SPECIFICATION OF THE STUDY INCLUSION ELIGIBILITY CRITERIA
The study should aim to include:
1. older people
2. who approach their council (or agencies acting on behalf of the council for contacting people with social care needs)
3. in order to enquire specifically about support with their social care needs
4. and who do not exceed the maximum needs eligibility criteria for the study.
The maximum needs eligibility criteria for the study should identify the threshold at which individuals become eligible forongoing social care support. The study could in particular implement an algorithm based on the Care Act 2014 nationalminimum eligibility criteria.
As far as possible, the algorithm should build on the information collected as a matter of course by the first point of contactsystems in the participating authorities, in order to help assess the representativeness of the study sample.
The main study will need to work with the participating councils to ensure the eligibility algorithm is interpreted and appliedconsistently.

58
Figure 11 shows the key stages involved inthe recruitment of individuals into the studyup to the completion of the baselineinterview. Older people with low needsshould be recruited to the study at the pointof first contact with the local authority. Thismeans that they will need to be recruitedinto the study by local authority staffworking within the First Contact Team (ordelegated body). To ensure older people arerecruited into the study on a consistentbasis all people contacting the authority willneed to be screened to determine eligibilityand only those who are eligible should beinvited to participate.
Discussions with local authority staffsuggested that members of the FirstContact Team would be able to undertakescreening at the stage of first contact. Theynoted that when older people contact thecouncil members of the First Contact Teamask a series of questions to determine themost appropriate response for eachenquiry. Some of the councils we spoke torecorded information about thecharacteristics of older people at this stage.
To screen older people the research teamwould need to develop a short screening
questionnaire that the participatingauthorities could include within theprepared scripts they currently use toassess the appropriate response for eachindividual contacting the council.
In some areas, responsibility for triagingentry to social care services may have beendelegated to other organisations, in whichcase these organisations will need tomanage recruitment into the study.
As discussed in Sections 5 and 6,recruitment into the study will need tooccur on a rolling basis over a period of atleast six months. Staff in the First ContactTeam(s) will need to apply a screeningquestionnaire to all those coming intocontact with the local authority requestingsocial care support over the capture period.All those people identified as eligible basedon their responses to the screeningquestionnaire should be invited toparticipate in the study. Staff in the First
FIGURE 11: ILLUSTRATIVE SAMPLE RECRUITMENT FLOWCHART
Enquiry is about social care needsEnquiry about otherareas (e.g. bus pass;other local services)
Person needswithin study’seligibility criteria
Person contacted byresearch team
Study baseline sample
Person needsabove study’seligibility criteria
FIRST POINT OF CONTACT TEAM
RESEARCH TEAM
Population of older people contacting local council first pointof contact system (or agency acting on council’s behalf)
Person acceptsinvitation toparticipate in study
Assumption: 10% recruitment rate Person
acceptsbaselineinterview
Assumption: 75%conversionrate

Contact Team(s) will need to provideinformation about the study to ensure thatthe study meets ethical and data protectionrequirements for the handling and transferof the contact details of people who arewilling to participate to the research team.
It is unlikely that information regarding theincome and wealth of individuals could becollected at the point of first contact. Thestudy will therefore include individualsregardless of whether they would meet thelocal authority means-test.
6.2.3 CARERS IN THE STUDY
The main study will explore care outcomesfor both older people and their carers. Thesampling of carers will be driven by thesample of older people with low/moderateneeds in the study, in that the study willseek to identify and recruit their maincarers. This means that carers will need tobe recruited into the study by fieldworkersvia contact with the older person.
An important consideration for the mainstudy will be how to define carers’ eligibilitycriteria. Carers could be defined as peopleproviding social care support (defined interms of support with shortfalls in ADLs,IADLs and associated needs such associal isolation) on an unpaid and informalor semi-formal basis to someone withwhom they have a pre-existingrelationship, e.g. because they are family,friends or neighbours.
Individuals should be considered as unpaidcarers and included in the study even ifthey receive direct payments, carers’allowance and/or occasional gifts from theperson being looked after.
When multiple carers exist for the sameperson, we suggest that only the maincarer, defined as the person providing thegreatest number of hours of care perweek, should be invited to participate inthe study.
A full description of the caring networks(including the number of carers available,sharing of caring tasks across them andrelationship to the person withlow/moderate needs) should be obtainedfrom the interviews with the person withlow/moderate needs and their main carer.
From the point of view of the planning andcosting of the data collection, it is
important to have an estimate of theproportion of older people who are likely tohave an informal carer, and to understandthe relationship between the carer and theperson being cared for, particularly whetherthe carer co-resides with the older person.
Based on analyses of the Health Survey forEngland 2011 to 2014 prepared for the CarePolicy and Evaluation Centre (CPEC)macrosimulation model of long-term caredemand and expenditure (Wittenberg andHu, 2015), approximately 60% to 65% ofolder people with low/moderate needs inEngland who approach local authorities forhelp have a carer. The lower estimate isbased on the assumption that older peopleapproaching the local authority have thesame likelihood of having a carer as thosereceiving LA-supported home care; thehigher estimate is based on theassumption that the likelihood is the sameas older people living in the community.
The percentage of people receivinginformal care does not vary extensively bydegree of disability as measured bylimitations with ADLs and IADLs, althoughpercentages are higher among peopleunable to carry out ADL limitationscompared to people reporting onlydifficulties carrying out ADLs and IADLs.
The PSSRU model can also provide anestimate of the likely percentage ofinformal carers that co-reside with theolder person, an important data fieldworkconsideration. It suggests that slightlymore than half of older people with informalcarers have a co-resident carer and closerto 60% have an extra-residential carer.Percentages do not add up 100 as roughly10% of older people with informal carerswill have both extra-residential and co-residential carers.
59

6.3 MANAGEMENT OF THE FIELDWORK
6.3.1 DATA COLLECTION STRATEGY
We have assumed a low (but realistic)recruitment rate into the study, which whencombined with estimates of the numberscontacting social services on a monthlybasis suggests that each site may produceonly a few contacts per week (see Section5.2). To collect data efficiently, the surveyorganisation responsible for the fieldworkwould ideally distribute batches of contactsthat are closely located to each interviewerso that interviewers can organise multipleinterviews for each day and thus minimisetravel and associated costs. However, thesurvey organisations interviewed felt therewould be little opportunity to clustercontacts in this way for this study withoutcompromising significantly the timescalefor the collection of the baseline data (andsubsequent waves). Our previousexperience suggests that waiting for acritical mass of contacts may beundesirable for other reasons, as it mayaffect the conversion rate of recruitedparticipants to achieved interviews. Theresearch team will need to be aware of theeffects of slow recruitment into the studyand ensure that the fieldwork is managedappropriately.
For baseline interviews to capture thesituation at the time the person contactstheir council the time between contactwith the local authority and the baselineinterview will need to be kept to aminimum. The concern being that if thebaseline interview takes place severalweeks after the first contact is made withthe local authority, then the older personmay already have started to receiveadditional support, or his/her situationmight have changed in other ways. Thefieldwork companies interviewed felt thatthe minimum time between recruitmentinto the study and baseline interview was
likely to be between four to six weeks. Thistimescale reflects potential delays receivingthe contact details, processing of thedetails in management systems, allocatingthe contact to an interviewer, makingcontact with the respondent and arrangingan appointment for an interview at a timethat is mutually convenient to theinterviewer and the older person.
There is little evidence to assess whether atimeframe of four to six weeks fromrecruitment to baseline interview would beshort enough to ensure the interviewreflects the true baseline. Interviews withlocal authority staff did not provide a clearindication of the average time betweencontacting the local authority and the startof the support package. It seems likely todepend on the type of information given bythe member of the First Contact Team andwhether a further assessment is carriedout. All of these aspects vary considerablyacross local authorities, meaning that it willbe important to make this assessment on acase-by-case basis for each local authoritysite. From the outset it will be importantfor the research team to plan foralternative approaches to conducting thebaseline interviews and gathering thebaseline data. The research team mayalso need to consider whether to place arestriction on the time to baselineinterview, bearing in mind theconsequences this is likely to have on thesample size and the quality of theinformation gathered.
In line with recent social care evaluations,and following our discussions with surveycompanies, we recommend that interviewsshould be administered using computer-assisted personal interviewing software.
6.3.2 TIMING OF INTERVIEW WAVES
To capture information on changes incircumstances (including needs andservice receipt) and assess outcomes forolder people and the wider impact of caremodels, the study will need to capture datafrom older people and their carers atseveral time points. Based on discussions
with local authorities, we suggest that theresearch team considers the followingintervals for data collection:
• A baseline data collection as soon aspossible after recruitment into the studyto capture the needs, circumstances and
60
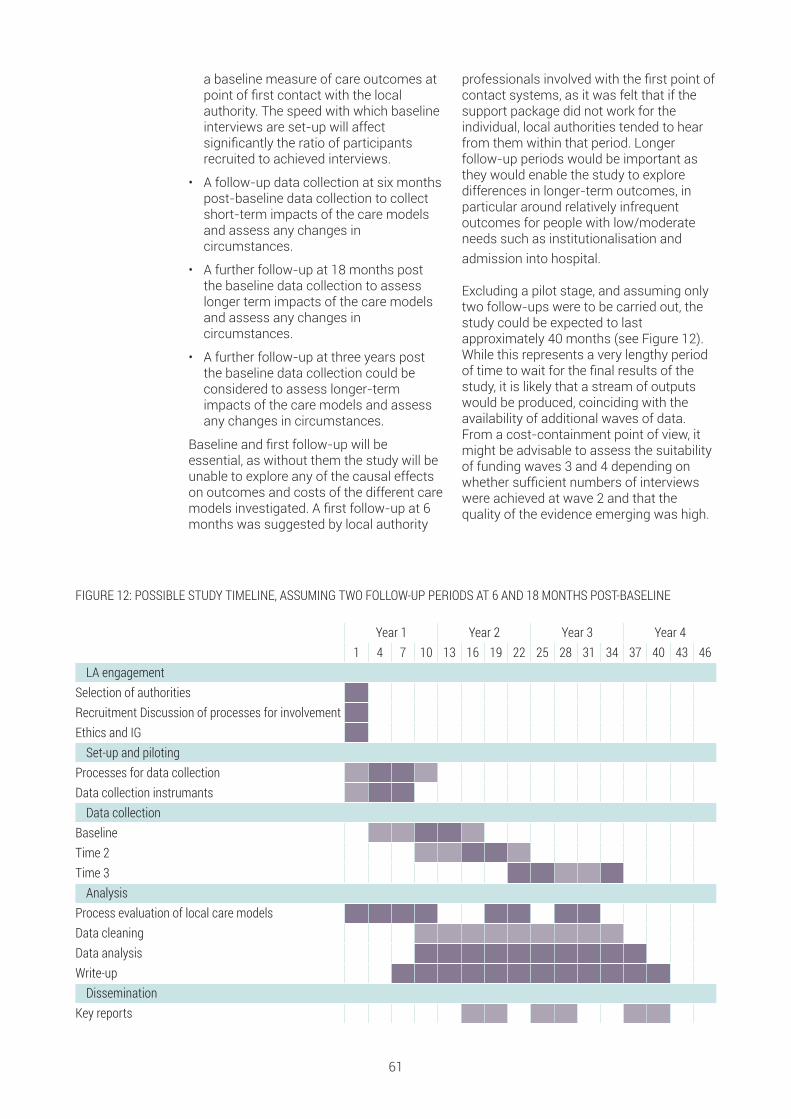
a baseline measure of care outcomes atpoint of first contact with the localauthority. The speed with which baselineinterviews are set-up will affectsignificantly the ratio of participantsrecruited to achieved interviews.
• A follow-up data collection at six monthspost-baseline data collection to collectshort-term impacts of the care modelsand assess any changes incircumstances.
• A further follow-up at 18 months postthe baseline data collection to assesslonger term impacts of the care modelsand assess any changes incircumstances.
• A further follow-up at three years postthe baseline data collection could beconsidered to assess longer-termimpacts of the care models and assessany changes in circumstances.
Baseline and first follow-up will beessential, as without them the study will beunable to explore any of the causal effectson outcomes and costs of the different caremodels investigated. A first follow-up at 6months was suggested by local authority
professionals involved with the first point ofcontact systems, as it was felt that if thesupport package did not work for theindividual, local authorities tended to hearfrom them within that period. Longerfollow-up periods would be important asthey would enable the study to exploredifferences in longer-term outcomes, inparticular around relatively infrequentoutcomes for people with low/moderateneeds such as institutionalisation andadmission into hospital.
Excluding a pilot stage, and assuming onlytwo follow-ups were to be carried out, thestudy could be expected to lastapproximately 40 months (see Figure 12).While this represents a very lengthy periodof time to wait for the final results of thestudy, it is likely that a stream of outputswould be produced, coinciding with theavailability of additional waves of data.From a cost-containment point of view, itmight be advisable to assess the suitabilityof funding waves 3 and 4 depending onwhether sufficient numbers of interviewswere achieved at wave 2 and that thequality of the evidence emerging was high.
61
FIGURE 12: POSSIBLE STUDY TIMELINE, ASSUMING TWO FOLLOW-UP PERIODS AT 6 AND 18 MONTHS POST-BASELINE
Year 1 Year 2 Year 3 Year 41 4 7 10 13 16 19 22 25 28 31 34 37 40 43 46
LA engagementSelection of authoritiesRecruitment Discussion of processes for involvementEthics and IGSet-up and piloting
Processes for data collectionData collection instrumantsData collection
BaselineTime 2Time 3Analysis
Process evaluation of local care modelsData cleaningData analysisWrite-upDissemination
Key reports
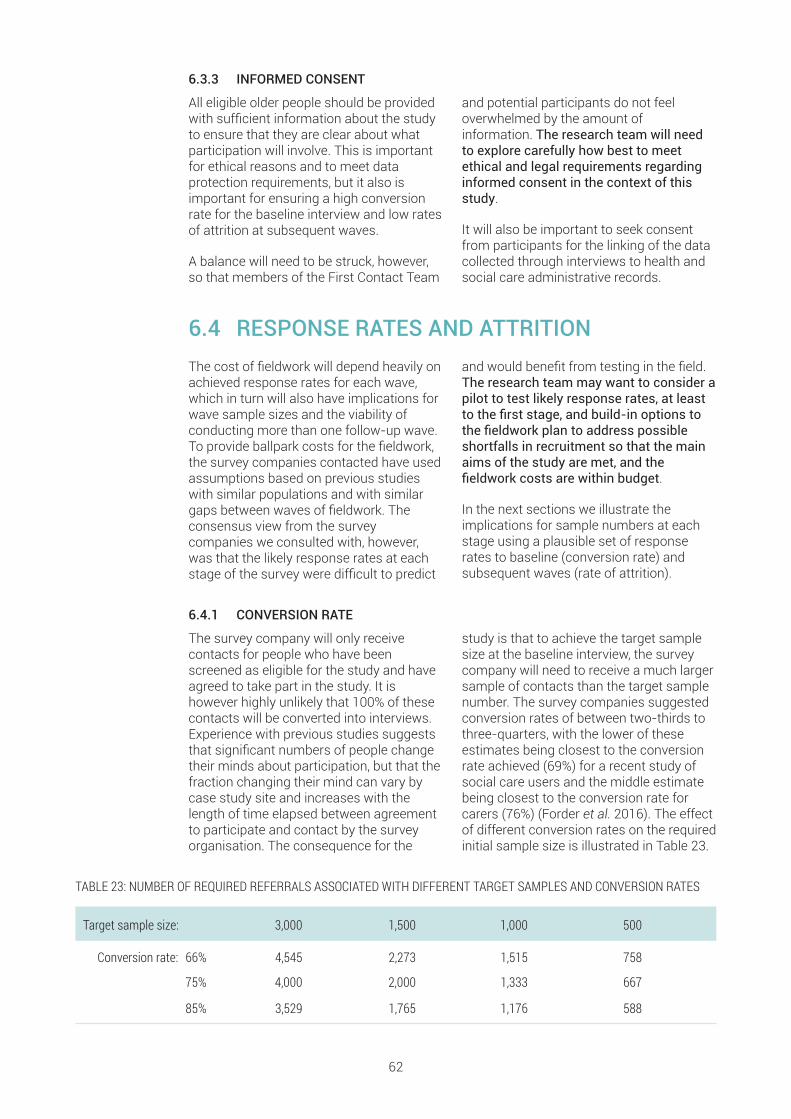
6.3.3 INFORMED CONSENT
All eligible older people should be providedwith sufficient information about the studyto ensure that they are clear about whatparticipation will involve. This is importantfor ethical reasons and to meet dataprotection requirements, but it also isimportant for ensuring a high conversionrate for the baseline interview and low ratesof attrition at subsequent waves.
A balance will need to be struck, however,so that members of the First Contact Team
and potential participants do not feeloverwhelmed by the amount ofinformation. The research team will needto explore carefully how best to meetethical and legal requirements regardinginformed consent in the context of thisstudy.
It will also be important to seek consentfrom participants for the linking of the datacollected through interviews to health andsocial care administrative records.
6.4 RESPONSE RATES AND ATTRITIONThe cost of fieldwork will depend heavily onachieved response rates for each wave,which in turn will also have implications forwave sample sizes and the viability ofconducting more than one follow-up wave.To provide ballpark costs for the fieldwork,the survey companies contacted have usedassumptions based on previous studieswith similar populations and with similargaps between waves of fieldwork. Theconsensus view from the surveycompanies we consulted with, however,was that the likely response rates at eachstage of the survey were difficult to predict
and would benefit from testing in the field.The research team may want to consider apilot to test likely response rates, at leastto the first stage, and build-in options tothe fieldwork plan to address possibleshortfalls in recruitment so that the mainaims of the study are met, and thefieldwork costs are within budget.
In the next sections we illustrate theimplications for sample numbers at eachstage using a plausible set of responserates to baseline (conversion rate) andsubsequent waves (rate of attrition).
6.4.1 CONVERSION RATE
The survey company will only receivecontacts for people who have beenscreened as eligible for the study and haveagreed to take part in the study. It ishowever highly unlikely that 100% of thesecontacts will be converted into interviews.Experience with previous studies suggeststhat significant numbers of people changetheir minds about participation, but that thefraction changing their mind can vary bycase study site and increases with thelength of time elapsed between agreementto participate and contact by the surveyorganisation. The consequence for the
study is that to achieve the target samplesize at the baseline interview, the surveycompany will need to receive a much largersample of contacts than the target samplenumber. The survey companies suggestedconversion rates of between two-thirds tothree-quarters, with the lower of theseestimates being closest to the conversionrate achieved (69%) for a recent study ofsocial care users and the middle estimatebeing closest to the conversion rate forcarers (76%) (Forder et al. 2016). The effectof different conversion rates on the requiredinitial sample size is illustrated in Table 23.
62
TABLE 23: NUMBER OF REQUIRED REFERRALS ASSOCIATED WITH DIFFERENT TARGET SAMPLES AND CONVERSION RATES
Target sample size: 3,000 1,500 1,000 500
Conversion rate: 66% 4,545 2,273 1,515 758
75% 4,000 2,000 1,333 667
85% 3,529 1,765 1,176 588

6.4.2 ATTRITION RATES
Participants may not take part insubsequent waves out of choice, or theymay be lost to follow-up due to for instancea change of residence or an admission tohospital. A proportion may also diebetween waves. The ill-health and frailty ofmany older people, particularly those withsocial care needs, means that we mightexpect fairly high rates of attrition betweenwaves. The evaluation of reablement byGlendinning et al. (2010) provides anindication of the likely attrition rate for themain study, given the similarities betweenthe target group for the main study and thecharacteristics of recipients of reablementinterventions. The study reported highattrition rates for both study arms over time(control 41% and intervention 45% over a12-month period), with a high proportion ofparticipants dying during the study period.Lower rates of attrition of 32% at 12months were observed in the personalhealth budgets evaluation, anotherevaluation for a comparable target group(Forder et al., 2012).
Our assumptions about attrition are basedon the experience of survey companies oflongitudinal surveys with similar
populations and similar gaps between thefieldwork stages. The rates of attritionsuggested by survey companies werebroadly similar – in the region of one-thirdto a quarter of cases lost at each stage.The survey companies suggested thatattrition may increase over the waves.These assumptions are perhaps optimisticgiven the reported attrition for the twostudies noted above. The effect on theachieved sample at each wave of attritionat these levels is illustrated in Table 24.
One aspect the research team will need toconsider in follow-up waves is the potentialthat carers’ roles may change as aconsequence of changes in the health andfrailty of the older person. New carers couldstart providing help and may take over asthe main carer. It is also possible that overthe course of the study some older peoplemay lose the capacity to participate. Ratherthan dropping these cases, it may bedesirable for carers to act as proxy-respondents for the older person. Theresearch team will need to consider howto address these challenges in the designof the study, by collecting appropriateinformation and consent at baseline.
63
TABLE 24: RESPONSE RATES AT EACH SURVEY WAVE
CONSTANT RESPONSE RATES DECREASING RESPONSE RATES Response rate Estimated sample size at each stage Response rate Estimated sample size at each stage
Baseline 3,000 1,500 1,000 500 3,000 1,500 1,000 500
6 months 75% 2,250 1,125 750 375 75% 2,250 1,125 750 375
18 months 75% 1,688 844 563 281 70% 1,575 788 525 263
3 year 75% 1,266 633 422 211 65% 1,024 512 341 171
6.4.3 SAMPLE RETENTION AT FOLLOW-UP WAVESThere is a large literature on nonresponseand strategies for improving response ratesto surveys (see for instance Dillman, Smythand Christian (2014), Ryu, Couper andMarans (2006) and Yu and Cooper (1983).Given the effects of nonresponse on thepower of the study to detect differences inoutcomes at follow-up waves, as illustratedin Table 25, it will be important for theresearch team to consider multiplestrategies to maximise response rates toeach wave. Options which should be
considered are the use of incentives forstudy participants; the design, accessibilityand attractiveness of advance materials;strategies to build a rapport betweeninterviewer and participants; and activitiesdesigned to keep in touch between wavesto provide the research team with a meansof identifying possible changes of addressor circumstances. The research team mayalso want to consider an allowance forinterviewers to carry out tracing ofparticipants in the field for follow-up waves.

6.5 QUESTIONNAIRES AND THEIR MODE OFADMINISTRATIONThe proposed content of the questionnairesis outlined in Section 4 and should coverthe following areas: service receipt, socialcare needs indicators, outcome indicatorsand personal characteristics andcircumstances. Based on previousexperience we expect each questionnaire totake between 45 mins to 1 hr to administer.The questionnaire is likely to have a coreset of questions that will remain the samethroughout the study, although a small setof questions may differ between thebaseline and each follow-up interview.Given the length of the questionnaire andthe type of information collected, paper-based self -completion should be ruled outas the primary data collection mode16. Bothtelephone and face-to-face interviewswould be appropriate methods forcollecting the types of data outlined, but werecommend that the research team useface-to-face interviews as the primarymode of data collection due primarily tothe length of the interview, but also tobuild rapport between the interviewersand participants which is important for amulti-wave study.
There are additional benefits to face-to-face interviews, particularly for olderpeople. First, face-to-face interviews aidcommunication, which is important giventhe likelihood that some participants mayhave hearing impairments or difficulties
processing complex information. Secondly,previous experience suggests that face-to-face interviews can facilitate therecruitment of carers into the study,particularly co-resident carers who arelikely to be present at the interview.Interviewers could try to scheduleinterviews to coincide with visits by extra-resident carers to facilitate recruitment ofsuch carers into the study.
Telephone interviews are a cheaper methodof data collection and could potentially beconsidered for follow-up waves when arapport is already established, andquestionnaires are likely to be quicker toadminister. This may be a particularlyattractive option for the carer interviews, asit could help to address some of thesensitivities that the research team arelikely to encounter trying to interview boththe older person and carer. For bothindividuals, but particularly carers, some ofthe interview content may be sensitive anddifficult for them to discuss in the presenceof the person with care needs (e.g. impactof caring on their health or employment).There may therefore be an advantage fordata quality in conducting a telephoneinterview which could be arranged to takeplace in private. The research team maywant to consider using telephoneinterviews for carers, particularly forfollow-up waves of the study. They mayalso want to consider options for ensuringinterviews can be conducted in privatewhere necessary.
6.5.1 DEVELOPMENT AND TESTING OF THE QUESTIONNAIRES
The proposed approach, outlined in Section4, suggests using established questionsthat have been widely used in other studiesfor the main study questionnaires. Thequestionnaires should therefore for themost part only require piloting for flow anderrors. It is, however, likely that some newquestions will be needed, particularly forcapturing some of the more novel servicesfor people with low-level needs. Given thelikelihood that some questions will need tobe developed we would recommend thatthe research team include some capacity
for testing and developing questions in thebudget.
The screening questionnaire for assessingeligibility for the study will requiredevelopment. Given the importance of thisquestionnaire for the success of the study,the research team will want to includesome capacity to develop and thoroughlytest this questionnaire with older peopleand local authority First Contact Teamstaff (see Section 6.2).
64

It will be important for the main study toexplore arrangements for data sharingbetween health and social careorganisations and the study, in particularregarding data describing the use of careservices. Potentially, these data couldimprove significantly some of the evidenceon care use collected through user andcarer interviews, by providing a continuouspicture of the use of care services over thecourse of the study, with precise dates ofchanges in consumption and possibly with
information regarding associated costs.These data would not present some of theproblems of recall bias associated withretrospective, self-reported data collection.
These linked administrative data wouldhave some limitations, however: privatesocial care provision would not be covered,and it is unlikely that universal low-levelservices would be recorded systematicallyin a form that could be shared with themain study.
6.6 DATA REPRESENTATIVENESS A key consideration for the study will be theextent to which its findings can be used toinform policy in other areas in England. Therepresentativeness of the main study andthe transferability of its results will beaffected by three considerations:
• The representativeness of the sample ofcases interviewed by the study relative tothe population of older people withlow/moderate needs contacting theauthorities in the study.
• The representativeness of the caremodels for supporting people withlow/moderate care needs of the localauthorities in the study.
• The inclusion of councils with a broadrange of characteristics likely to mediatethe success of those models of support(e.g. authority type, socio-economicprofile, key health and social care systemarrangements).
6.6.1 CORRECTING FOR BIASES IN THE SAMPLE OF INDIVIDUALS SAMPLED
The study should attempt to collectevidence about the representativeness ofthe sample of users interviewed relative tothe population of older people withlow/moderate needs contacting authoritiesfor support.
It will be particularly important to negotiatewith participating authorities access toaggregate data about the characteristics ofall individuals contacting the authority forsocial care support during the baseline datacollection period. This information could beused subsequently to identify possiblebiases in the sample of cases interviewed,
and to reweight the samples obtainedduring the analysis in order to attempt tocorrect for any such biases.
Our interviews with local authorities andanalyses of local assessmentdocumentation suggests that the type ofinformation collected at first point ofcontact varies considerably across areas,so it would not be possible to use thesedata to assess eligibility for the study on acomparable basis. Nevertheless, these datacould potentially be used to assess therepresentativeness of the achieved samplewithin each authority.
6.6.2 TESTING FOR THE REPRESENTATIVENESS OF PARTICIPATING AUTHORITIESAND GROSSING UP TO NATIONAL LEVELS
The typologies of local care modelsdeveloped using the methods in Section3.4, combined with information about localcharacteristics (e.g. LA type) should allowthe reweighting of the study sample toEnglish-level patterns. The success of anygrossing-up at the national-level of theresults of the main study will depend
critically on whether the relevant caremodels are represented in the study, as wellas whether the authorities in the study aredistributed across other importantdimensions of characteristics, such asrurality, population density, socioeconomiccharacteristics and deprivation.
65

The national-level representativeness ofthe individual-level characteristics of thesample in the study could be tested (andreweighted accordingly) by comparing the
study sample against nationallyrepresentative surveys such as ELSA, HSEand US.
6.7 THE ROLE OF A PILOTHigh recruitment and response rates toeach survey wave will be critical to thesuccess of the main study and will affectcritically the costs of the fieldwork. Therange of plausible estimates of recruitmentand response rates based on previoussimilar studies is quite wide. This meansthere is some uncertainty over thenecessary initial numbers to be recruited toachieve the desired sample size, the costsof the study and the viability of later follow-up waves, especially for the carer sample.Given the importance of these elements forthe success of the study and the largecosts of the main stage fieldwork there is astrong case for carrying out a significantpilot study across multiple local authoritysites. The research team may thereforewant to consider a pilot study whichwould aim to (i) inform the research teamabout likely recruitment and responserates for both older people and carers atbaseline, the proportion of older peoplewho are likely to have a main carer who isco-resident or extra-resident, and theproportion who are happy to be contactedagain at six months, (ii) examine ways ofmaximising recruitment and responserates for both older people and carers,looking at options for processes andscreening and recruitment materials, and(iii) refine in partnership with localauthority professionals the definition ofthe criteria to be applied acrosscollaborating authorities for selectingcases into the study.
A further area that it would be important toaddress in a pilot is the arrangementsbetween the research team (includingfieldwork organisation) and the localauthority for processing participants. The
smooth operation of this stage is critical forensuring that the baseline interviews areconducted as quickly as possible afterrecruitment of individuals into the study. Animportant aspect to assess would be thelikelihood of achieving a baseline interviewprior to the older person starting to receiveadditional support. The pilot would need toaddress this question directly. Givendifferences across authorities in how FirstContact Teams operate and in the types ofsupport provided to those who contact theauthority the research team may find itnecessary to pilot this process in all studysites. The research team may want toexplore other options for conducting thebaseline interviews in the pilot, e.g. usingretrospective questions, collecting keyneeds and outcomes data at the point offirst contact and so on.
In addition to these aspects, it would alsobe important to pilot the questionnaires foreach survey wave. We would anticipate thatthese questionnaires could be piloted as a‘dry-run’ of the main stage rather than alarge-scale pilot given the questionnairesshould be composed mainly of widely usedand tested sets of survey questions.
In the summary, a pilot would provide afirmer basis on which to plan the detail ofthe main stage survey and an opportunityto re-scope some elements of the study tofit the cost envelope should theassumptions set out here prove to be toooptimistic (or pessimistic) or should someof the proposed processes prove infeasiblein certain sites. It would provide theresearch team with greater confidence inthe viability of the main survey.
66

Ballpark costs for the fieldwork wereobtained from IPSOS/MORI, GfK andNatcen. These survey companies basedtheir estimates on a brief specificationprovided by LSE researchers and furtherdiscussions with the scoping studyresearch team. The survey organisationsmade a number of assumptions about keyelements of the study, some of whichvaried between estimates provided, asfollows:
1. Assumed start date of the study(variable: 2018, 2019)
2. The number of local authority sites(variable: 10, 15, 30)
3. The achieved sample at baseline forolder people (variable: 3,000; 1,500;1,000)
4. The proportion of older people with acarer who could be interviewed and theratio of extra- to co-resident carers(variable: two-thirds, half; ratio of half-half)
5. The number and timing of follow-upinterviews (variable: either 3 or 4 at 6months, 1 year, 18 months. 2 years, 3years)
6. The response rates at each stage of thestudy for both older people and carers(variable: see Tables 24 and 25)
7. The interview mode (variable: all face-to-face, some telephone interviews forlater follow-up interviews with carers)
8. Main questionnaire length (variable: 60-minute for baseline and 45-minute forfollow-ups, 45-minute for baseline and30-minute for follow-ups)
9. Carer questionnaire length (variable:45-minute questionnaire at each wave,30-minute questionnaire at each wave)
10. Overlap between questionnaires atwaves and between the older person
and carer questionnaires (variable: 50,70 and 75% the same)
11. Other elements of the study (variablecosting of pilots, incentives,involvement in questionnaire designand testing, coding of open-endedquestions and strategies formaximising response rates betweenwaves)
To protect commercial interests, the costsare reported below as ranges of values andare not attributed to the survey companies.These costs exclude VAT but includeestimated inflation costs beyond 2018. Toaid comprehension, we have providedsome indication of how the costs differaccording to changes in the keyparameters listed above. Where costs weredirectly comparable between companies(because they used the same coreassumptions) the quotes were fairly similar.
Broadly, it would not be possible to deliverthe fieldwork for a baseline sample of muchmore than a 1,000 older people for under£1m (including VAT) assuming threefollow-up waves of data collection. Evenassuming two follow-up waves of datacollection a baseline sample of 1,500 olderpeople will cost in the region of £1.1m to£1.5m (including VAT). Further follow-upwaves could increase costs to between£1.5 and £1.9m (including VAT). A baselinesample of 3,000 older people, which wouldhave the greatest power to detectdifferences between groups of peoplereceiving different care models, especiallygiven likely rates of attrition, would cost inthe region of £2m (including VAT) for astudy with two follow-up waves andsignificantly over £2m for three follow-upwaves. The fairly wide variability in costsdepends on the assumptions applied aboutthe likely recruitment, conversion andattrition rates for older people and theircarers.
67
7 COSTS OF THE STUDY

The costs of a pilot (including developmentwork) would be a fraction of the costs ofthe main survey and of the variation in theestimated costs of the fieldwork at around£35,000 depending on the size of the pilot.Given its potential to address many of thesignificant uncertainties surrounding theimplementation of the main study, fundinga pilot study appears therefore to be worththe additional costs.
Recruitment rates are also a key parameterin determining the costs of the fieldwork. Ifrecruitment rates are fairly high then ouranalysis in Section 5.2 suggests that forsome of the larger authorities the surveycompanies are likely to receive a goodnumber of contacts on a weekly basis,which reduces the cost of fieldwork. Bycontrast, if recruitment rates are fairly lowthen survey companies will receive very fewcontacts on a weekly basis. This has
consequences for the management of thefieldwork (discussed in Section 6).Estimates of likely recruitment rates aretherefore important for providing indicativecosts of the fieldwork. It will be importantfor the main study’s research team toexplore strategies to maximiserecruitment rates in a pilot to fine-tune themethods for the main stage of the studyand so keeping fieldwork costs down.
In addition to the fieldwork costs, theevaluation will incur other significant costs,including in particular the analysis costs(i.e., the costs of the research team, whichbased on the costs of prior similar largeevaluations are likely to be in excess of£700,000, assuming a four-year study), anyincentives that might be offered to increaselocal authority participation and individuals’recruitment rates into the study and thecosts of purchasing any linked data.
68

The previous section has highlighted the significant costs involved in implementing themain study. The present section provides a summary of the key outputs that would beexpected to emerge from the study, as well as a list of potential additional uses that couldbe made of the evidence generated by the main study.
8.1 KEY STUDY OUTPUTS n A detailed picture of the characteristicsof people with low/moderate care needsapproaching their local council for supportand their carers. If the recommendedtarget number of interviews is achieved, thesample in the study will exceed significantlythe numbers of similar cases available innational surveys such as ELSA and HSEand will provide a richer description of theirsocial care needs, formal and unpaidsupport, and of their quality of life. Thisevidence should inform needs planning bylocal authorities and the design of newforms of support for this target group.
n A detailed understanding of the natureof different care models for supportingindividuals with low/moderate social careneeds. This would represent a keycontribution of the study, given our lack ofunderstanding of the different supportarrangements put in place for this targetgroup. The study will quantify the types andlevels of support provided to differentindividuals by different care models and willbe able to describe patterns of supportthrough time. In addition, the processevaluation will provide evidence about therationale behind the differences ofapproach, the different practicalarrangements in place and the role of localcontext in shaping local care models.
n A comparative analysis of the costsand outcomes of alternative care models.The recommended study approachrepresents an economic evaluation of thedifferent models of support for people with
low/moderate care needs. The quantitativeanalyses will provide estimates of thedifferences between models in outcomesachieved for older people and their carers,as well as estimates of the differences inthe cost of resources. From this evidence,the study should be able to judge therelative cost-effectiveness of differentapproaches for supporting people withlow/moderate needs, taking into accountthe wider effects of different models oncarers and other parts of the health andcare system.
n An analysis of differences in the cost-effectiveness of specific services fordifferent individuals with low/moderatecare needs. In addition to comparing broadcare models, the evaluation will collectevidence about the specific services usedby the study participants. Usingmultivariate regression models, theevaluation should explore the way in whichincreases in different services lead toimprovements in care outcomes, theirrelative costs, and the way in which thecost-effectiveness of different services varydepending on the need-relatedcharacteristics of the care recipients. Fromthis evidence the study should be able toassess to some degree the relative cost-effectiveness of different services fordifferent groups of care recipients.
n An analysis of the likely effects ofrecent changes in social care provision. Bycomparing more generous care modelswith those providing less support, the main
69
8 SUMMARY OF EXPECTEDOUTCOMES FROM THE MAINSTUDY

study should inform our understanding ofthe likely consequences of the recentchanges in levels of statutory social caresupport in England. The study should beable to comment on the likelyconsequences for levels of unmet needs,care outcomes and the health and socialcare costs of providing different levels ofsocial care support for people withlow/moderate needs. The main study willnot provide, however, detailed quantitativeestimates of the changes in England inpatterns of support between specific yearsand of their consequences on wellbeing
and health and social care costs. Derivingsuch estimates would require comparableevidence about the past which is notpossible to collect retrospectively.
n Evidence to support the development ofrecommendations about the most cost-effective strategy for supporting olderpeople with low/moderate care needs. Thefindings above will allow the study torecommend strategies and associatedsystem arrangements for supportingpeople with low/moderate care needsacross local authorities in England.
8.2 OTHER USES OF THE MAIN STUDY EVIDENCEThe main study will collect a large amount of longitudinal quantitative data about needs,services and outcomes, and a wealth of information regarding local policies and carearrangements. This evidence could be used for a wide range of additional analyses, suchas:
n Changes in the needs profile of peoplewith low/moderate needs over time, andrates of transition between disabilitystates. Understanding individuals’ needsprogression through time is crucial forinstance when designing services andsystems which match the nature of theneeds progression. Such information isalso important for developing dynamicsimulation models of the social caresystem.
n Understanding lifetime patterns of carecosts: the main study should also provideinvaluable information about patterns ofcare use and transitions between servicesthrough time for older people just below theneeds eligibility threshold. Usingadministrative data, this information onlyexists at present for people who receivecore social care packages.
n Understanding the causal relationshipbetween needs, services and outcomes: bycollecting evidence about care needs,services and outcomes over a long period,the study evidence could be used toestimate the long-term effects ofdifferences in levels of support, andtherefore contribute significantly to ourunderstanding of the cost effectiveness ofdifferent strategies for prevention andforms of early intervention. A key policyquestion that could be investigated usingthe main study data is the interrelationship
between health and social care service use.
n The interrelationship through timebetween formal and unpaid care. There islittle research investigating theinterrelationship between formal andunpaid care, in part due to a lack ofavailable data. The data collected could beused to quantify the extent of substitutionbetween formal and informal care and toexplore differentiation in care tasks byformal and unpaid carers, and the factorsthat explain differentiation.
n Understanding the causal relationshipbetween formal care services andoutcomes for unpaid carers: relatively fewstudies have attempted to explore theeffect of formal services on outcomes forunpaid carers, largely due to a lack ofappropriate data and the challenges ofestimation with available datasets. It istheorised that outcomes for carers fromformal services (mainly provided to theolder people with care needs) are largelymediated through the effect of formal careon changes in the intensity of unpaid careand care tasks and on outcomes for olderpeople with care needs, which induces anemotional response in the unpaid carer(e.g. of relief, see Bobinac et al 2010, Al-Janabi 2016). The evidence from the mainstudy provides a suitable dataset to testthis theory and explore the interrelationshipbetween the quality of life of dependent
70

older people and their carers in the contextof formal care provision.
n Quantification of unmet needs: themeasurement of unmet needs related tosocial care is a controversial topic due tothe lack of an agreed definition of thespecific needs that should be supported,and in particular of the way in which theseneeds should be met. Previous studieshave, however, developed estimates ofunmet need in the social care system (seein particular NatCen Social Research andIpsos MORI (2017)). The evidence collectedin the main study of the types of supportprovided to older people with low/moderatecare needs would enable the estimation ofsimilar unmet needs measures to thoseused in previous studies, but this evidencewould be available for a much largersample and could be analysed alongsidedetailed information on care models tobetter contextualise and interpret the
findings. Estimates of unmet need wouldrelate specifically to older people withlow/moderate needs, rather than to thewhole population of individuals with socialcare needs, but such analysis would greatlyenhance our understanding of the level andtypes of unmet needs among this group ofolder people.
n The appropriateness of differentmeasures for capturing service outcomesfor older people with low/moderate careneeds. Few studies have explored theeffects of care and support services onolder people with low/moderate careneeds. The evidence collected from thisstudy would provide important informationabout the sensitivity of different measuresand therefore the most appropriate set ofoutcome indicators for future evaluationsof care and support services for olderpeople with low/moderate care needs.
71

ADASS LGA and Socitm (2017) Online Tools Within a Needs Assessment Process:ENGAGING CITIZENS ONLINE BRIEFINGS 05.
Al-Janabi, H., Flynn, T. and Coast, J. (2011) ‘Estimation of a Preference-Based CarerExperience Scale’, Medical Decision Making, 33(3), pp. 458–468.
Alexandre, T. da S. et al. (2016) ‘Gender Differences in the Incidence and Determinants ofComponents of the Frailty Phenotype Among Older Adults: Findings From the SABEStudy’, Journal of Aging and Health, p. 898264316671228.
Ambrose, A. F., Paul, G. and Hausdorff, J. M. (2013) ‘Risk factors for falls among olderadults: a review of the literature’, Maturitas, 75(1), pp. 51–61.
Armstrong, N. et al. (2017) Independent evaluation of the feasibility of using the PatientActivation Measure in the NHS in England. Available at:https://lra.le.ac.uk/bitstream/2381/40449/2/PAM learning set_final evaluationreport_final.pdf (Accessed: 6 March 2018).
Bandeen-Roche, K. et al. (2006) ‘Phenotype of frailty: characterization in the women’shealth and aging studies’, The Journals of Gerontology Series A: Biological Sciencesand Medical Sciences, 61(3), pp. 262–266.
Bauer, A. et al. (2017) ‘Costs and economic consequences of a help-at-home scheme forolder people in England’, Health & Social Care in the Community, 25(2), pp. 780–789.doi: 10.1111/hsc.12372.
Bowling, A., Grundy, E. and Farquhar, M. (1997) Living well into old age : three studies ofhealth and well-being among older people in East London and Essex, Age ConcernEngland.
Bulamu, N. B., Kaambwa, B. and Ratcliffe, J. (2015) ‘A systematic review of instruments formeasuring outcomes in economic evaluation within aged care’, Health and Quality ofLife Outcomes, 13(1), p. 179. doi: 10.1186/s12955-015-0372-8.
Caiels, J. et al. (2010) Measuring the outcomes of low-level services: Final report, PSSRUCanterbury,: PSSRU Discussion Paper 2699.
Campbell, A. J. et al. (1990) ‘Anthropometric measurements as predictors of mortality in acommunity population aged 70 years and over’, Age and Ageing, 19(2), pp. 131–135.
Campbell, A. J. and Buchner, D. (1997) ‘Unstable disability and the fluctuations of frailty’,Age and ageing, 26(4), pp. 315–318.
Coast, J. et al. (2008) ‘Valuing the ICECAP capability index for older people’, Soc Sci Med,67.
CSCI (2008) Cutting the cake fairly. CSCI review of eligibility criteria for social care. London:The Commission for Social Care Inspection. Available at:http://www.cpa.org.uk/cpa/cutting_the_cake_fairly.pdf.
72
9 REFERENCES

Davies, B. P. P., Fernández, J. L. and Nomer, B. (2000) Equity and Efficiency Policy inCommunity Care: Service Productivities, Efficiencies and their Implications. Aldershot:Ashgate. Available at: http://kar.kent.ac.uk/27426/ (Accessed: 17 March 2012).
Davis, J. C. et al. (2013) ‘A Comparison of the ICECAP-O and EQ-5D in a Falls PreventionClinical Setting: Are they complements or substitutes?’, Qual Life Res., 22(5), pp. 969–977.
Dillman, D. A., Smyth, J. D. and Christian, L. M. (2014) Internet, phone, mail, and mixed-mode surveys : the tailored design method, Wiley. Available at:https://www.wiley.com/en-gb/Internet,+Phone,+Mail,+and+Mixed+Mode+Surveys:+The+Tailored+Design+Method,+4th+Edition-p-9781118456149 (Accessed: 23 April 2018).
Donoghue, K. J. (2004) Measuring Coping : Evaluating the Psychometric Properties of theCOPE. Available at: http://ro.ecu.edu.au/theses_hons/968 (Accessed: 6 March 2018).
Dunatchik, A. et al. (2016) Predicting unmet social care needs and links with well-being:Findings from the secondary analysis, London: NatCen & Ipsos MORI.
Dunn, J. E. et al. (1992) ‘Mortality, disability, and falls in older persons: the role of underlyingdisease and disability’, American Journal of Public Health, 82(3), pp. 395–400.
Espinoza, S. E. and Fried, L. P. (2007) ‘Risk factors for frailty in the older adult’, ClinicalGeriatrics, 15(6), pp. 37–44.
Fernandez, J.-L. et al. (2014) Evaluation Of The June 2014 Draft National MinimumEligibility Criteria For Social Care, Edited by P. D. D. Paper, London: PSSRU DiscussionPaper DP2880.
Fernandez, J.-L. and Zigante, V. (2017) The Potential Gains From Improving Individual-Level Data Linkage in the English Social Care Aystem. PSSRU Discussion Paper 29332017/ID 5340, Edited by PSSRU, London.
Fernandez, J.-L., Snell, T. and Wistow, G. (2013) Changes in the patterns of social careprovision in England: 2005/6 to 2012/13, London School of Economics, London:PSSRU Discussion Paper 2867.
Flynn, T. et al. (2011) ‘Assessing Quality of Life among British Older People Using theICEPOP CAPability (ICECAP-O) Measure’, Appl Health Econ Health Policy, 9(5), pp.317–329.
Folstein, M. F., Folstein, S. E. and McHugh, P. R. (1975) ‘“Mini-mental state”: a practicalmethod for grading the cognitive state of patients for the clinician’, Journal ofPsychiatric Research, 12(3), pp. 189–198.
Forder, J. et al. (2012) Evaluation of the personal health budget pilot programme, PSSRU.
Forder, J. et al. (2016) Identifying the impact of adult social care: Interpreting outcome datafor use in the Adult Social Care Outcomes Framework, QORU Discussion Paper 2892.
Fox, D., Holder, J. and Netten, A. (2010) Personal Social Services of Adult Carers in England2009-2010: Survey development project – Technical Report, PSSRU DiscussionPaper No. 2643 (2), Canterbury.
Fried, L. P. et al. (2001) ‘Frailty in older adults: evidence for a phenotype’, The Journals ofGerontology Series A: Biological Sciences and Medical Sciences, 56(3), pp. M146–M157.
Glendinning, C. et al. (2008) Evaluation of the Individual Budgets Pilot Programme. FinalReport. York: Social Policy Research Unit, University of York. Available at:http://www.dh.gov.uk/en/Publicationsandstatistics/Publications/PublicationsPolicyandGuidance/DH_089505.
73

Glendinning, C. et al. (2010) Home care re-ablement services: Investigating the longer-term impacts (prospective longitudinal study), York: Social Policy Research Unit,University of York.
Golden, J. et al. (2009) ‘Loneliness, social support networks, mood and wellbeing incommunity-dwelling elderly’, International Journal of Geriatric Psychiatry, John Wiley& Sons, Ltd., 24(7), pp. 694–700. doi: 10.1002/gps.2181.
Goranitis, I., Coast, J. and Al-Janabi, H. (2014) ‘An investigation into the construct validityof the Carer Experience Scale (CES)’, Qual Life Res, 23(6), pp. 1743–1752.
Grewal, I. et al. (2006) ‘Developing attributes for a generic quality of life measure for olderpeople: Preferences or capabilities?’, Soc Sci Med, 62.
Guralnik, J. M. et al. (1994) ‘A short physical performance battery assessing lowerextremity function: association with self-reported disability and prediction of mortalityand nursing home admission’, Journal of gerontology, 49(2), pp. M85–M94.
Guyatt, G. H. et al. (1985) ‘The 6-minute walk: a new measure of exercise capacity inpatients with chronic heart failure’, Canadian Medical Association Journal, 132(8), p.919.
Hackert, M. Q. N., Exel, J. van and Brouwer, W. B. F. (2017) ‘Valid Outcome Measures in Carefor Older People: Comparing the ASCOT and the ICECAP-O.’, Value in health : thejournal of the International Society for Pharmacoeconomics and Outcomes Research,Elsevier, 20(7), pp. 936–944. doi: 10.1016/j.jval.2017.03.012.
Henwood, M. (2012) Beyond eligibility. Universal and open access support and social care.London: Melanie Henwood Associates. Available at:http://www.melaniehenwood.com/perch/resources/beyond-eligibility.pdf.
Iinattiniemi, S., Jokelainen, J. and Luukinen, H. (2009) ‘Falls risk among a very old home-dwelling population’, Scandinavian journal of primary health care, 27(1), pp. 25–30.
Isaacs, B. and Neville, Y. (1975) The Measurement of Need in Old People, HMSO, London:Scottish Home and Health Department.
Kaambwa, B. et al. (2008) ‘Costs and health outcomes of intermediate care: results fromfive UK case study sites’, Health & Social Care in the Community, 16.
Kennedy, J. (2001) ‘Unmet and undermet need for activities of daily living and instrumentalactivities of daily living assistance among adults with disabilities: estimates from the1994 and 1995 disability follow-back surveys’, Med Care. Department of CommunityHealth, University of Illinois at Urbana-Champaign, Champaign, IL 61820, [email protected], 39(12), pp. 1305–1312. Available at:http://www.ncbi.nlm.nih.gov/pubmed/11717572.
King, D. et al. (2011) Developing Improved Survey Questions on Older People’s Receipt of,and Payment for, Formal and Informal Care, London: NATCEN. Available at:http://natcen.ac.uk/media/205499/stage-1-report.pdf.
Kingston, A. et al. (2017) ‘Is late-life dependency increasing or not? A comparison of theCognitive Function and Ageing Studies (CFAS)’, The Lancet,. Elsevier, 390(10103), pp.1676–1684. doi: 10.1016/S0140-6736(17)31575-1.
Kinney, R. L. et al. (2015) ‘The association between patient activation and medicationadherence, hospitalization, and emergency room utilization in patients with chronicillnesses: A systematic review’, Patient Education and Counseling, 98(5), pp. 545–552. doi: 10.1016/j.pec.2015.02.005.
Kosberg, J. and Cairl, R. (1986) ‘The cost of care index: a case management tool forscreening informal care providers’, The Gerontologist, 26(3), pp. 273–278.
Leeuwen, K. et al. (2015) ‘Dutch translation and cross-cultural validation of the Adult SocialCare Outcomes Toolkit (ASCOT)’, Health and Quality of Life Outcomes, 13.
74

Link, W. S. (2012) Review of the Impact of Changing Social Care Eligibility Criteria. Availableat: http://www2.westsussex.gov.uk/ds/cttee/hasc/hasc031012i5a.pdf.
Luanaigh, C. Ó. and Lawlor, B. A. (2008) ‘Loneliness and the health of older people’,International Journal of Geriatric Psychiatry, 23(12), pp. 1213–1221. doi:10.1002/gps.2054.
Makai, P. et al. (2014) ‘Quality of life instruments for economic evaluations in health andsocial care for older people: A systematic review’, Soc Sci Med, 102.
Malley, J. N. et al. (2012) ‘An assessment of the construct validity of the ASCOT measure ofsocial care-related quality of life with older people.’, Health and quality of lifeoutcomes, 10(1), p. 21. doi: 10.1186/1477-7525-10-21.
Manthorpe, J. et al. (2018) ‘Frailty and Social Care: Over- or Under-Familiar Terms?’, SocialPolicy & Society, 17(1), pp. 23–33.
Mitnitski, A. B., Mogilner, A. J. and Rockwood, K. (2001) ‘Accumulation of deficits as a proxymeasure of aging’, The Scientific World Journal, 1, pp. 323–336.
Molyneuxa, G. J. et al. (2008) ‘Prevalence and predictors of carer burden and depression incarers of patients referred to an old age psychiatric service’, InternationalPsychogeriatrics, 20, pp. 1193–1202.
Monzani, D. et al. (2015) ‘The Situational Version of the Brief COPE: Dimensionality andRelationships With Goal-Related Variables.’, Europe’s journal of psychology.PsychOpen, 11(2), pp. 295–310. doi: 10.5964/ejop.v11i2.935.
NatCen Social Research and Ipsos MORI (2017) Unmet social care needs and well-being-Final report. NatCen Social Research & Ipsos MORI. Available at:https://www.ipsos.com/ipsos-mori/en-uk/unmet-social-care-needs-and-well-being.
National Institute for Health and Care Excellence (2014) Developing NICE guidelines: themanual. London. Available at: https://www.nice.org.uk/media/default/about/what-we-do/our-programmes/developing-nice-guidelines-the-manual.pdf (Accessed: 27February 2018).
Netten, A. et al. (2012) ‘Outcomes of social care for adults: developing a preference-weighted measure.’, Health Technology Assessment, 16(16), pp. 1–166. doi:10.3310/hta16160.
Pfortmueller, C. A., Lindner, G. and Exadaktylos, A. K. (2014) ‘Reducing fall risk in the elderly:risk factors and fall prevention, a systematic review’, Minerva Med, 105(4), pp. 275–281.
Prevention, U. S. C. for D. C. and (2010) ‘Falls among older adults: an overview ’. Availableat: http://www.cdc.gov/HomeandRecreationalSafety/Falls/adultfalls.html.
Rand, S. E. et al. (2015) ‘Factor structure and construct validity of the Adult Social CareOutcomes Toolkit for Carers (ASCOT-Carer)’, Quality of Life Research, SpringerInternational Publishing, 24(11), pp. 2601–2614. doi: 10.1007/s11136-015-1011-x.
Rand, S. E., Malley, J. and Netten, A. (2012) ‘Measuring the Social Care Outcomes ofInformal Carers’. Available at: https://www.qoru.ac.uk/wp-content/uploads/2013/07/A05-IIASC-Interim-Technical-Report-FINAL-DP-2833.pdf(Accessed: 12 April 2018).
Roalfe, A. K. et al. (2012) ‘A cross-sectional study of quality of life in an elderly population(75 years and over) with atrial fibrillation: secondary analysis of data from theBirmingham Atrial Fibrillation Treatment of the Aged study’, Europace, 14.
Rockwood, K., Andrew, M. and Mitnitski, A. (2007) ‘A comparison of two approaches tomeasuring frailty in elderly people’, The Journals of Gerontology Series A: BiologicalSciences and Medical Sciences, 62(7), pp. 738–743.
75

Rubenstein, L. Z. (2006) ‘Falls in older people: epidemiology, risk factors and strategies forprevention’, Age and ageing, 35(suppl_2), p. ii37-ii41.
Russell, D., Peplau, L. A. and Cutrona, C. E. (1980) ‘The revised UCLA Loneliness Scale:Concurrent and discriminant validity evidence.’, Journal of Personality and SocialPsychology, 39(3), pp. 472–480. doi: 10.1037/0022-3514.39.3.472.
Ryu, E., Couper, M. P. and Marans, R. W. (2006) ‘Survey Incentives: Cash vs. In-Kind; Face-to-Face vs. Mail; Response Rate vs. Nonresponse Error’, International Journal ofPublic Opinion Research, Oxford University Press, 18(1), pp. 89–106. doi:10.1093/ijpor/edh089.
SCIE and Social Care Institute for Excellence (2017) Asset-based places: A model fordevelopment, Future of Care Number 4, London: SCIE. Available at:https://www.scie.org.uk/files/future-of-care/asset-based-places/asset-based-places.pdf (Accessed: 25 February 2018).
SCIE and Social Care Institute for Excellence (2018) Growing innovative models of health,care and support for adults, Future of Care Number 6, Edited by SCIE, London: SCIE.Available at: https://www.scie.org.uk/files/future-of-care/adults/growing-innovative-models-of-health-care-and-support-for-adults.pdf (Accessed: 25 February 2018).
Shared Lives Plus (no date) Six innovations in social care Community Catalysts CICCommunity Circles Local area coordination Shared Lives Homeshare WellbeingTeams Community Catalysts CIC. Available at:https://sharedlivesplus.org.uk/images/6innovationsinsocialcare1.pdf (Accessed: 25February 2018).
Stevens, M. et al. (2010) ‘Making Decisions about Who Should Be Barred from Workingwith Adults in Vulnerable Situations: The Need for Social Work Understanding’, BritishJournal of Social Work, 40(1), pp. 290–310. doi: 10.1093/bjsw/bcn135.
Stuart, E. A. (2010) ‘Matching methods for causal inference: A review and a look forward.’,Statistical science : a review journal of the Institute of Mathematical Statistics, NIHPublic Access, 25(1), pp. 1–21. doi: 10.1214/09-STS313.
Stuck, A. E. et al. (1999) ‘Risk factors for functional status decline in community-livingelderly people: a systematic literature review’, Social science & medicine, 48(4), pp.445–469.
Studenski, S. et al. (2004) ‘Clinical Global Impression of Change in Physical Frailty:development of a measure based on clinical judgment’, Journal of the AmericanGeriatrics Society, 52(9), pp. 1560–1566.
The EuroQol Group (1990) ‘EuroQol - a new facility for the measurement of health-relatedquality of life’, Health Policy, Elsevier, 16(3), pp. 199–208. doi: 10.1016/0168-8510(90)90421-9.
Theeke, L. A. and Mallow, J. (2013) ‘Loneliness and Quality of Life in Chronically Ill RuralOlder Adults’, Am J Nurs, 113.
Thompson, J. et al. (2014) Health Survey of England-2013. Chapter 2: Social care: need forand receipt of help. Available at:http://content.digital.nhs.uk/catalogue/PUB16076/HSE2013-Ch2-soc-care.pdf.
Vlachantoni, A. et al. (2011) ‘Measuring unmet need for social care amongst older people’,Popul Trends, ESRC Centre for Population Change, University of Southampton, (145),pp. 56–72. doi: 10.1057/pt.2011.17.
Vlachantoni, A. et al. (2015) ‘The determinants of receiving social care in later life inEngland’, Ageing Soc. EPSRC Care Life Cycle, University of Southampton, UK . ; ESRCCentre for Population Change , University of Southampton , UK . ; Centre for Researchon Ageing , University of Southampton , UK . EPSRC Care Life Cycle , University ofSouthampton , UK . EPS, 35(2), pp. 321–345. doi: 10.1017/S0144686X1300072X.
76

De Vries, N. M. et al. (2011) ‘Outcome instruments to measure frailty: a systematic review’,Ageing research reviews, 10(1), pp. 104–114.
Windle, K. et al. (2009) National evaluation of the partnership for older people projects(POPP), Kent: PSSRU, University of Kent.
Wittenberg, R. and Hu, B. (2015) ‘Projections of demand for and costs of social care forolder people and younger adults in England, 2015 to 2035’, Personal Social ServicesResearch Unit. Available at: http://eprints.lse.ac.uk/64772/ (Accessed: 2 February2018).
Wolinsky, F. D., Johnson, R. J. and Fitzgerald, J. F. (1992) ‘Falling, health status, and the useof health services by older adults: a prospective study’, Medical Care, pp. 587–597.
Woods, L. et al. (2005) ‘Geographical variation in life expectancy at birth in England andWales is largely explained by deprivation’, Journal of Epidemiology and CommunityHealth, 59, pp. 115–120.
Xue, Q.-L. (2011) ‘The frailty syndrome: definition and natural history’, Clinics in geriatricmedicine, 27(1), pp. 1–15.
Yu, J. and Cooper, H. (1983) ‘A Quantitative Review of Research Design Effects onResponse Rates to Questionnaires’, Journal of Marketing Research, AmericanMarketing Association, 20(1), p. 36. doi: 10.2307/3151410
77

The following tables illustrate residualrelative to predicted local authority valuesaccording to a range of measures atdiscrete time points. As outlined in Figure 6and the accompanying text of the mainreport, tables are ordered to facilitate theidentification of authorities according totheir initial (2010/11) ranking, their final(2015/16) ranking and the degree ofmovement in ranking between first andfinal years.
The left-hand column of each tableincludes the 50% of authorities that aremost consistent in their ranking over time.
Those at the top (coloured red) consistentlyhave lower than expected values(according to local characteristics) for thecorresponding measure, while those at thebottom (coloured green) have consistentlyhigher values than expected.
The right-hand column of each tableincludes the 50% of authorities that showthe greatest variability within each measurebetween 2010/11 and 2015/16. Those atthe top (green to red) move from higher tolower than predicted values, while those atthe bottom (red to green) move from lowerto higher than predicted values.
78
ANNEX 1: RANKINGS OF LOCAL AUTHORITYCHARACTERISTICS BY YEAR

79
FIGURE 13: RESIDUAL RELATIVE TO PREDICTED NET CURRENT EXPENDITURE PER CAPITA ON OLDER PEOPLE’S ADULT SOCIALCARE (SELECTED YEARS)
Authority 2010/11 2013/14 2015/16 Authority 2010/11 2013/14 2015/16Portsmouth -0.30 -0.33 -0.21 Hounslow 0.10 -0.06 -0.39Salford -0.17 -0.36 -0.24 Oldham 0.41 0.00 0.03Wigan -0.27 -0.19 -0.30 Cambridgeshire 0.10 0.08 -0.24Plymouth -0.26 -0.22 -0.19 Barnsley -0.06 -0.17 -0.39York -0.17 -0.25 -0.22 Croydon -0.03 -0.19 -0.35Bexley -0.21 -0.26 -0.15 Thurrock 0.05 -0.02 -0.24Blackpool -0.21 -0.13 -0.19 Bromley 0.04 0.03 -0.25Wolverhampton -0.04 -0.30 -0.14 North Tyneside 0.04 -0.16 -0.22Wirral -0.07 -0.20 -0.16 Coventry 0.06 -0.10 -0.18Sutton -0.06 -0.24 -0.11 North East Lincolnshire 0.22 -0.04 0.01Sunderland -0.22 -0.03 -0.15 Worcestershire 0.12 0.20 -0.08Cornwall -0.17 -0.04 -0.17 Leeds 0.08 0.02 -0.13Windsor & Maidenhead -0.10 -0.21 -0.04 Staffordshire 0.07 0.02 -0.13Hampshire -0.09 -0.15 -0.11 Warrington 0.06 0.11 -0.14St Helens -0.10 -0.11 -0.09 Hackney 0.22 0.15 0.04Wokingham -0.14 -0.04 -0.07 East Sussex 0.25 0.04 0.07Southampton -0.16 -0.02 -0.07 Liverpool -0.02 -0.13 -0.19North Yorkshire -0.08 -0.10 -0.05 Rochdale 0.00 -0.10 -0.17Barnet -0.09 -0.12 -0.01 Manchester -0.04 0.09 -0.20Islington -0.07 -0.06 -0.08 Durham 0.11 0.00 -0.04Leicestershire -0.08 -0.05 -0.07 Newham 0.09 -0.11 -0.07Trafford -0.07 -0.01 -0.11 West Sussex -0.03 0.19 -0.18Cumbria -0.01 -0.09 -0.08 Oxfordshire 0.09 0.01 -0.06Halton -0.09 -0.09 0.01 Southwark -0.03 -0.04 -0.17Bolton -0.03 -0.06 -0.08 Cheshire West & Chester 0.04 -0.26 -0.11Wakefield -0.07 -0.09 -0.01 Stockport 0.01 -0.02 -0.14Harrow -0.07 -0.13 0.03 Wandsworth 0.05 -0.06 -0.09Northamptonshire 0.01 -0.11 -0.05 Lambeth 0.18 0.08 0.04Westminster -0.03 -0.03 -0.07 Northumberland 0.11 0.10 -0.03Telford & Wrekin -0.09 0.06 -0.09 Milton Keynes 0.03 0.05 -0.11Swindon -0.07 -0.01 -0.05 Calderdale 0.15 0.04 0.01Havering -0.10 -0.01 0.00 Waltham Forest -0.03 -0.09 -0.17Essex 0.02 -0.05 -0.04 Devon -0.04 0.01 -0.17Lincolnshire 0.00 -0.09 0.02 Suffolk 0.06 0.05 -0.07Bury -0.09 0.13 -0.10 Southend-on-Sea -0.05 -0.21 -0.18Merton 0.00 -0.03 -0.03 Torbay 0.02 -0.07 -0.09Gloucestershire -0.09 0.04 0.01 Medway -0.11 -0.18 -0.23Kirklees 0.00 -0.05 0.02 Walsall 0.14 0.34 0.03Hillingdon 0.04 -0.03 -0.04 Kent -0.06 -0.01 -0.16Ealing 0.08 -0.15 0.06 Shropshire -0.14 -0.24 -0.02North Somerset -0.05 0.08 -0.03 Brent -0.21 -0.28 -0.10Wiltshire -0.02 0.00 0.04 East Riding of Yorkshire -0.14 -0.19 -0.02Norfolk -0.04 0.09 -0.02 Hammersmith & Fulham 0.15 0.05 0.27Dorset 0.04 -0.01 0.01 Stockton-on-Tees 0.03 0.11 0.15Lancashire 0.03 -0.06 0.08 Dudley -0.11 0.04 0.03Sandwell 0.03 0.03 0.01 Sefton -0.06 0.15 0.07North Lincolnshire -0.03 0.12 -0.02 Nottingham 0.02 0.09 0.16Brighton & Hove 0.04 0.06 0.02 Reading -0.06 -0.02 0.10Greenwich 0.07 0.07 -0.01 Kensington & Chelsea -0.23 -0.06 -0.08Poole 0.01 0.04 0.09 Warwickshire -0.05 0.06 0.11South Gloucestershire 0.12 0.01 0.01 Gateshead 0.14 -0.16 0.32Bournemouth 0.11 0.02 0.04 Solihull -0.10 -0.13 0.07Darlington 0.04 0.12 0.03 Luton 0.09 0.05 0.27Birmingham 0.03 0.11 0.05 Enfield -0.03 0.20 0.15Nottinghamshire 0.05 0.15 0.00 Sheffield 0.14 0.16 0.34Rutland -0.01 0.13 0.09 Haringey -0.01 0.04 0.19Middlesbrough 0.05 0.14 0.02 Newcastle upon Tyne -0.08 0.00 0.12West Berkshire 0.04 0.09 0.09 Bracknell Forest -0.12 -0.05 0.09Kingston upon Thames 0.09 0.09 0.05 Hartlepool 0.02 0.19 0.23Bradford 0.15 0.04 0.04 Surrey -0.07 0.12 0.14Kingston Upon Hull -0.05 0.39 -0.08 Redbridge -0.14 -0.18 0.09Barking & Dagenham 0.09 0.17 0.00 Bedford 0.04 0.09 0.27Redcar & Cleveland 0.18 -0.01 0.10 Slough 0.02 0.12 0.24Central Bedfordshire 0.07 0.06 0.16 Bristol 0.02 0.11 0.25Camden 0.09 0.13 0.08 Blackburn with Darwen 0.12 -0.03 0.36Herefordshire 0.11 0.15 0.08 Peterborough -0.20 -0.20 0.05Hertfordshire 0.07 0.23 0.10 Bath & N. E. Somerset 0.04 0.06 0.30Rotherham 0.16 0.20 0.11 Buckinghamshire -0.06 -0.09 0.20Derbyshire 0.17 0.21 0.08 Tameside -0.11 0.02 0.15Tower Hamlets 0.13 0.24 0.13 Doncaster -0.06 0.02 0.21Lewisham 0.17 0.22 0.17 Knowsley -0.09 0.04 0.18Cheshire East 0.23 0.35 0.14 Leicester -0.02 0.15 0.29South Tyneside 0.24 0.17 0.31 Somerset -0.13 -0.09 0.22Richmond upon Thames 0.27 0.30 0.23 Derby -0.22 -0.03 0.22Isle of Wight 0.31 0.21 0.31 Stoke-on-Trent -0.06 0.16 0.46
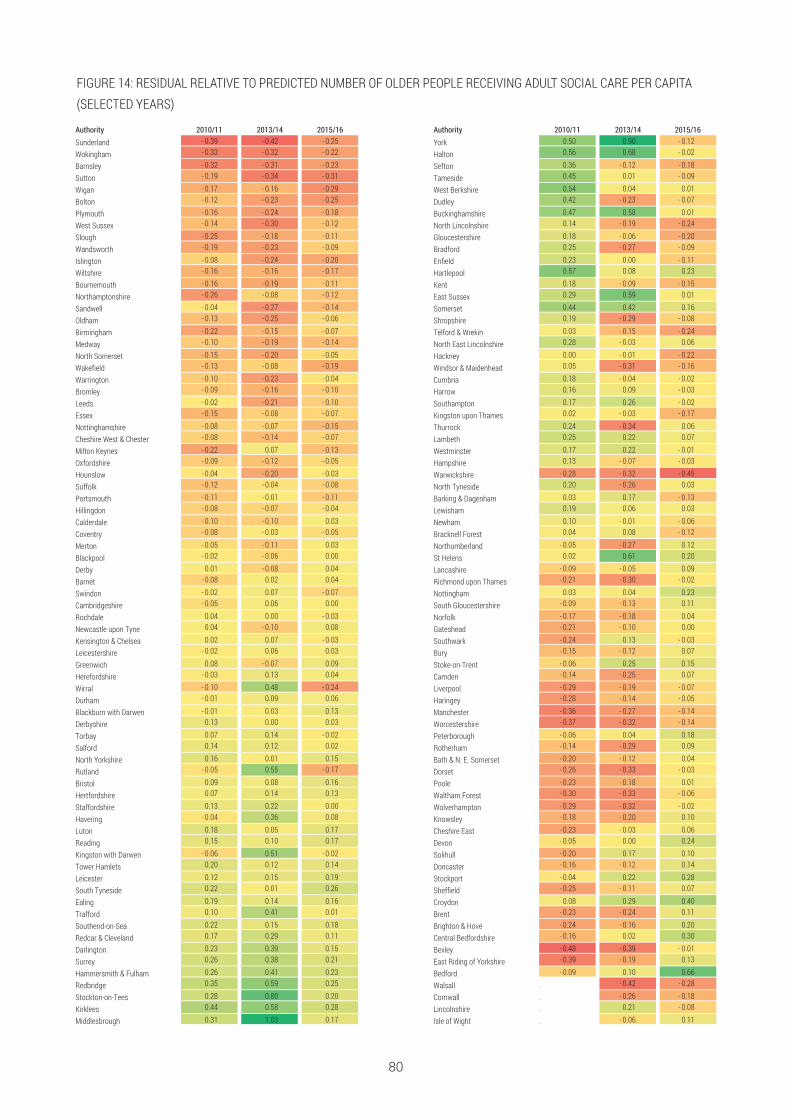
80
FIGURE 14: RESIDUAL RELATIVE TO PREDICTED NUMBER OF OLDER PEOPLE RECEIVING ADULT SOCIAL CARE PER CAPITA(SELECTED YEARS)
Authority 2010/11 2013/14 2015/16 Authority 2010/11 2013/14 2015/16Sunderland - 0.39 - 0.42 - 0.25 York 0.50 0.90 - 0.12
Wokingham - 0.33 - 0.32 - 0.22 Halton 0.56 0.68 - 0.02
Barnsley - 0.32 - 0.31 - 0.23 Sefton 0.36 - 0.12 - 0.18
Sutton - 0.19 - 0.34 - 0.31 Tameside 0.45 0.01 - 0.09
Wigan - 0.17 - 0.16 - 0.29 West Berkshire 0.54 0.04 0.01
Bolton - 0.12 - 0.23 - 0.25 Dudley 0.42 - 0.23 - 0.07
Plymouth - 0.16 - 0.24 - 0.18 Buckinghamshire 0.47 0.58 0.01
West Sussex - 0.14 - 0.30 - 0.12 North Lincolnshire 0.14 - 0.19 - 0.24
Slough - 0.25 - 0.18 - 0.11 Gloucestershire 0.18 - 0.06 - 0.20
Wandsworth - 0.19 - 0.23 - 0.09 Bradford 0.25 - 0.27 - 0.09
Islington - 0.08 - 0.24 - 0.20 Enfield 0.23 0.00 - 0.11
Wiltshire - 0.16 - 0.16 - 0.17 Hartlepool 0.57 0.08 0.23
Bournemouth - 0.16 - 0.19 - 0.11 Kent 0.18 - 0.09 - 0.15
Northamptonshire - 0.26 - 0.08 - 0.12 East Sussex 0.29 0.59 0.01
Sandwell - 0.04 - 0.27 - 0.14 Somerset 0.44 0.42 0.16
Oldham - 0.13 - 0.25 - 0.06 Shropshire 0.19 - 0.29 - 0.08
Birmingham - 0.22 - 0.15 - 0.07 Telford & Wrekin 0.03 - 0.15 - 0.24
Medway - 0.10 - 0.19 - 0.14 North East Lincolnshire 0.28 - 0.03 0.06
North Somerset - 0.15 - 0.20 - 0.05 Hackney 0.00 - 0.01 - 0.22
Wakefield - 0.13 - 0.08 - 0.19 Windsor & Maidenhead 0.05 - 0.31 - 0.16
Warrington - 0.10 - 0.23 - 0.04 Cumbria 0.18 - 0.04 - 0.02
Bromley - 0.09 - 0.16 - 0.10 Harrow 0.16 0.09 - 0.03
Leeds - 0.02 - 0.21 - 0.10 Southampton 0.17 0.26 - 0.02
Essex - 0.15 - 0.08 - 0.07 Kingston upon Thames 0.02 - 0.03 - 0.17
Nottinghamshire - 0.08 - 0.07 - 0.15 Thurrock 0.24 - 0.34 0.06
Cheshire West & Chester - 0.08 - 0.14 - 0.07 Lambeth 0.25 0.22 0.07
Milton Keynes - 0.22 0.07 - 0.13 Westminster 0.17 0.22 - 0.01
Oxfordshire - 0.09 - 0.12 - 0.05 Hampshire 0.13 - 0.07 - 0.03
Hounslow - 0.04 - 0.20 - 0.03 Warwickshire - 0.28 - 0.32 - 0.45
Suffolk - 0.12 - 0.04 - 0.08 North Tyneside 0.20 - 0.26 0.03
Portsmouth - 0.11 - 0.01 - 0.11 Barking & Dagenham 0.03 0.17 - 0.13
Hillingdon - 0.08 - 0.07 - 0.04 Lewisham 0.19 0.06 0.03
Calderdale - 0.10 - 0.10 0.03 Newham 0.10 - 0.01 - 0.06
Coventry - 0.08 - 0.03 - 0.05 Bracknell Forest 0.04 0.08 - 0.12
Merton - 0.05 - 0.11 0.03 Northumberland - 0.05 - 0.27 0.12
Blackpool - 0.02 - 0.06 0.00 St Helens 0.02 0.61 0.20
Derby 0.01 - 0.08 0.04 Lancashire - 0.09 - 0.05 0.09
Barnet - 0.08 0.02 0.04 Richmond upon Thames - 0.21 - 0.30 - 0.02
Swindon - 0.02 0.07 - 0.07 Nottingham 0.03 0.04 0.23
Cambridgeshire - 0.05 0.06 0.00 South Gloucestershire - 0.09 - 0.13 0.11
Rochdale 0.04 0.00 - 0.03 Norfolk - 0.17 - 0.18 0.04
Newcastle upon Tyne 0.04 - 0.10 0.08 Gateshead - 0.21 - 0.10 0.00
Kensington & Chelsea 0.02 0.07 - 0.03 Southwark - 0.24 0.13 - 0.03
Leicestershire - 0.02 0.06 0.03 Bury - 0.15 - 0.12 0.07
Greenwich 0.08 - 0.07 0.09 Stoke-on-Trent - 0.06 0.25 0.15
Herefordshire - 0.03 0.13 0.04 Camden - 0.14 - 0.25 0.07
Wirral - 0.10 0.48 - 0.24 Liverpool - 0.29 - 0.19 - 0.07
Durham - 0.01 0.09 0.06 Haringey - 0.28 - 0.14 - 0.05
Blackburn with Darwen - 0.01 0.03 0.13 Manchester - 0.36 - 0.27 - 0.14
Derbyshire 0.13 0.00 0.03 Worcestershire - 0.37 - 0.32 - 0.14
Torbay 0.07 0.14 - 0.02 Peterborough - 0.06 0.04 0.18
Salford 0.14 0.12 0.02 Rotherham - 0.14 - 0.29 0.09
North Yorkshire 0.16 0.01 0.15 Bath & N. E. Somerset - 0.20 - 0.12 0.04
Rutland - 0.05 0.55 - 0.17 Dorset - 0.26 - 0.33 - 0.03
Bristol 0.09 0.08 0.16 Poole - 0.23 - 0.18 0.01
Hertfordshire 0.07 0.14 0.13 Waltham Forest - 0.30 - 0.33 - 0.06
Staffordshire 0.13 0.22 0.00 Wolverhampton - 0.29 - 0.32 - 0.02
Havering - 0.04 0.36 0.08 Knowsley - 0.18 - 0.20 0.10
Luton 0.18 0.05 0.17 Cheshire East - 0.23 - 0.03 0.06
Reading 0.15 0.10 0.17 Devon - 0.05 0.00 0.24
Kingston with Darwen - 0.06 0.51 - 0.02 Solihull - 0.20 0.17 0.10
Tower Hamlets 0.20 0.12 0.14 Doncaster - 0.16 - 0.12 0.14
Leicester 0.12 0.15 0.19 Stockport - 0.04 0.22 0.28
South Tyneside 0.22 0.01 0.26 Sheffield - 0.25 - 0.11 0.07
Ealing 0.19 0.14 0.16 Croydon 0.08 0.29 0.40
Trafford 0.10 0.41 0.01 Brent - 0.23 - 0.24 0.11
Southend-on-Sea 0.22 0.15 0.18 Brighton & Hove - 0.24 - 0.16 0.20
Redcar & Cleveland 0.17 0.29 0.11 Central Bedfordshire - 0.16 0.02 0.30
Darlington 0.23 0.39 0.15 Bexley - 0.48 - 0.39 - 0.01
Surrey 0.26 0.38 0.21 East Riding of Yorkshire - 0.39 - 0.19 0.13
Hammersmith & Fulham 0.26 0.41 0.23 Bedford - 0.09 0.10 0.66
Redbridge 0.35 0.59 0.25 Walsall . - 0.42 - 0.28
Stockton-on-Tees 0.28 0.80 0.20 Cornwall . - 0.26 - 0.18
Kirklees 0.44 0.58 0.28 Lincolnshire . 0.21 - 0.08
Middlesbrough 0.31 1.03 0.17 Isle of Wight . - 0.06 0.11

81
Authority 2010/112013/14 2015/16 Authority 2010/11 2013/14 2015/16
Cornwall - 0.31 - 0.33 - 0.31 Cheshire West & Chester 0.23 0.14 - 0.15Wakefield - 0.23 - 0.28 - 0.21 Rutland 0.09 0.30 - 0.23Waltham Forest - 0.21 - 0.24 - 0.23 Hillingdon 0.11 - 0.07 - 0.20Poole - 0.19 - 0.23 - 0.22 North Lincolnshire 0.23 0.16 - 0.07Medway - 0.21 - 0.21 - 0.22 Kingston upon Thames 0.25 - 0.17 - 0.05Portsmouth - 0.21 - 0.20 - 0.23 Tameside 0.12 - 0.03 - 0.15Wigan - 0.17 - 0.23 - 0.19 South Tyneside 0.25 - 0.03 0.00Manchester - 0.22 - 0.15 - 0.20 Southend-on Sea 0.14 - 0.05 - 0.11Havering - 0.23 - 0.14 - 0.17 Oldham 0.30 0.14 0.06Sunderland - 0.18 - 0.13 - 0.18 Sutton - 0.16 - 0.39 - 0.40Torbay - 0.14 - 0.23 - 0.11 Tower Hamlets 0.24 0.21 0.01Plymouth - 0.12 - 0.17 - 0.19 Darlington 0.51 0.44 0.29Barnsley - 0.17 - 0.18 - 0.13 Wandsworth 0.15 0.05 - 0.08Wokingham - 0.19 - 0.13 - 0.12 Bromley - 0.06 - 0.21 - 0.28Solihull - 0.19 - 0.10 - 0.14 Wirral 0.12 0.04 - 0.09Warwickshire - 0.16 0.01 - 0.23 North Somerset 0.27 0.18 0.06Devon - 0.14 - 0.16 - 0.08 Thurrock 0.25 - 0.09 0.05Coventry - 0.14 - 0.09 - 0.09 Bolton - 0.10 - 0.13 - 0.29Milton Keynes - 0.12 - 0.06 - 0.12 Telford & Wrekin 0.00 0.10 - 0.18Reading - 0.09 - 0.13 - 0.05 Nottinghamshire 0.11 0.11 - 0.07Staffordshire - 0.09 - 0.11 - 0.06 Calderdale 0.04 - 0.11 - 0.13St Helens - 0.07 - 0.07 - 0.11 Richmond upon Thames 0.30 0.23 0.14Croydon - 0.18 0.03 - 0.09 North East Lincolnshire 0.08 - 0.01 - 0.08Bexley 0.03 - 0.26 0.00 Kent 0.01 - 0.06 - 0.14Kirklees - 0.06 - 0.17 0.02 Hackney - 0.14 - 0.21 - 0.28Liverpool - 0.09 - 0.08 - 0.03 Greenwich - 0.05 0.02 - 0.19Herefordshire - 0.10 - 0.03 - 0.07 Windsor & Maidenhead 0.02 - 0.10 - 0.12Luton - 0.12 0.03 - 0.09 Blackburn with Darwen 0.23 0.25 0.09Cambridgeshire - 0.06 - 0.04 - 0.08 Newcastle upon Tyne 0.11 0.13 - 0.03Suffolk - 0.05 - 0.07 - 0.06 North Tyneside 0.06 0.04 - 0.07Newham - 0.03 - 0.02 - 0.09 Lambeth 0.25 0.17 0.12Blackpool - 0.07 0.01 - 0.08 East Sussex 0.07 0.06 - 0.06Worcestershire - 0.04 - 0.04 - 0.05 Hounslow - 0.19 - 0.22 - 0.31Lincolnshire - 0.08 0.07 - 0.09 Essex - 0.01 - 0.07 - 0.12Bracknell Forest - 0.06 0.11 - 0.14 Shropshire 0.18 0.05 0.06Bournemouth - 0.03 - 0.02 - 0.03 Dorset - 0.07 - 0.20 - 0.19Sandwell - 0.05 - 0.05 0.02 Peterborough - 0.23 - 0.32 - 0.34Northumberland 0.01 - 0.13 0.07 Southwark 0.05 0.16 - 0.06York - 0.02 0.02 - 0.05 Barking & Dagenham - 0.05 0.01 - 0.15Oxfordshire - 0.04 - 0.02 0.01 Walsall - 0.19 - 0.25 - 0.29Norfolk - 0.01 0.00 0.02 Wolverhampton - 0.04 0.03 0.05Leicestershire - 0.01 - 0.01 0.05 Harrow - 0.11 - 0.02 - 0.01Merton 0.00 0.10 - 0.06 South Gloucestershire 0.05 0.15 0.15Brent 0.04 - 0.09 0.11 Stoke-on-Trent 0.00 0.00 0.10Leicester - 0.02 0.07 0.03 Southampton - 0.01 0.01 0.10Wiltshire 0.03 0.07 - 0.01 Somerset 0.00 0.05 0.11Stockport - 0.02 0.13 0.01 Swindon - 0.12 - 0.10 - 0.01Knowsley 0.10 0.00 0.02 Buckinghamshire - 0.04 0.10 0.07Durham 0.09 0.03 0.01 Slough - 0.17 - 0.07 - 0.05Derbyshire 0.02 0.12 0.01 Salford - 0.18 - 0.16 - 0.06Trafford 0.09 0.04 0.03 Middlesbrough 0.08 0.42 0.21Rotherham 0.10 - 0.05 0.13 0.29 0.15 0.41Leeds 0.09 - 0.01 0.14 Lewisham 0.03 0.09 0.17Camden 0.17 - 0.05 0.10 North Yorkshire - 0.11 - 0.18 0.03Gloucestershire 0.12 0.06 0.05 West Berkshire - 0.11 - 0.09 0.03Hammersmith & Fulham 0.08 0.13 0.04 Hampshire - 0.08 - 0.01 0.07Hartlepool 0.03 0.11 0.11 West Sussex - 0.14 - 0.06 0.02Warrington 0.12 0.00 0.15 Barnet - 0.03 0.03 0.13Cheshire East 0.07 0.14 0.09 Birmingham - 0.12 - 0.12 0.05Rochdale 0.14 0.10 0.08 Gateshead - 0.05 0.03 0.14Bradford 0.08 0.12 0.13 Halton - 0.42 - 0.20 - 0.24Lancashire 0.09 0.09 0.16 Bury - 0.05 - 0.05 0.14Dudley 0.06 0.18 0.14 Kensington & Chelsea - 0.31 - 0.12 - 0.11Westminster 0.14 0.18 0.11 Cumbria - 0.11 - 0.17 0.11Northamptonshire 0.14 0.23 0.07 Sheffield - 0.14 - 0.06 0.11Central Bedfordshire 0.18 0.11 0.16 Enfield - 0.23 - 0.18 0.06Islington 0.21 0.13 0.18 Surrey 0.04 0.05 0.38Redcar & Cleveland 0.18 0.22 0.16 Doncaster - 0.22 - 0.05 0.14Sefton 0.14 0.28 0.15 Ealing - 0.23 - 0.09 0.13Hertfordshire 0.23 0.21 0.14 Haringey - 0.04 0.09 0.32Kingston uopn Hull 0.24 0.22 0.15 Bedford 0.14 0.07 0.52Derby 0.25 0.17 0.20 Nottingham 0.00 0.10 0.39Bath & N. E. Somerset 0.14 0.25 0.23 Redbridge - 0.20 - 0.06 0.23Brighton & Hove 0.36 0.28 0.30 Bristol 0.03 0.04 0.60Stockton-on-Tees 0.33 0.43 0.36 Isle of Wight . 0.36 0.25
FIGURE 15: RESIDUAL RELATIVE TO PREDICTED NUMBER OF OLDER PEOPLE RECEIVING RESIDENTIAL/NURSING CARE PERCAPITA (SELECTED YEARS)
East Riding of Yorkshire
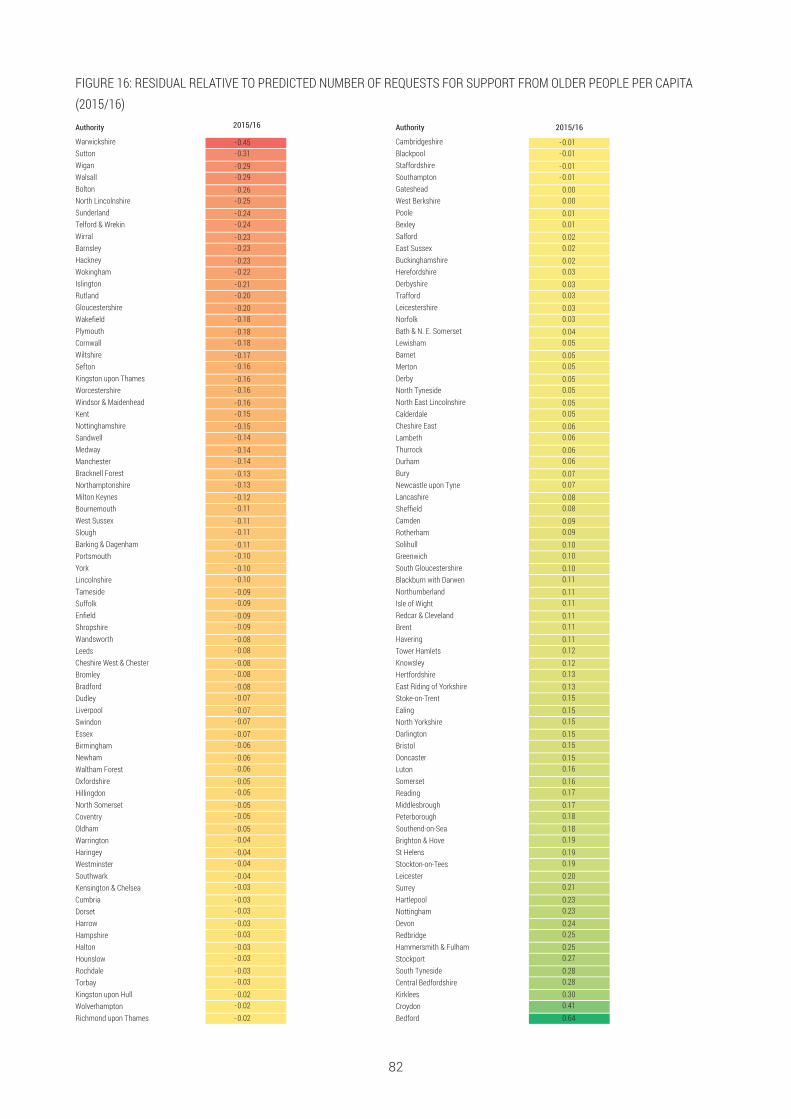
82
FIGURE 16: RESIDUAL RELATIVE TO PREDICTED NUMBER OF REQUESTS FOR SUPPORT FROM OLDER PEOPLE PER CAPITA(2015/16)Authority 2015/16 Authority 2015/16
Warwickshire - 0.45 Cambridgeshire -0.01Sutton -0.31 Blackpool - 0.01Wigan -0.29 Staffordshire - 0.01Walsall - 0.29 Southampton -0.01Bolton -0.26 Gateshead 0.00North Lincolnshire - 0.25 West Berkshire 0.00Sunderland -0.24 Poole 0.01Telford & Wrekin -0.24 Bexley 0.01Wirral - 0.23 Salford 0.02Barnsley -0.23 East Sussex 0.02Hackney -0.23 Buckinghamshire 0.02Wokingham -0.22 Herefordshire 0.03Islington -0.21 Derbyshire 0.03Rutland -0.20 Trafford 0.03Gloucestershire - 0.20 Leicestershire 0.03Wakefield -0.18 Norfolk 0.03Plymouth -0.18 Bath & N. E. Somerset 0.04Cornwall - 0.18 Lewisham 0.05Wiltshire - 0.17 Barnet 0.05Sefton -0.16 Merton 0.05Kingston upon Thames -0.16 Derby 0.05Worcestershire - 0.16 North Tyneside 0.05Windsor & Maidenhead -0.16 North East Lincolnshire 0.05Kent -0.15 Calderdale 0.05Nottinghamshire -0.15 Cheshire East 0.06Sandwell - 0.14 Lambeth 0.06Medway -0.14 Thurrock 0.06Manchester - 0.14 Durham 0.06Bracknell Forest - 0.13 Bury 0.07Northamptonshire -0.13 Newcastle upon Tyne 0.07Milton Keynes -0.12 Lancashire 0.08Bournemouth -0.11 Sheffield 0.08West Sussex -0.11 Camden 0.09Slough -0.11 Rotherham 0.09Barking & Dagenham -0.11 Solihull 0.10Portsmouth -0.10 Greenwich 0.10York -0.10 South Gloucestershire 0.10Lincolnshire - 0.10 Blackburn with Darwen 0.11Tameside -0.09 Northumberland 0.11Suffolk - 0.09 Isle of Wight 0.11Enfield -0.09 Redcar & Cleveland 0.11Shropshire -0.09 Brent 0.11Wandsworth -0.08 Havering 0.11Leeds -0.08 Tower Hamlets 0.12Cheshire West & Chester - 0.08 Knowsley 0.12Bromley -0.08 Hertfordshire 0.13Bradford -0.08 East Riding of Yorkshire 0.13Dudley -0.07 Stoke-on-Trent 0.15Liverpool - 0.07 Ealing 0.15Swindon -0.07 North Yorkshire 0.15Essex -0.07 Darlington 0.15Birmingham -0.06 Bristol 0.15Newham -0.06 Doncaster 0.15Waltham Forest - 0.06 Luton 0.16Oxfordshire - 0.05 Somerset 0.16Hillingdon -0.05 Reading 0.17North Somerset - 0.05 Middlesbrough 0.17Coventry -0.05 Peterborough 0.18Oldham -0.05 Southend-on-Sea 0.18Warrington -0.04 Brighton & Hove 0.19Haringey -0.04 St Helens 0.19Westminster - 0.04 Stockton-on-Tees 0.19Southwark -0.04 Leicester 0.20Kensington & Chelsea -0.03 Surrey 0.21Cumbria -0.03 Hartlepool 0.23Dorset - 0.03 Nottingham 0.23Harrow -0.03 Devon 0.24Hampshire -0.03 Redbridge 0.25Halton -0.03 Hammersmith & Fulham 0.25Hounslow -0.03 Stockport 0.27Rochdale -0.03 South Tyneside 0.28Torbay -0.03 Central Bedfordshire 0.28Kingston upon Hull - 0.02 Kirklees 0.30Wolverhampton -0.02 Croydon 0.41Richmond upon Thames -0.02 Bedford 0.64

83
FIGURE 17: HISTOGRAMS AND MEAN VALUES BY YEAR AND CLASS: RANK OF RESIDUAL RELATIVE TO EXPECTEDEXPENDITURE (LOW TO HIGH)
DISTRIBUTIONS OF LOCAL AUTHORITYCHARACTERISTICS BY LATENT CLASS

84
FIGURE 18: HISTOGRAMS AND MEAN VALUES BY YEAR AND CLASS: RANK OF RESIDUAL RELATIVE TO EXPECTED TOTALCLIENT COVERAGE (LOW TO HIGH)

85
FIGURE 19: HISTOGRAMS AND MEAN VALUES BY YEAR AND CLASS: RANK OF RESIDUAL RELATIVE TO EXPECTEDRESIDENTIAL CLIENT COVERAGE (LOW TO HIGH)

86
FIGURE 20: HISTOGRAMS AND MEAN VALUES BY CLASS: RANK OF RESIDUAL RELATIVE TO EXPECTED NUMBERS OFREQUESTS FOR SUPPORT (LOW TO HIGH, 2015/16)

87
Study design and strategies for data collection
• Observational study: users of help-at-home schemes, it comprised a volunteer-providedface-to-face and telephone befriending scheme; a practical home help service forgardening, shopping and cleaning; and welfare benefit advice service
• Target group: older people aged 55 years and above living in their own homes
• Panel data, ASCOT and questionnaire data collected twice, once when users startedusing the scheme and once after 4–6 months (to those still in contact with the scheme)
• The sample size: 24 for ASCOT and 1064 for questionnaires.
Indicators of needs
• Not available
Indicators of services and costs
• Activity data: hours provided by staff and volunteers; number of people using the scheme
• Budget data for each service components (see study design).
Indicators of outcomes
• Measures of outcomes: ASCOT SCT4 Version
• Well-being and resource use questionnaire (for over the previous 6 months): no before &after design, instead, two groups compared, namely existing users and new users wereassessed. No further information provided regarding the content of the questionnaire.
Statistical analyses of outcome data
• ASCOT: mean for each domain; paired t-test analysis to test statistical significance ofany differences in those scores (mean and sd available below, page 7)
• Analysis in the proportion of people whose levels of needs increased, decreased orremained the same
• Questionnaire: to estimate the predicted probability that someone would use suchservice, comparative analysis between service users who responded to the annualsurvey (people using the scheme for less than a year excluded) and new service userswho took part in the smaller survey was carried out; differences in socio-demographicsadjusted using logistic regression analysis
• Modelling: details can be included upon request.
STUDY 1: BAUER ET AL 2017
Bauer, A., Knapp, M., Wistow, G., Perkins, M., King, D. and Iemmi, V. (2017), Costs andeconomic consequences of a help-at-home scheme for older people in England. HealthSoc Care Community, 25: 780–789. doi:10.1111/hsc.12372
The aim of this review is to collect key information about relevant evaluations of socialcare interventions for people with low and medium needs in England.
ANNEX 2: TEMPLATE FOR THE EXTRACTION OF KEYINFORMATION FROM SOCIAL CARE EVALUATIONS

STUDY 2: CAIELS ET AL 2010
Caiels, J., Forder, J., Netten, A., Malley, J. and Windle, K. (2010) Measuring the outcomes oflow-level services: Final report, Discussion Paper 2699, PSSRU, University of Kent,Canterbury.
Study design and strategies for data collection
• Aim: develop and validate an approach (refined ASCOT) to measuring the impact of low-level services on service users, specifically day care centres
• Methodology:
Initial instrument design and sample frame development – the development phase(refined ASCOT)
Exploratory work with day care providers – piloting phase
Fieldwork for evaluation and testing of toolkit – main fieldwork phase
• Pilot phase: to assess the validity of the ASCOT and come up with questionnaires usedin the fieldwork phase in both interview and self-completion formats; carried out in 2-day care centres, using the following methods:
1. Consultation with service users using focus group – service users’ perspective onhow services (generally) help them, the outcome domains that were most affected byday care centres, and to examine whether the way in which this help is delivered isimportant to them
2. Consultation with stakeholders (interviews and focus groups with managers and careworkers) – providers’ views of the services that they are involved in delivering and theperceived differences that services make to users’ lives
3. Cognitive testing with service users – to test people’s understanding of the questionsin questionnaires/interviews
• Fieldwork phase: data on day care providing centres collected using a postal survey sentto councils with social services responsibility in England. The day care centres werethen asked to distribute recruitment packs17 to target population
• Sample sizes: n (recruitment packs handed out)=5,029; 961 valid responses andreturned self-completion questionnaires; 224 participants took part in the face-to-faceinterview18
• Cross-sectional study
• Study population/target group: aged 65 years and over and having sufficient cognitivefunctioning to understand the informed consent process and be able to participate in aface-to-face interview with a researcher
• Aspect of the sample is particularly relevant to the group of people with low social careneeds: It was considered likely that people accessing low-level services would have(relatively) low level needs and, therefore, would be able to understand the informedconsent process. The day care centre is considered as low-level services.
Indicators of needs
• ADLs (e.g. getting dressed, in/out of a chair, washing, preparing meals, walking)
• IADLs (e.g. dealing with finances/paperwork with or without help)
17 Recruitment packs were made up of the self-completion questionnaires, a letter inviting people to takepart in the study, and a participant information sheet explaining in detail what was involved.
18 Only those participants that had correctly completed 18 questions of the self-completion questionnaires(SCT) were asked to take part in a face-to-face interview. This was to ensure that valid comparisons couldbe made between participants’ SCT responses and responses in the face-to-face interview.
88
• Analysis of alternative wellbeing measures showed that the following two are sensitiveto the effects of low-level services: EQ5D, adjusted GHQ12
• Satisfaction: level of satisfaction with services.
Indicators of services and costs
• Day care centres19.
Indicators of outcomes
• ASCOT was developed by the researchers with two components: a well-beingmeasurement scale and an expected outcome (called capacity for benefit) attributionmethod. The version of ASCOT was not specified
• The self-completed questionnaires collected information on user characteristics andneed, and administered the ASCOT (3 levels – good, intermediate and bad for eachdomain) to collect outcomes information
• The interview repeated the collection of this information as well as including a morecomprehensive set of outcomes questions, demographics and dependency measures
• The face-to-face interview comprised 72 questions, The details of both measures wereclaimed to be included by Caiels 2010 as Annexes 2 and 8, which were not available inthe version of paper we obtained
• It was listed that the following aspects were assessed in the face-to-face interview:
The EQ5D measure (SD 0.35; p36)
A single (global) quality of life measure using a seven-point scale (Bowling, 1997)
A single (global) health measure using a five-point scale (Bowling, 1997)20
• The ASCOT indicator was developed to capture a range of social-care related quality oflife domains. In ASCOT there are three types of ‘indicator’ number:
1. Current quality of life (SD 0.20; p40)
2. Expected quality of life (SD 0.29; p41); adjusted expected quality of life (std. dev. 0.02;p44)
3. Outcome (current – expected quality of life) (SD 0.21; p41); adjusted outcome (SD0.18; p44).
Statistical analyses of outcome data
• Regression (GLM & OLS).
Other information
Overall, the ASCOT outcome measures performed well against validity and reliability tests;and it consistently measured greater degrees of improvement than the EQ5D.
The expected quality of life approach in ASCOT encountered some challenges as peoplewere not always able to isolate the effects of services from other forms of support (e.g.informal care); however, collecting information on other forms of support is useful toadjust or correct expected quality of life to remove any spurious other-service effect.
19 Examples of the types of service available to users included: nail cutting; hairdressing; lunch; activities(such as dancing, cards, bingo); bathing and cooking lessons.
20 The Bowling book gives a few “possible” measurements. Some of the examples they had was SF-36measures, and WHOQOL.
89

STUDY 3: FORDER ET AL 2016
Forder, J., Malley, J., Rand, S., Vadean, F., Jones, K. and Netten, A. (2016), Identifying theimpact of adult social care: Interpreting outcome data for use in the Adult Social CareOutcomes Framework . QORU Discussion Paper 2892.
Study design and strategies for data collection
• Statistical analysis of data collected from interviews
• Sample size: 990 care recipients (people with either physical or sensory impairment,mental health problems or learning disabilities); 387 carers for a subset of these carerrecipients
• The aim was to develop outcome indicators that might better reflect the contributionsmade by adult social care.
Indicators of needs/services and costs
• Not available.
Indicators of outcomes
• SCRQoL indicators in ASCOF.
Statistical analyses of outcome data
• Aim: developed formula to calculate a person’s adjusted SCRQoL score using values ofrelevant SCRQoL indicators
(a) A risk adjustment approach that estimated the relationship between sample SCRQoLand the external factors
(b) In addition to approach (a), the amount of care people received was included as afactor
9c) The expected ASCOT tool21 was used to estimate the relationship between thismeasure and the external factor.
STUDY 4: GLENDINNING ET AL 2010
Glendinning, C., Jones, K., Baxter, K., Rabiee, P., Curtis, L., Wilde, A., Arksey, H. and Forder, J.(2010). Home care re-ablement services: Investigating the longer-term impacts(prospective longitudinal study). York: Social Policy Research Unit, University of York.
Study design and strategies for data collection
• Comparative before-and-after study (participants receive one of the two services basedon the type LA provided), comparison of only home care re-ablement services vs onlyconventional home care service
• Sample sizes: T1 – 1,600; T2 – 370 approx
• Panel data: outcome data collected on study baseline (T1), post-intervention (T1+R) and12-month follow-up (T2) using questionnaires. Postal questionnaires sent 8 weeks afterrecruitment
• Study population: adult users (aged 65 and over) of re-ablement and conventional homecare services, who had been accepted as eligible for social care support under localFACS. The age group was further extended to just adults due to slow recruitment
• Follow-up period: up to 12 months - interviews were held with participants up to 12months following their first interview for the study.
21 The expected ASCOT tool asks people to hypothetically rate their SCRQoL as if they did not receiveservices
90

Indicators of needs
Not available.
Indicators of services and costs
• Use of re-ablement and/or social care services during the first few weeks of entry to thestudy
• The frequency of each service received (for example the hours of re-ablement homecare provided during the re-ablement period)
• Postal questionnaire: use of NHS services and services provided by voluntaryorganisations or other bodies
• For costs: average annual cost per service user; the cost per hour and the cost per hourof service user contact.
Indicators of outcomes
Outcome data collected using questionnaire (available at the end of the template, alsopage 182–190 on paper), which include the following measures:
• Self-perceived health
Based on the five-point scale suggested by Robine and colleagues (2003) as part of aEuropean project on health indicators. This question asks respondents to rate theirhealth in general according to five categories ranging from ‘very good’ to ‘very bad’. Ahigher score indicates better perceived health
In the comparison group, there was no change in mean perceived health from a baselinescore of 2.99 (standard deviation 0.99) to a 12-month follow-up score of 2.96 (sd 1.04)(page 96)
The self-perceived health measure appears as question 2(a) on the T2 questionnaire.
• Perceived quality of life (a seven-point scale)
Categories ranging from ‘so good, it could not be better’ to ‘so bad, it could not beworse’. A higher score indicates better perceived quality of life.
The perceived quality of life scale is question 2(b) on the T2 questionnaire
• Health-related quality of life (EQ-5D – Euro-QoL)
• Social care outcomes (ASCOT, version not mentioned)
Table D.1 shows the responses and associated levels of need for each of the ninedomains
Table D.2 gives the weights that we applied to each of the attributes
The ASCOT appears as questions 4(b) to 4(k) on the T2 questionnaire.
Statistical analyses of outcome data
• Paired t-tests, chi-square tests and binomial tests for univariate analysis
• Xtreg estimator in Stata10 for multivariate analyses
• Multivariate regression analyses using both a fixed and random-effects model
• The Hausman specification test to evaluate whether each model corresponded to thedata sufficiently.
91

STUDY 5: IPSOS DUNATCHIK 2016
Dunatchik et al 2016. Predicting unmet need for social care and exploring links with well-being: Findings from the secondary analysis: TECHNICAL REPORT. Ipsos MORI (TR).
Ipsos MORI, 2017. Unmet need for care: FULL REPORT (FR).
Dunatchik et al 2016. Predicting unmet social care needs and links with well-being:Findings from the secondary analysis (SA).
Study design and strategies for data collection
• Analysis of HSE and ELSA data
• 24 individual in-depth interviews
• Cross-sectional
• Study population/target group: aged 60 years old or over; have difficulties doing two ormore IADL by themselves and/or have difficulties doing at least one ADL by themselves
• Having needs in relation to ADLs indicates more personal care needs so havingdifficulties with only one of these activities was needed. For IADLs difficulties with atleast two activities were needed to be eligible to avoid recruiting people who just neededhelp with shopping or gardening
• Definition 2 of LA unmet need (pg. 13 of TR): captures those just outside (‘almost unmetneed’) the qualifying criteria22. For example, individuals that reported difficulties with twoADLs and good well-being, 11 are potentially eligible for local authority help (‘almostunmet need’).
Indicators of needs
• ADLs; IADLs; mobility
• Whether received help; nature of care received (paid or unpaid) to help with thesedifficulties; aids and adaptations available; intensive care from family (indicative ofunmet need); number of hours of care received.
Indicators of services and costs
• Care sources (SA pg.84) for activities such as movements, dressing, taking medicationetc:
Unpaid care (partner/spouse, daughter, son etc)
For a single source, unpaid care was received most often less than 10 hours per week,followed by 20 or more hours per week and then 10–20 hours per week
Formal care (state funded and privately paid) including (but not limited to): home careworker/ home help/ personal assistant; voluntary worker; member of staff at thecare/nursing home or reablement/intermediate care team; hospital staff/ nurse/physiotherapist; cleaner; handyman etc
• Common home adaptations (SA pg.85)
Bath or shower seat (~10–13%); alarm that can call for help (~7–12%); stair lift (~5%);toilet equipment or commode (~6–7%); bed lever or bed rail (~3–4%) etc
• Common mobility aid use (SA pg.85):
Cane or walking stick (~22–24%); zimmer frame or walker (~5–6%); manual wheelchair(~4%) etc.
22 For local authority Definition 1, the qualifying level of need is that individuals report difficulties with 3 ormore ADLs or that they report difficulties with 2 ADLs and they have poor well-being.
92

Indicators of outcomes
• Well-being: CASP-15 score in ELSA (st dev 8.14, pg11, TR) and the Warwick EdinburghMental Well-being Scale (WEMWBS) measure in HSE (st dev 8.74, pg11, TR)
• Table 10, Pg. 21, TR (below):
93
TABLE 10: COMPARING MEAN CASP-15 SCORES UNDER UMET NEED DEFINITIONS
Base: W6 ELSA respondents aged 60+ in wave 6 to have participated in every wave
Wider definition Modified wider definition Mean (SD) Mean (SD)
Unmet needs/unmet needs, no care 44.3 (9.2) 45.7 (7.3)
Needs met/at least some needs met 42.7 (8.1) 42.8 (8.9)
No qualifying needs 48.3 (7.4) 48.3 (7.4)
Statistical analyses of outcome data
• Regression.
Social care questions in ELSA and HSE
• ELSA/HSE questions for identifying needs and whether they are met by help from aperson are available in pg. 22–24, TR.
STUDY 6: KINGSTON ET AL 2017
Kingston, A., Wohland, P., Wittenberg, R., Robinson, L., Brayne, C., Matthews, F E. andJagger, C. (2017). Is late-life dependency increasing or not? A comparison of the CognitiveFunction and Ageing Studies (CFAS), The Lancet, Volume 390, Issue 10103, 1676–84.
Study design and strategies for data collection
• The study compared two Cognitive Function and Ageing Studies (CFAS I and CFAS II)23
of people aged over 65 (including those in institutional care)
• The target population for each cohort was people aged 65 years or older who werepermanently registered with a participating general practice (including those ininstitutional care). Sampling was stratified according to age group (65–74 years vs ≥75years)
• No further description that is indicative of participants having low social care needs24
• Data collection: participants were interviewed in their normal place of residence.
• If cognitive impairment was judged to limit participants’ ability to provide reliableanswers, proxy informants (generally spouses, offspring, or occasionally paid-forcarers) were used
• Information collected in CFAS I and CFAS II included basic sociodemographic (age, sex,marital status, living arrangements, and education); cognitive status, which was
23 Participants from CFAS I were assigned as the 1991 cohort, and those from CFAS II were assigned asthe 2011 cohort.24 Potentially relevant outcome: between 1991 and 2011, there were significant increases in years livedfrom age 65 years with low dependency (1·7 years [95% CI 1·0–2·4] for men and 2·4 years [1·8–3·1] forwomen).

assessed by the mini-mental state examination; urinary incontinence; and self-reportedability to do ADL
• Sample sizes (interviewed): 1991 cohort – 7,635; 2011 cohort – 7,796
• Cross-sectional study – two groups (1991 and 2011 cohorts) that met the same criteriawere compared.
Indicators of needs
• Not available.
Indicators of services and costs
• Not available.
Indicators of outcomes
• The outcome is individual dependency level and its distribution in the cohort
• Dependency was estimated with Isaacs and Neville’s interval measure
• Four levels of dependency: high; medium; low; independent25.
Statistical analyses of outcome data
• Age and sex-specific dependency prevalence for CFAS I and CFAS II was calculatedusing inverse probability weighting to account for no-response differences between thestudies and study design selection
• To explore time differences in dependency prevalence we combined low, medium, andhigh dependency and fitted logistic regression models with time (0=1991, 1=2011), age(5-year age band), sex, and region
• Further adjustment performed for education and living arrangement
• Years lived in each of the four dependency levels were calculated out using Sullivan’smethod
• The proportions in each dependency state were applied to the 2014 England populationprojections of those aged 65 years or older, by age group (65–74 years, 75–84 yearsand ≥85 years) and sex to project 2035 demand for care.
STUDY 7: VLACHANTONI ET AL 2011
Vlachantoni, A., Shaw, R., Willis, R., Evandrou, M., Falkingham, J. and Luff, R. (2011).‘Measuring unmet need for social care amongst older people’, Popul Trends. ESRC Centrefor Population Change, University of Southampton., (145), pp. 56–72. doi:10.1057/pt.2011.17.
Study design and strategies for data collection
• Conceptual framework
• Study population: older people with unmet social care needs
• Used three nationally representative datasets (ELSA, GHS, BHPS) to explore the receiptof support by older people in relation to specific needs, and the extent to which there isunmet need among older people
25 Interval measures-in terms of the interval of time between episodes of required assistance with activitylimitations which can provide a greater transparency in the amount of care required than a simple count ofactivity limitations. In these measures dependency can be stratified as: low dependency (care less thandaily), medium dependency (care at set times daily), high dependency (24-h care) (Cordingley et al., 2001;Kingston et al., 2017).
94
• Sample size: GHS (of people aged 65 and over) – 3,356 (2001–02)26; ELSA (Wave 4,2008, of people aged 65 and over) – 4,916; BHPS (Wave 18, 2008–09, of people aged 65and over) – 3,760.
Indicators of needs
• From GHS questionnaires:
Mobility aids
The ability to perform detailed ADLs and IADLs
Whether, and from whom, help is received with these specific ADLs and IADLs
• The analysis
Key concept: difficulty in performing selected ADL and IADL
Definition of ‘unmet need’: a person who has a need (ADL/IADL), but do not receive helpwith specific tasks from any source, either formal (state or paid) or informal
In the GHS and BHPS datasets, a person is defined as having a ‘need’ when they either(i) are unable to perform a specific task, such as bathing, or (ii) can perform such tasksonly with help, or (iii) can perform such tasks on their own but experience some degreeof difficulty in doing so
In the ELSA dataset, a person is defined as being in need in the same manner as above;however only if they have reported difficulty with at least one mobility task, ADL or IADL.
Indicators of services and costs
In GHS and ELSA ‘services’ from different sources are noted: formal help: state and paid;informal. In BHPS only formal help is noted (both state and paid), however, in BHPS thereport of receipt of different kinds of services is not asked in relation to specific kinds ofneeds.27
Indicators of outcomes
• Not available.
Statistical analyses of outcome data
• Not available.
STUDY 8: WINDLE ET AL 2009
Windle, K., Wagland, R., Forder, J., D’Amico, F., Janssen D. and Wistow, G. (2009). Nationalevaluation of the partnership for older people projects (POPP). Kent: PSSRU, University ofKent.
Study design and strategies for data collection
Information on study design:
• Quasi-control study. intervention: the POPP programme. Quasi-control group: samplesfrom British Household Panel Survey (16th and 17th waves)28
• Phase 1: standardised questionnaire and key information questionnaire
26 The 2001–02 GHS was the last time the elderly module was included in this survey.27 For example, if a person who needed help in order to bath/shower was receiving formal state support; itis difficult to understand whether such support was used by the person specifically towards bathing/showering or whether it was used for assistance with e.g. gardening. 28 In order to estimate EQ5D scores for the BHPS sub sample, the Health Survey for England 2005 (HSE05)was used to derive parameters for an imputation.
95

• Phase 2: telephone interviews29 + focus group30 + interviews31
• Phase 3: ‘exit interviews’ with project managers and senior members of the statutory orhealth authority.
Panel data:
• For standardised questionnaire: administered at two time points – prior to the POPPproject (time 1) and at either three or six months after the POPP project (time 2) – it wasdesigned to identify changes in user quality of life and service use
• For key informant questionnaire: administered twice during the POPP initiative – torespondents in the 19 first round pilot sites in June 2007, and to those in the tensecond round pilot sites in June 2008. Details available in Appendix A, not included inour version.
• Sample sizes: Table 27, pg.112 (see below):
For standardised questionnaire: data for time 1 and time 2 were available for a total of1,529 respondents
For Key information questionnaire: round 1 sites n=280; round 2 sites: n=188
Telephone interview: 24
Focus group: 12
Interview: 30 with each group
Exit interviews: 39
• Study population/target group:
Age range 40–101, mean: 75; mode: 79
Roughly one third was married (33%), with the remainder widowed, separated, divorcedor single
More than half of the respondents completed questionnaires by themselves – indicatesufficient cognitive ability
Half of service users belonged to universal services (low-level service) group32 (pg. 131).
29 The interviewees included the Project Manager, Project Lead, Older Person’s Lead (Officer) and an olderperson (either champion or representative).
30 Carried out with those staff responsible for delivering the projects to explore individuals’ experiences,perspectives and perceptions of the effectiveness of their respective models of partnership working,barriers and facilitators to project implementation, impact on older people, their relationship to the widerhealth and social care economy, practice changes and sustainability.
31 Carried out with older users, with two samples: users of POPP projects and a matched sample ofindividuals presenting similar needs, but who had not yet experienced a specific POPP service.32 Definitions: low-level, up-stream community orientated interventions; universal services available to allolder people within the locality of the POPP programme; examples include: gardening/handypersonschemes, crime prevention, learning (e.g. computers or photography), leisure, signposting services.
96
TABLE 27: USERS IN RECEIPT OF A SERVICE BY YEAR
Year of POPP pilot Total number receiving a service
2006/7 13,659
2007/8 99,988
2008/9 150,990
Total 264,637

In this subgroup, mean age is 74 with a SD of 10
57% of service users lived alone (pg. 139) – indicate potential loneliness
To act as the benchmarking sample, people were selected from the BHPS on the basisthat they were aged 60 and over and reported at least one or more limitations inactivities of daily living (ADLs).
Indicators of needs
• Not available.
Indicators of services and costs
• Number of service users at the time
• Focus of the projects.
Indicators of outcomes
• Euro QoL or EQ 5D that includes five health domains: mobility; self care; usual activities;pain/discomfort; and anxiety and depression.
• Self-rated QoL as a whole using a seven-point Likert-type scale (developed by ProfessorAnn Bowling), ranging from ‘so good it could not be better’ to ‘so bad it could not beworse’ (pg. 157, 161, see Figures below):
97
FIGURE 54: SELF-REPORTED QUALITY OF LIFE QUESTION
Thinking about the good and bad things that make up your quality-of-life, how would you rate the quality of your life as awhole (please tick the box next to the answer is that best describes the quality of your life)
(1) So good, it could not be better n (2) Very good n (3) Alright n (4) Bad n (5) Very bad n (6) So bad, it could not be worse n
FIGURE 57: SELF-REPORTED GENERAL LEVEL OF HEALTH QUESTION
Compare to my general level of health over the past 12 months, my health state today is:(please tick one box)
Better n Much the same n Worse n
• A client services receipt inventory (Beecham & Knapp 1992), wherein users were askedto indicate the type of services they used (within secondary, primary and social care)three months prior to the POPP project and three months following their contact withthe project.
• Available in Appendix H, which was not available in our version. Respondents wereasked to record the type and total usage of secondary care services (hospital), primarycare services (local surgery or health centre) and those interventions received withintheir own home (social worker, meals on wheels etc.).
Statistical analyses of outcome data
• Data were analysed using non parametric statistics (e.g. descriptive, bi variate analysis,chi-square; using SPSS 15)
• This data was fed back to the sites at each PLEN to provide an indication of progress asto actual and forecast activity. Discussions were also held at that time around on goingreporting inaccuracies and missing data. The latter became a particular problem for thisdata.
STUDY 9: GLENDINNING ET AL 2008
Glendinning, C., Challis, D., Fernandez J.-L., Jacobs, S., Jones, K., Knapp, M., Manthorpe, J.,Moran, N., Netten, A., Stevens, M., and Wilberforce, M. (2008), Evaluation of the IndividualBudgets Pilot Programme. Final Report. York: Social Policy Research Unit, University ofYork.
Study design and strategies for data collection
• Study design: RCT, based on ITT principle. Intervention: personal health budget vs.current support arrangement. Individuals offered IB (individual budgets) can decline
• Sample sizes: n=959; IB: 510 (with 458 accepted IB), control: 449
• Panel data: baseline, 6-month outcome interview
• The primary user groups have either physical disability, learning disability, mental healthissues or were older people. The mean age is 57 and more participants were females(56%)
• Those eligible for supporting people funds, that aim to ‘provid[e] a better quality of lifefor vulnerable people to live more independently and maintain their tenancies, were notalways eligible for PB/social care help. It could be indicative that some housing needsare more likely to be at the edge of eligibility
• Although councils were instructed to tighten up on FACS and to check that potential orexisting service users were FACS eligible before setting up an IB or providingconventional services, a small number of care co-ordinators from sites in which therehad been no such changes, indicated that thresholds were lower.
Indicators of needs
• Not available.
Indicators of services and costs
• Cost-effectiveness analysis
• The average gross cost of an IB was about £11,450 (median £6,610; standard deviation£15,810; minimum £72; maximum £165,000). On average, approximately £11,760 wasfor annual recurrent funding (n=278; median £6,580; standard deviation £16,860) and£1,260 for one-off payments (n=46; median £675; standard deviation) (pg. 69); Only in31 cases was the cost of payroll support included in the IB (mean £320; standarddeviation £194). Despite the widespread use of direct payments, the costs of support for
98

these were only included in the budget in seven instances (mean £2,218 standarddeviation £194) (pg. 117).
Indicators of outcomes
• Health-related quality of life (EQ-5D-Euro-QoL)
• Care-related quality of life (ASCOT): 3 levels (no, low, high-level of needs), 7 domains,version not specified. A list of domains is below:
• Psychological well being (GHQ 12): Goldberg 1992, his scale comprises of 12 items thatexplore whether respondents have experienced a particular symptom or behaviour overthe past few weeks. Each item is rated on a four-point scale (less than usual, no morethan usual, rather more than usual, or much more than usual)33
33 There are two scoring methods; the Likert scoring scale (0 to 3) which generates a total score rangingfrom 0 to 36, with higher scores indicating worse conditions; and the bi-modal (0 to 1) scoring style thatindicates the likely presence of psychological distress according to a designated cut-off score of 4 ormore.
99
TABLE C.1: OPTIONS PROVIDED FOR EACH DOMAIN TO REFLECT EACH NEEDED LEVEL
Domain Need level Description
Control no I feel in control of my daily life low I have some control over my daily life but not enough high I have no control over my daily life
Safety no I have no worries about my personal safety low I have some worries about my personal safety high I am extremely worried about my personal safety
Personal care no I would always feel clean and would be able to wear what I want low I will occasionally feel less clean then I would like all of not be able to wear what I want high I would feel much less clean then I would like, with poor personal hygiene
Accommodation no My home is clean and comfortable as I’d like it to be My home is feeling comfortable as it can be low My home could be more cleaning comfortable than it is high My home is not at all clean all comfortable
Food and nutrition no I’m able to eat their meals I like when I want low I can’t always evening meals I like when I want to, but I don’t think there is a risk to my health high I can’t always eat meals I liked when I want to, and I think there is a risk to my health
Social participation no I had a good social life low I have a social life but sometimes I feel lonely high I feel socially isolated and often feel lonely
Occupation no I have fully occupied in activities of my choice low I am occupied but not in activities of my choice I don’t have enough to do to keep me occupied high I have nothing much to do and unusually bored

• Self-perceived health (a five-point scale): Robine 2003, the respondents were asked torate their health in general according to five categories ranging from ‘very good’ to ‘verybad’
• Perceived quality of life: a seven point scale with categories ranging from ‘So good, itcould not be better’ to ‘So bad, it could not be worse’
• Process of care: people’s overall satisfaction with their support and about specificaspects of quality that previous studies have identified as important. The optionsinclude: extremely, very, quite satisfied to neither satisfied nor dissatisfied, to quite, very,extremely dissatisfied, and unaware of the planning process.
Statistical analyses of outcome data
• Parametric statistical tests, (multivariate) regression, t test.
STUDY 10: FORDER ET AL 2012
Forder, J., Jones, K., Glendinning, C., Caiels, J., Welch, E., Baxter, K., Davidson, J., Windle, K.,Irvine, A., King, D. and Dolan, P. (2012), Evaluation of the personal health budget pilotprogramme, PSSRU University of Kent, PSSRU Discussion Paper 2699.
Study design and strategies for data collection
• Study design: Controlled trial34, intervention: personal health budget vs. current supportarrangement; carers were approached to complete questionnaires 12 months afterparticipants’ consent
• Sample sizes: Study consent was gained from 2,700 people, with 2,235 participantsincluded in the active study sample. (pg.44)
• Panel data:
Outcomes data were collected on four occasions: at baseline, 6 months (initial follow-up), 12 months (main follow-up) and up to 24 months (second follow-up) after date ofconsent. Initial and second follow-up was done by postal questionnaires, the mainfollow-up was carried out using interviews
Information regarding primary and secondary healthcare service usage was collectedtwice (baseline and 12 months after consent) using a medical record template.
Wide range of age group for participants, with majority aged 20–69; for most carers arefemales, with majority aged 40–69
• People in the personal health budget group were significantly more likely to be unable toperform a number of activities of daily living compared to the control group.
Indicators of needs
• Not available.
Indicators of services and costs
• Cost-effectiveness analysis.
34 In some sites people were randomised into the personal health budget group or a control group. In othersites, the personal health budget group was recruited from patients of those health care professionals inthe pilot offering budgets and a control group from patients of non-participating health care professionals.
100

Indicators of outcomes
• Health-related quality of life (EQ-5D-Euro-QoL)
• Care-related quality of life (ASCOT): three levels (no, low, high-level of needs), sevendomains, version not specified. However, it was specified that slightly different versionsof ASCOT 1were used in 2008 and 2010
• Psychological well being (GHQ 12): Goldberg 1992, Each item is rated on a four-pointscale (less than usual, no more than usual, rather more than usual, or much more thanusual)35
• Subjective well being scale: based on the measure used by ONS in the IntegratedHousehold Survey (IHS). The measure consists of five questions using an eleven-pointscale ranging from 0 to 10. The questions are below:
Overall, how satisfied are you with your life?
Overall, how happy did you feel yesterday?
Overall, how worried did you feel yesterday?
Overall, how satisfied are you with your health?
Overall, how worried are you about your health?
• Perceived quality of life: a seven point scale with categories ranging from ‘So good, itcould not be better’ to ‘So bad, it could not be worse’
• Perceived health (a five-point scale): Robine 2003, the respondents were asked to ratetheir health in general according to 5 categories ranging from ‘very good’ to ‘very bad’
• Clinical outcomes: HbA1c for diabetes, lung function for COPD sufferers
• Mortality: to assess whether there were differences in mortality rates between thepersonal health budget and control groups
• The 36-range GHQ-12 score in IBSEN had a mean of 13.8 and a standard deviation 0.85for the comparison group (pg. 29).
Statistical analyses of outcome data
• Power calculations for minimum sample sizes were computed using data from theevaluation of IBSEN that used both the GHQ-12 measure and the ASCOT measure
• Difference in difference
• T-test, F-test, Sargan Chi2, truncated regression with predictive mean matchingapproach.
35 The findings of GHQ-12 were reported in two ways. The first provides a continuous variable reflectingpsychological well-being, and is obtained by summing scores on the 12 items (which run from 0 to 3, withhigher scores indicating worse conditions). The second way to use the GHQ-12 scores each item as 0 or 1,sums them, and then calculates the proportion of people with a total score of 4 or higher, which isconventionally interpreted as indicating that they are at risk of psychological ill-health.
101

STUDY 11: ARMSTRONG ET AL 2016
Armstrong, N., Tarrant, C., Martin, G., Manktelow, B., Brewster, L. and Chew, S. (2017),Independent evaluation of the feasibility of using the Patient Activation Measure in theNHS in England. University of Leicester / The Health Foundation.
Study design and strategies for data collection36
• Study design:
The UK Renal Registry – used co-production approach in their Valuing Individualsprogramme, engaging with patients right from the beginning of their decision-makingprocess
The Tailored Health Coaching service: observational
Diabetes care: re-designed appointment systems using the PAM as part of the diabetesreview process.
• Sample sizes:
NHS Islington – has collected baseline activation scores for around 9,000 patients andplans to repeat this data collection a year later to assess the impact of introducing careplanning consultations
• Cross-sectional data:
Where the PAM is being used as an outcome measure, often a baseline measurementhas been taken, but not yet any further follow-up.
• Study population/target group: the Tailored Health Coaching service – those with one ormore long-term conditions at medium risk (45–65%) of increased health service use.
Indicators of outcomes
• PAM37, typically for a distinct intervention or service that a patient has received, either aspart of their existing care or offered as an additional service, is a measurement scaleused to measure the effectiveness of an intervention for supporting patient activation
The scale is based on patients’ responses to questions that interrogate an individual’sknowledge, beliefs, confidence and self-efficacy. The resulting score places a patient atone of four levels of activation; the four levels of activation are:Level 1: Disengaged and overwhelmedLevel 2: Becoming aware, but still strugglingLevel 3: Taking actionLevel 4: Maintaining behaviours and pushing further
Potential use as a higher system-level outcome to evaluate and assess care provision.
When assessing the impact of any particular service, PAM data is not typically beingused in isolation. Common measures considered using with PAM include cost, value formoney, service usage and clinical outcomes etc.
• Risk stratification score, including predicted use of healthcare services and costs
• Well-being, measured using the Warwick-Edinburgh Mental Wellbeing Scale (WEMWBS)
• Number of goals set and achieved.
Statistical analyses of outcome data
• Not available.
36 Studies referred to each question are not the same, the report only mentioned info for different studies.37 PAM is more commonly being used by learning set organisations as a tailoring tool at individual patientlevel, as a means of ensuring patients are receiving the most appropriate types of support for their level ofactivation. The potential for the PAM to be used as a combination of both an outcome measure and atailoring tool within the same service or intervention appears to be growing.
102
STUDY 12: DAVIS ET AL 2013
Davis, J. C., Liu-Ambrose, T., Richardson, C G. and Bryan, S. (2013) ‘A Comparison of theICECAP-O and EQ-5D in a Falls Prevention Clinical Setting: Are they complements orsubstitutes?’, Qual Life Res., 22(5), pp. 969–977.
Study design and strategies for data collection
• Information on study design: cross-sectional analysis of participants visiting theVancouver Falls Prevention Clinic
• Sample size, n=215
• Cross-sectional analysis. collected once at 12 months post first clinic assessment.Follow-up period: 12 months
• Study population/target group:
Adults ≥ 70 years of age referred by a medical professional to the Falls Prevention Clinicas a result of seeking medical attention for a non-syncopal fall in the previous 12months; mean age was 79.3 (6.2) years
Had a Mini Mental State Examination (MMSE) score ≥ 24/30
Had a Physiological Profile Assessment (PPA) score of at least 1.0 SD above age-normative value or Timed Up and Go Test (TUG) performance of greater than 15seconds or one additional non-syncopal fall in the previous 12 months
Were able to walk 3 metres with or without an assistive device
were able to provide written informed consent; and
Did not have a neurodegenerative disease.
Indicators of outcomes
• EQ-5D
• ICECAP-O: a short five item multiple choice questionnaire that measures an individual’soverall quality of life and wellbeing according to the following five attributes: – Attachment (love and friendship) – Security (thinking about the future without concern) – Role (doing things that make you feel valued) – Enjoyment (enjoyment and pleasure) – Control (independence)
Each domain has four possible options.– I am able to do all of the things that make me feel valued – I am able to do many of the things that make me feel valued – I am able to do a few of the things that make me feel valued – I am unable to do any of the things that make me feel valued
The ICECAP-O can be used to calculate a global score on a zero to one scale where zerorepresents no capability and one represents full capability.
Statistical analyses of outcome data
• Exploratory factor analysis
• Association analyses
• Agreement analyses
• Components of benefit captured by the instruments.
103
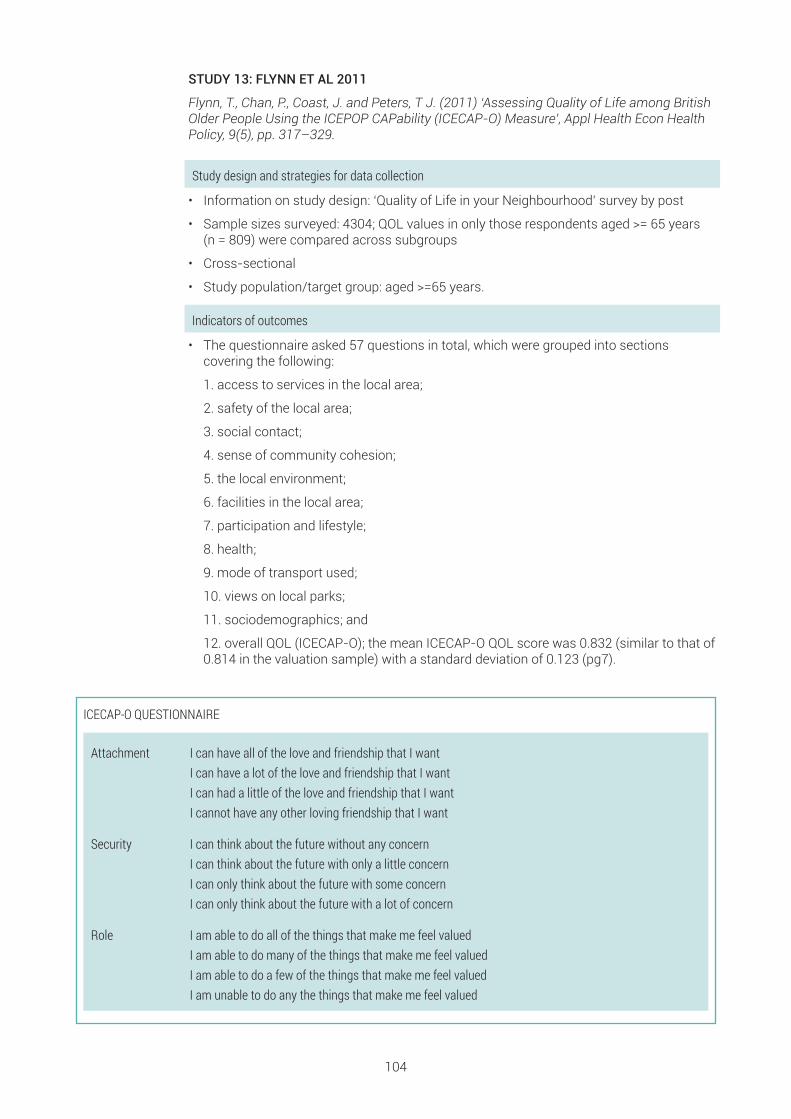
STUDY 13: FLYNN ET AL 2011
Flynn, T., Chan, P., Coast, J. and Peters, T J. (2011) ‘Assessing Quality of Life among BritishOlder People Using the ICEPOP CAPability (ICECAP-O) Measure’, Appl Health Econ HealthPolicy, 9(5), pp. 317–329.
Study design and strategies for data collection
• Information on study design: ‘Quality of Life in your Neighbourhood’ survey by post
• Sample sizes surveyed: 4304; QOL values in only those respondents aged >= 65 years (n = 809) were compared across subgroups
• Cross-sectional
• Study population/target group: aged >=65 years.
Indicators of outcomes
• The questionnaire asked 57 questions in total, which were grouped into sectionscovering the following:
1. access to services in the local area;
2. safety of the local area;
3. social contact;
4. sense of community cohesion;
5. the local environment;
6. facilities in the local area;
7. participation and lifestyle;
8. health;
9. mode of transport used;
10. views on local parks;
11. sociodemographics; and
12. overall QOL (ICECAP-O); the mean ICECAP-O QOL score was 0.832 (similar to that of0.814 in the valuation sample) with a standard deviation of 0.123 (pg7).
104
ICECAP-O QUESTIONNAIRE
Attachment I can have all of the love and friendship that I want I can have a lot of the love and friendship that I want I can had a little of the love and friendship that I want I cannot have any other loving friendship that I want
Security I can think about the future without any concern I can think about the future with only a little concern I can only think about the future with some concern I can only think about the future with a lot of concern
Role I am able to do all of the things that make me feel valued I am able to do many of the things that make me feel valued I am able to do a few of the things that make me feel valued I am unable to do any the things that make me feel valued

105
ICECAP-O QUESTIONNAIRE (CONTINUED)
Enjoyment I can have all of the enjoyment and pleasure that I want I can have a lot of the enjoyment and pleasure that I want I can have a little of the enjoyment and pleasure that I want I cannot have any of the enjoyment and pleasure that I want
Control I am able to be completely independent I am able to Be independent in many things I am able to be independent in a few things I am unable to be at all independent