unravelling the diversity of grapevine microbiome
TRANSCRIPT

Unravelling the Diversity of Grapevine MicrobiomeCatia Pinto1, Diogo Pinho1, Susana Sousa1, Miguel Pinheiro2, Conceicao Egas2, Ana C. Gomes1*
1 Genomics Unit, Biocant - Biotechnology Innovation Center, Cantanhede, Portugal, 2 Advanced Services Unit, Biocant - Biotechnology Innovation Center, Cantanhede,
Portugal
Abstract
Vitis vinifera is one of the most widely cultivated fruit crops with a great economic impact on the global industry. As a plant,it is naturally colonised by a wide variety of both prokaryotic and eukaryotic microorganisms that interact with grapevine,having either beneficial or phytopathogenic effects, who play a major role in fruit yield, grape quality and, ultimately, in theevolution of grape fermentation and wine production. Therefore, the objective of this study was to extensively characterizethe natural microbiome of grapevine. Considering that the majority of microorganisms are uncultivable, we have deeplystudied the microflora of grapevine leaves using massive parallel rDNA sequencing, along its vegetative cycle. Amongeukaryotic population the most abundant microorganisms belonged to the early diverging fungi lineages and Ascomycotaphylum, whereas the Basidiomycota were the least abundant. Regarding prokaryotes, a high diversity of Proteobacteria,Firmicutes and Actinobacteria was unveiled. Indeed, the microbial communities present in the vineyard during itsvegetative cycle were shown to be highly structured and dynamic. In all cases, the major abundant microorganisms werethe yeast-like fungus Aureobasidium and the prokaryotic Enterobacteriaceae. Herein, we report the first completemicrobiome landscape of the vineyard, through a metagenomic approach, and highlight the analysis of the microbialinteractions within the vineyard and its importance for the equilibrium of the microecosystem of grapevines.
Citation: Pinto C, Pinho D, Sousa S, Pinheiro M, Egas C, et al. (2014) Unravelling the Diversity of Grapevine Microbiome. PLoS ONE 9(1): e85622. doi:10.1371/journal.pone.0085622
Editor: Adam Driks, Loyola University Medical Center, United States of America
Received September 12, 2013; Accepted December 5, 2013; Published January 16, 2014
Copyright: � 2014 Pinto et al. This is an open-access article distributed under the terms of the Creative Commons Attribution License, which permitsunrestricted use, distribution, and reproduction in any medium, provided the original author and source are credited.
Funding: This work was carried out within the InovWine project, which funded by FEDER - COMPETE, through ‘‘Quadro de Referencia Estrategico Nacional’’ –QREN, with the reference FCOMP-01-0202-FEDER-011498, and within the project FCOMP-01-0124-FEDER-008749, which is financed with funds from FEDERthrough the ‘‘Programa Operacional Factores de Competitividade’’ – COMPETE, and FCT – ‘‘Fundacao para a Ciencia e a Tecnologia’’. The funders had no role instudy design, data collection and analysis, decision to publish, or preparation of the manuscript.
Competing Interests: All the authors are affiliated to BIOCANT, which is a not-for-profit technology transfer association, registered in the Portuguese Scienceand Technology System. This does not alter the authors’ adherence to all the PLOS ONE policies on sharing data and materials and we declare not having anycompeting commercial interests in relation to the submitted work.
* E-mail: [email protected]
Introduction
Vitis vinifera naturally hosts a reservoir of microorganisms that
interact with it and can be transferred to grapes and then into the
winery where, ultimately, it may affect the wine production and
compromise its quality. Those microorganisms can be beneficial,
neutral or pathogenic to the plant [1,2].
The grapevine is also colonized by other ubiquitous microor-
ganisms known as epiphytes and endophytes, who could have
beneficial or neutral effects on plants, without causing disease
symptoms [3]. Some of these microorganisms are even considered
as natural biocontrol agents due to their ability to protect the plant
against phytopathogens and reinforce the natural plant defences
[4].
Indeed, grapevine is susceptible to several phytopathogens
attacks with negative impact on vine longevity, affecting the plant
vitality [5]. Altogether, they compromise the normal physiological
properties of the grapevine and its vigour, resulting in a decrease of
fruit yield and quality, and thus undermining the expected
economic return of the vineyard. The most critical phytopatho-
gens agents are fungi, viruses and phytoplasmas [6,7].
The balance of the grapevine microecosystem is influenced by
biotic and abiotic factors and also by spatial and temporal
fluctuations. In addition, the chemical treatments also affect the
grapevine microbiome and are responsible for the appearance of
pesticide-resistant pathogen strains [8]. Therefore, a complete
survey of the grapevine’s microbial ecology, under natural
conditions, is of outmost importance because the grape production
and quality can be affected by the vineyard’s active microbial
community [9].
Indeed, phytopathogens have a direct negative impact on
grapevine and cause blighting, shrivelling, vine decay and tissue
damage [10]. Moreover, the microbial secondary metabolites as
mycotoxins, produced by some moulds, are toxic metabolites that
may later contaminate the wines. An example of a relevant
mycotoxin present in wines, with highest impact in red wines, is
the ochratoxin_A (OTA) that is produced by Aspergillus spp. and
Penicillium spp. [11,12]. On the other hand, the microbial
community can activate the plant defence pathways, inducing
the accumulation of pathogenesis-related (PR) proteins of grape-
vine as a protection against fungal pathogen attacks or other
biological stresses [5]. In fact, it is well known that the
accumulation of such PR proteins as chitinases and taumatin-like
proteins will later affect the wine clarity and stability [5,13].
Altogether, microorganisms are important for the equilibrium of
ecosystems, although little is known about the magnitude and
variability of those populations under natural conditions [14].
Indeed, the majority of studies characterizing the microbial
diversity rely on classical microbiological approaches. However,
cultivation-independent molecular techniques are now starting to
be widened, and metagenomics, the study of all indigenous biota
PLOS ONE | www.plosone.org 1 January 2014 | Volume 9 | Issue 1 | e85622

from samples, represents a powerful tool for assessing the
microbial communities [15–17].
In our study we have used 454 Next-Generation Sequencing
(NGS) to sequence the rDNAs of all microorganisms present in the
vine’s samples. With these data we will be able to identify both
abundant and rare microorganisms present on the vineyard and
therefore unravel the dynamics of microbial population during the
grapevine vegetative cycle.
Materials and methods
Sampling procedures and DNA extractionA vineyard with 10 ha located in Bairrada appellation
(Cantanhede, Portugal) was chosen for this study (Figure S1a).
The sampling was authorized by the private owner, who is fully
acknowledged in this paper, and no specific permissions were
required for this activity. Also, the field study did not involve
endangered or protected species. In order to obtain the deepest
insight on the microbial biodiversity, we have collected both
healthy (asymptomatic) and diseased leaves from V. vinifera cv
Tempranillo (also known as Aragonez and Tinta Roriz). For this
study, we have decided to sample leaves as they are the biomarkers
for the phytosanitary status of plant, are the most abundant, and
are the organ of highest surface of the plant. Comparatively to
other structures as fruits or flowers, which are not always present,
the leaves are the most permanent structures, thus allowing the
study along the vegetative cycle of the plant. Furthermore, leaves
are more convenient to sample than the wood, which would
require cuttings and thus would jeopardize the vitality of the vine.
The leaf samples were repeatedly collected during the vegetative
cycle from May to July in a total of 10 samplings, from T1 to T10.
Sampling was done in 5 different vines distributed in the vineyard,
before and after chemical treatments (Figure S1b). The sampling
was carried out always from the same vines all over the
experiment, in order to minimize sources of variability within this
study. A total of 50 leaves were collected and stored at 280uC for
subsequent DNA extraction. The DNA, from individual grapevine
leaf samples, was extracted using the QIAampH DNA Stool Mini
Kit (Qiagen, Hilden, Germany), according to the manufacturer’s
instructions.
Amplification of prokaryotic and eukaryotic populationand pyrosequencing
A PCR amplicon library was built with the extracted DNA. The
PCR primers were designed to target the V6 region of the 16S
rDNA for prokaryotic population analysis and the ITS2 and D2
rDNA sequences for eukaryotic population study. A preliminary
analysis of our results demonstrated that species obtained with D2
and ITS2 region sequencing are different and that the common
taxonomic organisms are low (Figure S2). Therefore, here in we
have sequenced and analysed both regions to have the most
complete landscape of the vineyards microbiome.
Distinct PCR reactions were performed for V6, D2 and ITS2
region. The amplification of the PCR products was carried out in
a 30 mL reaction mix containing 16 reaction buffer (USB,
Affymetrix), 0.2 mM of MgCl2 (USB, Affymetrix), 0.2 mM dNTPs
(Bioron), 2 mL of DNA, 1 unit of FideliTaq DNA Polymerase
(USB, Affymetrix) and 0.4 mM of the eukaryotic forward and
reverse specific primer or 0.8 mM of prokaryotic primers. Both
eukaryotic and prokaryotic regions were amplified with primers
containing the 454 Life Science’s sequence adaptors (59-
CGTATCGCCTCCCTCGCGCCATCAG-39), a barcode with
8 nucleotides which allowed the pooling of multiple samples for
pyrosequencing, and the universal primers. The ITS2 region was
amplified with the primers ITS2_F 59-GCATCGATGAA-
GAACGC-39 and ITS2_R 5-‘CCTCC GCTTATTGATATGC-
3’, the D2 region was amplified with D2_F 59AAGMACTTT-
GRAAAGAGAG-39 and D2_R 59-GGTCCGTGTTTCAA-
GACG-39 and the V6 region with the primers V6_F 59-
ATGCAACGCGAAGAACCT-39 and V6_R 59-TA GCGAT-
TCCG ACTTCA-39. Cycling conditions consisted of an initial
denaturation step at 94uC for 5 min; followed by 25 cycles at 94uC35 s, 50uC 35 s and 68uC for 40 s; and a final extension for 5 min
at 68uC. The PCR amplicons were analysed with the HT DNA
5000 SE30 Chip for the LabChip 90 (Caliper LifeSciences, USA).
The PCR products were purified with the High Pure 96 UF
Cleanup Plates (Roche) and then their quality and quantity were
assessed by fluorimetry, using the PicoGreenH dsDNA quantita-
tion kit (Invitrogen, USA). Afterwards, samples were pooled
together in equimolar amounts, and the fragments in the amplicon
library were bound to beads under conditions that favour one
fragment per bead. The fragments in the amplicon library were
subject to an emulsion PCR and the resulting DNA library beads
were deposited into the PicoTiterPlate (PTP) for high-throughput
pyrosequencing using the Genome Sequencer FLX System
Instrument (454 Life Sciences, Roche) at Biocant, Portugal. All
sequences obtained from this work are publically available in
NCBI platform with the accession number SRP029989.
Data analysisThe raw data was analysed by an automatic annotation pipeline
implemented at the Bioinformatics Unit of Biocant. The sequence
reads obtained were sorted by identification TAGs and quality
filters were applied in order to remove low-quality reads. We have
eliminated (i) sequences with less than 120 pb, (ii) sequences that
contained unresolved nucleotides (.2), (iii) masked sequences with
more than 50% of low complexity areas [18], (iv) chimera
sequences detected using UChime [19]. Sequences were then
grouped according to their phylogenetic distance of 3% [14] and
grouped in Operational Taxonomic Units (OTU) through
USearch [20]. The consensus sequences were automatically
obtained by this software. These pairwise distances served as
input to Mothur package [21] for the generation of rarefaction
curves (richness of population analysis) and the calculation of the
population diversity analysis estimator Chao1 (a diversity).
Consensus sequences for each OTU were blasted against curate
databases which allowed for taxonomic annotation. Prokaryotic
microorganisms were searched on Ribosomal Database Project II
(RDP) database [22], whereas eukaryotic microorganisms were
identified on the nt@ncbi/SILVA database. After BLAST, the
best hits were selected and subjected to another quality control:
only the sequences with an alignment greater than 60% and an e-
value lower than 1e25 were selected and applied for a bootstrap
test with 100 replicates, which were obtained by seqBoot from
Phylip package [23]. Only those sequences with an identity greater
than 70% were accepted, while all the others were considered new
sequences.
Eukaryotic and prokaryotic data were analyzed to determine
the minimum significant difference (r,0.05) between biodiversity
(Chao1) and one-way analysis of variance (ANOVA) was
performed by employing SPSS 20.0 (IBM, US). Normality tests
(Shapiro-Wilk) were carried out for each month of collections
(May, June, July) and for interval betweenchemical treatments. As
all groups followed the normal distribution, a T-test was used.
The microbial communities present from T1 to T10 were
compared at family level for prokaryotic microorganisms and at
genus level for eukaryotic population through the sequence reads
analysis. Thus, microbial population comparisons were carried out
Unravelling the Diversity of Grapevine Microbiome
PLOS ONE | www.plosone.org 2 January 2014 | Volume 9 | Issue 1 | e85622

using these taxa. Nevertheless, in some cases it was possible to
achieve a sound identification of the species sequence (table S1),
mostly for the eukaryotic population, which are also herein
discussed.
To analyze the community composition, a log-transformed (log
10(x+1)) of microbial community was performed. Then, to
compare the microbial community structure across the different
times of collection (T1–T10), a Principal Component Analysis
(PCA) was performed with Bionumerics 6.5 (Applied Maths NV,
Belgium). The scores and loadings values were exported and both
plots were designed in Excel 2010 (Microsoft, USA). Metastats
[24] was used to detect differentially abundant taxa in two
microbial populations (microbial population before and after
chemical control and during vegetative cycle – May, June, July)
and to assess the significance of the observed differences in
microbial community. The heat maps were done using Bionu-
merics 6.5 (Applied Maths NV, Belgium).
Results
Microbial population diversity and richness of grapevinesThe objective of this work was to assess the microbial
community from grapevine leaves, during the vineyard’s vegeta-
tive cycle, using a culture independent approach. To achieve this
we have undergone a DNA massive parallel sequencing of 16S
rRNA gene and D2 and ITS2. Throughout the vegetative cycle of
the grapevine, a total of 50 leaf samples were collected from V.
vinifera cv Tempranillo and samples were collected before and
after the application of chemical treatment according to the
calendar of Figure S1b. The deep sequencing of microbial
communities originated a total of 142 096 sequences, of which
139 034 sequences passed the Quality Control filters, which
represented 97.9% of the obtained sequences (Table 1). For
eukaryotic microorganisms we have obtained 79 398 sequences
(38 187 identified with D2 region and 41 211 with ITS2) and for
prokaryotic we have obtained 59 636 sequences (Table 1). The
number of reads per sample ranged from 2070 to 9462 sequences.
All the high-quality sequence reads were grouped at a genetic
distance of 3% and generated a total of 1 043 OTUs for ITS2, 895
for D2 and 1 242 for V6. On average, we have obtained 97611
and 12467 OTUs for eukaryotic and prokaryotic microorgan-
isms, respectively.
The diversity of eukaryotic and prokaryotic populations was
compared between samples by rarefaction curves analysis
(Figure 1). This allowed us to measure the deepness of our
experiments and to characterize the microbial community [25].
Rarefaction curves showed that a good coverage of the entire
community was achieved. Therefore, we are aware that despite
unveiling a complex and rich microbial structure, there still exists a
hidden biodiversity within the vineyard, which we were not able to
expose (Table 1).
For each sample we have determined its expected richness
(Chao1 index). In our analysis, we have predicted a total richness
ranging from 179617 (eukaryotic microorganisms) to 203615
(prokaryotic population). By comparing the obtained number of
OTUs with its predicted Chao1, we were able to determine the
coverage of our experiments. The richness estimators indicated
that 54.462.2 % and 62.762.7 % of the eukaryotic and
prokaryotic diversity was uncovered, respectively (Table 1).
In order to assess to the microbial biodiversity during the plant’s
vegetative cycle, the Chao1 was determined (Figure 2). Interest-
ingly, the Chao1 varied during the vegetative cycle of grapevine
and the sequencing of ITS2 regions exposed a higher biodiversity
at May and a lower biodiversity at July when compared with D2
and V6 regions.
Microbial community compositionThe eukaryotic microbiome of the grapevine leaves was mainly
characterized by a high amount of microorganisms from Early
diverging fungal lineages (27.9%), Ascomycota phylum (26.3%)
and Basidiomycota (16.9%), and at much lower abundances we
have also identified microorganisms from Chytridiomycota,
Blastocladiomycota and Rozella phyla, which all summed up
represent 4.3% of the microbial population. The unknown
eukaryotic sequences corresponded to 24.7%, meaning that these
sequences were not assigned to any microorganism during the
BLAST process (Figure S3a).
Again, our results also reinforce the need for simultaneously
sequencing of both eukaryotic regions which was crucial because
their discriminating power is rather different, where some
organisms are only identified by one of these regions (Figure S4).
Regarding the microbial community, the grapevine showed a
dominance of microorganisms that belonged to early diverging
fungal lineages namely, Rhizopus, Mucor and the entomopathogens
Zoophthora and Pandora. Among Rhizopus and Pandora, these
microorganisms were very dynamic along the vegetative cycle
and showed to have a higher dominance on July. Rhizopus is
responsible for the sour rot of grapes and for post-harvest diseases
in close association with others as Penicillium, Alternaria or Diplodia
[26,27]. The Mucor population decreased along the vegetative
cycle and, as Rhizopus, is an important genera associated with post-
harvest diseases of table grapes [28]. Finally, the entomopathogens
Zoophthora radicans and Pandora neoaphidis are insect-pathogenic fungi
that infect and kill a variety of insects, including pests [29].
Indeed, some of these early diverging fungi lineages are known
to affect the functional insect biodiversity, rather than to impact
directly on the physiology of grapevine. For this reason, from now
on we will focus on microorganisms belonging to the Ascomycota
and Basidiomycota phyla.
Of these, the most dominant genera were Aureobasidium,
Sporormiella and Alternaria from Ascomycota phylum (Figure 3a)
and the phytopathogen Guignardia, which had higher abundances
at T1, T2, T3, T5 and T6. At lower abundance, we have
identified other genera as Kurtzmanomyces, Colacogloea, Lewia,
Ustilago, Puccinia and Cronartium. The eukaryotic community of
T1 was the most complex and biodiverse of all samples and,
interestingly, such biodiversity consistently decreased during the
vegetative cycle. As mentioned above, Aureobasidium was dominant,
which is in agreement with previously published studies that
reported these species as the most abundant in similar eukaryotic
communities [30,31].
The dominant phylum among prokaryotic community was
Proteobacteria with 31.2% and the Firmicutes with 29.4%. The
least abundant phylum was Actinobacteria with 19.4% (Figure
S3b). At the class level, the microbial communities were mostly
characterized by Gammaproteobacteria (18.8%), Bacilli (18.1%),
Betaproteobacteria (12.6%), Actinobacteria (12.1%), Alphapro-
teobacteria (11.2%), Negativicutes (9.9%), unknown microorgan-
isms (8.7%) and a minor abundance of other class bacterial which
all summed up represents 8.6% (Figure S3c).
Bacterial community (Figure 3b) was mostly dominated by
Streptococcaceae, Enterobacteriaceae, Pseudomonadaceae and
Moraxellaceae families followed by Leuconostocaceae, Comamo-
nadaceae, Veillonellaceae, Xanthomonadaceae, Sphingomonada-
ceae and Neisseriaceae
Although the microbial community seemed to be similar from
T1 to T10, the relative abundances varied during the vegetative
Unravelling the Diversity of Grapevine Microbiome
PLOS ONE | www.plosone.org 3 January 2014 | Volume 9 | Issue 1 | e85622

cycle. For example while T1 was characterized by the major
abundance of Pseudomonadaceae and Sphingomonadaceae, T10
was characterized by the dominance of Streptococcaceae and
Enterobacteriaceae.
To analyze the dynamics and relationships among the entire
microbial communities (eukaryotic and prokaryotic) present from
T1 to T10, a Principal Component Analysis (PCA) was carried
out. Figure 4a shows that this separated samples into twogroups, in
terms of similarity degree. The first cluster grouped the sampling
times T4, T6 and T8, which corresponded to those samples
collected after chemical treatment, whereas the second cluster
groups T2, T3, T5, T7 and T10, which were collected both before
(T3,T5, T7) and after chemical treatments (T2, T10), and have no
correlation with chemical treatment or collection time. Indeed, the
separation into these 2 clusters is mainly explained by the presence
of Enterobacteriaceae, Pseudomonadaceae, Streptococcaceae,
Alternaria and Sporormiella, in the first cluster, and the presence of
Aureobasidium in the second cluster (Figure 4b). Furthermore T1,
which does not belong to any of the clusters formed by the
hierarchical clustering based on a Pearson correlation matrixes, is
Table 1. Total sequences obtained for eukaryotic (ITS2 and D2) and prokaryotic (V6) microbial community for all samples (T1–T10).
0.03 distance
Time Points Target region Total reads High qualityOTUobtained
OTU that passed theblast CHAO 1 ACE Coverage (%)
T1 D2 3310 3284 118 111 173 171.37 64.2%
ITS2 6958 6858 187 176 244 233.70 72.1%
V6 9528 9462 91 88 127 125.49 69.4%
T2 D2 3371 3342 175 170 272 373.87 62.4%
ITS2 5630 5454 244 228 392 518.71 58.1%
V6 8258 8197 130 127 219 327.75 58.1%
T3 D2 3544 3511 109 99 212 208.34 46.6%
ITS2 3176 3034 148 138 254 353.58 54.4%
V6 6254 6127 134 126 233 355.03 54.1%
T4 D2 6758 6680 91 85 250 379.68 33.9%
ITS2 4117 3828 91 84 186 280.17 45.2%
V6 5534 5464 111 107 152 183.03 70.3%
T5 D2 4094 4071 72 69 116 116.77 59.5%
ITS2 2765 2648 48 46 106 369.32 43.4%
V6 6728 6627 169 163 242 254.01 67.2%
T6 D2 3902 3872 109 106 199 340.45 53.3%
ITS2 3354 3197 121 115 245 358.78 46.9%
V6 5763 5723 132 128 225 297.95 56.9%
T7 D2 2096 2070 48 47 87 123.31 54.3%
ITS2 3712 3485 61 58 106 213.35 54.7%
V6 3923 3872 104 103 176 206.29 58.6%
T8 D2 3325 3304 83 78 165 207.70 47.3%
ITS2 3751 3576 74 73 110 109.81 66.5%
V6 4383 4274 149 142 268 386.75 52.9%
T9 D2 4543 4487 72 68 146 192.89 46.5%
ITS2 4518 4292 65 65 106 138.57 61.6%
V6 5615 5553 157 146 250 304.77 58.3%
T10 D2 3612 3566 67 62 89 100.74 69.5%
ITS2 5197 4839 61 60 127 186.99 47.2%
V6 4377 4337 116 112 138 144.16 81.4%
Total D2 38555 38187 944 895 1710 2215.11 52.3%
ITS2 43178 41211 1100 1043 1875 2762.97 55.6%
V6 60363 59636 1293 1242 2030 2585.22 61.2%
Eukaryotic 81733 79398 2044 1938 3585 4978 54.462.2%
Prokaryotic 60363 59636 1293 1242 2030 2585 62.762.7%
TOTAL 142096 139034 3337 3180 5616 7563
OTUs and estimated species (Chao1) were determined at a genetic distance of 3% using Mothur. The coverage obtained was also determined as being the ratiobetween the observed OTUs and the estimated Chao1 (OTUs/Chao1).doi:10.1371/journal.pone.0085622.t001
Unravelling the Diversity of Grapevine Microbiome
PLOS ONE | www.plosone.org 4 January 2014 | Volume 9 | Issue 1 | e85622

Figure 1. Rarefaction curves at a genetic distance of 3% for each sample (T1–T10). D2 (a) and ITS2 (b) sequences both from the analysis of26S rRNA and ITS regions of eukaryotic population present in the sample and V6 sequences (c) from the analysis of 16S rRNA of prokaryotic diversity.doi:10.1371/journal.pone.0085622.g001
Unravelling the Diversity of Grapevine Microbiome
PLOS ONE | www.plosone.org 5 January 2014 | Volume 9 | Issue 1 | e85622

mainly characterized by the major abundances of Guignardia, a
phytopathogens, and Pseudomonadaceae.
Impact of the chemical treatments on microbialcommunity
The chemical treatments affected the vineyard’s microbial
population and the comparison among microbial community
using Metastats [24] revealed differences between communities
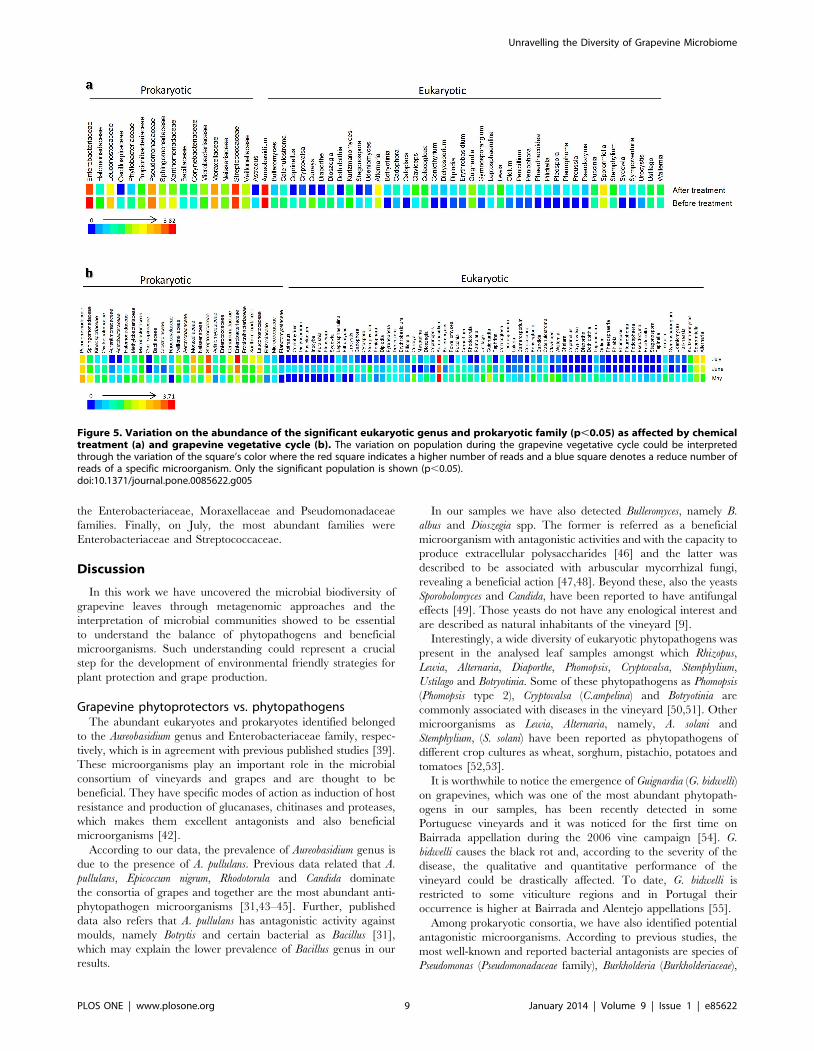
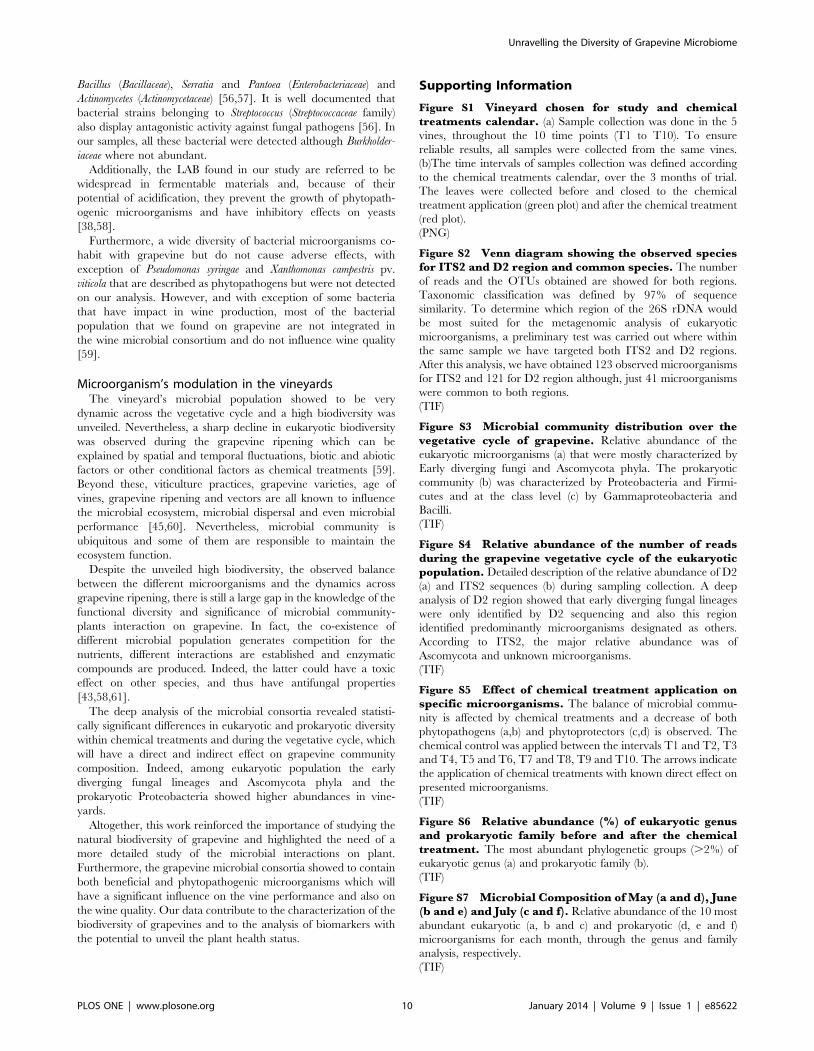
(r,0.05) (Figure 5a). In general, chemical treatments had a
negative impact on the balance between phytopathogens and
phytoprotectors in the V. vinifera microbiome (Figure S5), and a
significant decrease on population was observed after the first
treatment on May (Figure 5b), when there was the highest
microbial biodiversity in the vineyard. Considering the eukaryotic
community (r,0.05) we found significant differences in the
populations of Alternaria, Bulleromyces, Claviceps, Cryptovalsa, Diaporthe,
Guignardia, Lewia, Pleurophoma, Puccinia, Sporormiella, Stemphylium,
Sydowia and Ustilago (Figure 5a; Table S2).
Aureobasidium, the most abundant eukaryotic genus, showed a
relative abundance of 7.1% and 4.1% before and after chemical
treatments, respectively. Sporormiella (6.1 and 5.1%) and the
phytopathogens Alternaria (3.9 and 4.2%) and Guignardia (3.3 and
3.0%) were also abundant (Figure S6a). Interestingly, we have
identified a negative correlation between Aureobasidium and
Alternaria: when Aureobasidium is present, Alternaria is reminiscent
and vice-versa. Alternaria is mainly present after the chemical
treatment when Aureobasidium is less abundant, which suggest that
Aureobasidium have a protector effect on plant and its abundance on
microbial community is clearly affected by chemical control.
Among the rare eukaryotic genera, we found Filobasidiella, Diaporthe
(the teleomorph of Phomopsis viticola), Cryptovalsa, Stemphylium,
Candida, Phomopsis, Botryotinia, Dothichiza, Bulleromyces and Dioszegia.
Interestingly, among this low abundance microorganisms, we have
observed Botryosphaeria dothidea (0.23%), which is a phytopathogen
associated with grapevine trunk disease that causes the decline of
grapevine, limiting vineyard longevity and productivity [32].
In our analysis, Saccharomyces, Hanseniaspora and Metschnikowia were
also identified in leaves at T3, T6 and T8, though at low levels (,
1%). Our data demonstrated that despite being at low levels, these
microorganisms are natural colonizers of the vine, even before the
appearance of grape fruits and after chemical treatments.
When chemical control with the active element sulfur is applied
(Table S3), a drastic impact on the yeast flora is observed [33], and
this explains the observed decrease of Aureobasidium, Rhodotor-
ula or Candida by the end of May. In general, the whole yeast
community was affected by these chemical treatments (Figure 5b).
Furthermore, the application of the chemical treatments supple-
mented with folpet (applications between T3–T4, T5–T6 and T7–
T8) showed an impact mostly in Aureobasidium during May and
June which is in accordance with the study of Cabras et al. [34].
Folpet is generally used to control downy mildew, powdery mildew
and grey mold infections which are the most devastating grapevine
diseases [35]. In our study we did not find the most damaging
phytopathogens of grapevine namely, downy mildew (Plasmopara
viticola) and powdery mildew (Uncinula necator) (syn. Erysiphe necator)
[36,37] which might be explained by the constant chemical
control of these phytopathogens (Table S3).
Our experimental vineyard was also subjected to the treatments
against black rot disease (Guignardia bidwelli) and phomopsis cane
and leaf spot (Phomopsis viticola). As expected, after the chemical
control the abundance of these phytopathogens decreased
dramatically (Figure 5; table S1). Interestingly, only a chemical
treatment was applied against G. bidwelli and we have observed
that during the vegetative cycle new infections have emerged on
the vineyard (Figure S5b).
Concerning the prokaryotic population, we found significant
differences across Bacillaceae, Corynebacteriaceae, Enterobacte-
riaceae, Halomonadaceae, Leuconostocaceae, Microbacteriaceae,
Moraxellaceae, Propionibacteriacea, Pseudomonadaceae, Sphin-
gomonadaceae, Streptococcaceae and Xanthomonadaceae fami-
lies (r,0.05) (Figure 5a; Table S2).
The most abundant family was Enterobacteriaceae, with a
relative abundance of 7.1% and 7.0% before and after chemical
treatments, respectively (Figure S6b). Also, Streptococcaceae (7.0%
and 7.3%), Pseudomonadaceae (6.5% and 6.1%), Moraxellaceae
(5.8% and 6.2%) and Comamonadaceae (5.0% and 4.7%), were
Figure 2. Biodiversity dynamics associated with D2, ITS2 and V6 during the vegetative cycle of grapevine. The means of Chao1 index6 SEM are represented in the graph. Significance was assessed with one-way analysis of variance (ANOVA) and p,0.05 was set as statistic significantlevel. No significant differences were obtained for D2, ITS2 and V6 regions among May, June and July.doi:10.1371/journal.pone.0085622.g002
Unravelling the Diversity of Grapevine Microbiome
PLOS ONE | www.plosone.org 6 January 2014 | Volume 9 | Issue 1 | e85622

among the most abundant before and after chemical treatments of
the vineyards, respectively. Other families, as Methylobacteriaceae,
Oxalobacteraceae, Nocardioidaceae, Rhodobacteraceae or Bacil-
laceae were also detected, though with relative abundances below
2%, and were considered as rare microorganisms. In general, the
applied chemicals affected the bacterial community and a decreased
on the relative abundance was observed after chemical treatments
for Enterobacteriaceae, Pseudomonadaceae, Comamonadaceae or
Xanthomonadaceae families.
In the grapevine bacterial population, both lactic acid bacteria
(LAB) and acetic acid bacteria (AAB) were identified among other
bacterial groups. In wine production LAB, especially Oenococcus
oeni, Lactobacillus, Pediococcus and Leuconostoc are of outmost
importance because of the malolactic fermentation. In our
samples, the identified LAB belonged to Carnobacteriaceae,
Enterococcaceae, Leuconostocaceae and Streptococcaceae fami-
lies. From the Carnobacteriaceae it was observed Trichoccus and
Atopostipes genus and from the Enterococcaceae family Enterococcus
(mainly E. italicus) was also observed. From the Leuconostocaceae
we observed Leuconostoc (L. citreum and L. fallax species) and Weisella
(W. confuse) and, finally, from the Streptococcaceae family,
Streptococcus and Lactococcus were identified. However, most of these
bacteria are not associated with the winemaking process. We have
also detected microorganisms from the Lactobacillaceae family
mainly, Lactobacillus salivarius, though this population was rare
(table S1). Like previous reports on biodiversity of grapes, we did
not identify O. oeni in grape leaves [38,39]. Overall, our data show
an increase of LAB from May to July (Figure 5b).
Regarding the AAB, we have detected in our samples
microorganisms from the Acetobacteraceae family, mainly Acid-
isoma, Gluconacetobacter and Roseomonas genus. Remarkably, the AAB
was predominantly present on May and June in a positive
correlation with the presence of Botryotinia. This finding reinforces
the positive correlation between AAB and Botrytis infection in the
vineyards [40], [41].
Distribution and interactions of microbial communityacross vegetative cycle
The eukaryotic microbial community was very dynamic during
the vegetative cycle (Figure 5b) and presented significant
Figure 3. Eukaryotic (a) and prokaryotic (b) microbial community distribution from T1 to T10. Relative abundance of the 10 mostabundant eukaryotic and prokaryotic microorganisms through the genus and family analysis, respectively.doi:10.1371/journal.pone.0085622.g003
Unravelling the Diversity of Grapevine Microbiome
PLOS ONE | www.plosone.org 7 January 2014 | Volume 9 | Issue 1 | e85622

alterations in its structure (r,0.05). Among phytopathogens,
differences were found in Guignardia, Diaporthe or Phomopsis and
between phytoprotectors differences were found in Aureobasidium
and Rhodotorula (table S4).
Concerning the 10 most abundant eukaryotic communities on
May, June and July (Figure S7a, 7b and 7c), we observed that on
these months the most abundant microorganisms were Aureobasi-
dium and Alternaria. Furthermore, in May Guignardia was the most
abundant phytopathogen though Bensingtonia, Claviceps, Ustilago,
Alternaria or Curreya were also present. On June, Sporormiella and
Alternaria showed an increase and a decrease of Guignardia from
May to July was detected. Then, on July Alternaria, Aureobasidium
and Sporormiella were the most abundant microorganisms and an
increase of Alternaria, Aureobasidium and Sporormiella was observed.
Prokaryotic population was also very dynamic and significant
differences (r,0.05) across the microorganisms as Enterobacteri-
aceae, Pseudomonadaceae, Streptococcaceae, Sphingomonada-
ceae, Moraxellaceae, Leuconostocaceae were observed (Figure 5b
and table S4).
Of the 10 most abundant prokaryotic communities (Figure S7d,
7e and 7f) we observed that on May Pseudomonadaceae,
Streptococcaceae, Sphingomonadaceae and Enterobacteriaceae
dominated the microbial consortia. On June, Streptococcaceae
was the most abundant family followed by microorganisms from
Figure 4. PCA biplot diagram and loading plot of microbial community across sampling time (T1–T10), based on sequenceabundance of eukaryotic genus and bacterial family. (a) The PCA diagram is shown and the percentages of data variability explanation areshown in the upper of X and Y axis and more than 85% of the variability in the data is accounted. (b) Loading plot of principal component 1 showingvariables that explain variability across eukaryotic genus and prokaryotic family during the vegetative cycle of grapevine (T1–T10). The significantdifferences were observed in Metastats for eukaryotic genus or prokaryotic families and are represented with asterisk (*) and microbial communitythat are identified with ## are considered false discovery rate.doi:10.1371/journal.pone.0085622.g004
Unravelling the Diversity of Grapevine Microbiome
PLOS ONE | www.plosone.org 8 January 2014 | Volume 9 | Issue 1 | e85622
the Enterobacteriaceae, Moraxellaceae and Pseudomonadaceae
families. Finally, on July, the most abundant families were
Enterobacteriaceae and Streptococcaceae.
Discussion
In this work we have uncovered the microbial biodiversity of
grapevine leaves through metagenomic approaches and the
interpretation of microbial communities showed to be essential
to understand the balance of phytopathogens and beneficial
microorganisms. Such understanding could represent a crucial
step for the development of environmental friendly strategies for
plant protection and grape production.
Grapevine phytoprotectors vs. phytopathogensThe abundant eukaryotes and prokaryotes identified belonged
to the Aureobasidium genus and Enterobacteriaceae family, respec-
tively, which is in agreement with previous published studies [39].
These microorganisms play an important role in the microbial
consortium of vineyards and grapes and are thought to be
beneficial. They have specific modes of action as induction of host
resistance and production of glucanases, chitinases and proteases,
which makes them excellent antagonists and also beneficial
microorganisms [42].
According to our data, the prevalence of Aureobasidium genus is
due to the presence of A. pullulans. Previous data related that A.
pullulans, Epicoccum nigrum, Rhodotorula and Candida dominate
the consortia of grapes and together are the most abundant anti-
phytopathogen microorganisms [31,43–45]. Further, published
data also refers that A. pullulans has antagonistic activity against
moulds, namely Botrytis and certain bacterial as Bacillus [31],
which may explain the lower prevalence of Bacillus genus in our
results.
In our samples we have also detected Bulleromyces, namely B.
albus and Dioszegia spp. The former is referred as a beneficial
microorganism with antagonistic activities and with the capacity to
produce extracellular polysaccharides [46] and the latter was
described to be associated with arbuscular mycorrhizal fungi,
revealing a beneficial action [47,48]. Beyond these, also the yeasts
Sporobolomyces and Candida, have been reported to have antifungal
effects [49]. Those yeasts do not have any enological interest and
are described as natural inhabitants of the vineyard [9].
Interestingly, a wide diversity of eukaryotic phytopathogens was
present in the analysed leaf samples amongst which Rhizopus,
Lewia, Alternaria, Diaporthe, Phomopsis, Cryptovalsa, Stemphylium,
Ustilago and Botryotinia. Some of these phytopathogens as Phomopsis
(Phomopsis type 2), Cryptovalsa (C.ampelina) and Botryotinia are
commonly associated with diseases in the vineyard [50,51]. Other
microorganisms as Lewia, Alternaria, namely, A. solani and
Stemphylium, (S. solani) have been reported as phytopathogens of
different crop cultures as wheat, sorghum, pistachio, potatoes and
tomatoes [52,53].
It is worthwhile to notice the emergence of Guignardia (G. bidwelli)
on grapevines, which was one of the most abundant phytopath-
ogens in our samples, has been recently detected in some
Portuguese vineyards and it was noticed for the first time on
Bairrada appellation during the 2006 vine campaign [54]. G.
bidwelli causes the black rot and, according to the severity of the
disease, the qualitative and quantitative performance of the
vineyard could be drastically affected. To date, G. bidwelli is
restricted to some viticulture regions and in Portugal their
occurrence is higher at Bairrada and Alentejo appellations [55].
Among prokaryotic consortia, we have also identified potential
antagonistic microorganisms. According to previous studies, the
most well-known and reported bacterial antagonists are species of
Pseudomonas (Pseudomonadaceae family), Burkholderia (Burkholderiaceae),
Figure 5. Variation on the abundance of the significant eukaryotic genus and prokaryotic family (p,0.05) as affected by chemicaltreatment (a) and grapevine vegetative cycle (b). The variation on population during the grapevine vegetative cycle could be interpretedthrough the variation of the square’s color where the red square indicates a higher number of reads and a blue square denotes a reduce number ofreads of a specific microorganism. Only the significant population is shown (p,0.05).doi:10.1371/journal.pone.0085622.g005
Unravelling the Diversity of Grapevine Microbiome
PLOS ONE | www.plosone.org 9 January 2014 | Volume 9 | Issue 1 | e85622
Bacillus (Bacillaceae), Serratia and Pantoea (Enterobacteriaceae) and
Actinomycetes (Actinomycetaceae) [56,57]. It is well documented that
bacterial strains belonging to Streptococcus (Streptococcaceae family)
also display antagonistic activity against fungal pathogens [56]. In
our samples, all these bacterial were detected although Burkholder-
iaceae where not abundant.
Additionally, the LAB found in our study are referred to be
widespread in fermentable materials and, because of their
potential of acidification, they prevent the growth of phytopath-
ogenic microorganisms and have inhibitory effects on yeasts
[38,58].
Furthermore, a wide diversity of bacterial microorganisms co-
habit with grapevine but do not cause adverse effects, with
exception of Pseudomonas syringae and Xanthomonas campestris pv.
viticola that are described as phytopathogens but were not detected
on our analysis. However, and with exception of some bacteria
that have impact in wine production, most of the bacterial
population that we found on grapevine are not integrated in
the wine microbial consortium and do not influence wine quality
[59].
Microorganism’s modulation in the vineyardsThe vineyard’s microbial population showed to be very
dynamic across the vegetative cycle and a high biodiversity was
unveiled. Nevertheless, a sharp decline in eukaryotic biodiversity
was observed during the grapevine ripening which can be
explained by spatial and temporal fluctuations, biotic and abiotic
factors or other conditional factors as chemical treatments [59].
Beyond these, viticulture practices, grapevine varieties, age of
vines, grapevine ripening and vectors are all known to influence
the microbial ecosystem, microbial dispersal and even microbial
performance [45,60]. Nevertheless, microbial community is
ubiquitous and some of them are responsible to maintain the
ecosystem function.
Despite the unveiled high biodiversity, the observed balance
between the different microorganisms and the dynamics across
grapevine ripening, there is still a large gap in the knowledge of the
functional diversity and significance of microbial community-
plants interaction on grapevine. In fact, the co-existence of
different microbial population generates competition for the
nutrients, different interactions are established and enzymatic
compounds are produced. Indeed, the latter could have a toxic
effect on other species, and thus have antifungal properties
[43,58,61].
The deep analysis of the microbial consortia revealed statisti-
cally significant differences in eukaryotic and prokaryotic diversity
within chemical treatments and during the vegetative cycle, which
will have a direct and indirect effect on grapevine community
composition. Indeed, among eukaryotic population the early
diverging fungal lineages and Ascomycota phyla and the
prokaryotic Proteobacteria showed higher abundances in vine-
yards.
Altogether, this work reinforced the importance of studying the
natural biodiversity of grapevine and highlighted the need of a
more detailed study of the microbial interactions on plant.
Furthermore, the grapevine microbial consortia showed to contain
both beneficial and phytopathogenic microorganisms which will
have a significant influence on the vine performance and also on
the wine quality. Our data contribute to the characterization of the
biodiversity of grapevines and to the analysis of biomarkers with
the potential to unveil the plant health status.
Supporting Information
Figure S1 Vineyard chosen for study and chemicaltreatments calendar. (a) Sample collection was done in the 5
vines, throughout the 10 time points (T1 to T10). To ensure
reliable results, all samples were collected from the same vines.
(b)The time intervals of samples collection was defined according
to the chemical treatments calendar, over the 3 months of trial.
The leaves were collected before and closed to the chemical
treatment application (green plot) and after the chemical treatment
(red plot).
(PNG)
Figure S2 Venn diagram showing the observed speciesfor ITS2 and D2 region and common species. The number
of reads and the OTUs obtained are showed for both regions.
Taxonomic classification was defined by 97% of sequence
similarity. To determine which region of the 26S rDNA would
be most suited for the metagenomic analysis of eukaryotic
microorganisms, a preliminary test was carried out where within
the same sample we have targeted both ITS2 and D2 regions.
After this analysis, we have obtained 123 observed microorganisms
for ITS2 and 121 for D2 region although, just 41 microorganisms
were common to both regions.
(TIF)
Figure S3 Microbial community distribution over thevegetative cycle of grapevine. Relative abundance of the
eukaryotic microorganisms (a) that were mostly characterized by
Early diverging fungi and Ascomycota phyla. The prokaryotic
community (b) was characterized by Proteobacteria and Firmi-
cutes and at the class level (c) by Gammaproteobacteria and
Bacilli.
(TIF)
Figure S4 Relative abundance of the number of readsduring the grapevine vegetative cycle of the eukaryoticpopulation. Detailed description of the relative abundance of D2
(a) and ITS2 sequences (b) during sampling collection. A deep
analysis of D2 region showed that early diverging fungal lineages
were only identified by D2 sequencing and also this region
identified predominantly microorganisms designated as others.
According to ITS2, the major relative abundance was of
Ascomycota and unknown microorganisms.
(TIF)
Figure S5 Effect of chemical treatment application onspecific microorganisms. The balance of microbial commu-
nity is affected by chemical treatments and a decrease of both
phytopathogens (a,b) and phytoprotectors (c,d) is observed. The
chemical control was applied between the intervals T1 and T2, T3
and T4, T5 and T6, T7 and T8, T9 and T10. The arrows indicate
the application of chemical treatments with known direct effect on
presented microorganisms.
(TIF)
Figure S6 Relative abundance (%) of eukaryotic genusand prokaryotic family before and after the chemicaltreatment. The most abundant phylogenetic groups (.2%) of
eukaryotic genus (a) and prokaryotic family (b).
(TIF)
Figure S7 Microbial Composition of May (a and d), June(b and e) and July (c and f). Relative abundance of the 10 most
abundant eukaryotic (a, b and c) and prokaryotic (d, e and f)
microorganisms for each month, through the genus and family
analysis, respectively.
(TIF)
Unravelling the Diversity of Grapevine Microbiome
PLOS ONE | www.plosone.org 10 January 2014 | Volume 9 | Issue 1 | e85622

Table S1 Species observed on eukaryotic and prokaryotic
community. Distribution of the microbial microorganisms identi-
fied both eukaryotic and prokaryotic, during the vegetative cycle of
grapevine. For each microorganism, a consensus ID, number of
reads, alignment lenght, alignment start, score and the respective
e-value for the blast are shown.
(XLSX)
Table S2 Impact of chemical treatments application on
eukaryotic and prokaryotic community. Application of Metastat
to compare and to detect differences between microbial commu-
nities (both eukaryotic and prokaryotic) with chemical treatment
application.
(XLSX)
Table S3 Active elements of chemical treatments. Chemical
treatments calendar with their respective active elements. The
interval of application of such chemical treatment is also shown.
(XLSX)
Table S4 Distribution and interactions of microbial community
across vegetative cycle. Application of Metastat to compare and to
detect differences between microbial communities (both eukaryotic
and prokaryotic) during the vegetative cycle of grapevine.
(XLSX)
Acknowledgments
We are grateful to Jose Matos for his cooperation and support in the
collecting samples.
Author Contributions
Conceived and designed the experiments: CP ACG. Performed the
experiments: CP SS. Analyzed the data: CP DP MP. Contributed
reagents/materials/analysis tools: SS MP CE ACG. Wrote the paper:
CP ACG.
References
1. Schulz B, Rommert K, Dammann U, Aust H, Strack D (1999) The endophyte-host interaction: a balanced antagonism? Mycol Res 103: 1275–1283.
2. Compant S, Birgit M, Colli-Mull J, Gangl H, Sessitsch A (2011) Endophytes of
grapevine flowers, berries, and seeds: identification of cultivable bacteria,comparison with other plant parts, and visualization of niches of colonization.
Microb Ecol 62: 188–197.
3. Lodewyckx C, Vangronsveld J, Porteous F, Moore E, Taghavi S, et al. (2002)Endophytic bacteria and their potencial applications. Crit Rev Plant Sci 21:
583–606.
4. Compant S, Duffy B, Nowak J, Clement C, Barka E (2005) Use of plant growth-promoting bacteria for biocontrol of plant diseases: principles, mechanisms of
action, and future prospects. Appl Environ Microbiol 71: 4951–4959.
5. Ferreira R, Monteiro S, Picarra-Pereira M, Teixeira A (2004) Engineeringgrapevine for increased resistance to fungal pathogens without compromising
wine stability. Trends Biotechnol 22: 168–173.
6. Coetzee B, Freeborough M, Maree H, Celton J, Rees D, et al. (2010) Deepsequencing analysis of viruses infecting grapevines: virome of a vineyard.
Virology 400: 157–163.
7. Laimer M, Lemaire O, Herrbach E, Goldschmidt V, Minafra A, et al. (2009)Resistence to viruses, phytoplasmas and their vectors in the grapevine in Europe:
a review. J Plant Pathol 91: 7–23.
8. Pereira A (2003) As medidas indirectas de proteccao e as doencas parasitarias da
videira In: Amaro P, editor. A proteccao integrada na vinha – coloquio. Evora.
9. Loureiro V, Malfeito-Ferreira M (2003) Spoilage yeats in the wine industry.Int J Food Microbiol 86: 23–50.
10. Jackson R (2000) Wine Science: Principles, Practices, Perception. San Diego
USA: Academic Press.
11. Visconti A, Perrone G, Cozzi G, Solfrizzo M (2008) Managing ochratoxin A riskin the grape-wine food chain. Food Addit Contam Part A Chem Anal Control
Expo Risk Assess 25: 193–202.
12. Serra R, Braga A, Venancio A (2005) Mycotoxin-producing and other fungi
isolated from grapes for wine production, with particular emphasis on
ochratoxin A. Res Microbiol 156: 515–521.
13. Fusi M, Mainente F, Rizzi C, Zoccatelli G, Simonato B (2010) Wine hazing: a
predictive assay based on protein and glycoprotein independent recovery and
quantification. Food Control 21: 830–834.
14. Sharpton T, Riesenfeld S, Kemblel S, Ladau J, O9Dwyer J, et al. (2011)
PhylOTU: a high-throughput procedure quantifies microbial community
diversity and resolves novel taxa from metagenomic data. Plos Comput Biol 7:e1001061.
15. Handelsman J (2004) Metagenomics: application of genomics to unculturedmicroorganisms. Microbiol Mol Biol Rev 68: 669–685.
16. Schloss P, Handelsman J (2008) A statistical toolbox for metagenomics: accessing
functional diversity in microbial communities. BMC Bioinformatics 9: 34.
17. Mocali S, Benedetti A (2010) Exploring research frontiers in microbiology: thechallenge of metagenomics in soil microbiology. Res Microbiol 161: 497–505.
18. Sogin M, Morrison H, Huber J, Welch D, Huse S, et al. (2006) Microbial
diversity in the deep sea and the underexplored ‘‘rare biosphere’’. PNAS 103:12115–12120.
19. Edgar R, Haas B, Clemente C, Quince C, Knight R (2011) UCHIME improves
sensitivity and speed of chimera detection. Bioinformatics 27: 2194–2200.
20. Edgar RC (2010) Search and clustering orders of magnitude faster than BLAST.
Bioinformatics 26: 2460–2461.
21. Schloss P, Westcott S, Ryabin T, Hall J, Hartmann M (2009) Introducingmother: open-source, platform-independent, community-supported software for
describing and comparing microbial communities. Appl Environ Microbiol 75:7537–7541.
22. Cole JR, Wang Q, Cardenas E, Fish J, Chai B, et al. (2009) The Ribosomal
Database Project: improved alignments and new tools for rRNA analysis.
Nucleic Acids Res 37: D141–D145.
23. Felsenstein J (1989) PHYLIP- Phylogeny inference package (version 3.2).
Cladistics 5: 164–166.
24. White J, Nagarajan N, Pop M (2009) Statistical methods for detecting
differentially abundant features in clinical metagenomic samples. Plos Comput
Biol 5: 1000352.
25. Siqueira J, Fouad A, Rocas I (2012) Pyrosequencing as a tool for better
understanding of human microbiomes. J Oral Microbiol 4: 10743.
26. Chervin C, Aked J, Crisosto C (2012) Grapes. In: Rees D, Farris G, Orchard J,
editors. Crop Post-Harvest: Science and Technology: Blackwell Publishing pp.
187–211.
27. Zahavi T, Cohen L, Weiss B, Schena L, Daus A, et al. (2000) Biological control
of botrytis, Aspergillus and Rhizopus rots on table and wine grapes in Israel.
Postharvest Biol Tec 20: 115–124.
28. Batta Y (2006) Postharvest control of soft-rot fungi on grape berries by fungicidal
treatment and Trichoderma J Appl Hort 8: 29–32.
29. Xu J, Baldwin D, Kindrachuck C, Hegedus D (2009) Comparative EST analysis
of zoophthora radicans isolate derived from Pieris brassicae and an isogenic
strain adapted to Plutella xylostella. Microbiology 155: 174–185.
30. Barata A, Seborro F, Belloch C, Malfeito-Ferreira M, Loureiro V (2008)
Ascomycetous yeast species recovered from grapes damaged by honeydew and
sour rot. J Appl Microbiol 104.
31. Grube M, Schmid F, Berg G (2011) Black fungi and associated bacterial
communities in the phyloosphere of grapevine. Fungal Biology 115: 978–986.
32. Urbez-Torres J, Leavitt G, Voegel T, Gubler W (2006) Identification and
distribution of Botryosphaeria spp. associated wirh grapevine cankers in
California. Plant Dis 90: 1490–1503.
33. Bisson L, Joseph C (2009) Yeasts. In: Konig H, Unden G, Frohlich J, editors.
Biology of Microorganisms on Grapes, in Must and in Wine. Berlin Heidelberg:
Springer-Verlag. pp. 47–60.
34. Cabras P, Angioni A, Garau V, Pirisi F, Farris G, et al. (1999) Pesticides in
fermentatibe processes of wine. J Agric Food Chem 47: 3854–3857.
35. Cabras P, Angioni A, Garau V, Melis M, Pirisi F, et al. (1997) Persistence and
metabolism of folpet in grapes and wine. J Agric Food Chem 45: 476–479.
36. Calonnec A, Cartolar P, Poupot C, Dubourdieu D, Darriet P (2004) Effects of
Uncinula necator on the yield and quality of grapes (Vitis vinifera) and wine.
Plant Pathol 53: 434–445.
37. Gomes E, Coutos-Thevenot P (2009) Molecular aspects of grapevine-pathogenic
fungi interactions In: Roubelakis-Angelakis K, editor. Grapevine Molecular
Physiology & Biotecnology. New York: Springer.407–428.
38. Bae S, Fleet GH, Heard GM (2006) Lactic acid bacteria associated with wine
grapes from several Australian vineyards. J Appl Microbiol 100: 712–727.
39. Nisiotou A, Rantsiou K, Iliopoulos V, Cocolin L, Nychas G (2011) Bacterial
species associated with sound and Botrytris-infected grapes from a Greek
vineyard. Int J Food Microbiol 145: 432–436.
40. Joyeux A, Lafon-Lafourcade S, Ribereau-Gavon P (1984) Evolution of acetic
acid bacterial during fermentation and storage of wine. Appl Environ Microbiol
48: 153–156.
41. Toit W, Pretorius I (2002) The occurence, control and esoteric effect of acetic
acid bacteria in winemaking. Ann Microbiol 52: 155–179.
42. Renouf V, Claisse O, Lonvaud-Funel A (2007) Inventory and monitoring of
wine microbial consortia. Appl Microbiol Cell Physiol 75: 149–164.
43. Fleet G (2003) Yeast interactions and wine flavour. Int J Food Microbiol 86: 11–
22.
Unravelling the Diversity of Grapevine Microbiome
PLOS ONE | www.plosone.org 11 January 2014 | Volume 9 | Issue 1 | e85622

44. Prakitchaiwattana C, Fleet G, Heard G (2004) Application and evaluation of
denaturing gradient gel electrophoresis to analyse the yeast ecology of wine
grapes. FEMS Yeast Res 4: 865–877.
45. Garijo P, Lopez R, Santamarıa P, Ocon E, Olarte C, et al. (2011) Presence of
enological microorganisms in the grapes and the air of a vineyard during the
ripening period. Eur Food Res Technol 233: 359–365.
46. Raspor P, Miklic-Milek D, Avbelj M, Cadez N (2010) Biocontrol of grey mould
disease on grape caused by Botrytis cinerea with autochthonous wine yeasts.
Food Technol Biotech 48: 336–343.
47. Renke C, Blake V, Borstler B, Heinrichs J, Buscot F (2004) Diversity of
Cryptococcus and Dioszegia yeasts (Basidiomycota) inhabiting arbuscular roots
or spores. FEMS Yeast Res 4: 597–603.
48. Botha A (2011) The importance and ecology of yeasts in soil. Soil Biol Biochem
43: 1–8.
49. Sipiczki M (2006) Metschnikowia strains isolated from botrytized grapes
antagonize fungal and bacterial growth by iron depletion. Appl Environ
Microbiol 72: 6716–6724.
50. Mostert L, Crous PW, Kang JC, Phillips AJL (2001) Species of Phomopsis and a
Libertella sp occurring on grapevines with specific reference to South Africa:
morphological, cultural, molecular and pathological characterization. Mycologia
93: 146–167.
51. Loureiro V, Malfeito-Ferreira M (2003) Spoilage yeasts in the wine industry.
International Journal of Food Microbiology 86: 23–50.
52. van der Waals JE, Korsten L, Slippers B (2004) Genetic Diversity Among
Alternaria solani Isolates from Potatoes in South Africa. Plant Disease 88: 959–
964.
53. Phalip V, Hatsch D, Laugel B, Jeltsch J-M (2006) An overview of fungal
community diversity in diseased hop plantations. FEMS Microbiology Ecology56: 321–329.
54. Martins I, Dias D, Andrade A, Neves M (2010) Relatorio de actividades –
Estacao de Avisos da Bairrada. Direccao regional de agricultura e pescas docentro, direccao de servicos de agricultura e pescas, divisao de proteccao e
qualidade da producao. 1–90 p.55. Rego C, Oliveira H (2007) ‘‘Black Rot’’ da videira causado por Guinardia
bidwellii. Actas do 7u Simposio de Vitivinicultura do Alentejo. Evora - Portugal..
107–114.56. Trotel-Aziz P, Couderchet M, Biagianti S, Aziz A (2008) Characterization of
new bacterial biocontrol agents Acinetobacter, Bacillus, Pantoea and Pseudo-monas spp. mediating grapevine resistance against Botrytis cinerea. Environ
Exper Bot 64: 21–32.57. Bulgari D, Casati P, Crepaldi P, Daffonchio D, Quaglino F, et al. (2011)
Restructuring of endophytic bacterial communities in grapevine yellows-diseased
and recovered Vitis vinifera L. plants. Appl Environ Microbiol 77: 5018–5022.58. Konig H, Frohlich J (2009) Lactic Acid bacteria In: Konig H, Unden G,
Frohlich J, editors. Biology of Microorganisms on Grapes, in Must and in Wine.Berlin Heidelberg: Springer-Verlag pp. 3–30.
59. Barata A, Malfeito-Ferreira M, Loureiro V (2012) The microbial ecology of wine
grape berries. Int J Food Microbiol 153: 243–259.60. Comitini F, Ciani M (2008) Influence of fungicide treatments on the occurrence
of yeast flora associated with wine grapes. Ann Microbiol 58: 23–27.61. Guillamon J, Mas A (2009) Acetic acid bacteria. In: Konig H, Gottfried U,
Jurgen F, editors. Biology of Microorganisms on Grapes, in Must and Wine.Berlin Heidelberg: Springer-Verlag pp. 31–46.
Unravelling the Diversity of Grapevine Microbiome
PLOS ONE | www.plosone.org 12 January 2014 | Volume 9 | Issue 1 | e85622